molecular phylogeny restores the supra-generic subdivision of homoscleromorph sponges (porifera,...
TRANSCRIPT

Molecular Phylogeny Restores the Supra-GenericSubdivision of Homoscleromorph Sponges (Porifera,Homoscleromorpha)Eve Gazave1., Pascal Lapebie1., Emmanuelle Renard1, Jean Vacelet1, Caroline Rocher1, Alexander V.
Ereskovsky1,2, Dennis V. Lavrov3, Carole Borchiellini1*
1 Aix-Marseille Universite, Centre d’Oceanologie de Marseille, Station marine d’Endoume - CNRS UMR 6540-DIMAR, Marseilles, France, 2 Department of Embryology,
Faculty of Biology and Soils, Saint-Petersburg State University, St Petersburg, Russia, 3 Department of Ecology, Evolution, and Organismal Biology, Iowa State University,
Iowa, Ames, United States of America
Abstract
Background: Homoscleromorpha is the fourth major sponge lineage, recently recognized to be distinct from theDemospongiae. It contains ,100 described species of exclusively marine sponges that have been traditionally subdividedinto 7 genera based on morphological characters. Because some of the morphological features of the homoscleromorphsare shared with eumetazoans and are absent in other sponges, the phylogenetic position of the group has beeninvestigated in several recent studies. However, the phylogenetic relationships within the group remain unexplored bymodern methods.
Methodology/Principal Findings: Here we describe the first molecular phylogeny of Homoscleromorpha based on nuclear(18S and 28S rDNA) and complete mitochondrial DNA sequence data that focuses on inter-generic relationships. Our resultsrevealed two robust clades within this group, one containing the spiculate species (genera Plakina, Plakortis, Plakinastrellaand Corticium) and the other containing aspiculate species (genera Oscarella and Pseudocorticium), thus rejecting a closerelationship between Pseudocorticium and Corticium. Among the spiculate species, we found affinities between the Plakortisand Plakinastrella genera, and between the Plakina and Corticium. The validity of these clades is furthermore supported byspecific morphological characters, notably the type of spicules. Furthermore, the monophyly of the Corticium genus issupported while the monophyly of Plakina is not.
Conclusions/Significance: As the result of our study we propose to restore the pre-1995 subdivision of Homoscleromorphainto two families: Plakinidae Schulze, 1880 for spiculate species and Oscarellidae Lendenfeld, 1887 for aspiculate species thathad been rejected after the description of the genus Pseudocorticium. We also note that the two families ofhomoscleromorphs exhibit evolutionary stable, but have drastically distinct mitochondrial genome organizations that differin gene content and gene order.
Citation: Gazave E, Lapebie P, Renard E, Vacelet J, Rocher C, et al. (2010) Molecular Phylogeny Restores the Supra-Generic Subdivision of HomoscleromorphSponges (Porifera, Homoscleromorpha). PLoS ONE 5(12): e14290. doi:10.1371/journal.pone.0014290
Editor: Sergios-Orestis Kolokotronis, American Museum of Natural History, United States of America
Received June 7, 2010; Accepted November 16, 2010; Published December 14, 2010
Copyright: � 2010 Gazave et al. This is an open-access article distributed under the terms of the Creative Commons Attribution License, which permitsunrestricted use, distribution, and reproduction in any medium, provided the original author and source are credited.
Funding: This work was supported by the Centre National de Recherche Scientifique, Universite de la Mediterranee, a DEB-0828783 grant from the NationalScience foundation, a foreign travel grant from Iowa State University, the program Russian Foundation of Basic Research N 09-04-00337 and European Marie CurieMobility program (fellowship of A. Ereskovsky, MIF1-CT-2006-040065). The funders had no role in study design, data collection and analysis, decision to publish, orpreparation of the manuscript.
Competing Interests: The authors have declared that no competing interests exist.
* E-mail: [email protected]
. These authors contributed equally to this work.
Introduction
Sponges (phylum Porifera) are exclusively aquatic and predom-
inantly filter-feeding animals that play an important role in benthic
ecosystems. There are currently 8,366 described species in the
phylum (World Porifera Database), subdivided into three classes
on the basis of body plan features: Calcarea Bowerbank, 1864 [1];
Demospongiae Sollas, 1885 [2] and Hexactinellida Schmidt, 1870
[3]. While recent phylogenetic studies have failed to find an
obvious consensus concerning the monophyly vs paraphyly of
Porifera and their exact branching relatively to other non-
bilaterians (i.e. cnidarians, ctenophores, placozoans) [4,5,6,7,8,9],
it is now clear that Homoscleromorpha (Dendy, 1905) [10],
previously defined as part of the Demospongiae, is the fourth high-
level sponge taxon, alongside the three classically recognized
classes (for recent references see [8,11,12]).
Homoscleromorphs are a small group (,100 described species)
of exclusively marine sponges, generally located in shallow waters
from 8 to 60 m, but also at more than 1000 m depth [13]. All
species are dwellers of hard substratum communities often in semi-
dark or dark conditions; some may grow only on coralligenous
substratum. In some places, homoscleromorphs can be predom-
inant and they seem to be strong competitors for space,
overgrowing massive sponges, sea fans and erect bryozoans
PLoS ONE | www.plosone.org 1 December 2010 | Volume 5 | Issue 12 | e14290

[13,14,15]. Their fossil record dates back at least to the Early
Carboniferous [16], and is also documented in the Early and
Upper Jurassic [17]. This fossil record, however, is poor, due to
the homoscleromorph’s reduced and poorly organized siliceous
skeleton (when present), and provides no indication regarding their
affinities and evolution.
Although Homoscleromorpha show a great variability of forms,
their general organization and the shared features of their cytology
and embryology, as putative autapomorphic characters, argue for
the monophyly of this group (Fig. 1). This sponge clade is
characterized by an aquiferous system of either sylleibid-like or
leuconoid organization with eurypylous, diplodal or aphodal
choanocyte chambers (Fig. 1c, d). As far as skeletal structures are
concerned, they harbor a peculiar type of tetractines spicules
(calthrops), distinguishable from calthrops of the Demospongiae and
their derivatives by their small size, ramification of one to all four
actines (lophose calthrops) or reduction (diods and triods) (Fig. 1a, b)
and by the presence of an amorphous axial filament [18,19]. These
spicules do not form a well-organized skeleton. Homoscleromorpha
possess flagellated exopinacocytes and endopinacocytes (Fig. 1e),
peculiar flagellated apopylar cells, a cinctoblastula larva (Fig. 1g),
cross-striated ciliar rootlets in larval cells (Fig. 1h), a basement
membrane underlying both choanoderm and pinacoderm (Fig. 1f),
and zonula adhaerens cell junctions in adults and larval epithelia
(Fig. 1i), as well as an asynchronous spermatogenesis (for review see
[13,15]). Some of these features are shared with Eumetazoa, making
this group especially interesting.
Traditionally, Homoscleromorpha has been classified as a
family or a suborder of the subclass Tetractinellida, within the
class Demospongiae, mainly due to the shared presence of siliceous
tetractinal-like calthrop spicules [20]. Levi (1973) later proposed to
classify them as a distinct subclass of the Demospongiae [21], a
rank maintained in the most authoritative recent classification
‘‘Systema Porifera: a guide to the classification of sponges’’ [22].
However, the inclusion of Homoscleromorpha in the Demospon-
giae has been challenged by molecular studies [8,9,11,23,24].
Among these recent phylogenetic studies based on nuclear
sequences, two alternative positions of homoscleromorphs have
emerged: (i) closer to eumetazoan than to the other sponges,
resulting in the paraphyly of sponges [7,9,11,23,24] or (ii) as the
sister group of calcareous sponges within monophyletic Porifera
[8,12]. Recent studies based on complete mitochondrial genome
sequences strongly supported the grouping of Homoscleromorpha
with other sponges rather than with the Eumetazoa, although
calcareous sponges were not included in the dataset [25].
Interestingly, a shared ancestry of Homoscleromorpha and
Calcarea had been suggested earlier [26,27], based on a slight
similarity of spicule form and of larva type. However, these
morphological characters were not convincing: indeed (i) the
calthrop-like spicules are of a different mineralogical composition
(calcium carbonate or silica); furthermore, (ii) the analogy between
their larva types was based only on the use of a similar term for
larvae that are now considered as clearly different, respectively
amphiblastula for Calcarea and cinctoblastula for Homosclero-
morpha [28].
Until 1995, two families were recognized within the Homo-
scleromorpha, Plakinidae Schulze, 1880 [29] and Oscarellidae
Lendenfeld, 1887 [30], distinguished by the presence or absence of
the mineral skeleton, respectively. However, in 1990, the discovery
of a skeleton-less Corticium-like species led Sole-Cava et al. (1992) to
propose the rejection of the family Oscarellidae [31]. Later, when
this species was described as a member of a new genus
Pseudocorticium [32], all homoscleromorph genera were merged
into a single family, the Plakinidae. Pseudocorticium is indeed devoid
of a mineral skeleton like the genus Oscarella, but is more similar in
histological traits (notably the leuconoid aquiferous system and a
well developed ectosome) to the spiculated genus Corticium. Thus,
the Homoscleromorpha are currently considered to contain a
single family, the Plakinidae Schulze, 1880 [29], including 7
genera (Oscarella Vosmaer, 1887 [33]; Plakina Schulze, 1880 [29];
Plakortis Schulze, 1880 [29]; Plakinastrella Schulze, 1880 [29];
Corticium Schmidt 1862 [34]; Pseudocorticium Boury-Esnault et al.,
1995 [32]; Placinolopha Topsent, 1897 [35]) and about 78 species.
The genera are distinguished mainly by four morphological
characters [13,14,32]: the presence or absence of a siliceous
skeleton; the presence or absence of a cortex associated with the
architecture of the aquiferous system and type of choanocyte
chambers; if spicules are present, the number of spicule size classes
and the presence and type of ramification in the actins of
calthrops.
Several recent molecular phylogenetic studies examined internal
relationships within three of the four major sponge groups:
Calcarea [36,37], Demospongiae, [23,38,39] and Hexactinellida
[12]. Because the Homoscleromorpha were only recently
recognized as a separate, major sponge clade [7,8,9,11,12,23,
24], their internal relationships have not yet been investigated
using molecular markers. However, such investigation is necessary,
given both the potential usefulness of Homoscleromorpha in
pharmacological research [40] and the recent emergence of two
Oscarella species (O. lobularis and O. carmela) as models in the Evo-
Devo field [15,41,42,43]. Here we present a thorough investiga-
tion of homoscleromorph phylogeny using morphology, 18S
rDNA, 28S rDNA and complete mitochondrial genome sequence
data. Our aims were to test the two competing hypotheses for their
broadest subdivision proposed in the literature, to test genus
validity and to formulate hypotheses concerning morphological
character evolution within the group.
Methods
Specimen CollectionSpecimens from the Mediterranean Sea and the North Pacific
were collected by SCUBA diving or provided to us by colleagues
(see Acknowledgments). Locations of the collection sites are shown
on a geographical map (Fig. S1). The species used in this study,
their current taxonomic status, and their NCBI GenBank
sequence accession numbers are summarized in Table 1. The
identification of all specimens used in this study has been carefully
checked on the basis of morphological characters by the
taxonomists in our team.
DNA Sequence AcquisitionNuclear markers: 18S and 28S rRNA genes. Procedures
used for genomic DNA extraction, cloning and DNA sequencing
are described in previous studies [44,45], except for a few DNA
extractions made with the QIAamp DNA mini kit (DNA
purification from tissues, Qiagen), following the manufacturer’s
instructions. PCR primers for full-length/partial 18S and partial
28S ribosomal DNA (rDNA) amplification are provided in Table
S1a. Reaction mixes were adapted from [44,45]. Most 18S and
28S rDNA amplicons were obtained by nested PCR with different
combinations of primers. Thermocycling was often carried out
using the ‘‘touchdown’’ protocols with annealing temperatures
ranging from 65uC to 45uC, (depending on the primer melting
temperature) and a range of cycles from 30 to 45 were performed.
As protocols had to be adapted for each species, the exact
conditions of amplification are not listed here but can be obtained
from the authors upon request.
Phylogeny of Homoscleromorph
PLoS ONE | www.plosone.org 2 December 2010 | Volume 5 | Issue 12 | e14290

Despite substantial efforts (variety of DNA extraction proce-
dures tested, PCR additive tested, gradient PCR tested), we were
not able to obtain 18S/28S sequences for some species (especially
a Placinolopha species), and in some cases only shorter sequences
could be amplified (see Table 1 for distribution of missing data).
This may be due to either poor conservation of samples or to
PCR-inhibitors (pigments or secondary metabolites for example).
Complete mitochondrial genome. The overall procedure
for complete mtDNA sequencing was described in [46]. For this
study, a partial cytochrome b sequence was determined for all
Figure 1. A few relevant morphological characters in the Homoscleromorpha. (a, b) spicules of the Homoscleromorpha (SEM). (a): c -calthrop of Plakina trilopha (Marseilles, Mediterranean); d – diod of Plakina trilopha (Marseilles, Mediterranean); t – triod of Plakortis simplex (Marseilles,Mediterranean); (b): hc – heterolophose calthrop (candelabra) of Corticium candelabrum (Adriatic Sea); tc – tetralophose calthrop of Plakina weinbergi(Mediterranean, Lebanon). (c) – Oscarella kamchatkensis (Avacha Bay, Bering Sea, Russia), transverse semi-thin section showing the sylleibidaquiferous system with eurypylous choanocyte chambers (cc), fine ectosome (ec) and an ostium (o); (d) – Pseudocorticium jarrei (Marseilles,Mediterranean) transverse semi-thin section showing the leuconoid aquiferous system with diplodal choanocyte chambers (cc). (e) – Oscarellamalakhovi (Japan Sea, Russia) SEM micrograph of the flagellated exopinacoderm with ostium (o). (f) – Oscarella viridis (Marseilles, Mediterranean) TEMmicrograph showing basement membrane (arrow heads) underlining the endopinacocytes (en) and choanocytes (ch) and endobiotic bacteria (b) inthe mesohyl. (g) – Corticium candelabrum (Marseilles, Mediterranean) transverse semi-thin section of cinctoblastula larva, showing anterior (ap) andposterior (pp) poles. (h) – Plakina trilopha TEM micrograph of the cross-striated ciliar rootlet (arrow) close to a nucleus (n) in cinctoblastula larva. (i) –Oscarella microlobata (Marseilles, Mediterranean) TEM micrograph of cell junctions (zonula adhaerens) between the ciliated cells of cinctoblastulalarva (arrows).doi:10.1371/journal.pone.0014290.g001
Phylogeny of Homoscleromorph
PLoS ONE | www.plosone.org 3 December 2010 | Volume 5 | Issue 12 | e14290

collected specimens and used to design Homoscleromorpha-
specific primers. In addition, demosponge-optimized primers for
large and small subunit rRNA, and, if necessary, species-specific
primers for other genes, were used to amplify the complete
mtDNA for each species in 2–4 fragments (Table S1b). PCR
reactions for each species were combined in equimolar
concentration, sheared and barcoded as described in [47].
Barcoded PCR fragments were combined together and used for
Table 1. List of species used in this work according to the classification of Systema Porifera [22] and the recent update undertakenin the World Porifera Database [90].
GenBank accession numbers Collection sites
18S rRNA 28S rRNAMitochondrialgenome
Plakinidae Nu
Oscarella Vosmaer, 1877
1 Oscarella lobularis (Schmidt, 1862) HM118536 HM118549 HQ269361 Marseilles, France(Coral cave or Plane Island)
2 Oscarella carmela Muricy & Pearce, 2004 EU702422 EF654519 NC_009090 California, USA(Carmel Bay)
3 Oscarella malakhovi Ereskovsky, 2006 HM118537 HM118550 HQ269364 Japan Sea, Russia(Vostok Bay, )
4 Oscarella microlobata Muricy et al., 1996a HM118538 HM118551 HQ269355 Marseilles, France(Jarre Cave)
5 Oscarella tuberculata (Schmidt, 1868) — — HQ269353 Marseilles, France(Coral Cave)
6 Oscarella viridis Muricy et al., 1996a — — HQ269358 Marseilles, France(Jarre Cave)
Pseudocorticium Boury-Esnault et al.,1995
7 Pseudocorticium jarrei Boury-Esnault et al., 1995 HM118539 HM118552 HQ269357 Marseilles, France(Jarre Cave)
Corticium Schmidt, 1862
8 Corticium candelabrum Schmidt, 1862 HM118540 HM118553 HQ269363 Marseilles, France(Coral Cave)
9 Corticium sp.1 n/a HM118541 HM118554 — Palau(Ngedesakr Channel)
10 Corticium sp.2 n/a HM118542 HM118555 — Vanuatu
Plakortis Schulze, 1880
11 Plakortis simplex Schulze, 1880 AY348884 HM118556 HQ269362 La Ciotat, France(3 PP Cave)
12 Plakortis halichondrioides (Wilson, 1902) HM118543 HM118557 HQ269359 Bocas del Toro, Panama
Plakina Schulze, 1880
13 Plakina jani Muricy et al., 1998 HM118544 HM118558 HQ269360 Marseilles or La Ciotat, France(Jarre Cave, 3 PP Cave)
14 Plakina crypta Muricy et al. 1998 HM118545 HM118559 HQ269352 La Ciotat, France(3 PP Cave)
15 Plakina trilopha Schulze, 1880 HM118546 HM118560 HQ269356 Marseilles, France(Jarre Cave)
16 Plakina monolopha Schulze, 1880 HM118547 HM118561 HQ269351 Sete, France(Thau pond)
17 Plakina sp. n/a — — HQ269354 Marseilles, France(Plane island)
Plakinastrella Schulze, 1880
18 Plakinastrella onkodes (Uliczka, 1929) HM118548 HM118562 — Panama(Bocas del Toro)
19 Plakinastrella sp. * n/a EU702423 — EU237487 Florida, USA(Looe Keys)
20 Plakinastrella sp. 2 3269 n/a — HM118563 — Coral Sea Queensland, Australia(Holmes Reef)
The collection sites and the GenBank numbers of the 18S and 28S rDNA sequences and of the complete mitochondrial genomes are indicated. In the sequencescolumn, the new sequence accession numbers are mentioned in bold. A number is given to each species for the understanding of the map in Fig. S1. Note: an asterisk(*) indicates that this species has been previously misidentified as Plakortis angulospiculatus and published under this name. n/a: not available.doi:10.1371/journal.pone.0014290.t001
Phylogeny of Homoscleromorph
PLoS ONE | www.plosone.org 4 December 2010 | Volume 5 | Issue 12 | e14290

the GS FLX Titanium library preparation (454 Life Sciences).
Pyrosequencing was carried out on a Genome Sequencer FLX
Instrument (454 Life Sciences) at the University of Indiana Center
for Genomics and Bioinformatics. The STADEN package v. 1.6.0
(http://staden.sourceforge.net) was used to assemble the
sequences. Gaps and uncertainties in the assembly were filled/
resolved by primer-walking using conventional Sanger sequencing.
tRNA genes were identified with the tRNAscan-SE program [48];
other genes were identified by similarity searches in local databases
using the FASTA program [49] and in GenBank using BLAST
(http://blast.ncbi.nlm.nih.gov). All new sequences were deposited
in GenBank under accession numbers listed in Table 1.
Sequence Alignment and Phylogenetic AnalysisNuclear loci. To achieve a reasonable trade-off between
representativeness of outgroup taxa and ease of alignment, and
because our prime interests were relationships within the
Homoscleromorpha, we restricted our sampling to sponges and
included only a few members of two key sponge groups as
outgroup: Calcarea and Demospongiae (sequences from
GenBank). Thus, one Calcinea, two Calcaronea and two
Halichondrida were added to our Homoscleromorpha sampling.
Initial sequence alignment was performed using the software
MUSCLE available online (http://www.ebi.ac.uk/Tools/muscle/
index.html) [50,51], and subsequently optimized by eye using the
Bioedit Sequence Alignment Editor v5.09 [52]. Ambiguously
aligned regions were determined by the program Gblocks v0.91 b
[53]. A relaxed selection of blocks is better for short alignment [54],
thus the settings were the following for the 18S rDNA [1: 12; 2: 17;
3: 4; 4: 3; 5: all] and 28S rDNA [1: 11; 2: 11; 3: 4; 4: 4; 5: all]. The
treatment by GBlock resulted in the removal of 4%, and 9% for the
18S and 28S alignments respectively. The character exclusion sets
based on Gblocks are available upon request from the
corresponding author. Phylogenetic analyses were performed
using parsimony, maximum likelihood (ML) and Bayesian methods.
For maximum parsimony (MP) analyses, we used MEGA v4.0
[55]. Characters were always treated as unordered and equally
weighted. We performed heuristic searches with 100 replicates of
random taxon addition sequence and TBR branch swapping. For
ML analyses we used JModelTest [56] to determine the best-
fitting nucleotide substitution model for each data set. This
resulted, according to the likelihood score, [Akaike Information
Criterion (AIC)], in the following model choice for respectively
18S and 28S: TIM2+C+I (TIM2 model+gamma (C)-distributed
rates of substitution among sites+estimated proportion of
invariant sites) and GTR+C (general time-reversible substitution
model+gamma (C)-distributed rates of substitution among sites
[57,58]), (with the following parameters, for 18S: I = 0.4290,
a= 0.5200; for 28S: a= 0.4280); Then, we performed the
analyses with the PhyML software v3 [59,60] using the previously
estimated parameters. Among sites rate heterogeneity was
estimated using a discrete approximation of the gamma
distribution with 4 rate categories. For both methods, gaps were
treated as missing data and the statistical robustness of the tree
topology was assessed by non-parametric bootstrap resampling
(1000 replicates) [61].
In molecules constrained by secondary structure such as 18S
and 28S rRNA, the nucleotides involved in stems and loops do not
evolve independently, as assumed with standard models of
substitution [62,63] such as those compared in Modeltest [64]
and jModelTest [56]. Mixed models of substitution, in which a
matrix describes the changes among nucleotide pairs and another
matrix is fitted for single nucleotide changes, thus potentially
provide a better fit to nucleotide sequence data from such
molecules [12,37,45,65]. We thus conducted Bayesian analyses
with partitioning of our datasets in stems and loops. The pre-
requirement of this method is to determine a consensual secondary
structure from several sequences. For this purpose, we used the
online RNAalifold software (http://mobyle.pasteur.fr/cgi-bin/
portal.py, with the MFE (minimum free energy) fold algorithm)
that calculates consensus secondary structures for a set of aligned
RNAs [66]. Then, we used the PHASE software (http://www.
bioinf.manchester.ac.uk/resources/phase) providing such parti-
tioned models and performing Bayesian phylogenetic inferences
[67]. We chose the RNA7D model for nucleotide pairs, also
known as OTRNA [68], in which seven pair states are considered
(AU, UA, GC, CG, GU, UG and MM for all mismatches). This
model is a biologically plausible restriction of the most general
model involving those seven pairs, considering transition, double
transition, and transversion rates. It uses seven frequency
parameters and four rate parameters (the most common seven
state model has 21 rates). For unpaired nucleotides, we used the
REV model. For both models, we used a gamma distribution with
six categories to account for rate variation among sites. The
program mcmcphase used Markov chain Monte Carlo (MCMC) to
sample from the posterior probability distribution of phylogenetic
trees, branch lengths and sequence evolution model parameters.
For the burn-in, the number of burn-generations was set at
150,000 generations. The posterior distributions (thinning) were
calculated sampling every 150 generations. The total run length
was 1,500,000 generations. For priors and other MCMC
parameters, we used default values proposed by the program.
We checked for convergence by examining the likelihood values
(PLT file), and ran four chains for each analysis with different
random seeds five times to check whether the same stationary
distribution was reached. The program mcmcsummarize then
provided the topology, branch lengths and branch support of
the consensus tree. Bayesian posterior probabilities (PP) were used
for assessing the confidence value of each node. Lacking positions
were scored as missing data.
The 18S and 28S alignments plus the resulting trees (in ML)
have been deposited on the free TreeBASE database (numbers
10402 and 10403 for the 18S and 28S Matrix ID respectively)
(http://www.treebase.org, [69,70]). Given that bootstrap propor-
tion values (BP values) are a conservative measure of a clade
support [71] and that Bayesian posterior probabilities (PP values)
might overestimate node support [72], PP values .95% and BP
values .85% were interpreted as giving significant support to the
respective clades.
Mitochondrial coding sequences. Mitochondrial coding
sequences for Cantharellus cibarius and Capsaspora owczarzaki mtDNA
were downloaded from http://megasun.bch.umontreal.ca/People/
lang/FMGP/proteins.html. Other sequences were derived from the
GenBank files: Acanella eburnea NC_011016, Acropora tenuis NC_
003522, Astrangia sp. NC_008161, Briareum asbestinum NC_008073,
Chrysopathes formosa NC_008411, Metridium senile NC_000933,
Nematostella sp. NC_008164, Pocillopora damicornis NC_009797,
Porites porites NC_008166, Ricordea florida NC_008159, Sarcophyton
glaucum AF064823, AF063191, Savalia savaglia NC_008827, Aurelia
aurita NC_008446, Amphimedon compressa NC_010201, Aplysina fulva
NC_010203, Ephydatia muelleri NC_010202, Halisarca dujardini NC_
010212, Igernella notabilis NC_010216, Oscarella carmela EF081250,
Plakinastrella sp. NC_010217, Tethya actinia NC_006991, Xestospongia
muta NC_010211, Trichoplax adhaerens NC_008151, Placozoan
BZ10101 NC_008832, Amoebidium parasiticum AF538042–
AF538052, Monosiga brevicollis NC_004309, Allomyces macrogynus
NC_001715, Mortierella verticillata NC_006838, Rhizopus oryzae
NC_006836.
Phylogeny of Homoscleromorph
PLoS ONE | www.plosone.org 5 December 2010 | Volume 5 | Issue 12 | e14290

Amino acid sequences of individual proteins were aligned three
times with ClustalW v1.82 [73] using different combinations of
opening/extension gap penalties: 10/0.2 (default), 12/4 and 5/1.
The three alignments were compared using SOAP [74], and only
positions that were aligned identically among them were included
in phylogenetic analyses. Nucleotide sequences of protein-coding
genes were aligned based upon amino-acid alignments using
CodonAlign [75].
We assembled two datasets of concatenated mitochondrial
amino-acid sequences. The first, ‘‘small’’, dataset (3662 amino acid
positions) encompassed 35 taxa representing Homoscleromorpha,
Demospongiae, and Anthozoa. The second, ‘‘large’’, dataset
included sequences from additional outgroup taxa: 4 species of
fungi, the ichthyosporean Amoebidium parasiticum, the amoeba
Capsaspora owczarzaki, the choanoflagellate Monosiga brevicollis, two
placozoans, and the scyphozoan Aurelia aurita (45 taxa, 3278 amino
acids). The differences in size among these datasets are due to the
fact that there are more positions than can be reliably aligned
when fewer taxa are included. Furthermore, we constructed a
concatenated alignment of nucleotide sequences (10,986 bp) for
Cnidaria and Demospongiae corresponding to the small amino-
acid dataset.
Phylogenetic analyses on the nucleotide data were conducted
with the RAxML v7.0.4 [76] using the GTR+C model of sequence
evolution with 4 discrete categories of gamma-distributed among-
site rates. Phylogenetic analyses on concatenated amino-acid
datasets were carried out with RAxML and PhyloBayes (PB)
v3.2d [77,78]. For the RAxML analyses on concatenated data, we
used ProtTest v2.4 [79] to evaluate different models of amino-acid
substitution. With the same combination of C and F (F stands for
empirical amino-acid frequencies) parameters, JTT [80] was
preferred among standard matrices for the small dataset, while
cpREV [81] was the best-fit model for the larger dataset according
to the likelihood score, Akaike Information Criterion
(AIC = 22lnL+2K, where L is the likelihood and K is the number
of parameters) and Bayesian Information Criterion (BIC =
22lnL+Klogn, where n is the number of variable characters). We
used the category CAT+C [72] as well as CAT+GTR+C models for
the PhyloBayes analysis and ran four chains until convergence (max
diff ,0.1), sampling every 10th tree.
All alignments and resulting trees have been deposited on
TreeBASE (number 10864 Matrix ID, http://www.treebase.org;
[69,70]).
Statistical tests of alternative topologies. When topologies
were not totally congruent between markers or phylogenetic
methods, we tested alternative topologies for each dataset. ML
analyses for alternative topologies were conducted in PAUP*
v4.0b10 (for rRNA data [75]) and PAML v4.4b (for mtDNA data
[76]). Alternative topologies were compared with the approximately
unbiased (AU) [82] and weighted Shimodaira and Hasegawa tests
(WSH) [83] using CONSEL (with default values for RELL
calculation: 10 sets of bootstrap replicates; each set consists of
10000 replicates) [84]. Results are summarized in Table 2.
Results
Nuclear markers 18S and 28S rRNA genesThe results obtained by the 18S and 28S using the different
phylogenetic methods were mostly congruent. We chose to present
the topologies obtained by ML method for each marker, indicating
for each node the support found by the different methods (Figs. 2
and 3). All the other trees obtained by the different methods are
provided in figures S2 and S3.
Homoscleromorpha are divided into two clades supported by
high BP and PP values (from 90 to 100 for BP and PP = 1.00): one
groups Pseudocorticium and Oscarella genera (clade A) while the other
groups Corticium, Plakina, Plakinastrella and Plakortis genera (clade B).
Inside clade A, the monophyly of the genus Oscarella depends on
the fluctuating positions of O. microlobata and Pseudocorticium jarrei:
Oscarella is monophyletic according to the 28S topologies vs
paraphyletic according to the 18S topologies. The longer branch
leading to O. microlobata suggests that these unstable positions may
be due to long-branch attraction (LBA) artifact. Statistical tests
(AU and WSH) indicate that we cannot reject the hypothesis of the
monophyly of Oscarella with the 18S dataset, while the hypothesis
of a monophyletic clade containing Oscarella species+Pseudocorticium
jarrei, with O. microlobata at the base of the tree, can be rejected
according to the 28S dataset (Table 2).
Among the three other analyzed species of Oscarella, O. malakhovi
and O. carmela (both from North Pacific) are closer to each other
(maximum BP and PP in all analyses) than they are to the
Mediterranean species O. lobularis.
Inside clade B, the three species of Corticium form a highly
supported monophyletic group (clade B1 supported by robust
values from 95 to 100 for BP and PP = 1.00), where the two south
Pacific species are sister groups. The four species belonging to
Plakortis and Plakinastrella group together in most analyses, forming
a robust clade B2 (BP from 84 to 99 and maximum PP). In this
clade B2, the two Plakinastrella species are grouped (maximum PP
and BP from 99 to 100) while the relative position of the two
species of Plakortis is uncertain. These relationships are thus
congruent with the monophyly of Plakinastrella whereas the
monophyly of Plakortis would have to be further tested.
Nevertheless, statistical tests indicate that we cannot reject
significantly the hypothesis of the monophyly of Plakortis with the
18S dataset, while the hypothesis of the paraphyly of Plakortis can
be rejected with the 28S dataset (Table 2). As far as genus Plakina is
concerned (all species from the north-west of the Mediterranean
Sea), it does not appear to be monophyletic: on the one hand P.
trilopha and P. jani form a supported group (clade B3 supported by
PP values ranging from 0.91 to 1.00 and BP values from 75 to
100), on the other hand P. monolopha and P. crypta have a weaker
affinity to one another (clade B4 not supported). B3 and B4 do not
group together whatever the marker or the phylogenetic method
Table 2. Statistical tests results of alternative topologies inmaximum likelihood framework.
Data sets Topologies constrained P AU Test P WSH Test
18S rDNA Monophyly of genus Oscarella 0.191 0.244
Monophyly of genus Plakortis 0.324 0.328
Monophyly of the genus Plakina 0.014* 0.044*
28S rDNA Paraphyly of genus Oscarella 0.018* 0.033*
Paraphyly of genus Plakortis 0.008* 0.023*
Monophyly of the genus Plakina 0.138 0.173
Mitochondrialgenome
Monophyly of genus Oscarella 0.112 0.187
B2 non valid 0.364 0.554
Polyphyly of Plakina+B2 non valid 0.495 0.662
Asterisk (*) indicates a significant P value (P,0.05), and thus the rejection of thehypothesis mentioned. AU = Approximately Unbiased, WSH = weightedShimodaira–Hasegawa. Graphic representations of topologies constrained areavailable upon request to the corresponding author.doi:10.1371/journal.pone.0014290.t002
Phylogeny of Homoscleromorph
PLoS ONE | www.plosone.org 6 December 2010 | Volume 5 | Issue 12 | e14290

Figure 2. Phylogram showing the relationships among the six genera of Homoscleromorpha based on 18S rDNA analyses. Thetopology presented corresponds to the ML analysis. Outgroups are Calcarea (AM180965, AM180976, AF100945) and Demospongiae (AY737637,AY737638) species. The Homoscleromorpha species are split into two robust clades: A and B. The numbers are from top to bottom: posteriorprobabilities for BI and bootstrap values (.50) for ML and MP respectively. Bayesian and MP analyses recovered slightly different phylogenies (Fig.S2). The black square points out the node corresponding to Homoscleromorpha.doi:10.1371/journal.pone.0014290.g002
Phylogeny of Homoscleromorph
PLoS ONE | www.plosone.org 7 December 2010 | Volume 5 | Issue 12 | e14290

Phylogeny of Homoscleromorph
PLoS ONE | www.plosone.org 8 December 2010 | Volume 5 | Issue 12 | e14290

used. Nevertheless, regarding the low support values supporting
the relationships between B1, B2, B3 and B4, we chose to
statistically test the hypothesis of monophyly of the genus Plakina
(Table 2). In contrast to the 28S rDNA dataset, we can reject
significantly the monophyly of Plakina with the 18S rDNA dataset.
Mitochondrial genome evolution in HomoscleromorphaWe determined the complete mitochondrial genome sequences
of 12 species of homoscleromorphs representing five genera in this
group plus the partial sequences of two species (Oscarella malakhovi
and Plakina trilopha). These mitochondrial genomes can be
subdivided into two groups on the basis of their mitochondrial
genome organization (Fig. 4). All genomes in the first group
(Oscarella and Pseudocorticium species) are very similar to the
mitochondrial genome of Oscarella carmela [85] and share with it
a nearly identical gene order, the presence of tatC, a gene for
subunit C of the twin arginine translocase, as well as genes for 27
tRNAs [85]. The genomes in the second group (Plakina,
Plakinastrella, Plakortis and Corticium species) have a genome
organization that is very similar to that in Plakinastrella sp.
(previously misidentified as Plakortis angulospiculatus) [25], displaying
a nearly identical gene arrangement, lack of tatC as well as 20 of
the 25 tRNA genes typically found in demosponges. These two
different genome organizations have a clearly defined phylogenetic
distribution within the Homoscleromorpha: all spiculate homo-
scleromorphs have Plakinastrella sp.-like mitochondrial genome
organization, while all aspiculate homoscleromorphs have O.
carmela-like mitochondrial genome organization. The variations
within each group are minor. Within the Oscarella-like genomes,
two duplicated tRNA genes (V and T) have changed identities in
some species. Within the Plakinastrella-like genomes, one or two
introns are present in cox1 of Plakinastrella sp., Plakina crypta and
Plakina trilopha but absent elsewhere, an observation we interpret as
multiple independent losses [86].
Mitochondrial genome phylogenetic analysesMitochondrial coding sequences were previously shown to be
highly informative for reconstructing phylogenetic relationships
among non-bilaterian animals [38]. Here we used them to conduct
Bayesian and ML phylogenetic analyses of homoscleromorph
relationships, on two datasets that included sequences from 16
species of homoscleromorphs but differed by the number and
diversity of outgroups (see Material and Methods). The results of
these analyses were highly congruent (Fig. 5 and Fig. S4). All
homoscleromorphs are subdivided into two groups corresponding
to aspiculate species (genera Oscarella and Pseudocorticium, clade A)
Figure 4. Mitochondrial genome organization in Plakinidae and Oscarellidae. Protein (green) and ribosomal (blue) genes are atp6, atp8–9:subunits 6, 8, and 9 of F0 adenosine triphosphatase (ATP) synthase; cob: apocytochrome b; cox1–3: cytochrome c oxidase subunits 1–3; nad1–6 andnad4L: NADH dehydrogenase subunits 1–6 and 4L; rns and rnl: small and large subunit rRNAs; tatC: twin-arginine translocase component C. tRNAgenes (black) are identified by the one-letter code for their corresponding amino acid. Genes outside the main circle are transcribed clock-wise, inside– counter clock-wise. Variations within each genome organization are shown in red and explained in corresponding boxes.doi:10.1371/journal.pone.0014290.g004
Figure 3. Phylogram showing the relationships among the six genera of Homoscleromorpha based on 28S rDNA analyses. Thetopology presented corresponds to the ML analysis. Outgroups are Calcarea (AM180995, AM181007, AY026372) and Demospongiae (AY864741,AY864743) species. The Homoscleromorpha species are split into two robust clades: A and B. The numbers are from top to bottom: posteriorprobabilities for BI and bootstrap values (.50) for ML and MP respectively. Bayesian and MP analyses recovered slightly different phylogenies (Fig.S3). The black square points out the node corresponding to Homoscleromorpha.doi:10.1371/journal.pone.0014290.g003
Phylogeny of Homoscleromorph
PLoS ONE | www.plosone.org 9 December 2010 | Volume 5 | Issue 12 | e14290
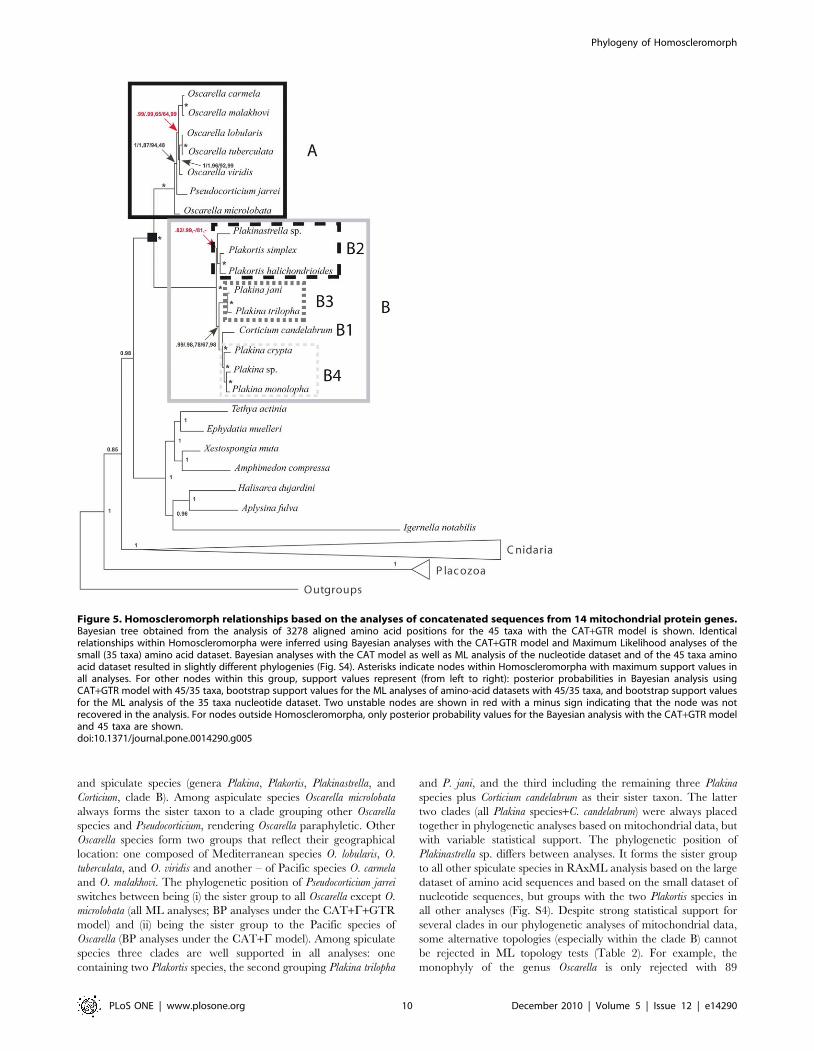
and spiculate species (genera Plakina, Plakortis, Plakinastrella, and
Corticium, clade B). Among aspiculate species Oscarella microlobata
always forms the sister taxon to a clade grouping other Oscarella
species and Pseudocorticium, rendering Oscarella paraphyletic. Other
Oscarella species form two groups that reflect their geographical
location: one composed of Mediterranean species O. lobularis, O.
tuberculata, and O. viridis and another – of Pacific species O. carmela
and O. malakhovi. The phylogenetic position of Pseudocorticium jarrei
switches between being (i) the sister group to all Oscarella except O.
microlobata (all ML analyses; BP analyses under the CAT+C+GTR
model) and (ii) being the sister group to the Pacific species of
Oscarella (BP analyses under the CAT+C model). Among spiculate
species three clades are well supported in all analyses: one
containing two Plakortis species, the second grouping Plakina trilopha
and P. jani, and the third including the remaining three Plakina
species plus Corticium candelabrum as their sister taxon. The latter
two clades (all Plakina species+C. candelabrum) were always placed
together in phylogenetic analyses based on mitochondrial data, but
with variable statistical support. The phylogenetic position of
Plakinastrella sp. differs between analyses. It forms the sister group
to all other spiculate species in RAxML analysis based on the large
dataset of amino acid sequences and based on the small dataset of
nucleotide sequences, but groups with the two Plakortis species in
all other analyses (Fig. S4). Despite strong statistical support for
several clades in our phylogenetic analyses of mitochondrial data,
some alternative topologies (especially within the clade B) cannot
be rejected in ML topology tests (Table 2). For example, the
monophyly of the genus Oscarella is only rejected with 89
Figure 5. Homoscleromorph relationships based on the analyses of concatenated sequences from 14 mitochondrial protein genes.Bayesian tree obtained from the analysis of 3278 aligned amino acid positions for the 45 taxa with the CAT+GTR model is shown. Identicalrelationships within Homoscleromorpha were inferred using Bayesian analyses with the CAT+GTR model and Maximum Likelihood analyses of thesmall (35 taxa) amino acid dataset. Bayesian analyses with the CAT model as well as ML analysis of the nucleotide dataset and of the 45 taxa aminoacid dataset resulted in slightly different phylogenies (Fig. S4). Asterisks indicate nodes within Homoscleromorpha with maximum support values inall analyses. For other nodes within this group, support values represent (from left to right): posterior probabilities in Bayesian analysis usingCAT+GTR model with 45/35 taxa, bootstrap support values for the ML analyses of amino-acid datasets with 45/35 taxa, and bootstrap support valuesfor the ML analysis of the 35 taxa nucleotide dataset. Two unstable nodes are shown in red with a minus sign indicating that the node was notrecovered in the analysis. For nodes outside Homoscleromorpha, only posterior probability values for the Bayesian analysis with the CAT+GTR modeland 45 taxa are shown.doi:10.1371/journal.pone.0014290.g005
Phylogeny of Homoscleromorph
PLoS ONE | www.plosone.org 10 December 2010 | Volume 5 | Issue 12 | e14290

probability, while alternative positions of Plakinastrella are practi-
cally undistinguishable from this perspective. Finally, our analysis
shows that there is relatively little mitochondrial genetic diversity
within either spiculate or aspiculate homoscleromorphs, although
the divergence between the two groups is substantial.
Discussion
The position of Pseudocorticium and the restoration oftwo families within the Homoscleromorpha
In 1995, Boury-Esnault et al. described a new genus of
Homoscleromorpha, Pseudocorticium [32]. The name for this genus
was chosen on the basis of its morphological similarity to Corticium,
in particular the presence of the cortex. However, unlike Corticium,
Pseudocorticium does not produce silicious spicules. It has therefore
been suggested that Pseudocorticium may represent an aspiculate
morph of Corticium, unable to secrete spicules in an environment
poor in silica, a case that has been reported for some demosponges
[87]. The grouping of Pseudocorticium with Corticium received some
support from an allozyme analysis where Pseudocorticium jarrei
(identified as Corticium sp. or Corticium-like in the cited paper) was
found to be more closely related to Corticium candelabrum than to
Oscarella lobularis and O. tuberculata [31].
By contrast, our phylogenetic analyses, based on nuclear and
mitochondrial markers, as well as the overall mitochondrial
genome organization, reject the hypothesis of close relationship
between Pseudocorticium and Corticium and, instead, place Pseudo-
corticium with the genus Oscarella. This result leads to the
subdivision of the Homoscleromorpha into two clades (A and B):
one comprising only aspiculate species (clade A: Pseudocorticium and
Oscarella), the other grouping spiculate species (clade B: Plakina,
Plakortis, Plakinastrella and Corticium). Our results are thus congruent
with the subdivision of homoscleromorphs into two families,
Oscarellidae Lendenfeld, 1887 [30] (corresponding to clade A
minus the Pseudocorticium genus that was described latter) and
Plakinidae Schulze, 1880 [29] (corresponding to clade B), as was
accepted prior to 1995 on the basis of absence/presence of a
mineral skeleton (Fig. 6).
From a morpho-anatomical point of view, the separation of
spiculate and aspiculate homoscleromorphs into two clades, makes
the secondary loss of spicules in Oscarellidae or the gain of spicules
in Plakinidae equally parsimonious reconstructions. Our results
also indicate that the similar cortex, aquiferous system organiza-
tion and outer morphological similarities encountered between
Corticium and Pseudocorticium represent either homoplasic or
plesiomorphic characters. As a consequence of our phylogenetic
analyses, we propose to restore the family Oscarellidae Lenden-
feld, 1887 [30] with the following diagnosis: ‘‘Homoscleromorpha
without skeleton, with a variable degree of ectosome development.
The aquiferous system has a sylleibid-like or leuconoid organiza-
tion, with eurypylous or diplodal choanocyte chambers.’’ The
diagnosis for the family Plakinidae should be modified from that
proposed by Schulze, 1880 [29] as follows: ‘‘Homoscleromorpha
with a skeleton formed by a combination of small calthrops and/or
derivatives through reduction (diods and triods), generally
arranged uniformly in the sponge body, surrounding the
aquiferous system in a regular ‘‘alveolar’’ way or more confusedly
dispersed. The aquiferous system has a sylleibid-like or leuconoid
organization, with eurypylous or aphodal choanocyte chambers’’.
Accordingly, the definitions of the two families are:
Family Plakinidae: ‘‘Homoscleromorpha with inorganic spicular
skeletal complements, represented by calthrops, diods and triods;
with a sylleibid-like or leuconoid aquiferous system made up of
eurypylous or aphodal choanocyte chambers’’.
Family Oscarellidae: ‘‘Homoscleromorpha without spicules,
with a sylleibid-like or leuconoid aquiferous system made up of
spherical, eurypylous or diplodal choanocyte chambers’’.
On the basis of the above phylogenetic revision we propose new
taxonomical keys for Homoscleromorpha families:
Key to families (modified from [13])
With inorganic (spicular) skeletal complement . . . Plakinidae
Lacking inorganic skeletal complement. . . . . . Oscarellidae
The genus Oscarella, monophyletic or paraphyletic?Phylogenetic analyses based on three different markers used in
this study produced conflicting results with regard to the
monophyly vs. paraphyly of Oscarella. The analyses of mtDNA
and 18S rRNA data support the paraphyly of Oscarella, O.
microlobata either grouping with Pseudocorticium jarrei (18S) or
forming a sister group to all other aspiculate homoscleromorphs
(mtDNA, highly supported). In contrast to that, the analyses of 28S
rRNA sequences produce a monophyletic Oscarella genus with
Pseudocorticium jarrei as its sister group. Despite these uncertainties,
statistical tests do not allow us to fully reject the monophyly of
Oscarella. As morphological characters are not helpful here, a more
detailed molecular study comprising more numerous Oscarella
species and more molecular loci is needed to resolve this issue.
A possible common origin of Plakinastrella and Plakortisgenera
Most of our analyses also tentatively support the grouping of
Plakortis and Plakinastrella. While the affinity between these two
genera has never been previously proposed, it is worth noticing
that this clade is in fact supported by a morphological
synapomorphy. Indeed, in both genera, lophose spicules are
absent, in contrast to all the other spiculate genera, which possess
at least one type of lophose spicules (Fig. 6). The two genera
remain, nevertheless, distinct. Plakortis has diods and triods of a
single size class, whereas, Plakinastrella synthesizes diods, triods
and/or calthrops of several size classes [13]. In all our analyses
based on nuclear rDNA data, the three species of Plakinastrella form
a monophyletic group, thus making the combination of those
spicules a valid morphological character to define this genus. Even
if weakly supported in rRNA analyses, the monophyly of Plakortis
cannot be rejected and is strongly supported by mitochondrial
data and spicular characters. As in the case of Oscarella, a
molecular phylogenetic analysis encompassing more Plakortis
species will be necessary to investigate these relationships.
The challenging of the Plakina genus: need forsubstantial nomenclature revision
Genus Plakina has been defined as ‘‘Plakinidae with a spiculation
of diods, triods and calthrops in a single size class, and with
homolophose calthrops with, one, two, three, or four lophate rays’’
[13]. The presence of such lophose calthrops and the lack of the
heterolophose calthrop (‘‘candelabra’’) distinguish Plakina from
Corticium, with which it shares some spicule similarity. However,
the boundaries between the two genera remain unstable, primarily
due to the scarcity of informative morphological characters, and
several species originally assigned to Corticium were transferred to
Plakina [88]. Interestingly, a close relationship between the
Corticium genus (clade B1) and some Plakina species (clade B4)
was found in molecular analyses with the 18S rDNA marker as
well as with mitochondrial genomes. Moreover, the four studied
Plakina species plus Corticium form a monophyletic group in
mitochondrial genome analyses. Several authors have previously
recognized that Plakina is probably a paraphyletic genus
Phylogeny of Homoscleromorph
PLoS ONE | www.plosone.org 11 December 2010 | Volume 5 | Issue 12 | e14290

[13,88,89], a supposition strongly supported by our study. Indeed,
Plakina species were never recovered as a monophyletic group in
our analyses (regardless of genetic marker and analytical method).
Non-monophyly of Plakina may explain the wide variability in
morphological characters previously observed in this genus [88].
Thus, the genus Plakina should be redefined and, potentially
subdivided into several genera on the basis of a comprehensive
analysis of extant species. One of the new genera might contain
Plakina jani and P. trilopha (clade B3, always recovered in all of our
analyses) that are characterized by the presence of a well
developed mesohyl, well-differentiated ectosome, large subectoso-
mal cavities and a tetralophose calthrop (Fig. 6). All these
characters are absent in the other Plakina (P. monolopha and P.
crypta) included in our study.
Figure 6. Simplified consensus tree showing the genera relationships in Homoscleromorpha based on molecular phylogenies.Morphological characters that are diagnostics of these clades are mapped. I: Absence of spicules in clade A. II: Specific gene arrangement inmitochondrial genome in clade A (see Fig. 4). III: Presence of spicules (lophate and alophate) in clade B. IV: Specific gene arrangement inmitochondrial genome in clade B (see Fig. 4). V: Presence of a candelabra (heterolophose calthrop) specific to Corticium genus, clade B1. VI: Presenceof alophose spicules and absence of lophose spicules in clade B2. VII: Presence of tetralophose calthrop and of a well developed mesohyl in clade B3.doi:10.1371/journal.pone.0014290.g006
Phylogeny of Homoscleromorph
PLoS ONE | www.plosone.org 12 December 2010 | Volume 5 | Issue 12 | e14290

The monophyly of Corticium genus: valid morphologicalcharacters
The three species of Corticium used for the nuclear rRNA
analysis form a well-supported monophyletic group. Thus, the
spicular characteristics that are used as diagnosis of this genus ‘‘a
spiculation consisting almost exclusively of non-lophose calthrops
in one size class and heterolophose calthrops (candelabra)’’ appear
to be valid [13]. Among those characters, the presence of
candelabra, a special kind of tetralophose calthrops (Fig. 1b) is
the best morphological apomorphy of this genus.
In conclusion, this study represents the first attempt to elucidate
with molecular tools the phylogeny of the Homoscleromorpha, a
small group of sponges that has been recently recognized as the
fourth major lineage in the phylum Porifera, using both nuclear
and mitochondrial molecular markers as well as morphological
characters. As the result of our study we propose to restore the pre-
1995 subdivision of the Homoscleromorpha into two families:
Plakinidae Schulze, 1880 for spiculate species and Oscarellidae
Lendenfeld, 1887 for aspiculate species that had been abandoned
after the description of the genus Pseudocorticium. These two families
are well supported in all our phylogenetic analyses and display
evolutionary stable, but clearly distinct mitochondrial genome
organizations that differ in gene content and gene order.
Our results also reject the monophyly of the genus Plakina, and
question the monophyly of Oscarella, necessitating further studies of
these genera. In fact, a more detailed study of Pseudocorticium and
Oscarella species is currently in progress in our laboratories.
Furthermore, the monophyly of Plakortis should be tested using
more comprehensive taxon sampling and the phylogenetic
position of Placinolopha, which was not included in our molecular
analyses, should be investigated.
Finally, this study illustrates once again that the combination of
several molecular markers is a powerful tool for the a posteriori re-
examination of morphological characters and the reassessment of
those that can or cannot be used as diagnostic features for the
definition of taxa. This study contributes to the improvement of
our knowledge of the metazoan Tree of Life – a highly necessary
endeavour for both ecological and evolutionary studies.
Supporting Information
Figure S1 Locations of the collections sites
Found at: doi:10.1371/journal.pone.0014290.s001 (7.29 MB TIF)
Figure S2 Trees resulting from the MP and Bayesian analyses
with the 18S rDNA marker. The numbers correspond to posterior
probabilities for BI and bootstrap values MP analyses.
Found at: doi:10.1371/journal.pone.0014290.s002 (1.28 MB TIF)
Figure S3 Trees resulting from the MP and Bayesian analyses
with the 28S rDNA marker. The numbers correspond to posterior
probabilities for BI and bootstrap values MP analyses.
Found at: doi:10.1371/journal.pone.0014290.s003 (1.28 MB TIF)
Figure S4 Additional trees resulting from the ML and Bayesian
analyses in mitochondrial (small and large datasets).
Found at: doi:10.1371/journal.pone.0014290.s004 (2.47 MB TIF)
Table S1 a) List of primers names and sequences used in this
study, for 18S, 28S rDNA and complete mitochondrial genome
amplifications. b) Primer pairs used for mtDNA amplification and
number of long PCR realized for each species.
Found at: doi:10.1371/journal.pone.0014290.s005 (0.08 MB
DOC)
Acknowledgments
Robert Thacker, Paco Cardenas, Guilherme Muricy, Friederike Hoff-
mann, Hans Tore Rapp, John Hooper, Jane Fromont, Shirley Pomponi,
Cecile Debitus, Sylvain Petek, Andrew Han, Margo Haygood are thanked
for providing specimens. Special thanks to Merrick Ekins, the Collection
Manager of Sessile Marine Invertebrates Biodiversity program, at the
Queensland Museum (Australia) for providing several specimens. We
gratefully acknowledge Arun Sethuraman, William Law (ISU), and several
other students (COM) for their assistance in labwork , Dr. Dorothee-Marie
Huchon-Pupko (Tel-Aviv University) for her help in statistical tests, and
Dr. Nicole Boury-Esnault for helpful discussions. Thierry Perez, Roland
Graille, Frederic Zuberer, Christian Marschal and Pierre Chevaldonne
(Centre d’Oceanologie de Marseille, CNRS UMR 6540-DIMAR,
Marseille, France) are thanked for diving assistance. The English of the
text has been revised by Michael Paul.
Author Contributions
Conceived and designed the experiments: EG ER JV AVE DVL CB.
Performed the experiments: EG PL ER CR DVL CB. Analyzed the data:
EG PL ER JV AVE DVL CB. Contributed reagents/materials/analysis
tools: EG PL ER JV AVE DVL CB. Wrote the paper: EG ER JV AVE
DVL CB. Performed the morphological studies: JV AVE.
References
1. Bowerbank JS (1864) Monograph of the British Spongiadae. London: Ray
Society. 290 p.
2. Sollas WJ (1885) A Classification of the Sponges. Ann Mag Nat Hist 5: 395.
3. Schmidt O (1870) Grundzuge einer Spongien-Fauna des atlantischen Gebietes.
Leipzig: Wilhelm Engelmann. 88 p.
4. Lavrov DV (2007) Key transitions in animal evolution: a mitochondrial DNA
perspective. Integrat Comp Biol 47: 734–743.
5. Dunn CW, Hejnol A, Matus DQ, Pang K, Browne WE, et al. (2008) Broad
phylogenomic sampling improves resolution of the animal tree of life. Nature
452: 745–749.
6. Srivastava M, Begovic E, Chapman J, Putnam NH, Hellsten U, et al. (2008) The
Trichoplax genome and the nature of placozoans. Nature 454: 955–960.
7. Hejnol A, Obst M, Stamatakis A, Ott M, Rouse GW, et al. (2009) Assessing the
root of bilaterian animals with scalable phylogenomic methods. Proc Biol Sci
276: 4261–4270.
8. Philippe H, Derelle R, Lopez P, Pick K, Borchiellini C, et al. (2009)
Phylogenomics revives traditional views on deep animal relationships. Curr
Biol 19: 706–712.
9. Sperling EA, Peterson KJ, Pisani D (2009) Phylogenetic-signal dissection of
nuclear housekeeping genes supports the paraphyly of sponges and the
monophyly of Eumetazoa. Mol Biol Evol 26: 2261–2274.
10. Dendy A (1905) Report on the sponges collected by Professor Herdman, at
Ceylon, in 1902. London: Royal Society.
11. Sperling EA, Pisani D, Peterson KJ (2007) Poriferan Paraphyly and its Implications
for Precambrian Paleobiology. London: Geological Society. pp 355–368.
12. Dohrmann M, Janussen D, Reitner J, Collins AG, Worheide G (2008)
Phylogeny and evolution of glass sponges (Porifera, Hexactinellida). Syst Biol
57: 388–405.
13. Muricy G, Diaz MC (2002) Order Homosclerophorida Dendy, 1905, Family
Plakinidae Schulze, 1880. In: Hooper JNA, Van Soest RWM, eds. Systema
Porifera: A Guide to the Classification of Sponges. New-York: Kluwer
Academic/Plenum Publishers. pp 71–82.
14. Diaz MC, Van Soest RWM (1994) The Plakinidae: a systematic review.
Rotterdam: A.A. Balkema. pp 93–110.
15. Ereskovsky AV, Borchiellini C, Gazave E, Ivanisevic J, Lapebie P, et al. (2009)
The Homoscleromorph sponge Oscarella lobularis, a promising sponge model in
evolutionary and developmental biology. Bioessays 31: 89–97.
16. Reid REH (1970) Tetraxons and demosponge phylogeny. In: Fry WG, ed. The
Biology of Porifera. Symposia of the Zoological Society of London, 25. London:
Academic Press. pp 63–89.
17. Wiedenmayer F (1994) Contributions to the knowledge of post-palaeozoic
neretic and archibenthal sponges (Porifera): The stratigraphic record, ecology,
and global distribution of intermediate and higher taxa. Schweiz Palaontol Abh
116: 1–147.
18. Uriz MJ (2006) Mineral skeletogenesis in sponges. Can J Zool 84: 322–356.
19. Uriz MJ, Turon X, Becerro MA, Agell G (2003) Siliceous Spicules and Skeleton
Frameworks in Sponges: Origin, Diversity, Ultrastructural Patterns, and
Biological Functions. Micr Res Tech 62: 279–299.
20. Levi C (1956) Etude des Halisarca de Roscoff. Embryologie et systematique des
demosponges. Arch Zool Exp Gen 93: 1–184.
Phylogeny of Homoscleromorph
PLoS ONE | www.plosone.org 13 December 2010 | Volume 5 | Issue 12 | e14290

21. Levi C (1973) - Systematique de la classe des Demospongiaria (Demosponges): in
Grasse PP, ed. Spongiaires. Paris: Masson & Compagnie. pp 577–632.
22. Hooper JNA, van Soest RWM (2002) Systema Porifera: A guide to the
classification of sponges. New York: Kluwer Academic/Plenum Publishers.
23. Borchiellini C, Chombard C, Manuel M, Alivon E, Vacelet J, et al. (2004)
Molecular phylogeny of Demospongiae: implications for classification and
scenarios of character evolution. Mol Phylogenet Evol 32: 823–837.
24. Peterson KJ, Cotton JA, Gehling JG, Pisani D (2008) The Ediacaran emergence
of bilaterians: congruence between the genetic and the geological fossil records.
Phil Trans R Soc Lond B Biol Sci 363: 1435–1443.
25. Wang X, Lavrov DV (2008) Seventeen new complete mtDNA sequences revealextensive mitochondrial genome evolution within the Demospongiae. PLoS
ONE 3: e2723.
26. Van Soest RWM (1984) Deficient Merlia normani Kirkpatrick, 1908, from theCuracao reefs, with a discussion on the phylogenetic interpretation of
sclerosponges. Bijdr Dierk 54: 211–219.
27. Grothe F (1989) On the phylogeny of homoscleromorphs. Berl Geowiss AbhReiche A Geolog Palacont 106: 155–164.
28. Boury-Esnault N, Ereskovsky AV, Bezac C, Tokina DB (2003) Larval
development in Homoscleromorpha (Porifera, Demospongiae). Invert Biol122: 187–202.
29. Schulze FE (1880) Untersuchungen uber den Bau und die Entwicklung der
Spongien. Neunte Mittheilung. Die Plakiniden. Z Wiss Zool Abt A 34: 407–451.
30. Lendenfeld RV (1886) On the Systematic Position and Classification of Sponges.
Proc Zool Soc Lond 1886: 558–662.
31. Sole Cava AM, Boury-Esnault N, Vacelet J, Thorpe JP (1992) Biochemicalgenetic divergence and systematics in sponges of the genera Corticium and
Oscarella (Demospongiae: Homoscleromorpha) in the Mediterranean Sea. Mar
Biol 113: 299–304.
32. Boury-Esnault N, Muricy G, Gallissian MF, Vacelet J (1995) Sponges without
skeleton: a new Mediterranean genus of Homoscleromorpha (Porifera,
Demospongiae). Ophelia 43: 25–43.
33. Vosmaer GCJ (1884) Studies on sponges: II–IV. Mitt Zool Stat Neapel 5:483–493.
34. Schmidt O (1862) Die Spongien des Adriatischen Meeres. Leipzig: Verlag Von
Wilhelm Engelmann. 88 p.
35. Topsent E (1897) Spongiaires de la Baie d’Amboine. (Voyage de MM. M. Bedot
et C. Pictet dans l’Archipel Malais). Rev Suisse Zool 4: 421–487.
36. Manuel M, Borchiellini C, Alivon E, Le Parco Y, Vacelet J, et al. (2003)Phylogeny and evolution of calcareous sponges: monophyly of Calcinea and
Calcaronea, high level of morphological homoplasy, and the primitive nature of
axial symmetry. Syst Biol 52: 311–333.
37. Dohrmann M, Voigt O, Erpenbeck D, Worheide G (2006) Non-monophyly of
most supraspecific taxa of calcareous sponges (Porifera, Calcarea) revealed by
increased taxon sampling and partitioned Bayesian analysis of ribosomal DNA.Mol Phylogenet Evol 40: 830–843.
38. Lavrov DV, Wang X, Kelly M (2008) Reconstructing ordinal relationships in the
Demospongiae using mitochondrial genomic data. Mol Phylogenet Evol 49:
111–124.
39. Nichols SA (2005) An evaluation of support for order-level monophyly and
interrelationships within the class Demospongiae using partial data from the
large subunit rDNA and cytochrome oxidase subunit I. Mol Phylogenet Evol 34:81–96.
40. Kornprobst JM (2005) Substances naturelles d’origine marine: Chimiodiversite,
pharmacodiversite, biotechnologie. Tome 2: invertebres - vertebres. Paris:Lavoisier Publisher.
41. Nichols SA, Dirks W, Pearse JS, King N (2006) Early evolution of animal cell
signaling and adhesion genes. Proc Natl Acad Sci U S A 103: 12451–12456.
42. Gazave E, Lapebie P, Renard E, Bezac C, Boury-Esnault N, et al. (2008) NK
homeobox genes with choanocyte-specific expression in homoscleromorph
sponges. Dev Genes Evol 218: 479–489.
43. Lapebie P, Gazave E, Ereskovsky A, Derelle R, Bezac C, et al. (2009) WNT/
beta-catenin signalling and epithelial patterning in the homoscleromorph sponge
Oscarella. PLoS ONE 4: e5823.
44. Borchiellini C, Manuel M, Alivon E, Boury-Esnault N, Vacelet J, et al. (2001)
Sponge paraphyly and the origin of Metazoa. J Evol Biol 14: 171–179.
45. Gazave E, Carteron S, Richelle-Maurer E, Boury-Esnault N, Borchiellini C,et al. (2010) Polyphyly of the genus Axinella and of the family Axinellidae
(Porifera: Demospongiae). Mol Phylogenet Evol 57: 35–47.
46. Burger G, Lavrov DV, Forget L, Lang BF (2007) Sequencing complete
mitochondrial and plastid genomes. Nat Protoc 2: 603–614.
47. Meyer M, Stenzel U, Hofreiter M (2008) Parallel tagged sequencing on the 454
platform. Nat Protoc 3: 267–278.
48. Lowe TM, Eddy SR (1997) tRNAscan-SE: a program for improved detection of
transfer RNA genes in genomic sequence. Nucleic Acids Res 25: 955–964.
49. Pearson WR (1994) Using the FASTA program to search protein and DNA
sequence databases. Methods Mol Biol 25: 365–389.
50. Edgar RC (2004) MUSCLE: a multiple sequence alignment method with
reduced time and space complexity. BMC Bioinformatics 5: 113.
51. Edgar RC (2004) MUSCLE: multiple sequence alignment with high accuracy
and high throughput. Nucleic Acids Res 32: 1792–1797.
52. Hall TA (1999) Bioedit: a user-friendly biological sequence alignment editor and
analysis program for Windows 95/98/NT. Nucl Acids Symp Ser 41: 95–8.
53. Castresana J (2000) Selection of conserved blocks from multiple alignments for
their use in phylogenetic analysis. Mol Biol Evol 17: 540–552.
54. Talavera G, Castresana J (2007) Improvement of phylogenies after removing
divergent and ambiguously aligned blocks from protein sequence alignments.
Syst Biol 56: 564–577.
55. Kumar S, Nei M, Dudley J, Tamura K (2008) MEGA: a biologist-centric
software for evolutionary analysis of DNA and protein sequences. Brief
Bioinform 9: 299–306.
56. Posada D (2008) jModelTest: phylogenetic model averaging. Mol Biol Evol 25:
1253–1256.
57. Lanave C, Preparata G, Saccone C, Serio G (1984) A new method for
calculating evolutionary substitution rates. J Mol Evol 20: 86–93.
58. Yang Z (1994) Maximum likelihood phylogenetic estimation from DNA
sequences with variable rates over sites: approximate methods. J Mol Evol 39:
306–314.
59. Guindon S, Gascuel O (2003) A simple, fast, and accurate algorithm to estimate
large phylogenies by maximum likelihood. Syst Biol 52: 696–704.
60. Guindon S, Lethiec F, Duroux P, Gascuel O (2005) PHYML Online–a web
server for fast maximum likelihood-based phylogenetic inference. Nucleic Acids
Res 33: W557–559.
61. Felsenstein J (1985) Confidence limits on phylogenies: an approach using the
bootstrap. Evolution 39: 783–791.
62. Wheeler WC, Honeycutt RL (1988) Paired sequence difference in ribosomal
RNAs: Evolutionary and phylogenetic implications. Mol Biol Evol 5: 90–96.
63. Dixon MT, Hillis DM (1993) Ribosomal RNA secondary structure: compen-
satory mutations and implications for phylogenetic analysis. Mol Biol Evol 10:
256–267.
64. Posada D, Crandall KA (1998) MODELTEST: testing the model of DNA
substitution. Bioinformatics 14: 817–818.
65. Erpenbeck D, List-Armitage SE, Alvarez B, Degnan B, Worheide G, et al.
(2007) The systematics of Raspailiidae (Demospongiae: Poecilosclerida: Micro-
cionina) re-analysed with a ribosomal marker. J Mar Biol Assoc UK 87:
1571–1576.
66. Hofacker IL, Fekete M, Stadler PF (2002) Secondary structure prediction for
aligned RNA sequences. J Mol Biol 319: 1059–1066.
67. Hudelot C, Gowri-Shankar V, Jow H, Rattray M, Higgs PG (2003) RNA-based
phylogenetic methods: application to mammalian mitochondrial RNA sequences.
Mol Phylogenet Evol 28: 241–252.
68. Tillier ER, Collins RA (1998) High apparent rate of simultaneous compensatory
base-pair substitutions in ribosomal RNA. Genetics 148: 1993–2002.
69. Sanderson MJ, Donoghue MJ, Piel W, Erikson T (1994) TreeBASE: a prototype
database of phylogenetic analyses and an interactive tool for browsing the
phylogeny of life. Am J bot 81: 183.
70. Morell V (1996) TreeBASE: the roots of phylogeny. Science 273: 569.
71. Hillis DM, Bull JJ (1993) An empirical test of bootstrapping as a method for
assessing confidence in phylogenetic analysis. Syst Biol 42: 182–192.
72. Huelsenbeck J, Rannala B (2004) Frequentist properties of Bayesian posterior
probabilities of phylogenetic trees under simple and complex substitution
models. Syst Biol 53: 904–913.
73. Thompson JD, Higgins DG, Gibson TJ (1994) CLUSTAL W: improving the
sensitivity of progressive multiple sequence alignment through sequence
weighting, position-specific gap penalties and weight matrix choice. Nucleic
Acids Res 22: 4673–4680.
74. Loytynoja A, Milinkovitch MC (2001) SOAP, cleaning multiple alignments from
unstable blocks. Bioinformatics 17: 573–574.
75. Hall BG (2004) Phylogenetic trees made easy: a how-to manual. 2nd ed Sinauer
Associates.
76. Stamatakis A (2006) RAxML-VI-HPC: maximum likelihood-based phylogenetic
analyses with thousands of taxa and mixed models. Bioinformatics 22:
2688–2690.
77. Lartillot N, Lepage T, Blanquart S (2009) PhyloBayes 3: a Bayesian software
package for phylogenetic reconstruction and molecular dating. Bioinformatics
25: 2286–2288.
78. Lartillot N, Philippe H (2004) A Bayesian mixture model for across-site
heterogeneities in the amino-acid replacement process. Mol Biol Evol 21:
1095–1109.
79. Abascal F, Zardoya R, Posada D (2005) ProtTest: selection of best-fit models of
protein evolution. Bioinformatics 21: 2104–2105.
80. Jones DT, Taylor WR, Thornton JM (1992) The rapid generation of mutation
data matrices from protein sequences. Comput Appl Biosci 8: 275–282.
81. Adachi J, Waddell PJ, Martin W, Hasegawa M (2000) Plastid genome phylogeny
and a model of amino acid substitution for proteins encoded by chloroplast
DNA. J Mol Evol 50: 348–358.
82. Shimodaira H (2002) An approximately unbiased test of phylogenetic tree
selection. Syst Biol 51: 492–508.
83. Shimodaira H, Hasegawa M (1999) Multiple comparisons of log-likelihoods with
applications to phylogenetic inference. Mol Biol Evol 16: 1114–1116.
84. Shimodaira H, Hasegawa M (2001) CONSEL: for assessing the confidence of
phylogenetic tree selection. Bioinformatics 17: 1246–1247.
85. Wang X, Lavrov DV (2007) Mitochondrial genome of the homoscleromorph
Oscarella carmela (Porifera, Demospongiae) reveals unexpected complexity in the
common ancestor of sponges and other animals. Mol Biol Evol 24: 363–373.
Phylogeny of Homoscleromorph
PLoS ONE | www.plosone.org 14 December 2010 | Volume 5 | Issue 12 | e14290

86. Lavrov DV, Forget L, Kelly M, Lang BF (2005) Mitochondrial genomes of two
demosponges provide insights into an early stage of animal evolution. Mol BiolEvol 22: 1231–1239.
87. Maldonado M, Carmona MC, Uriz MJ, Cruzado A (1999) Decline in Mesozoic
reef-building sponges explained by silicon limitation. Nature 401: 785–788.88. Muricy G, Boury-Esnault N, Bezac C, Vacelet J (1998) Taxonomic revision of
the Mediterranean Plakina Schulze (Porifera, Demospongiae, Homoscleromor-pha). Zool J Linn Soc 124: 169–203.
89. Muricy G, Sole Cava AM, Thorpe JP, Boury-Esnault N (1996) Genetic evidence
for extensive cryptic speciation in the subtidal sponge Plakina trilopha (Porifera:
Demospongiae: Homoscleromorpha) from the Western Mediterranea. Mar Ecol
Progr 138: 181–187.
90. Van Soest RWM, Boury-Esnault N, Hooper JNA, Rutzler K, de Voogd NJ,
et al. (2008) World Porifera database http://www.marinespecies.org/porifera.
Phylogeny of Homoscleromorph
PLoS ONE | www.plosone.org 15 December 2010 | Volume 5 | Issue 12 | e14290