modelling banking sector stability with multicriteria approaches
TRANSCRIPT
Electronic copy available at: http://ssrn.com/abstract=1531837Electronic copy available at: http://ssrn.com/abstract=1531837Electronic copy available at: http://ssrn.com/abstract=1531837
Financial Engineering Laboratory
Technical University of Crete
Modelling banking sector stability with multicriteria
approaches
Chrysovalantis Gaganis, Fotios Pasiouras, Michael Doumpos, Constantin Zopounidis
Working Paper 2010.01
January 2010
Working papers are in draft form. They are distributed for purposes of comment and
discussion only. The papers are expected to be published in due course, in revised
form. They may not be reproduced without permission of the copyright holder(s).
Copies of working papers are available at www.dpem.tuc.gr/fel
Electronic copy available at: http://ssrn.com/abstract=1531837Electronic copy available at: http://ssrn.com/abstract=1531837Electronic copy available at: http://ssrn.com/abstract=1531837
Financial Engineering Laboratory
Department of Production Engineering & Management
Technical University of Crete
Working Paper Series
Editorial Committee
Constantin Zopounidis, Technical University of Crete
Michael Doumpos, Technical University of Crete
Fotios Pasiouras, Technical University of Crete
www.dpem.tuc.gr/fel
2010
2010.01 C. Gaganis, F. Pasiouras,
M. Doumpos &
C. Zopounidis
Modelling banking sector stability with multicriteria
approaches

1
Modelling banking sector stability with multicriteria
approaches
Chrysovalantis Gaganis1,2
, Fotios Pasiouras1,3
, Michael Doumpos1, Constantin Zopounidis
1*
1Financial Engineering Laboratory, Department of Production Engineering & Management,
Technical University of Crete, Greece
,2Department of Economics, University of Crete, Greece
3 Centre for Governance & Regulation, University of Bath School of Management, UK
Abstract
Banking crises can be damaging for the economy, and as the recent experience has
shown, nowadays they can spread rapidly across the globe with contagious effects.
Therefore, the assessment of the stability of the banking sectors is important for
regulators, depositors, investors and the general public. In the present study, we
propose the development of classification models that assign the banking sectors in
three classes, labelled “low stability”, “medium stability”, and “high stability”. The
models are developed using three multicriteria decision aid techniques, which are
well-suited to ordinal problems. We use a sample of 114 banking sectors, and a set of
criteria that includes indicators of the macroeconomic, institutional and regulatory
environment, as well as basic characteristics of the banking and financial sector. The
models are developed and tested using a 10-fold cross-validation approach and they
are benchmarked against models developed with discriminant analyis and logistic
regression.
Keywords: banking, multicriteria decision aid, risk, stability
* Author for correspondence. E-mail: [email protected] ; Tel: +30-28210-37236
Copyright © 2010 by C. Gaganis, F. Pasiouras, M. Doumpos & C. Zopounidis
2
1. Introduction
Banking crises can be damaging for the economy, and as the recent experience has
shown, nowadays they can spread rapidly across the globe with contagious effects.
More detailed, after a relatively stable period between the Second World War and the
early 1970s, several countries experienced a banking crisis over the last thirty years.
Caprio and Klingebiel (2003) provide information on 117 systemic banking crises that
occurred in 93 countries and 51 borderline and smaller banking crises in 45 countries
since the late 1970s. Laeven and Valencia (2008) also provide details as well as
management strategies for 42 systemic banking crises from 37 countries between
1970 and 2007. These crises have both direct and indirect costs for the economy.
First, as documented in Caprio and Klingebiel (2003) the costs for restructuring and
recapitalisation can reach 10-20% and occasionally 40-55% of GDP (e.g. Argentina,
Indonesia). Second, the crises have adverse effects on the efficient operation of the
market economy due to the central role of banks as financial intermediates. Such
adverse developments result in reduction in investment and consumption, increases in
unemployment, and disturb the flow of credit to individuals and firms causing an
overall economic slowdown. This makes the assessment of the stability of the banking
sectors of particular importance for regulators, depositors, investors and the general
public.
Therefore, a number of studies examine the determinants of systemic banking
crises or develop early warning models to predict the crises (e.g. Demirguc-Kunt and
Detragiache, 1998; Davis and Karim, 2008; Moshirian and Wu, 2009). However,
there are a number of problems associated with these studies. First, they focus on the
1980s and the 1990s, when we experienced the majority of banking crises, and their
results may not be applicable to the current financial environment. Second, they
3
concentrate on emerging market economies due to the higher frequency of crises in
these economies in the past (Bell and Pain, 2000). Yet, the current crisis started from
developed countries like the US and the UK. In addition, there are differences in the
dates attributed to the banking crises (Bell and Pain, 2000), thus making their
empirical modelling problematic. Third, dating is also problematic when there are
successions of crises episodes as later crises can be extensions or re-emergences of
previous financial distress rather than individual events (Caprio and Klingebiel, 1996;
Davis and Karim, 2008). Fourth, the binary classification of the banking sectors, in
the ones that experienced a crisis and those that did not experienced a crisis, reduces
the usefulness of the models.
In contrast, in the present study we propose the classification of the banking
sectors in three classes, labelled “low stability”, “medium stability”, and “high
stability”. Furthermore, to avoid some of the aforementioned problems, we rely on the
Economist Intelligent Unit (EIU) “Banking Sector Risk Ratings rather than banking
crises. This approach can provide additional information, since it monitors the
banking sectors as they deteriorate from the “high stability” to the “low stability”
class. The models are developed using three multicriteria decision aid (MCDA)
techniques, namely UTilities Additives DIScriminantes (UTADIS), Multi-group
Hierarchical DIScrimination (MHDIS), and ELECTRE TRI. These methods are well-
suited to ordinal problems, like the one that we examine. Furthermore, they are not
making any statistical assumptions. We use a sample of 114 banking sectors and a set
of criteria that includes indicators of the macroeconomic, institutional and regulatory
environment, together with variables that consider the basic characteristics of the
banking and financial sector. To ensure the proper estimation and validation of the
models we follow a 10-fold cross-validation approach.

4
The rest of the paper is as follows. Section 2 discusses the sample and the
variables used in the study, while Section 3 outlines the classification techniques.
Section 4 discusses the empirical results, and Section 5 concludes the study.
2. Sample and variables
2.1. Sample
We start by considering the 120 banking sectors which were assigned an Economist
Intelligent Unit (EIU) “Banking Sector Risk Rating” during 2008. The EIU ratings
classify these sectors in 8 risk groups, ranging from C to AA. However, as our
purpose is not to explain or replicate the ratings, but rather to use them as the basis for
.the development of a general model, we group the banking sectors in three broad
classes.1 The first class includes banking sectors with ratings A and AA, the second
class includes those banking sectors with ratings B, BB and BBB, and the third class
consists of banking sectors with ratings C, CC, CCC. Thus, Class 1 includes “high
stability” banking sectors, Class 2 includes “medium stability” banking sectors, and
Class 3 includes “low stability” sectors.
Data for end-2007 for the macroeconomic and institutional environment, as
well as basic characteristics of the banking sector, all at the country/sector level, were
collected from the following sources: (i) the deposit insurance database developed by
Demirguc-Kunt et al. (2005), (ii) the financial structure database developed by Beck
1 We are not interested in replicating all the ratings of EIU for two reasons. First, the classification of
the banking sectors in three general classes allows to avoid potential problems that could arise during
the estimation and validation of the models due to the small number of sectors falling in a few of the
original EIU groups. Second, this approach allows us to avoid (at least to some extent) problems
associated with the timely adjustment of ratings. For instance, a delay in a downgrade from AA to A or
from BBB to B would have no impact in assessing the overall stability of a banking sector as we do.
Furthermore small errors of judgment in the assignment of ratings such as rating an A banking sector as
AA would also had no impact on our model. Obviously, large errors of judgment could make a
difference but we have no reason to believe that EIU would classify let us say a B banking sector as A
and visa versa.
5
et al. (2000, 2007), (iii) Heritage Foundation, and (iv) World Development Indicators
(WDI).
After excluding 6 banking sectors due to missing data for the selected criteria,
the final sample consists of 114 banking sectors. The distribution in the three classes
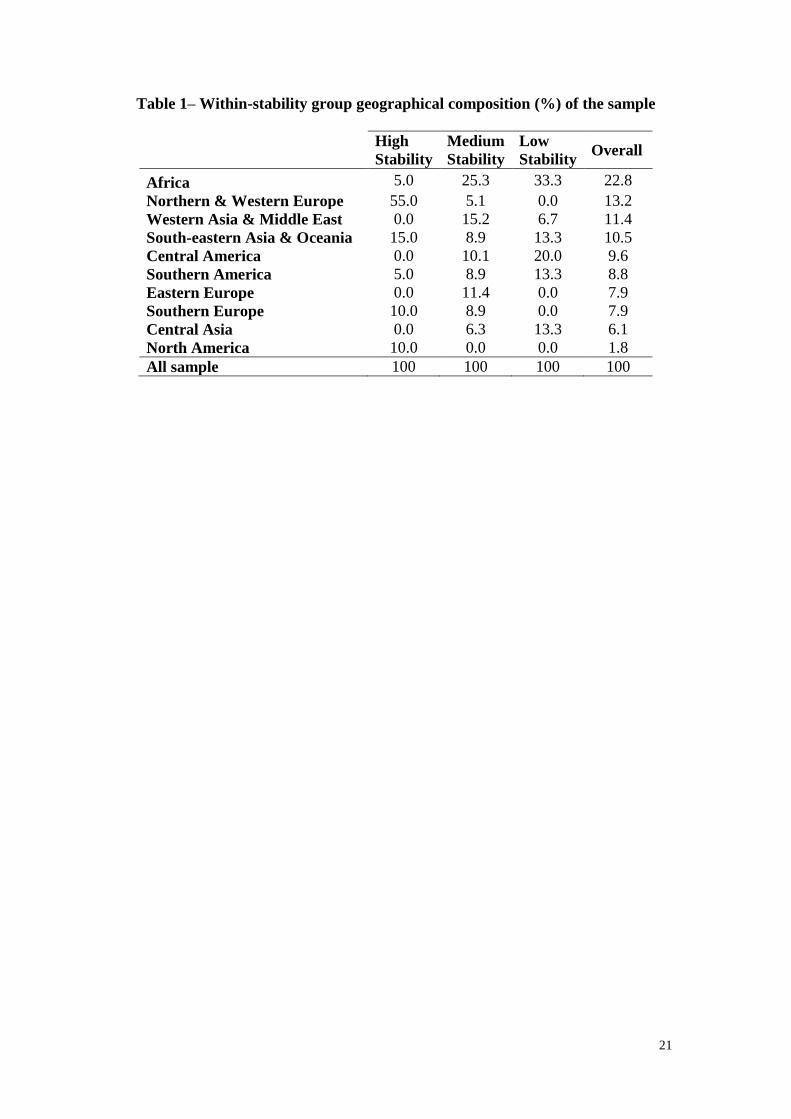
is as follows: 20 (Class 1), 79 (Class 2), and 15 (Class 3). Table 1 presents the within-
stability class geographical percentage composition of the sample. More detailed, the
figures in Table 1 show that 5% of the banking sectors in sample that are classified as
“high stability” come from Africa, 55% of them are from Northern and Western
Europe, and so on.
[Insert Table 1 Around Here]
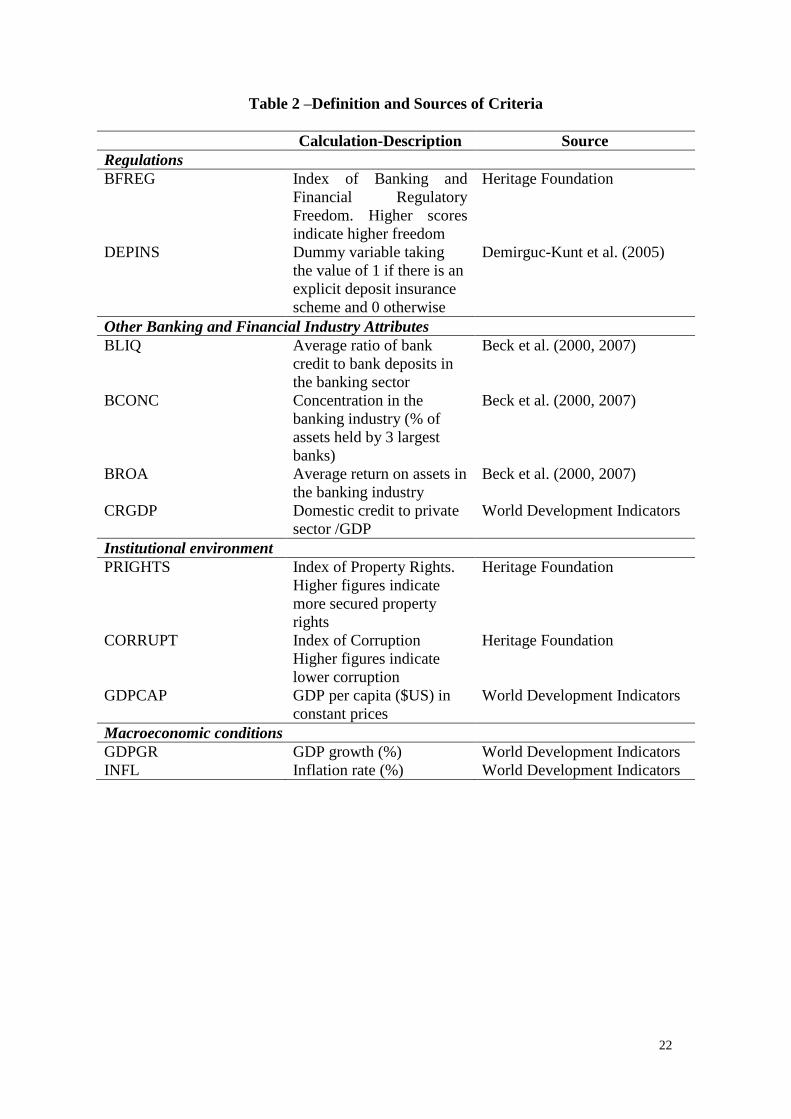
2.2. Criteria of banking stability
We use a total of 11 criteria falling in four general categories: (i) regulations, (ii) other
banking and financial sector attributes, (iii) institutional environment, and (iv)
macroeconomic conditions. These criteria and the corresponding sources of
information are presented in Table 2 and discussed below.
[Insert Table 2 Around Here]
2.2.1. Regulations
Theoretical and empirical evidence suggests that banking regulations such as entry
into the banking industry, restrictions on activities, etc., as well as state ownership of
banks can influence the stability of the banking sector (see Barth et al., 2004). As in
Demirguc-Kunt et al. (2004) and Pasiouras et al. (2007a) we use an overall indicator
of the relative openness of each country’s banking and financial system (BFREG),

6
taken by Heritage Foundation. Τhis index indicates the extent of restrictions on
financial services, central bank independence, government ownership of banks, the
difficulty of opening and operating domestic and foreign financial firms and
government influence on the allocation of credit. Higher scores indicate higher
freedom (i.e. less restrictions) in the banking and financial sector.
Deposit insurance is another regulatory tool used in many countries as a way
to avoid bank runs. However, deposit insurance schemes may encourage excessive
risk-taking behaviour (Demirguc-Kunt and Detragiache, 2002). The main reason is
that depositors will have no incentives to monitor bank managers, who can take on
riskier investments under the assumption that depositors are protected in the event of
a failure. Demirguc-Kunt and Detragiache (2002) provide evidence that an explicit
deposit insurance scheme, in the absence of strong banking regulations tends to
increase the probability of banking crises. Barth et al. (2004) also report a positive
relationship between deposit insurance “generosity” and the likelihood of a crisis.
Therefore, we use a dummy variable indicating whether an explicit deposit insurance
scheme has been adopted (DEPINS = 1) or not (DEPINS = 0).
2.2.2. Other Banking and financial sector attributes
As the recent crisis revealed, liquidity can become a very important problem for banks
especially when there is reluctance for interbank borrowings and depositors demand a
higher rate for their savings. To assess the liquidity of the banking sector we use the
average ratio of bank credit to bank deposits (BLIQ) that shows the percentage of
deposits that is tied up in loans. Therefore, higher ratios may indicate that the banking
sector has fewer funds available to meet a sudden recall of its funding.
7
The literature suggests that increased competition decreases bank charter value
and induces bank managers to increase risk (Keeley, 1990). Cross-country evidence
by De Nicolo et al. (2004) shows that highly concentrated banking markets faced
levels of systemic risk potentially higher than less concentrated markets during the
1993-2000 period, and this relationship strengthened between 1997 and 2000. In
contrast, Beck et al. (2006) report that more concentrated national systems are subject
to a lower probability of systemic banking crises. As a rough measure of competition,
we use the percentage of assets held by the three largest commercial banks relative to
the total assets of the commercial banking sector within the country (BCONC).
Results from bank-level studies indicate that profitability is negatively related
to the probability of failure (e.g. Wheelock and Wilson, 2000; Lanine and Vander
Vennet, 2006). Therefore, we use the average return on assets in the banking industry
(BROA) under the assumption that higher ROA will result in a more stable sector.
As discussed in Demirguc-Kunt and Detragiache (1998) financial
liberalization may increase banking sector fragility due to increased opportunities for
excessive risk-taking and fraud. Therefore, following, Demirguc-Kunt and
Detragiache (1998) and Davis and Karim (2008) among others, we use the ratio of
domestic credit to private sector over GDP (CRGDP) to proxy for financial
liberalization.
2.2.3. Institutional environment
The stability of the banking sector may also be affected by the country’s institutional
environment which can also mitigate the adverse effects of deposit insurance. For
example, Barth et al. (2004) find that better-developed private property rights and
greater political openness mitigate the negative association of moral hazard and bank
8
fragility. Demirguc-Kunt and Detragiache (2002) and Demirguc-Kunt and Kane
(2002) also conclude that a sound legal system with proper enforcement of rules
reduces the adverse effects of deposit insurance on bank risk-taking.
In the present study, we use three indicators of the level of the development of
institutional environment. The first is an index of the protection of property rights
(PRIGHTS) taken by Heritage Foundation. This index indicates the ability to
accumulate private property, secured by clear laws that are fully enforced by the
stage, and it can take values between 0 (i.e. private property is outlawed and all
property belongs to the state) and 100 (i.e. private property is guaranteed by the
government). The second is the Heritage index of corruption (CORRUPT) that reveals
the degree of corruption in the business environment, including levels of
governmental legal, judicial, and administrative corruption. It takes values between 0
and 100, with higher figures indicating lower corruption. Finally, as in past studies we
use the GDP per capita as a general indicator of institutional development (e.g.
Demirguc-Kunt et al., 2004).
2.2.4. Macroeconomic conditions
Several studies document a relationship between real GDP growth and the probability
or hazard rate of banking crisis (e.g. Demirguc-Kunt and Detragiache, 1998; Noy,
2004; Davis and Karim, 2008; Evrensel, 2008). As Davis and Karim (2008) mention,
GDP growth cannot only reduce non-performing loans it can also delay banking crises
due to pro-cyclicality. Following these studies, we use the real GDP growth (GDPGR)
as an overall indicator of economic growth. Finally, we use the annual inflation rate
(INFL) since past studies show that it can impact the stability of the banking sector
(e.g. Demirguc-Kunt and Detragiache, 1998; Davis and Karim, 2008).
9
Table 3 presents descriptive statistics for the above criteria while
distinguishing between the three stability classes. The Kruskal-Wallis non-parametric
test indicates that there are statistically significant differences between the means of
the three groups in all the cases.
[Insert Table 3 Around Here]
3. Multicriteria classification techniques
The problem considered in this case study falls within the multicriteria classification
problematic, which, in general involves, the assignment of a finite set of alternatives
1 2, ,..., nX x x x , each one described along a set of m criteria g1, g2, …, gm, to a set
of q ordered classes C1 C2. . . Cq. In the present study, the alternatives involve
the 114 banking sectors, the criteria correspond to the 11 variables discussed in
Section 2.2., and there are three ordered classes.
3.1. UTilités Additives DIScriminantes (UTADIS)
The UTADIS method develops an additive value function, which is used to score the
banking sectors and decide upon their classification. The value function has the
following general form:
1
( ) [0,1]m
i i i
i
U x wu g
where wi is the weight of criterion gi (the criteria weights sum up to 1) and )( ii gu is
the corresponding marginal value function normalized between 0 and 1. The marginal
value functions provide a mechanism for decomposing the aggregate result (global
value) in terms of individual assessment to the criterion level. To avoid the estimation
10
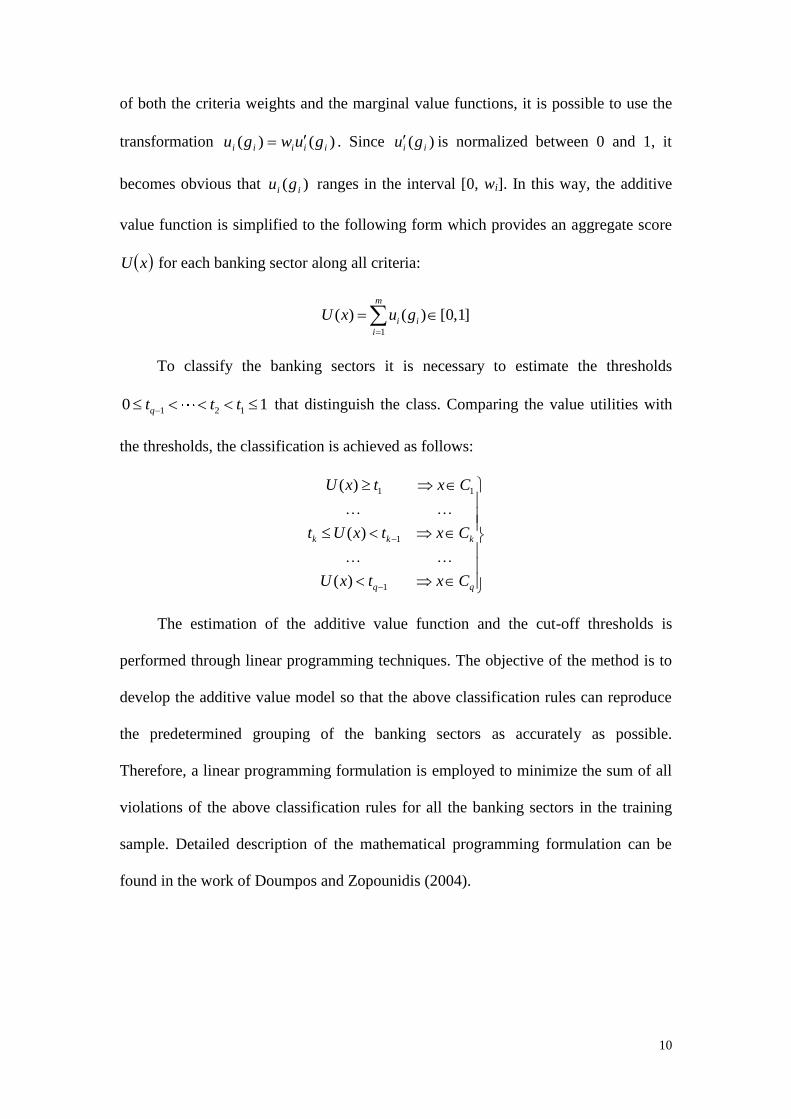
of both the criteria weights and the marginal value functions, it is possible to use the
transformation )()( iiiii guwgu . Since )( ii gu is normalized between 0 and 1, it
becomes obvious that )( ii gu ranges in the interval [0, wi]. In this way, the additive
value function is simplified to the following form which provides an aggregate score
xU for each banking sector along all criteria:
1
( ) ( ) [0,1]m
i i
i
U x u g
To classify the banking sectors it is necessary to estimate the thresholds
1 2 1 10 q tt t that distinguish the class. Comparing the value utilities with
the thresholds, the classification is achieved as follows:
1 1
1
1
( )
( )
( )
k k k
q q
U x t x C
t U x t x C
U x t x C
The estimation of the additive value function and the cut-off thresholds is
performed through linear programming techniques. The objective of the method is to
develop the additive value model so that the above classification rules can reproduce
the predetermined grouping of the banking sectors as accurately as possible.
Therefore, a linear programming formulation is employed to minimize the sum of all
violations of the above classification rules for all the banking sectors in the training
sample. Detailed description of the mathematical programming formulation can be
found in the work of Doumpos and Zopounidis (2004).
11
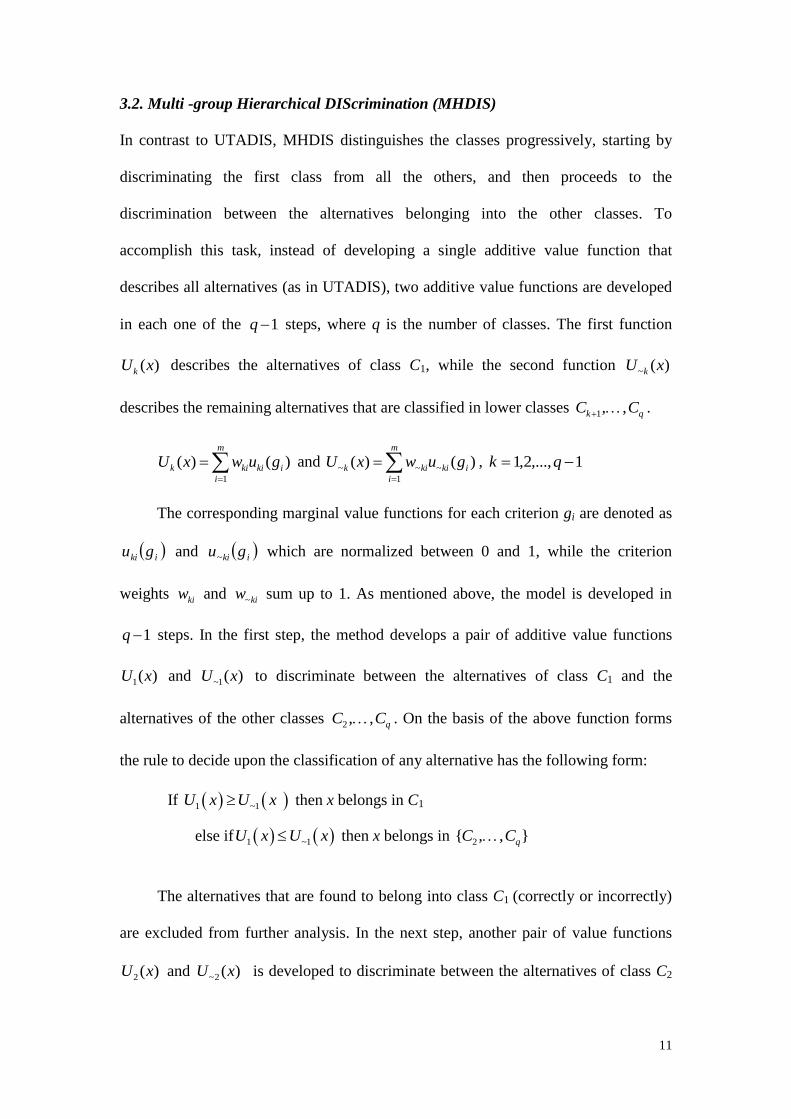
3.2. Multi -group Hierarchical DIScrimination (MHDIS)
In contrast to UTADIS, MHDIS distinguishes the classes progressively, starting by
discriminating the first class from all the others, and then proceeds to the
discrimination between the alternatives belonging into the other classes. To
accomplish this task, instead of developing a single additive value function that
describes all alternatives (as in UTADIS), two additive value functions are developed
in each one of the 1q steps, where q is the number of classes. The first function
( )kU x describes the alternatives of class C1, while the second function ~ ( )kU x
describes the remaining alternatives that are classified in lower classes 1, ,k qC C .
1
( ) ( )m
k ki ki i
i
U x w u g
and ~ ~ ~
1
( ) ( )m
k ki ki i
i
U x w u g
, 1,...,2,1 qk
The corresponding marginal value functions for each criterion gi are denoted as
iki gu and iki gu~ which are normalized between 0 and 1, while the criterion
weights kiw and ~kiw sum up to 1. As mentioned above, the model is developed in
1q steps. In the first step, the method develops a pair of additive value functions
1( )U x and ~1( )U x to discriminate between the alternatives of class C1 and the
alternatives of the other classes 2 , , qC C . On the basis of the above function forms
the rule to decide upon the classification of any alternative has the following form:
If 1 ~1U x U x then x belongs in C1
else if 1 ~1U x U x then x belongs in 2 }{ , , qC C
The alternatives that are found to belong into class C1 (correctly or incorrectly)
are excluded from further analysis. In the next step, another pair of value functions
2 ( )U x and ~2( )U x is developed to discriminate between the alternatives of class C2
12
and the alternatives of the classes 3, , qC C . Similarly to step 1, the alternatives that
are found to belong in class C2 are excluded from further analysis. This procedure is
repeated up to the last stage ( 1q ), where all classes have been considered.
The estimation of the weights of the criteria in the value functions as well as
the marginal value functions is accomplished through mathematical programming
techniques. More specifically, at each stage of the hierarchical discrimination
procedure, two linear programs and a mixed-integer one are solved to estimate
optimally the two required functions and minimize the classification error. Further
details of the mathematical programming formulations used in MHDIS can be found
in Zopounidis and Doumpos (2002).
3.3. ELECTRE TRI
The ELECTRE TRI method implements the outranking relations approach of
multicriteria decision aiding (Roy and Bouyssou, 1993). The outranking relation is a
binary relation that enables the assessment of the outranking degree of an alternative
xi over an alternative xj. The outranking relation allows to conclude that xi outranks xj
if there are enough arguments to confirm that xi is at least as good as xj (concordance),
while there is no essential reason to refute this statement (discordance).
Within the context of classification/sorting problems the outranking relation is
used to estimate the outranking degree of an alternative xi over a reference profile rk
that distinguish the classes Ck and Ck+1. Each reference profile rk is defined as a vector
of individual profiles for each criterion g1, g2, …, gm: rk=(rk1, rk2, …rkm).
In order to determine whether an alternative xi outranks a reference profile rk, all
paired comparisons (gij, rkj) and (rkj, gij) should be performed for each criterion gj. The
former comparison enables the assessment of the strength (xi, rk) of the affirmation
13
“alternative xi is at least as good as profile rk”, while the latter comparison leads to the
assessment of the strength (rk, xi) of the affirmation “profile rk is at least as good as
alternative xi”. Typically, an alternative xi is preferred to a profile rk (xi P rk) if (xi,
rk) and (rk, xi)< ( is a pre-specified cut-off point). If (xi, rk) and (rk, xi),
then xi and rk are considered as indifferent (xi I rk). Finally, if (xi, rk)< and (rk,
xi)< then xi and rk are considered incomparable (xi R rk). The estimation of the
credibility index (xi, rk) is performed in two stages. The first stage involves the
concordance test, which considers the criteria for which xi is at least as good as rk. The
second stage considers the veto conditions, which may arise if xi is significantly worse
than rk in some criteria. The details of this process can be found in Roy and Bouyssou
(1993).
Once the outranking relation is constructed, its exploitation to sort the
alternatives in X is performed through several heuristic assignment procedures. For
instance, ELECTRE TRI employs two assignment procedures, the pessimistic and the
optimistic one. Assuming a classification problem with q classes, in the pessimistic
assignment, each alternative ix is compared successively to the profiles 1 2 1, , , qr r r .
Let kr be the first profile such that (xi, rk). Then, ix is assigned to group kC (if
there is no profile such that (xi, rk), then ix is assigned to group qC ). In the
optimistic assignment each alternative ix is compared successively to the profiles
1 2 1, , ,q qr r r . Let kr be the first profile such that ( , )k ir x and ( , )i kx r .
Then, ix is assigned to group 1kC (if the there is no profile satisfying the above
condition, then ix is assigned to group 1C ).
The differences between the two procedures arise in the presence of the
incomparability relation. For example, in a two-group case an alternative that is
14
incomparable to the profile 1r will be assigned to group
1C with the optimistic
procedure and to group 2C with the pessimistic procedure. Thus, the differences
between the two assignment rules facilitate the identification of alternatives with
special characteristics, which make the comparison of the alternatives to the profiles
difficult.
In this study we employ the pessimistic assignment procedures and all the
parameters of the ELECTRE TRI model (weights of the criteria, preference,
indifference and veto thresholds, as well as the cut-off point) are estimated using
the evolutionary optimization approach, which has been recently proposed by
Doumpos et al. (2009).
4. Results
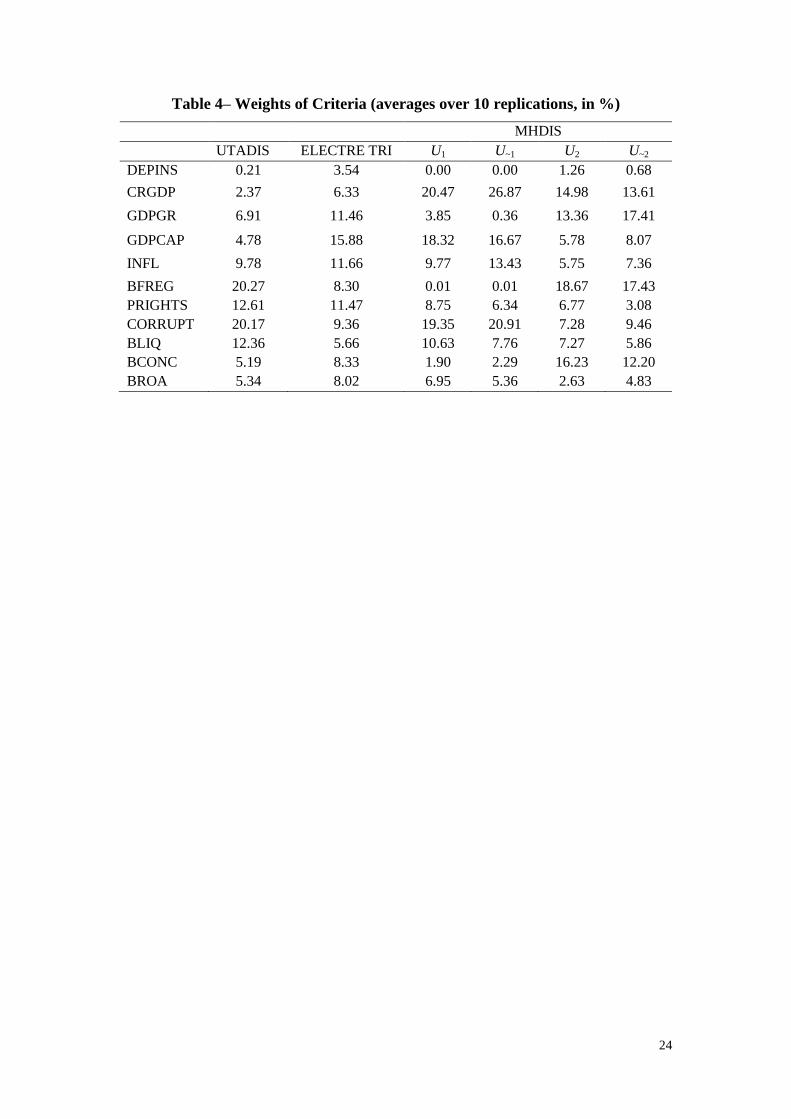
Table 4 presents the average weights (in %) of the criteria along all replications over
the 10-fold cross-validation analysis.2 The banking-financial regulatory environment
(BFREG) and corruption (CORRUPT) are the two most important criteria in the
UTADIS model, accounting together for around 40%. Property rights (PRIGHTS) and
liquidity (BLIQ) are of medium importance with weights around 12% each, while the
weights of the rest of the criteria range between 0.21% (DEPINS) and 9.78% (INFL).
Turning to the ELECTRE TRI model we observe that the weights of the criteria are
quite more balanced ranging between 3.54% (DEPINS) and 15.88% (GDPCAP). The
interpretation of the weights is more complicated in the case of MHDIS due to the
multiple functions that are developed. The most important criteria in the first set of
2 As mentioned earlier, we adopt a 10-fold cross validation approach to develop and evaluate the
models. The full sample of the 114 banking sectors is randomly split into 10 mutually exclusive sub-
samples (i.e. non-overlapping folds of approximately equal size). Then, 10 models are developed in
turn, using nine folds for training and leaving one fold out each time for validation. The average error
rate over all the 10 replications is the cross-validated error rate.
15
the utility functions U1 (i.e. “high stability”) and U~1 (i.e. “medium” and “low”
stability) are the domestic credit to private sector over GDP (CRGDP), GDP per
capita (GDPCAP), and corruption (CORRUPT). However, in the second set of utility
functions other criteria become important. In particular, in U2 which characterizes the
“medium stability” banking sectors and U~2 which characterizes the “low stability”
banking sectors the four most important criteria are: bank concentration (BCONC),
banking-financial regulatory environment (BFREG), domestic credit to private sector
over GDP (CRGDP), and GDP growth (GDPGR).
[Insert Table 4 Around Here]
Overall, it appears that deposit insurance is the less important criterion in all
models, while the institutional environment is a good predictor (on an aggregate
basis) of the stability of the banking sectors. Yet, there is no general agreement in the
models as for the importance of the criteria. While there is no particular reason for
that, such differences have been observed in past studies as well (e.g. Espahbodi and
Espahbodi, 2003; Barnes, 2000; Pasiouras et al., 2007b). One possible explanation is
that although all methods attempt to classify correctly as many observations as
possible, they consider different ways of processing the same information in the
dataset. Another explanation is that, while UTADIS and ELECTRE develop only one
function characterizing all banking sectors, MHDIS develops four functions that
correspond to difference classes. It should also be noted, while the weights in the
value functions developed with UTADIS and MHDIS represent tradeoffs, the weights
in ELECTRE TRI represented the strength of the criteria in a weighted voted process.
As discussed in Pasiouras et al. (2007b), whether the weights attributed by one
16
method are intuitively more appealing than those selected by another method is a
matter of subjective judgment.
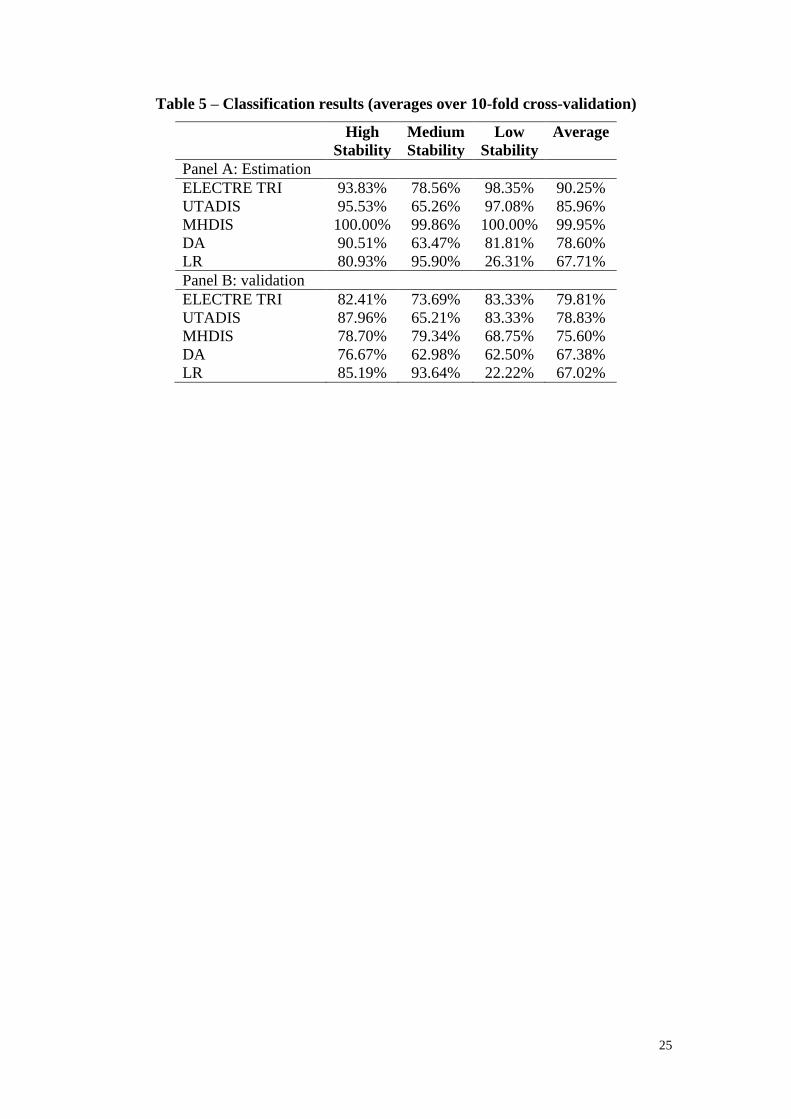
Table 5 presents the average classification results obtained over the 10
replications. Since the classification accuracies in the training sample can be upward
biased, we focus on the ones achieved in the validation sample. Panel B shows that
these accuracies are quite satisfactory being 79.81% (ELECTRE TRI), 78.83%
(UTADIS), and 75.60% (MHDIS). Of particular importance is that ELECTRE TRI
and UTADIS perform very well in identifying banking sectors that belong in Class 3,
which bear the highest risk. MHDIS on the other hand achieves the highest accuracy
in classifying banking sectors in Class 2. This is also a difficult task since the
characteristics of these banking sectors may overlap with the ones belonging in the
lower band of Class 1 and/or the upper band of Class 3.
[Insert Table 5 Around Here]
As a benchmark to the three MCDA methods, we also develop two models
using discriminant analysis (DA) and logistic regression (LR). The average
classification accuracies of DA and LR are considerably lower than the ones of the
three MCDA methods. Despite being quite similar on average (i.e. DA: 67.38%; LR:
67.02%), these accuracies are achieved in a different way. While the performance of
DA is balanced among the three classes, LR classifies very poorly banking sectors
belonging in class 3, with an accuracy as low as 22.22%.
A closer look at the two models with the lowest misclassification errors in the
validation sample indicate the following. First, 62% of the misclassification errors of
UTADIS involve downgrades. More detailed, Greece, Portugal, and Botswana are
downgraded from the class of high stability to the one of medium stability. Countries

17
downgraded from medium to low stability come mostly from Asia (India,
Bangladesh, Indonesia, etc.), Africa (Algeria, Egypt, Nigeria, etc.), Latin-Southern
America (Guatemala, Paraguay, Bolivia) and Eastern Europe (Russia, Romania).
Only 38% of the errors involve upgrades. Most of them refer to upgrades of banking
sectors from the medium stability class to the high stability one3 ,while there are also
three misclassifications involving upgrades from the low stability class to the medium
stability one (i.e. Sudan, Jamaica, Syria).
We observe a similar picture in the case of ELECTRE TRI, with downgrades
accounting for 70% of the misclassification errors. More detailed, the model
downgrades four banking sectors from the high stability class to the medium stability
one (Germany, USA, Singapore and Switzerland). As it concerns downgrades from
the medium to the low stability class, they mostly involve countries from Western
Asia (Azerbaijan, United Arab Emirates, Turkey), South-Eastern Asia (Indonesia,
Malaysia), Eastern Europe (Moldova, Slovakia), Africa (Tunisia, Gabon, Equatorial
Guinea), and Central – South America (Guatemala, Argentina, Uruguay). The
misclassification errors of the model that are due to upgrades account for 30%,
involving one upgrade from the medium to high stability class (Tanzania) and seven
upgrades from low to medium stability class (Kenya, Honduras, Sudan, Uzbekistan,
Nicaragua, Syria, and Vietnam).
5. Conclusions
The recent financial crisis that started in the US and the UK and spread across the
globe, highlighted the importance of early warning models to assess the stability of
the banking sector. Using a sample of 114 banking sectors, and a set of eleven
3 These are mostly countries from Oceania (New Zealand, Australia), Europe (Spain, UK, Slovenia,
Czech Republic), Israel, and South-eastern Asia (Korea, Malaysia).
18
variables we developed three multicriteria decision aid models to classify banking
sectors as “high stability”, “medium stability,” and “low stability”. These models
were capable in classifying correctly between 75.60% and 79.81% in the validation
sample. Models developed with discriminant analysis and logistic regression for
benchmarking purposes achieved accuracies around 67%. The models developed in
the present study could be useful in assessing the soundness of the banking sectors
and monitor them as their stability deteriorates from the group of “high stability” to
the one of “low stability”.
References
Barnes P., (2000), The identification of U.K. takeover targets using published
historical cost accounting data. Some empirical evidence comparing logit with
linear discriminant analysis and raw financial ratios with industry-relative ratios,
International Review of Financial Analysis, 9(2), 147−162.
Barth, J.R., Caprio G. Jr, Levine, R., (2004), Bank regulation and supervision: what
works best? Journal of Financial Intermediation, 13, 205-248.
Beck T., Demirguç-Kunt A., Levine R., (2000), A New Database on Financial
Development and Structure, World Bank Economic Review, 14, 597-605.
Beck T., Demirguç-Kunt A., Levine R., (2007), A New Database on Financial
Development and Structure (1960-2007), September 2007 update, World Bank.
Beck T., Dermirguc-Kunt A., Levine R., (2006), Bank concentration, competition and
crises: First results. Journal of Banking and Finance, 30, 1581-1603.
Bell J., Pain D., (2000), Leading indicator models of banking crises – a critical
review, Financial Stability Review, December, 113-129.
Caprio G., Jr., Klingebiel D., (1996), Bank Insolvencies: Cross-country Experience,
World Bank Policy Research Working Paper 1620, July.
Caprio G., Klingebiel D., (2003), Episodes of Systemic and Borderline Financial
Crises, January, World Bank, available at http://go.worldbank.org/5DYGICS7B0
Davis E.P., Karim D., (2008), Comparing early warning systems for banking crises,
Journal of Financial Stability, 4, 89-120.
19
De Nicolo G., Bartholomew P., Zaman J., Zephirin M., (2004), Bank consolidation,
internationalization, and conglomeration: Trends and implications for financial
risk. Financial Markets, Institutions & Instruments, 13, 173-217.
Demirguc-Kunt A., Detragiache E., (1998), The Determinants of Banking Crises in
Developing and Developed Countries, IMF Staff Papers, 45, 81-109.
Demirguc-Kunt A., Detragiache E., (2002), Does deposit insurance increase banking
system stability? An empirical investigation. Journal of Monetary Economics 49,
1373-1406.
Demirguc-Kunt A., Kane E.J., (2002) Deposit insurance around the world: Where
does it work? Journal of Economic Perspectives 16, 175-195.
Demirguc-Kunt A., Karacaovali B., Laeven L., (2005), Deposit Insurance around the
World: A Comprehensive Database, World Bank Policy Research Working
Paper 3628, June.
Demirguc-Kunt A., Laeven L., Levine R., (2004), Regulations, Market Structure,
Institutions and the Cost of Financial Intermediation, Journal of Money, Credit
and Banking, 36, 593-622.
Doumpos M., Marinakis Y., Marinaki M., Zopounidis C. (2009), An evolutionary
approach to construction of outranking models for multicriteria classification:
The case of the ELECTRE TRI method, European Journal of Operational
Research (in press).
Doumpos M., Zopounidis C., (2004), Developing sorting models using preference
disaggregation analysis: An experimental investigation, European Journal of
Operational Research, 154, 585-598.
Espahbodi H., Espahbodi P., (2003), Binary choice models for corporate takeover,
Journal of Banking and Finance, 27, 549−574.
Evrensel A.Y., (2008), Banking crisis and financial structure: A survival-time
analysis, International Review of Economics and Finance, 17, 589-602.
Keeley M.C., 1990. Deposit insurance, risk, and market power in banking. American
Economic Review 5, 1183-1200.
Laeven L., Valencia F., (2008), Systemic Banking Crises: A New Database, IMF
Working Paper 08/224, October.
Lanine G., Vander Vennet R., (2006), Failure prediction in the Russian bank sector with
logit and trait recognition models, Expert Systems with Applications, 30, 463-478.
20
Moshirian F., Wu Q., (2009), Banking industry volatility and banking crises,
International Financial Markets, Institutions and Money, In press.
Noy I., (2004), Financial liberalization, prudential supervision, and the onset of
banking crises, Emerging Markets Review, 5, 341-359.
Pasiouras F., Gaganis C., Doumpos M., (2007a), A multicriteria discrimination
approach for the credit ratings of Asian banks, Annals of Finance, 3, 351- 367.
Pasiouras F., Tanna S., Zopounidis C., (2007), The identification of acquisition targets
in the EU banking industry: An application of multicriteria approaches,
International Review of Financial Analysis, 16, 262-281.
Roy, B., and Bouyssou, D. (1993), Aide Multicritère à la Décision: Méthodes et Cas,
Economica, Paris.
Wheelock D.C., Wilson P.W., (2000), Why do banks disappear? The determinants of
U.S. bank failures and acquisitions, The Review of Economics and Statistics 82,
127-138.
Zopounidis C., Doumpos M., (2002), Multi-group discrimination using multi-criteria
analysis: Illustrations from the field of finance, European Journal of Operational
Research, 139, 371-389.
21
Table 1– Within-stability group geographical composition (%) of the sample
High
Stability
Medium
Stability
Low
Stability Overall
Africa 5.0 25.3 33.3 22.8
Northern & Western Europe 55.0 5.1 0.0 13.2
Western Asia & Middle East 0.0 15.2 6.7 11.4
South-eastern Asia & Oceania 15.0 8.9 13.3 10.5
Central America 0.0 10.1 20.0 9.6
Southern America 5.0 8.9 13.3 8.8
Eastern Europe 0.0 11.4 0.0 7.9
Southern Europe 10.0 8.9 0.0 7.9
Central Asia 0.0 6.3 13.3 6.1
North America 10.0 0.0 0.0 1.8
All sample 100 100 100 100
22
Table 2 –Definition and Sources of Criteria
Calculation-Description Source
Regulations
BFREG Index of Banking and
Financial Regulatory
Freedom. Higher scores
indicate higher freedom
Heritage Foundation
DEPINS Dummy variable taking
the value of 1 if there is an
explicit deposit insurance
scheme and 0 otherwise
Demirguc-Kunt et al. (2005)
Other Banking and Financial Industry Attributes
BLIQ Average ratio of bank
credit to bank deposits in
the banking sector
Beck et al. (2000, 2007)
BCONC Concentration in the
banking industry (% of
assets held by 3 largest
banks)
Beck et al. (2000, 2007)
BROA Average return on assets in
the banking industry
Beck et al. (2000, 2007)
CRGDP Domestic credit to private
sector /GDP
World Development Indicators
Institutional environment
PRIGHTS Index of Property Rights.
Higher figures indicate
more secured property
rights
Heritage Foundation
CORRUPT Index of Corruption
Higher figures indicate
lower corruption
Heritage Foundation
GDPCAP GDP per capita ($US) in
constant prices
World Development Indicators
Macroeconomic conditions
GDPGR GDP growth (%) World Development Indicators
INFL Inflation rate (%) World Development Indicators

23
Table 3– Descriptive Statistics
High
Stability
Medium
stability Low
Stability
Kruskal –
Wallis
Mean Median Std. Dev. Mean Median Std. Dev. Mean Median Std. Dev.
Deposit insurance 0.85 1.00 0.49 0.62 1.00 0.49 0.53 1.00 0.52 4.67*
Credit to private sector / GDP 133.26 129.84 45.27 54.30 40.40 45.27 31.11 25.67 21.33 33.90***
GDP growth 3.55 3.25 3.30 6.54 6.20 3.30 6.00 6.90 4.41 19.29***
GDP per capita 26971.63 27732.77 6500.55 5796.14 2867.75 6500.55 1375.54 783.03 1482.34 48.90***
Inflation 2.13 2.01 6.63 7.34 5.58 6.63 25.04 8.24 59.18 25.65***
Banking & financial index 68.00 70.00 16.55 53.42 50.00 16.55 38.46 38.46 19.58 19.47***
Property rights index 83.50 90.00 18.31 44.43 40.00 18.31 27.69 30.00 10.79 51.12***
Corruption index 79.55 82.50 16.42 38.97 34.00 16.42 26.08 26.00 4.22 50.35***
Bank credit / Bank deposits 1.30 1.20 0.44 0.98 0.91 0.44 0.82 0.83 0.25 7.35**
Bank concentration 75.65 0.78 0.18 66.85 0.66 0.18 75.66 0.79 0.19 5.79*
ROA 1.14 0.01 0.02 1.72 0.01 0.02 2.33 0.02 0.04 5.63* The Kruskal-Wallis test indicates whether there are statistically significant differences between the three groups. *** Significant at the 1% level, ** Significant at the 5%
level, * Significant at the 10% level.
24
Table 4– Weights of Criteria (averages over 10 replications, in %)
MHDIS
UTADIS ELECTRE TRI U1 U~1 U2 U~2
DEPINS 0.21 3.54 0.00 0.00 1.26 0.68
CRGDP 2.37 6.33 20.47 26.87 14.98 13.61
GDPGR 6.91 11.46 3.85 0.36 13.36 17.41
GDPCAP 4.78 15.88 18.32 16.67 5.78 8.07
INFL 9.78 11.66 9.77 13.43 5.75 7.36
BFREG 20.27 8.30 0.01 0.01 18.67 17.43
PRIGHTS 12.61 11.47 8.75 6.34 6.77 3.08
CORRUPT 20.17 9.36 19.35 20.91 7.28 9.46
BLIQ 12.36 5.66 10.63 7.76 7.27 5.86
BCONC 5.19 8.33 1.90 2.29 16.23 12.20
BROA 5.34 8.02 6.95 5.36 2.63 4.83
25
Table 5 – Classification results (averages over 10-fold cross-validation)
High
Stability
Medium
Stability
Low
Stability
Average
Panel A: Estimation
ELECTRE TRI 93.83% 78.56% 98.35% 90.25%
UTADIS 95.53% 65.26% 97.08% 85.96%
MHDIS 100.00% 99.86% 100.00% 99.95%
DA 90.51% 63.47% 81.81% 78.60%
LR 80.93% 95.90% 26.31% 67.71%
Panel B: validation
ELECTRE TRI 82.41% 73.69% 83.33% 79.81%
UTADIS 87.96% 65.21% 83.33% 78.83%
MHDIS 78.70% 79.34% 68.75% 75.60%
DA 76.67% 62.98% 62.50% 67.38%
LR 85.19% 93.64% 22.22% 67.02%