modeling time-dependent forces on liquid bridge interactions between dissimilar particles
TRANSCRIPT

Advanced Powder Technology 19 (2008) 277–292www.brill.nl/apt
Original paper
Modeling Time-Dependent Forces on Liquid BridgeInteractions Between Dissimilar Particles
P. Gopalkrishnan a, I. Manas-Zloczower a and D. L. Feke b,∗
a Department of Macromolecular Science and Engineeringb Department of Chemical Engineering, Case Western Reserve University, Cleveland,
OH 44106, USA
Received 15 March 2007; accepted 25 July 2007
AbstractThe total force of interaction induced by a viscous binder between two equal-sized spheres had been previ-ously analyzed. In this work, we extend the modeling approach to the interaction of dissimilar particles viaa harmonic mean approximation used to compute the effective size of the interacting entities. We test thevalidity of this approximation to extrapolate these earlier analytical models to the practical processing sce-nario of particle size distributions generated during dispersive mixing. Additionally, we use an experimentalmethodology to simulate typical processing flow geometries and conditions ranging from the simple shear todynamic shear to extensional flows. This enables application of the previously established algorithm, whichis based on constant velocity interactions, to a range of realistic mixing modeling and simulation efforts.© Koninklijke Brill NV, Leiden and Society of Powder Technology, Japan, 2008
KeywordsLiquid bridge, agglomerate dispersion, binder, scaling, shear flows.
1. Introduction
This work aims at furthering our earlier model [1] for characterizing interstitialfluid interactions within compacted particulate systems. Several authors have in-vestigated the binder-induced capillary force interactions between particulates inwet processing operations mixing [2–6]. Such work has often used the thin-filmlubrication-regime Reynold’s equation [3]. The work of Ennis et al. [7] first empha-sized the relative importance of viscous force contributions to liquid bridge inter-actions. In our previous work [8], we considered interactions between equal-sizedmodel particles and incorporated the effects of dynamics of interaction. The ana-lytical expressions and scaling algorithm developed for the total interparticle force
* To whom correspondence should be addressed. E-mail: [email protected]
© Koninklijke Brill NV, Leiden and Society of Powder Technology, Japan, 2008 DOI:10.1163/156855208X294636

278 P. Gopalkrishnan et al. / Advanced Powder Technology 19 (2008) 277–292
induced by the straining of a pendular liquid bridge between equal-sized particleswere validated experimentally. Here, we extend that experimental and modeling ef-fort to dissimilar particle interactions. These results have practical implications inparticle processing applications ranging from dispersion to granulation [1, 9].
Preliminary efforts towards characterizing dissimilar particle interactions havebeen attempted by applying a mean size approximation for the static component ofthe liquid bridge force or the capillary force only [4]. The lack of accurate analyticalmodels for the dynamic or viscous component has prevented the characterization ofthe total liquid bridge interactions for such practical processing scenarios.
Further demonstration of the applicability of this modeling work is achieved byutilizing our experimental technique to simulate flow fields ranging from simpleshear to oscillatory (or dynamic) shear to extensional flows. Our approach enablesus to make predictions based on experiments utilizing constant velocities of inter-action between similar particles, which are applicable to non-linear flow fields anddissimilar particles as well.
2. Theory
2.1. Polydisperse Systems
Expressions for the capillary [6] and viscous [1, 8] forces have been estimatedthrough experimentation and analytical modeling. Based on these, the pair-wisebinder-induced interaction has been estimated accurately (error below 5%) as thedirect sum of the individual components. The total liquid bridge interaction betweentwo equal-sized spheres of radius R is given by [1]:
Ftot = πR22σ
(1
R1+ 1
R2
)+ 3
2πμR2 1
h
dh
dt
R42
(R22 + Rh)2
, (1)
where dh/dt is the relative velocity of separation (v) imposed on the particles (nor-mally treated as constant), σ is the interfacial tension between the binder and theparticle surface and μ is the fluid viscosity. The other parameters are obtained fromthe system geometry (Fig. 1).
Dimensionless forms of (1) enable scaling predictions for the interactions acrossa range of particle sizes and interaction dynamics (interaction velocity/fluid viscos-ity) based on a single reference run. For this we employ a dimensionless capillarynumber defined for liquid bridge geometries [10]:
CaLB = μvR
σh= μv
σ
(1
h∗
), (2)
where h∗ is the dimensionless separation scaled on R, the radius of an interactingsphere. Non-dimensionalizing (1) yields [1]:
Ftot
πRσ≡ F ∗
tot =R∗2
R∗1(R∗
1 + R∗2) + 3
2CaLB
R∗42
(R∗22 + h∗)2
, (3)

P. Gopalkrishnan et al. / Advanced Powder Technology 19 (2008) 277–292 279
Figure 1. Schematic of a liquid bridge extended between two identical spherical particles of radius, R.The position of the contact line on both spheres provides an estimate for the half-filling angle, β , onboth upper (β1) and lower (β2) spheres. Here β1 = β2. The separation distance is represented as h
and the upper sphere is submerged in the liquid to a depth of l, as shown. The radii of curvatureare R1, in the plane of the meridian (considered positive), and R2, in the plane orthogonal to themeridian, within the bridge, such that its center of curvature lies on the axis of symmetry of the bridge(considered negative). Rw is the wetted radius and H represents the total length of the liquid bridgeincluding the wetted portions of the spheres.
where the radius of the interacting glass spheres (R) is used as the length scale and(dh/dt) is replaced by the relative speed (v) used in the capillary number.
Here, we build on (3) by incorporating a polydispersity in size distribution ofinteracting particles, as is experienced practically. The interaction of the dissimilarparticles is accounted for by a simple Derjaguin approximation for the effectiveparticle size via the harmonic mean of the radii [4]:
Rmean = 2RARB
RA + RB. (4)
Extending this approximation to the viscous force and hence the total liquidbridge force is, in practice, a significant approximation. This is so because ana-lytical modeling of binder-induced dissimilar sphere interactions for even just thecapillary component under simplifying approximations such as the toroid bridgegeometry has proven to be very intensive [4]. That (4) is well suited to accountfor size disparity amongst interacting particles connected by a liquid bridge whencomputing the capillary force has been established [4]. We now test the same ap-

280 P. Gopalkrishnan et al. / Advanced Powder Technology 19 (2008) 277–292
proximation in the analytical estimation of the viscous force and consequently thetotal liquid bridge interaction.
Substituting Rmean for the particle radius R in (3) and rewriting the force ex-pression in an implicit form [1, 8] enables isolation and direct comparison of thecapillary and viscous components:
Ftot
πRmeanσ= F ∗
tot = F ∗cap +CaLBF ∗
vis. (5)
Equation (4) thus reduces a dissimilar particle system to one with equal-sized par-ticles of radius Rmean, as are modeled by (5) for the total interaction force due toa pendular liquid bridge. Dimensionless capillary (F ∗
cap) and viscous (F ∗vis) forces
thus computed for a model system are then used directly in any study system withthe adjusted capillary number accounting for the specific dynamics employed. Sep-aration of the static and dynamic components of the total force also enables directassessment of the relative magnitudes of the interfacial tension relative to the vis-cous component for a given system.
2.2. Flow Fields
To characterize the flow field, the rate of deformation tensor γ̇≈is used. The three
cases studied include simple shear, small amplitude oscillatory shear and uniaxialextension flow.
Simple shear:
ux = γ̇ y, uy = uz = 0 (6)
γ̇≈
=( 0 γ̇ 0
γ̇ 0 00 0 0
). (7)
Oscillatory shear:
ux = γ̇ y sin(ωt), uy = uz = 0 (8)
γ̇≈
=( 0 γ̇ 0
γ̇ 0 00 0 0
)sin(ωt). (9)
Uniaxial extension:
ux = − γ̇
2x, uy = − γ̇
2y, uz = γ̇ z (10)
γ̇≈
=(−γ̇ 0 0
0 −γ̇ 00 0 2γ̇
). (11)
Equation (5) for the dimensionless force of interaction includes the velocity of inter-action parameter in the capillary number (CaLB). We employ the rate of deformationtensors above to estimate the velocity profile to be imposed for the interacting

P. Gopalkrishnan et al. / Advanced Powder Technology 19 (2008) 277–292 281
spheres. Thus, we can see from (6) that simple shear flow fields can be simulatedby a uni-directional constant relative velocity (ux) between two particles lined upin the direction of flow. On the other hand, the relative velocity between two similarparticles in dynamic shear or the uniaxial extensional fields is constantly changingin magnitude and/or direction due to the acceleration inherent to these flows. Uni-axial extension in (10), for instance, is imposed in practice by driving the spheres inthe principal direction (uz) in precise pre-calculated steps of time and displacementas discussed in the experimentation section.
3. Apparatus and Experimentation
3.1. Polydisperse Systems
The experimental setup shown in Fig. 2 and described in earlier work [1, 8] wasused here with a wide range of applied velocities, fluid viscosities and varied com-binations of interacting particle sizes. The material data and imposed conditions
Figure 2. Schematic of the experimental apparatus. The apparatus is used to generateforce versus time data which is electronically recorded. This figure is published in color onhttp://www.ingentaconnect.com/content/vsp/apt

282 P. Gopalkrishnan et al. / Advanced Powder Technology 19 (2008) 277–292
Table 1.Material properties and experimental conditions for the scaling investigations
Reference Study systems
Run 1 Run 2 Run 3 Run 4 Run 5
Particle radii (mm)upper sphere 2.5 1.19 1.98 1.98 2.38 1.98lower sphere 2.5 2.38 2.38 3.18 3.18 2.38
Effective particle radius (mm) 2.5 1.59 2.16 2.44 2.72 2.16Viscosity (Pa·s) 1 60 60 60 60 60Velocity (μm/s) 1000 50 50 50 50 100Surface tension (N/m) 0.021 0.021 0.021 0.021 0.021 0.021Capillary number range (CaLB) 0.06–12 0.2–38 0.2–38 0.2–38 0.2–0.38 0.4–76
Fluid under consideration is PDMS between model glass spheres. Effect of sphere size: runs 1–4.Effect of dynamics: runs 2 and 5.
in reference and study runs including effective particle radii (Rmean) are summa-rized in Table 1. Plots of total liquid bridge force as a function of the inter-sphereseparation are generated for each study system and compared with the scalingpredictions from (5) based on the reference run. The dimensionless liquid bridgevolume (Vb/R
3mean) was maintained below 0.01 in order to keep gravitational forces
negligible [11].
3.2. Flow Field Adaptations
Various flow profiles were imposed using the programmable DC motor which con-trolled the relative displacement between spheres. The control board for the motorallows for macro commands to be written in order to impose specific motion pro-files. Specifications for the imposed velocity and desired displacement, accelerationand deceleration rates are included in each macro command. Through a series ofsuch macros, pre-calculated values of displacement at appropriate interaction ve-locities are imposed on the model spheres connected via the liquid bridge.
Prior to imposing time-dependent velocity profiles on the liquid bridge, the dif-ferential response of the force components within the liquid bridge, i.e. the capillaryand viscous forces, was tested during approach and separation of the model spheres.This is a measure of the hysteresis in the force measurement within the system.
3.3. Hysteresis in Liquid Bridge Force Measurements
It is expected that hysteresis effects would be negligible in one of two scenarios,based on dimensionless Capillary numbers for deformation of the liquid bridge [8]:
(i) Capillary regime: CaLB < 0.1.
(ii) Viscous regime: CaLB > 10.

P. Gopalkrishnan et al. / Advanced Powder Technology 19 (2008) 277–292 283
The fluids we tested for hysteresis included the reference system 1 Pa·s poly-dimethyl siloxane (PDMS) fluid and the higher-viscosity system, 60 Pa·s PDMS.At the end of each motion path, the bridge was allowed to stabilize for 5 s, since thedynamics of direction reversal were not being probed in this specific case.
3.4. Time-Dependent Flow Profiles
In order to approximate a time-dependent phenomenon using constant velocitymodels, we have to use a series of time steps with correspondingly incrementedvelocities. Superposition of these in a sequence yields an estimate of the desiredvelocity profile at each instant of time. As expected, the increments must ideallytake place over infinitesimal time steps to yield minimum deviation of effectivevelocities from the calculated profiles. Experiments involving time-dependent flowprofiles utilized 60 Pa·s PDMS and equal-sized spheres (3.18 mm).
3.5. Oscillatory Shear Flow
Three time intervals were investigated: 1.00, 0.70 and 0.07 s. The limiting factor ongoing to smaller time steps is with the dynamic response of the balance. While themotor control itself is capable of handling time scales down to 2 ms, the responseof the force balance is limited to about 0.1 s. This is determined from the responseobtained at each time interval. In addition, the experimental corroboration datasetsare limited to a smaller extent by the velocity range of the motor (5–1300 μm/s) andthe motor displacement range having a maximum extension of 2.5 cm.
Oscillations about a mean velocity were imposed via a sinusoidal profile (am-plitude of 0.5 mm/s) using 60 Pa·s PDMS. Lower viscosities did not provide forsufficient measurable variation in liquid bridge forces due to the small amplitudesof oscillation. Within the range of imposed motion, insufficient force variation oc-curs to effect detection and measurement with the low viscosity fluids.
By a trial-and-error method, an optimum frequency of oscillation was identifiedby a counterbalance of balance response time and the time of relaxation of theviscous forces built up in the bridge at the end of each cycle at the point of closestapproach. This frequency of oscillation was set to 1.75π rad/s.
3.6. Uniaxial Elongation Flow
A range of elongation rates was employed with variations on the duration of the stepsizes. Again three step sizes were investigated: 0.50, 0.10 and 0.01 s. In practicesuccessful implementation of such a velocity profile depends on the force measure-ment apparatus being sensitive enough to read force variations due to very smalldisplacements at very low velocities and at small times, and rapid changes in ratesand consequently forces at the higher end of the time scale, this being an accelerat-ing flow. As a result, the optimum conditions at which resolution of applied forceand adequate response of the balance could be obtained were determined to be atime step on the motor of 0.5 s and a high enough elongation rate. Based on this,a velocity profile at an elongation rate of 3 s−1 and using a step-size of 0.5 s isapplied as depicted in Fig. 3.

284 P. Gopalkrishnan et al. / Advanced Powder Technology 19 (2008) 277–292
Figure 3. Uniaxial elongation velocity profile. Applied strain rate = 3 s−1.
4. Results and Discussion
4.1. Polydisperse Systems
As in previous work [8], all study runs are characterized with respect to a sin-gle reference run using a pair of 5-mm diameter glass spheres, interacting acrosslow-viscosity 1 Pa·s PDMS fluid. Even though the viscosity of the fluid is low, asufficiently large velocity of interaction of 1000 μm/s ensures significant viscouscontribution at small separations, as seen from Fig. 4. Here we plot the experimen-tally measured data points from the analytical balance alongside force modelingfrom the dimensional force (1) for the reference system. Table 1 lists the specificsof each of the combinations of sphere sizes used in this work. We investigate thefollowing effects.
4.1.1. Dissimilar Sphere Interactions: Effect of Particle Size VariationFigure 5(a–d) shows measured force tensiograms for four different sphere size com-binations (Table 1, runs 1–4), under dynamic conditions completely different fromthose employed in the reference run. Also superposed are the predictions from thenon-dimensional scaling results applied from (3). Excellent conformance betweenexperiment and modeling is observed, with errors below 5% in most cases. Thisproves the applicability of the Derjaguin approximation to adapt dissimilar sphereinteractions to the analytical viscous force modeling established earlier [8].
To contrast the effect of the resultant particle size (Rmean) in estimating the totalliquid bridge force, Fig. 6 compares the force tensiograms for the smallest (run 1)and largest (run 4) effective sphere sizes considered from Table 1, for the same inter-action dynamics. The capillary plateau is indicative of the capillary force regime [8],where the viscous forces have attenuated and only surface tension effects persist.As expected, the larger effective sphere size being capable of accommodating morefluid, the capillary plateau is also higher. The other significant disparity in the tworuns is the magnitude of the viscous contribution [from (1), Fvis ∼ R2]. Conse-

P. Gopalkrishnan et al. / Advanced Powder Technology 19 (2008) 277–292 285
Figure 4. Reference system used to set up the dimensionless force expression. The dotted line indi-cates capillary force baseline trend. Two different sets of measurements were matched with modelingto confirm accuracy of prediction. The rupture criterion (12) is achieved at a dimensionless separation(h/R) of 0.72.
(a)
(b)
Figure 5. Force versus separation curves. (a) Run 1 with smallest effective particle size. The viscouseffect at low separation is also smallest. The rupture criterion (12) achieved at dimensionless separa-tion of 0.74. (b) Run 2 with intermediate effective particle size. The rupture criterion achieved at adimensionless separation of 0.74. (c) Run 3 with high intermediate effective particle size. Rupture cri-terion achieved at a dimensionless separation of 0.68. (d) Run 4 with largest effective particle size. Themaximum viscous effect is seen at small separation. The rupture criterion achieved at a dimensionlessseparation of 0.72.

286 P. Gopalkrishnan et al. / Advanced Powder Technology 19 (2008) 277–292
(c)
(d)
Figure 5. (Continued.)
quently, force predictions in the viscous regime are much larger for run 4 thanrun 1. The predicted viscous force at an inter-sphere separation of 1 mm is 0.093 Nfor run 4 and 0.024 N for run 1.
In all study runs where the viscous effects are found to dominate, a dotted lineindicating the capillary force trend is superposed to emphasize the extent of viscouscontribution before the capillary plateau is reached. Both force regimes, viscousforce at small separations and capillary forces at larger separations in the capillaryplateau prior to bridge rupture, are very well predicted.
4.1.2. Effect of the Dynamics of InteractionThe effect of varying stress dynamics can be achieved by either varying the fluidviscosity and/or the relative velocity of interaction. The effect of viscosity variationis already accounted for in that a reference run using low-viscosity 1 Pa·s PDMS isused to predict corresponding interactions for a high-viscosity 60 Pa·s PDMS. Con-sequently, for the 60 Pa·s PDMS study system, any further changes in the dynamicsare introduced by imposing different velocities of interaction.

P. Gopalkrishnan et al. / Advanced Powder Technology 19 (2008) 277–292 287
Figure 6. Comparing runs 1 and 4, for the smallest and largest resultant sphere sizes, respectively. Notethat the capillary force plateau is higher for larger Rmean and viscous force effects more significantfor larger Rmean.
Figure 7(a,b) compares the measured total interactions for 60 Pa·s PDMS fluidfor the larger intermediate effective particle size combination (Rmean = 2.16 mm)at velocities of 50 (run 2) and 100 μm/s (run 5). Also plotted alongside experi-mental measurements are the predictions from the scaling equation (5). Excellentcorrelation is observed (error below 5%).
The interaction velocities in both cases are sufficient to generate adequate vis-cous effects at low separation as seen from the maximum of the calculated capillarynumber values in Table 1. Plotting the two runs together in Fig. 8 allows directcomparison of the effects of the dynamics of interaction. Since the effective parti-cle radius is maintained constant, the capillary plateaus corresponding to the staticsurface tension contributions are observed to overlap, as expected. However, thedynamic viscous component of the liquid bridge force shows the expected disparityon account of the linear dependence of Fvis on the relative velocity of interaction asseen from (2). This translates into increased viscous forces for run 5 at 100 μm/s,as opposed to run 2 at 50 μm/s. The extrapolated total liquid bridge interaction at asmall non-zero separation of 1 μm is 0.04 N for run 2 and 0.063 N for run 5.
4.1.3. Liquid-Bridge Rupture CriterionThe rupture distance criterion set up by Lian et al. [12] for liquid bridges betweenspheres in the limit of good wetting, has also been verified to good accuracy:
hrup = (1+ 0.5θ)3√
VLB (12)
where hrup is the inter-sphere separation at rupture, VLB is the liquid volume inliquid bridge and θ is the wetting angle of the liquid on the sphere.
Comparing the last predicted data point from the scaling procedure in (5) withthe point at which a complete plateau in force measurement is achieved indicatingbridge rupture, we see the good conformance shown with Lian’s bridge rupturecriterion.

288 P. Gopalkrishnan et al. / Advanced Powder Technology 19 (2008) 277–292
(a)
(b)
Figure 7. Force versus separation curves. (a) Run 5 with larger intermediate resultant sphere size and alower velocity of 50 μm/s. The rupture criterion (12) is achieved at a dimensionless separation of 0.74.(b) Run 6 with larger intermediate resultant bead size and higher velocity of 100 μm/s. The rupturecriterion is achieved at a dimensionless separation of 0.74.
Figure 8. Force versus separation curves for runs 5 and 6 with larger intermediate resultant spheresize. The effect of varied dynamics is superposed. Note the disparity in the viscous regime due tolinear dependence on interaction velocity and that the capillary regimes overlap for both runs due toidentical Rmean.

P. Gopalkrishnan et al. / Advanced Powder Technology 19 (2008) 277–292 289
4.2. Other Flow Fields
4.2.1. HysteresisFigure 9 maps the force variation when the inter-sphere separation is cycled be-tween an upper and lower limit for the 1 Pa·s PDMS fluid, a primarily capillaryregime fluid (CaLB = 0.006–1.2). The force plateaus at the ends of the motion pathsindicate the 5-s interval imposed prior to direction reversal. Based on the chosenconditions, as expected, the liquid bridge shows excellent force reversal withoutany significant difference between the force increase during approach and the forcereduction during separation as is shown in Fig. 10.
Figure 11, based on the higher viscosity fluid with CaLB = 0.4–76, i.e. primar-ily transition regime conditions, shows a significant hysteresis effect developing atsmall separations due to the viscous component becoming comparable in magni-tude to the capillary component of force within the liquid bridge at the imposedconditions. Consequently, at small separations (below 0.4 mm) the measured forcesduring approach are greater than those during separation. This is so on account ofthe orientations of the individual components of the force. During approach, the dy-
Figure 9. Force cycles during separation and approach for a low-viscosity 1 Pa·s PDMS liquid bridge.
Figure 10. Measure of hysteresis effects between approach and separation in liquid bridges usinglow-viscosity 1 Pa·s PDMS fluid. Hysteresis effects are insignificant at all separations.

290 P. Gopalkrishnan et al. / Advanced Powder Technology 19 (2008) 277–292
Figure 11. Measure of hysteresis effects between approach and separation in liquid bridges usinghigher-viscosity 60 Pa·s fluid. Hysteresis effects become significant at smaller separations when Fvisbecomes significant.
namic viscous component acting on the lower model sphere acts in tandem with theweight of the lower prop, thereby exerting a greater force on the balance than dur-ing separation, where Fvis opposes gravity. The capillary force Fcap always opposesgravity.
None of the conditions that our device is capable of reaching, such as using thehigh-viscosity 60 Pa·s PDMS fluid and higher interaction velocities, can put usinto a purely viscous regime of force contributions for the entire range of separa-tions. Hence, investigations at the higher end of the dynamics spectrum could not beimplemented. However, it is expected that in the purely viscous regime, the forcesobserved in approach and separation will be essentially identical in magnitude sincethe capillary contribution to the total interaction force will be negligibly small.
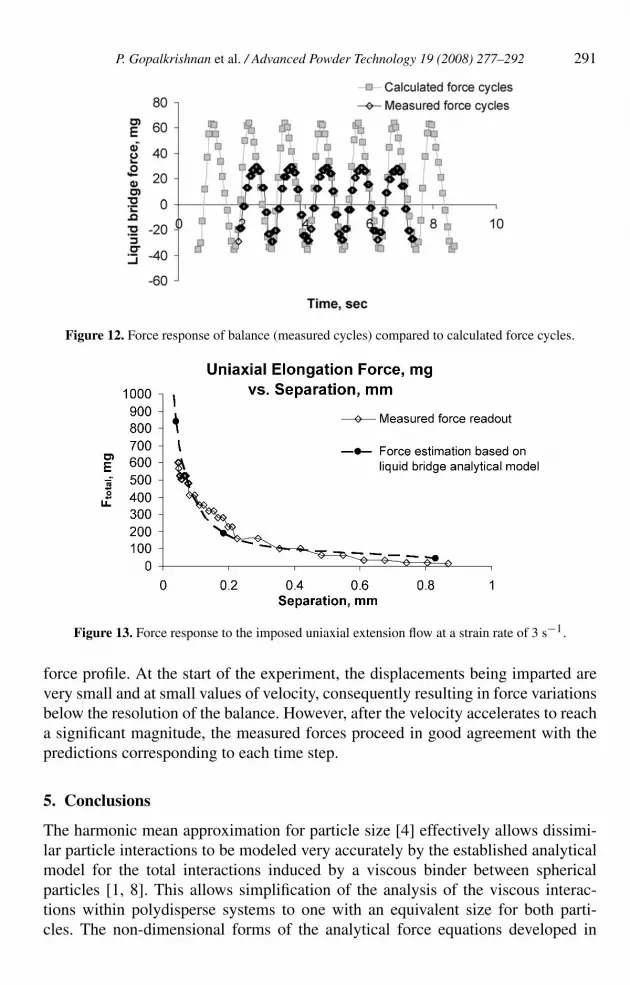
4.2.2. Oscillatory Shear FlowFigure 12 shows the force response of the 60 Pa·s PDMS being cycled at a fre-quency of 1.75π rad/s. The imposed period of oscillation is well traced by experi-mental variations in the force readout. As mentioned earlier, the minimum responsetime of the balance has been determined to be 0.1 s. Since the imposed velocitiesact over a time step of 0.07 s, the portion of the crests and troughs in the sine wavethat correspond to the region of maximum rate of change are cut off. With fasterfrequency of response, excellent correlation would be obtained both in the periodand amplitude of oscillation.
4.2.3. Uniaxial Elongation FlowFigure 13 shows the correlation obtained between experimentally measured valuesfrom the balance and the values predicted from the imposed velocity steps. A goodcorrelation is obtained in this case. Since the larger time steps used result in fewervelocity steps being employed, this results in reduced resolution on the imposed
P. Gopalkrishnan et al. / Advanced Powder Technology 19 (2008) 277–292 291
Figure 12. Force response of balance (measured cycles) compared to calculated force cycles.
Figure 13. Force response to the imposed uniaxial extension flow at a strain rate of 3 s−1.
force profile. At the start of the experiment, the displacements being imparted arevery small and at small values of velocity, consequently resulting in force variationsbelow the resolution of the balance. However, after the velocity accelerates to reacha significant magnitude, the measured forces proceed in good agreement with thepredictions corresponding to each time step.
5. Conclusions
The harmonic mean approximation for particle size [4] effectively allows dissimi-lar particle interactions to be modeled very accurately by the established analyticalmodel for the total interactions induced by a viscous binder between sphericalparticles [1, 8]. This allows simplification of the analysis of the viscous interac-tions within polydisperse systems to one with an equivalent size for both parti-cles. The non-dimensional forms of the analytical force equations developed in

292 P. Gopalkrishnan et al. / Advanced Powder Technology 19 (2008) 277–292
previous work [1] have been tested for scalability for these dissimilar particleinteractions. This allows the previous model to apply to realistic situations involv-ing wet processing scenarios, wherein the particle size distributions are generallynot monodisperse. By suitably combining the distribution of wet and dry contactswithin a processing environment, quantitative and qualitative characterization ofthe mixing mechanisms can be facilitated. The advantage of being able to extendexperimental and modeling approaches developed for characterizing simple shearflow fields to time-dependent flows also aids practical utility from a processingviewpoint.
Acknowledgments
This work was supported by the ACS Petroleum Research Fund under grant 35561-AC9.
References
1. P. Gopalkrishnan, I. Manas-Zloczower and D. L. Feke, Effect of morphology and extent of infil-tration on the cohesivity and dispersion mechanism of particle agglomerates, Chem. Eng. Sci. 62,3740–3747 (2007).
2. J. P. K. Seville, U. Tüzün and R. Clift, Processing of Particulate Solids. Kluwer, Dordrecht (1997).3. A. Cameron, The Principles of Lubrication. Longmans, London (1966).4. C. D. Willett, M. J. Adams, S. A. Johnson and J. P. K. Seville, Capillary forces between two
spherical bodies, Langmuir 16, 9396–9405 (2000).5. W. B. Haines, Studies of the physical properties of soils. II. A note on the cohesion developed by
capillary forces in an ideal soil, J. Agric. Sci. 15, 529–535 (1925).6. R. A. Fisher, On the capillary forces in an ideal soil, J. Agric. Sci. 16, 491–505 (1926).7. B. J. Ennis, G. T. Tardos and R. A. Pfeffer, A microlevel-based characterization of granulation
phenomena, Powder Technol. 65, 257–272 (1991).8. P. Gopalkrishnan, Inter-particle Liquid Bridges a Building Block to Model Complex Mixing Phe-
nomena, Ph.D. Thesis, Case Western Reserve University (2004).9. S. M. Iveson, J. D. Litster, K. Hapgood and B. J. Ennis, Nucleation, growth and breakage phe-
nomena in agitated wet granulation processes: a review, Powder Technol. 117, 3–39 (2001).10. R. Kroger and H. Rath, Velocity and elongation rate distributions in stretched polymeric and New-
tonian liquid bridges, J. Non-Newtonian Fluid Mech. 57, 137–153 (1995).11. S. J. R. Simons, J. P. K. Seville and M. J. Adams, An analysis of the rupture energy of pendular
liquid bridges, Chem. Eng. Sci. 49, 2331–2339 (1994).12. G. Lian, C. Thornton and M. J. Adams, A theoretical study of the liquid bridge forces between
two rigid spherical bodies, J. Colloid Interf. Sci. 161, 138–147 (1993).