modeling solar energy potential in turkey
TRANSCRIPT
_________________________________________________________________________________ BALWOIS 2010 – Ohrid, Republic of Macedonia – 25, 29 May 2010 1 / 10
Modeling Solar Energy Potential In Turkey
Serhat SENSOY, Yusuf ULUPINAR, Mesut DEMIRCAN, Ilker ALAN, Zuhal AKYUREK,
Pinar A. BOSTAN
Turkish State Meteorological Service, Ankara, Turkey
Abstract
Since the Industrialization revolution, atmospheric CO2 concentration has been increased from 280 to 400 ppm due to mainly caused fossil fuel uses in the energy sector. However, small portion of the incoming solar energy into the world is sufficient to meet human needs. For this reason nowadays to use renewable energy sources such as solar energy is very important to protect atmosphere.
Geographic variables are measured at certain points, and prediction map for the entire area is been obtained by some spatial interpolation methods. Spatial distribution of geographic data can be obtained only from this data and also prediction map can be obtained by using secondary variables which have spatial relationship with the measured values (Bostan, P.A., et al, 2007)
Geographically Weighted Regression (GWR) and Co-kriging methods were applied in the modelling of radiation. GWR is the multi-faceted approach to the analysis of spatial data. GWR opens a window through the data set to calculate local r2 (Laffan, 1999). Co-kriging is an extension of ordinary kriging method which takes into account the spatial cross-validation between two or more data. In the modeling of spatial interpolation of radiation data, aspect, latitude, relative humidity and cloudiness were used as secondary variable. Best results were obtained with the cloudiness and relative humidity parameters. Simple linear models generally are been solved by ordinary least square method is given below formula: P= C1+C2+e where; P= Radiation (KWh/m²) C1= solar radiation parameters change with the humidity C2= solar radiation parameters change with the cloud cover e= error term Co-kriging and GWR model results were compared by the lowest RMSE and higher r² values obtained in the model. Because of the RMSE is smaller and r2 is grater than the Co-kriging result, GWR tool is been selected for modeling solar energy potential in Turkey. According to model result, southern parts of Izmir-Igdir line, have over 1500 KWh/m²/Year radiation potential and is considered as optimum area for the photovoltaic installation. Keywords: GWR, Co-kriging, Modeling, Radiation, Photovoltaic
_________________________________________________________________________________ BALWOIS 2010 – Ohrid, Republic of Macedonia – 25, 29 May 2010 2 / 10
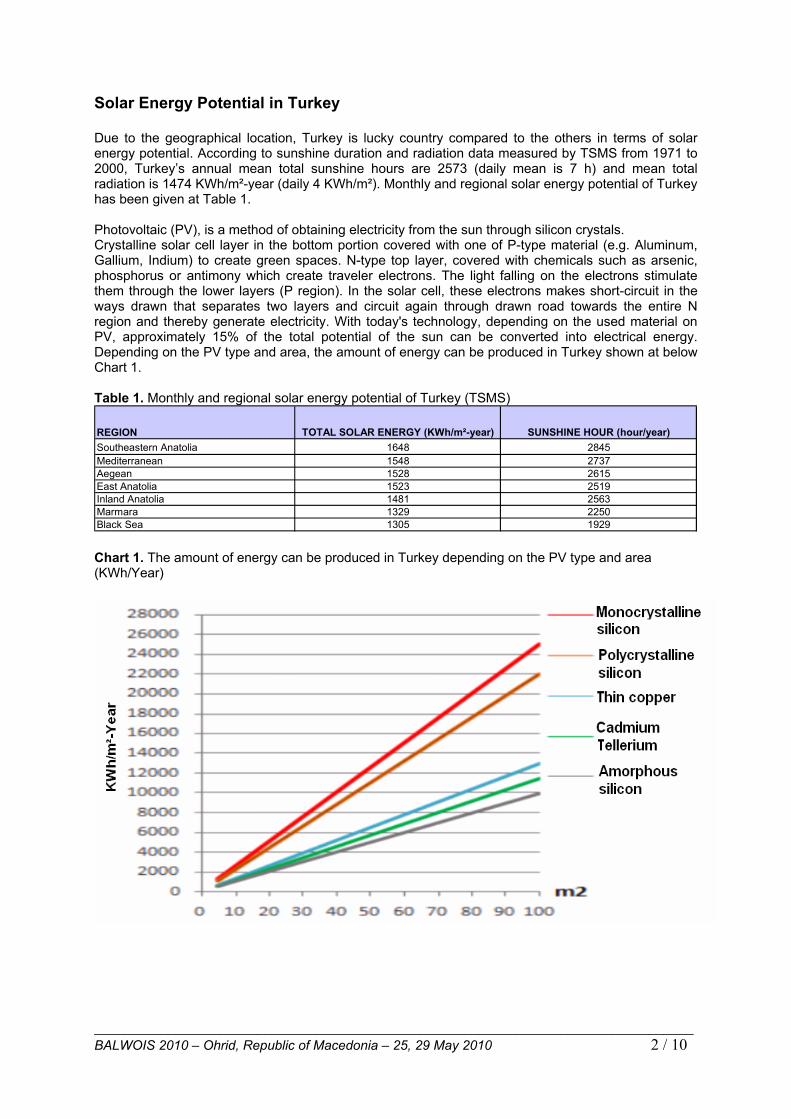
Solar Energy Potential in Turkey Due to the geographical location, Turkey is lucky country compared to the others in terms of solar energy potential. According to sunshine duration and radiation data measured by TSMS from 1971 to 2000, Turkey’s annual mean total sunshine hours are 2573 (daily mean is 7 h) and mean total radiation is 1474 KWh/m²-year (daily 4 KWh/m²). Monthly and regional solar energy potential of Turkey has been given at Table 1. Photovoltaic (PV), is a method of obtaining electricity from the sun through silicon crystals. Crystalline solar cell layer in the bottom portion covered with one of P-type material (e.g. Aluminum, Gallium, Indium) to create green spaces. N-type top layer, covered with chemicals such as arsenic, phosphorus or antimony which create traveler electrons. The light falling on the electrons stimulate them through the lower layers (P region). In the solar cell, these electrons makes short-circuit in the ways drawn that separates two layers and circuit again through drawn road towards the entire N region and thereby generate electricity. With today's technology, depending on the used material on PV, approximately 15% of the total potential of the sun can be converted into electrical energy. Depending on the PV type and area, the amount of energy can be produced in Turkey shown at below Chart 1. Table 1. Monthly and regional solar energy potential of Turkey (TSMS)
REGION TOTAL SOLAR ENERGY (KWh/m²-year) SUNSHINE HOUR (hour/year)Southeastern Anatolia 1648 2845Mediterranean 1548 2737Aegean 1528 2615East Anatolia 1523 2519Inland Anatolia 1481 2563Marmara 1329 2250Black Sea 1305 1929 Chart 1. The amount of energy can be produced in Turkey depending on the PV type and area (KWh/Year)
_________________________________________________________________________________ BALWOIS 2010 – Ohrid, Republic of Macedonia – 25, 29 May 2010 3 / 10
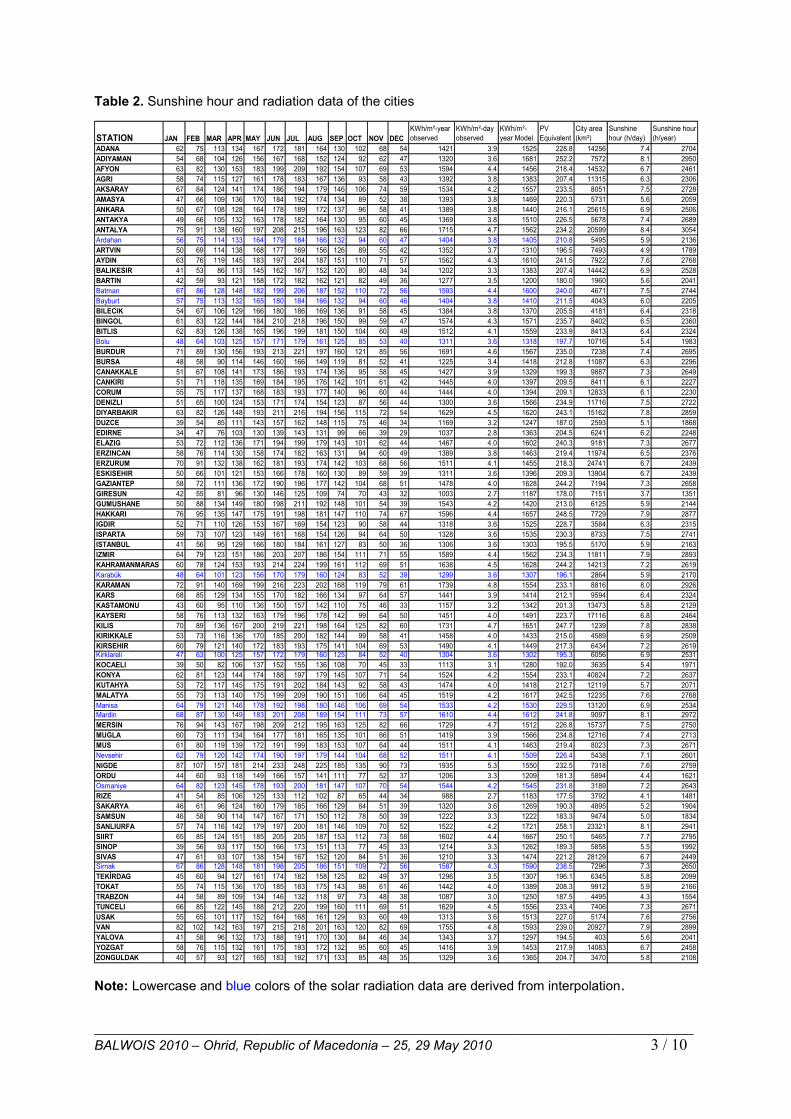
Table 2. Sunshine hour and radiation data of the cities STATION JAN FEB MAR APR MAY JUN JUL AUG SEP OCT NOV DEC
KWh/m²-year observed
KWh/m²-day observed
KWh/m²-year Model
PV Equivalent
City area (km²)
Sunshine hour (h/day)
Sunshine hour (h/year)
ADANA 62 75 113 134 167 172 181 164 130 102 68 54 1421 3.9 1525 228.8 14256 7.4 2704ADIYAMAN 54 68 104 126 156 167 168 152 124 92 62 47 1320 3.6 1681 252.2 7572 8.1 2950AFYON 63 82 130 153 183 199 209 192 154 107 69 53 1594 4.4 1456 218.4 14532 6.7 2461AGRI 58 74 115 127 161 178 183 167 136 93 58 43 1392 3.8 1383 207.4 11315 6.3 2306AKSARAY 67 84 124 141 174 186 194 179 146 106 74 59 1534 4.2 1557 233.5 8051 7.5 2728AMASYA 47 66 109 136 170 184 192 174 134 89 52 38 1393 3.8 1469 220.3 5731 5.6 2059ANKARA 50 67 108 128 164 178 189 172 137 96 58 41 1389 3.8 1440 216.1 25615 6.9 2506ANTAKYA 49 66 105 132 163 178 182 164 130 95 60 45 1369 3.8 1510 226.5 5678 7.4 2689ANTALYA 75 91 138 160 197 208 215 196 163 123 82 66 1715 4.7 1562 234.2 20599 8.4 3054Ardahan 56 75 114 133 164 179 184 166 132 94 60 47 1404 3.8 1405 210.8 5495 5.9 2136ARTVIN 50 69 114 138 168 177 169 156 126 89 55 42 1352 3.7 1310 196.5 7493 4.9 1789AYDIN 63 76 119 145 183 197 204 187 151 110 71 57 1562 4.3 1610 241.5 7922 7.6 2768BALIKESIR 41 53 86 113 145 162 167 152 120 80 48 34 1202 3.3 1383 207.4 14442 6.9 2528BARTIN 42 59 93 121 158 172 182 162 121 82 49 36 1277 3.5 1200 180.0 1960 5.6 2041Batman 67 86 128 148 182 199 206 187 152 110 72 56 1593 4.4 1600 240.0 4671 7.5 2744Bayburt 57 75 113 132 165 180 184 166 132 94 60 46 1404 3.8 1410 211.5 4043 6.0 2205BILECIK 54 67 106 129 166 180 186 169 136 91 58 45 1384 3.8 1370 205.5 4181 6.4 2318BINGOL 61 83 122 144 184 210 218 196 150 99 59 47 1574 4.3 1571 235.7 8402 6.5 2360BITLIS 62 83 126 138 165 196 199 181 150 104 60 49 1512 4.1 1559 233.9 8413 6.4 2324Bolu 48 64 103 125 157 171 179 161 125 85 53 40 1311 3.6 1318 197.7 10716 5.4 1983BURDUR 71 89 130 156 193 213 221 197 160 121 85 56 1691 4.6 1567 235.0 7238 7.4 2695BURSA 48 58 90 114 146 160 166 149 119 81 52 41 1225 3.4 1418 212.8 11087 6.3 2296CANAKKALE 51 67 108 141 173 186 193 174 136 95 58 45 1427 3.9 1329 199.3 9887 7.3 2649CANKIRI 51 71 118 135 169 184 195 176 142 101 61 42 1445 4.0 1397 209.5 8411 6.1 2227CORUM 55 75 117 137 168 183 193 177 140 96 60 44 1444 4.0 1394 209.1 12833 6.1 2230DENIZLI 51 65 100 124 153 171 174 154 123 87 56 44 1300 3.6 1566 234.9 11716 7.5 2722DIYARBAKIR 63 82 126 148 193 211 216 194 156 115 72 54 1629 4.5 1620 243.1 15162 7.8 2859DUZCE 39 54 85 111 143 157 162 148 115 75 46 34 1169 3.2 1247 187.0 2593 5.1 1868EDIRNE 34 47 76 103 130 139 143 131 99 66 39 29 1037 2.8 1363 204.5 6241 6.2 2248ELAZIG 53 72 112 136 171 194 199 179 143 101 62 44 1467 4.0 1602 240.3 9181 7.3 2677ERZINCAN 58 76 114 130 158 174 182 163 131 94 60 49 1389 3.8 1463 219.4 11974 6.5 2376ERZURUM 70 91 132 138 162 181 193 174 142 103 68 56 1511 4.1 1455 218.3 24741 6.7 2439ESKISEHIR 50 66 101 121 153 166 178 160 130 89 59 39 1311 3.6 1396 209.3 13904 6.7 2439GAZIANTEP 58 72 111 136 172 190 196 177 142 104 68 51 1478 4.0 1628 244.2 7194 7.3 2658GIRESUN 42 55 81 96 130 146 125 109 74 70 43 32 1003 2.7 1187 178.0 7151 3.7 1351GUMUSHANE 50 88 134 149 180 198 211 192 148 101 54 39 1543 4.2 1420 213.0 6125 5.9 2144HAKKARI 76 95 135 147 175 191 198 181 147 110 74 67 1596 4.4 1657 248.5 7729 7.9 2877IGDIR 52 71 110 126 153 167 169 154 123 90 58 44 1318 3.6 1525 228.7 3584 6.3 2315ISPARTA 59 73 107 123 149 161 168 154 126 94 64 50 1328 3.6 1535 230.3 8733 7.5 2741ISTANBUL 41 56 95 129 166 180 184 161 127 83 50 36 1306 3.6 1303 195.5 5170 5.9 2163IZMIR 64 79 123 151 186 203 207 186 154 111 71 55 1589 4.4 1562 234.3 11811 7.9 2893KAHRAMANMARAS 60 78 124 153 193 214 224 199 161 112 69 51 1638 4.5 1628 244.2 14213 7.2 2619Karabük 48 64 101 123 156 170 179 160 124 83 52 39 1299 3.6 1307 196.1 2864 5.9 2170KARAMAN 72 91 140 169 199 216 223 202 168 119 79 61 1739 4.8 1554 233.1 8816 8.0 2926KARS 68 85 129 134 155 170 182 166 134 97 64 57 1441 3.9 1414 212.1 9594 6.4 2324KASTAMONU 43 60 95 110 136 150 157 142 110 75 46 33 1157 3.2 1342 201.3 13473 5.8 2129KAYSERI 58 76 113 132 163 179 196 178 142 99 64 50 1451 4.0 1491 223.7 17116 6.8 2464KILIS 70 89 136 167 200 219 221 198 164 125 82 60 1731 4.7 1651 247.7 1239 7.8 2838KIRIKKALE 53 73 116 136 170 185 200 182 144 99 58 41 1458 4.0 1433 215.0 4589 6.9 2509KIRSEHIR 60 79 121 140 172 183 193 175 141 104 69 53 1490 4.1 1449 217.3 6434 7.2 2619Kirklareli 47 63 100 125 157 172 179 160 125 84 52 40 1304 3.6 1302 195.3 6056 6.9 2531KOCAELI 39 50 82 106 137 152 155 136 108 70 45 33 1113 3.1 1280 192.0 3635 5.4 1971KONYA 62 81 123 144 174 188 197 179 145 107 71 54 1524 4.2 1554 233.1 40824 7.2 2637KUTAHYA 53 72 117 145 175 191 202 184 143 92 58 43 1474 4.0 1418 212.7 12119 5.7 2071MALATYA 55 73 113 140 175 199 209 190 151 106 64 45 1519 4.2 1617 242.5 12235 7.6 2768Manisa 64 79 121 146 178 192 198 180 146 106 69 54 1533 4.2 1530 229.5 13120 6.9 2534Mardin 68 87 130 149 183 201 208 189 154 111 73 57 1610 4.4 1612 241.8 9097 8.1 2972MERSIN 76 94 143 167 198 209 212 195 163 125 82 66 1729 4.7 1512 226.8 15737 7.5 2750MUGLA 60 73 111 134 164 177 181 165 135 101 66 51 1419 3.9 1566 234.8 12716 7.4 2713MUS 61 80 119 139 172 191 199 183 153 107 64 44 1511 4.1 1463 219.4 8023 7.3 2671Nevsehir 62 79 120 142 174 190 197 179 144 104 68 52 1511 4.1 1509 226.4 5438 7.1 2601NIGDE 87 107 157 181 214 233 248 225 185 135 90 73 1935 5.3 1550 232.5 7318 7.6 2759ORDU 44 60 93 118 149 166 157 141 111 77 52 37 1206 3.3 1209 181.3 5894 4.4 1621Osmaniye 64 82 123 145 178 193 200 181 147 107 70 54 1544 4.2 1545 231.8 3189 7.2 2643RIZE 41 54 85 106 125 133 112 102 87 65 44 34 988 2.7 1183 177.5 3792 4.1 1481SAKARYA 46 61 96 124 160 179 185 166 129 84 51 39 1320 3.6 1269 190.3 4895 5.2 1904SAMSUN 46 58 90 114 147 167 171 150 112 78 50 39 1222 3.3 1222 183.3 9474 5.0 1834SANLIURFA 57 74 116 142 179 197 200 181 146 109 70 52 1522 4.2 1721 258.1 23321 8.1 2941SIIRT 65 85 124 151 185 205 205 187 153 112 73 58 1602 4.4 1667 250.1 5465 7.7 2795SINOP 39 56 93 117 150 166 173 151 113 77 45 33 1214 3.3 1262 189.3 5858 5.5 1992SIVAS 47 61 93 107 138 154 167 152 120 84 51 36 1210 3.3 1474 221.2 28129 6.7 2449Sirnak 67 86 128 148 181 198 205 186 151 109 72 56 1587 4.3 1590 238.5 7296 7.3 2650TEKİRDAG 45 60 94 127 161 174 182 158 125 82 49 37 1296 3.5 1307 196.1 6345 5.8 2099TOKAT 55 74 115 136 170 185 183 175 143 98 61 46 1442 4.0 1389 208.3 9912 5.9 2166TRABZON 44 58 89 109 134 146 132 118 97 73 48 38 1087 3.0 1250 187.5 4495 4.3 1554TUNCELI 66 85 122 145 188 212 220 199 160 111 69 51 1629 4.5 1556 233.4 7406 7.3 2671USAK 55 65 101 117 152 164 168 161 129 93 60 49 1313 3.6 1513 227.0 5174 7.6 2756VAN 82 102 142 163 197 215 218 201 163 120 82 69 1755 4.8 1593 239.0 20927 7.9 2899YALOVA 41 58 96 132 173 188 191 170 130 84 46 34 1343 3.7 1297 194.5 403 5.6 2041YOZGAT 58 76 115 132 161 175 193 172 132 95 60 45 1416 3.9 1453 217.9 14083 6.7 2458ZONGULDAK 40 57 93 127 165 183 192 171 133 85 48 35 1329 3.6 1365 204.7 3470 5.8 2108 Note: Lowercase and blue colors of the solar radiation data are derived from interpolation.
_________________________________________________________________________________ BALWOIS 2010 – Ohrid, Republic of Macedonia – 25, 29 May 2010 4 / 10
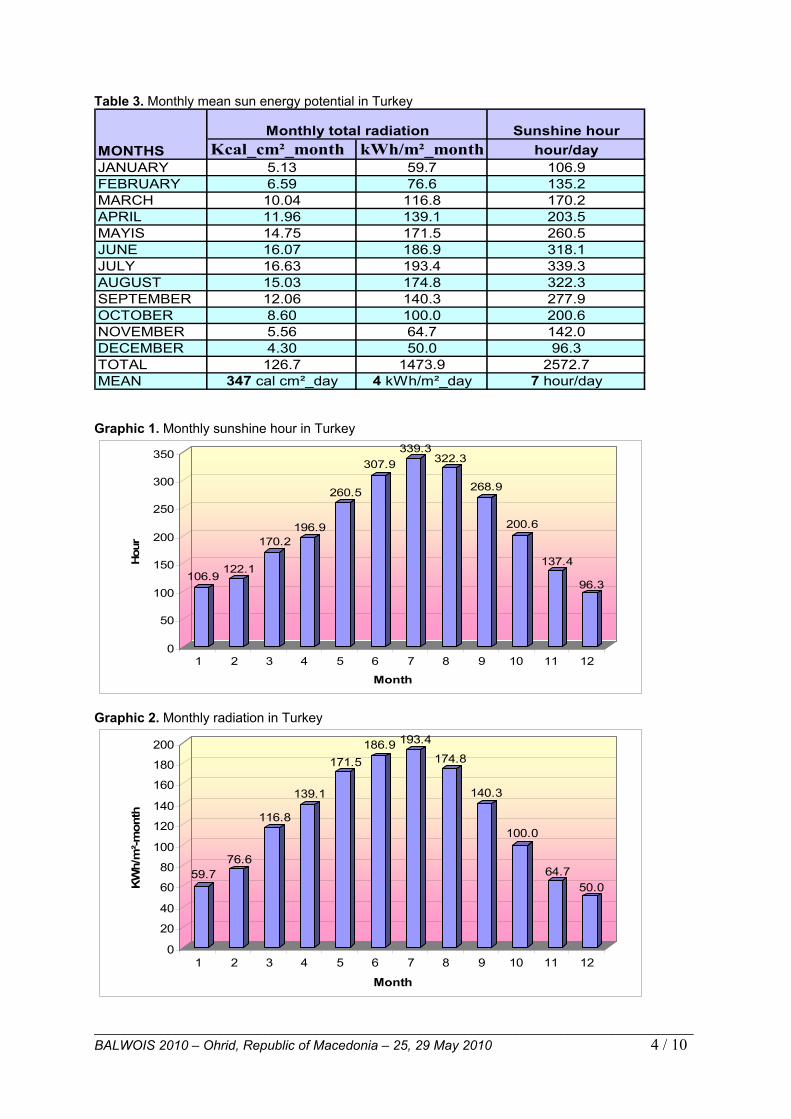
Table 3. Monthly mean sun energy potential in Turkey
Sunshine hourKcal_cm²_month kWh/m²_month hour/day
JANUARY 5.13 59.7 106.9FEBRUARY 6.59 76.6 135.2MARCH 10.04 116.8 170.2APRIL 11.96 139.1 203.5MAYIS 14.75 171.5 260.5JUNE 16.07 186.9 318.1JULY 16.63 193.4 339.3AUGUST 15.03 174.8 322.3SEPTEMBER 12.06 140.3 277.9OCTOBER 8.60 100.0 200.6NOVEMBER 5.56 64.7 142.0DECEMBER 4.30 50.0 96.3TOTAL 126.7 1473.9 2572.7MEAN 347 cal cm²_day 4 kWh/m²_day 7 hour/day
Monthly total radiationMONTHS
Graphic 1. Monthly sunshine hour in Turkey
106.9122.1
170.2196.9
260.5
307.9339.3
322.3
268.9
200.6
137.4
96.3
0
50
100
150
200
250
300
350
Hou
r
1 2 3 4 5 6 7 8 9 10 11 12
Month
Graphic 2. Monthly radiation in Turkey
59.776.6
116.8
139.1
171.5186.9 193.4
174.8
140.3
100.0
64.750.0
0
20
40
60
80
100
120
140
160
180
200
KW
h/m
²-mon
th
1 2 3 4 5 6 7 8 9 10 11 12
Month
_________________________________________________________________________________ BALWOIS 2010 – Ohrid, Republic of Macedonia – 25, 29 May 2010 5 / 10
Methods used in the solar energy atlas Data and calculations: In this study 157 weather stations radiation data were used which measured by the Turkish State Meteorological Service in the 1971-2000 climatic periods. Unit conversions: (via www.birimcevir.com ) 1Kcal = 1000 cal 1KWh/m² = 11.63 x Kcal/cm² PV equivalent = KWh/m2 x 0.15 1MW/m² = 1000000 KWh/m² 1TEP = 85.9845 x MW/m² Geographic variables are measured at certain points, and prediction map for the entire area is been obtained by some spatial interpolation methods. Spatial distribution of geographic data can be obtained only from this data and also prediction map can be obtained by using secondary variables which have spatial relationship with the measured values (Bostan, P.A., et al, 2007). The maps were prepared in Lambert Conformal Conic Projection and ED50 Datum. Geographically Weighted Regression (GWR) and Co-kriging methods were applied in the modelling of radiation. GWR is the multi-faceted approach to the analysis of spatial data. GWR opens a window through the data set to calculate local r2 (Laffan, 1999). Co-kriging is an extension of ordinary kriging method which takes into account the spatial cross-validation between two or more data. In the modelling of spatial interpolation of radiation data, aspect, latitude, relative humidity and cloudiness were used as secondary variable. Best results were obtained with the cloudiness and relative humidity parameters. Simple linear models generally are been solved by ordinary least square method is given below formula: P= C1+C2+e where; P= Radiation (KWh/m²) C1= solar radiation parameters change with the humidity C2= solar radiation parameters change with the cloud cover e= error term. Co-kriging and GWR model results were compared by the lowest RMSE and higher r² values obtained in the model. Because of the RMSE is smaller and r2 is grater than the Co-kriging result, GWR tool is been selected for modeling solar energy potential in Turkey. According to model result, southern parts of Izmir-Igdir line, have over 1500 KWh/m²/Year radiation potential and is considered as optimum area for the photovoltaic installation.
_________________________________________________________________________________ BALWOIS 2010 – Ohrid, Republic of Macedonia – 25, 29 May 2010 6 / 10
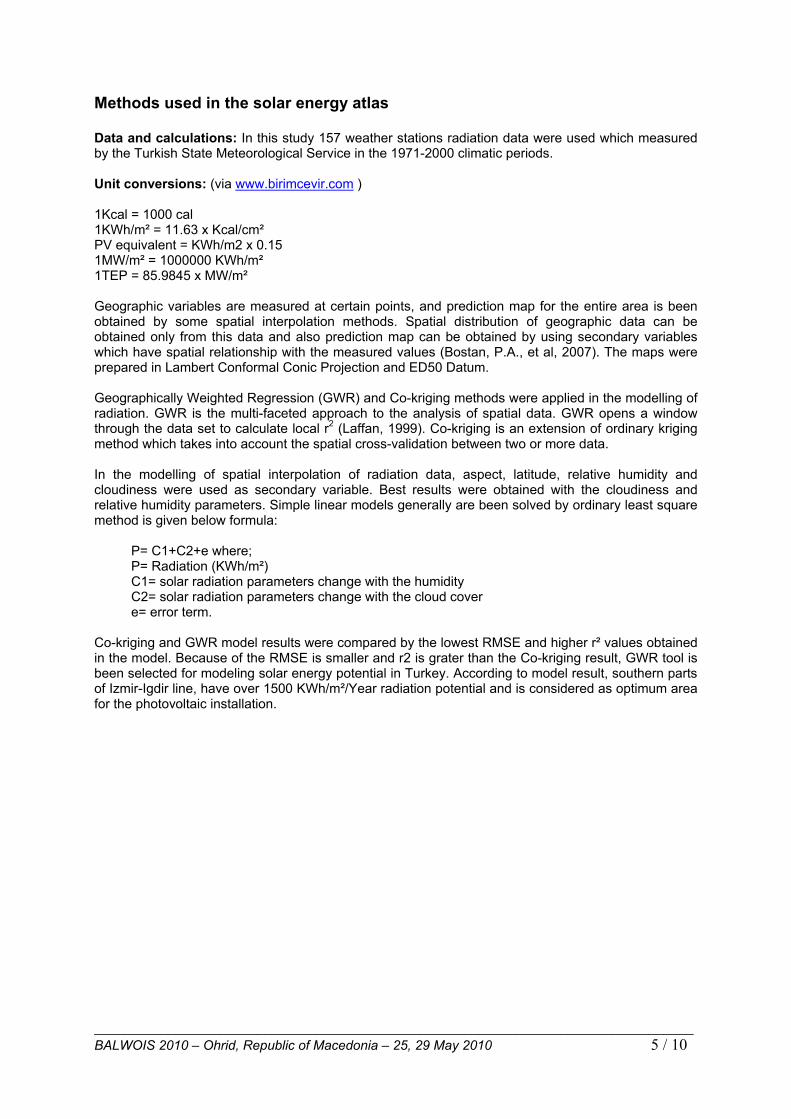
Secondary variables were used in GWR Model
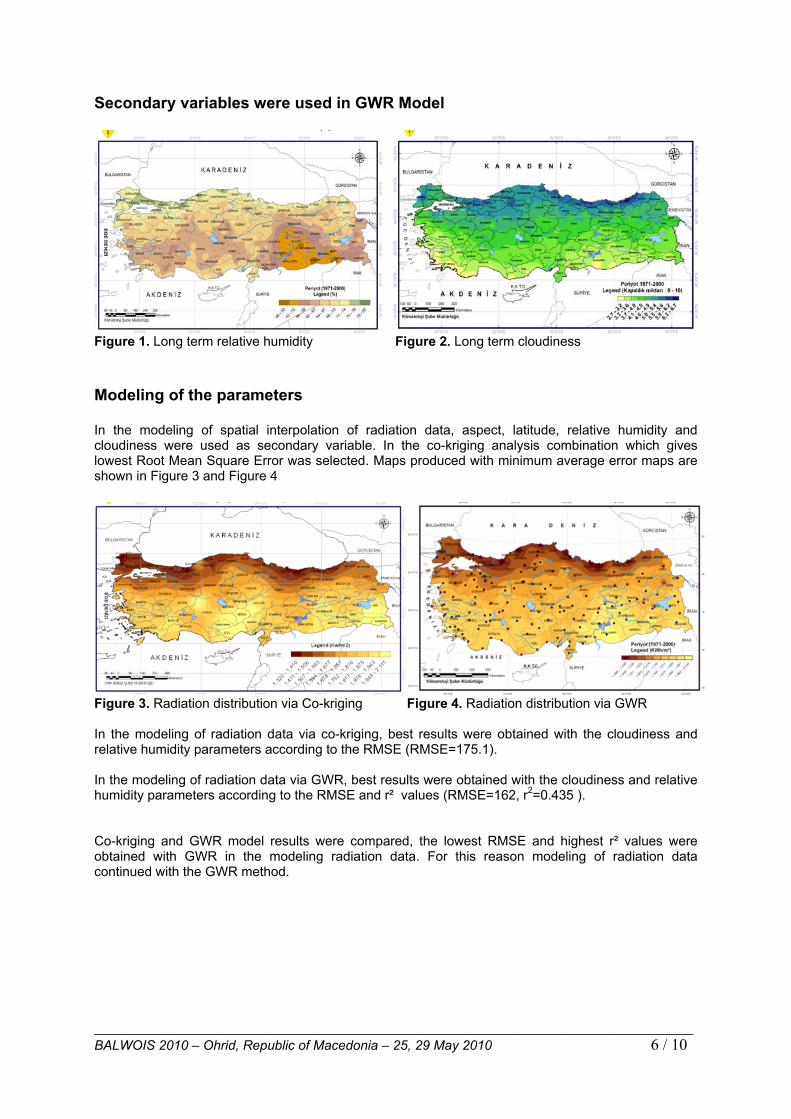
Figure 1. Long term relative humidity Figure 2. Long term cloudiness Modeling of the parameters In the modeling of spatial interpolation of radiation data, aspect, latitude, relative humidity and cloudiness were used as secondary variable. In the co-kriging analysis combination which gives lowest Root Mean Square Error was selected. Maps produced with minimum average error maps are shown in Figure 3 and Figure 4
Figure 3. Radiation distribution via Co-kriging Figure 4. Radiation distribution via GWR In the modeling of radiation data via co-kriging, best results were obtained with the cloudiness and relative humidity parameters according to the RMSE (RMSE=175.1). In the modeling of radiation data via GWR, best results were obtained with the cloudiness and relative humidity parameters according to the RMSE and r² values (RMSE=162, r2=0.435 ). Co-kriging and GWR model results were compared, the lowest RMSE and highest r² values were obtained with GWR in the modeling radiation data. For this reason modeling of radiation data continued with the GWR method.
_________________________________________________________________________________ BALWOIS 2010 – Ohrid, Republic of Macedonia – 25, 29 May 2010 7 / 10
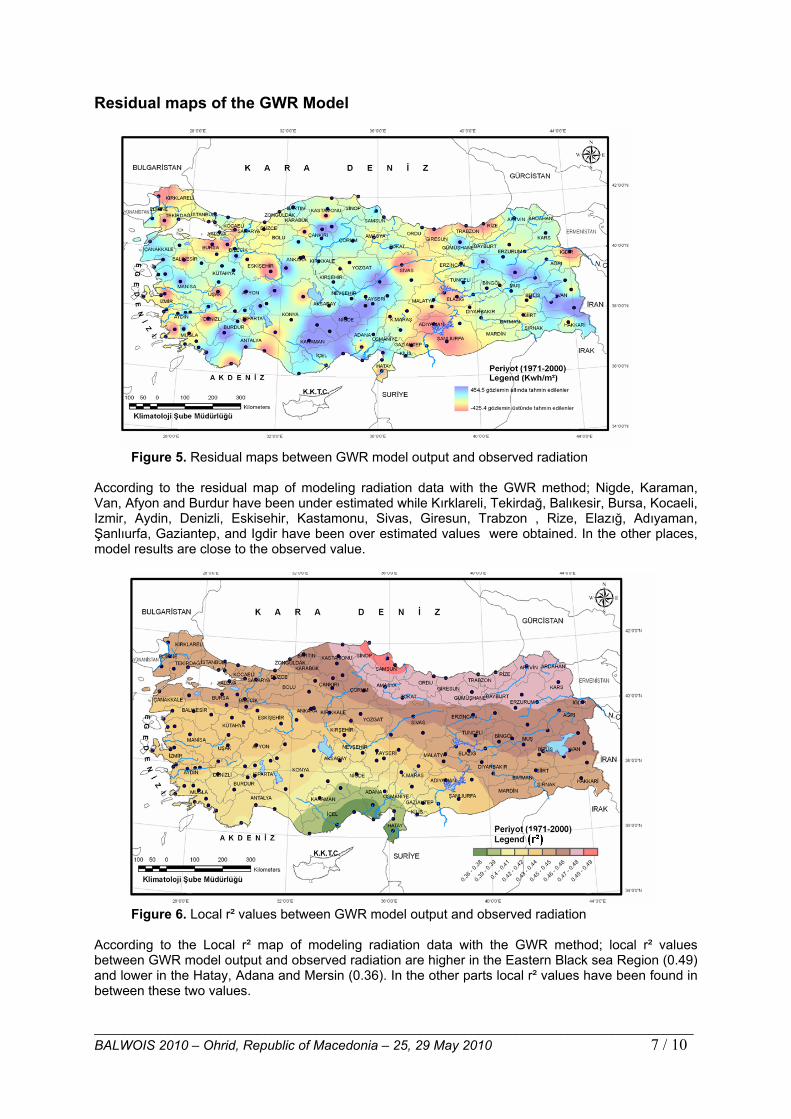
Residual maps of the GWR Model
Figure 5. Residual maps between GWR model output and observed radiation According to the residual map of modeling radiation data with the GWR method; Nigde, Karaman, Van, Afyon and Burdur have been under estimated while Kırklareli, Tekirdağ, Balıkesir, Bursa, Kocaeli, Izmir, Aydin, Denizli, Eskisehir, Kastamonu, Sivas, Giresun, Trabzon , Rize, Elazığ, Adıyaman, Şanlıurfa, Gaziantep, and Igdir have been over estimated values were obtained. In the other places, model results are close to the observed value.
Figure 6. Local r² values between GWR model output and observed radiation According to the Local r² map of modeling radiation data with the GWR method; local r² values between GWR model output and observed radiation are higher in the Eastern Black sea Region (0.49) and lower in the Hatay, Adana and Mersin (0.36). In the other parts local r² values have been found in between these two values.
_________________________________________________________________________________ BALWOIS 2010 – Ohrid, Republic of Macedonia – 25, 29 May 2010 8 / 10
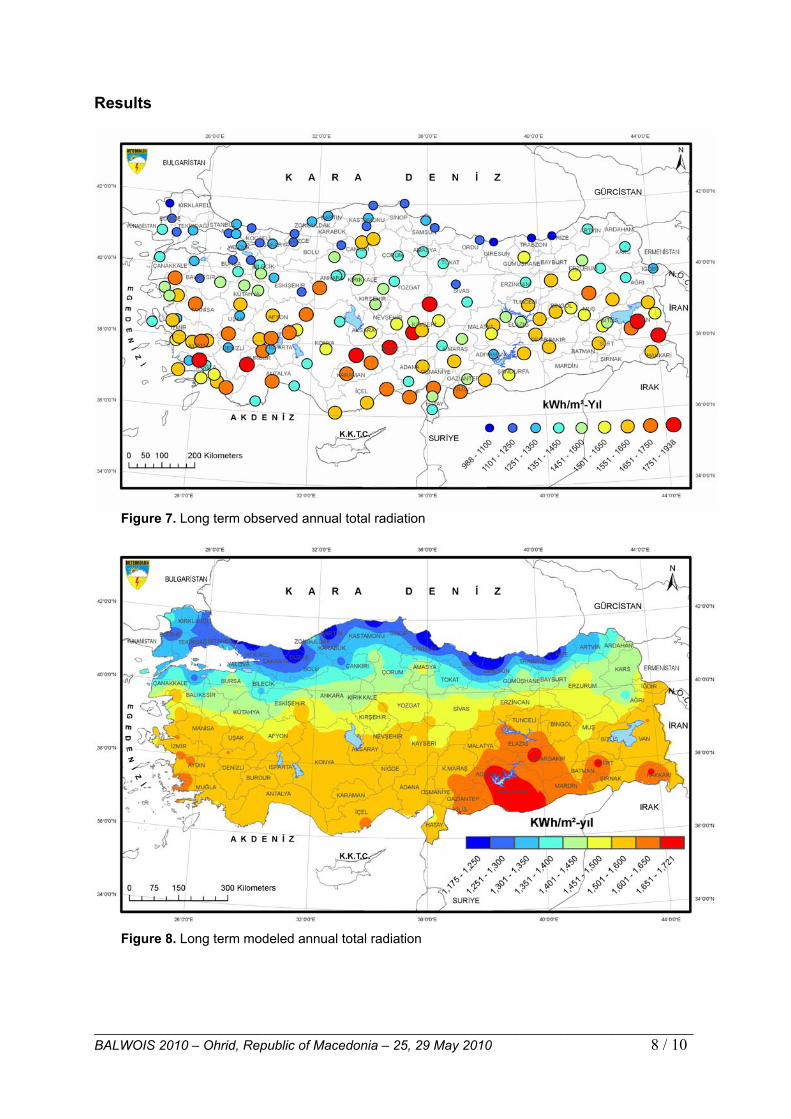
Results
Figure 7. Long term observed annual total radiation
Figure 8. Long term modeled annual total radiation
_________________________________________________________________________________ BALWOIS 2010 – Ohrid, Republic of Macedonia – 25, 29 May 2010 9 / 10
Conclusion
• In the modelling of spatial interpolation of radiation data, aspect, latitude, relative humidity and cloudiness were used as secondary variable. Best results were obtained with the cloudiness and relative humidity parameters.
• The lowest RMSE and highest r² values have been looked for between GWR model output
and observed radiation.
• Co-kriging and GWR model results were compared, the lowest RMSE and highest r² values were obtained with GWR in the modeling radiation data. For this reason modeling of radiation data continued with the GWR method.
• Co-kriging ve GWR model sonuçları karşılaştırıldığında, elde edilen en düşük RMSE değeri
ve yüksek r² değeri GWR ile yapılan modellemede elde edilmiştir. Bu nedenle güneşlenme şiddetinin ikincil verilerle modellenmesine, GWR yöntemi ile devam edilmiştir.
• Relationship between radiation and latitude and aspect is extremely low (r² 0.04 and 0.01). It
has been found that cloudiness and relative humidity parameters are more effective on interpolation of radiation. Best model combination according to r² and RMSE are: Radiation(Relative humidity + Cloudiness).
According to the residual map of modeling radiation data with the GWR method; Nigde,
Karaman, Van, Afyon and Burdur have been under estimated while Kırklareli, Tekirdağ, Balıkesir, Bursa, Kocaeli, Izmir, Aydin, Denizli, Eskisehir, Kastamonu, Sivas, Giresun, Trabzon , Rize, Elazığ, Adıyaman, Şanlıurfa, Gaziantep, and Igdir have been over estimated values were obtained. In the other places, model results are close to the observed value.
• According to the Local r² map of modeling radiation data with the GWR method; local r² values
between GWR model output and observed radiation are higher in the Eastern Black sea Region (0.49) and lower in the Hatay, Adana and Mersin (0.36). In the other parts local r² values have been found in between these two values.
Acknowledgements
The authors would like to acknowledge conference organizer for their kind invitation and acceptation of this paper, as well as excellent organization
_________________________________________________________________________________ BALWOIS 2010 – Ohrid, Republic of Macedonia – 25, 29 May 2010 10 / 10
References Bostan P.A., Akyürek Z., 2007, İkincil Veriler Kullanılarak Türkiye Ortalama Yıllık Yağış Değerlerinin Mekansal Dağılımının Modellenmesi, TMMOB Harita ve Kadastro Mühendisleri Odası, Ulusal Coğrafi Bilgi Sistemleri Kongresi, 30 Ekim –02 Kasım 2007, KTÜ, Trabzon Brundson, C., Fotheringham, S., Charlton, M., 2000, Geographically Weighted Regression as a Statistical Model. Brundson, C., McClatchey, J., Unwin, D.J., 2001, Spatial Variations in the Average Rainfall–Altitude Relationship in Great Britain: An Approach Using Geographically Weighted Regression, International Journal of Climatology, volume 21, issue 4, page: 455–466. Carrera-Hernandez, J.J, Gaskin, S.J., 2007, Spatio temporal analysis of daily precipitation and temperature in the Basin of Mexico, Journal of Hydrology, volume 336, issue 3-4, p: 231-249. Heuvelink, G.B.M., 2006, Incorporating process knowledge in spatial interpolation of environmental variables, 7th International Symposium on Spatial Accuracy Assessment in Natural Resources and Environmental Sciences, 5-7 July, Lisbon, Portugal. Lloyd, C.D, 2005, Assessing the Effect of Integrating Elevation Data into the Estimation of Monthly Precipitation in Great Britain, Journal of Hydrology, volume 308, issue 1-4, p: 128–150. Özmen, A., 2007, Güneş pilleri kullanarak elektrik üretimi, G.Ü. Fen Bilimleri Enstitüsü Yüksek lisans tezi Propastin, P., Muratova, N., Kappas, M., 2006, Reducing uncertainty in analysis of relationship between vegetation patterns and precipitation, 7th International Symposium on Spatial Accuracy Assessment in Natural Resources and Environmental Sciences, 5-7 July, Lisbon, Portugal. Simbahan, G.C., Dobermann, A., Goovaerts, P., Ping, J., Haddix, M.L, 2005, Fine-resolution mapping of soil organic carbon based on multivariate secondary data, Geoderma, volume 132, issue 3- 4, p: 471-489. Tappeiner U., Tappeiner G., Aschenwald J., Tasser E., Ostendorf B., 2001, GIS-based modeling of spatial pattern of snow cover duration in an alpine area, Ecological Modeling, volume 138, issue 1-3, p: 265–275. URL 1, Meteoroloji Ders Kitabı, http://www.ans.dhmi.gov.tr/TR/ATCTR/dok/metdrsktb.pdf, URL 2, Gamma Design software, Geostatistics for the Environmental Sciences, Cokriging in GS, http://www.gammadesign.com/OverviewCokriging.html, 19 Eylül 2007. URL 3, Goecomputation 99, Spatially Assessing Model Error Using Geographically Weighted Regression, http://www.geocomputation.org/1999/086/gc_086.htm, 19 Eylül 2007. URL 4. Enerji birimleri çevirici, http://www.birimcevir.com, 15.07.2009