modeling of urban flooding in bangkok
TRANSCRIPT

1
Modelling of Urban Flooding in Bangkok
Surajate Boonya-aroonnet*, Sutat Weesakul* and Ole Mark* *Water Engineering & Management Program, Asian Institute of Technology, PO Box 4, Klong Luang, Pathumthani, 12120 Thailand. E-mail: [email protected], [email protected], [email protected] Abstract The three different urban flooding models were applied in Sukhumvit urbanized area in Bangkok. The first model can exchange the surcharged water and surface storage by using virtual reservoir applied with the pipe network model. The second model is the two layers model which is the combination of pipe network and street net work model. The last model is the Digital Elevation Model (DEM) linked with pipe network model. The result of simulation of all models compared with the flood field data showed that the last model provided the best computed result. To examine the extension of application of model A and B capability, it was found that the first model was still can be applied for the light rainfall case. The two-layered model can be applied for the moderate rain and suitable for real time control due to its reasonable performance time. Introduction Flooding in urban area is an inevitable problem for many cities. Many cities in Asian region are old and they have developed according to varying historical needs and visions. This means that the layout and design of infrastructure have gradually developed into rather complex systems. At present, there are few studies on urban flooding that deal with both the conditions in the surcharged pipe network and extensive flooding on the catchment surface. Even fewer projects have dealt with modelling urban flooding in Asian countries. But today it is feasible to model urban flooding with the interaction between the pipe system and surface flooding and this raises new possibilities for managing urban flooding problems. Advanced modelling of flooding in urban areas was presented by Maksimovic C. (1999). The presentation is emphasized on the need of high-resolution data on terrain model for modelling of urban flooding. The author stated “virtual reservoir”, which is an advanced modelling technique to keep and exchange surcharged water between pipe network and surface storage. Tomicic et al. (1999) considered urban flooding modelling study at Playa de Gandia in Spain. The study has relied on a combined application of mathematical modelling and GIS. The runoff and flow models were completed in MOUSE. Hydrodynamic model, constructed in two exchangeable layers, describes both underground (pipes) and over land networks (streets). The exchange of water between the two networks was secured by a system of weir. Digital Elevation Model (DEM) within GIS supported extensively to model development (surface storage) and result presentation in flood inundation map. The study has proved combination of GIS and urban flood modelling is a powerful tool for urban flooding problems to achieve flood alleviation scenarios.

2
The authors state further that integration of mathematical modelling and GIS will contribute to even more cost-efficient and versatile studies in future. Apirumanekul C. (2001) studied urban flooding in Dhaka City to determine drainage system capacity and find alleviation scenario to relief flood problems. The study based on a combination of physically based modeling and GIS. The urban drainage is described by MOUSE on basis of two exchangeable networks, free surface flow over the streets and the sewer pipe flow as done by Tomicic et al. (1999). The result from drainage system simulation was presented in simply understandable form of flood inundation map performed by application of ArcView and DEM. Robert W. Carr et al (2001) described the use of street-surface storage for control of combined sewer surcharge and mitigate basement flooding. Street storage refers to the technology of temporarily storing storm water on the surface and below the surface close to the source. The idea is to accept the full volume of storm-water runoff into the sewer system but greatly reduce the peak rate of entry of storm water into the system. System components include street berms, flow regulators, and surface and subsurface storm-water storage facilities. This study strongly suggests that street storage, where physically feasible, is likely to be much less costly than sewer separation and relief sewers, a traditionally more common means of solving basement and other flooding. A MOUSE model, describing flows in two layers both flow in pipe and street networks and simulating one-dimensional flow for river and canals network, will be used in the present study model set up based on data for a sub-catchment in Bangkok. A Digital Elevation Model (DEM) and ArcView also will be established for generation of flood inundation maps in catchment areas. The objective of the study is to evaluate the different models of urban flooding emphasis on the exchange of surcharge water and pipe/ canal network that can provide the inundation map in urban area Study Area Sukhumvit sub-catchment, one of the parts of Central Business District of eastern sub-urban area in Bangkok, has an area of 24 km2 and is bound klongs and Chao Phraya River as shown in Fig. 1. At present, there are 10 polders exist in the primary drainage of Bangkok. Sukhumvit sub-catchment is the one of them. Each polder area will have its own drainage system, so-called secondary drainage system. The characteristic of secondary drainage system is to prevent floodwater from outside by level up its boundary and try to pump rainwater out of the area to main drainage canals. The boundaries of the study area are: North : klong Sean Seap East : klong Tan and klong Phra Khanong West : Chong Nontri Railway South : Chao Phraya River at klong Toei Port
This study area has a characteristic of flat plain. Although, this area can prevent floods caused by overflow from Chao Phraya River in 1995 and 1996, removal of stormwater is impossibly drained by gravity into existing canals. Some areas in Sukhumvit sub-catchment are frequently inundated. The primary drainage system mostly depends on klongs. Due to flat area, combination of pumps and klongs is used to drain water to the main drainage canals or the river. To prevent

3
flooding from river, gates are also installed in this area. Nevertheless, drainage capacity of existing system is still not adequate because hydraulic capacity of klongs is limited. At present, the secondary drainage system, Sukhumvit area, is operated by Department of Drainage & Sewerage (DDS). The pumping is mainly operated to drain rainwater. There is no retention pond inside this area and unfortunately, in wet season, water levels in both surrounded canals, which are Klong Phra Khanong and Klong Tan almost reach the embankment level. Drainage by pumps is only one means to remove water. Due to flat area and insufficient drainage capacity, frequent floods occur even a small local rainfall at the area of Sukhumvit Soi 39 to Rama 4th junction including Soi Thong Lor and Soi Ekamai as shown in Fig. 2.
Figure 1. Map of Master Plan and Study Area (DDS, 1998)

4
Figure 2. Detailed Map of The Study Area (DDS, 1998)
Figure 3. Location Having A Capacity less than 1-year Return Period Rainfall (DDS, 1998)
Existing drainage system consists of 2 major parts. One is area in both side of Sukhumvit Street and area in the South of the street will drain rainwater to klong Toei finally to the river at klong Toei pumping station. Another one is area in the North of Sukhumvit Street will drain to klong
Cho
ng N
ontr
i Rai
lway

5
Sean Seap, klong Tan, and klong Phra Khanong. The overall drainage system can be summarized as followed: • The area starts to be inundated by 1-year return period rainfall and 1-hour duration, which is
35 mm accumulated as shown in Intensity-Duration-Frequency Curve Fig. 4 with flood depth approximately 20-40 cm,
• Sewer pipes have not covered all streets and roads and sizes are insufficient, while drainage channels become shallow and were invaded,
• This secondary drainage system is independent from primary drainage system when water level outside is lower than embankments,
• In this drainage area, land use has been changed from residential to high commercial building.
Existing flood protections to this area mostly are from existing embankments of the river, retaining walls of channels, streets, and railways. These make this area separate from primary drainage system. Elevation of the study area in average is around 0.4 to 1.0 Mean Sea Level (MSL). Dike elevation along klong Sean Seap varies between 6.0 to 1.20 MSL and along klong Tan/Phra Khanong ranges around 0.4 to 1.2 MSL.
Figure 4. Intensity-Duration-Frequency Curve (DDS, 1998) Methodology Model Scenarios Different model scenarios were established to evaluate the suitable modelling technique for simulation of urban flooding in Sukhumvit area.
1-Year Return Period
2-Year Return Period
5-Year Return Period
10-Year Return Period
Rai
nfal
l (m
m)
Duration (min)
6
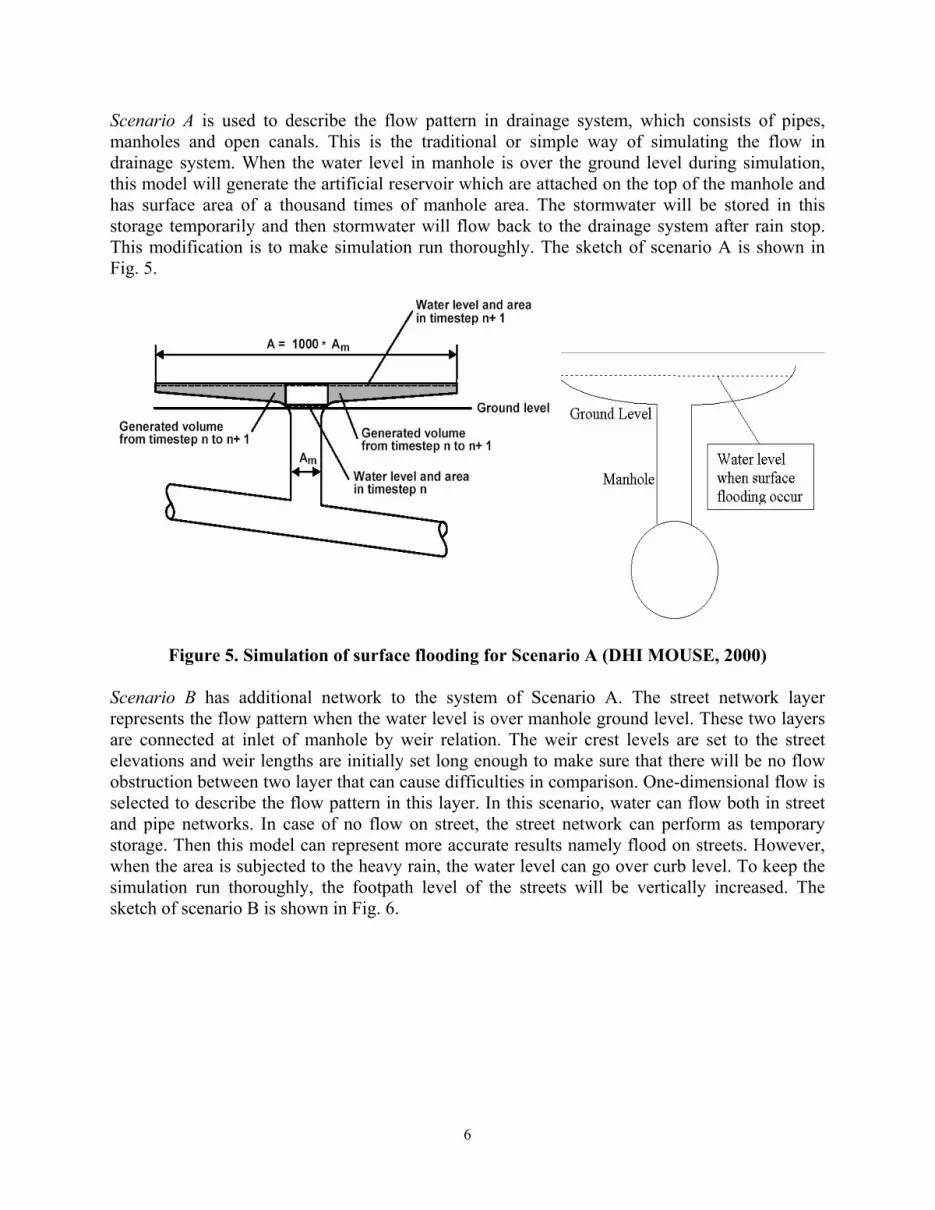
Scenario A is used to describe the flow pattern in drainage system, which consists of pipes, manholes and open canals. This is the traditional or simple way of simulating the flow in drainage system. When the water level in manhole is over the ground level during simulation, this model will generate the artificial reservoir which are attached on the top of the manhole and has surface area of a thousand times of manhole area. The stormwater will be stored in this storage temporarily and then stormwater will flow back to the drainage system after rain stop. This modification is to make simulation run thoroughly. The sketch of scenario A is shown in Fig. 5.
Figure 5. Simulation of surface flooding for Scenario A (DHI MOUSE, 2000) Scenario B has additional network to the system of Scenario A. The street network layer represents the flow pattern when the water level is over manhole ground level. These two layers are connected at inlet of manhole by weir relation. The weir crest levels are set to the street elevations and weir lengths are initially set long enough to make sure that there will be no flow obstruction between two layer that can cause difficulties in comparison. One-dimensional flow is selected to describe the flow pattern in this layer. In this scenario, water can flow both in street and pipe networks. In case of no flow on street, the street network can perform as temporary storage. Then this model can represent more accurate results namely flood on streets. However, when the area is subjected to the heavy rain, the water level can go over curb level. To keep the simulation run thoroughly, the footpath level of the streets will be vertically increased. The sketch of scenario B is shown in Fig. 6.

7
Figure 6. Simulation of surface flooding for Scenario B (Apirumanekul, 2001)
Scenario C brings the terrain information to the previous scenario B. To know where flood water goes when it spill over curb level, flood cell will be represented. The flood cell is the defined area in real topography from the same location of the street. The area-elevation capacities of storing water for each flood cells were extracted from existing DEM. The flood depth can then be simulated correctly according to the terrain shape. Exchange of stormwater between street network and flood cell storage was described by weir relation. The weir crest levels are set to be at the curb level and the weir lengths were defined according to the length of the streets in each flood cell. The sketch of scenario C is shown in Fig. 7.
Figure 7. Simulation of surface flooding for Scenario C
The three different models were set up to evaluate the appropriate scenario for simulation of urban flooding. The descriptions for each model were shown in Table 1.

8
Table 1 Description of Each Model Scenario
Model
A (Artificial Reservoir)
B (Pipe + Street
Networks)
C (Pipe + Street
+DEM) No. of Catchments 2002 2002 2002 No. of Manholes/Street Nodes 1907 2299 2299 No. of Basins 189 189 515 No. of Outlets 21 21 21 No. of Weirs 0 269 596 No. of Pumps 70 70 70 No. of Pipes/Links 2057 2057 2057 No. of Canals/Streets 360 785 785 Digital Elevation Model (DEM) The available spot-elevation data from DDS are collected along street footpath uniformly separate through out the study area. Then, using the spot-elevation data to create the DEM is suitable to represent the terrain topography. First street elevations totally 4,626 points in 24 km2 area were converted to XYZ coordinate format. Then, from converted XYZ coordinate format, The DEM was created by a distance-weighted interpolation with a grid-size resolution of 5 meters. The resolution of digitized DEM is 5 m, which yields sufficiently accurate representation of elevations along the streets and flood prone areas.
Figure 8. Defined Flood Cells and DEM of the Study Area Area–Elevation Curve To represent the terrain shape in the study area, the DEM is used to describe the area elevation characteristics in scenario C. If water from pipe network flows through manhole and reaches

9
curb level of street, then surface flooding will take place. The surface inundation then can be described by rising water level according to area-elevation relation of terrain. Area–elevation relation is required for input data. To find storage capacity of surface as input of the model, this relation is developed from DEM with the application of MIKE11 GIS. Flood cells as shown in Fig. 8 are defined for each node above the street network for estimating area–elevation relation corresponding to DEM. Flood cells are located at the adjacent areas around street nodes, where surface flooding may spread. This procedure is called “catchment delineation”. Surface Flooding The model results are geo-referenced and related through a coordinate system common with the DEM grid. The results are presented in ArcView GIS as flood inundation maps, based on water levels computed by the models. This has been chosen as flood inundation maps provide the most effective media for visualizing flooding. In reality, the water levels from street nodes mainly cause flooding on the streets and the adjacent areas. However, to compare different three model scenarios that model A has no exist of street nodes, water levels from the simulation at manhole nodes were chosen and exported to ArcView GIS. Using interpolation routines in MIKE11 GIS, continuous three-dimensional water surfaces were constructed based on the simulated manhole water level from MOUSE and the DEM. The DEM elevations were subsequently subtracted from the water level surface delineating inundated areas by flood extent and flood depth. In this study, The maximum water levels for each manhole are interpolated to create flood inundation map with time regardless. Therefore, it will give a higher flooding even a small rainfall of 15 mm. However, it is suitable for model scenarios testing. Hydrological & Hydraulic Data Hydrological model deals with the computation of surface runoff hydrograph by surface runoff models. The following data were collected: • Catchment Area, • Impervious Area: due to urbanized area, • Rainfall Data: the 15-mm box rainfall considered light rain and 1-year return period rainfall,
considered heavy rain, were used in this study, • Concentration Time: 7 min was selected under condition of urbanized area. Hydraulic model in MOUSE deals with flows both in pipe and street system. Pipe flow model computes flows, water levels and discharges which are based on the fully dynamic wave approach. The following data were collected for pipe flow model and street flow model. • Pipe network: Dimensions of the pipe system e.g. diameter, length and invert level, • Detention storage, • Road system: The elevation and the cross section of the roads are essential for flow
simulation on streets and estimation of the storage of street network, • Water level in river/canal system, • Pump, gates, flow regulators, this data are essential in application of real time flood control,

10
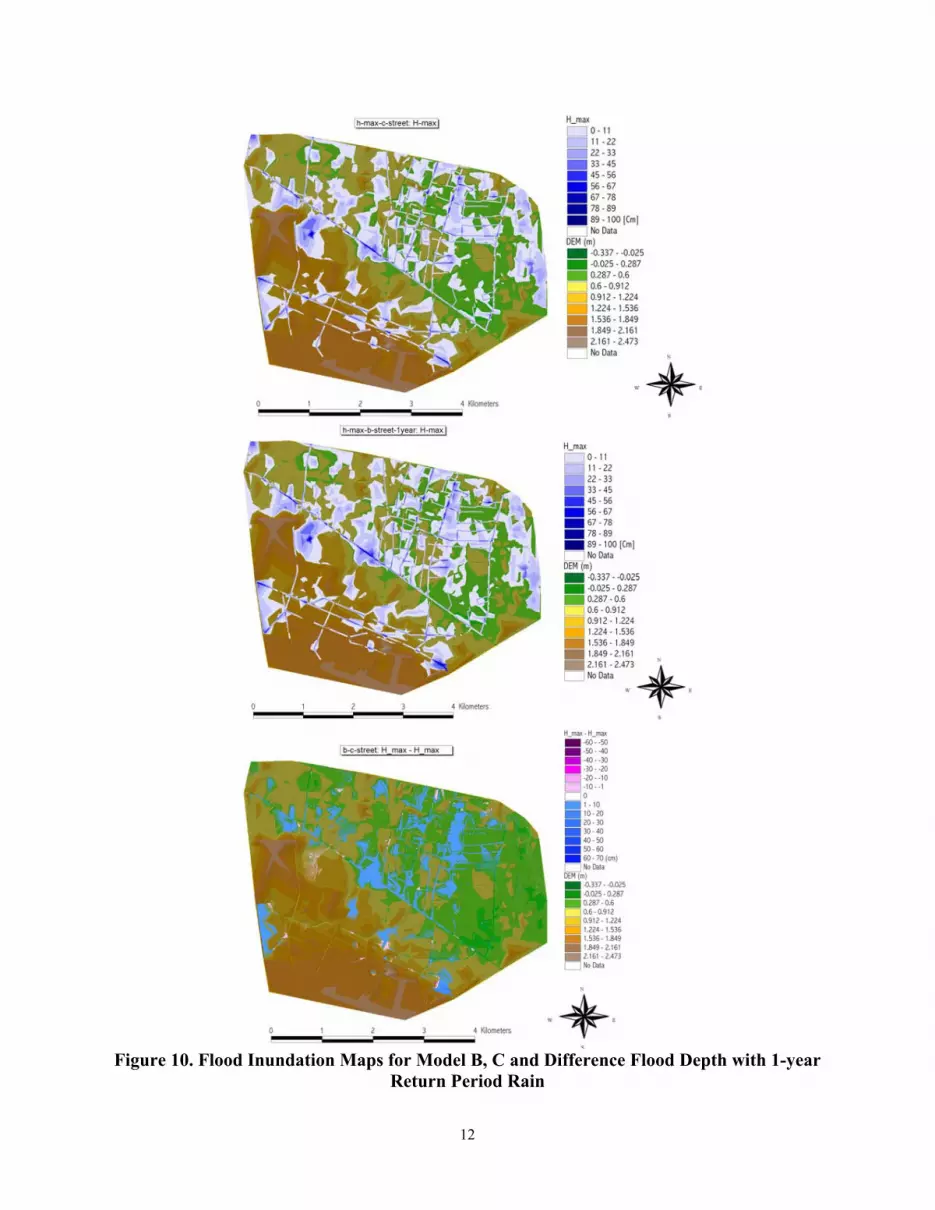
Results and Discussion Simulation Time As the fact that the simulation time is one important factor of model for practical use in real time situation, the purpose of using model can limit the application for high-detail model. Hence, the level of data requirement depends on purpose of using model. The simulation time for each model were summarized as shown in Table 2. The size of rain is also another suggestion of model selection. Since the light rainfall will yield lower flood depth then only model A is suitable for use. Flood Depth The flood depth from Model A gives the highest magnitude. The reason is that the scenario of model A cannot allow water to flow between street nodes. The floodwater is temporarily storing in artificial storage above the manhole to keep the simulation run and flow back after rain stop. With 15-mm rainfall, the result from model A simulation is shown in Fig. 9. The simulated flood depth from model B is then greatly reduced from Model A (Fig. 9). However in Model C, the result gave almost the same to Model C compared to Model B because the rain using in the first simulation is the light rain then the stormwater will not reach high magnitude to spill over the footpath level. To simulate the real condition and see difference between Model B and C, the design rainfall with 1-year return period is applied to the Model B and Model C. Formerly only 15 mm small rainfall cannot give the difference in flood depth between this two models. The simulation results are presented in flood inundation map by selecting water level from street nodes to compute flood map. It was found that the result from Model B gave higher flood, because water level is over the curb level. The water can spill over to the adjacent area in Model C not like in Model B, which water will keep going up higher than model C due to vertically increasing of footpath elevation in order to make a simulation run. The result from Model C gives a good agreement with the former study by DDS (1998) as shown in Fig. 3. Figure 10 shows the flood inundation map of the area with 1-year return period design rainfall. System Capacity From the simulation results, most of the area can be flooded under 1-year return period rainfall event. This means that almost all pipes in drainage system are filled up by stormwater. It took very long time to empty up the system again. This is particular characteristic of the drainage system in flat area like Bangkok that storage from system itself indicates the system capacity. Hence, the system capacity will affect the application of real time flood control as well.

11
Figure 9. Flood Inundation Maps for Model A, B and C with 15-mm Rain
12
Figure 10. Flood Inundation Maps for Model B, C and Difference Flood Depth with 1-year
Return Period Rain

13
Table 2 Comparison of Each Model Results Model Simulation time (min*)
Reliability of simulating rain
event Simulated Flood Depth
A 10 Light rain (~15 mm**) Overestimate flood B 30 Moderate rain (~35 mm** ) Valid below curb level C 60 Heavy rain Follow terrain shape
*Pentium III 933MHz CPU **Lasting for 1 hour Conclusions • Model A seems to be applied with only the light rainfall case, • Model B, two-layered model, provides satisfactory result for moderate rainfall in this case 1-
year return period, • Model C is preferred to obtain the real flood pattern which can be used for further analysis of
the system, • In practical use of real time flood control, simulation time is an important factor for different
purposes. Therefore selection of model depends on response time of the natural processes compared with simulation time. Model B is preferable for real time operation due to its satisfactory result and less computational time,
• DEM directly represents the terrain shapes characteristic which affects the inundation depth so that DEM has to be accurate,
• For estimating storage volume of the surface flooding, land elevation data together with road cross section are necessary,
• In case of heavy rain or high flood from river overflow, the two-dimensional model on flood plain is required because the model C cannot allow water to flow across the flood cells.
References Apirumanekul C. (2001). “Modelling of Urban Flooding in Dhaka City,” Master Thesis No. WM 00-13, Asian Institute of Technology, Bangkok, Department of Drainage and Sewerage (1998). “Project for Investigation and Design Drainage Systems in Sukhumvit Sub-catchment Area,” Bangkok Metropolitan Administration, DHI Water & Environment (2000), “MOUSE Pipe Flow: Reference Manual,” DHI Water and Environment. Maksimovic C. (1999). “Data Requirements for Advanced Modelling of Flooding in Urban Areas,” Chartered Institution of Water and Environmental Management Meeting Birmingham, England, Robert W. Carr and Stuart G. Walesh (2001). “Street Surface Storage for Control of Combined Sewer Surcharge,” Journal of Water Resource Planning and Management, Vol. 127, No.3, May/June, 2001, pp. 162-167.

14
Tomicic B., Mark O., and Kornborg P. (1999). “Urban Flooding Modelling Study at Playa de Gandia,” 3rd DHI User Conference, H∅rsholm, Denmark.