modeling of thermal cracking process in a crude oil refinery
TRANSCRIPT
Vol. 4(4), pp. 81-90, April, 2013
DOI 10.5897/JPGE2013.0151 ISSN 1996-0816 ©2013 Academic Journals
http://www.academicjournals.org/JPGE
Journal of Petroleum and Gas
Engineering
Full Length Research Paper
Modeling of thermal cracking process in a crude oil refinery
Sepehr Sadighi and S. Reza. Seif Mohaddecy*
Project Manager, Catalysis and Nanotechnology Division, Catalytic Reaction Engineering Department, Research
Institute of Petroleum Industry (RIPI) Iran
Accepted 11 March, 2013
In a thermal cracking process, the molecular bonds of the liquid are broken to the lighter ones. Recently due to the availability of more heavy oils, the process interest was to yield light and middle distillate products. In this research, thermal cracking of vacuum residue in a commercial soaker-visbreaking plant is studied. The product of the process is characterized to the light gas (C1, C2), liquefied petroleum gases (C3, C4), gasoline (IBP-180°C), gas oil (180 to 320°C) and fuel (320
+°C). Then to model the
visbreaking process, a six-lump kinetic network with fifteen reactions and thirty kinetic parameters is developed. In this model, visbreaking process is modeled as an equal distributed heater, and the soaker is modeled as a complete stirred tank reactor. After evaluating the rate of reactions by estimated kinetic parameters, it is confirmed that a reduced reaction network with seven reaction paths and fourteen kinetic parameters is reliable enough to simulate the performance of the reactor with the absolute
average deviation ( %AAD ) of 4.75%. Key words: Kinetic model, visbreaking, lumped model.
INTRODUCTION In the present day scenario the availability of more heavy crude oils has resulted in the increased production of atmospheric and vacuum residues and simultaneous decrease in light and middle distillate fractions (Singh et al., 2012). A visbreaker is a processing unit in oil refinery whose purpose is to reduce the quantity of residual oil produced in the distillation of crude oil and to increase the yield of more valuable middle distillates (heating oil and diesel) by the refinery. A visbreaker thermally cracks large hydrocarbon molecules in the oil by heating in a furnace to reduce its viscosity and to produce small quantities of light hydrocarbons (LPG and gasoline). The process name of "visbreaker" refers to the fact that the process reduces (that is, breaks) the viscosity of the residual oil. The process is non-catalytic (Gary et al., 1984; Speight et al., 2006).
There are two types of commercial visbreaking units:
the coil or furnace type, and the soaker process. The coil-visbreaker is operated at high temperature and low residence time whilst in a soaker one by adding an adiabatic drum after the coil furnace, the product is held for a longer time so that the coil is kept at relatively lower temperature. Therefore, the heater duty and, in turn, the fuel consumption is only 70% of that for the coil-visbreaking process (Joshi et al., 2008). Worldwide, about 200 visbreaking units are under operation, and Europe alone accounts for about 55% of the total visbreaking capacity (Joshi et al., 2008).
To effective design and perfect control of any process, a model is needed to predict product yields and qualities versus variables such as space velocity and temperature. However, the complexity of visbreaking feed and product makes it extremely difficult to characterize and describe its kinetics at a molecular level. Modern day rigorous
*Corresponding author. E-mail: Seifsr @ripi.ir.
82 J. Petroleum Gas Eng. simulators such as Aspen plus or Hysys from Aspen Technology do not have such restrictive limits on the total number of components, and it is possible to use a unique set of pseudo components for every petroleum assay stream (Sadighi et al., 2012). This approach increases the calculation time, however, and characterization of the streams and subsequent reports become unnecessarily complicated (Sadighi et al., 2012).
One approach to simplify the problem is to consider the partition of the species into a few equivalent classes, the so-called lumps or lumping technique, and then assume each class is an independent entity. Developing simple kinetic models (for example, power-law model) for complex catalytic reactions is a common approach as it can give basic information for reactor design and optimization. In this field, many investigations were reported in which visbreaking process was modeled with discrete two-lump (Al-Soufi et al., 1988; Krishna et al., 1988; Di Carlo and Jenis, 1992), three-lump (Benito et al., 1995), 4-lump (Del Bianco et al., 1993; Trauth et al., 1992; Singh et al., 2012), five-lump (Kataria et al., 2004; AlHumaidan et al., 2013) and 7-lump (Xiao et al., 2002) approaches. In all these investigation, the experiments were carried out in a micro or pilot scale reactor. But, the common advantage of all of these presented models is their simplicity, less required computational time and the least needed structural information. Furthermore, the more sophisticated lumping models are continuous one that one of them was recently presented by Shadbahra et al. (2011).
The aim of this research is developing a simple yield predictor model, according to a six-lump reaction approach, to predict the most added value products consists of gas, LPG, gasoline, diesel and fuel oil in a commercial soaker unit. The main advantage of this work is presenting a simple approach for the commercial visbreaking process in which the temperature profile of the furnace is also included in the model. DATA GATHERING
Feed characterization An Industrial soker-visbreaker unit was chosen as a case study. This unit was designed to visbreak 20,000 barrel per day of a mixture of vacuum residuum and slop vacuum gas oil which are both taken from the vacuum tower; the composition of the fresh feed can vary slightly with time from start of run (SOR) to end of run (EOR). The specification of the combined feed, which was analyzed during this research, is shown in Table 1. Process description The visbreaking feed is charged to the coil furnace at the temperature about 340°C. The visbreaking furnace is included of two sections fired independently. After the coil furnace, the two hot streams are drained into a transfer line; then the mixed product is entered into the soaker drum. The specifications of cells and the soaker drum are presented in Table 2. The output product from the
Table 1. Feed characterization.
Property Unit Value
Sp.Gr. - 1.006
Sulfur Content wt % 3.19
Va + Ni Content wt ppm 188
Distillation ( ASTM D1160 )
Vol % Temperature (°C)
IBP1 303
5 409
10 457
20 503
30 543
50 585 Table 2. Specifications of the cell and soaker of the visbreaking
unit.
Coil specification Unit Value
Number of tubes - 128
Number of convection tubes - 76
Number of radiation tubes - 52
Tube length m 18.745
Outside diameter m 0.114
Soaker specification
Outside diameter m 2.405
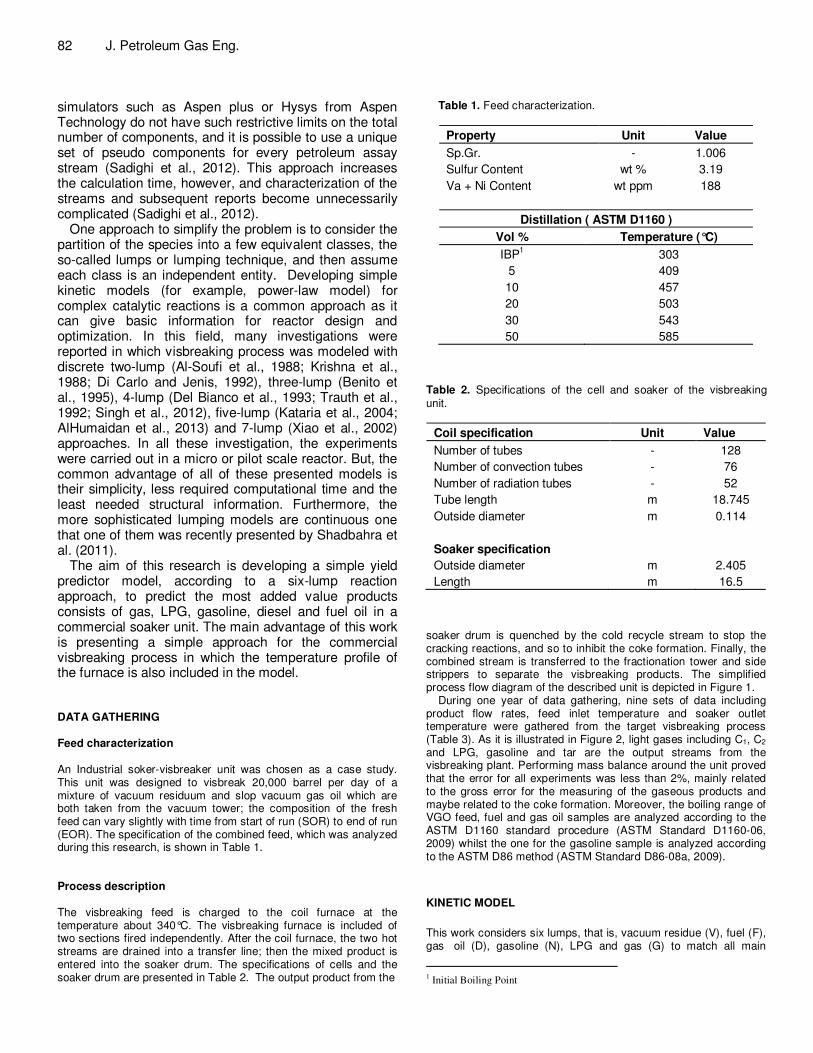
Length m 16.5 soaker drum is quenched by the cold recycle stream to stop the cracking reactions, and so to inhibit the coke formation. Finally, the combined stream is transferred to the fractionation tower and side strippers to separate the visbreaking products. The simplified process flow diagram of the described unit is depicted in Figure 1.
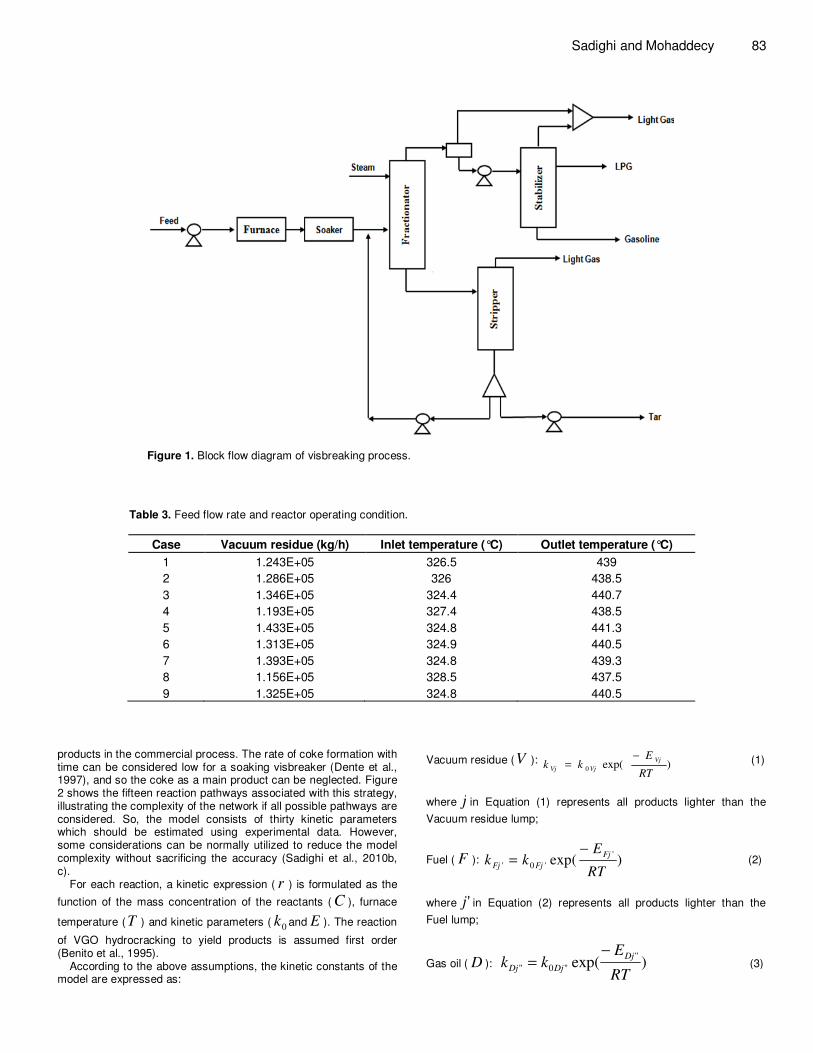
During one year of data gathering, nine sets of data including product flow rates, feed inlet temperature and soaker outlet temperature were gathered from the target visbreaking process (Table 3). As it is illustrated in Figure 2, light gases including C1, C2 and LPG, gasoline and tar are the output streams from the visbreaking plant. Performing mass balance around the unit proved that the error for all experiments was less than 2%, mainly related to the gross error for the measuring of the gaseous products and maybe related to the coke formation. Moreover, the boiling range of VGO feed, fuel and gas oil samples are analyzed according to the ASTM D1160 standard procedure (ASTM Standard D1160-06, 2009) whilst the one for the gasoline sample is analyzed according to the ASTM D86 method (ASTM Standard D86-08a, 2009).
KINETIC MODEL
This work considers six lumps, that is, vacuum residue (V), fuel (F), gas oil (D), gasoline (N), LPG and gas (G) to match all main
1 Initial Boiling Point
Sadighi and Mohaddecy 83
Figure 1. Block flow diagram of visbreaking process.
Table 3. Feed flow rate and reactor operating condition.
Case Vacuum residue (kg/h) Inlet temperature (°C) Outlet temperature (°C)
1 1.243E+05 326.5 439
2 1.286E+05 326 438.5
3 1.346E+05 324.4 440.7
4 1.193E+05 327.4 438.5
5 1.433E+05 324.8 441.3
6 1.313E+05 324.9 440.5
7 1.393E+05 324.8 439.3
8 1.156E+05 328.5 437.5
9 1.325E+05 324.8 440.5
products in the commercial process. The rate of coke formation with time can be considered low for a soaking visbreaker (Dente et al., 1997), and so the coke as a main product can be neglected. Figure 2 shows the fifteen reaction pathways associated with this strategy, illustrating the complexity of the network if all possible pathways are considered. So, the model consists of thirty kinetic parameters which should be estimated using experimental data. However, some considerations can be normally utilized to reduce the model complexity without sacrificing the accuracy (Sadighi et al., 2010b, c).
For each reaction, a kinetic expression ( r ) is formulated as the
function of the mass concentration of the reactants ( C ), furnace
temperature (T ) and kinetic parameters ( 0k and E ). The reaction
of VGO hydrocracking to yield products is assumed first order (Benito et al., 1995).
According to the above assumptions, the kinetic constants of the model are expressed as:
Vacuum residue (V ): )exp(0RT
Ekk
Vj
VjVj
−= (1)
where j in Equation (1) represents all products lighter than the
Vacuum residue lump;
Fuel ( F ): )exp('
'0'RT
Ekk
Fj
FjFj
−= (2)
where 'j in Equation (2) represents all products lighter than the
Fuel lump;
Gas oil ( D ): )exp(''
''0''RT
Ekk
Dj
DjDj
−= (3)
84 J. Petroleum Gas Eng.
Figure 2. The complete six-lump kinetic model.
where ''j in Equation (3) represents all products lighter than the
Gas oil lump;
Gasoline ( N ): )exp('''
'''0'''RT
Ekk
Nj
NjNj
−= (4)
where '''j in Equation (4) represents all products lighter than
Gasoline; and
LPG ( LPG ): )exp(0RT
Ekk LPGG
LPGGLPGG
−= (5)
In Equations (1) to (5), T and R are the absolute value of the coil temperature of the visbreaking furnace and the ideal gas constant, respectively. Thus, the reaction rates ( r ) can be formulated as the following:
Vacuum residue (Vr ):
G
V Vj V
j V
r k C=
= ∑ (6)
Fuel ( Fr ):
G
F VF V Fj F
j F
r k C k C=
= −∑ (7)
Gas oil ( Dr ):
G
D VD V FD F Dj D
j D
r k C k C k C=
= + −∑
(8)
Gasoline (N
r ):
D G
N jN j Nj N
j V j N
r k C k C= =
= −∑ ∑ (9)
LPG (LPG
r ):
N
LPG jLPG j LPGG LPG
j V
r k C k C=
= −∑ (10)
Gas (G
r ):
G
G jG j
j V
r k C=
= ∑ (11)
MASS BALANCE EQUATIONS
A soaker-visbreaking unit is divided to two reactive parts in series. The first one is the coils of the furnace assumed as an ideal plug-flow reactor (Joshi et al., 2008), and the second one is the soaker drum which is considered as complete mixed reactor. So, the mass balance equations for the coil and soaker drum can be given as follows.
For the coil: ( )
0j
j
C
Cr
V
υ∂± =
∂ (12)
For the soaker drum: '
( )0
j
j
D
Cr
V
υ∆± = (13)
In Equations (12) and (13), j ranges from the vacuum residue
lump (V ) to the gas (G), C is the mass concentration of the lump,
CV is the volume of coil, DV is the volume of drum; rj and r'j are
reaction rates; negative sign "-" is used for the feed (or VGO), and a positive sign "+" is used for products.
For the coil: 0)(
=∂
∂
cV
ρν (14)
For the soaker drum: 0)(
=∆
DV
ρν (15)
m
j
jF
CX
ν.= (16)
∑=
=G
Vj j
jX
ρρ
1 (17)
In Equations (14) to (17), ρ and ν are the stream density and
volumetric flow rate through the reactor, respectively; m
F is the
mass flow rate of the stream passing through the coil; j
X , and
jρ are the mass fraction and density of lump j, respectively.
After calculating the mass concentration and volumetric flow rate of each lump in the effluent stream, the product yields can be found as the following:
. (1 )j out out R
j
m
C FY
F
υ −= (18)
In Equation (18), RF is the fraction of recycle of the lumps, which is
mixed with the fresh feed.
COIL TEMPERATURE MODEL In this work, it is supposed that there is an equal heat flux throughout the furnace to close the overall heat balance. Therefore, the following expression can be written for the temperature profile through the furnace tubes:
t
V
Gj
injj
V
Gj
outjjm
L
TCpXTCpXF
z
T
−
=∂
∂∑∑==
).().(.
(19)
where T is the fluid temperature flowing the coil (reaction
temperature); t
L is the total length of the tubes and j
Cp is the
heat capacity of lump j; co
T and 0T are coil inlet and outlet
temperatures, respectively.
Sadighi and Mohaddecy 85
Because the difference between the inlet and outlet temperatures of the soaker drum is negligible, it can be modeled similar to an isothermal reactor. PARAMETER ESTIMATION
To estimate the kinetic parameters, the sum of squared
errors, SQE , as given below, is minimized:
2
1
)(pred
jn
N
n
meas
jn
G
Vj
YYSQEt
−=∑∑= =
(20)
In Equation (20),t
N , meas
jnY and pred
jnY are the number of test
runs, the measured product yield and the yield predicted by the model, respectively.
The visbreaking model according to Equations (1) to (19) is coded and solved simultaneously using the Aspen Custom Modeler (ACM) programming environment (AspenTech, 2006) to calculate
the product yields (jn
Y ). ACM is an easy-to-use tool for creating,
editing and re-using models of process units. ACM uses an object-oriented modeling language to build the simulation applications; then, the entire process can be simulated by combining these applications on a graphical flow sheet.
To estimate kinetic parameters, Equation (20) is minimized by sequential application of the NL2Sol and Nelder-Mead algorithms which are both found in the Aspen Custom Modeler software.
Additionally, to compare the simulated and measured product values, absolute average deviations (AAD) are calculated by the following equation (Sadighi et al., 2010a):
%
)(
100%1
2
2
t
N
nmeas
jn
pred
jn
meas
jnG
Fj
N
Y
YY
AAD
t
∑∑= =
−
= (21)
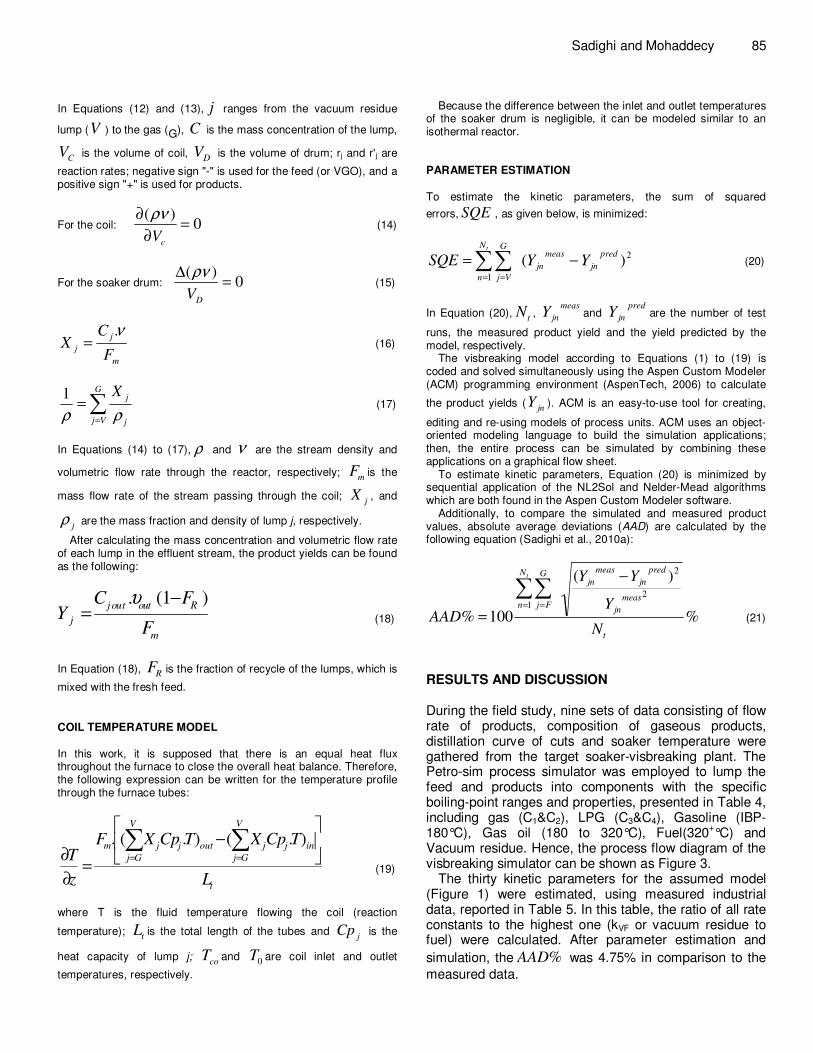
RESULTS AND DISCUSSION During the field study, nine sets of data consisting of flow rate of products, composition of gaseous products, distillation curve of cuts and soaker temperature were gathered from the target soaker-visbreaking plant. The Petro-sim process simulator was employed to lump the feed and products into components with the specific boiling-point ranges and properties, presented in Table 4, including gas (C1&C2), LPG (C3&C4), Gasoline (IBP-180°C), Gas oil (180 to 320°C), Fuel(320
+°C) and
Vacuum residue. Hence, the process flow diagram of the visbreaking simulator can be shown as Figure 3.
The thirty kinetic parameters for the assumed model (Figure 1) were estimated, using measured industrial data, reported in Table 5. In this table, the ratio of all rate constants to the highest one (kVF or vacuum residue to fuel) were calculated. After parameter estimation and
simulation, the %AAD was 4.75% in comparison to the
measured data.
86 J. Petroleum Gas Eng.
Table 4. Average properties of the visbreaking lumps.
Parameter IBP-FBP (°C) Sp. g Heat capacity (kJ/kg.°C)
Gas C1&C2 0.364 1.86
LPG C3&C4 0.55 1.97
Gasoline IBP-180 0.739 2.4
Gas oil 180-320 0.806 2.6
Fuel 320+ 0.999 2.95
Figure 3. The scheme of the process flow diagram of visbreaking simulator.
Table 5. Kinetic parameters for the reaction network.
Frequency factor
k0 (m3.hr
-1.m
3 cat
-1)
Activation energy
E (kcal/mol)
Rate
ko exp(-E/RTmean)
Order
(to kVF)
k0VF 243082 EVF 8.70 520.98 1
k0VD 6785.12 EVD 11.10 2.66 5.11E-03
k0VN 0 EVN 31.11 0 0
k0VLPG 0 EVLPG 30.91 0 0
k0FG 3034.89 EFG 31.29 7.63E-07 1.46E-09
k0FD 0 EFD 29.08 0 0
k0FN 91224.183 EFN 19.53 0.093 1.78E-04
k0FLPG 2184.96 EFLPG 31.01 6.70E-07 1.29E-09
k0FG 15776.3 EFG 19.30 0.019 3.63E-05
k0DN 0 EDN 29.32 0 0
k0DLPG 0 EDLPG 29.26 0 0
k0DG 1766.11 EDG 30.66 6.91E-07 1.33E-09
k0NLPG 1344.11 ENLPG 12.12 0.256 4.92E-04
k0NG 1.03799 ENG 16.97 6.45E-06 1.24E-08
k0LPGG 1344.11 ELPGG 31.15 0 0
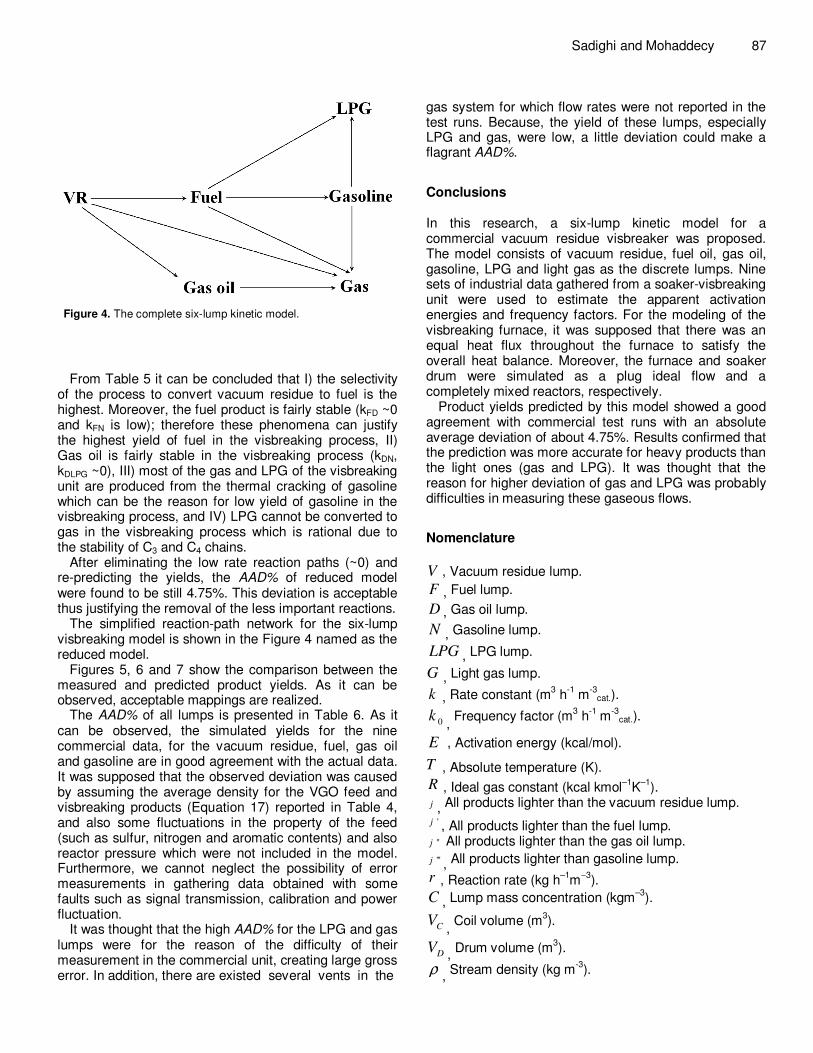
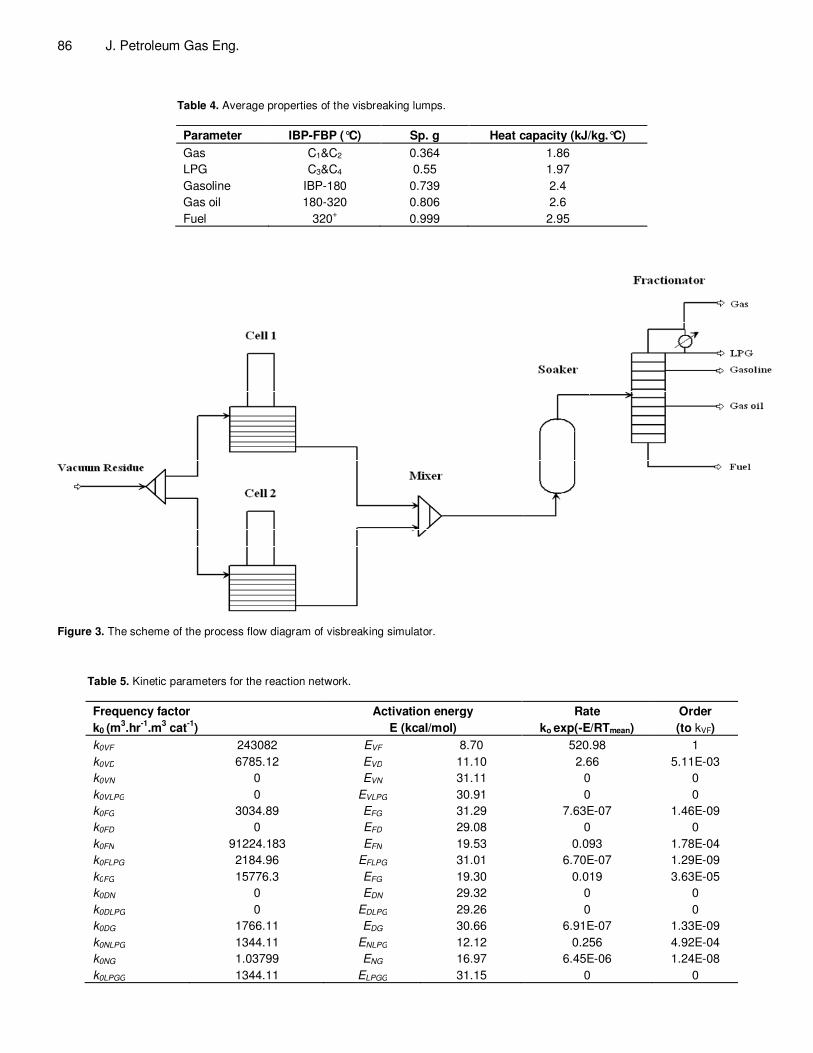
Figure 4. The complete six-lump kinetic model.
From Table 5 it can be concluded that I) the selectivity of the process to convert vacuum residue to fuel is the highest. Moreover, the fuel product is fairly stable (kFD ~0 and kFN is low); therefore these phenomena can justify the highest yield of fuel in the visbreaking process, II) Gas oil is fairly stable in the visbreaking process (kDN, kDLPG ~0), III) most of the gas and LPG of the visbreaking unit are produced from the thermal cracking of gasoline which can be the reason for low yield of gasoline in the visbreaking process, and IV) LPG cannot be converted to gas in the visbreaking process which is rational due to the stability of C3 and C4 chains.
After eliminating the low rate reaction paths (~0) and re-predicting the yields, the AAD% of reduced model were found to be still 4.75%. This deviation is acceptable thus justifying the removal of the less important reactions.
The simplified reaction-path network for the six-lump visbreaking model is shown in the Figure 4 named as the reduced model.
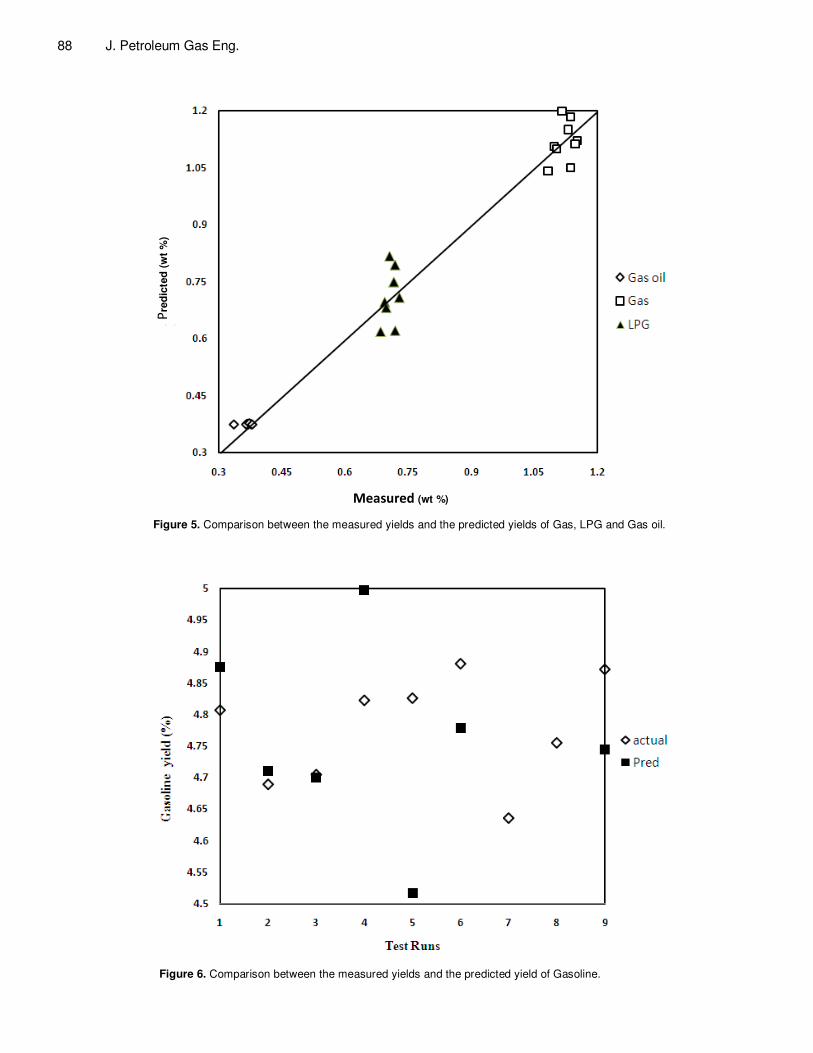
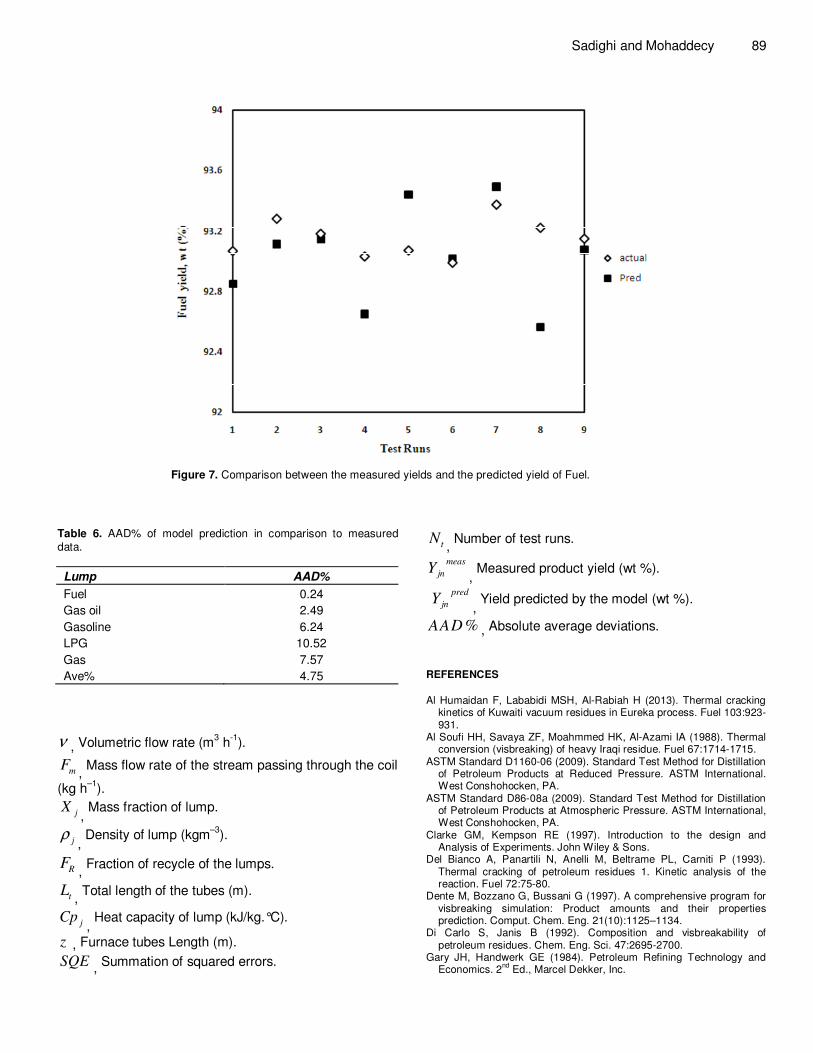
Figures 5, 6 and 7 show the comparison between the measured and predicted product yields. As it can be observed, acceptable mappings are realized.
The AAD% of all lumps is presented in Table 6. As it can be observed, the simulated yields for the nine commercial data, for the vacuum residue, fuel, gas oil and gasoline are in good agreement with the actual data. It was supposed that the observed deviation was caused by assuming the average density for the VGO feed and visbreaking products (Equation 17) reported in Table 4, and also some fluctuations in the property of the feed (such as sulfur, nitrogen and aromatic contents) and also reactor pressure which were not included in the model. Furthermore, we cannot neglect the possibility of error measurements in gathering data obtained with some faults such as signal transmission, calibration and power fluctuation.
It was thought that the high AAD% for the LPG and gas lumps were for the reason of the difficulty of their measurement in the commercial unit, creating large gross error. In addition, there are existed several vents in the
Sadighi and Mohaddecy 87 gas system for which flow rates were not reported in the test runs. Because, the yield of these lumps, especially LPG and gas, were low, a little deviation could make a flagrant AAD%.
Conclusions In this research, a six-lump kinetic model for a commercial vacuum residue visbreaker was proposed. The model consists of vacuum residue, fuel oil, gas oil, gasoline, LPG and light gas as the discrete lumps. Nine sets of industrial data gathered from a soaker-visbreaking unit were used to estimate the apparent activation energies and frequency factors. For the modeling of the visbreaking furnace, it was supposed that there was an equal heat flux throughout the furnace to satisfy the overall heat balance. Moreover, the furnace and soaker drum were simulated as a plug ideal flow and a completely mixed reactors, respectively.
Product yields predicted by this model showed a good agreement with commercial test runs with an absolute average deviation of about 4.75%. Results confirmed that the prediction was more accurate for heavy products than the light ones (gas and LPG). It was thought that the reason for higher deviation of gas and LPG was probably difficulties in measuring these gaseous flows.
Nomenclature
V , Vacuum residue lump.
F , Fuel lump.
D , Gas oil lump.
N , Gasoline lump.
LPG , LPG lump.
G , Light gas lump.
k , Rate constant (m3 h
-1 m
-3cat.).
0k, Frequency factor (m
3 h
-1 m
-3cat.).
E , Activation energy (kcal/mol).
T , Absolute temperature (K).
R , Ideal gas constant (kcal kmol–1
K–1
). j , All products lighter than the vacuum residue lump.
'j , All products lighter than the fuel lump. ''j All products lighter than the gas oil lump.
'''j , All products lighter than gasoline lump.
r , Reaction rate (kg h–1
m−3
).
C , Lump mass concentration (kgm–3
).
CV,
Coil volume (m3).
DV,
Drum volume (m3).
ρ , Stream density (kg m
-3).
88 J. Petroleum Gas Eng.
Pre
dic
ted
(w
t %
)
Measured (wt %) Figure 5. Comparison between the measured yields and the predicted yields of Gas, LPG and Gas oil.
Figure 6. Comparison between the measured yields and the predicted yield of Gasoline.
Sadighi and Mohaddecy 89
Figure 7. Comparison between the measured yields and the predicted yield of Fuel.
Table 6. AAD% of model prediction in comparison to measured
data.
Lump AAD%
Fuel 0.24
Gas oil 2.49
Gasoline 6.24
LPG 10.52
Gas 7.57
Ave% 4.75
ν , Volumetric flow rate (m
3 h
-1).
mF,
Mass flow rate of the stream passing through the coil
(kg h–1
).
jX
, Mass fraction of lump.
jρ
, Density of lump (kgm
–3).
RF,
Fraction of recycle of the lumps.
tL,
Total length of the tubes (m).
jCp
, Heat capacity of lump (kJ/kg.°C).
z , Furnace tubes Length (m).
SQE,
Summation of squared errors.
tN,
Number of test runs.
meas
jnY,
Measured product yield (wt %).
pred
jnY,
Yield predicted by the model (wt %).
%AAD , Absolute average deviations.
REFERENCES
Al Humaidan F, Lababidi MSH, Al-Rabiah H (2013). Thermal cracking
kinetics of Kuwaiti vacuum residues in Eureka process. Fuel 103:923-931.
Al Soufi HH, Savaya ZF, Moahmmed HK, Al-Azami IA (1988). Thermal conversion (visbreaking) of heavy Iraqi residue. Fuel 67:1714-1715.
ASTM Standard D1160-06 (2009). Standard Test Method for Distillation of Petroleum Products at Reduced Pressure. ASTM International. West Conshohocken, PA.
ASTM Standard D86-08a (2009). Standard Test Method for Distillation of Petroleum Products at Atmospheric Pressure. ASTM International, West Conshohocken, PA.
Clarke GM, Kempson RE (1997). Introduction to the design and Analysis of Experiments. John Wiley & Sons.
Del Bianco A, Panartili N, Anelli M, Beltrame PL, Carniti P (1993). Thermal cracking of petroleum residues 1. Kinetic analysis of the reaction. Fuel 72:75-80.
Dente M, Bozzano G, Bussani G (1997). A comprehensive program for visbreaking simulation: Product amounts and their properties prediction. Comput. Chem. Eng. 21(10):1125–1134.
Di Carlo S, Janis B (1992). Composition and visbreakability of petroleum residues. Chem. Eng. Sci. 47:2695-2700.
Gary JH, Handwerk GE (1984). Petroleum Refining Technology and Economics. 2
nd Ed., Marcel Dekker, Inc.
90 J. Petroleum Gas Eng. Krishna R, Kuchhal YK, Sarna GS, Singh ID (1988). Visbreaking studies
on Aghajari long residue. Fuel 67:379-383. Montgomery DC (2001). Design and Analysis of Experiments. New
York: John Wiley & Sons. Sadighi S, Ahmad A (2012). An Optimisation Approach for Increasing
the Profit of a Commercial VGO Hydrocracking process. Can. J. Chem. Eng. DOI 10.1002/cjce.21720.
Sadighi S, Ahmad A, Mohaddecy SR (2010a). 6-Lump Kinetic Model for a Commercial Vacuum Gas Oil Hydrocracke. Int. J. Chem Reactor Eng. 8(1):1542-6580.
Sadighi S, Arshad A, Irandoukht A (2010b). Modeling a Pilot Fixed-bed Hydrocracking Reactor via a Kinetic Base and Neuro-Fuzzy Method. J. Chem. Eng. Jap. 43(2):174-185.
Sadighi, S, Arshad A, Irandoukht A (2010c). Kinetic Study on a Commercial Amorphous Hydrocracking Catalyst by Weighted Lumping Strategy. Int. J. Chem. Reactor Eng. 8:A60.
Sawarkar AN, Joshi JB, Pandit AB, Kataria KL, Kulkarni RP, Tandon D, Ram Y, Kumar MM (2007). Petroleum Residue Upgrading via Visbreaking: A Review. Can J. Chem. Eng. 85:1-24.
Shadbahra J, Khosravanib L, Khorasheh F (2011). Development of a
continuous kinetic model for visbreaking reactions. Sci. Iranica. 18(3):465-469.
Singh J, Kumar S, Garg MO (2012). Kinetic modeling of thermal cracking of petroleum residues: A critique. Fuel Process. Technol. 94(1):131-144.
Speight JG (2006). The Chemistry and Technology of Petroleum. 4th
ed., CRC Press. Trauth DM, Yasar M, Neurock M, Nasigam A, Klein M, Kukes SG
(1992). Asphaltene and Resid Pyrolysis: Effect of Reaction Environment. Fuel Sci. Technol. Int. 10(7):1161-1179.
Xiao J, Wang L, Chen Q, Wang D (2002). Modeling for Product Distribution in Thermal conversion of Heavy Oil. Pet. Sci. Technol. 20(5):605-612.