modeling of lithology and hydraulic conductivity of shallow sediments from resistivity measurements,...
TRANSCRIPT
This article was downloaded by: [Prof. Hilmi S. Salem]On: 19 April 2012, At: 04:10Publisher: Taylor & FrancisInforma Ltd Registered in England and Wales Registered Number: 1072954Registered office: Mortimer House, 37-41 Mortimer Street, London W1T 3JH,UK
Energy SourcesPublication details, including instructions for authorsand subscription information:http://www.tandfonline.com/loi/ueso19
Modelling of Lithology andHydraulic Conductivity ofShallow Sediments fromResistivity Measurements UsingSchlumberger Vertical ElectricSoundingsHilmi S. Salem
Available online: 29 Oct 2010
To cite this article: Hilmi S. Salem (2001): Modelling of Lithology and HydraulicConductivity of Shallow Sediments from Resistivity Measurements Using SchlumbergerVertical Electric Soundings, Energy Sources, 23:7, 599-618
To link to this article: http://dx.doi.org/10.1080/00908310119202
PLEASE SCROLL DOWN FOR ARTICLE
Full terms and conditions of use: http://www.tandfonline.com/page/terms-and-conditions
This article may be used for research, teaching, and private study purposes.Any substantial or systematic reproduction, redistribution, reselling, loan,sub-licensing, systematic supply, or distribution in any form to anyone isexpressly forbidden.
The publisher does not give any warranty express or implied or make anyrepresentation that the contents will be complete or accurate or up todate. The accuracy of any instructions, formulae, and drug doses should beindependently verified with primary sources. The publisher shall not be liablefor any loss, actions, claims, proceedings, demand, or costs or damages
whatsoever or howsoever caused arising directly or indirectly in connectionwith or arising out of the use of this material.
Dow
nloa
ded
by [
Prof
. Hilm
i S. S
alem
] at
04:
10 1
9 A
pril
2012
Modelling of Lithology and Hydraulic Conductivity ofShallow Sediments from Resistivity MeasurementsUsing Schlumberger Vertical Electric Soundings
HILMI S. SALEM
Atlantic Geo-Technology
Halifax, Nova Scotia, Canada
The vertical electric soundings (VES) technique has been eVectively used for severalpurposes related to investigations of surface soils and shallow sediments. Theseinclude detection of subsurface lithology, structures, stratiWcation, and dippinglayers; evaluation of physical properties that govern Xuid Xow and electric-currentconduction; delineation of aquifers; assessment of engineering-site properties (suchas pore-water saturation and clay content); and mapping various environmentalproblems (such as saline-water intrusion, groundwater contamination, and leachatetransport through porous media). In this study, Schlumberger VES-measurements,along with borehole and experimental data, were employed to image laminations,layering, and lithology of surface soils and subsurface aeration and saturated zonesof glacial sediments; and to model the electric resistivity and hydraulic conductivityvariations with depth and lithology. It is shown that the VES-technique can provide asubstantial improvement in the resolution of thin laminations within thick layers andcan also provide a good assessment of the hydraulic conductivity, water Xux, andwater movement. Numerous references, dealing with a wide range of VES-applica-tions for several purposes, were reviewed and cited in this study.
Keywords VES, applications, surface soils, aeration zone, aquifer, lithology,electric resistivity, hydraulic conductivity, water ¯ ux and movement, layering,laminations
Introduction
Applications of Vertical Electric Soundings ( VES) Technique
For several decades, the vertical electric soundings (VES) technique has been eŒec-
tively used in surveying several targets related to surface soils and subsurface shallow
sediments. These include mapping lithology, clay content, and structures; delineating
aquifers; assessing seepage; monitoring underground for engineering purposes;
understanding mechanisms and interactions of electric-current conduction and
hydraulic ¯ ow; detecting anisotropy; monitoring high potential zones; mapping
low/high salinity zones for agricultural development; and evaluating environmental
problems. Following is a brief review of several studies carried out to investigate
diŒerent targets related to surface soils and shallow sediments, for which VES (with
or without other geophysical and hydrogeological techniques) was applied.
599
Energy Sources, 23:599 ± 618, 2001
Copyright # 2001 Taylor & Francis
0090-8312 /01 $12.00 ‡ .00
Received 30 May 2000; accepted 17 July 2000.Address correspondence to Hilmi S. Salem, Atlantic Geo-Technology, Suite 307, 26
Alton Drive, Halifax, Nova Scotia, Canada, B3N 1L9. E-mail: [email protected]
Dow
nloa
ded
by [
Prof
. Hilm
i S. S
alem
] at
04:
10 1
9 A
pril
2012
Lithology, Clay Content, and Clay Deposits
Barker and Worthington (1973a), Frohlich (1973), Worthington (1976a, 1977a),Urish (1983), and Mazac et al. (1985) mapped variations in grain size, porosity,
and clay content. Biella and Tabbacco (1981) and Biella et al. (1983) investigated
variations in grain shape and degree of cementation. Meheni et al. (1996) and
Nowroozi et al. (1997) investigated subsurface layering and lithology. Hosain et al.
(1999) mapped thick layers of clay deposits.
Groundwater Exploration and Aquifer Delineation
Kui and Huisheng (1990) conducted tens of thousands of VES-pro® les to
delineate wide extended fresh- and saline-water aquifers in China. Frohlich
(1974), Worthington (1977b) , Kauahikaua (1986), Dodds and Ivic (1990),
Sandberg and Hall (1990), Schwarz (1990), Schneider et al. (1993), and Yadavet al. (1997) investigated aquifers and their characteristics and mapped depth of
bedrock.
Geotechnology , Subsurface Structures, ArtiWcial InWltration, and Archaeology
Ogilvy et al. (1969), Llopis et al. (1988), and Butler and Llopis (1990) assessedgeotechnical sites of anomalous seepage by detecting and mapping seepage paths
and monitoring changes in conditions as a function of time. Bristow (1966), Dey and
Morrison (1979), Barker (1981), Moore and Stewart (1983) , Butler (1984), Acworth
and Gri� ths (1985), Raiche et al. (1985), Barker (1988), Taylor and Fleming (1988),
Stewart and Wood (1990), and Pous et al. (1996) mapped subsurface structures (suchas fracture zones, joints, and cavities) in sandstones and carbonates. Subsurface
structures usually generate low resistivity anomalies because they serve as active
¯ ow conduits or because they are ® lled in some cases with clays and other conducting
materials. The VES-technique has also proved to be eŒective in monitoring arti® cial
in® ltration through porous media (Cahyna, 1990) and in investigating archaeologicalsites (Panissod et al., 1997).
Electric Current and Hydraulic Flow Interactions
Researchers have investigated mechanisms of electric-current conduction and
hydraulic ¯ ow by determining petrophysical and hydrophysical properties ofporous media. They obtained, for example, increasing and decreasing relationships
between electric resistivity and hydraulic conductivity. This paradox is due to vari-
ations in lithology; mineralogy, size, and shape of grains; pore-water salinity; clay
content; and porosity (Buhle and Brueckman, 1964; Zohdy, 1969; Barker and
Worthington, 1973a; Bose et al., 1973; Worthington, 1975, 1976b; Kelly, 1977;Heigold et al., 1979; Mazac and Landa, 1979; Kosinski and Kelly, 1981; Urish,
1981; Leonard-Mayer, 1984; Kelly, 1985; Mazac et al., 1985; Niwas and Singhal,
1985; Huntley, 1986; Worthington, 1986; Mazac et al., 1988, 1990a; Yaramanci and
Flach, 1992; Yadav, 1995; Lile et al., 1997).
600 H. S. Salem
Dow
nloa
ded
by [
Prof
. Hilm
i S. S
alem
] at
04:
10 1
9 A
pril
2012
Anisotropy
Nobes et al. (1990) correlated the formation resistivity factor to anisotropy of layersand cementation of grains in order to evaluate the seismic risk of unconsolidated
sediments. Other researchers investigated the anisotropy in¯ uence on transmission of
electric current and hydraulic ¯ ow through porous media, as a result of variations of
physical and lithological properties in the horizontal and vertical directions of
layered media or due to dipping of layers and presence of fractures (Zohdy, 1965;Singh and Singh, 1970; Habberjam, 1972; Barker and Worthington, 1973b; Hab-
berjam, 1975; Worthington, 1976b; Campbell, 1977; Schimschal, 1981; Urish, 1981;
Nunn et al., 1983; Kelly and Reiter, 1984; Matias and Habberjam, 1984; Ritzi and
Andolsek, 1992; Sauck and Zabik, 1992; Bolshakov et al., 1995; Loke and Barker,
1995; Li and Uren, 1997; Salem 1999; Watson and Barker, 1999).
High Potential Zones
The VES-technique has also been successfully used to evaluate the hydraulic trans-
missivity in relation to the electric transverse resistance in order to map high poten-tial zones within porous media (Duprat et al., 1970; Scaracia, 1976; Mazac and
Landa, 1979; Niwas and Singhal, 1981; Singhal and Niwas, 1983; Ponzini et al.
1984; Frohlich and Kelly, 1985; Niwas and Singhal, 1985; Yadav and Abolfazli,
1998; Salem, 1999).
Agriculture and Pedology
Researchers have also used the VES-technique to investigate high salinity zones of
surface soils and shallow sediments in order to provide solutions for salinization
problems that seriously aŒect farmlands, especially in arid and semi-arid regions.
Salinization problems resulting from high evaporation rates that lead to enrichment
of salt minerals have caused a great loss of huge agricultural areas. If the salinizationprocesses are understood, the problems of salinization can be relatively contained by
using appropriate land-management practices. Several VES-surveys were conducted
to assess soil systems and high salinity of farmlands and to implement hydrological
and engineering solutions for land reclamation (Roy and Elliot, 1980; Street andEngel, 1988; West and Linford, 1988; Humphreys et al., 1990; Street and Engel,
1990; Robian et al., 1996).
Environment
Nowadays, the environmental problems aŒecting, in particular, aquifers and their
water storage, as a result of high salinization and contamination and lowering of
water level, are very serious ones. For example, in their hydrogeological study on the
very high rate of groundwater salinization in the Gaza Strip, Yakirevich et al. (1998)
indicated that the Gaza Strip aquifer system is greatly salinized and the salinizationproblem has increased. The over-exploitation of groundwater from this coastal
aquifer and the very low rate of annual recharge have forced the Mediterranean
Sea water to intrude, easily and rapidly, into the aquifer system. Analysis based on
numerical simulation and sample tests showed that the rate of salt water intrusion
Modelling of Lithology and Hydraulic Conductivity Using VES 601
Dow
nloa
ded
by [
Prof
. Hilm
i S. S
alem
] at
04:
10 1
9 A
pril
2012
into the Gaza Strip aquifer is expected, during the next few years (until 2006), to be
20± 45 m/yr (Yakirevich et al., 1998).For such severe salinization problems and others of less impact, the VES-tech-
nique has shown to be very eŒective. The VES-technique is of direct advantage in
aquifers’ protection because it provides a substantial evaluation of hydrological and
petrophysical properties. The VES-technique has been widely used in mapping fresh
water± salt water interface and salt water intrusion and in monitoring bodies of saline
groundwater (Swartz, 1937; Flathe, 1955, 1967; Van Dam and Meulenkamp, 1967;Zohdy, 1969; Monkhouse and Fleet, 1975; Bugg and Lloyd, 1976; Gorhan, 1976;
Henriet, 1976; Bisdorf and Zohdy, 1979; Barker, 1981; Fretwell and Stewart, 1981;
Gri� ths et al., 1981; Barker, 1982; Tellam et al., 1985; Kauahikaua, 1986; Mazac
et al., 1987; Seara and Granda, 1987; Barker, 1990a; Hagemeyer and Stewart, 1990;
Salem, 1995).On the other hand, the VES-technique has been successfully used to locate
subsurface contaminated zones. Stollar and Roux (1975) and Barker (1990b) delin-
eated locations of contaminant plume around land® lls and spoil tips. Skuthan et al.
(1979) and Mazac et al. (1990b) used VES to select locations of dumps and to detect
perforations in the dumps’ sealing in order to avoid contamination problems thatmay aŒect the groundwater and its surrounding geological environment. Urish
(1984) mapped high levels of groundwater mineralization caused by nuclear-waste
deposits aŒecting glacial aquifers. Mazac et al. (1990c) and Benson et al. (1997)
mapped the extent of groundwater contamination caused by oil migration.
Cahyna et al. (1990) mapped the extent of land® ll slag-type materials containing
cyanide complexes that migrate and contaminate groundwater. Ross et al. (1990)investigated underlying clay layers of a large number of old land® lls and chemical-
and industrial-waste disposal sites and detected vertical and lateral migration of
waste ¯ uids. LaBrecque et al. (1984), Davis et al. (1988), Buselli et al. (1988,
1990), Hagrey (1992), Daily et al. (1995), De Lima et al. (1995), Osiensky and
Donaldson (1995), Cardarelli and Bernabini (1997), Liu and Cheng (1997), Osiensky(1997), and Daily et al. (1998) mapped subsurface and groundwater contamination
caused by transport of industrial contaminants and land® ll-waste leachates. Slater
et al. (1997) conducted cross-borehole electric imaging during migration processes
of saline-water tracer to investigate ® eld-scale transport in unsaturated zones.
Hagrey and Michaelsen (1999) mapped water and solute movement in the vadosezone of highly heterogeneous soils in order to detect transport and migration of
contaminants.
Further details on the theory and applications of the VES-technique, as well as
the electric properties and their relations to the hydraulic ¯ ow through porous
media, are given in Maillet (1947), Keller and Frischknecht (1966), Kunetz (1966),
Keller (1967), Battacharya and Patra (1968), Astier (1971), Plotnikov (1972), Zohdyet al. (1974), Telford et al. (1976), Koefoed (1980), McNeill (1980), Keller (1982), De
Marsily (1986), Ward (1990a,b,c), Burger et al. (1992), Kelly and Mares (1993),
Zhdanov and Keller (1994), Reynolds (1997), Fang (1998), Hallenburg (1998a,b),
SchoÈ n (1998), and Sharma (1998).
Study Area
The study area, in the Segeberger forest (northern Germany), shows less than 1 m
diŒerence in topography. The altitude of the forest ranges, in general, from 25 to
602 H. S. Salem
Dow
nloa
ded
by [
Prof
. Hilm
i S. S
alem
] at
04:
10 1
9 A
pril
2012
65 m above sea level. The area receives annual precipitation of 800 mm/yr, distrib-
uted as 500 mm evaporation, 60 mm runoŒ, and 240 mm in® ltration, recharging theaquifer system (Einsele & Schultz, 1973). The sediments of the area are characterized
by a high degree of heterogeneity, both laterally and vertically. These Pleistocene-
glacially originated sediments are composed of gravels, sands, and silts, with a small
fraction of clays. They have wide ranges of grain sizes and shapes and a variety of
mineralogical compositions.
In this study, VES-measurements were conducted to assess the electric resistivityvariations with lithology and depth; delineate the aquifer’s thickness and depth;
monitor the layering and laminations; evaluate the hydraulic conductivity of the
surface soils, the aeration zone, and the body of the aquifer; and evaluate the
aquifer’s potential and the water movement through the subsurface.
Methodology
Field Measurements
The apparent resistivity (Ra, in «.m) was measured using a GGA-30 equipment. This
equipment consists of a power unit (GGA-30L), measuring the low frequency direct
current `̀ DC’ ’ (I, in ampere), and a potentiometer unit (GGA-30M), measuring thepotential diŒerence (V, in volt). Both units were assembled in two separate hard
plastic cases to eliminate the humidity eŒect. Nonpolarizable electrodes were used to
minimize the polarization eŒect caused by the movement of charged particles (ions)
through the pore spaces towards the current electrodes. These ions usually tend to
inhibit the electric-current conduction and thus aŒect the measurements.
Modelling of Lithology and Hydraulic Conductivity Using VES 603
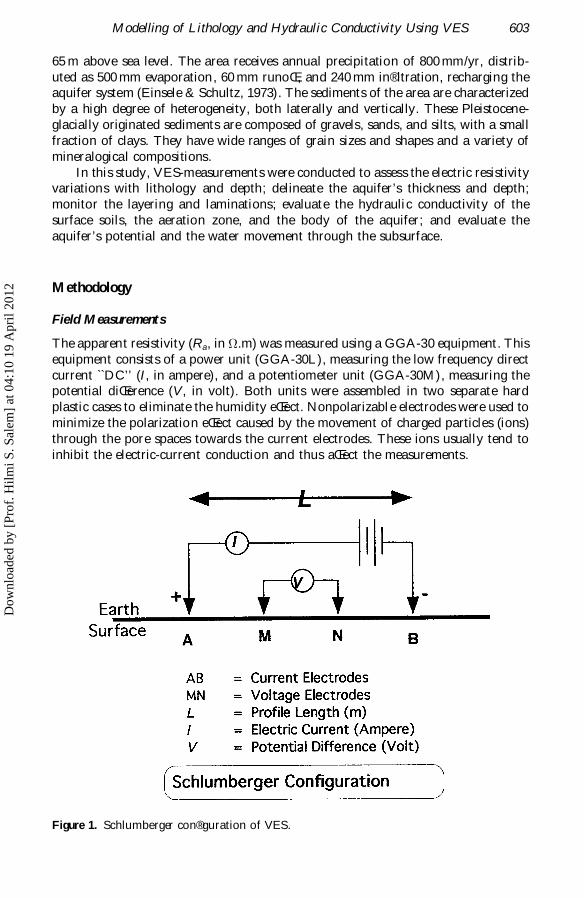
Figure 1. Schlumberger con® guration of VES.
Dow
nloa
ded
by [
Prof
. Hilm
i S. S
alem
] at
04:
10 1
9 A
pril
2012
The Schlumberger con® guration (array) was used for four electrodes (AMNB)
were located along a straight line (L; pro® le length) (Figure 1). The current (I) wasdriven through one pair of the electrodes (A and B), and the potential diŒerence (V)
was measured with the other pair of the electrodes (M and N). The apparent resis-
tivity (Ra) was obtained as the ratio of V to I, using a proportionality factor (known
as the geometrical coe� cient µ) which depends on the array’s geometrical arrange-
ment. Mathematically, the Schlumberger arrangement (Figure 1) can be expressed as
follows:
V ˆ µ…IR†=2º …1†
which leads to
V ˆ …IR=2º†‰f…1=AM† ¡ …1=BN†g ¡ f…1=AN† ¡ …1=BN†gŠ …2†
which leads to
R ˆ º…V=I†‰f…AB=2†2 ¡ …MN=2†2g=MNŠ …3†
The measured electric resistivity (R) (Equations 1± 3) is apparent resistivity sinceit re¯ ects the average resistivity confronting the current conducted through a hetero-
geneous medium that consists of several layers. If the medium is homogeneous,
isotropic, and semi-in® nite, then the measured resistivity is the true one.
The electric pro® les conducted for the area ranged in length (L) from 120 to 200
m, crossing each other. Several trials (diŒerent individual measurements) were car-ried out for each pro® le in order to choose the best reading of the apparent resistivity
(Ra), which lies between the maximum and minimum values of each reading. This
procedure (choosing the best reading) helped to eliminate the errors which might be
produced during the survey due to geological, physical, and/or technical in¯ uences.
These in¯ uences can generally be caused by any dipping of the subsurface layers,alteration of thick and thin layers (macro- and micro-anisotropy) , intercalation of
diŒerent grain sizes and shapes, presence of water pipes and electric cables, electro-
lytic (ionic) eŒects, and/or shifts in the array from the ideal position. If any of these
in¯ uences exists, the value of the geometrical factor, µ, will be aŒected and thus the
measured resistivity will also be aŒected.
Analysis
The two components of the VES-measurements (apparent resistivity (Ra) and half
electrode spacing (AB/2)) were analyzed using three iterative computer programs
based on calculating the total kernel function (Zohdy, 1973, 1974; Last, 1980). TheZohdy (1973) program and the Last (1980) program have the ability to invert Ra and
AB/2 into true resistivities (Rt) and corresponding thicknesses (h) of the subsurface
layers (i± n). The Zohdy (1974) program was used as a reversal technique to trans-
form Rt and h into Ra and AB/2 in order to adjust the VES-data and to cancel any
disturbing readings.The advantage of the Zohdy (1973) program lies in the fact that it yields
an approximately true resistivity, thickness, and depth of each layer monitored
by the array. The program originally gives a detailed model (DM) consisting of
several thin laminations (as many as the soundings points). Then the DM is trans-
604 H. S. Salem
Dow
nloa
ded
by [
Prof
. Hilm
i S. S
alem
] at
04:
10 1
9 A
pril
2012
formed into a reduced (equivalent) model (RM). According to the principle of
equivalence, a reduced model composed, for example, of three layers is equivalent
to a detailed model composed of a greater number of layers, especially when the
error value is 2% or less (Zohdy, 1989). The error value represents the diŒerence
between the observed (measured) resistivity (Ra) and the modelled (calculated) resis-
tivity (Rm) for each sounding point. The Last (1980) program needs an initial model
that consists of resistivity and thickness of each layer. The Last program then
extrapolates the initial model by iterating the observed resistivities. The iteration
process continues until a small, or no, discrepancy between the observed and calcu-
lated resistivities is reached and until a smoothed, best-® tting curve (calculated
curve) is obtained.
The Zohdy (1973) program diŒers from the Last (1980) program in that its
iterative procedure is fully automatic, i.e., without any control from the interpreter.
In addition, unlike the Last program, the Zohdy program does not require an initial
model. It also gives detailed and reduced models of the resistivities, thicknesses, and
depths of the layers. On the other hand, unlike the Las program, the Zohdy program
does not provide a curve of the resistivity versus the half electrode spacing. In view of
these diŒerences between both programs, the Zohdy (1973) program was originally
used to obtain a reduced model that was introduced into the Last (1980) program.
This procedure was done in order to obtain the best solution of the resistivities,
thicknesses, and depths of the monitored layers and to obtain the ® nal smoothed
and best ® tting curves. A range of error values of 0.2± 1.5% , which is less than the
allowed value (2% ), was obtained. An example of the observed resistivity (Ra),
obtained from four trials, and the modelled resistivity (Rm), along with the error
Modelling of Lithology and Hydraulic Conductivity Using VES 605
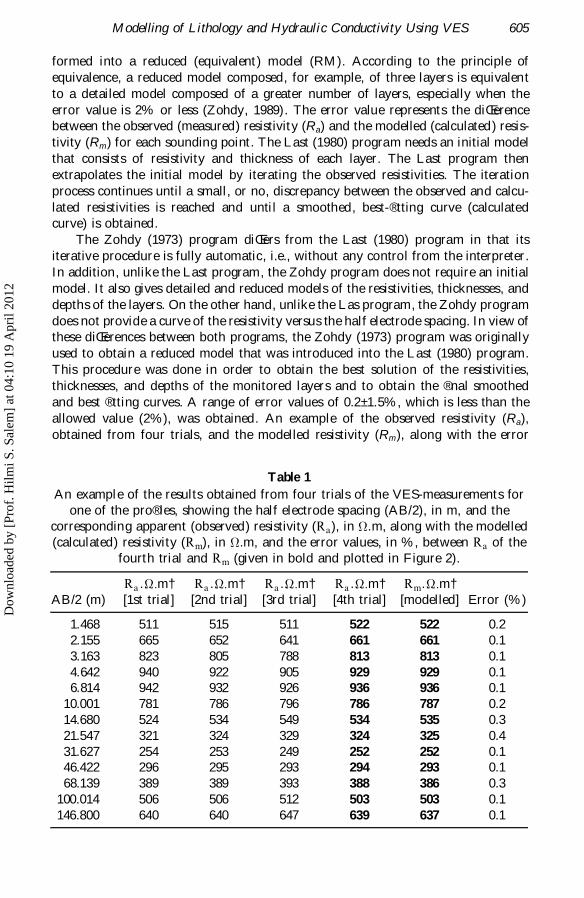
Table 1
An example of the results obtained from four trials of the VES-measurements for
one of the pro® les, showing the half electrode spacing (AB/2), in m, and the
corresponding apparent (observed) resistivity (Ra), in «.m, along with the modelled
(calculated) resistivity (Rm), in «.m, and the error values, in % , between Ra of the
fourth trial and Rm (given in bold and plotted in Figure 2).
Ra…«:m† Ra…«:m† Ra…«:m† Ra…«:m† Rm…«:m†AB/2 (m) [1st trial] [2nd trial] [3rd trial] [4th trial] [modelled] Error (% )
1.468 511 515 511 522 522 0.2
2.155 665 652 641 661 661 0.1
3.163 823 805 788 813 813 0.1
4.642 940 922 905 929 929 0.16.814 942 932 926 936 936 0.1
10.001 781 786 796 786 787 0.2
14.680 524 534 549 534 535 0.3
21.547 321 324 329 324 325 0.4
31.627 254 253 249 252 252 0.146.422 296 295 293 294 293 0.1
68.139 389 389 393 388 386 0.3
100.014 506 506 512 503 503 0.1
146.800 640 640 647 639 637 0.1
Dow
nloa
ded
by [
Prof
. Hilm
i S. S
alem
] at
04:
10 1
9 A
pril
2012
values and the half electrode spacing (AB/2), are given in Table 1 and plotted in
Figure 2.
Results and Discussion
Electric Resistivity
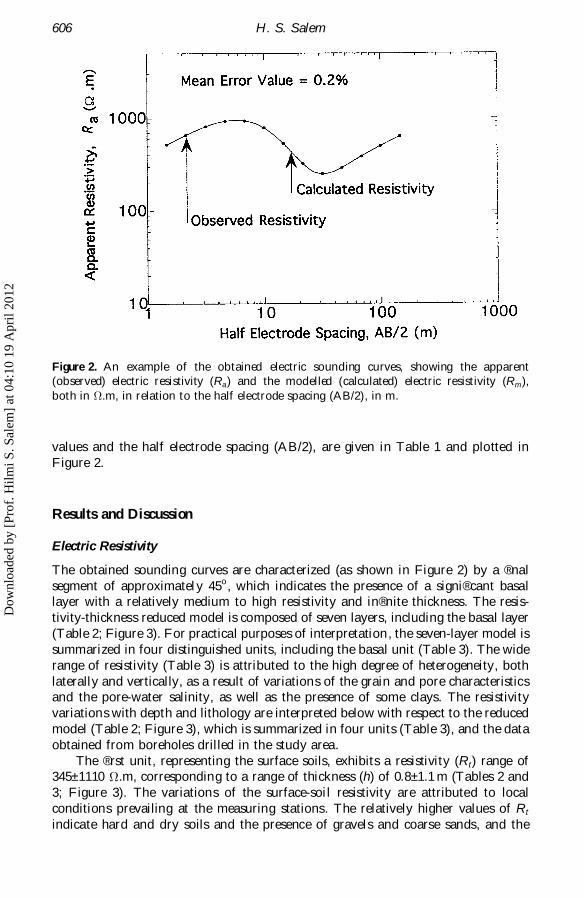
The obtained sounding curves are characterized (as shown in Figure 2) by a ® nal
segment of approximately 45o, which indicates the presence of a signi® cant basallayer with a relatively medium to high resistivity and in® nite thickness. The resis-
tivity-thickness reduced model is composed of seven layers, including the basal layer
(Table 2; Figure 3). For practical purposes of interpretation, the seven-layer model is
summarized in four distinguished units, including the basal unit (Table 3). The wide
range of resistivity (Table 3) is attributed to the high degree of heterogeneity, both
laterally and vertically, as a result of variations of the grain and pore characteristicsand the pore-water salinity, as well as the presence of some clays. The resistivity
variations with depth and lithology are interpreted below with respect to the reduced
model (Table 2; Figure 3), which is summarized in four units (Table 3), and the data
obtained from boreholes drilled in the study area.
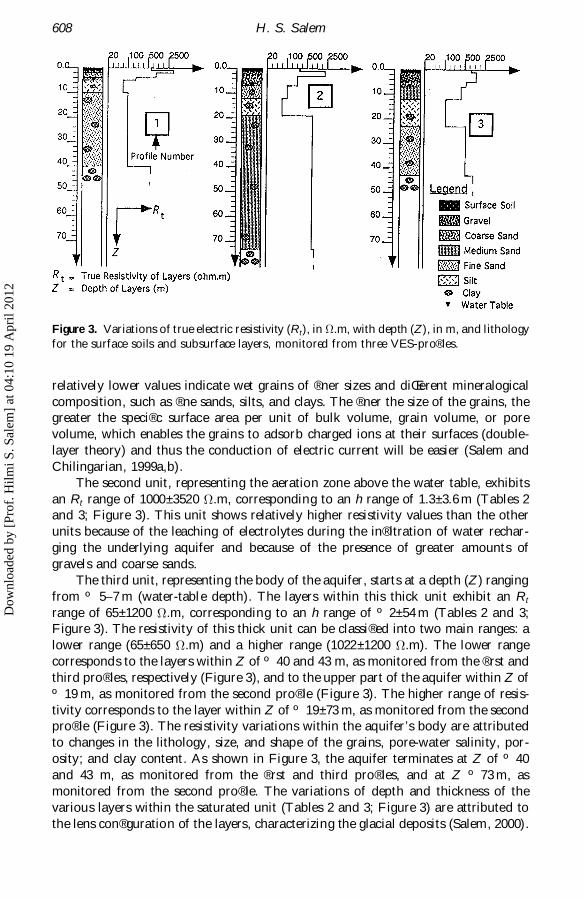
The ® rst unit, representing the surface soils, exhibits a resistivity (Rt) range of345± 1110 «.m, corresponding to a range of thickness (h) of 0.8± 1.1 m (Tables 2 and
3; Figure 3). The variations of the surface-soil resistivity are attributed to local
conditions prevailing at the measuring stations. The relatively higher values of Rt
indicate hard and dry soils and the presence of gravels and coarse sands, and the
606 H. S. Salem
Figure 2. An example of the obtained electric sounding curves, showing the apparent
(observed) electric resistivity (Ra) and the modelled (calculated) electric resistivity (Rm),
both in «.m, in relation to the half electrode spacing (AB/2), in m.
Dow
nloa
ded
by [
Prof
. Hilm
i S. S
alem
] at
04:
10 1
9 A
pril
2012
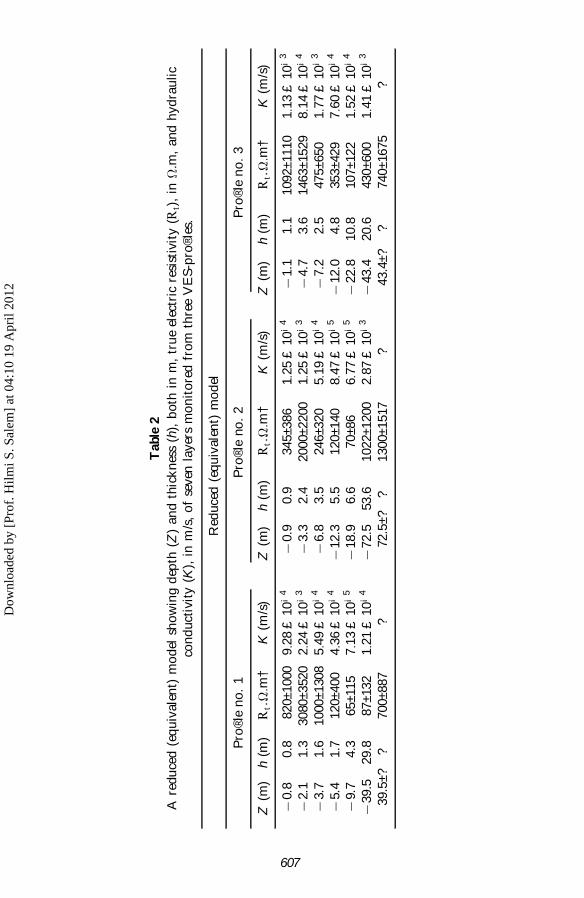
Table
2
Are
du
ced
(eq
uiv
ale
nt)
mo
del
sho
win
gd
epth
(Z)
an
dth
ick
nes
s(h
),b
oth
inm
,tr
ue
elec
tric
resi
stiv
ity
(Rt)
,in
«.m
,and
hyd
rau
lic
con
duct
ivit
y(K
),in
m/s
,o
fse
ven
layer
sm
on
ito
red
fro
mth
ree
VE
S-p
ro®
les.
Red
uce
d(e
qu
ivale
nt)
mo
del
Pro
®le
no
.1
Pro
®le
no
.2
Pro
®le
no
.3
Z(m
)h
(m)
Rt… «
:m†
K(m
/s)
Z(m
)h
(m)
Rt… «
:m†
K(m
/s)
Z(m
)h
(m)
Rt… «
:m†
K(m
/s)
70.8
0.8
820±1000
9:2
8£
10
¡4
70.9
0.9
345±386
1:2
5£
10
¡4
71.1
1.1
1092±1110
1:1
3£
10
¡3
72.1
1.3
3080±3520
2:2
4£
10
¡3
73.3
2.4
2000±2200
1:2
5£
10
¡3
74.7
3.6
1463±1529
8:1
4£
10
¡4
73.7
1.6
1000±1308
5:4
9£
10
¡4
76.8
3.5
246±320
5:1
9£
10
¡4
77.2
2.5
475±650
1:7
7£
10
¡3
75.4
1.7
120±400
4:3
6£
10
¡4
712.3
5.5
120±140
8:4
7£
10
¡5
712.0
4.8
353±429
7:6
0£
10
¡4
79.7
4.3
65±115
7:1
3£
10
¡5
718.9
6.6
70±86
6:7
7£
10
¡5
722.8
10.8
107±122
1:5
2£
10
¡4
739.5
29.8
87±132
1:2
1£
10
¡4
772.5
53.6
1022±1200
2:8
7£
10
¡3
743.4
20.6
430±600
1:4
1£
10
¡3
39.5
±?
?700±887
?72.5
±?
?1300±1517
?43.4
±?
?740±1675
?
607
Dow
nloa
ded
by [
Prof
. Hilm
i S. S
alem
] at
04:
10 1
9 A
pril
2012
relatively lower values indicate wet grains of ® ner sizes and diŒerent mineralogical
composition, such as ® ne sands, silts, and clays. The ® ner the size of the grains, the
greater the speci® c surface area per unit of bulk volume, grain volume, or pore
volume, which enables the grains to adsorb charged ions at their surfaces (double-
layer theory) and thus the conduction of electric current will be easier (Salem and
Chilingarian, 1999a,b).
The second unit, representing the aeration zone above the water table, exhibits
an Rt range of 1000± 3520 «.m, corresponding to an h range of 1.3± 3.6 m (Tables 2
and 3; Figure 3). This unit shows relatively higher resistivity values than the other
units because of the leaching of electrolytes during the in® ltration of water rechar-
ging the underlying aquifer and because of the presence of greater amounts of
gravels and coarse sands.
The third unit, representing the body of the aquifer, starts at a depth (Z) ranging
from º 5–7 m (water-table depth). The layers within this thick unit exhibit an Rt
range of 65± 1200 «.m, corresponding to an h range of º 2± 54 m (Tables 2 and 3;
Figure 3). The resistivity of this thick unit can be classi® ed into two main ranges: a
lower range (65± 650 «.m) and a higher range (1022± 1200 «.m). The lower range
corresponds to the layers within Z of º 40 and 43 m, as monitored from the ® rst and
third pro® les, respectively (Figure 3), and to the upper part of the aquifer within Z of
º 19 m, as monitored from the second pro® le (Figure 3). The higher range of resis-
tivity corresponds to the layer within Z of º 19± 73 m, as monitored from the second
pro® le (Figure 3). The resistivity variations within the aquifer’s body are attributed
to changes in the lithology, size, and shape of the grains, pore-water salinity, por-
osity; and clay content. As shown in Figure 3, the aquifer terminates at Z of º 40
and 43 m, as monitored from the ® rst and third pro® les, and at Z º 73 m, as
monitored from the second pro® le. The variations of depth and thickness of the
various layers within the saturated unit (Tables 2 and 3; Figure 3) are attributed to
the lens con® guration of the layers, characterizing the glacial deposits (Salem, 2000).
608 H. S. Salem
Figure 3. Variations of true electric resistivity (Rt), in «.m, with depth (Z), in m, and lithology
for the surface soils and subsurface layers, monitored from three VES-pro® les.
Dow
nloa
ded
by [
Prof
. Hilm
i S. S
alem
] at
04:
10 1
9 A
pril
2012
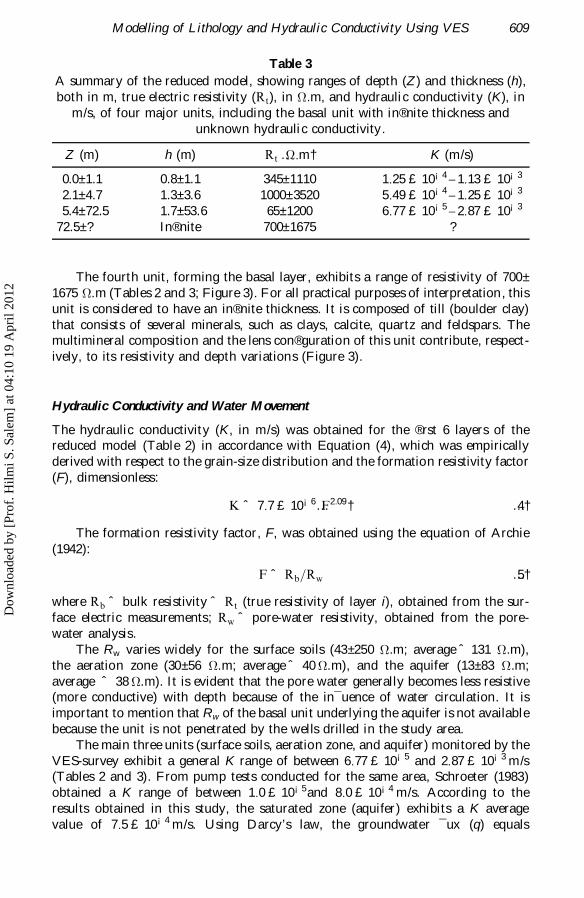
The fourth unit, forming the basal layer, exhibits a range of resistivity of 700±
1675 «.m (Tables 2 and 3; Figure 3). For all practical purposes of interpretation, this
unit is considered to have an in® nite thickness. It is composed of till (boulder clay)
that consists of several minerals, such as clays, calcite, quartz and feldspars. Themultimineral composition and the lens con® guration of this unit contribute, respect-
ively, to its resistivity and depth variations (Figure 3).
Hydraulic Conductivity and Water Movement
The hydraulic conductivity (K, in m/s) was obtained for the ® rst 6 layers of thereduced model (Table 2) in accordance with Equation (4), which was empirically
derived with respect to the grain-size distribution and the formation resistivity factor
(F), dimensionless:
K ˆ 7:7 £ 10¡6…F2:09† …4†
The formation resistivity factor, F, was obtained using the equation of Archie
(1942):
F ˆ Rb=Rw …5†
where Rb ˆ bulk resistivity ˆ Rt (true resistivity of layer i), obtained from the sur-
face electric measurements; Rw ˆ pore-water resistivity, obtained from the pore-
water analysis.
The Rw varies widely for the surface soils (43± 250 «.m; average ˆ 131 «.m),
the aeration zone (30± 56 «.m; average ˆ 40 «.m), and the aquifer (13± 83 «.m;
average ˆ 38 «.m). It is evident that the pore water generally becomes less resistive(more conductive) with depth because of the in¯ uence of water circulation. It is
important to mention that Rw of the basal unit underlying the aquifer is not available
because the unit is not penetrated by the wells drilled in the study area.
The main three units (surface soils, aeration zone, and aquifer) monitored by the
VES-survey exhibit a general K range of between 6:77 £ 10¡5 and 2:87 £ 10¡3 m/s(Tables 2 and 3). From pump tests conducted for the same area, Schroeter (1983)
obtained a K range of between 1:0 £ 10¡5and 8:0 £ 10¡4 m/s. According to the
results obtained in this study, the saturated zone (aquifer) exhibits a K average
value of 7:5 £ 10¡4 m/s. Using Darcy’s law, the groundwater ¯ ux (q) equals
Modelling of Lithology and Hydraulic Conductivity Using VES 609
Table 3
A summary of the reduced model, showing ranges of depth (Z) and thickness (h),
both in m, true electric resistivity (Rt), in «.m, and hydraulic conductivity (K), in
m/s, of four major units, including the basal unit with in® nite thickness and
unknown hydraulic conductivity.
Z (m) h (m) Rt …«:m† K (m/s)
0.0± 1.1 0.8± 1.1 345± 1110 1:25 £ 10¡4 – 1:13 £ 10¡3
2.1± 4.7 1.3± 3.6 1000± 3520 5:49 £ 10¡4 – 1:25 £ 10¡3
5.4± 72.5 1.7± 53.6 65± 1200 6:77 £ 10¡5 – 2:87 £ 10¡3
72.5± ? In® nite 700± 1675 ?
Dow
nloa
ded
by [
Prof
. Hilm
i S. S
alem
] at
04:
10 1
9 A
pril
2012
6:7 £ 10¡2 m3 /s and the hydraulic ® lter velocity (or microscopic velocity; vf ) equals
7:5 £ 10¡7 m/s ( º 24 m/yr). If an average value of 0.3 is considered for the aquifer’sporosity (¿), as obtained from the VES-analysis, then the hydraulic distance velocity
(macroscopic velocity; vd) equals 2:5 £ 10¡6 m/s ( º 80 m/yr). By taking into
account the aquifer’ s average thickness (h º 44 m) and the distance velocity
(vd º 80 m/yr ˆ 0.22 m/d), then a drop of water needs º 200 days to cross the aquifer.
Schroeter (1983) experimentally obtained a range of distance velocity, vd, of between
2:32 £ 10¡6 and 5:56 £ 10¡6 m/s (ˆ 73–175 m/yr). Using the K and vd valuesobtained by Schroeter (1983), the travel time needed for a drop of water to cross
the aquifer’s average thickness ( º 44 m) will be between º 92 and 220 days, which
agrees well with the average travel time (200 days) obtained in this study from
surface electric measurements.
Conclusions
The VES technique has been widely and eŒectively used for various applications to
several purposes related to porous media. Over 160 references, including journal arti-
cles, books, reports, conference proceedings, and others, covering several applicationsof VES, as well as electric properties related to hydraulic properties, were reviewed and
cited in this study. Also, results of Schlumberger VES-measurements for surface soils
and shallow sediments were presented and discussed. It was shown that the VES-tech-
nique can provide good assessments of the lithology, physical properties, laminations,
and thicknesses and depths of the surface soils and the subsurface layers. A resistivity-
thickness model composed of seven layers was obtained. The investigated surface soilsand the underlying layers (composed of gravels; coarse, medium, and ® ne sands; silts;
and a small fraction of clays) exhibit a wide range of resistivity (65± 3520 «.m). The
resistivity variations are attributed to the in¯ uences of heterogeneity , both laterally and
vertically, and to the changes in the grain and pore texture and structure, mineralogy of
the grains, clay content, and salinity of the pore water.Using the results obtained from the VES-measurements, a range of the hydraulic
conductivity of between 6:77 £ 10¡5 and 2:87 £ 10¡3 m/s was obtained. This range
corresponds to the whole column of the surface soils, the aeration zone, and the
aquifer. The water ¯ ux and ® lter and distance velocities, as well as the time needed
for the in® ltrated water to cross the aquifer, were also obtained. An average periodof time of about 7 months, with an average microscopic (® lter) velocity of about
24 m/yr and an average macroscopic (distance) velocity of about 80 m/yr, is needed
for the water to cross the aquifer’s average thickness (º 44 m). The rate of water
movement depends on several in¯ uences, such as the aquifer’s thickness (which
varies from one location to another), variations of the lithology, hydraulic gradient,
hydraulic conductivity, and porosity due to variations in the grain and pore char-acteristics. These in¯ uences are particularly important when the sediments are
greatly heterogeneous and the layers are laminated and characterized by lens con-
® guration, as in the case of the present study. The results obtained in this study agree
well with experimental results and borehole measurements.
Nomenclature
F formation resistivity factor (dimensionless)
I electric current (ampere)
610 H. S. Salem
Dow
nloa
ded
by [
Prof
. Hilm
i S. S
alem
] at
04:
10 1
9 A
pril
2012
K hydraulic conductivity (m/s)
L pro® le length (m)
R electric resistivity («.m)
Ra apparent (observed) resistivity («.m)
Rm modelled (calculated) resistivity («.m)
Rt Rb ˆ true (bulk) resistivity of layer i («.m)
Rw pore-water resistivity («.m)
V potential diŒerence (volt)
Z depth of layer i (m)
h thickness of layer i (m)
i–n number of monitored layers from i to n
µ geometrical coe� cient of Schlumberger con® guration (dimensionless)
q water ¯ ux (m3 /s)
vd distance (macroscopic) velocity of water movement (m/s)
vf ® lter (microscopic) velocity of water movement (m/s)
¿ porosity (fraction)
AB spacing of current electrodes (m)
AB/2 half spacing of current electrodes (m)
MN spacing of potential electrodes (m)
AMNB L ˆ line of measurement (m)
DC direct current
DM detailed (primary) model
RM reduced (equivalent) model
VES vertical electric soundings
References
Acworth, R. I., and D. H. Gri� ths. 1985. Simple data processing of tripotential apparent
resistivity measurements as an aid to the interpretation of subsurface structure. Geophys.
Prosp. 33:861 ± 887.
Archie, G. E. 1942. The electrical resistivity log as an aid in determining some reservoir
characteristics. Trans. AIME 146:54± 62.
Astier, J. L. 1971. Geophysique appliquee a l’hydrogeologie. Paris: Masson.
Barker, R. D. 1981. The oŒset system of electrical resistivity sounding and its use with a
multicore cable. Geophys. Prosp. 29:128 ± 143.
Barker, R. D. 1982. Geophysical surveys near Goxhill, South Humberside. Proc. Yorks. Geol.
Soc. 44:119 ± 129.
Barker, R. D. 1988. Resistivity soundings in engineering investigations with the oŒset Wenner
technique. Geotechnique 38:128 ± 143.
Barker, R. D. 1990a. Investigation of groundwater by geophysical methods. In S. H. Ward
(ed.), Geotechnical and environmental geophysics. Vol. II: Environmental and groundwater,
pp. 201± 211. Tulsa, OK: Soc. Expl. Geophys.
Barker, R. D. 1990b. Improving the quality of resistivity sounding data in land® ll studies. In
S. H. Ward (ed.), Geotechnical and environmental geophysics. Vol. II: Environmental and
groundwater, pp. 245± 251. Tulsa, OK: Soc. Expl. Geophys.
Barker, R.D., and P. F. Worthington. 1973a. Some hydrogeophysical properties of the Bunter
sandstone of northwest England. Geoexploration 11:151 ± 170.
Barker, R. D., and P. F. Worthington. 1973b. The hydrogeological and electrical anisotropy
of the Bunter sandstone of northwest Laccashire. Quart. J. Eng. Geol. 6:169± 175.
Modelling of Lithology and Hydraulic Conductivity Using VES 611
Dow
nloa
ded
by [
Prof
. Hilm
i S. S
alem
] at
04:
10 1
9 A
pril
2012
Benson, A. K., K. L. Payne, and M. A. Stubben. 1997. Mapping groundwater contamination
using DC resistivity and VLF geophysical methods: A case study. Geophysics 62:80± 86.
Bhattacharya, P. K., and H. P. Patra. 1968. Direct current geoelectric sounding. Amsterdam:
Elsevier.
Biella, G., and I. Tabbacco. 1981. The in¯ uence of grain size on the relationships between
resistivity, porosity and permeability in unconsolidated formations. Boll. Geof. Teor.
Appl. 23:43± 58.
Biella, G., A. Lotzej, and I. Tabbacco, I. 1983. Experimental study of some hydrogeophysical
properties of unconsolidated porous media. Ground Water 21:741± 751.
Bisdorf, R. J., and A. A. R. Zohdy. 1979. Geoelectric investigations with Schlumberger
soundings near Venice, Parrish and Homassassa, Florida. U.S. Geol. Surv., Open-File
Rep., 17± 841.
Bolshakov, D. K., I. N. Modin, E. V. Pervago, and V. A. Shevnin. 1995. Anisotropy eŒects
investigations by resistivity method in some inhomogeneous media. In Expanded abstracts
of the 57th annual meeting of the European association of exploration geophysics, PO34.
Bose, R. N., D. Chatterjee, and A. K. Sen. 1973. Electrical resistivity surveys for groundwater
in the Aurangabad Subdivision, Gaya District, Bihar, India. Geoexploration 11:171 ± 181.
Bristow, C. M. 1966. A new graphical resistivity technique for detection of air-® lled cavities.
Studies Speleol. 7:204± 227.
Bugg, S. F., and J. W. Lloyd. 1976. A study of fresh water lens con® guration in the Cayman
Islands using resistivity methods. Quart. J. Eng. Geol. 9:291± 302.
Buhle, M. B., and J. E. Brueckman. 1964. Electrical earth resistivity surveying in Illinois. Circ.
Ill. St. Geol. Surv. 376:1± 51.
Burger, H. R., D. C. Burger, and R. H. Burger. 1992. Exploration geophysics of the shallow
subsurface. Upper Saddle River, NJ: Prentice Hall.
Buselli, G., C. Barber, and A. Zerilli. 1988. The mapping of groundwater contamination with
TEM and DC methods. Expl. Geophys. 19:240 ± 243.
Buselli, G., C. Barber, G. B. Davis, and R. B. Salama. 1990. Detection of groundwater
contamination near waste disposal sites with transient electromagnetic and electrical
methods. In S. H. Ward (ed.), Geotechnical and environmental geophysics. Vol. II:
Environmental and groundwater, pp. 27± 41. Tulsa, OK: Soc. Expl. Geophys.
Butler, D. 1984. Geophysical methods for seepage detection, mapping and monitoring. In
Expanded abstracts of the 54th annual international meeting of the society of exploration
geophysics, pp. 157± 160.
Butler, D., and J. L. Llopis. 1990. Assessment of anomalous seepage conditions. In S. H. Ward
(ed.), Geotechnical and environmental geophysics. Vol. II: Environmental and groundwater,
pp. 153± 173. Tulsa, OK: Soc. Expl. Geophys.
Cahyna, F. 1990. Monitoring of arti® cial in® ltration using geoelectrical methods. In S. H.
Ward (ed.), Geotechnical and environmental geophysics. Vol. II: Environmental and ground-
water, pp. 101± 106. Tulsa, OK: Soc. Expl. Geophys.
Cahyna, F., O. Mazac, and D. Venhodova. 1990. Determination of the extent of cyanide
contamination by surface geoelectric methods. In: S. H. Ward. (ed.), Geotechnical and
environmental geophysics. Vol. II: Environmental and groundwater, pp. 101± 106. Tulsa,
OK: Soc. Expl. Geophys.
Campbell, D. L. 1977. Model for estimating electric macro-anisotropy coe� cient of aquifers
with horizontal and vertical fractures. Geophysics 42:114 ± 117.
Cardarelli, E., and M. Bernabini. 1997. Two case studies of the determination of parameters of
urban waste dumps. J. Appl. Geophys. 36:167± 174.
Daily, W., A. Ramirez, D. LaBrecque, and W. Barber. 1995. Electrical resistance tomography
experiments at the Oregon Graduate Institute. J. Appl. Geophys. 33:227± 237.
Daily, W., A. Ramirez, and R. Johnson. 1998. Electric impedance tomography of a perchloro-
ethelyne release. J. Environ. Eng. Geophys. 2:189± 201.
612 H. S. Salem
Dow
nloa
ded
by [
Prof
. Hilm
i S. S
alem
] at
04:
10 1
9 A
pril
2012
Davis, G. B., C. Barber, and G. Buselli. 1988. Borehole and surface geophysical monitoring
and simple modelling of groundwater polluted by waste leachates. In Proceedings of the
3rd international mining and water congress, pp. 261± 270, Melbourne.
De Lima, O. A. L., H. K. Sato, and M. J. Porsani. 1995. Imaging industrial contaminant
plumes with resistivity techniques. J. Appl. Geophys. 34:93± 108.
De Marsily, G. 1986. Quantitative hydrogeology : Groundwater hydrology for engineers.
London: Academic Press.
Dey, A., and H. F. Morrison. 1979. Resistivity modelling for arbitrary shaped two-dimen-
sional structures. Geophys. Prosp. 27:106 ± 136.
Dodds, A. R., and D. Ivic. 1990. Integrated geophysical methods used for groundwater studies
in the Murray Basin, south Australia. In S. H. Ward (ed.), Geotechnical and environmental
geophysics. Vol. II: Environmental and groundwater, pp. 303± 310. Tulsa, OK: Soc. Expl.
Geophys.
Duprat, A., L. Simler, and P. Ungemach. 1970. Contribution de la prospection electrique a la
recherche des caracteristiques hydrodynamiques d’un milieu aquifere. Terres Eaux 23:23±
31.
Einsele, G., and H. D. Schultz. 1973. Ueber den Grundwasserhaushalt im norddeutschen
Flachland. Teil 1: Grundwasserneubildung bewaldeter und waldfreier Sander¯ aechen
Schleswig-Holstein. Bes. Mitt. Dt. Gewass. Jb. 36:1± 72.
Fang, H.-Y. 1998. Introduction to environmental geotechnology. Boca Raton, FL: CRC Press.
Flathe, H. 1955. Possibilities and limitations in applying geoelectrical methods to hydrogeo-
logical problems in the coastal areas of north-west Germany. Geophys. Prosp. 3:95± 110.
Flathe, H. 1967. Interpretation of geoelectrical measurements for solving hydrogeological
problems. Geol. Surv. Can., Econ. Geol. Rep. 26:580 ± 597.
Fretwell, J. D., and M. T. Stewart. 1981. Resistivity study of a coastal karst terrain, Florida.
Ground Water 19:156 ± 162.
Frohlich, R. K. 1973. Detection of fresh-water aquifers in the glacial deposits of north-western
Missouri by geoelectrical methods. Bull. Wat. Resour. 9:723± 734.
Frohlich, R. K. 1974. Combined geoelectrical and drill-hole investigations for detecting fresh-
water aquifers in north-western Missouri. Geophysics 39:340 ± 352.
Frohlich, R. K., and W. E. Kelly. 1985. The relation between hydraulic transmissibility and
transverse resistance in a complicated aquifer of glacial outwash deposits. J. Hydrol.
79:215± 229.
Gorhan, H. L. 1976. The determination of the saline/fresh water interface by resistivity sound-
ings. Bull. Assn. Eng. Geol. 13:163± 175.
Gri� ths, D. H., R. D. Barker, and J. W. Finch. 1981. Recent applications of the electrical
resistivity and induced-polarization methods to hydrogeological problems. A survey of
British hydrogeology. Royal Soc. 85± 96.
Habberjam, G. M. 1972. The eŒects of anisotropy on square array resistivity measurements.
Geophys. Prosp. 20:249 ± 266.
Habberjam, G. M. 1975. Apparent resistivity, anisotropy and strike measurements. Geophys.
Prosp. 23:211 ± 247.
Hagemeyer, R. T., and M. Stewart. 1990. Resistivity investigations of salt-water intrusion near
a major sea-level canal. In S. H. Ward. (ed.), Geotechnical and environmental geophysics.
Vol. II: Environmental and groundwater, pp. 67± 77. Tulsa, OK: Soc. Expl. Geophys.
Hagrey, S. A. al. 1992. Waste site modelling using a combination of electromagnetic induction
and resistivity sounding measurements. Environ. Technol. 13:275± 280.
Hagrey, S. A. al, and J. Michaelsen. 1999. Resistivity and percolation study of preferential
¯ ow in vadose zone at Bokhorst, Germany. Geophysics 64:746± 753.
Hallenburg, J. K. 1998a. Standard methods of geophysical formation evaluation. Boca Raton,
FL: CRC Press.
Hallenburg, J. K., 1998b. Non-hydrocarbon methods of geophysical formation evaluation. Boca
Raton, FL: CRC Press.
Modelling of Lithology and Hydraulic Conductivity Using VES 613
Dow
nloa
ded
by [
Prof
. Hilm
i S. S
alem
] at
04:
10 1
9 A
pril
2012
Heigold, P. C., R. H. Gilkeson, K. Cartwright, and P. C. Reed. 1979. Aquifer transmissivity
from surfacial electrical methods. Ground Water 17:338 ± 345.
Henriet, J. P. 1976. Direct application of Dar Zarrouk parameters in groundwater surveys.
Geophys. Prosp. 24:344 ± 353.
Hosain, I., V. G. Maris, J. P. Ristau, and I. J. Ferguson. 1999. Geophysical imaging of a
kaolinite deposit at Sylvan, Manitoba, Canada. J. Appl. Geophys. 41:105 ± 129.
Humphreys, G. L., J. G. Linford, and S. M. West. 1990. Application of geophysics to the
reclamation of saline farmland in western Australia. In S. H. Ward (ed.), Geotechnical and
environmental geophysics. Vol. II: Environmental and groundwater, pp. 175± 186. Tulsa,
OK: Soc. Expl. Geophys.
Huntley, D. 1986. Relations between permeability and electrical resistivity in granular aqui-
fers. Ground Water 24:466 ± 474.
Kauahikaua, J. 1986. An evaluation of electrical geophysical techniques for groundwater
exploration in Turk. Federated States of Micronesia. U.S. Geol. Surv., Open-File Rep.
87± 146.
Keller, G. V. 1967. Application of resistivity methods in mineral and groundwater exploration
programs. Geol. Surv. Can., Mining and Groundwater Geophysics 51± 66.
Keller, G. V. 1982. Electrical properties of rocks and minerals. In R. C. Carmichael (ed.),
Handbook of physical properties of rocks, Vol. I, pp. 217± 293. Boca Raton, FL: CRC
Press.
Keller, G. V., and F. C. Frischknecht. 1966. Electrical methods in geophysical prospecting.
Oxford: Pergamon Press.
Kelly, W. E. 1977. Geoelectric sounding for estimating aquifer hydraulic conductivity. Ground
Water 15:420± 425.
Kelly, W. E. 1985. Electrical resistivity for estimating groundwater recharge. J. Irrig. Drain.
Eng. 11:177 ± 180.
Kelly, W. E., and S. Mares. 1993. Applied geophysics in hydrogeologica l and engineering
practice. Developments in Water Science Series, Vol. 44. Amsterdam: Elsevier.
Kelly, W. E., and P. F. Reiter. 1984. In¯ uence of anisotropy on relations between electrical
and hydraulic properties. J. Hydrol. 74:311± 321.
Koefoed, O. 1980. Geosounding principles: Resistivity sounding measurements. Methods in
Geochemistry and Geophysics Series, Vol. 14A, Amsterdam: Elsevier.
Kosinski, W. K., and W. E. Kelly. 1981. Geoelectric soundings for predicting aquifer proper-
ties. Ground Water 19:163 ± 171.
Kui, F. L., and D. Huisheng. 1990. Application of geophysical methods to surveys for ground-
water in the Huang-Huai-Hai plains, China. In S. H. Ward (ed.), Geotechnical and envir-
onmental geophysics. Vol. II: Environmental and groundwater, pp. 133± 143. Tulsa, OK:
Soc. Expl. Geophys.
Kunetz, G. 1966. Principles of direct current resistivity prospecting. Geoexploration
Monograph Series, Vol. I, Berlin: Gebrueder Borntraeger.
LaBrecque, D. J., D. D. Weber, and R. B. Evans. 1984. Comparison of the resistivity and
electromagnetic methods over a contaminate plume using numerical modelling. In
Proceedings of the national water well association: Conference on surface borehole geo-
physical methods, pp. 316± 333. San Antonio, TX.
Last, B. 1980. Automatic interpretation of resistivity sounding curves. Min. Expl. Dept., ITC,
Delft, The Netherlands.
Leonard-Mayer, P. 1984. A surface resistivity method for measuring hydrologic characteristics
of jointed formations. U.S. Bur. Mines Rep. Invest., 8901.
Li, P., and N. F. Uren. 1997. The modelling of direct current electric potential in an arbitrarily
anisotropic half-space containing a conductive 3-D body. J. Appl. Geophys. 38:57± 76.
Lile, O. B., M. Morris, and J. S. Running. 1997. Estimating groundwater ¯ ow velocity from
changes in contact resistance during a saltwater tracer experiment. J. Appl. Geophys.
38:105± 114.
614 H. S. Salem
Dow
nloa
ded
by [
Prof
. Hilm
i S. S
alem
] at
04:
10 1
9 A
pril
2012
Liu, C. W., and L. H. Cheng. 1997. Hydrogeological investigation of a groundwater contam-
ination site in southern Taiwan. Environ. Geol. 29:238 ± 245.
Llopis, J. L., C. M. Deaver, D. K. Butler, and S. C. Hartung. 1988. Comprehensive seepage
assessment, Beaver Dam, Arkansas. In Proceedings of the 2nd international conference on
case histories of geotechnical engineering, Vol. I, pp. 519± 526.
Loke, M. H., and R. D. Barker. 1995. Least-squares deconvolution of apparent resistivity
pseudosections. Geophysics 60:1682 ± 1690.
Maillet, R. 1947. The fundamental equations of electrical prospecting. Geophysics 12:529 ± 556.
Matias, M. J. S., and G. M. Habberjam. 1984. A ® eld example of the use of anisotropy
parameters derived from resistivity soundings. Geophys. Prosp. 32:725± 739.
Mazac, O., and I. Landa. 1979. On determination of hydraulic conductivity and transmissivity
of granular aquifers by vertical electrical sounding. J. Geol. Sci. 16:123 ± 139.
Mazac, O., W. E. Kelly, and I. Landa. 1985. A hydrogeological model for relations between
electrical and hydraulic properties of aquifers. J. Hydrol. 79:1± 19.
Mazac, O., W. E. Kelly, and I. Landa. 1987. Surface geoelectrics for groundwater pollution
and protection studies. J. Hydrol. 93:277± 294.
Mazac, O., M. Cislerova, and T. Vogel. 1988. Application of geophysical methods in describ-
ing spatial variability of saturated hydraulic conductivity in the zone of aeration. J.
Hydrol. 103:117 ± 126.
Mazac, O., M. Cislerova, W. E. Kelly, I. Landa, and D. Venhodova. 1990a. Determination of
hydraulic conductivities by surface geoelectrical methods. In S. H. Ward (ed.),
Geotechnical and environmental geophysics. Vol. II: Environmental and groundwater, pp.
125± 131. Tulsa, OK: Soc. Expl. Geophys.
Mazac, O., L. Benes, I. Landa, and B. Skuthan. 1990b. Geoelectrical detection of sealing foil
quality in light ash dumps. In S. H. Ward (ed.), Geotechnical and environmental geophysics.
Vol. II: Environmental and groundwater, pp. 113± 119. Tulsa, OK: Soc. Expl. Geophys.
Mazac, O., L. Benes, I. Landa, and A. Maskova. 1990c. Determination of oil contamination in
groundwater by geoelectrical methods. In S. H. Ward (ed.), Geotechnical and environ-
mental geophysics. Vol. II: Environmental and groundwater pp. 107± 112. Tulsa, OK: Soc.
Expl. Geophys.
McNeill, J. D. 1980. Electrical conductivity of soils and rocks. Geonics Ltd., TN-5,
Mississauga, ON, Canada.
Meheni, Y., R. GuErin, Y. Benderitter, and A. Tabbagh. 1996. Subsurface DC resistivity
mapping: Approximate 1-D interpretation. J. Appl. Geophys. 34:255 ± 269.
Monkhouse, R. A., and M. Fleet. 1975. A geophysical investigation of saline water in the
chalk of the south coast of England. Quart. J. Eng. Geol. 8:291± 302.
Moore, D. M., and M. Stewart. 1983. Geophysical signatures of fracture zones in a karst
aquifer. J. Hydrol. 61:325 ± 340.
Niwas, S., and D. C. Singhal. 1981. Estimation of aquifer transmissivity from Dar Zarrouk
parameters in porous media. J. Hydrol. 50:393 ± 399.
Niwas, S., and D. C. Singhal. 1985. Aquifer transmissivity of porous media from resistivity
data. J. Hydrol. 82:143± 153.
Nobes, D. C., T. S. Hamilton, and P. Cartwright. 1990. Structure of the south-western Fraser
River as determined from geoelectric sounding. Geophys. Prosp. 38:525± 544.
Nowroozi, A. A., G. R. Whittecar, and J. C. Daniel. 1997. Estimating the yield of crushable
stone in an alluvial fan deposit by electrical resistivity methods near Stuarts Draft,
Virginia. J. Appl. Geophys. 38:25± 40.
Nunn, K. R., R. D. Barker, and D. Bamford. 1983. In situ seismic and electrical measurements
of fracture anisotropy in the Lincolnshire chalk. Quart. J. Eng. Geol. 16:187± 195.
Ogilvy, A. A., M. A. Ayed, and V. A. Bogoslovsky.1969. Geophysical studies of water leakage
from reservoirs. Geophys. Prosp. 17:36± 62.
Osiensky, J. L. 1997. Groundwater modelling of mise-a-la-masse delineation of contaminated
groundwater plumes. J. Hydrol. 197:146 ± 165.
Modelling of Lithology and Hydraulic Conductivity Using VES 615
Dow
nloa
ded
by [
Prof
. Hilm
i S. S
alem
] at
04:
10 1
9 A
pril
2012
Osiensky, J. L., and P. R. Donaldson. 1995. Electrical ¯ ow through an aquifer for contami-
nant source leak detection and delineation of plume evolution. J. Hydrol. 169:243± 263.
Panissod, C., M. Lajarthe, and A. Tabbagh. 1997. Potential focusing: A new multi-electrode
array concept, simulation study and ® eld tests in archaeological prospecting. J. Appl.
Geophys. 38:1± 23.
Plotnikov, N. I. 1972. Geophysical methods in hydrology and engineering geology. Moscow: Nedra.
Ponzini G., A. Ostroman, and M. Molinaria. 1984. Empirical relation between electrical
transverse resistance and hydraulic transmissivity. Geoexploration 22:1± 15.
Pous, J., P. Queralt, and R. Chavez. 1996. Lateral and topographic eŒects in geoelectric
soundings. J. Appl. Geophys. 35:237± 248.
Raiche, A. P., D. L. B. Jupp, H. Rutter, and K. VozoŒ. 1985. The joint use of coincident loop
transient electromagnetic and Schlumberger sounding to resolve layered structure.
Geophysics 50:1618 ± 1627.
Reynolds, J. M. 1997. An introduction to applied and environmental geophysics. New York:
John Wiley & Sons.
Ritzi, R. W., and R. H. Andolsek. 1992. Relation between anisotropic transmissivity and
azimuthal resistivity surveys in shallow fractured carbonate ¯ ow systems. Ground
Water 30:774± 780.
Robian, H., M. Descloitres, M. Ritz, and Q. Y. Atangana. 1996. A multiscale electrical survey
of a lateritic soil system in the rain forest of Cameroon. J. Appl. Geophys. 34:237 ± 253.
Ross, H. P., C. E. Mackelprang, and P. H. Wright. 1990. Dipole-dipole electrical resistivity
surveys at waste disposal study sites in northern Utah. In S. H. Ward (ed.), Geotechnical
and environmental geophysics. Vol. II: Environmental and groundwater, pp. 145± 152.
Tulsa, OK: Soc. Expl. Geophys.
Roy, K. K., and H. M. Elliot. 1980. Resistivity and IP surveys for delineating saline and
freshwater zones. Geoexploration 23:193± 205.
Salem, H. S. 1995. Application of geophysical techniques to map aquifer contamination and salt-
water intrusion in northern Germany. Research Proposal, Kiel University, Germany.
Salem, H. S. 1999. Determination of ¯ uid transmissivity and electric transverse resistance for
shallow aquifers and deep reservoirs from surface and well-log measurements. Hydrol.
Earth System Sci. 3:421± 428.
Salem, H. S. 2000. Combination of compressional and sheer wave velocities to investigate
heterogeneous, unconsolidated shallow sediments. Energy Sources, 22(10):935± 941.
Salem, H. S., and G. V. Chilingarian. 1999a. Determination of speci® c surface area and mean
grain size from well log-data and their in¯ uence on the physical behavior of oŒshore
reservoirs. J. Pet. Sci. Eng. 22:241 ± 252.
Salem, H. S., and G. V. Chilingarian. 1999b. The cementation factor of Archie’s equation for
shaly sandstone reservoirs. J. Pet. Sci. Eng. 23:83± 93.
Sandberg, S. K., and D. W. Hall. 1990. Geophysical investigation of an unconsolidated
coastal plain aquifer system and the underlying bedrock geology in central New Jersey.
In S. H. Ward (ed.), Geotechnical and environmental geophysics. Vol. II: Environmental
and groundwater, pp. 311± 320. Tulsa, OK: Soc. Expl. Geophys.
Sauck, W. A., and S. M. Zabik. 1992. Azimuthal resistivity techniques and the directional
variations of hydraulic conductivity in glacial sediments. In R. S. Bell (ed.), Proceedings of
the symposium on the application of geophysics to engineering and environmental problems,
pp. 197± 222. Soc. Eng. Min. Expl. Geophys.
Scaracia, S. 1976. Contributions of geophysical methods to the management of water
resources. Geoexploration 14:256± 266.
Schimschal, U. 1981. The relationship of geophysical measurements to hydraulic conductivity
at the Brantly Dam site, New Mexico. Geoexploration 19:115± 125.
Schneider, G. W., S. M. DeRyck, and P. A. Ferre. 1993. The application of automated high
resolution DC resistivity in monitoring hydrogeological ® eld experiments. In R. S. Bell
616 H. S. Salem
Dow
nloa
ded
by [
Prof
. Hilm
i S. S
alem
] at
04:
10 1
9 A
pril
2012
and C. M. Lepper (eds.), Proceedings of the symposium on the application of geophysics to
engineering and environmental problems, pp. 145± 162. Environ. Eng. Geophys. Soc.
SchoÈ n, J. H. 1998. Physical properties of rocks: Fundamentals and principles of petrophysics.
Oxford: Pergamon.
Schroeter, J. 1983. Der einXuss von textur- und struktureigenschaften poroeser midien auf die
dispersivitaet. Ph.D. thesis, Kiel University, Germany.
Schwarz, S. D. 1990. Application of geophysical methods to groundwater exploration in the
Tolt River Basin, Washington State. In S. H. Ward (ed.), Geotechnical and environmental
geophysics. Vol. II: Environmental and groundwater, pp. 213± 217. Tulsa, OK: Soc. Expl.
Geophys.
Seara, J. L., and A. Granda. 1987. Interpretation of IP time-domain/resistivity sounding for
delineating sea-water intrusions in some coastal areas of the north-east of Spain.
Geoexploration 24:153 ± 161.
Sharma, P. V. 1998. Environmental and engineering geophysics. London: Cambridge University
Press.
Singh, C. L., and S. N. Singh. 1970. Some geoelectrical investigations for potential ground-
water in part of Azamgrah area of U.P. Pure Appl. Geophys. 82:270 ± 285.
Singhal, D. C., and S. Niwas. 1983. Estimation of aquifer transmissivity from surface geo-
electrical measurements. In Proceedings of the symposium on methodology and instrumental
investigations of groundwater systems, pp. 405± 414. The Netherlands.
Skuthan, B., I. Landa, and O. Mazac. 1979. Use of stationary geophysical device for deter-
mining the location of water leakage from reservoirs of pumped storage plants. Bull. Int.
Assn. Eng. Geol. 20:234 ± 236.
Slater, L., M. D. Zaidman, A. M. Binley, and L. J. West. 1997. Electrical imaging of saline
tracer migration for the investigation of unsaturated zone transport mechanisms. Hydrol.
Earth System Sci. 1:291± 302.
Stewart, M., and J. Wood. 1990. Geological and geophysical character of fracture zones in a
Tertiary carbonate aquifer, Florida. In S. H. Ward (ed.), Geotechnical and environmental
geophysics. Vol. II: Environmental and groundwater, pp. 235± 243. Tulsa, OK: Soc. Expl.
Geophys.
Stollar, R. L., and P. Roux. 1975. Earth resistivity surveys: A method for de® ning ground-
water contamination. Ground Water 13:145± 150.
Street, G. J., and R. Engel. 1988. The use of geophysics in de® ning the cause of dryland
salinity in south-western Australia. Expl. Geophys. 18:207 ± 210.
Street, G. J., and R. Engel. 1990. Geophysical surveys of dryland salinity. In S. H. Ward (ed.),
Geotechnical and environmental geophysics. Vol. II: Environmental and groundwater, pp.
187± 199. Tulsa, OK: Soc. Expl. Geophys.
Swartz, H. J. 1937. Resistivity studies of some salt-water boundaries in the Hawaiian Islands.
Trans. Am. Geophys. Un. 18:387 ± 393.
Taylor, R. W., and A. H. Fleming. 1988. Characterizing jointed systems by azimuthal resis-
tivity surveys. Ground Water 26:464 ± 474.
Telford, W. M., L. P. Geldart, R. E. SheriŒ, and D. A. Keys. 1976. Applied geophysics.
London: Cambridge University Press.
Tellam, J. H., J. W. Lloyd, and M. Walters. 1985. The morphology of a saline groundwater
body: Its investigation, description and possible explanation. J. Hydrol. 83:1± 21.
Urish, D. W. 1981. Electrical resistivity-hydraulic conductivity relationships in glacial outwash
aquifers. Wat. Resour. Res. 17:1401 ± 1408.
Urish, D. W. 1983. The practical application of surface electrical resistivity to detection of
groundwater pollution. Ground Water 21:144± 152.
Urish, D. W. 1984. Detection of a radioactive plume by surface electrical resistivity methods.
In Surface and borehole geophysical methods in groundwater investigations, pp. 421± 437.
National Water Well Association.
Modelling of Lithology and Hydraulic Conductivity Using VES 617
Dow
nloa
ded
by [
Prof
. Hilm
i S. S
alem
] at
04:
10 1
9 A
pril
2012
Van Dam, J. C., and J. J. Meulenkamp. 1967. Some results of the geoelectrical resistivity
method in groundwater investigations in the Netherlands. Geophys. Prosp. 15:92± 115.
Ward, S. H. (ed.). 1990a. Geotechnical and environmental geophysics. Vol. I: Review and
tutorial. Tulsa, OK: Soc. Expl. Geophys.
Ward, S. H. (ed.) 1990b. Geotechnical and environmental geophysics. Vol. II: Environmental and
groundwater. Tulsa, OK: Soc. Expl. Geophys.
Ward, S. H. (ed.) 1990c. Geotechnical and environmental geophysics. Vol. III: Geotechnical.
Tulsa, OK: Soc. Expl. Geophys.
Watson, K. A., and R. D. Barker. 1999. DiŒerentiating anisotropy and lateral eŒects using
azimuthal resistivity Wenner soundings. Geophysics, 64:739 ± 745.
West, S. M., and J. G. Linford. 1988. Application of geophysics to saline reclamation of
farmland. Expl. Geophys. 19:373-376.
Worthington, P. F. 1975. Quantitative geophysical investigations of granular aquifers.
Geophys. Surv. 3:313± 366.
Worthington, P. F. 1976a. Hydrogeophysical equivalence of water salinity, porosity and
matrix conduction in arenaceous aquifers. Ground Water 14:224 ± 232.
Worthington, P. F. 1976b. Hydrogeophysical properties of parts of the British Trias. Geophys.
Prosp. 24:672 ± 695.
Worthington, P. F. 1977a. In¯ uence of matrix conduction upon hydrogeophysical relation-
ships in arenaceous aquifers. Wat. Resour. Res. 13:87± 92.
Worthington, P. F. 1977b. Geophysical investigations of groundwater resources in the
Kalahari Basin. Geophysics 42:838 ± 849.
Worthington, P. F. 1986. The relationship of aquifer petrophysics to hydrocarbon evaluation.
Quart. J. Eng. Geol. 19:97± 107.
Yadav, G. S. 1995. Relating hydraulic and geoelectric parameters of the Jayant Aquifer, India.
J. Hydrol. 167:23± 38.
Yadav, G. S., and H. Abolfazli. 1998. Geoelectrical soundings and their relationship to
hydraulic parameters in semi-arid regions of Jalore, north-western India. J. Appl.
Geophys. 39:35± 51.
Yadav, G. S., P. N. Singh, and K. M. Srivastava. 1997. Fast method of resistivity sounding for
shallow groundwater investigations. J. Appl. Geophys. 37:45± 52.
Yakirevich, A., A. Melloul, S. Sorek, and S. Shaath. 1998. Simulation of sea-water intrusion
into the Khan Yunis area of the Gaza Strip coastal aquifer. Hydrogeol. J. 6:549± 559.
Yaramanci, U., and D. Flach. 1992. Resistivity of rock-salt in Asse (Germany) and petro-
physical aspects. Geophys. Prosp. 40:85± 100.
Zhdanov, M. S., and G. V. Keller. 1994. The geoelectrical methods in geophysical exploration.
Methods in Geochemistry and Geophysics Series, Vol. 31, Amsterdam: Elsevier.
Zohdy, A. A. R. 1965. The auxiliary point method of electrical sounding interpretation and its
relationship to Dar Zarrouk parameters. Geophysics 30:644 ± 660.
Zohdy, A. A. R. 1969. The use of Schlumberger and equatorial soundings in groundwater
investigations near El Paso, Texas. Geophysics 34:713 ± 728.
Zohdy, A. A. R. 1973. A computer program for the automatic interpretation of Schlumberger
sounding curves over horizontally strati® ed media. US Geol. Surv., Tech. Infor. Serv., PB-
232-703, Spring® eld, VA.
Zohdy, A. A. R. 1974. A computer program for the calculation of Schlumberger sounding
curves by convolution. US Geol. Surv., Tech. Inform. Serv., PB-232-056, Spring® eld, VA.
Zohdy, A. A. R. 1989. A new method for the automatic interpretation of Schlumberger and
Wenner sounding curves. Geophysics 54:245 ± 252.
Zohdy, A. A. R., G. P. Eaton, and D. R. Mabey. 1974. Application of Surface Geophysics to
Groundwater Investigations. Techniques of Water Resources Investigation, Vol. 2-D1,
U.S. Geol. Surv., U.S. Gov. Printing O� ce, Washington.
618 H. S. Salem
Dow
nloa
ded
by [
Prof
. Hilm
i S. S
alem
] at
04:
10 1
9 A
pril
2012