modeling doxorubicin transport to improve intratumoral drug delivery to rf ablated tumors
TRANSCRIPT
Modeling Doxorubicin Transport to Improve Intratumoral DrugDelivery to RF Ablated Tumors
Brent D. Weinberg1,3, Ravi B. Patel1, Agata A. Exner2, Gerald M. Saidel1, and JinmingGao3
1 Department of Biomedical Engineering, Case Western Reserve University, Cleveland, OH 44106
2 Department of Radiology, Case Western Reserve University, Cleveland, OH 44106
3 Simmons Comprehensive Cancer Center, University of Texas Southwestern Medical Center, Dallas, TX75390
AbstractA mathematical model of drug transport provides an ideal strategy to optimize intratumoral drugdelivery implants to supplement radiofrequency (RF) ablation for tumor treatment. To simulatedoxorubicin transport in non-ablated and ablated liver tumors, a one-dimensional, cylindricallysymmetric transport model was generated using a finite element method (FEM). Parameters of thismodel, the diffusion (D) and elimination (γ) coefficients for doxorubicin, were estimated using drugdistributions measured 4 and 8 days after placing biodegradable implants in non-ablated and ablatedrabbit VX2 liver carcinomas. In non-ablated tumor, values of diffusion and elimination parameterswere 25% and 94% lower than normal liver tissue, respectively. In ablated tumor, diffusion near theablation center was 75% higher than non-ablated tumor but decreased to the non-ablated tumor valueat the ablation periphery. Drug elimination in ablated tumor was zero for the first four days, but byday 8 returned to 98% of the value for non-ablated tumor. Three-dimensional (3-D) simulations ofdrug delivery from implants with and without RF thermal ablation underscore the benefit of usingRF ablation to facilitate local drug distribution. This study demonstrates the use of computationalmodeling and optimal parameter estimation to predict local drug pharmacokinetics from intratumoralimplants after ablation.
Keywordsbiodegradable implant; local chemotherapy; radiofrequency ablation; mathematical modeling; VX2tumor
IntroductionTreatment of unresectable tumors has been supplemented in recent years by the developmentof minimally invasive interventions, such as laser [1], microwave [2], and radiofrequency (RF)ablation [3]. RF ablation in particular has shown improved efficacy in the treatment ofhepatocellular carcinoma (HCC) [4], where approximately 80% of tumors cannot be surgically
Correspondence and reprint requests should be addressed to: Jinming Gao, Simmons Comprehensive Cancer Center, University of TexasSouthwestern Medical Center, 6001 Forrest Park, Rm ND2.210, Dallas, TX 75390, Phone: 214-645-6370, Fax: 214-645-6347, E-mail:[email protected]'s Disclaimer: This is a PDF file of an unedited manuscript that has been accepted for publication. As a service to our customerswe are providing this early version of the manuscript. The manuscript will undergo copyediting, typesetting, and review of the resultingproof before it is published in its final citable form. Please note that during the production process errors may be discovered which couldaffect the content, and all legal disclaimers that apply to the journal pertain.
NIH Public AccessAuthor ManuscriptJ Control Release. Author manuscript; available in PMC 2008 December 4.
Published in final edited form as:J Control Release. 2007 December 4; 124(1-2): 11–19.
NIH
-PA Author Manuscript
NIH
-PA Author Manuscript
NIH
-PA Author Manuscript
removed [5]. However, despite its success, RF ablation is restricted by limited ablation sizesthat can be created with a single treatment as well as the risk of tumor recurrence around theboundary [6,7]. Biodegradable polymer implants, termed polymer millirods, have beendesigned to deliver chemotherapeutic agents to the RF treated region to kill residual tumorcells and prevent tumor recurrence [8–10]. These implants have been studied systematicallyin non-ablated and ablated liver tissues [11,12], and initial studies using doxorubicin-containing implants to treat tumors have indicated their potential benefit [13,14]. Up to now,the major challenge in effectively treating tumors with polymer millirods has been the limiteddrug penetration distance into the surrounding tissue. Although several changes to implantdesign have already been described [9,15], how these changes would affect local drug deliveryefficiency and anti-tumor efficacy is not obvious.
A strategic method for improving implant therapy is to use a mathematical model to establisha mechanistic understanding of drug transport processes and how they affect drugpharmacokinetics and delivery efficiency [16–19]. Using a mathematical model to aid inpolymer millirod design has several advantages over empirical experimental testing. First,measurement of doxorubicin transport parameters in tumor tissue provides insight intodifferences between tissue types and cellular changes that result from RF ablation. Thisinformation allows for a better understanding of why a particular treatment may be effectiveand allows for better treatment design. Second, model simulation can be used to test a widevariety of treatment conditions while minimizing the number of animal subjects. Different drugrelease profiles, implant locations, or number of implants can be modeled, and only the bestavailable treatments need to be tested in animals. Third, drug distributions can be predicted inlarger tumors that are a better approximation of clinical cases. Tumors in rat and rabbit modelstypically range from 0.5 – 2.0 cm in diameter, but human tumors are often 5.0 cm or largerwhen first treated [20]. By simulating treatments in these larger tumors, problems in treatmentscale-up can be anticipated and addressed. These advantages make a distinct argument forusing mathematical modeling to improve post-ablation drug delivery.
Other studies have established a precedent for using modeling to design local drug deliverysystems. Strasser et al. estimated a coefficient of elimination and diffusion to explaindifferences in transport of several different drugs away from polymers implanted in the brain[21]. Wang et al. used model simulation of BCNU delivery to brain tumors with implants toestablish the value of combination treatment using surgical debulking and intratumoralethylene-vinyl acetate implants [22]. Other studies have delved into the specific factorsinfluencing drug transport surrounding implants in the brain [23] and increased the complexityof model simulations [24]. In the area of convection enhanced delivery (CED), in which amicrocatheter is used to instill drugs into the center of a brain tumor, computational modelinghas been used to optimize treatment parameters, such as infusion rate and pressure, to maximizethe area treated by drug infusion [25–27]. Transport modeling has also been used to describehow modification of the tissue properties of a tumor, such as using a drug pretreatment toincrease the diffusion rate, can affect drug penetration into tumors [28,29]. Valuableconclusions drawn from these works emphasize the value of modeling to optimize drugdelivery to solid tumors, where drug distribution is often limited by poor perfusion and limiteddiffusion distances.
A model to describe local drug transport in the tissue surrounding polymer millirods has alreadybeen introduced in our previous publications. Qian et al. introduced a mass transport modelthat described the radially outward transport of doxorubicin (DOX) away from the polymermillirod surface using diffusion and elimination terms [9]. This model could be analyticallysolved to determine drug release rates necessary to create a desired drug concentration at theboundary of an ablated liver region. In a subsequent application of this model, doxorubicindiffusion and elimination parameters in non-ablated and ablated liver tissue were estimated,
Weinberg et al. Page 2
J Control Release. Author manuscript; available in PMC 2008 December 4.
NIH
-PA Author Manuscript
NIH
-PA Author Manuscript
NIH
-PA Author Manuscript
providing initial insights about how ablation influences local drug transport by dramaticallydecreasing drug elimination [10]. Together, these studies demonstrated the feasibility of usinga model to predict local drug delivery from polymer millirods in non-ablated and ablated liver.However, the applicability of this model to drug transport in tumors has not been investigated.
The goal of this paper is to extend the previously developed doxorubicin transport model todescribe transport in non-ablated and ablated liver tumors. To accomplish this goal, twodifferent implementations of a mass transport model incorporating doxorubicin diffusion andelimination in tumors were developed. First, a one-dimensional (1-D), cylindrically symmetrictransport model was used to simulate intratumoral doxorubicin release from polymer millirods.Parameters of this doxorubicin transport model were estimated using nonlinear least-squaresestimation to minimize the error between the model output and experimentally measured DOXconcentration distributions. Second, a three-dimensional (3-D) implementation of the drugtransport model was used to simulate treatment of larger tumors with RF ablation and polymermillirods. This implementation was used to demonstrate how this model can be effective inpredicting doxorubicin distributions in different tumor treatment scenarios. Results from thispaper provide essential information about doxorubicin transport and elimination in tumors andwill ultimately be used to improve future intratumoral treatment with polymer millirods.
Experimental MethodsImplant fabrication
Implants were produced by a compression-heat molding procedure [30]. Poly(D,L-lactide-co-glycolide) (PLGA; 1:1 lactide/glycolide; inherent viscosity 0.65 dL/g) was obtained fromBirmingham Polymers (Birmingham, AL) and was made into microspheres using a singleemulsion method. Doxorubicin HCl (DOX) (2 mg/mL) in saline (9 mg/mL) was acquired fromBedford Laboratories (Bedford, OH) and desalted before use. A mixture of 65% PLGAmicrospheres, 13.5% DOX, and 21.5% NaCl (w/w) was mixed with a mortar and pestle, packedinto a Teflon tube (1.6 mm outside diameter), and compressed with steel plungers (1.6 mminside diameter) at 90° C for 2 hours. Final implants were cylindrical with an approximatediameter of 1.5 mm and length of 8.0 mm.
Non-ablated tumor treatmentAll animal studies followed the guidelines of and were approved by the IACUC at Case WesternReserve University. Treatment of liver tumors in rabbits using doxorubicin-containing PLGAimplants was reported in a previous publication [13]. Adult male New Zealand White rabbits(n = 14; Covance, Princeton, NJ) weighing 2.8–3.2 kg were used for all in vivo studies. VX2liver carcinomas were generated in rabbit livers by surgically implanting a small piece (1mm3) of frozen tumor tissue in the rabbit liver. The tumors were grown in the liver for 12 daysuntil they reached an approximate diameter of 8 mm. Then, the abdomen was surgically openedand a control or doxorubicin-containing implant was inserted into the center of the tumor andsecured with a suture. The rabbits were euthanized 4 or 8 days after the onset of treatment, andthe tumors were removed.
Ablated tumor treatmentCombined treatment of liver tumors in rabbits with RF ablation followed by doxorubicin-containing polymer implants was also reported in a previous publication [14]. VX2 carcinomaswere implanted as above but were allowed to grow for 18 days until they reached anapproximate diameter of 11 mm. A 17-gauge ablation probe with a 1-cm exposed tip(Radionics, Burlington, MA) was placed into the center of the tumor. The tissue in contact withthe tip was heated to 80°C for 2 min, which created a coagulated region of approximately 8mm in diameter. After ablation, a control or doxorubicin-containing millirod was placed into
Weinberg et al. Page 3
J Control Release. Author manuscript; available in PMC 2008 December 4.
NIH
-PA Author Manuscript
NIH
-PA Author Manuscript
NIH
-PA Author Manuscript
the electrode tract and secured with a suture. The rabbits were euthanized 4 or 8 days after theonset of treatment, and the tumors were removed.
Tumor assessmentTumors removed from the surrounding liver tissue were sliced in half perpendicular to themajor axis of the implant. Half of the tumor was fixed in formalin solution and the other halfwas frozen at −20°C. The fixed tissue was embedded in paraffin, sliced, and stained withhematoxylin and eosin (H&E) or Masson’s trichrome (MTC). Liver sections 100 μm thickwere sliced from the frozen half of the tumor using cryostat microtome (Microm 505E) andthen scanned with a fluorescent imager (Molecular Dynamics Fluorimager SI). For ablatedtissue sections, the ablation background was adjusted for using a background subtractionalgorithm [14]. Then, tumor net fluorescence intensity (NFI) was converted to doxorubicinconcentration using a previously established calibration curve, NFI = 194·[DOX]0.67, where[DOX] is the doxorubicin concentration in μg/g [13]. Radial drug distribution profiles as afunction of distance from the implant center were determined by averaging four evenly spacedsamples from the fluorescence image.
Development of Drug Transport ModelDrug transport model
Doxorubicin transport into tumor tissue from an implant device was analyzed by a dynamicmass balance transport model incorporating diffusion and elimination [10],
∂C∂t = D∇2C − γC (1)
where D and γ represent apparent diffusion and elimination coefficients, respectively [10].Drug elimination resulted from both perfusion and metabolism and was approximated as firstorder.
Boundary and initial conditionsThe boundary conditions were chosen to approximate experimental measurements. At the innerimplant boundary,
r = RIB : C = f (t) (2)
where f(t) is the time dependent concentration that was measured experimentally. At the outernormal tissue boundary,
r = ROB : C = 0 (3)
where ROB is the maximum extent of normal liver tissue included in the model. Theconcentration at this boundary was assumed to go to zero because of the elimination process.Initially, the tissue drug concentration was zero,
t = 0 : C = 0 (4)
because there was no doxorubicin present in the tissue before the implants were placed. Drugflux and concentration were assumed continuous at all interior boundaries.
Weinberg et al. Page 4
J Control Release. Author manuscript; available in PMC 2008 December 4.
NIH
-PA Author Manuscript
NIH
-PA Author Manuscript
NIH
-PA Author Manuscript
One-dimensional (1-D) simulation methodDoxorubicin diffusion and elimination parameters were estimated for non-ablated and ablatedtumor by implementing a 1-D, cylindrically symmetric simulation. For spherical tumors witha single cylindrical implant placed in the center, the dominant transport process occurs in theradial (r) direction, which can be described by a one-dimensional (1-D) model of the drugconcentration distribution with time C(r,t),
∂C∂t = D
r∂∂r (r ∂C
∂r ) − γC (5)
In both non-ablated and ablated tissue models, a single polymer implant (r = 0.8 mm) waslocated at the tumor center. In experimental studies of non-ablated VX2 liver tumors treatedwith a doxorubicin implant, the tumor radius began as 4 mm but decreased to 2.4 and 2.1 mmafter 4 and 8 days, respectively, responding to the chemotherapeutic treatment. To account forthe tumor shrinkage in the theoretical model, the boundary between tumor and normal livertissue, RTN, was placed at a radius of 2.3 mm. In the ablated model, drug transport from acentrally located implant in ablated tumor was simulated using an ablated tissue radius, RAB,of 4.3 mm, corresponding to measurements in fresh tissue slices. The outer boundary of normaltissue, ROB, was placed at 10 mm in both non-ablated and ablated models.
The drug distributions from the 1-D transport models in non-ablated and ablated tumor werethen solved. With this model, previously estimated values for the diffusion coefficient (Dliver= 6.7 × 10⁻¹¹ m2s−1) and elimination coefficient (γliver = 9.6 × 10⁻⁴ s−1) were used for non-ablated, normal liver tissue surrounding the tumors [10]. The cylindrically symmetric modelwas spatially discretized with a uniform mesh spacing of 0.1 mm to match the spacing of theexperimental data. This system was then solved using a finite element method (FEM)implemented by COMSOL 3.3 (Burlington, MA). The simulated model output consisted ofthe doxorubicin concentration as a function of radius at the experimentally measured times, 4and 8 days. Values for D and γ and their corresponding 95% confidence intervals in non-ablatedand ablated tumor tissue were determined by least-squares fitting of the model simulated drugconcentration distributions to the experimental data. This step was implemented using thelsqcurvefit function of MATLAB 7.1 (Mathworks, Natick, MA). Initially, D and γ wereassumed to be independent of position and time. When the model did not yield a good fit tothe experimental data, however, these coefficients were represented as functions of r and/or tbased on an understanding of the underlying physiology. Since various functional forms wereconsistent with changes in these coefficients, the final choices were those for which the modeloutput most closely fit the data and involved the fewest number of model parameters.
Three-dimensional (3-D) simulation methodTo demonstrate that the estimated tissue parameters could be used more generally to determinedrug concentrations throughout a tumor, treatment of tumors with a diameter of 2.0 cm wassimulated in 3-D. This simulation phase considered two polymer millirods implant treatmentstrategies: (A) treatment of a non-ablated tumor (2.0 cm diam.) with a central implant; (B)treatment of a tumor (2.0 cm diam.) with ablation of 75% of the volume (1.8 cm diam.) and acentral implant. Because these cases did not assume that transport was cylindrically symmetric,simulations were based on a 3-D drug transport model,
∂C∂t = D( ∂2C
∂x 2+ ∂2C
∂ y 2 + ∂2C
∂z 2) − γC (6)
Boundary and initial conditions were set as described above with the exception that ROB = 4cm to allow for placement of larger tumors. Diffusion in the ablated region was scaled to the
Weinberg et al. Page 5
J Control Release. Author manuscript; available in PMC 2008 December 4.
NIH
-PA Author Manuscript
NIH
-PA Author Manuscript
NIH
-PA Author Manuscript
larger size by setting the RAB at 0.9 cm and linearly scaling the spatial dependence of thediffusion parameter. Drug concentrations within the tumor were obtained using a 3-D FEMsolution implemented by COMSOL. The two drug distributions were compared by calculatingaverage drug concentrations in the entire tumor and an outer tumor region measuring 25% ofthe total tumor volume, which corresponds to the non-ablated region of geometry B. Therapieswere further compared by determining the fractions of the tumor and risk volumes that werecovered with greater than 2 times the known therapeutic value of doxorubicin in VX2 tumor,6.4 μg/g [31,32].
ResultsDrug transport in non-ablated tumors
Rates of drug diffusion and elimination in non-ablated tumors were estimated from drugdistribution profiles measured 4 and 8 days after implant placement. Drug transport wasapproximated using transport coefficients that did not vary as a function of time or position.Experimental drug measurements compared to model generated output are shown in Figure 1.The estimated value of doxorubicin diffusion throughout non-ablated tumor, Dtumor, wascalculated as 5.01 ± 0.32 × 10⁻¹¹ m2s−1. Doxorubicin elimination, γtumor, was calculated as0.58 ± 0.04 × 10⁻⁴ s−1.
Drug transport in ablated tumorsDrug diffusion and elimination coefficients were estimated from ablated tumor drugdistributions obtained 4 and 8 days after tumor ablation and implant placement. Using onlyconstant parameters, the predicted concentration distribution did not yield a close fit to theexperimental data; the model substantially overpredicted drug concentrations in the outerregion of the ablated tumor on day 8. This finding suggested that constant model parameterswere inadequate to simulate ablated tumor tissue. To more accurately predict drug transport inablated tumors, diffusion and elimination coefficients that were a function of distance from theimplant radius (r), time (t), or both were tested. Where possible, assumptions about theparameters were made based on a priori information, such as the physiology of ablation-induced damage and histological changes occurring after ablation, to minimize the number ofparameters estimated.
Optimal model fits in ablated tumor (Figure 2) were obtained by using diffusion that varied asa function of r and elimination that varied as a function of t. The diffusion rate of doxorubicinin ablated tissue was obtained by setting the diffusion rate in the center of the ablated tumor(0.8 ≤r < 2.0 mm) to a constant parameter, Dablated tumor
center , and allowing the parameter to vary
linearly between Dablated tumorcenter and Dtumor in the outer portion of the ablated tumor (2.0 ≤ r
< 4.3 mm),
D = {r < 2mm : Dablated tumorcenter
r ≥ 2mm : Dablated tumorcenter − ( r − 2mm
4.3 − 2mm )(Dablated tumorcenter − Dtumor)
} (7)
In this equation, 2 mm was chosen as the distance for the change in the diffusion parameterfunction by testing several different locations and determining which model output mostclosely approximated the experimental data. Additionally, 4.3 mm was chosen as the outerboundary of the ablated region because this was the experimentally measured size of theablation coagulated region. The piecewise linear function of D was constant for the 8 day periodof the study. In contrast, the elimination coefficient gave the best model fit when it varied asa function of t and not r. The elimination coefficient was set to a constant value of 0 for the
Weinberg et al. Page 6
J Control Release. Author manuscript; available in PMC 2008 December 4.
NIH
-PA Author Manuscript
NIH
-PA Author Manuscript
NIH
-PA Author Manuscript
first four days of the study, after which it was allowed to vary linearly between 0 and eliminationon day 8, γablated tumor
day 8 ,
γ = {t < 4 days : 0
t ≥ 4days : ( t − 4days4days )γablated tumor
day 8 } (8)
This pattern of elimination was chosen based on the mechanism of tissue destruction due toRF ablation. Previous modeling work has shown that after ablation of normal tissue, theelimination rate is reduced to zero, a reasonable finding because ablation destroys the livingtissue and stops blood flow to the area. However, because ablation also induces a wound healingresponse that includes the formation of new blood vessels in the injured region, the eliminationmay begin to return several days after ablation. In this case, 4 days was chosen as the inflectionpoint because experimental data and previously published reports indicated that this was aboutthe time when new blood vessels would begin forming after tissue injury [33]. Using thisparameter structure, which is shown in Figure 3, Dablated tumor
center was estimated to be 8.76 ±
0.41 × 10⁻¹¹ m2s−1, and γablated tumorday 8 was determined to be 0.57 ± 0.04 × 10⁻⁴ s−1. Parameter
structures with greater parameter complexity, such as power and exponential growth, did notimprove the quality of the model fits. Furthermore, functions that allowed each parameter tovary simultaneously as a function of t and r increased the number of parameters required anddid not improve the model approximation.
Histology of ablated tumorsHistology of tumor tissues treated with RF ablation followed by polymer implants providedphysiological insights on the pattern of tissue destruction for comparison with quantitativetransport information. H&E stained sections at the center and periphery of the ablated regionon day 8 indicated some essential differences between tissues in these regions (Figure 4). Tissueapproximately 1–2 mm from the ablation probe tip showed extensive necrosis and proteindenaturation, with few visible nuclei or intact cell membranes. Damage to this region wasextensive and indicative of high heat exposure. At a distance of 3–4 mm from the ablationprobe, a different structural pattern was seen. Cells showed pallor, pyknotic nuclei, andshrunken cytoplasm while retaining much of their underlying morphology. This finding wasconsistent with tissues receiving a lower heat dose but loss of blood supply. This patternsubstantiated the choice of a diffusion parameter which varied with radius in the model. Thestructure of tissue in the center of the ablated region was more extensively destroyed, and thisregion corresponded to the location of ablated tissue which had a higher estimated diffusionrate in the model. Tumor around the periphery that was exposed to less heat was less severelydamaged, and exhibited a diffusion rate that deviated less from normal tissue.
Comparative histology between 4 and 8 days also revealed time-dependent processes that tookplace in the ablated tissue (Figure 5). Ablated tumor after 4 days showed significant signs ofcoagulative necrosis, featuring numerous blood vessels filled with coagulated red blood cells,particularly around the ablation periphery. Lack of patent blood vessels in the day 4 tissue wascompatible with the initial segment of the elimination function, which had a value of zero.However, by day 8 the region revealed progression of the ablation-induced injury. In additionto granulation tissue found around the boundary, moderate amounts of new blood vessels wereseen throughout the ablated region. This day 8 tissue section provided evidence supporting theassumption that elimination returns gradually between 4 and 8 days after ablation.
Weinberg et al. Page 7
J Control Release. Author manuscript; available in PMC 2008 December 4.
NIH
-PA Author Manuscript
NIH
-PA Author Manuscript
NIH
-PA Author Manuscript
Three-dimensional (3-D) simulation of tumor transportWith the diffusion and elimination coefficients determined from the 1-D model analysis, a 3-D model was applied to simulate treatment scenarios for a larger tumor. Drug distribution wassimulated from 0 to 8 days after a doxorubicin millirod was centrally placed in a 2.0 cm diametertumor: (A) without thermal ablation (B) following RF ablation of 75% of the tumor volume(1.8 cm diameter). A sample finite element mesh and corresponding results for the twoscenarios are shown in Figure 6. Over 8 days, the average drug concentrations in the entiretumor were 32 and 119 μg/g in the non-ablated and ablated case, respectively. Whenconsidering the outer rim of tumor within 1 mm of normal liver, average concentrationsdropped to 0.2 μg/g in the non-ablated scenario or 17 μg/g in the ablated scenario. None of thetissue in the outer rim reached the therapeutic margin (13 μg/g, or 2x the known therapeuticvalue) without ablation, but ablation pretreatment increased coverage of the outer tumor to80% of the outer rim volume. Finally, total drug released from the simulated implants in ablatedtumor was 2.6 mg compared with 3.6 mg in non-ablated tumor.
DiscussionIn this study, mass transport modeling was used to estimate doxorubicin transport in tumortissues and then to simulate drug distribution in a larger tumor. In addition to providingdoxorubicin transport parameters, this work represents an improvement in methodology thatcan be used in future work. The finite element method (FEM) of solving the model provideda flexible platform that had advantages over an analytical solution, such as the ability to usearbitrary geometries or functions that are not easily expressed analytically [34–37]. Thisflexibility allowed transport modeling with space and time variant parameters, representing asignificant advancement in modeling drug transport in ablated tissues that had not beenaccomplished previously. Additionally, future uses of this model can simulate drug transportin scenarios that are not symmetric or incorporate spatial data about a tumor into the model.
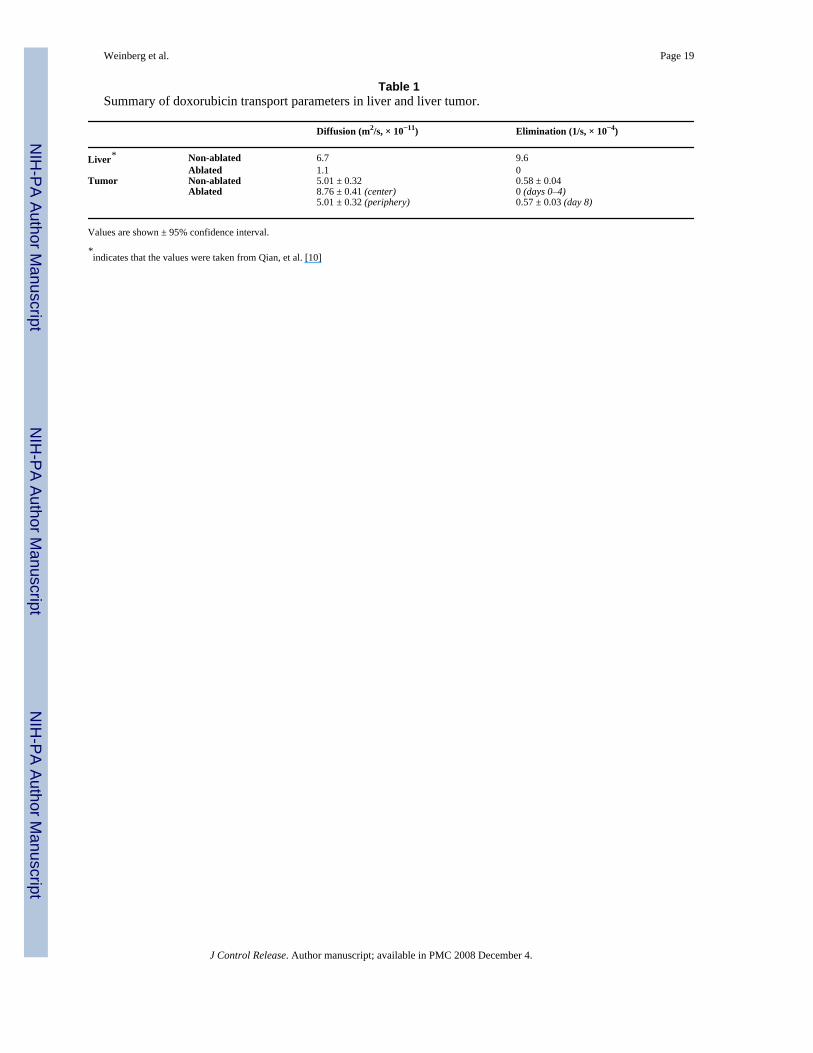
Estimation of doxorubicin transport properties in tumorsSimulation of drug transport using the model allowed for reasonable approximation of drugrelease from doxorubicin millirods placed in tumors. In Table 1, estimated values of tissuetransport parameters are summarized along with previous values from Qian et al. in whichparameters were calculated from drug distribution data measured from 1 hour to 4 days [10].The estimated value for diffusion in non-ablated liver tumors was 25% lower than diffusion innon-ablated normal liver tissue. This may have occurred because tumors are often comprisedof dense tissue with high cellularity, elevated collagen content, and a tortuous extracellularmatrix, all of which can act as a barrier to drug transport [38,39]. The elimination rate in tumorwas 6% of the value in normal liver, indicating that doxorubicin was removed from tumor ata drastically lower rate. Normal liver parenchyma is heavily populated with blood vessels andsinusoids, and hepatocytes may have high enzymatic activity for drug elimination.Additionally, the VX2 tumors used in this study may have a lower blood vessel density andmay metabolize drug more slowly than normal liver.
Ablation-induced changes in tumor doxorubicin transportIn the ablated tumor tissue, diffusion was best represented by a function of radius, whileelimination was best represented by a function of time. After ablation, diffusion at the centerof the tumor region was increased by 75% over non-ablated tumor. This finding is in contrastto the previous results showing that ablation decreased the diffusion coefficient in normal liver[10]. However, several other studies have demonstrated that drug diffusion rates could beincreased by using an apoptosis-inducing drug pretreatment to reduce barriers to drug transit[28,29]. Analogously, RF ablation may increase the rate of doxorubicin diffusion by disruptingtumor morphology and cellular structure. Changes in the diffusion value did not extend to the
Weinberg et al. Page 8
J Control Release. Author manuscript; available in PMC 2008 December 4.
NIH
-PA Author Manuscript
NIH
-PA Author Manuscript
NIH
-PA Author Manuscript
ablation periphery, which had the same diffusion value as non-ablated tumor. This findingsuggests that RF-induced structural damage to the tumor may not be uniform throughout thetumor, with higher damage found at the center of the coagulated region. The temperaturedistribution during ablation, with high temperatures near the ablation probe that graduallydecrease to normal at the ablation periphery [40], can explain this fundamental difference.Moreover, these values may vary little with time because the initial ablation tissue damageresolves very slowly over time. Histology corroborated the pattern of more extensive celldamage at the center of the ablation region. Other published reports of tumor ablation supportthe finding that RF-induced damage is not homogeneous throughout the ablated region [41,42].
In contrast, elimination could be represented as a homogenous function throughout the ablatedregion that varied as a function of time. RF ablation reduced tumor drug elimination to zerofor the first four days after treatment, consistent with previous results in ablated liver tissue[10]. This finding is likely because the heat exposure to the entire ablated region was sufficientto coagulate all of the blood vessels. However, elimination in the ablated tumor increased asa function of time between days 4 and 8, which was not observed in the previous study thatstopped at day 4. This increase in elimination between days 4 and 8 could result from the hostinflammatory response to the ablation. Histology of the ablated tumors demonstrated theinfiltration of inflammatory cells and formation of new blood vessels, which could explain thereturn of elimination as a function of time. A few small blood vessels exerted a sizeable effecton drug elimination without affecting diffusion because they comprised a small fraction of thetotal ablated volume. Overall, choosing the diffusion rate coefficient as a function of positionand elimination coefficient as a function of time allowed for effective simulation of drugdistribution in ablated tumors.
Simulation of drug distribution in larger tumorsThree-dimensional simulation of a larger, more clinically relevant tumor treated locally witha doxorubicin-containing implant without or following RF thermal ablation demonstrated theability to evaluate 3-D scenarios based on their expected drug distributions. First, the feasibilityof using parameters from a 1-D model simulation for application in a 3-D simulation of a largertumor was established. Because it was solved using a finite element method, this 3-D simulationstrategy could be implemented in situations that are not symmetric, such as when multipleimplants are placed around the periphery of a tumor. Second, the simulation reaffirmedprevious findings about using ablation before implant placement. Ablation drasticallydecreased drug elimination in the tumor region, which had the most pronounced effects ondrug retention in the peripheral tumor region. While experimentally observed previously, thiseffect appeared to be more substantial in the larger simulated tumors. Furthermore, RF ablationallowed for significantly slower drug release from the implant, depleting the implant moreslowly and maintaining a therapeutic level, especially at the tumor periphery, for a longerperiod. These simulations provide the basis for designing future animal experiments to confirmthese conclusions and validate the extension of this model into a larger tumor. Additionally,the model could be used in the future to anticipate how other changes to implant design, suchas modifying the drug release rate or including dexamethasone to moderate the inflammatoryresponse after ablation [43], could affect drug distribution in the tumors. This computationalstrategy should allow for rapid development and prototyping of different implant designs thatcan optimally treat larger, more clinically relevant tumor models. Ultimately, this drugtransport model may be used as part of a comprehensive treatment planning tool. Afteracquiring imaging data about tumor geometry, ablation treatment could be planned using athermal damage model, and drug coverage in the ablated tumor could be predicted using this3-D finite element model.
Weinberg et al. Page 9
J Control Release. Author manuscript; available in PMC 2008 December 4.
NIH
-PA Author Manuscript
NIH
-PA Author Manuscript
NIH
-PA Author Manuscript
ConclusionThis computational model provided a feasible means of estimating drug distribution dynamicsfollowing placement of an intratumoral chemotherapeutic implant. RF ablation was shown tofacilitate intratumoral drug delivery in tissue not only by reducing normal elimination processesbut also by increasing diffusion. Extension of parameter estimates from a 1-D model into a 3-D simulation further demonstrated the benefits of ablation in conjunction with drug delivery.The computational modeling approach indicates the advantages of using simulation to designand rapidly prototype new implant treatment strategies.
Acknowledgements
This work was supported by NIH grant R01 CA90696 to JG. BW and RP are supported in part by the NIH grant T32GM07250 to the Case Western Reserve University Medical Scientist Training Program. BW is also supported by DODpredoctoral fellowship BC043453. This is manuscript CSCN 016 from the ‘Cell Stress and Cancer Nanomedicine’program in the Simmons Comprehensive Cancer Center at the University of Texas Southwestern Medical Center atDallas.
References1. Pacella CM, Valle D, Bizzarri G, Pacella S, Brunetti M, Maritati R, Osborn J, Stasi R. Percutaneous
laser ablation in patients with isolated unresectable liver metastases from colorectal cancer: Resultsof a phase II study. Acta Oncol 2006;45(1):77–83. [PubMed: 16464799]
2. Simon CJ, Dupuy DE, Iannitti DA, Lu DS, Yu NC, Aswad BI, Busuttil RW, Lassman C. Intraoperativetriple antenna hepatic microwave ablation. AJR Am J Roentgenol 2006;187(4):W333–340. [PubMed:16985103]
3. Amersi FF, McElrath-Garza A, Ahmad A, Zogakis T, Allegra DP, Krasne R, Bilchik AJ. Long-termsurvival after radiofrequency ablation of complex unresectable liver tumors. Arch Surg 2006;141(6):581–587. [PubMed: 16785359]discussion 587–588
4. Tateishi R, Shiina S, Teratani T, Obi S, Sato S, Koike Y, Fujishima T, Yoshida H, Kawabe T, OmataM. Percutaneous radiofrequency ablation for hepatocellular carcinoma. An analysis of 1000 cases.Cancer 2005;103(6):1201–1209. [PubMed: 15690326]
5. Clark HP, Carson WF, Kavanagh PV, Ho CP, Shen P, Zagoria RJ. Staging and current treatment ofhepatocellular carcinoma. Radiographics 2005;25(Suppl 1):S3–23. [PubMed: 16227495]
6. Harrison LE, Koneru B, Baramipour P, Fisher A, Barone A, Wilson D, Dela Torre A, Cho KC,Contractor D, Korogodsky M. Locoregional recurrences are frequent after radiofrequency ablation forhepatocellular carcinoma. J Am Coll Surg 2003;197(5):759–764. [PubMed: 14585410]
7. Yu HC, Cheng JS, Lai KH, Lin CP, Lo GH, Lin CK, Hsu PI, Chan HH, Lo CC, Tsai WL, Chen WC.Factors for early tumor recurrence of single small hepatocellular carcinoma after percutaneousradiofrequency ablation therapy. World J Gastroenterol 2005;11(10):1439–1444. [PubMed:15770718]
8. Gao J, Qian F, Szymanski-Exner A, Stowe N, Haaga J. In vivo drug distribution dynamics inthermoablated and normal rabbit livers from biodegradable polymers. J Biomed Mater Res 2002;62(2):308–314. [PubMed: 12209952]
9. Qian F, Saidel GM, Sutton DM, Exner A, Gao J. Combined modeling and experimental approach forthe development of dual-release polymer millirods. J Control Release 2002;83(3):427–435. [PubMed:12387950]
10. Qian F, Stowe N, Liu EH, Saidel GM, Gao J. Quantification of in vivo doxorubicin transport fromPLGA millirods in thermoablated rat livers. J Control Release 2003;91(1–2):157–166. [PubMed:12932647]
11. Qian F, Stowe N, Saidel GM, Gao J. Comparison of doxorubicin concentration profiles inradiofrequency-ablated rat livers from sustained- and dual-release PLGA millirods. Pharm Res2004;21(3):394–399. [PubMed: 15070087]
12. Szymanski-Exner A, Gallacher A, Stowe NT, Weinberg B, Haaga JR, Gao J. Local carboplatindelivery and tissue distribution in livers after radiofrequency ablation. J Biomed Mat Res 2003;67A(2):510–516.
Weinberg et al. Page 10
J Control Release. Author manuscript; available in PMC 2008 December 4.
NIH
-PA Author Manuscript
NIH
-PA Author Manuscript
NIH
-PA Author Manuscript
13. Weinberg BD, Ai H, Blanco E, Anderson JM, Gao J. Antitumor efficacy and local distribution ofdoxorubicin via intratumoral delivery from polymer millirods. J Biomed Mater Res A 2007;81(1):161–170. [PubMed: 17120197]
14. Weinberg BD, Blanco E, Lempka SF, Anderson JM, Exner AA, Gao J. Combined radiofrequencyablation and doxorubicin-eluting polymer implants for liver cancer treatment. J Biomed Mater ResA 2007;81(1):205–213. [PubMed: 17120205]
15. Qian F, Nasongkla N, Gao J. Membrane-encased polymer millirods for sustained release of 5-fluorouracil. J Biomed Mater Res 2002;61(2):203–211. [PubMed: 12007200]
16. Au JL, Jang SH, Zheng J, Chen CT, Song S, Hu L, Wientjes MG. Determinants of drug delivery andtransport to solid tumors. J Control Release 2001;74(1–3):31–46. [PubMed: 11489481]
17. Banerjee RK, van Osdol WW, Bungay PM, Sung C, Dedrick RL. Finite element model of antibodypenetration in a prevascular tumor nodule embedded in normal tissue. J Control Release 2001;74(1–3):193–202. [PubMed: 11489495]
18. Guse C, Koennings S, Kreye F, Siepmann F, Goepferich A, Siepmann J. Drug release from lipid-based implants: elucidation of the underlying mass transport mechanisms. Int J Pharm 2006;314(2):137–144. [PubMed: 16503388]
19. Siepmann J, Siepmann F, Florence AT. Local controlled drug delivery to the brain: mathematicalmodeling of the underlying mass transport mechanisms. Int J Pharm 2006;314(2):101–119. [PubMed:16647231]
20. Shah SA, Cleary SP, Wei AC, Yang I, Taylor BR, Hemming AW, Langer B, Grant DR, Greig PD,Gallinger S. Recurrence after liver resection for hepatocellular carcinoma: risk factors, treatment andoutcomes. Surgery 2007;141(3):330–339. [PubMed: 17349844]
21. Strasser JF, Fung LK, Eller S, Grossman SA, Saltzman WM. Distribution of 1,3-bis(2-chloroethyl)-1-nitrosourea and tracers in the rabbit brain after interstitial delivery by biodegradable polymerimplants. J Pharmacol Exp Ther 1995;275(3):1647–1655. [PubMed: 8531140]
22. Wang CC, Li J, Teo CS, Lee T. The delivery of BCNU to brain tumors. J Control Release 1999;61(1–2):21–41. [PubMed: 10469900]
23. Tao A, Tao L, Nicholson C. Cell cavities increase tortuosity in brain extracellular space. J Theor Biol2005;234(4):525–536. [PubMed: 15808873]
24. Tan WH, Wang F, Lee T, Wang CH. Computer simulation of the delivery of etanidazole to braintumor from PLGA wafers: comparison between linear and double burst release systems. BiotechnolBioeng 2003;82(3):278–288. [PubMed: 12599254]
25. Kalyanasundaram S, Calhoun VD, Leong KW. A finite element model for predicting the distributionof drugs delivered intracranially to the brain. Am J Physiol 1997;273(5 Pt 2):R1810–1821. [PubMed:9374827]
26. Neeves KB, Lo CT, Foley CP, Saltzman WM, Olbricht WL. Fabrication and characterization ofmicrofluidic probes for convection enhanced drug delivery. J Control Release 2006;111(3):252–262.[PubMed: 16476500]
27. Raghavan R, Brady ML, Rodriguez-Ponce MI, Hartlep A, Pedain C, Sampson JH. Convection-enhanced delivery of therapeutics for brain disease, and its optimization. Neurosurg Focus 2006;20(4):E12. [PubMed: 16709017]
28. Au JL, Jang SH, Wientjes MG. Clinical aspects of drug delivery to tumors. J Control Release 2002;78(1–3):81–95. [PubMed: 11772451]
29. Lu D, Wientjes MG, Lu Z, Au JL. Tumor priming enhances delivery and efficacy of nanomedicines.J Pharmacol Exp Ther 2007;322(1):80–88. [PubMed: 17420296]
30. Qian F, Szymanski A, Gao JM. Fabrication and characterization of controlled release poly(D,L-lactide-co-glycolide) millirods. Journal of Biomedical Materials Research 2001;55(4):512–522.[PubMed: 11288079]
31. Ridge JA, Collin C, Bading JR, Hancock C, Conti PS, Daly JM, Raaf JH. Increased adriamycin levelsin hepatic implants of rabbit Vx-2 carcinoma from regional infusion. Cancer Res 1988;48(16):4584–4587. [PubMed: 3396009]
32. Swistel AJ, Bading JR, Raaf JH. Intraarterial versus intravenous adriamycin in the rabbit Vx-2 tumorsystem. Cancer 1984;53(6):1397–1404. [PubMed: 6692329]
Weinberg et al. Page 11
J Control Release. Author manuscript; available in PMC 2008 December 4.
NIH
-PA Author Manuscript
NIH
-PA Author Manuscript
NIH
-PA Author Manuscript
33. Anderson JM. Mechanisms of inflammation and infection with implanted devices. CardiovascularPathology 1993;2(3 Supplement 1):33–41.
34. Frenning G, Brohede U, Stromme M. Finite element analysis of the release of slowly dissolving drugsfrom cylindrical matrix systems. J Control Release 2005;107(2):320–329. [PubMed: 16081182]
35. Haddish-Berhane N, Nyquist C, Haghighi K, Corvalan C, Keshavarzian A, Campanella O, Rickus J,Farhadi A. A multi-scale stochastic drug release model for polymer-coated targeted drug deliverysystems. J Control Release 2006;110(2):314–322. [PubMed: 16288814]
36. Huang J, Wong HL, Zhou Y, Wu XY, Grad H, Komorowski R, Friedman S. In vitro studies andmodeling of a controlled-release device for root canal therapy. J Control Release 2000;67(2–3):293–307. [PubMed: 10825562]
37. Tzafriri AR. Mathematical modeling of diffusion-mediated release from bulk degrading matrices. JControl Release 2000;63(1–2):69–79. [PubMed: 10640581]
38. Netti PA, Berk DA, Swartz MA, Grodzinsky AJ, Jain RK. Role of extracellular matrix assembly ininterstitial transport in solid tumors. Cancer Res 2000;60(9):2497–2503. [PubMed: 10811131]
39. McGuire S, Zaharoff D, Yuan F. Nonlinear dependence of hydraulic conductivity on tissuedeformation during intratumoral infusion. Ann Biomed Eng 2006;34(7):1173–1181. [PubMed:16791492]
40. Johnson PC, Saidel GM. Thermal model for fast simulation during magnetic resonance imagingguidance of radio frequency tumor ablation. Ann Biomed Eng 2002;30(9):1152–1161. [PubMed:12502226]
41. Coad JE, Kosari K, Humar A, Sielaff TD. Radiofrequency ablation causes ‘thermal fixation’ ofhepatocellular carcinoma: a post-liver transplant histopathologic study. Clin Transplant 2003;17(4):377–384. [PubMed: 12868996]
42. Nikfarjam M, Muralidharan V, Christophi C. Mechanisms of focal heat destruction of liver tumors.J Surg Res 2005;127(2):208–223. [PubMed: 16083756]
43. Blanco E, Weinberg BD, Stowe NT, Anderson JM, Gao J. Local release of dexamethasone frompolymer millirods effectively prevents fibrosis after radiofrequency ablation. J Biomed Mater Res A2006;76(1):174–182. [PubMed: 16265662]
Weinberg et al. Page 12
J Control Release. Author manuscript; available in PMC 2008 December 4.
NIH
-PA Author Manuscript
NIH
-PA Author Manuscript
NIH
-PA Author Manuscript
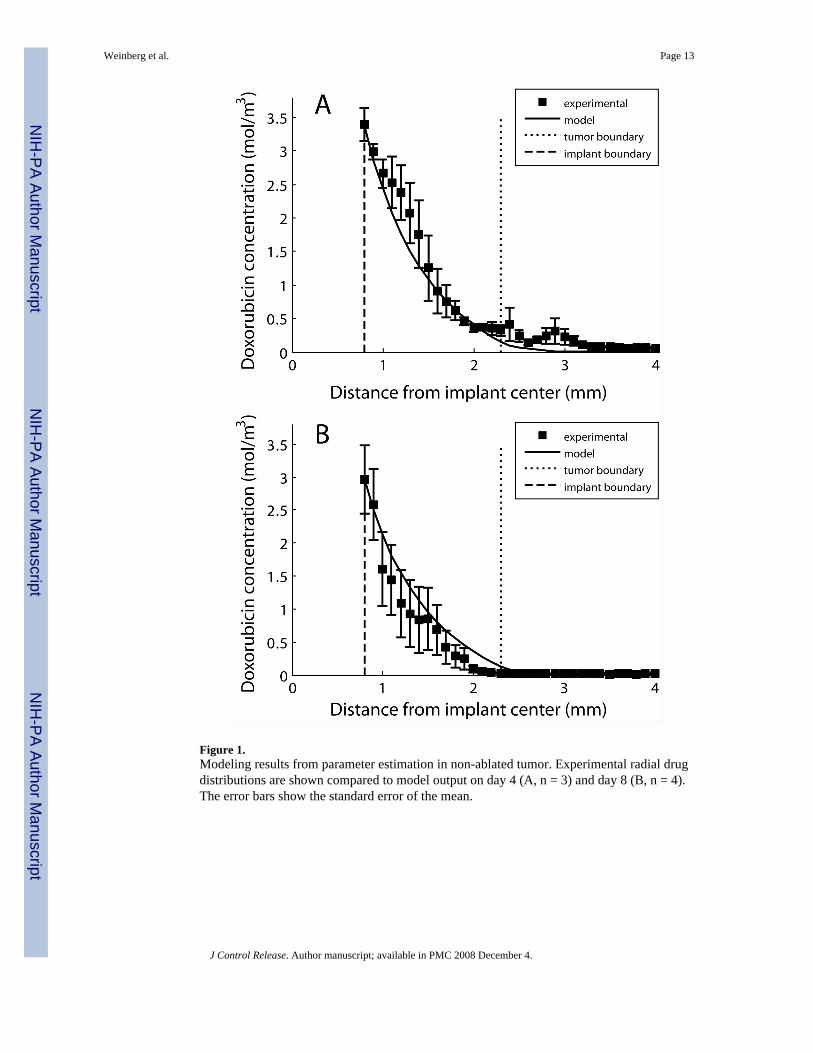
Figure 1.Modeling results from parameter estimation in non-ablated tumor. Experimental radial drugdistributions are shown compared to model output on day 4 (A, n = 3) and day 8 (B, n = 4).The error bars show the standard error of the mean.
Weinberg et al. Page 13
J Control Release. Author manuscript; available in PMC 2008 December 4.
NIH
-PA Author Manuscript
NIH
-PA Author Manuscript
NIH
-PA Author Manuscript
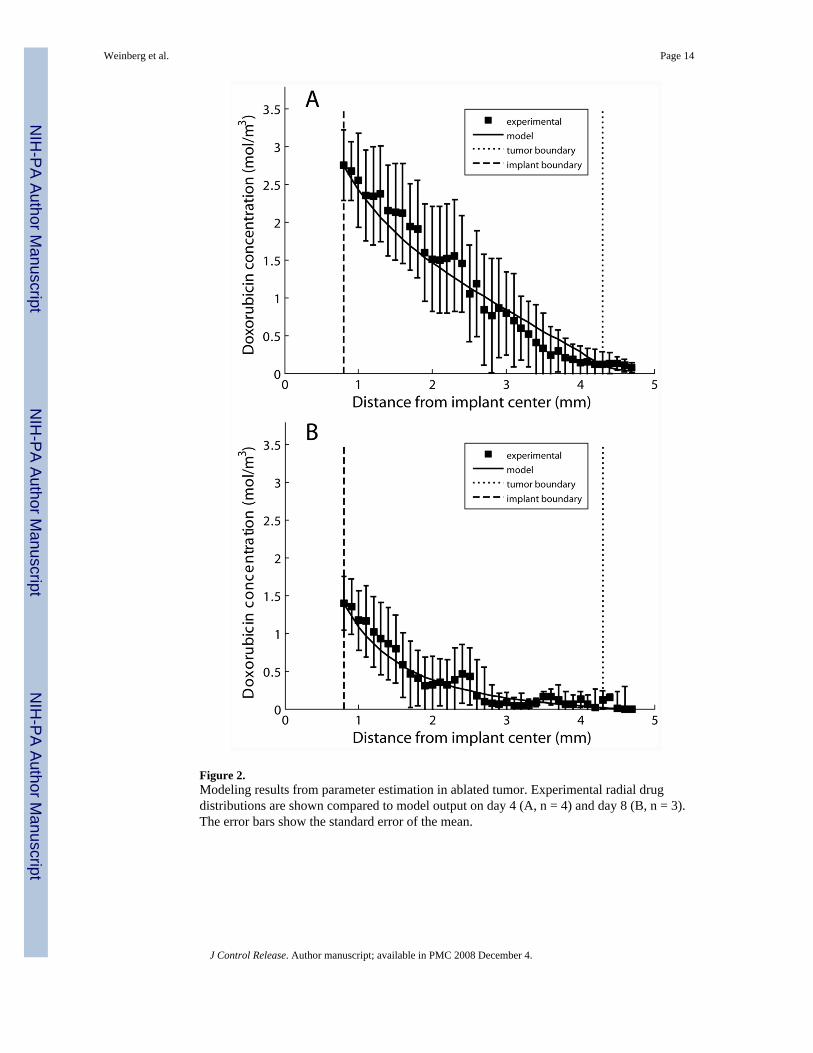
Figure 2.Modeling results from parameter estimation in ablated tumor. Experimental radial drugdistributions are shown compared to model output on day 4 (A, n = 4) and day 8 (B, n = 3).The error bars show the standard error of the mean.
Weinberg et al. Page 14
J Control Release. Author manuscript; available in PMC 2008 December 4.
NIH
-PA Author Manuscript
NIH
-PA Author Manuscript
NIH
-PA Author Manuscript
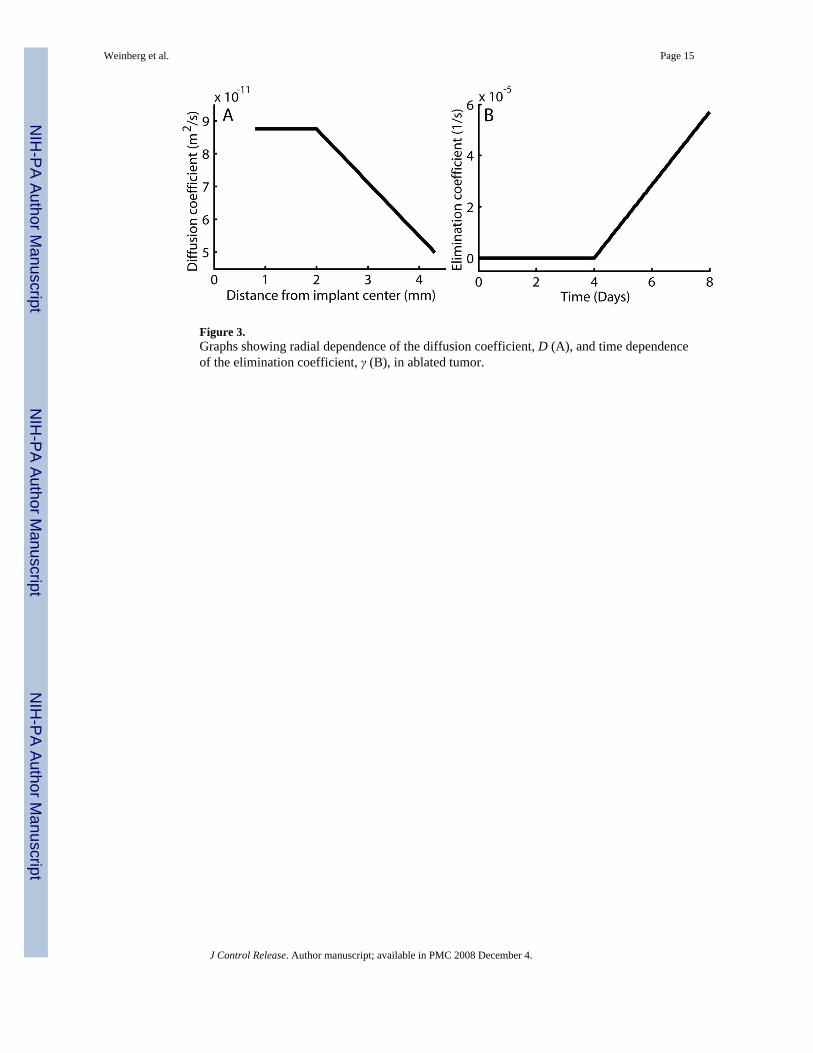
Figure 3.Graphs showing radial dependence of the diffusion coefficient, D (A), and time dependenceof the elimination coefficient, γ (B), in ablated tumor.
Weinberg et al. Page 15
J Control Release. Author manuscript; available in PMC 2008 December 4.
NIH
-PA Author Manuscript
NIH
-PA Author Manuscript
NIH
-PA Author Manuscript
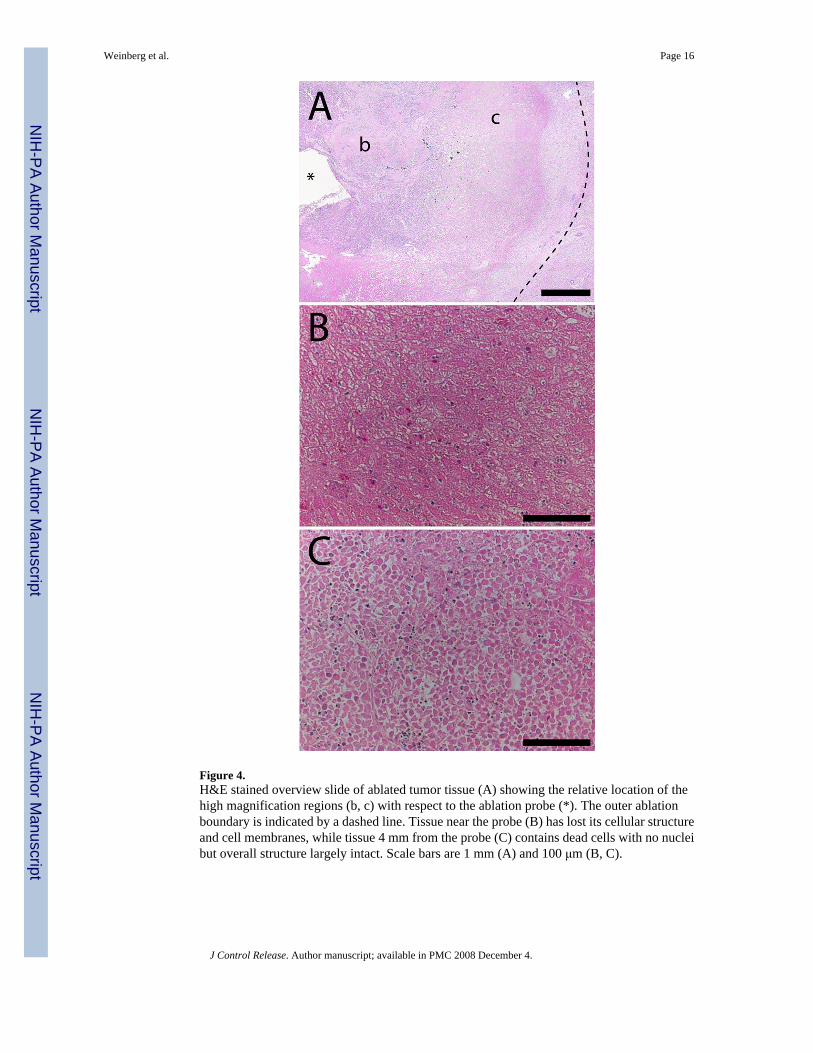
Figure 4.H&E stained overview slide of ablated tumor tissue (A) showing the relative location of thehigh magnification regions (b, c) with respect to the ablation probe (*). The outer ablationboundary is indicated by a dashed line. Tissue near the probe (B) has lost its cellular structureand cell membranes, while tissue 4 mm from the probe (C) contains dead cells with no nucleibut overall structure largely intact. Scale bars are 1 mm (A) and 100 μm (B, C).
Weinberg et al. Page 16
J Control Release. Author manuscript; available in PMC 2008 December 4.
NIH
-PA Author Manuscript
NIH
-PA Author Manuscript
NIH
-PA Author Manuscript
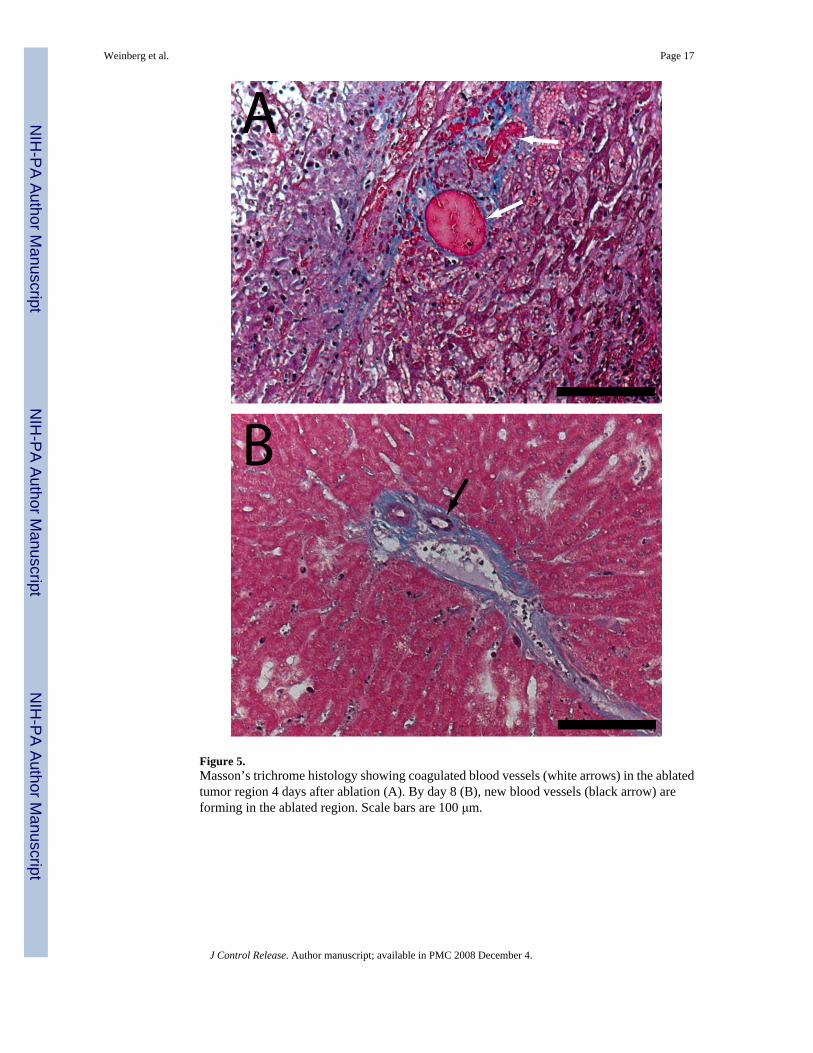
Figure 5.Masson’s trichrome histology showing coagulated blood vessels (white arrows) in the ablatedtumor region 4 days after ablation (A). By day 8 (B), new blood vessels (black arrow) areforming in the ablated region. Scale bars are 100 μm.
Weinberg et al. Page 17
J Control Release. Author manuscript; available in PMC 2008 December 4.
NIH
-PA Author Manuscript
NIH
-PA Author Manuscript
NIH
-PA Author Manuscript
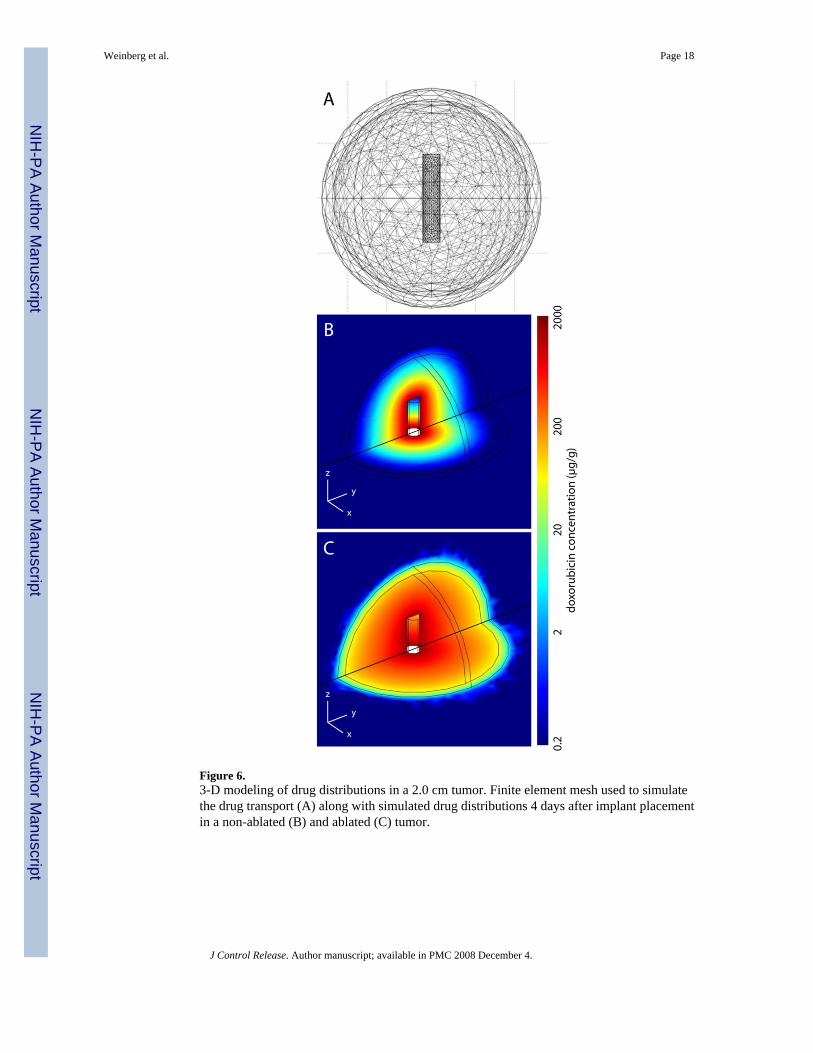
Figure 6.3-D modeling of drug distributions in a 2.0 cm tumor. Finite element mesh used to simulatethe drug transport (A) along with simulated drug distributions 4 days after implant placementin a non-ablated (B) and ablated (C) tumor.
Weinberg et al. Page 18
J Control Release. Author manuscript; available in PMC 2008 December 4.
NIH
-PA Author Manuscript
NIH
-PA Author Manuscript
NIH
-PA Author Manuscript
NIH
-PA Author Manuscript
NIH
-PA Author Manuscript
NIH
-PA Author Manuscript
Weinberg et al. Page 19
Table 1Summary of doxorubicin transport parameters in liver and liver tumor.
Diffusion (m2/s, × 10−11) Elimination (1/s, × 10−4)
Liver* Non-ablated 6.7 9.6Ablated 1.1 0
Tumor Non-ablated 5.01 ± 0.32 0.58 ± 0.04Ablated 8.76 ± 0.41 (center) 0 (days 0–4)
5.01 ± 0.32 (periphery) 0.57 ± 0.03 (day 8)
Values are shown ± 95% confidence interval.
*indicates that the values were taken from Qian, et al. [10]
J Control Release. Author manuscript; available in PMC 2008 December 4.