modeling and analysis of cellular wireless machine-to-machine communication traffic
TRANSCRIPT
Modeling and Analysis of Cellular Wireless Machine-to-Machine Communication Traffic
Harish Viswanathan, Kyung Mun and Franck Scholler Alcatel Lucent, Bell Labs
600 Mountain Avenue, Room 2C 518 Murray Hill, NJ
Email: [email protected]
Abstract – Machine-to-machine (M2M) communications is poised to become a significant fraction of all mobile cellular devices in the near future. M2M involves communications between a network based application and embedded devices in vertical industries such as automotive, healthcare, vending, point-of-sale, security, and general remote monitoring and control. With such large numbers of M2M devices expected to be deployed in the future, one important concern is how much traffic these devices will generate, and what will be their impact on the network. This is particularly important because the characteristics of traffic generated by M2M devices will be substantially different from that of traditional human devices such as smart phones and tablets. We study different use cases across the different verticals and model the traffic associated with cellular M2m communications. Our focus is on modeling on a per device basis, how many transactions are generated on an hourly basis, and how many bytes are exchanged in each transaction. With this model, we then generate aggregate hourly average traffic statistics that will be transported over the network. We project aggregate traffic separately for each of the major technologies GSM/GPRS, UMTS WCDMA, and CDMA EV-DO. As expected, our finding is that these devices generate a disproportionately large amount of signaling traffic relative to the data traffic generated. Our results show that M2M traffic could consume up to 33% of deployed signaling capacity in the network while consuming less than 1% of the data throughput capacity.
I. Introduction
Mobile network operators are making significant investments in M2M communications for providing
connectivity as well as value added services to M2M application providers and enterprises. M2M includes a
variety of vertical applications such as the remote patient monitoring (e-health), smart metering, connected
car applications, fleet management, vending machines and retail point of sale terminals based
applications. With saturation in voice revenues, MNOs are looking at data connections for revenue growth.
The number of connected devices deployed is projected to be close 50 Billion devices by 2020 [3], of which
cellular connected M2M devices will be about 2 Billion [4].
With such large numbers of M2M devices likely to be deployed in the future, one important concern is how
much traffic these devices will generate, and what will be their impact on the network. This is particularly
important because the characteristics of traffic generated by M2M devices will be substantially different
from that of traditional human devices such as smart phones and tablets. M2M devices generally
communicate short bursts of data intermittently, which is quite different from voice and video traffic. The
mobile networks are being designed for human generated traffic and thus it is particularly important to
understand their ability to handle machine traffic.
Standards organizations such as 3GPP that provide the standards for technology such as HSPA, LTE are
incorporating standards modifications to accommodate M2M traffic, starting with overload protection of
the network [5]. However, there is no systematic forecast of cellular M2M traffic available in the literature.
In this paper, we focus on modeling the traffic from/to devices across different verticals. Our focus is on
modeling on a per device basis, how many transactions are generated on an hourly basis, and how many
bytes are exchanged in each transaction. With this model, we then generate aggregate hourly average
traffic statistics that will be transported over the network. We project aggregate traffic separately for each of
the major technologies GSM/GPRS, UMTS WCDMA, and CDMA EV-DO. As expected, our finding is that
these devices generate a disproportionately large amount of signaling traffic relative to the data traffic
generated. We quantify how much more the signaling traffic impact on the network is. One of the goals of
traffic modeling is to understand the impact of the traffic on the network. We apply our traffic model to
project traffic for the NYC Metro area and estimate what proportion of the resources of a typical network in
that NYC Metro area get consumed by M2M traffic.
The paper is organized as follows. In section II we describe our overall methodology for modeling the M2M
data plane and control plane traffic. In Section III, we describe the traffic model for each of the verticals
that we consider. In Section IV we present our traffic projections for the NY Metro area. In Section V we
present our findings on the impact on the network.
II. Modeling Methodology
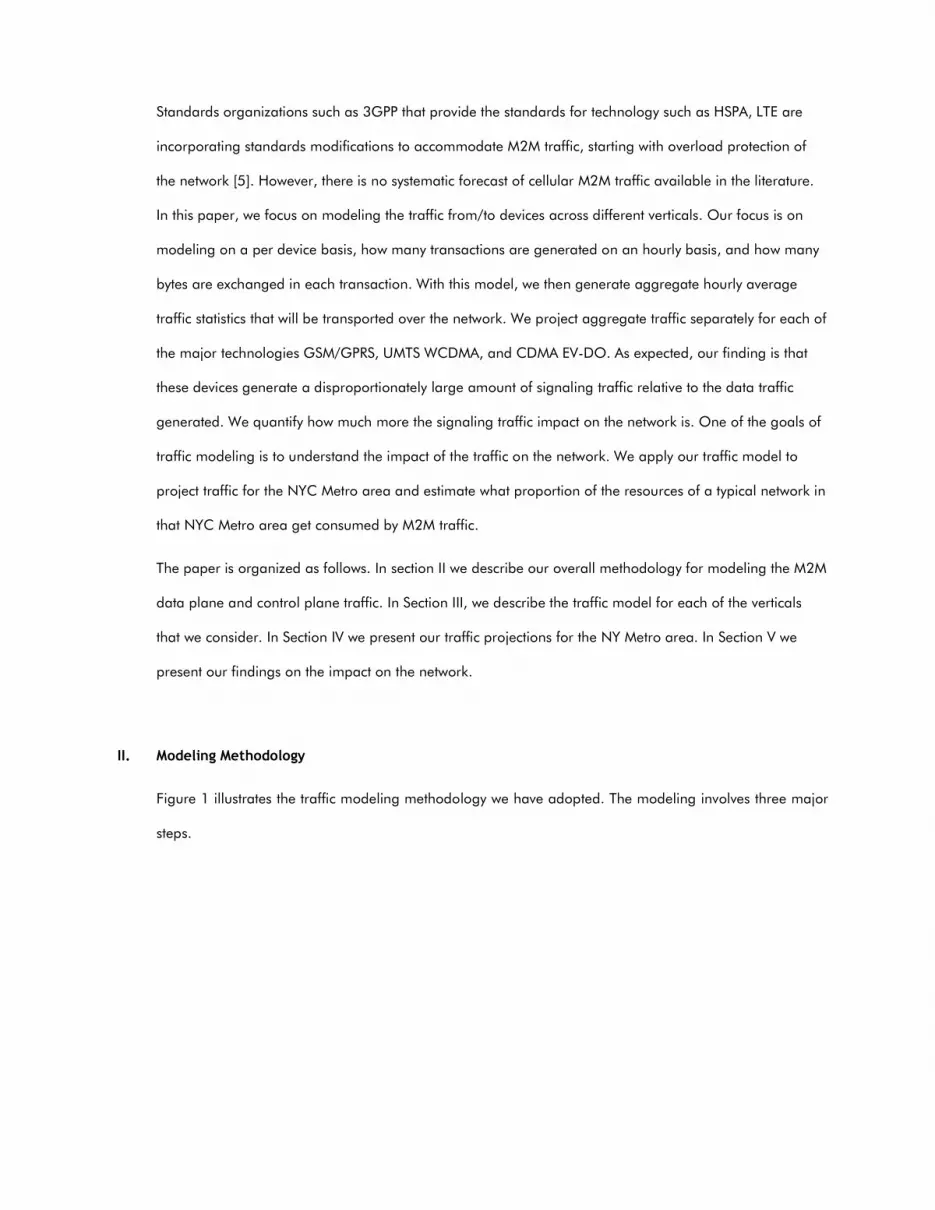
Figure 1 illustrates the traffic modeling methodology we have adopted. The modeling involves three major
steps.
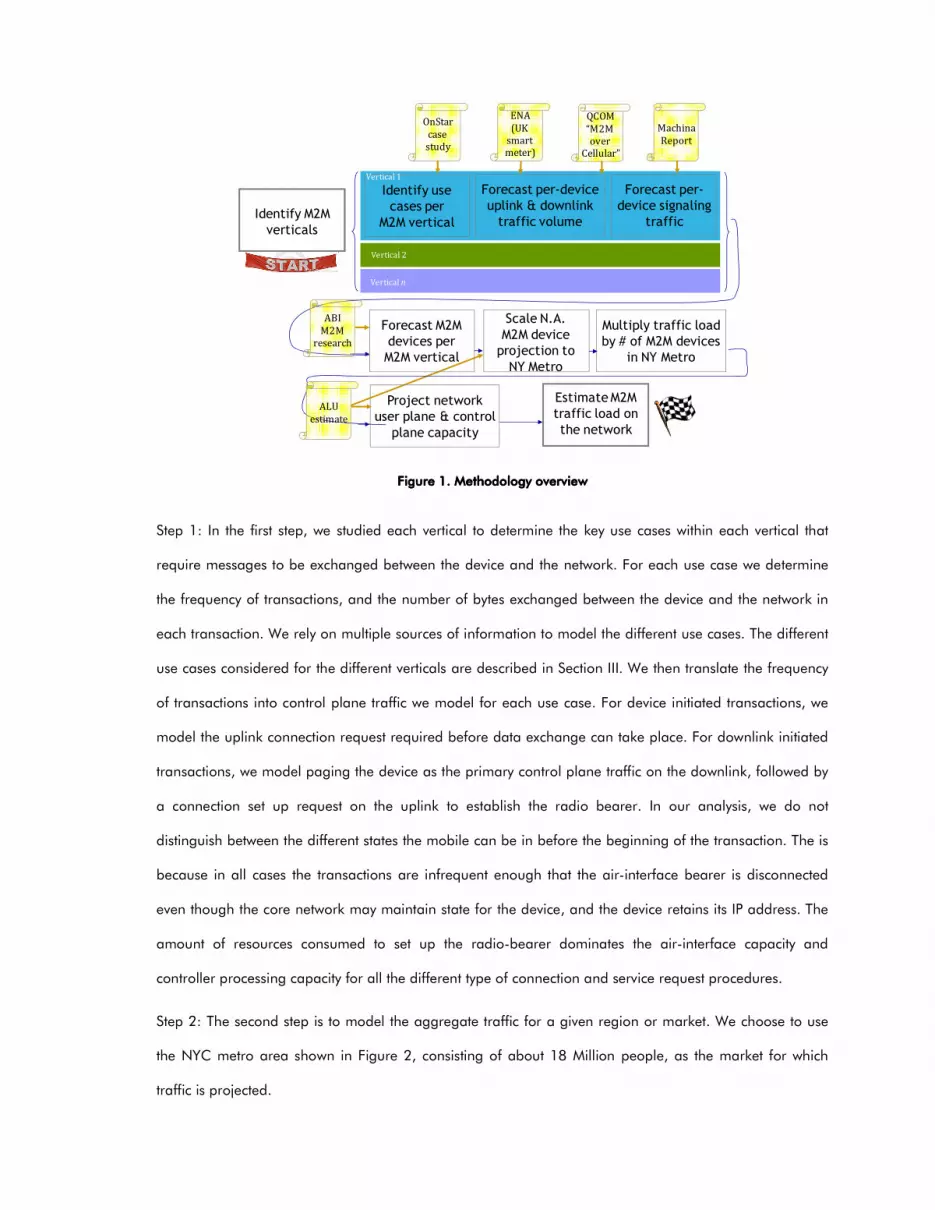
Figure Figure Figure Figure 1111. Methodology overview. Methodology overview. Methodology overview. Methodology overview
Step 1: In the first step, we studied each vertical to determine the key use cases within each vertical that
require messages to be exchanged between the device and the network. For each use case we determine
the frequency of transactions, and the number of bytes exchanged between the device and the network in
each transaction. We rely on multiple sources of information to model the different use cases. The different
use cases considered for the different verticals are described in Section III. We then translate the frequency
of transactions into control plane traffic we model for each use case. For device initiated transactions, we
model the uplink connection request required before data exchange can take place. For downlink initiated
transactions, we model paging the device as the primary control plane traffic on the downlink, followed by
a connection set up request on the uplink to establish the radio bearer. In our analysis, we do not
distinguish between the different states the mobile can be in before the beginning of the transaction. The is
because in all cases the transactions are infrequent enough that the air-interface bearer is disconnected
even though the core network may maintain state for the device, and the device retains its IP address. The
amount of resources consumed to set up the radio-bearer dominates the air-interface capacity and
controller processing capacity for all the different type of connection and service request procedures.
Step 2: The second step is to model the aggregate traffic for a given region or market. We choose to use
the NYC metro area shown in Figure 2, consisting of about 18 Million people, as the market for which
traffic is projected.
Identify M2M
verticals
Forecast per-device
uplink & downlink
traffic volume
Identify use
cases per
M2M vertical
Multiply traffic load
by # of M2M devices
in NY Metro
Forecast per-
device signaling
traffic
Project network
user plane & control
plane capacity
Estimate M2M
traffic load on
the network
Forecast M2M
devices per
M2M vertical
Vertical 1
Vertical 2
Vertical n
ABI
M2M
research
ALU
estimate
OnStar
case
study
ENA
(UK
smart
meter)
QCOM
“M2M
over
Cellular”
Machina
Report
Scale N.A.
M2M device
projection to
NY Metro

Figure Figure Figure Figure 2222. NY Metro area/region. NY Metro area/region. NY Metro area/region. NY Metro area/region
To this end, we use data from ABI Research [2] that provides the number of M2M devices by technology
and vertical application. We take 7% of the total projected number of devices deployed to be resident in
the NYC metro area under consideration. The 7% number is based on population density of the region
relative to the whole of North America. Once we have determined the projected number of devices for
each vertical in the NY metro area, we can determine the total traffic for the region by multiplying the
traffic per device determined in the previous step by the number of devices. This gives the total amount of
traffic for this region. We assume that this traffic is spatially distributed uniformly throughout this region.
Step 3: The final step in our modeling exercise is to determine the impact of the traffic on the network. To
this end, for each technology we model the number of base stations and radio network controllers (RNCs)
that will be deployed by a typical mobile network operator (MNO) serving that area with a particular
market penetration. Once we determine the number of base stations and RNCs, we can translate that into
a network capacity for the region for carrying both traffic and signaling. This is described in Section V. We
can thus calculate the proportion of the resources that will be consumed by the projected M2M traffic
calculated in Step 2.

We do not include mobility related events such as handoff signaling or location or tracking area updates in
our study. This needs to be included in future studies.
III. M2M Vertical Segments and Use Cases
a. Vehicle Telematics
For cellular-based Vehicle Telematics traffic modeling, we focused primarily on fleet management and
consumer-focused telemetry services like GM OnStar (see Table 1). In fleet management application, a
control center tracks each vehicle for many purposes and each vehicle sends periodically sends its location
along with other relevant information to the control center. In our model, much of the underlying traffic
profile such as downlink and uplink payload size, frequency of tracking is based on “M2M over CDMA”
data from China in which a 350-byte uplink payload is sent to the control center every 20 seconds and 70-
byte acknowledgement is sent back on the downlink [11].
For other telemetry services, such as remote unlock, diagnostics, roadside assistance, theft recovery,
navigation, etc., the traffic profile is based on publicly available statistics of the GM OnStar service in North
America which provide many of the services noted:
• 46,000 remote unlock per month [14]
• 30,000 remote diagnostics monthly average [14]
• 27,000 roadside assistance monthly average [14]
• 15,000 emergency calls monthly average [14]
• 600 stolen recovery each month over the 5M subscriber base [12]
• 1,700 navigation routes per hour [15]
• 136,000 average daily calls from 5.5M subscriber base [13]
Table 1 captures a summary of the per-unit traffic profile based on the monthly averages scaled down to
daily usage assuming usage pattern is uniform.
Table Table Table Table 1111. Vehicle Telematics application use cases. Vehicle Telematics application use cases. Vehicle Telematics application use cases. Vehicle Telematics application use cases
With increasing proliferation of electronics within vehicles, combined with faster mobile broadband like
LTE, we expect increasing innovation in vehicular applications and services, and resulting increase in traffic.
b. Security
Surveillance and security devices are mainly deployed in residential and small business premises to provide
alarm messages, pictures or videos surveillance information to security alarm applications. The primary
mode of connectivity for security systems deployed already is typically wireline with cellular wireless used for
back up connectivity. With falling wireless connectivity cost, wireless is becoming the primary mode since it
is much more convenient than wireline. The high throughputs available through cellular data networks
such as the 3GPP high speed packet access (HSPA) and LTE are also enabling video based surveillance
equipment to be deployed through wireless connectivity.
The key use cases and associated traffic model parameters are illustrated in Table 2. The use cases are
• Connect-Disconnect: Daily basic connectivity establishment related transaction.
• Daily Presence Control – Ensuring that the presence detection application works properly as
intended by registering presence during alarm on/off periods.
• Alerting – Sending alerts from the device because of any unexpected mal-function or other alarms.
• Presence detection – Sending an alert upon motion or presence sensing is triggered.
% of vehicle
units per day
Uplink payload size per
message (bytes)
Downlink payload size per
message (bytes)
Function from to0. Frequentation curve 0 24
A. Vehicular tracking / fleet management 0 24 16.00% 350 70B. Remote services (unlock, diagnostics) 0 24 0.05% 500 500C. Roadside assitance/ emergency call 0 24 0.04% 500 100D. Insurance 8 22 22.00% 14000 5600E. Vehicle recovery/ theft prevention 0 24 0.0004% 500 10000F. Navigation 0 24 0.74% 2000 100000G. Lease/ rental/ ride share 8 22 2.30% 5000 5000H. Voice Communication system support 0 24 2.47% 195000 195000K. Maintenance Data support transfert 0 24 1.00% 100000 5000L. Car System data transfert (Firware, 0 24 0.10% 5000 2000
data upload/monitoring every 30min
1% of ITS cars systems during 20 min
600 stolen recovery from 5M subs each month1700 navigation routes per hourlease once a month
27000 roadside assist; 31200 e-calls a month
Hour of day when
activity will occur
Transaction volume assumptions
vehicle sends its location/info on UL & control
136000 avg. daily calls from 5.5M subs; 2 mins/hr
0.1% of ITS cars systems during 20 min
46000 unlock; 30000 diagnostics monthly avg

• Fire detection – Sending an alert when fire is detected.
• Power shut down detection – Send an alert indicating lack of power
• Presence pictures – In case the security device is equipped with a camera, snap shots may be
captured upon presence/motion detection and subsequently transmitted. Each picture is set at 100
Kbytes
• Presence video – When the device is a video camera, video is captured and transmitted upon
presence or motion detection. The model uses a 20 minute video session. Since the video traffic
will dominate and mask all other traffic, we do not include this use case in our aggregate
modeling.
• Management use cases – firmware upgrades, security exchange and network time synchronization
are standard uses cases for all vertical applications.
Table Table Table Table 2222 Security systems use casesSecurity systems use casesSecurity systems use casesSecurity systems use cases
% of
Alarms
per day
Uplink payload
size per
transaction
(bytes)
Downlink
payload size
per transaction
(bytes)
AMI Function from to
A. Connect-Disconnect 0 24 100.00% 5,000 2,000
B. Daily presence
control 0 24 100.00% 200 200
C. Altering settings 8 21 2.00% 200 500
D. Presence Detection 0 24 0.20% 500 200
E. Fire detection 0 24 0.10% 500 200
F. Power Shut down
detection 0 24 0.05% 500 200
G. Reading events logs
(individual) 8 18 2.00% 1,000 200
H. Reading events logs
(all) 8 18 14.29% 2,000 200
I. Presence Pictures
taken 0 24 3.00% 100,000 500
J. Presence Video
taken 0 24 3.00% 90,000,000 500
J. Firmware
0 7 3.33% 10,000 100,000
K. Reg, De-reg, Auth,
Key exchange 0 24 100.00% 1,000 1,000
L. NTP 0 24 100.00% 500 500
All meters within 30 days in 7 hours per
day
All meters in 24 hours
All meters evenly over 24 hours
0.1% of Alarms within 30 days
0.05% of Alarms within 30 days
2% of meters
100% of meters in 7 days,10 hours (8 AM
to 6 PM) per day
3% of Alarms within 30 days 5 min
3% of Alarms within 30 days 20 min
Hour of day when
activity will occur
Transaction volume assumptions
All systems over 24 hours
2 times per days for all systems
2% of devices in 13 hours
0.2% of Alarms within 30 days
c. Telehealth
For cellular network traffic modeling of the Telehealth vertical, the primary use cases are the ones involving
remote monitoring of health related information through mobile devices that do not constrain people to
remain within the hospitals or homes. There are two major categories of use cases within the remote
monitoring for telehealth, namely, connected wellness and patient monitoring. Connected wellness refers
to healthy people keeping track of their physical condition, for example, monitoring the heart rate during
exercise, or monitoring their weight through a connected weight scale. Patient monitoring refers to use
cases where vital statistics of patients with chronic diseases such as diabetes, hypertension, or other cardio
vascular diseases.
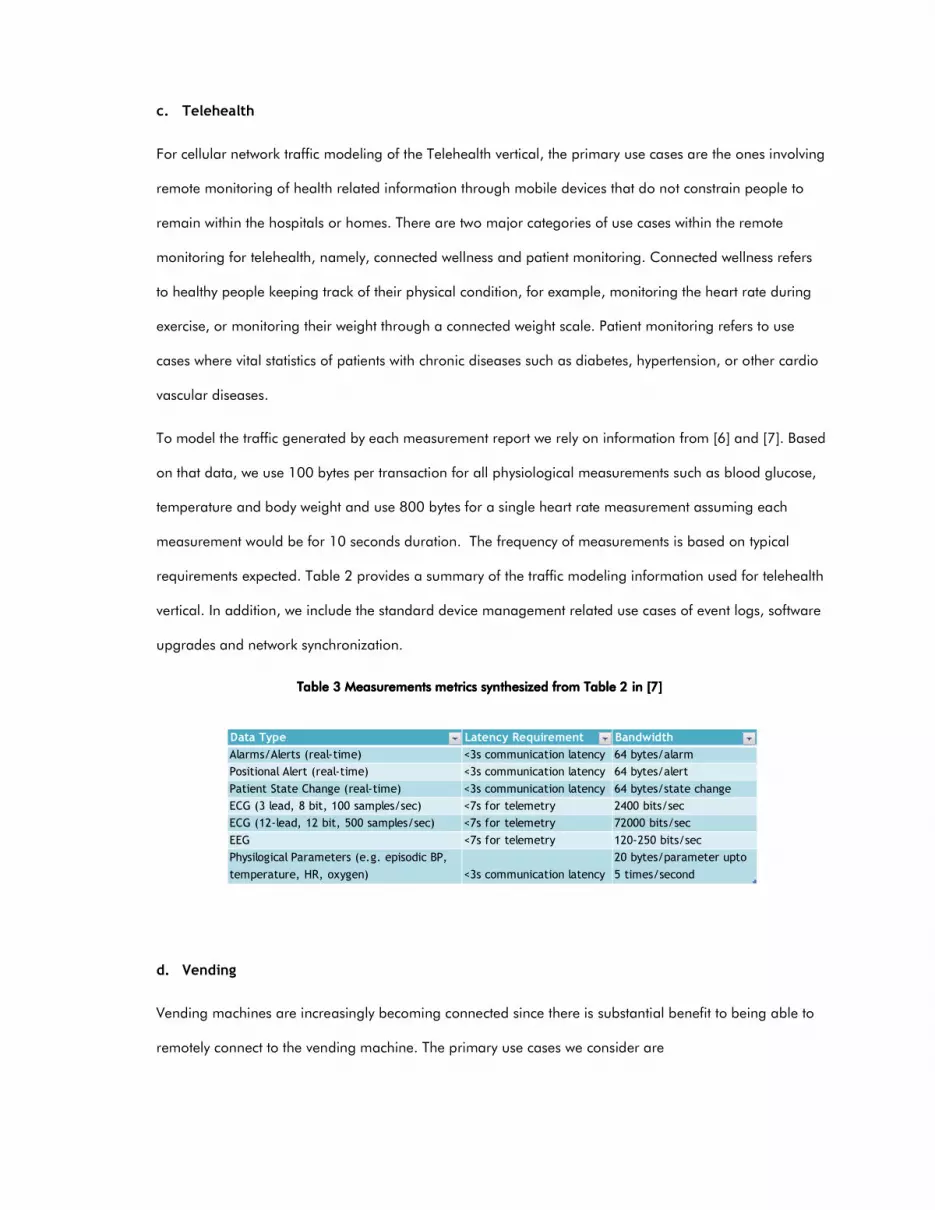
To model the traffic generated by each measurement report we rely on information from [6] and [7]. Based
on that data, we use 100 bytes per transaction for all physiological measurements such as blood glucose,
temperature and body weight and use 800 bytes for a single heart rate measurement assuming each
measurement would be for 10 seconds duration. The frequency of measurements is based on typical
requirements expected. Table 2 provides a summary of the traffic modeling information used for telehealth
vertical. In addition, we include the standard device management related use cases of event logs, software
upgrades and network synchronization.
Table Table Table Table 3333 Measurements metrics Measurements metrics Measurements metrics Measurements metrics synthesized from Table 2 in [7]synthesized from Table 2 in [7]synthesized from Table 2 in [7]synthesized from Table 2 in [7]
d. Vending
Vending machines are increasingly becoming connected since there is substantial benefit to being able to
remotely connect to the vending machine. The primary use cases we consider are
Data Type Latency Requirement Bandwidth
Alarms/Alerts (real-time) <3s communication latency 64 bytes/alarm
Positional Alert (real-time) <3s communication latency 64 bytes/alert
Patient State Change (real-time) <3s communication latency 64 bytes/state change
ECG (3 lead, 8 bit, 100 samples/sec) <7s for telemetry 2400 bits/sec
ECG (12-lead, 12 bit, 500 samples/sec) <7s for telemetry 72000 bits/sec
EEG <7s for telemetry 120-250 bits/sec
Physilogical Parameters (e.g. episodic BP,
temperature, HR, oxygen) <3s communication latency
20 bytes/parameter upto
5 times/second
• Processing sales for cashless vending machines - In this case, purchases from vending machines
are done using a credit or debit card or through mobile payment. The transaction involves sending
the credentials and the amount for authorization before the vending machine delivers the goods to
the user. The transaction in this case is similar to a point-of-sale terminal described in the next
section.
• Retrieving vending machine inventory – Prior to refilling the vending machine, the current inventory
levels are gathered to make sure that the service man carries the right products for each of the
vending machines in the route.
• Price changes – Price of different products vended can be updated remotely whenever desired.
• Alerting – The vending machine can be programmed to alert the central network application upon
events such as security breach or tampering and environmental conditions such as temperature or
humidity inside the machine crossing acceptable limits.
• Reading Events – The network can read various data recorded in the vending machine on a
periodic basis or on demand.
• Management use cases – As with all other use cases, we also include device management,
software or firmware upgrades, security exchange, and network time synchronization use cases.
Table 4 below provides the summary of modeling parameters for the various use cases outlined above.
The frequency of transactions is estimated based on the description of the use case above. The connect-
disconnect use case is the generic use case to establish a cellular network connection to register the
vending machine application with the central network application.

Table Table Table Table 4444 Modeling of vending machine use caModeling of vending machine use caModeling of vending machine use caModeling of vending machine use casessessesses
e. Automatic Teller Machines (ATM) and Point of Sale (PoS) Terminals
Wireless POS terminals and ATMs are becoming increasingly common since being untethered offers a lot
of flexibility. It enables payment for services that are rendered away from any buildings or other wired
infrastructure such as in a Taxi or in the parking lot of a rental car company. The primary transaction
involved between a PoS terminal and the network based application in simply the transmission of the
customer’s credentials, the type of service offered, payment amount by PoS terminal and receipt of the
approval. ATM machines transactions are also similar.
The typical call flow for a PoS transaction is reproduced from [8]. According to [8], a single transaction
involves sending less than 1000 bytes from the POS terminal and the average transaction rate is one every
5 minutes or about 12 per hour. This data is used to model the primary use case for the ATM/PoS vertical
in Table 5. Additional use cases include on demand retrieval of information from ATM/PoS terminals from
the network, and other generic use cases such as sending event logs, updating data bases,
software/firmware upgrades of the terminal, and network synchronization related transactions as shown in
Table 5.
Uplink
payload
size
(bytes)
Downlink
payload
size
(bytes)
Vending Use Case from to
A. Connect-Disconnect 0 24 100.00% 5000 2000
B. Sales products 7 22 100.00% 5000 5000
C. Altering 0 24 2.00% 200 500
D. Reading settings 0 24 2.00% 1000 200
E. Reading events logs (individual) 0 24 2.00% 1000 200
F. Reading events logs (all) 1 5 14.29% 2000 200
H. Price Change / Refilling Machine 8 17 6.67% 5000 5000
I. Security Alarms 0 24 100.00% 1000 1000
J. Firmware 1 6 3.33% 50000 1000000
K. Reg, De-reg, Auth, Key exchange 0 24 100.00% 1000 1000
L. NTP 0 24 100.00% 500 500
All Vending Machines in 24 hours
All Vending Machines evenly over 24 hours
% of
machines
per day
2% of vending Machines
2% of vending Machines
100% of Vending Machines in 7 days,4
All Machines within 15 days in 20 minutes
100% of vending Machines with 1%
All Machines within 30 days in 5 hours per
Hour of day when
activity will occur
Transaction volume assumptions
100% of Vending Machines connected
100% of Vending Machines based on
2% of vending Machines

Table Table Table Table 5555 Modeling of ATM/POModeling of ATM/POModeling of ATM/POModeling of ATM/POS TrafficS TrafficS TrafficS Traffic
f. Advanced Metering
Smart grid includes several different applications including advanced meter reading for demand response,
outage monitoring, service switching, transmission and distribution equipment monitoring, substation
equipment monitoring and control, and alternate energy source monitoring and control. However, utilities
tend to rely on private networks for most of these applications except for the advance metering or smart
metering. For traffic modeling, we focus our attention only on the smart metering related use cases.
The use cases considered for Smart Metering/Advanced metering along with the frequency and volume of
transactions are provided in Table 6. We have based on the modeling based on smart metering use cases
in the smart grid interoperability forum.
% of
Systems
per day
Uplink
volume per
transaction
(bytes)
Downlink
volume per
transaction
(bytes)
ATM/POS Use Case from to
Connect-Disconnect 7 20 100.00% 5000 5000Withdrawal/Payment Transactions 8 20 100.00% 1000 100
Reading events logs (individual) 8 20 5.00% 1000 200
Reading events logs (all) 7 10 14.29% 2000 200
Data base update 7 10 23.33% 10000 200000
Software update 7 10 3.33% 10000 1000000
Reg, De-reg, Auth, Key exchange 7 20 100.00% 1000 1000
NTP 7 20 100.00% 500 500
100% of POS on line over 5 mins
5% of POS in 60 minutes
100% of meters in 7 days, 3 hours ( 7 to
100% of meters in 6 hours within 1 week
All meters within 30 days in 2 hours per
All meters in 24 hours
All meters evenly over 24 hours
Hour of day when
activity will occur
Transaction Frequency Assumptions
POS over 13 hours
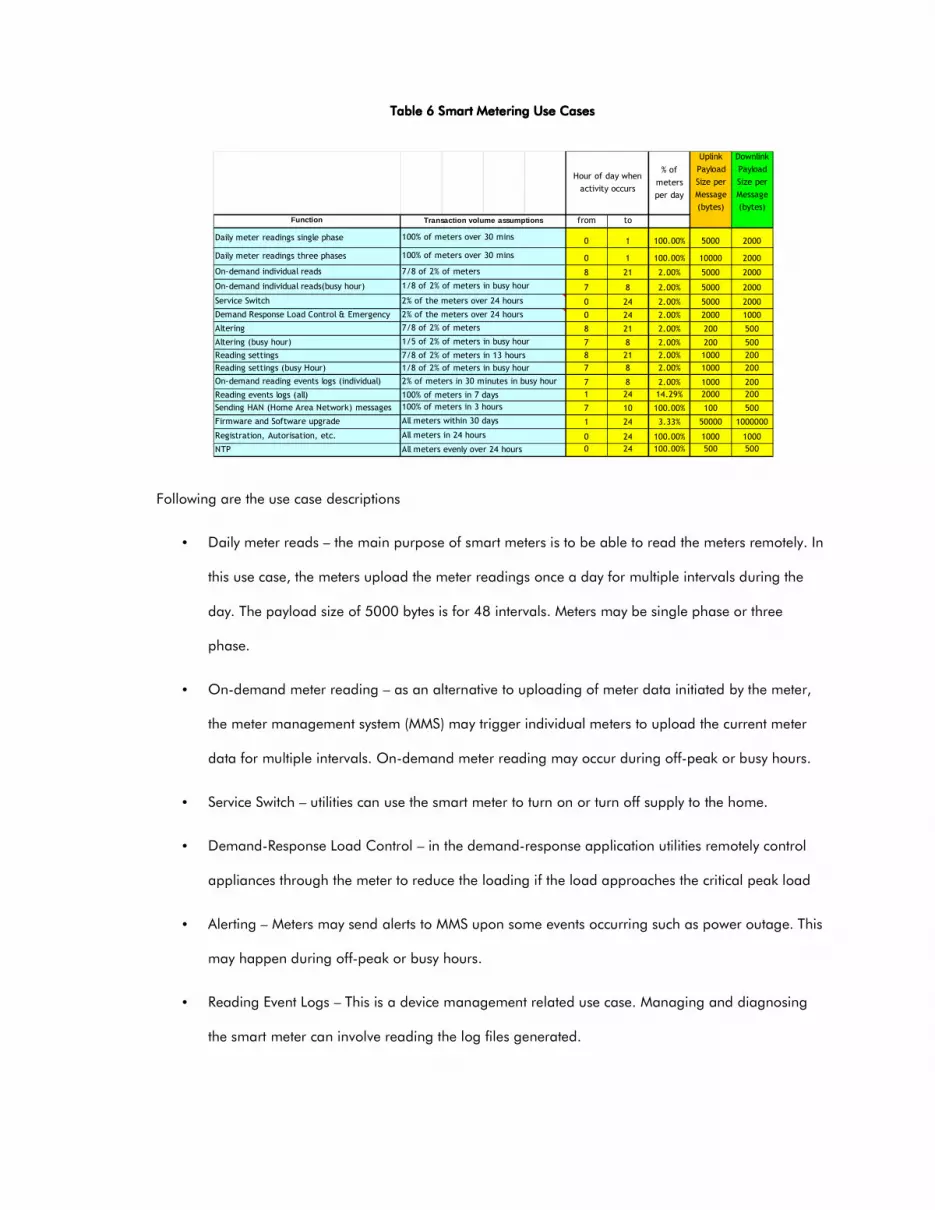
Table Table Table Table 6666 Smart Metering Use CasesSmart Metering Use CasesSmart Metering Use CasesSmart Metering Use Cases
Following are the use case descriptions
• Daily meter reads – the main purpose of smart meters is to be able to read the meters remotely. In
this use case, the meters upload the meter readings once a day for multiple intervals during the
day. The payload size of 5000 bytes is for 48 intervals. Meters may be single phase or three
phase.
• On-demand meter reading – as an alternative to uploading of meter data initiated by the meter,
the meter management system (MMS) may trigger individual meters to upload the current meter
data for multiple intervals. On-demand meter reading may occur during off-peak or busy hours.
• Service Switch – utilities can use the smart meter to turn on or turn off supply to the home.
• Demand-Response Load Control – in the demand-response application utilities remotely control
appliances through the meter to reduce the loading if the load approaches the critical peak load
• Alerting – Meters may send alerts to MMS upon some events occurring such as power outage. This
may happen during off-peak or busy hours.
• Reading Event Logs – This is a device management related use case. Managing and diagnosing
the smart meter can involve reading the log files generated.
% of
meters
per day
Uplink
Payload
Size per
Message
(bytes)
Downlink
Payload
Size per
Message
(bytes)
Function from to
Daily meter readings single phase 0 1 100.00% 5000 2000
Daily meter readings three phases 0 1 100.00% 10000 2000
On-demand individual reads 8 21 2.00% 5000 2000
On-demand individual reads(busy hour) 7 8 2.00% 5000 2000
Service Switch 0 24 2.00% 5000 2000
Demand Response Load Control & Emergency 0 24 2.00% 2000 1000
Altering 8 21 2.00% 200 500
Altering (busy hour) 7 8 2.00% 200 500
Reading settings 8 21 2.00% 1000 200
Reading settings (busy Hour) 7 8 2.00% 1000 200
On-demand reading events logs (individual) 7 8 2.00% 1000 200
Reading events logs (all) 1 24 14.29% 2000 200
Sending HAN (Home Area Network) messages 7 10 100.00% 100 500
Firmware and Software upgrade 1 24 3.33% 50000 1000000
Registration, Autorisation, etc. 0 24 100.00% 1000 1000
NTP 0 24 100.00% 500 500
2% of meters in 30 minutes in busy hour
100% of meters in 7 days
100% of meters in 3 hours
All meters within 30 days
All meters in 24 hours
All meters evenly over 24 hours
2% of the meters over 24 hours
2% of the meters over 24 hours
7/8 of 2% of meters
1/5 of 2% of meters in busy hour
7/8 of 2% of meters in 13 hours
1/8 of 2% of meters in busy hour
Hour of day when
activity occurs
Transaction volume assumptions
100% of meters over 30 mins
100% of meters over 30 mins
7/8 of 2% of meters
1/8 of 2% of meters in busy hour

• HAN messages through the meter – The smart meter can be the gateway to connected home
appliances, and home automation or home energy management related use cases may be sent
through the meter.
• Firmware and software upgrades – This is also a device management related use case. The
management server can download new applications or modify the firmware of the meter.
• Security – the meters have to register with the MMS periodically and get authenticated prior to
transmission of information. Authenticated status will typically be retained for 24 hours after which
the meter will have to register again.
g. Industrial Automation and Remote Monitoring
Industrial automation and remote monitoring devices are used to provide automatic exchange of
information between industrial equipment and infrastructure such as bridges, tunnels. Data is gathered
from these devices that provide valuable information about the machine or infrastructure that is then
analyzed to assess the reliability or determine required maintenance activities. The goal is to improve the
efficiency of operations. Equipment monitored includes elevators, large heating and ventilation systems,
power systems, and environmental sensors, and are typically the ones that require intelligent supervisory
and data acquisition between the equipment and the application servers.
Industrial automation and remote monitoring application use cases are similar to those of the advanced
metering. We use essentially the same set of use cases with slightly different payload sizes for these two set
of applications. Because of lack of reliable information, we use our own model parameters for these two
application categories.
IV. M2M Growth Forecast
With computing cost coming down, a proliferation of M2M devices is expected to continue its steady
upward trend across all major vertical segments. According to ABI Research [2], cellular-based M2M unit
shipment in North America is expected to grow from 8 million units in 2010 to over 22 million units by

2014, i.e., a compound annual growth rate (CAGR) of 30%. Assuming a very long replacement cycle (i.e.,
no replacement during this time period), the installed base of M2M devices cumulatively across all vertical
segment is expected to grow from about 20 million units in 2010 to over 80 million units by 2014 (CAGR ≈
40%). Assuming 7% of North American M2M devices are located in the NY metro area, the installed base
of M2M devices in the NY metro region is expected to grow from less than 2 million in 2010 to about 6
million units by 2014 as shown below.
Figure Figure Figure Figure 3333. Installed base of M2M devices in . Installed base of M2M devices in . Installed base of M2M devices in . Installed base of M2M devices in NY metro areaNY metro areaNY metro areaNY metro area (source data: (source data: (source data: (source data: [2][2][2][2]))))
The largest base is in the Vehicle Telematics segment, followed by Remote Monitoring and Security, and the
biggest growth is expected to come from the Vehicle Telematics, AMI, and Telehealth. Combined with the
large market size and projected exploding growth rate, the Vehicle Telematics is expected to be a major
focus for the industry.
Based on the breakdown of M2M devices by air interface from the ABI Research [2], the installed base of
M2M devices in the NY metro area can be segmented by cellular air interface as shown in Figure 4. With a
lower module cost, GSM/GPRS is expected to constitute the largest segment, followed by CDMA EV-DO.
2.2
0.7
0.9
1.0
0.30.10.30.2
0.0
1.0
2.0
3.0
4.0
5.0
6.0
2010 2011 2012 2013 2014
De
vic
es
in m
illi
on
s
Industrial Automation
Telehealth
Vending
ATM/POS
Remote Monitoring
Security
AMI
Vehicle Telematics
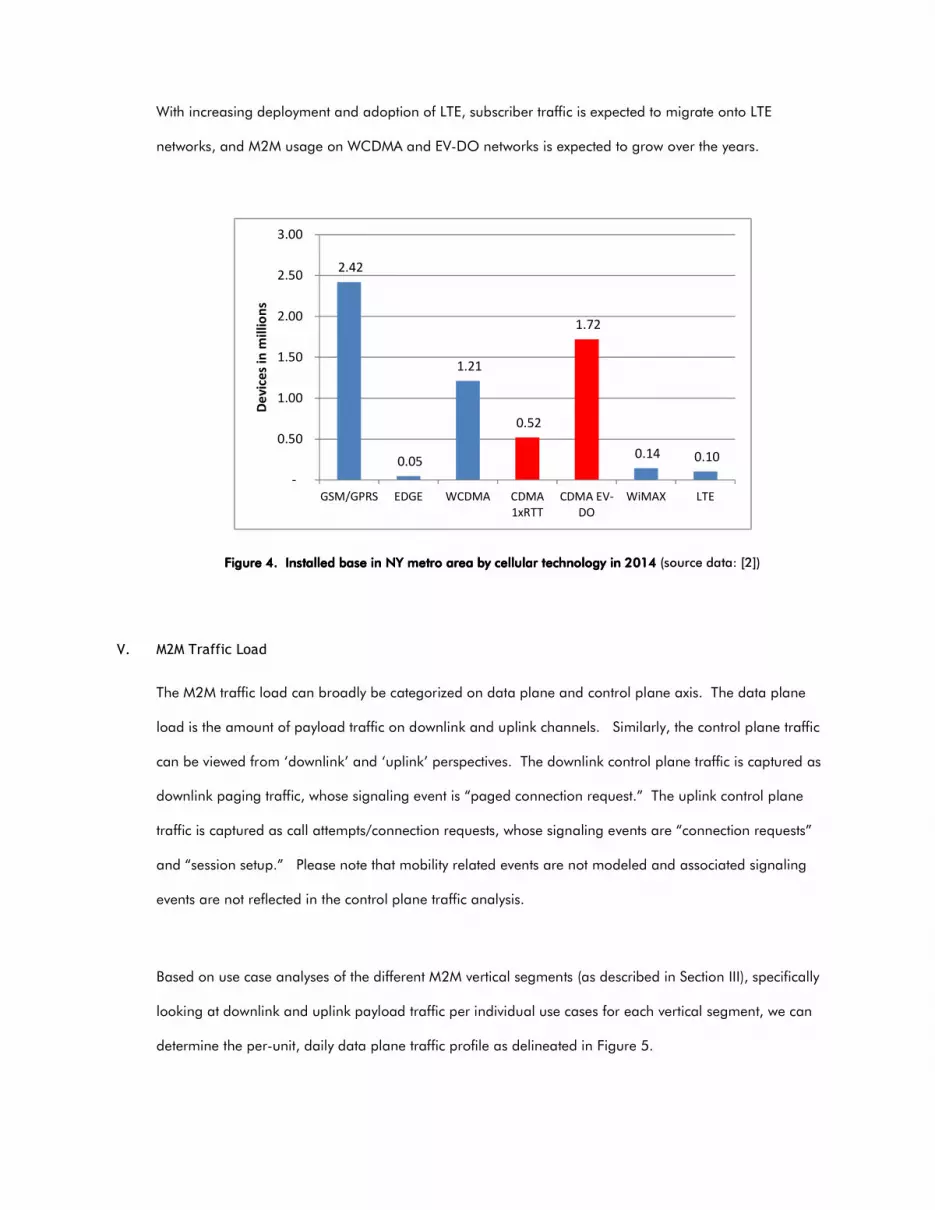
With increasing deployment and adoption of LTE, subscriber traffic is expected to migrate onto LTE
networks, and M2M usage on WCDMA and EV-DO networks is expected to grow over the years.
Figure Figure Figure Figure 4444. Installed base in NY metro area by cellular technology. Installed base in NY metro area by cellular technology. Installed base in NY metro area by cellular technology. Installed base in NY metro area by cellular technology in 2014in 2014in 2014in 2014 (source data: [2])
V. M2M Traffic Load
The M2M traffic load can broadly be categorized on data plane and control plane axis. The data plane
load is the amount of payload traffic on downlink and uplink channels. Similarly, the control plane traffic
can be viewed from ‘downlink’ and ‘uplink’ perspectives. The downlink control plane traffic is captured as
downlink paging traffic, whose signaling event is “paged connection request.” The uplink control plane
traffic is captured as call attempts/connection requests, whose signaling events are “connection requests”
and “session setup.” Please note that mobility related events are not modeled and associated signaling
events are not reflected in the control plane traffic analysis.
Based on use case analyses of the different M2M vertical segments (as described in Section III), specifically
looking at downlink and uplink payload traffic per individual use cases for each vertical segment, we can
determine the per-unit, daily data plane traffic profile as delineated in Figure 5.
2.42
0.05
1.21
0.52
1.72
0.14 0.10
-
0.50
1.00
1.50
2.00
2.50
3.00
GSM/GPRS EDGE WCDMA CDMA
1xRTT
CDMA EV-
DO
WiMAX LTE
De
vic
es
in m
illi
on
s

Figure Figure Figure Figure 5555 Daily data plane traffic per unitDaily data plane traffic per unitDaily data plane traffic per unitDaily data plane traffic per unit
As shown above, an ATM/POS device produces most data plane traffic – i.e., about 390/180 kbytes per
day (uplink/downlink). Another significant data traffic contributor is Vehicle Telematics device which exerts
about 360/85 kbytes per day (uplink/downlink). A Vending device produces about 200 kbytes per day
downlink and uplink combined, and all other vertical M2M devices produce downlink and uplink combined
data plane traffic of less than 100 kbytes per day each. As shown in Figure 5, the uplink channel is
utilized more for data plane traffic than downlink, and it is a reflection of dominant “device-originated”
traffic profile of use cases across most of the vertical segments.
On the control plane side, the “device-originated” traffic profile is even more dominant as shown in Figure
6 . In fact, except for Remote Monitoring, the uplink signaling load dominates all vertical devices with a
Vehicle Telematics unit exerting highest signaling load of about 700/90 sessions per day on
uplink/downlink respectively. The next biggest signaling load contributor is Vending. An Industrial
Automation device contributes the least with roughly 15 sessions per day combined.
85 49 15 62
177 100
9 71
358
19 56 35
391
103
84 59
-
100
200
300
400
500
600
Kb
yte
s
Uplink
Downlink
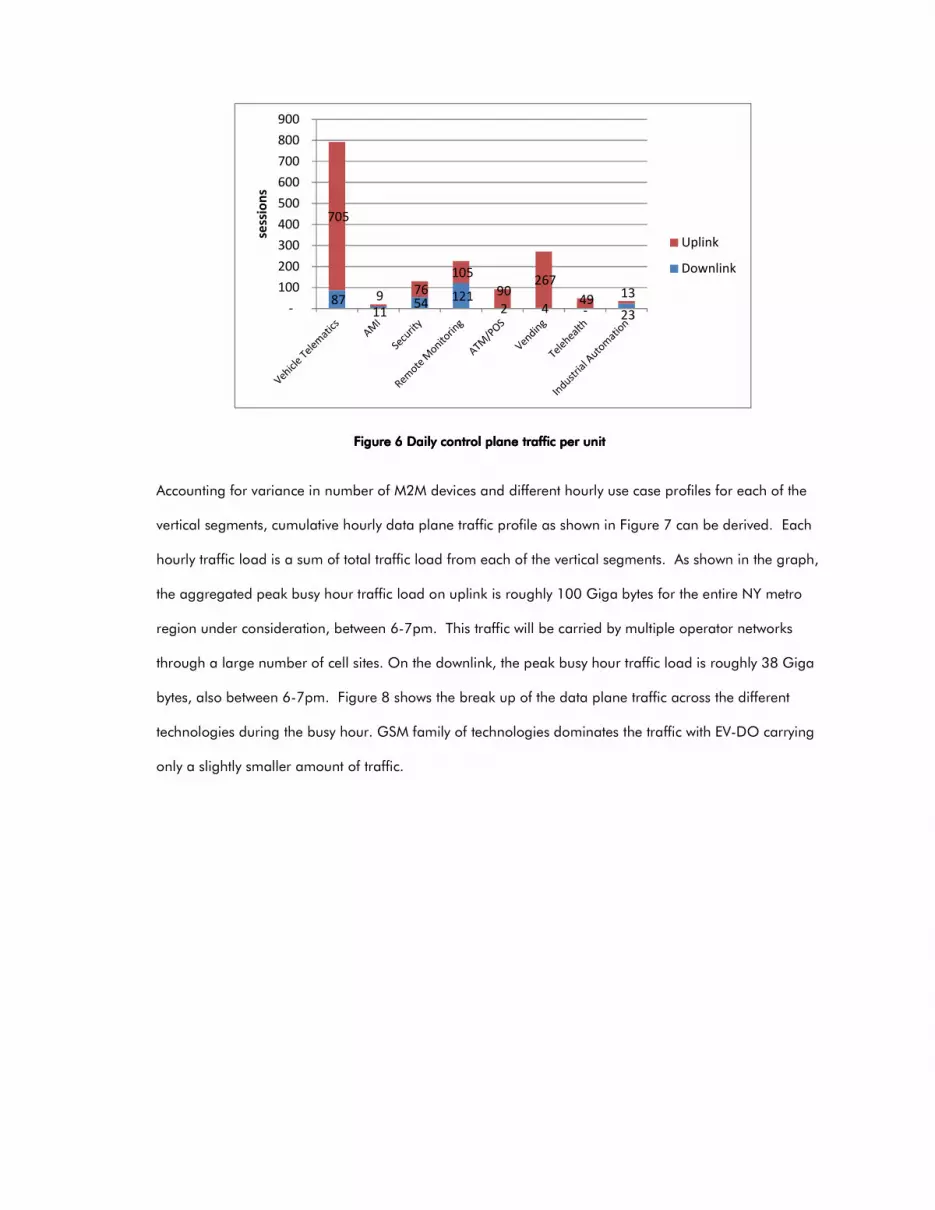
Figure Figure Figure Figure 6666 Daily control plane traffic per unitDaily control plane traffic per unitDaily control plane traffic per unitDaily control plane traffic per unit
Accounting for variance in number of M2M devices and different hourly use case profiles for each of the
vertical segments, cumulative hourly data plane traffic profile as shown in Figure 7 can be derived. Each
hourly traffic load is a sum of total traffic load from each of the vertical segments. As shown in the graph,
the aggregated peak busy hour traffic load on uplink is roughly 100 Giga bytes for the entire NY metro
region under consideration, between 6-7pm. This traffic will be carried by multiple operator networks
through a large number of cell sites. On the downlink, the peak busy hour traffic load is roughly 38 Giga
bytes, also between 6-7pm. Figure 8 shows the break up of the data plane traffic across the different
technologies during the busy hour. GSM family of technologies dominates the traffic with EV-DO carrying
only a slightly smaller amount of traffic.
87 11
54 121
2 4 - 23
705
9 76
105
90 267
49 13
-
100
200
300
400
500
600
700
800
900
sess
ion
s
Uplink
Downlink

Figure Figure Figure Figure 7777 Cumulative data plane traffic load by hourCumulative data plane traffic load by hourCumulative data plane traffic load by hourCumulative data plane traffic load by hour
Figure Figure Figure Figure 8888 Cumulative busy hour traffic by technology for NY metroCumulative busy hour traffic by technology for NY metroCumulative busy hour traffic by technology for NY metroCumulative busy hour traffic by technology for NY metro
In a similar manner to deriving the cumulative hourly data plane traffic profile,
cumulative control plane signaling profile on an hourly basis. Each hourly signaling load is a sum of total
signaling load from each of the vertical segments. As shown in the graph, the aggregated peak busy hour
signaling load on uplink is roughly
hour signaling load is 22 million sessions, between 8
which are SMS messages used to trigger devices when there is a need to send information on the downlink,
the peak busy hour load is roughly 6.6 Million
0
20000
40000
60000
80000
100000
120000
1 3
Tra
ffic
lo
ad
( M
By
tes)
Total data plane traffic load
0
20
40
60
80
100
Bu
sy H
ou
r T
raff
ic (
GB
)
Cumulative data plane traffic load by hourCumulative data plane traffic load by hourCumulative data plane traffic load by hourCumulative data plane traffic load by hour for NY Metrofor NY Metrofor NY Metrofor NY Metro
Cumulative busy hour traffic by technology for NY metroCumulative busy hour traffic by technology for NY metroCumulative busy hour traffic by technology for NY metroCumulative busy hour traffic by technology for NY metro
ilar manner to deriving the cumulative hourly data plane traffic profile, Figure 9
cumulative control plane signaling profile on an hourly basis. Each hourly signaling load is a sum of total
of the vertical segments. As shown in the graph, the aggregated peak busy hour
signaling load on uplink is roughly 160 Million sessions, between 6-7pm. On the downlink, the peak
million sessions, between 8-9am. For “device triggering” SMS signaling events,
which are SMS messages used to trigger devices when there is a need to send information on the downlink,
usy hour load is roughly 6.6 Million messages, also between 8-9am, cumulatively across all
3 5 7 9 11 13 15 17 19 21 23
Total data plane traffic load
Downlink
Traffic
Uplink
Traffic
CDMA EV-DO
CDMA 1X
WCDMA
GSM/GPRS/EDGE
9 captures the
cumulative control plane signaling profile on an hourly basis. Each hourly signaling load is a sum of total
of the vertical segments. As shown in the graph, the aggregated peak busy hour
7pm. On the downlink, the peak busy
ce triggering” SMS signaling events,
which are SMS messages used to trigger devices when there is a need to send information on the downlink,
9am, cumulatively across all
DL
UL

vertical segments. SMS used to carry actual payload information are not included in the modeling. Similar
to Figure 8, Figure 10 shows the break up according to technology.
Figure Figure Figure Figure 9999. Cumulative control plane signaling load by hour. Cumulative control plane signaling load by hour. Cumulative control plane signaling load by hour. Cumulative control plane signaling load by hour
Figure Figure Figure Figure 10101010 Cumulative busy hour signaling traffic by technology in NY metroCumulative busy hour signaling traffic by technology in NY metroCumulative busy hour signaling traffic by technology in NY metroCumulative busy hour signaling traffic by technology in NY metro
VI. M2M Load vs. Network Capacity A
In this section, amalgamated traffic load from the various vertical segments is contrasted against the
available network capacity of a CDMA 1xRTT/EV
0
20000
40000
60000
80000
100000
120000
140000
160000
180000
1
# o
f se
ssio
ns
(10
00
s)
Total control plane signaling load
0
50
100
150
200
Downlink
Signaling
Nu
mb
er
of
Se
ssio
ns
(Mil
lio
ns)
SMS used to carry actual payload information are not included in the modeling. Similar
to Figure 8, Figure 10 shows the break up according to technology.
. Cumulative control plane signaling load by hour. Cumulative control plane signaling load by hour. Cumulative control plane signaling load by hour. Cumulative control plane signaling load by hour in NY in NY in NY in NY metrometrometrometro
Cumulative busy hour signaling traffic by technology in NY metroCumulative busy hour signaling traffic by technology in NY metroCumulative busy hour signaling traffic by technology in NY metroCumulative busy hour signaling traffic by technology in NY metro
M2M Load vs. Network Capacity Analysis
In this section, amalgamated traffic load from the various vertical segments is contrasted against the
lable network capacity of a CDMA 1xRTT/EV-DO network. We determine what proportion of the
3 5 7 9 11 13 15 17 19 21 23
Total control plane signaling load
Downlink
Signaling
Uplink
Signaling
CDMA EV-DO
CDMA 1X
WCDMA
GSM/GPRS/EDGE
SMS used to carry actual payload information are not included in the modeling. Similar
metrometrometrometro
Cumulative busy hour signaling traffic by technology in NY metroCumulative busy hour signaling traffic by technology in NY metroCumulative busy hour signaling traffic by technology in NY metroCumulative busy hour signaling traffic by technology in NY metro
In this section, amalgamated traffic load from the various vertical segments is contrasted against the
what proportion of the
DL
UL
available capacity gets consumed by the forecasted M2M traffic load. In commercial reality, there are
multiple mobile network operators serving any given region. Assuming that a given operator’s network in
the NY metro region addresses 35% of M2M devices in the market, we scale the total traffic demand
calculated in the previous section to 35% of the total value and then compare that against the available
network capacity. We assume a CDMA 1X/EV-DO network in our analysis. Results will be similar for the
GSM family which has roughly the same total traffic.
a. NY Metro CDMA 1xRTT/EV-DO Network Profiles and Assumptions
We use the following parameters for modeling a typical CDMA network in the NYC metro area for which
we have projected the traffic. Our typical network consists of a total of 1000 cell sites, each with 3 sectors
and 4 carriers serving this region, and total of 40 RNCs and 1 MSC. We essentially consider three main
metrics in our analysis.
First is connection requests performed by the devices. These consume signaling resources over the air-
interface, primarily the random access channel, and processing resources in the RNC. Our analysis shows
that the limiting factor for connection requests is the RNC processing and thus we focus our attention on
characterizing the load on the RNC.
Second is the traffic volume tied to all the machine data communications. For this, the primary bottleneck
is the air-interface capacity. Each sector-carrier has a maximum throughput that it can deliver to the sector.
Assuming the devices are uniformly distributed throughout the region, we can calculate the per sector-
carrier load in terms of bits/second of data traffic generated by these devices. This assumes that the
transactions across all devices occur uniformly over time within the hour. In practice, there is likely to be
some level of burstiness such as more traffic at the beginning of the hour. However, the burstiness is not
captured in our analysis. If desired an additional burst factor can be applied to the calculated fraction of
resources consumed to account for that.
Third is the paging signaling required for network initiated transactions to these devices. Paging is triggered
by the RNC and the page message is sent over the air across all sector–carriers in the paging area. We
consider the RNC as the limiting factor for generating the paging messages. Note that when a paging
triggers a connection request that is also included in the connection requests signaling count.
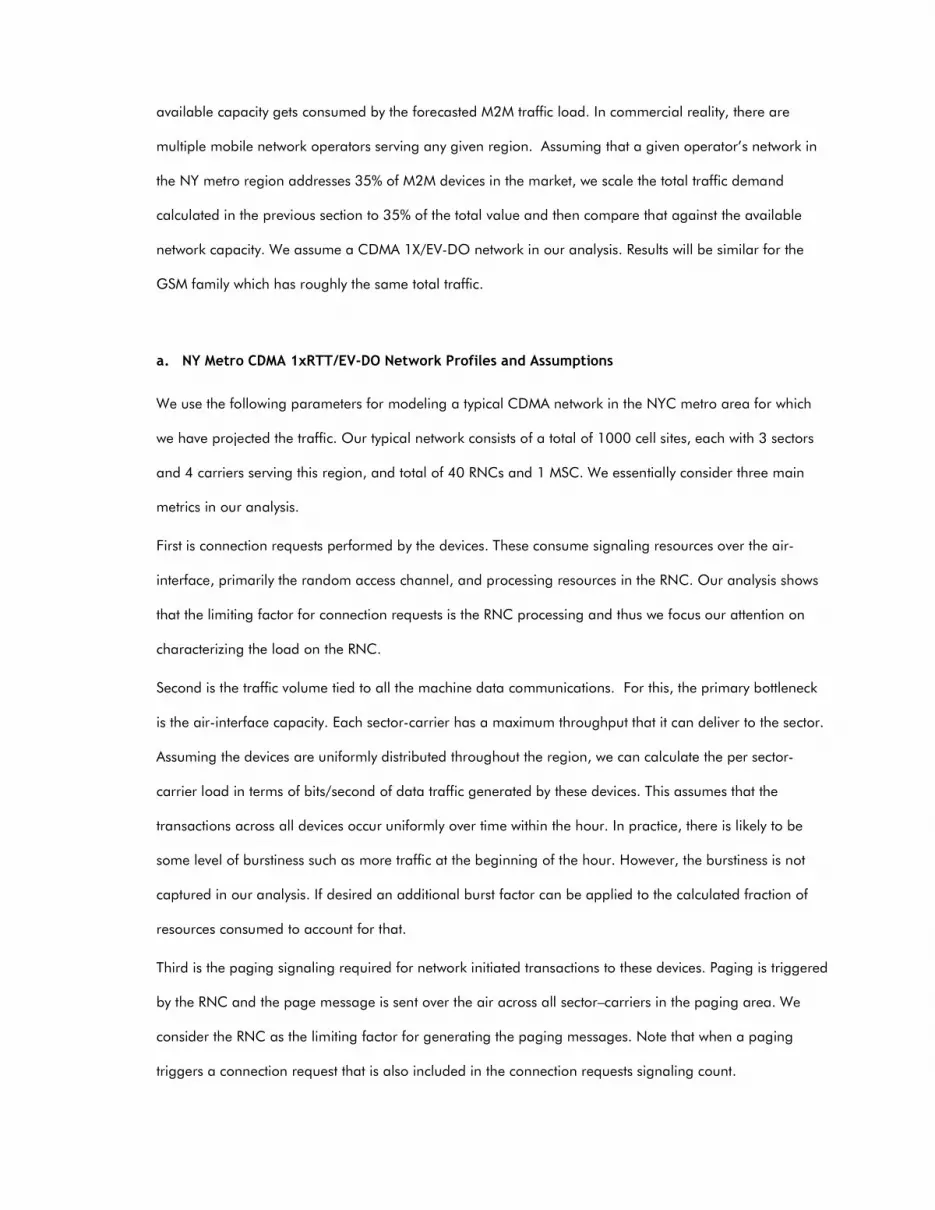
We use the capacity figures shown in
paging, the RNC capacity is calculated based on the processor occupancy for differ
events reported in [10]. We assume of 30% of the processor is available for processing connection requests
and another 30% for paging. The sector
number of sector carriers.
Table Table Table Table
Data plane
Downlink data throughput capacity
Uplink data throughput capacity
Control plane
Paging capacity
Connections capac
SMS capacity
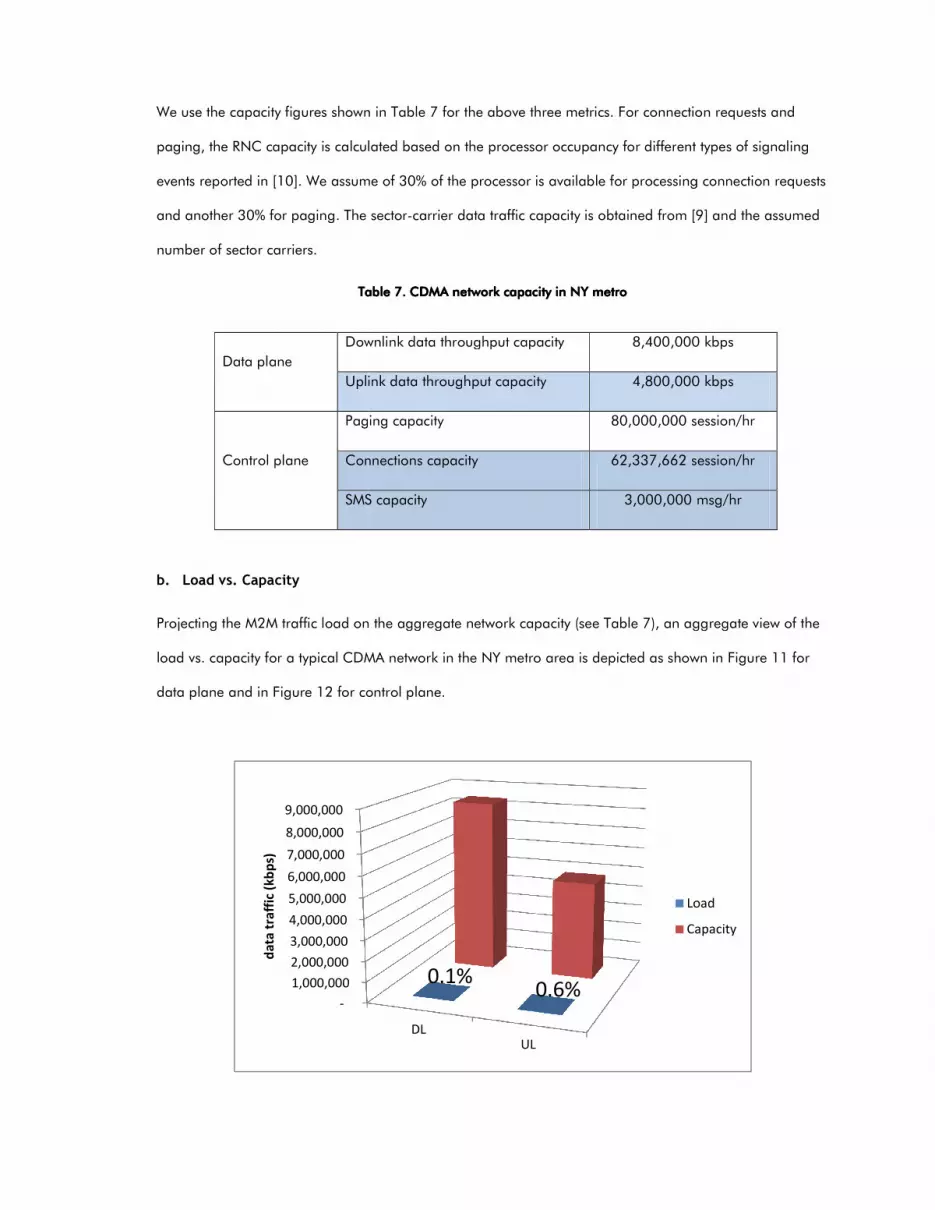
b. Load vs. Capacity
Projecting the M2M traffic load on the aggregate network capacity (see
load vs. capacity for a typical CDMA network i
data plane and in Figure 12 for control plane
-
1,000,000
2,000,000
3,000,000
4,000,000
5,000,000
6,000,000
7,000,000
8,000,000
9,000,000
da
ta t
raff
ic (
kb
ps)
We use the capacity figures shown in Table 7 for the above three metrics. For connection requests and
paging, the RNC capacity is calculated based on the processor occupancy for different types of signaling
. We assume of 30% of the processor is available for processing connection requests
and another 30% for paging. The sector-carrier data traffic capacity is obtained from [9]
Table Table Table Table 7777. . . . CDMA network capacity in NY metroCDMA network capacity in NY metroCDMA network capacity in NY metroCDMA network capacity in NY metro
Downlink data throughput capacity 8,400,000 kbps
Uplink data throughput capacity 4,800,000 kbps
Paging capacity 80,000,000 session/hr
Connections capacity 62,337,662 session/hr
SMS capacity 3,000,000 msg/hr
Projecting the M2M traffic load on the aggregate network capacity (see Table 7), an aggregate view of the
for a typical CDMA network in the NY metro area is depicted as shown in
for control plane.
DLUL
0.1%0.6%
Load
Capacity
for the above three metrics. For connection requests and
ent types of signaling
. We assume of 30% of the processor is available for processing connection requests
[9] and the assumed
8,400,000 kbps
4,800,000 kbps
80,000,000 session/hr
62,337,662 session/hr
3,000,000 msg/hr
aggregate view of the
n the NY metro area is depicted as shown in Figure 11 for
Load
Capacity

The projected traffic from M2M devices in the NY metro area is expected to be minimal on data plane
exerting only 0.1% of downlink and 0.6% of uplink channel capacities.
Figure Figure Figure Figure
Signaling load on the network is greater than data plane traffic, but it is well within the aggregate control
plane capacity – exerting 5% on the downlink paging capacity and 33% on the uplink connection setup/call
attempt capacity.
For the device triggering ‘downlink’
capacity, assuming 1 MSC that is capable of handling 3 million SMS busy hour call attempts as shown in
Figure 13.
-
10,000,000
20,000,000
30,000,000
40,000,000
50,000,000
60,000,000
70,000,000
80,000,000
sig
na
lin
g t
raff
ic (
sess
ion
s/h
r)
Figure Figure Figure Figure 11111111. Data plane load vs. ca. Data plane load vs. ca. Data plane load vs. ca. Data plane load vs. capacitypacitypacitypacity
The projected traffic from M2M devices in the NY metro area is expected to be minimal on data plane
exerting only 0.1% of downlink and 0.6% of uplink channel capacities.
Figure Figure Figure Figure 12121212. Control plane load vs. capacity. Control plane load vs. capacity. Control plane load vs. capacity. Control plane load vs. capacity
ling load on the network is greater than data plane traffic, but it is well within the aggregate control
exerting 5% on the downlink paging capacity and 33% on the uplink connection setup/call
‘downlink’ SMS traffic, the aggregate load represents about 32% of available
capacity, assuming 1 MSC that is capable of handling 3 million SMS busy hour call attempts as shown in
DLUL
5%33%
Load
Capacity
The projected traffic from M2M devices in the NY metro area is expected to be minimal on data plane –
ling load on the network is greater than data plane traffic, but it is well within the aggregate control
exerting 5% on the downlink paging capacity and 33% on the uplink connection setup/call
the aggregate load represents about 32% of available
capacity, assuming 1 MSC that is capable of handling 3 million SMS busy hour call attempts as shown in
Load
Capacity

VII. Conclusions
We forecasted M2M traffic load in a given market (NY metro region studied in this paper)
analyzed its impact on a typical CDMA EV
disproportionately large amount of signaling load relativ
on average behavior during the busy hour
expected to consume about 1% of CDMA data plane capacity. Meanwhile, these devices wi
consume over 30% of control plane capacity.
signaling impact on the network. Our modeling assumes that applications are well behaved; if
applications are poorly designed and implemented, the signaling load
well beyond the 30% load identified.
Our analysis did not include sensors that are connected to the cellular network through a
gateway. The majority of M2M devices will likely be connected indirectly through such gateways.
However, such devices will be low power, non
Nevertheless, in aggregate they
should include a modeling of communication through the gateways.
-
500,000
1,000,000
1,500,000
2,000,000
2,500,000
3,000,000
me
ssa
ge
s /h
r
Figure Figure Figure Figure 13131313. SMS load vs. capacity. SMS load vs. capacity. SMS load vs. capacity. SMS load vs. capacity
forecasted M2M traffic load in a given market (NY metro region studied in this paper)
analyzed its impact on a typical CDMA EV-DO network deployed in that region. W
large amount of signaling load relative to data for M2M traffic profi
during the busy hour, the traffic load from forecasted M2M devices is
expected to consume about 1% of CDMA data plane capacity. Meanwhile, these devices wi
consume over 30% of control plane capacity. M2M applications need to carefully consider
signaling impact on the network. Our modeling assumes that applications are well behaved; if
applications are poorly designed and implemented, the signaling load on the network can extend
well beyond the 30% load identified.
Our analysis did not include sensors that are connected to the cellular network through a
gateway. The majority of M2M devices will likely be connected indirectly through such gateways.
, such devices will be low power, non-rechargeable and many not communicate much.
Nevertheless, in aggregate they may contribute significantly to the total traffic load. Future studies
should include a modeling of communication through the gateways.
SMS
32%Load
Capacity
forecasted M2M traffic load in a given market (NY metro region studied in this paper) and
DO network deployed in that region. We observed a
e to data for M2M traffic profie. Based
, the traffic load from forecasted M2M devices is
expected to consume about 1% of CDMA data plane capacity. Meanwhile, these devices will
M2M applications need to carefully consider
signaling impact on the network. Our modeling assumes that applications are well behaved; if
on the network can extend
Our analysis did not include sensors that are connected to the cellular network through a
gateway. The majority of M2M devices will likely be connected indirectly through such gateways.
rechargeable and many not communicate much.
total traffic load. Future studies
Load
Capacity

Among the different M2M vertical segments, Vehicle Telematics represents the largest block (i.e., 37% of all
M2M devices) and is the biggest contributor of total M2M traffic on data plane and control plane. On a
per unit basis, the ATM/POS device is the biggest contributor on data plane while Vehicle Telematics is the
biggest contributor on control plane. Hence, it is important to focus on these verticals in terms of
application integrity in how they utilize network resources.
VIII. References
[1] Zdravkovic, A.; , "Wireless point of sale terminal for credit and debit payment systems," Electrical and Computer Engineering, 1998. IEEE Canadian Conference on , vol.2, no., pp.890-893 vol.2, 24-28 May 1998 doi: 10.1109/CCECE.1998.685641 URL: http://ieeexplore.ieee.org/stamp/stamp.jsp?tp=&arnumber=685641&isnumber=15021
[2] ABI Research, Cellular Machine-to-Machine (M2M) Markets research report, August 2010.
[3] Ericsson Press Release, “CEO to shareholders: 50 Billion connections 2020,” URL: http://www.ericsson.com/news/1403231
[4] Steve Hilton, “ Machine-to-machine device connections: worldwide forecast 2010–2020, “, Analysys Mason Report, December 2010
[5] 3GPP TS 23.368, “Service Requirements for Machine Type Communications; Stage 2,” 2011.
[6] Arnon, S., Bhastekar, D., Kedar, D., and Tauber, A., “A comparative study of wireless communication network configurations for medical applications,” IEEE Wireless Communications, pp. 56-61, February 2003
[7] IEEE Standard, Health Informatics - PoC Medical Device Communication - Part 00101: Guide--Guidelines for the Use of RF Wireless Technology, December 2008. URL: http://ieeexplore.ieee.org/servlet/opac?punumber=4736535
[8] Zdravkovic, A.; , "Wireless point of sale terminal for credit and debit payment systems," IEEE Canadian Conference on Electrical and Computer Engineering, vol.2, no., pp.890-893 vol.2, 24-28 May 1998 URL: http://ieeexplore.ieee.org/stamp/stamp.jsp?tp=&arnumber=685641&isnumber=15021
[9] Qi Bi, “Voice and Data Throughput Capacity Summary of Wireless Mobile Systems,” Internal Document, September 2009
[10] ALU Capacity Summary of Wireless Mobile Systems (Sep. 2009)
[11] Y. Jou, R. Attar, S. Ray, J. Ma and X. Zhang, "M2M over CDMA2000 1x Case Studies," IEEE WCNC 2011.
[12] Autoblog, OnStar announces Remote Ignition Block for stolen vehicles, http://www.autoblog.com/2009/07/21/onstar-announces-remote-ignition-block-for-stolen-vehicles/, 2009.
[13] EMSworld, OnStar works to deliver crash data to responders, http://www.emsworld.com/news/10407208/onstar-works-to-deliver-crash-data-to-responders, 2011.
[14] eSafetySupport, E-Call estimation of the PSAPs workload (OnStar statistics 2006), http://www.esafetysupport.org/download/ecall_toolbox/Members_States/4.-%20Estimation%20of%20the%20number%20of%20eCalls%20and%20its%20impact%20on%20the%20PSAPs%20workload_final.pdf, 2007.
[15] Telematics News, Video on OnStar statistics, http://telematicsnews.info/2009/08/02/video-onstar-statistics/, 2009.