tnk062 – traffic modeling intersections and traffic signals - itn
TRANSCRIPT
1
TNK062 – Traffic modelingIntersections and traffic signals
» Johan Janson Olstam» Office: SP7206» E-mail: [email protected]» Phone: 36 34 90 or
013 – 20 41 82 (VTI)
2
Contents
» 3 Lectures» 1 Computer exercise (incl. a Dugga)» 1 Assignment consisting of three parts
- Theory questions (Individually)- Calculation problems (Individually)- Task to be solved using CAPCAL
(groups of 2 students)
3
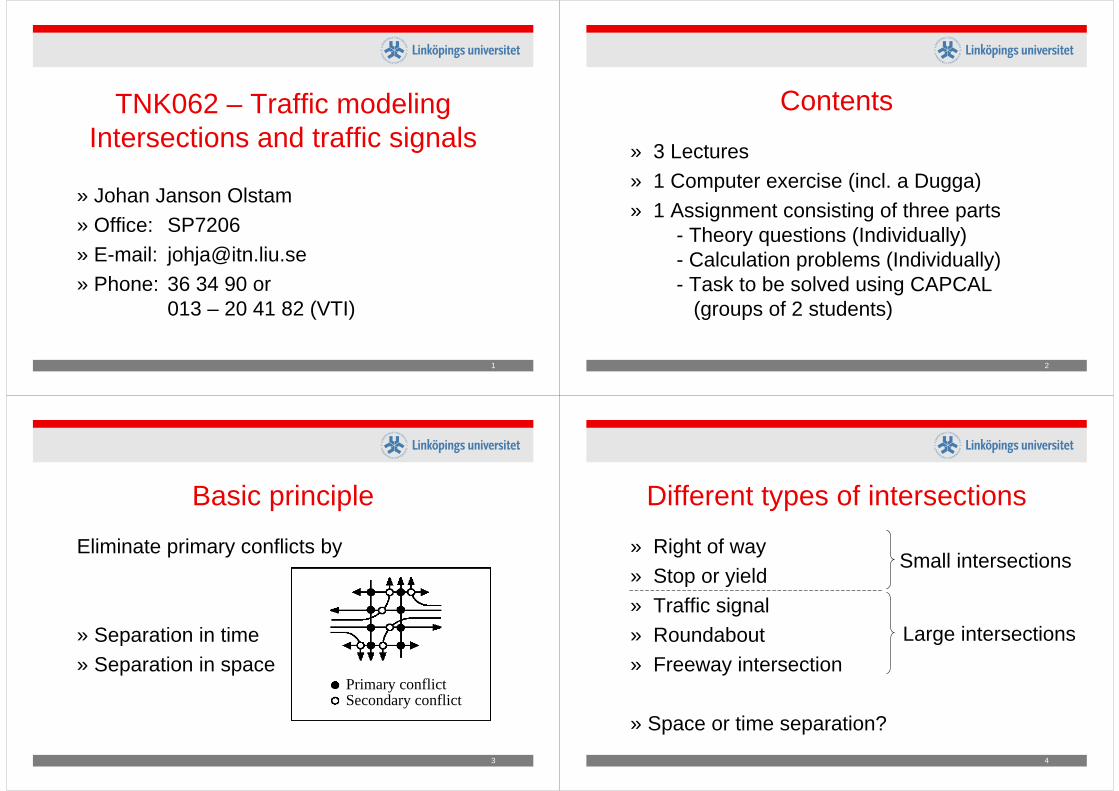
Basic principle
Eliminate primary conflicts by
» Separation in time» Separation in space
Primary conflictSecondary conflict
4
Different types of intersections
» Right of way» Stop or yield» Traffic signal» Roundabout» Freeway intersection
» Space or time separation?
Small intersections
Large intersections
5
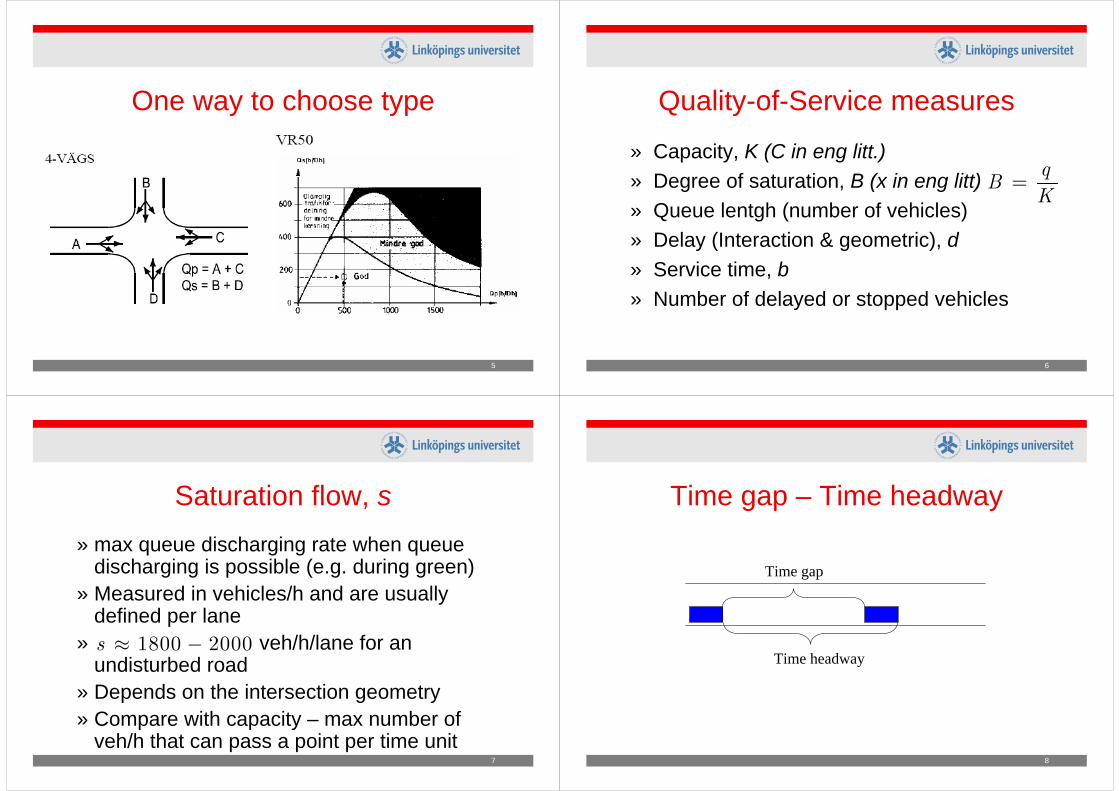
One way to choose type
6
Quality-of-Service measures
» Capacity, K (C in eng litt.)» Degree of saturation, B (x in eng litt)» Queue lentgh (number of vehicles)» Delay (Interaction & geometric), d» Service time, b» Number of delayed or stopped vehicles
qB
K=
7
Saturation flow, s» max queue discharging rate when queue
discharging is possible (e.g. during green)» Measured in vehicles/h and are usually
defined per lane» veh/h/lane for an
undisturbed road» Depends on the intersection geometry» Compare with capacity – max number of
veh/h that can pass a point per time unit
1800 2000s ≈ −
8
Time gap – Time headway
Time gap
Time headway
9
Quality-of-service calculations for non-signalized intersections
Two different approaches
» Macro e.g.
» Micro critical time gaps
1mm
qK Kq
⎛ ⎞= −⎜ ⎟
⎝ ⎠
10
Micro models
no vehicle can pass1 vehicle can pass2 vehicles can pass
1
1 2
2 3
h TT h TT h T
<< << <
h
11
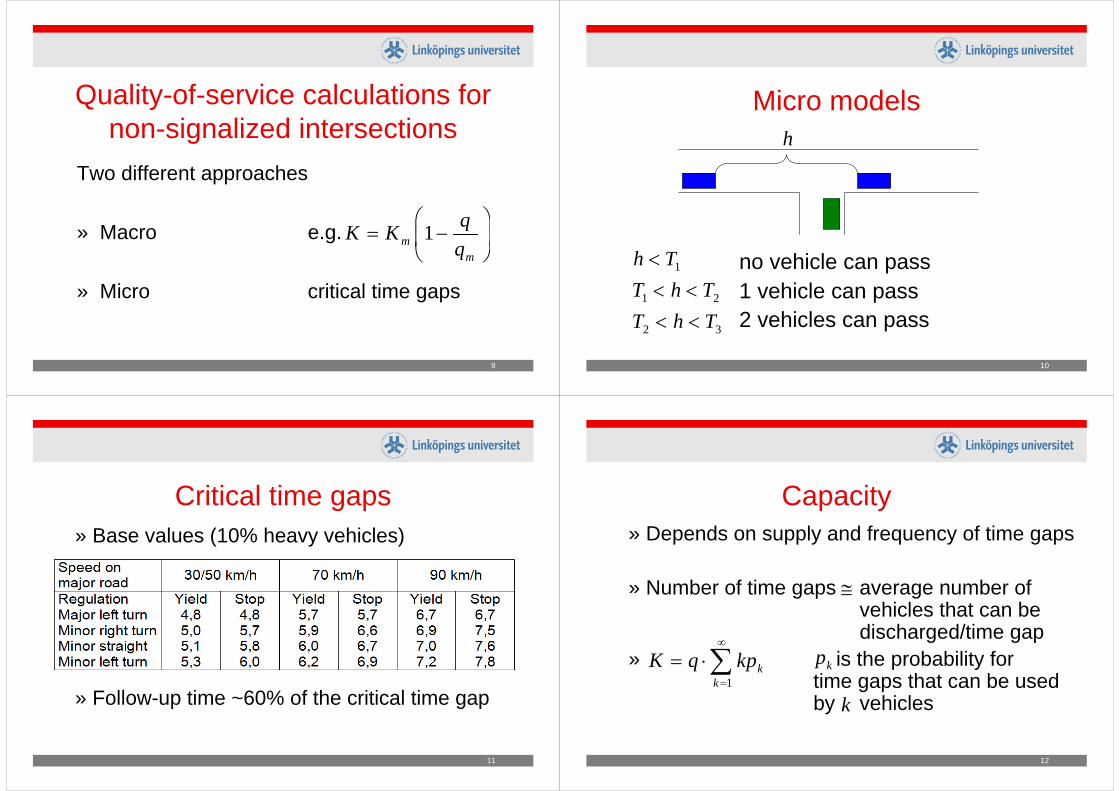
Critical time gaps» Base values (10% heavy vehicles)
» Follow-up time ~60% of the critical time gap
12
Capacity» Depends on supply and frequency of time gaps
» Number of time gaps average number of vehicles that can be discharged/time gap
» is the probability for time gaps that can be used by vehicles
≅
1k
kK q kp
∞
=
= ⋅∑ kp
k
13
Queue theory
A minor approach can be seen as a queue system characterized by
» distribution of the arrivals» distribution of service times» number of service stations» Queue discipline (FCFS = FIFO)
14
Time gap distributions
» Off-peak hours: all vehicles free time gaps exponential distributed
» Min time gap 0 shifted exponential distributed
» Vehicle platoons with fixed min time gap M3-distribution
→≠ →
→
15
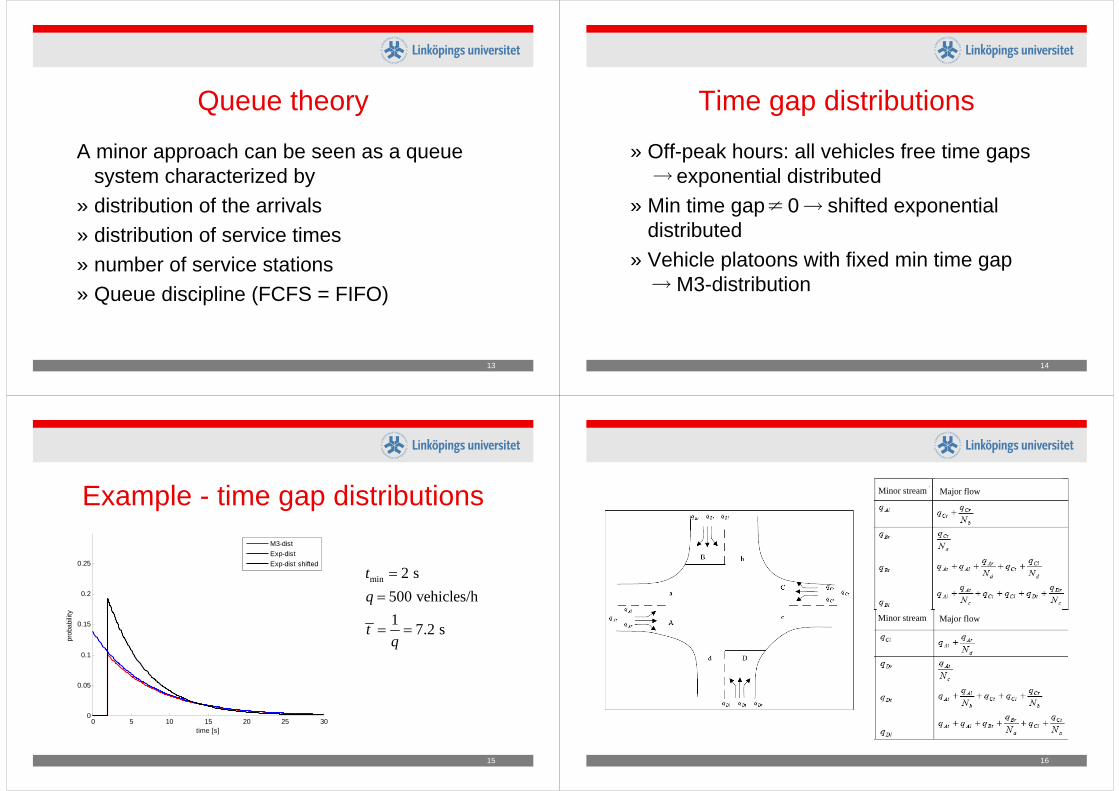
Example - time gap distributions
0 5 10 15 20 25 300
0.05
0.1
0.15
0.2
0.25
time [s]
prob
abili
ty
M3-distExp-distExp-dist shifted
min 2 s500 vehicles/h1 7.2 s
tq
tq
==
= =
16
Minor stream Major flow
Minor stream Major flow
17
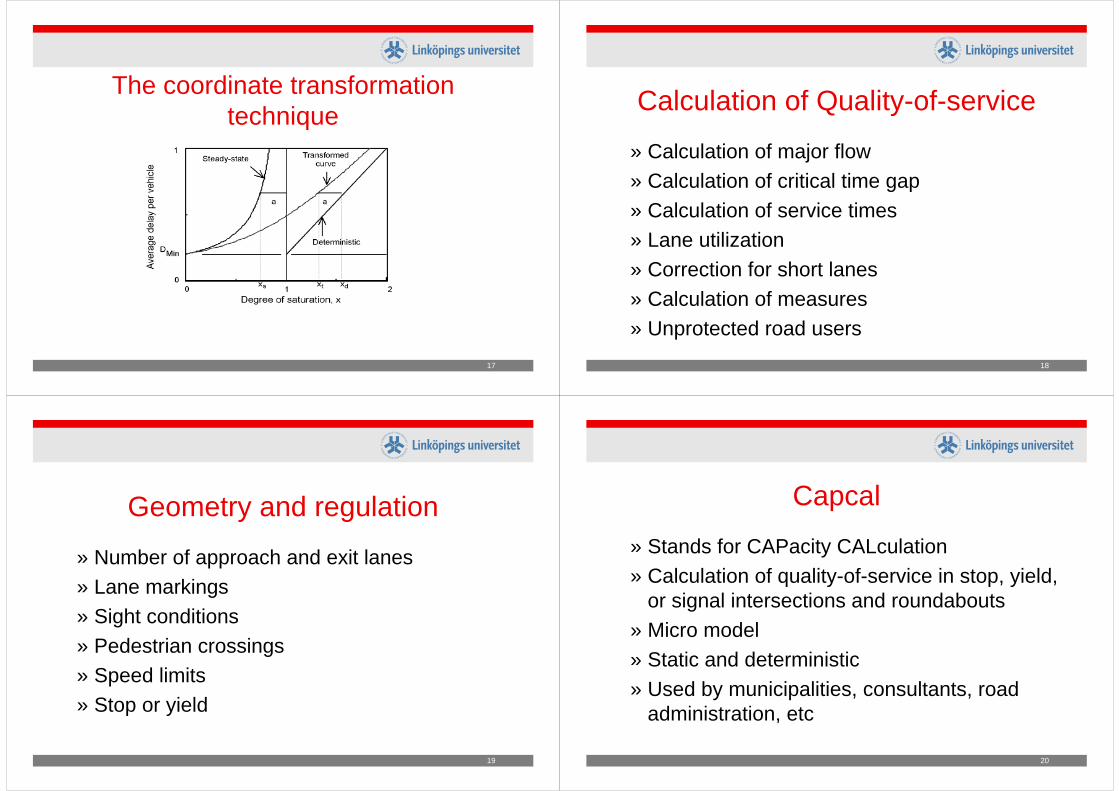
The coordinate transformation technique
18
Calculation of Quality-of-service
» Calculation of major flow» Calculation of critical time gap» Calculation of service times» Lane utilization» Correction for short lanes» Calculation of measures» Unprotected road users
19
Geometry and regulation
» Number of approach and exit lanes» Lane markings» Sight conditions» Pedestrian crossings» Speed limits» Stop or yield
20
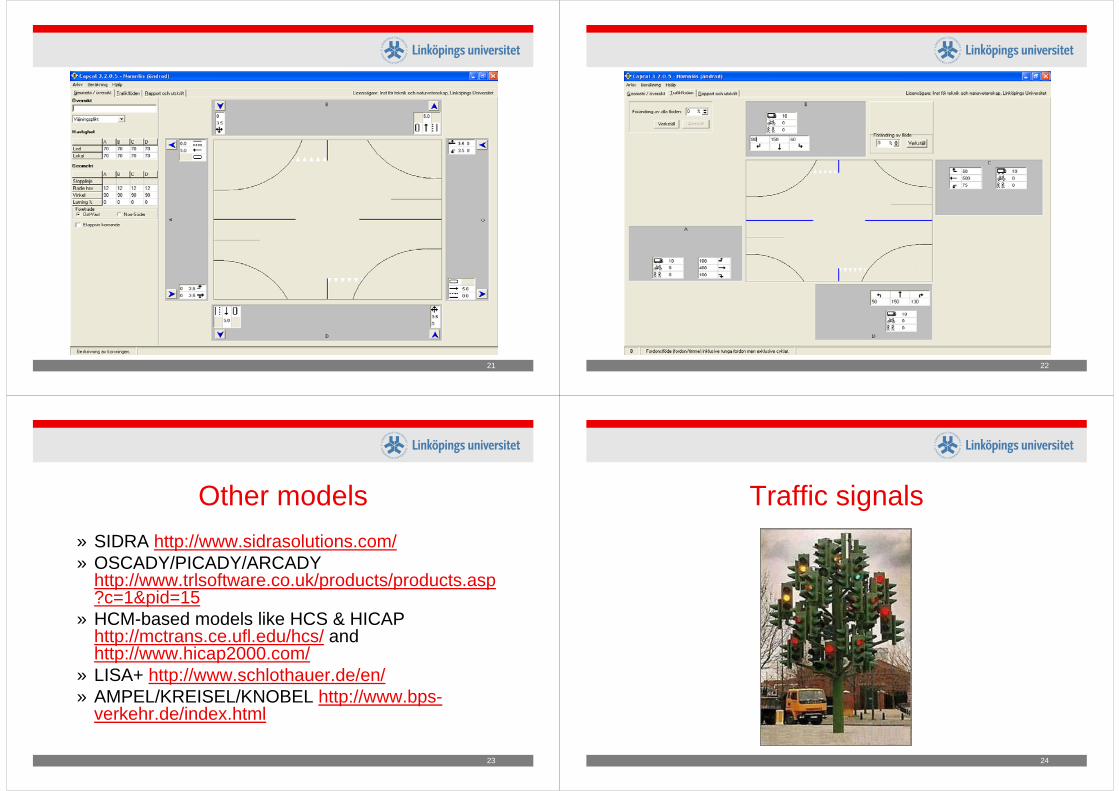
Capcal
» Stands for CAPacity CALculation» Calculation of quality-of-service in stop, yield,
or signal intersections and roundabouts» Micro model» Static and deterministic» Used by municipalities, consultants, road
administration, etc
21 22
23
Other models» SIDRA http://www.sidrasolutions.com/» OSCADY/PICADY/ARCADY
http://www.trlsoftware.co.uk/products/products.asp?c=1&pid=15
» HCM-based models like HCS & HICAP http://mctrans.ce.ufl.edu/hcs/ and http://www.hicap2000.com/
» LISA+ http://www.schlothauer.de/en/» AMPEL/KREISEL/KNOBEL http://www.bps-
verkehr.de/index.html
24
Traffic signals
25
Advantages with traffic signals
» Allocate capacity amongst approaches and road user groups
» Create regularity and minimize waiting time» Give priority for buses, platoons,
emergency vehicles, etc» Traffic safety (also a disadvantage!)
26
Definitions
» Signal picture – Green, Amber, Red, Red-Amber, etc.
» Signal group – Signals that always are given r.o.w. (green) simultaneously
» Phase or stage – Combination of signal groups that are given r.o.w. at the same time
27
cycle time
red time green time amber
safety time red-amber
Road 1
Road 2
Road 1
Road 2
28
Effective green
, saturation flows
Red RA Green A Red
effective green
29
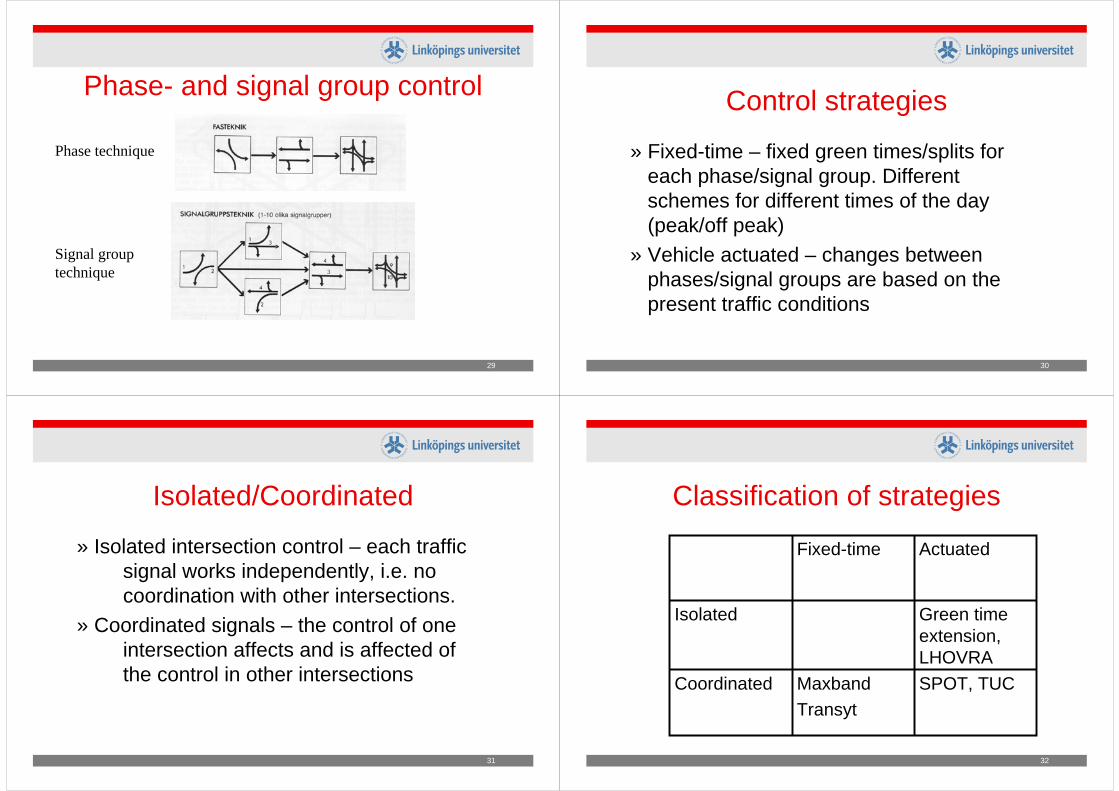
Phase- and signal group control
Phase technique
Signal grouptechnique
30
Control strategies
» Fixed-time – fixed green times/splits for each phase/signal group. Different schemes for different times of the day (peak/off peak)
» Vehicle actuated – changes between phases/signal groups are based on the present traffic conditions
31
Isolated/Coordinated
» Isolated intersection control – each traffic signal works independently, i.e. no coordination with other intersections.
» Coordinated signals – the control of one intersection affects and is affected of the control in other intersections
32
Classification of strategies
SPOT, TUCMaxbandTransyt
Coordinated
Green time extension, LHOVRA
Isolated
ActuatedFixed-time
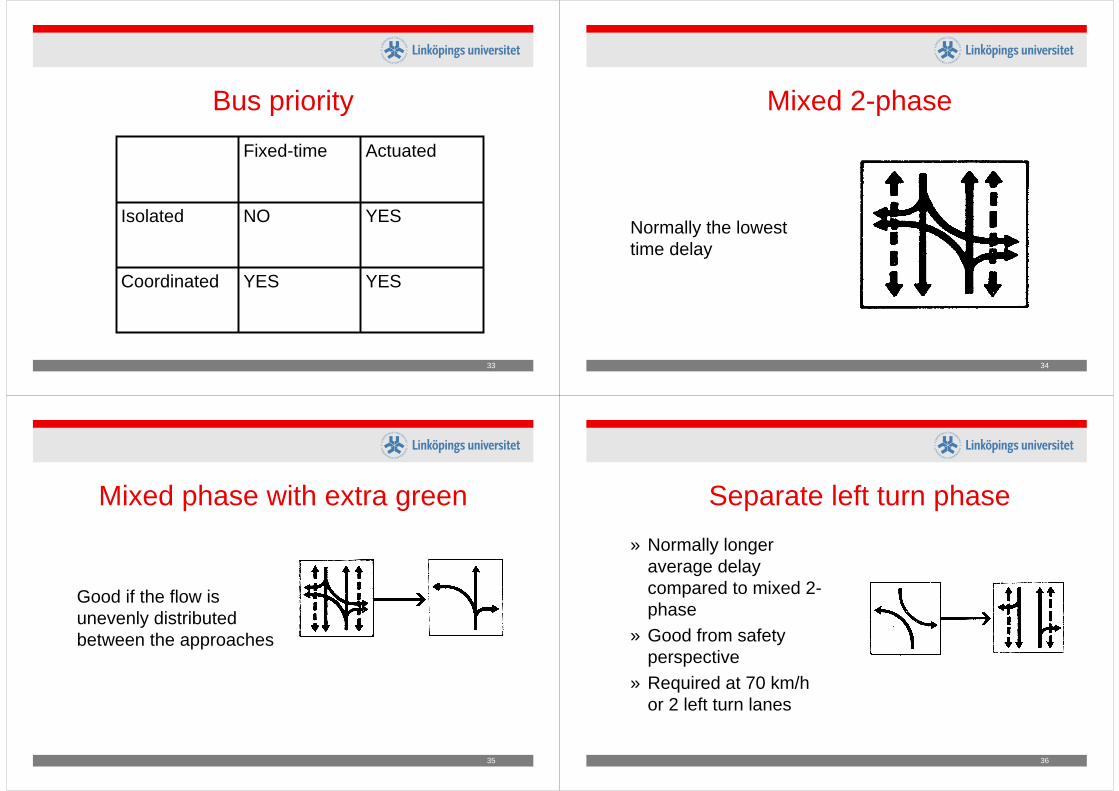
33
Bus priority
YESYESCoordinated
YESNOIsolated
ActuatedFixed-time
34
Mixed 2-phase
Normally the lowest time delay
35
Mixed phase with extra green
Good if the flow is unevenly distributed between the approaches
36
Separate left turn phase» Normally longer
average delay compared to mixed 2-phase
» Good from safety perspective
» Required at 70 km/h or 2 left turn lanes
37
Separate phases for each approach
» Normally inferior compared to mixed 2-phase, mixed phase with extra green and separate left turn phase
» Good from safety perspective
38
All pedestrian phase
39
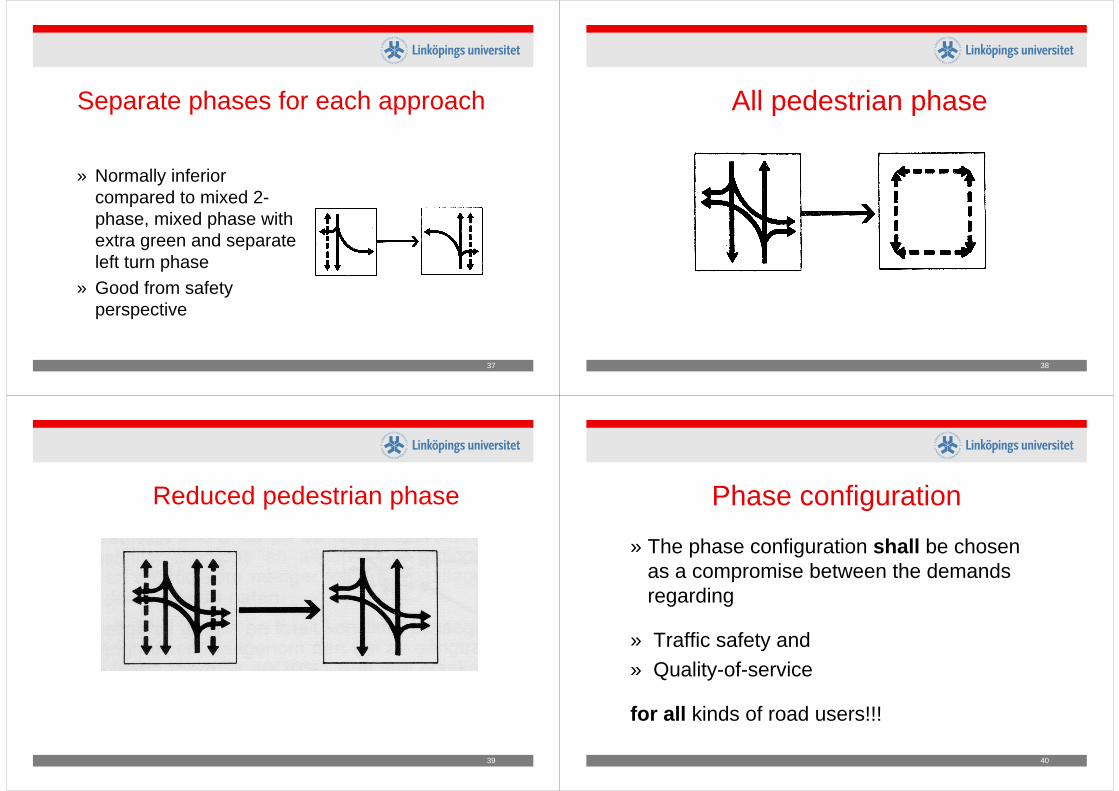
Reduced pedestrian phase
40
Phase configuration
» The phase configuration shall be chosen as a compromise between the demands regarding
» Traffic safety and» Quality-of-service
for all kinds of road users!!!