mla donor company final report template - pip
TRANSCRIPT
Project code: P.PIP.0743
Prepared by: Dr Fiona Anderson and Assoc. Professor David Miller
Murdoch University
Date published: 29th November 2018
PUBLISHED BY Meat and Livestock Australia Limited Locked Bag 1961 NORTH SYDNEY NSW 2059
The Impact of Handling Conditions and New
Environments on the Stress of Cattle
This is an MLA Donor Company funded project.
Meat & Livestock Australia acknowledges the matching funds provided by the Australian
Government and contributions from the Australian Meat Processor Corporation to support the
research and development detailed in this publication.
This publication is published by Meat & Livestock Australia Limited ABN 39 081 678 364 (MLA). Care is taken to ensure the accuracy of the information contained in this publication. However MLA cannot accept responsibility for the accuracy or completeness of the information or opinions contained in the publication. You should make your own enquiries before making decisions concerning your interests. Reproduction in whole or in part of this publication is prohibited without prior written consent of MLA.
final report
P.PIP.0743 - The Impact of Handling Conditions and New Environments on the Stress of Cattle
Page 2 of 80
Abstract Cattle welfare is important from the perspective of the cattle themselves, marketing of beef product
and improved production characteristics. This project aimed to assess time points in the supply chain
from the time of induction to a feedlot through to slaughter to assess the relative levels of stress at
these time points and the impact of cattle temperament on stress. Qualitative behavioural
assessment was also investigated as an adjunctive or alternative method of assessing welfare. The
impact of stress and temperament on cattle production and the potential for prediction of cattle
performance was assessed and quantified. Data was collected from 240 cattle that originated from a
single property from induction to slaughter. Although some measures of acute stress were greatest
at slaughter, many measures of longer-term stress indicated that compared to induction this time
point was less stressful for cattle. Cattle were shown to habituate to their environment in this study
which may be a factor in their low expression of stress at slaughter. Temperament had an impact on
production and carcase characteristics, however measurements taken in the feedlot and pre-
slaughter periods are poor predictors of these traits. Results from this experiment can be used to
develop indices for welfare assessment throughout the cattle supply chain.
P.PIP.0743 - The Impact of Handling Conditions and New Environments on the Stress of Cattle
Page 3 of 80
Executive summary Animal welfare is an important consideration in the beef supply chain. Measuring and maximising
animal welfare along the supply chain is important not only for the individual animals but also from a
marketing perspective given the public interest in animal welfare. There are also direct economic
implications of cattle welfare due to the impact of stress and animal temperament on carcase traits
and meat quality. Beef cattle are often managed in a feedlot environment prior to slaughter to
‘finish’ the cattle to market weight, with several routine assessment points to check their growth
during this process. The stress exhibited by livestock is affected by their handling and environment.
Minimising stress within the feedlot program is vital as this will affect animal well-being,
performance and growth, and potentially meat quality.
A key aim of this experiment was to assess the relative levels of stress exhibited by cattle in common
Australian handling and management conditions in a feedlot and abattoir. Furthermore the relative
impacts of cattle temperament on stress indicators compared to the difference in stress due to the
environment (different time points) was assessed. The impact of stress and temperament on
production characteristics and meat quality was also investigated with the aim of determining if
measurements in the feedlotting and pre-slaughter time periods could predict carcase traits and
meat quality.
Cattle that had been managed at one extensive beef farm were transported by road to a single
feedlot where they remained for 100 days before being transported to the same abattoir for
slaughter. The cattle had data collected at the time of induction to the feedlot, day 30, day 70,
feedlot exit and post slaughter, with these collection points aligning with routine management
procedures. Cattle were maintained in separate groups throughout the feedlot time period and
slaughtered in 4 groups on different days. In the feedlot, data was collected on cattle temperament
(flight speed and crush score), stress indicators from blood samples, behavioural analysis and cattle
growth. Following slaughter, blood was collected to examine the same range of stress indicators,
with samples collected to assess meat quality characteristics in addition to routine collection of
Meat Standards Australia carcase information. The stress measures examined in blood samples were
aimed at assessing a wide range of types of stress (acute, chronic, hydration, muscle damage,
nutritional stress) and were considered valid for assessing stress based on previous research.
Key findings from this research include:
• Cattle under the handling and management strategies utilised at this feedlot showed significant improvement in their temperament over their 100-day feedlot stay, which is likely related to the excellent low-stress stock handling of cattle at the feedlot and in the pre-slaughter period.
• The level of stress as measured by a range of blood indicators was considered low to moderate at all time points throughout the 100-day feedlot program and slaughter process.
• Compared to slaughter, cattle having been transported and inducted to the feedlot had a greater magnitude in chronic stress responses as indicated by markers of immune function, muscle damage, dehydration and feed deprivation. In comparison, the acute measures of stress (cortisol, lactate and glucose) were higher at the time of slaughter compared to induction, likely reflecting the increasing anticipation (short-term psychological stress) of the blood sampling regimen by the cattle over time.
P.PIP.0743 - The Impact of Handling Conditions and New Environments on the Stress of Cattle
Page 4 of 80
• There were few accurate indicators of cattle growth and carcase characteristics linked to the blood samples and temperament measures collected during the feedlot and pre-slaughter periods. However, one of the most useful indicators of future cattle performance was temperament as measured by flight speed at the time of induction. Cattle with poor temperament at the time of induction were shown to exhibit lower average daily gains, hot carcase weights, and increased shear force, despite habituation to the feedlot environment. These cattle were also more likely to show signs of acute stress at slaughter.
• Qualitative behavioural assessment (QBA) was able to differentiate between the stress levels of cattle at induction and slaughter and these results aligned well with the results of the blood and temperament indicators.
• The use of novel methods for prediction of post-slaughter muscle glycogen such as eye thermography showed some promising results.
Results of this study provide assurance that in well managed cattle production systems the stress of
cattle is low to moderate at all time points, and that overall the measures stress at slaughter are
lower than at the time of induction to the feedlot. This work provides important information that
shows, under good handling conditions, that cattle are habituated to the feedlot environment and
display improved temperament. The use of QBA in the feedlot and abattoir may be a useful adjunct
to document stress levels of cattle and be used as an auditing system.
The impact of temperament at the time of induction to the feedlot on cattle growth and some
aspects of carcase quality were quantified. It was found that the measurement of flight speed at or
before induction to the feed lot may be the most useful time at which to assess temperament of
cattle as it related to stress measures at slaughter and some growth and carcase characteristics.
Future work could focus on ways of ameliorating the stress of cattle considered to be of poor
temperament to improve cattle performance. This could include backgrounding of cattle with poor
temperament before entering the feedlot, or altered management within the feedlot.
Although there were some significant associations between temperament and some of the blood
measures with growth and carcass characteristics the predictive power and precision of these
measurements was limited. Despite this, the measures of stress utilised in this study remain
extremely useful for the assessment of stress at various time points in the supply chain as described
above. For predication of production and carcass characteristics there may be merit in examining
some of the stress indicators in this study over a larger number of cattle with a greater range of
characteristics, (e.g. cattle age, intramuscular fat, glycogen, shear force) however the use of blood
sampling in particular is unlikely to provide an precise method for predicting cattle growth and
carcass quality. There was however some evidence in this study that eye temperature as measured
by thermography has an association with post slaughter muscle glycogen. However, it is important
to investigate this technique in a larger population of cattle with a range of muscle glycogen with
validation of the technique before any conclusion or recommendations can be made.

P.PIP.0743 - The Impact of Handling Conditions and New Environments on the Stress of Cattle
Table of contents
The Impact of Handling Conditions and New Environments on the Stress of Cattle ...... 1
1 Background ........................................................................................................................... 7
2 Project objectives .................................................................................................................. 9
3 Methodology ...................................................................................................................... 10
3.1 Cattle selection, nutrition and sampling time points ..............................................10
3.2 Tests performed ...................................................................................................11
3.2.1 Crush score ......................................................................................................... 11
3.2.2 Flight speed ......................................................................................................... 11
3.2.3 Thermography ..................................................................................................... 11
3.2.4 Blood sampling .................................................................................................... 11
3.2.5 Carcase sampling ................................................................................................ 12
3.2.6 Analysis of glycogen ............................................................................................ 13
3.2.7 Analysis of shear force ........................................................................................ 14
3.2.8 Analysis of intramuscular fat ................................................................................ 14
3.3 Qualitative behavioural assessment .....................................................................14
3.3.1 Behavioural assessment filming .......................................................................... 14
3.3.2 Qualitative behavioural assessment (QBA) ......................................................... 14
3.3.3 Quantification ...................................................................................................... 15
3.4 Statistical analysis ................................................................................................16
4 Results ................................................................................................................................ 18
4.1 Raw data ..............................................................................................................18
4.2 Temperament measures at time points.................................................................22
4.3 The impact of time point on measures of stress ....................................................24
4.3.1 Acute stress indicators ........................................................................................ 24
4.3.2 Chronic stress indicators ..................................................................................... 25
4.3.2.1 Complete blood count results ................................................................................... 25
4.3.2.2 Other measures of stress and metabolism ............................................................... 28
4.3.3 The impact of gender on blood metabolites and stress indicators ........................ 30
4.4 The impact of temperament (flight speed) on measures of stress .........................31
4.5 Qualitative behavioural assessment .....................................................................35
4.6 The association of production traits and carcase characteristics using
temperament, blood results and eye temperature .............................................................40
P.PIP.0743 - The Impact of Handling Conditions and New Environments on the Stress of Cattle
4.6.1 Post slaughter muscle glycogen .......................................................................... 44
4.6.2 Temperament (flight speed and crush score) ...................................................... 47
4.6.3 Associations of other blood measures on production and carcase characteristics48
5 Discussion ........................................................................................................................... 49
5.1 Comparison of stress and temperament indicators between time points ..............49
5.1.1 Acute stress indicators ........................................................................................ 50
5.1.2 Chronic stress indicators ..................................................................................... 51
5.1.2.1 Complete blood count results ................................................................................... 51
5.1.3 Muscle damage (creatine kinase and aspartate aminotransferase) ..................... 53
5.1.4 Nutritional stress and metabolism ........................................................................ 53
5.1.5 Other indicators of stress ..................................................................................... 54
5.2 Cattle temperament and the impact of temperament on measures of stress ........55
5.2.1 Acute stress indicators and associations with flight speed ................................... 56
5.2.2 Other indicators of stress ..................................................................................... 57
5.3 Prediction of cattle growth, carcase traits and meat quality traits ..........................58
5.3.1 Post slaughter muscle glycogen and pH .............................................................. 58
5.3.2 Temperament measures, cattle growth and carcase characteristics. ................... 59
5.3.2.1 Average daily gain and hot carcase weight. .............................................................. 59
5.3.2.2 Shear force (N)........................................................................................................... 60
5.3.3 Other findings ...................................................................................................... 60
5.4 Qualitative behavioural assessment .....................................................................61
5.5 Completion of key objectives ................................................................................63
5.6 Assessment of project design and improvements .................................................65
6 Conclusions/recommendations ........................................................................................... 66
6.1 Recommendations ...............................................................................................67
7 Key messages ...................................................................................................................... 69
8 Bibliography........................................................................................................................ 70
9 Appendix ............................................................................................................................ 77
9.1 The impact of flight speed on indicators of stress. ................................................77

P.PIP.0743 - The Impact of Handling Conditions and New Environments on the Stress of Cattle
1 Background
Consumers are demanding that animals are managed in a healthy and stress-free environment along
the entire supply chain, therefore it is essential, to understand the nature of stressful conditions
throughout this time. Beef cattle are often managed in a feedlot environment prior to slaughter to
‘finish’ the cattle to market weight. Minimising stress within this program is vital as this will affect
animal well-being, performance and growth, and potentially meat quality.
Given that feedlotting is a common method of finishing cattle it is useful to know whether this equips
cattle, through their habituation to their environment, with better mechanisms to navigate the pre-
slaughter environment. Greater understanding of the response of cattle to stressors such as
transportation and induction to a novel environment at the feedlot as well as habituation may
facilitate lower levels of stress throughout the finishing and pre-slaughter process, thus improving
cattle welfare.
The stress exhibited by livestock is affected by their handling and environment (Hemsworth et al.,
2011). Beef producers and processors already aim to minimise the stress induced during transport,
the feedlot and lairage through adoption of low stress handling techniques, good handling facilities
and efficient processing and by increasing awareness and capacity of industry personnel. There are
time-points during the process which may be more stressful than others and this study aims to
establish baseline stress levels at various points during the process. A specific aim of this project is to
compare the level of stress as measured by physiological indicators, blood metabolites and
quantitative and qualitative behavioural assessments at different time points. There are previous
studies that focus specifically on cattle stress during transportation (Arthington, Eicher, Kunkle, &
Martin, 2003; Grandin, 1997; Minka & Ayo, 2009; Stockman et al., 2012), with information also
evaluating restraint (Grandin, 1997) and the pre slaughter time periods (Ferguson & Warner, 2008;
Shaw & Tume, 1992). It is often difficult to compare results of one study to another as studies will
often assess cattle at only one time point or compare two time points where the nutritional
management or environmental factors are vastly different. Transportation of cattle from an
extensive farm environment to a feedlot finishing program is a common practice and exposes cattle
to a novel environment, similarly after habituating to their feedlot environment cattle transport to
lairage and slaughter poses a new novel exposure. This study will focus on a comparison of the time
period associated with induction to the feedlot program and the pre-slaughter period in the same
animals to better compare the relative stress at these time points. In particular the cattle response to
habituation and subsequent stress response will be a focus.
Quantification of stress on animals and their production can be challenging as some manifestations
of stress occur at a subclinical level (Chen, Arsenault, Napper, & Griebel, 2015). A response to stress
can be evaluated in numerous ways, with the validity and feasibility of many of these tests
summarised by Losada-Espinosa et al (2017). A classical stress response is mediated through the
hypothalamus and central/sympathetic nervous systems to release glucocorticoids and
catecholamines with elevations of cortisol, adrenaline, glucose and lactate common indicators of
heightened stress response (Chen et al., 2015; Shaw & Tume, 1992). A complete blood count and
evaluation of neutrophil and lymphocyte ratios (N:L) can also be used to evaluate ruminant health
and detect a stress response (Blecha, Boyles, & Riley, 1984; Jones & Allison, 2007). The ratio of
neutrophil:lymphocytes has also been used to evaluate stress in mammals, birds and reptiles (Davis,

P.PIP.0743 - The Impact of Handling Conditions and New Environments on the Stress of Cattle
Maney, & Maerz, 2008) which may offer a better measure of stress. Haptoglobin and ceruloplasmin
are acute phase proteins that can be elevated in response to inflammation and infection in
ruminants (Ceciliani, Ceron, Eckersall, & Sauerwein, 2012; Cray, Zaias, & Altman, 2009) and have also
been used as a marker of stress in livestock (Giannetto et al., 2011; Lomborg, Nielsen, Heegaard, &
Jacobsen, 2008; Salamano et al., 2008). High magnesium levels have also been associated with a
reduced stress response (Hubbard, 1973) and low plasma magnesium has been associated with
increased stress and muscle contraction, which may potentiate dark cutting (Ebel & Günther, 1980;
Schonewille, 2013). Dehydration as a result of lack of available water or reluctance to consume water
when stressed can result in dehydration and elevations in packed cell volume (PCV) and total protein
(TP) (Hogan, Petherick, & Phillips, 2007; Jacob et al., 2006). Elevations of PCV are also associated with
exercise and stress (Fazio & Ferlazzo, 2003; Fell, Colditz, Walker, & Watson, 1999; Knowles, 1999).
Creatinine kinase (CK) and aspartate aminotransferase (AST) are indicators of muscle damage and
can increase with muscle trauma and exercise such as can occur during transportation and lairage
(Fisher et al., 2010; Pettiford et al., 2008). The relative nutritional stress that ruminants are exposed
to can be measured by non-esterified fatty acids (NEFA) (Saco et al., 2008) and beta hydroxybutyrate
(BHB) (Shaw & Tume, 1992; Warriss, Bevis, Brown, & Ashby, 1989), with differences in BHB having
been associated with dark cutting in bulls (Warriss, 1984a). Thermography of eye (ocular)
temperatures has recently been shown to be a precise and non-contact method to determine body
temperature (Petry, McGilvray, Rakhshandeh, & Rakhshandeh, 2017) and may be a useful indicator
of stress. Temperament can be assessed using observations of animals during restraint (crush score)
and when the cattle are released from the crush (flight speed) and has been shown to associate with
measures of stress in cattle (Burdick, Randel, Carroll, & Welsh, 2011; Coombes, Gardner, Pethick, &
McGilchrist, 2014; Curley, Paschal, Welsh, & Randel, 2006; Vann, Paschal, & Randel, 2004), however
these relationships require further investigation in the context of the feedlot environment. It is
difficult to use a single parameter by which to measure stress (Chen et al., 2015), hence the inclusion
of multiple parameter in this experiment.
The use of qualitative behavioural assessment (QBA) has been used to assess cattle temperament
under field conditions with success (Sant’Anna & da Costa, 2013) and had a good association with
more traditional measures of stress. QBA was also used successfully to differentiate between
habituated and naive cattle during transportation (Stockman et al., 2011), with the results correlating
well with body temperature, heart rate, plasma glucose and N:L. We have previously shown that QBA
can assist the assessment of pre-slaughter handling and that correlations exist between QBA and
other methods of assessment of stress such as plasma metabolites. This same study showed
correlation between slaughter order and slaughter lactate (Stockman et al., 2012) with further
investigation into this relationship and that of meat quality warranted. The benefits of QBA are that it
is a quick and non-invasive assessment that is relatively easy to implement, and provides a useful
measurement of an animal’s wellbeing, capturing how it reacts to its environment at a specific time
point. The use of QBA to make comparisons between time points of animal behaviour and well-being
is also a key aim of this experiment.
Apart from increasing the welfare of the animals through increased knowledge of the nature of any
stressful conditions, improvements in a cattle production and meat quality would be a beneficial
outcome of the experiment. Beef animals exhibiting a calmer temperament, measured by flight
speed and crush score, show a strong correlation with improved carcase performance in a
comprehensive range of beef productions traits and meat quality traits (Cafe, Cafe, Robinson,

P.PIP.0743 - The Impact of Handling Conditions and New Environments on the Stress of Cattle
Ferguson, & McIntyre; Petherick, Holroyd, Doogan, & Venus, 2002). In cattle, excitable temperament
has been linked to reduced tenderness (Gruber, Tatum, Engle, & Chapman, 2010; Warner, Ferguson,
Cottrell, & Knee, 2007) although this relationship has not been well explored, with other measures of
stress or temperament potentially offering better prediction.
Given that dark cutting continues to cost the Australian beef industry up to $55 million per annum
(Jose, McGilchrist, Perovic, Gardner, & Pethick, 2015) investigation into factors that can influence
ultimate carcase pH and glycogen is warranted. Temperament has been shown to effect glycogen
synthesis and mobilisation (Voisinet, Grandin, Tatum, O'Connor, & Struthers, 1997), and animals with
excitable temperaments having lower feed intake which could increase risk of dark cutting. In
contrast, other research shows no association of temperament on dark cutting (Coombes et al.,
2014), therefore further investigation into the association of temperament and meat quality is
required. Furthermore the opportunity to explore the use of a range of measures from the point of
entry to the feedlot through to slaughter will explore factors that impact on glycogen exists by
examining the same animals repeatedly through out the feedlot program.
A key objective of this study was to evaluate the stress response of cattle at two key time points,
induction to the feedlot and at slaughter to determine if a difference exists between the stress
response at these two time-points. Additionally, the use of blood parameters, assessment of
temperament and ocular thermography at a number of time-points from induction to feedlot and
slaughter was undertaken to better quantify how they impact cattle growth and carcase
characteristics. This study provides important information regarding the physiological response of
cattle to exposure to novel environments over time and has the potential to improve animal welfare
and meat quality. Results from this study will help to identify key time points where collection of
data relating to cattle temperament and stress measures may help to identify animals likely to
respond unfavourably to novel environments
2 Project objectives
• To identify markers of the relative stress in beef cattle at various time points in the supply
chain using stress related blood metabolites and behavioural assessments.
• To determine the impact that body temperament has on the stress responsiveness of cattle
at; induction to feedlot; after 70 days and at slaughter.
• To investigate whether the current recommendations for low stress stock handling technique
in lairage results in appropriate wellbeing of animals and meat quality – benchmarked
against other bovine and ovine blood metabolite, animal behaviour, body temperature and
meat quality data at slaughter
• To identify the impact of stress and temperament on meat quality of cattle

P.PIP.0743 - The Impact of Handling Conditions and New Environments on the Stress of Cattle
3 Methodology
3.1 Cattle selection, nutrition and sampling time points
Cattle for the study were sourced from a single property in the Geraldton region in Western Australia
over a 4 week period and transported to the same feedlot, ensuring conditions were relatively similar
for all inducted groups of cattle until slaughter. Prior to induction at the feedlot, cattle were
transported for 4 hours before being unloaded and weighed at a transit stop before the cattle were
loaded and transported for a further 4 hours to the feedlot. Cattle were unloaded from transport
and then inducted into the feedlot within 12 hours of arrival. At induction cattle were weighed and
an ear tag inserted. All cattle were of similar breed with a mixture of steers (n=116) and heifers
(n=74) (Table 1) of various cross breeds (Angus, Charolais, Droughtmaster, Limousin, Murray Grey,
Red Angus, Santa Gertrudis, Shorthorn, Simmental) . Cattle were inducted to the feedlot on 2
separate occasions approximately one month apart. Cattle in the group inducted first were
immediately separated into 2 smaller groups and remained separate for the duration of the
experiment. Cattle inducted in the second group remained together, however were slaughtered over
2 consecutive days.
Table 1. Number and sex of cattle in each of the 4 groups.
Group 1 Group 2 Group 3 Group 4 Total
Heifers 1 19 29 25 74
Steers 80 59 14 13 166
Total 81 78 43 38 240
This study was designed to compare cattle when conditions were similar with respect to fasting and
mixing of animals: at induction to the feedlot and pre-slaughter. Data was collected at these two
time-points and also at day 30, 70 and feedlot exit to record their adaptation to the feedlot
environment. The timing of data collection was specifically designed to coincide with the routine
management of the cattle in the 100-day grain-fed Meat Standards Australia (MSA) program to make
the results directly applicable to industry. The cattle had data collected at 5 time-points with Table 2
showing the schedule of data collection for all cattle in the study.
Table 2. Data collection time points from cattle induction (day 0) until slaughter and the procedures performed at each time point.
Time point Day 0 Day 30 Day 70 Feedlot exit
Slaughter
(day 102-105) Procedures performed
Weight Y Y Y Y Y
Crush score Y Y Y Y -
Blood collection Y - Y - Y
Eye thermography Y - Y - Y
Video data in race Y - Y - Y
Flight speed at race exit Y Y Y Y -
The average live weight of cattle at induction was 450 kg ± 24.6 (396, 516), with cattle remaining at
the feedlot for 100 days and exiting for slaughter at an average live weight of 645 kg ± 45 (518, 778).
P.PIP.0743 - The Impact of Handling Conditions and New Environments on the Stress of Cattle
During the 100 days spent in the feedlot, all cattle were fed on the same grain-based diet
supplemented with hay and ad-lib access to some kikuyu-based pasture. All groups of cattle
commenced a starter ration at feedlot entry for 7 days, followed by an intermediate ration for a
further 7 days and remained on ‘full’ ration for the remainder of their feedlot stay. The finisher ration
contained MJ/kg dry matter of metabolisable energy and 13% crude protein on a dry matter basis
and had a digestibility of 79.1 %.
3.2 Tests performed
3.2.1 Crush score
An observer recorded a crush score (range 1-5) based on their behaviour for the duration of the
animals time in the crush, the same assessor was used at each time point for consistency across
groups and days. The scores range from 1 which depicts very quiet to 5 which depicts very excited
(Curley et al., 2006).
3.2.2 Flight speed
Flight speed can be described as the speed at which cattle exit the crush (m/sec), with high flight
speeds indicative of excitable animals which have a poor or flighty temperament. Flight speed was
measure over a 3-metre distance using video analysis, as cattle immediately exited the crush after
weighing at the feedlot at all time points.
3.2.3 Thermography
Infrared thermography was performed to determine eye temperature of all cattle in the study at
induction, day 70 and immediately pre-slaughter using a FLIR E4 digital camera (FLIR Systems, Inc.,
Wilsonville, OR). The resolution for each infrared image was set at the maximum possible for the
camera model (80 by 60 pixels). The IR camera then converted the animal’s emitted radiation at a 10-
to 12- mm wavelength into an electrical signal, which was then processed into a thermal pattern. The
camera can detect temperature differentials as small as 0.1°C. The emissivity value used was 0.98,
which is the recommendation for biological tissues (Lahiri, Bagavathiappan, Jayakumar, & Philip,
2012). All infrared pictures were taken approximately 50 cm from the eye. Three pictures of the left
eye were taken for each animal, and pictures was analysed using FLIR Tools software (FLIR Systems,
Inc.). For determining eye temperature, the software was used to determine a spot temperature
reading of the medial canthus region of the eye, along with a maximum, minimum and average
temperature along a linear line connecting the medial and lateral canthi regions of the eye.
3.2.4 Blood sampling
On day 0 and 70, blood was collected from each animal using venepuncture of the tail vein and
placed into two 9 ml lithium heparin (Vacuette®) and one EDTA (BD Vacutainer®) blood tubes. Bloods
collected at slaughter were collected within 1 minute of slaughter directly from the carcase at
exsanguination. Following blood collection all samples were immediately placed in ice.
The lithium heparin samples were centrifuged within 4 hours of collection (3200 rpm, 10 minutes an
4 degrees Celsius) before being transferred to microcentrifuge containers in 1 mL aliquots and frozen
P.PIP.0743 - The Impact of Handling Conditions and New Environments on the Stress of Cattle
at -20°C until processing at a later time. For plasma metabolites (NEFA, glucose, protein, magnesium)
samples were thawed, with each sample inverted several times before a 100 μL sample was pipetted
into 1.7 mL sample cups (Greiner Bio-one, Kremsmüster, Austria). Laboratory analyses of plasma
were carried out as a batch sample using the Olympus AU400 automated chemistry analyser
(Olympus Optical Co. Ltd., Melville, NY) and commercially available reagent kits at Murdoch
University, Perth, WA, or as otherwise stated. For each commercial kit, the correlating control and
calibration sera was used. Plasma lactate, glucose, NEFA, magnesium, total protein, CK and AST were
analysed using commercial available reagent kits (Olympus Diagnostics, Tokyo, Japan). Plasma
haptoglobin, ceruloplasmin and BHB were analysed by the Western Australian Department of
Agriculture (DAFWA) Animal Health Laboratories, South Perth. Plasma BHB was analysed using the
commercial reagent kit (Randox Laboratories kit, County Antrim, UK). Plasma haptoglobin was
determined using an in-house method, based on the method described by Eckersall et al. (1999).
Plasma cortisol levels were determined using chemiluminescent immunometric assay on Immulite
XPi at Vetpath Veterinary services, (Perth, Australia).
The EDTA blood samples were refrigerated and sent to the laboratory for complete blood count and
determination of fibrinogen within 24 hours of collection. Automated red cell and white cell counts
were performed on a Cell Dyn 3700, with a manual differential from blood film also performed.
Fibrinogen was determined using a Stago Start 4.
3.2.5 Carcase sampling
Cattle were transported for approximately 3 hours before being held in lairage overnight with access
to water. Following electrical stunning slaughter and exsanguination, blood samples were collected
from each animal. A sample of M. longissimus lumborum et thoracis was obtained, adjacent and
caudal to the 12th rib within 60 minutes of slaughter. Immediately after each sample was taken,
visible fat was removed and samples were frozen and stored at −20 °C for glycogen and lactate
analysis.
At approximately 24 hours post slaughter meat samples were collected from the M. longissimus
thoracis, at the 12th rib, trimmed of visible fat and stored at −20 °C for shear force testing (100 g) and
intramuscular fat (70g).
Carcase measurements were taken by graders accredited with both MSA grading and AUS-MEAT
chiller assessment (AUS-MEAT, 2005; MLA 2006) . The carcase measurements included:
• Body number to identify individual carcases
• Hot standard carcase weight (HSCW) measured in kilograms with carcases dressed to AUS-
MEAT carcase standards (MLA, 2006)
• Sex (male/female)
• Hang method: AT, Conventional hanging by the Achilles tendon; TL, Hanging by the iliosacral
ligament, which is more commonly known as the sacro-sciatic ligament; TX: Hanging by the
“Pope’s Eye” or “Aitch bone”
• Hump height is measured in gradients of 5mm and is primarily used to verify the tropical
breed content declared on the vendor declaration (MLA, 2006).

P.PIP.0743 - The Impact of Handling Conditions and New Environments on the Stress of Cattle
• Fat colour was determined from the intermuscular fat lateral to the rib eye muscle. It was
assessed on the chilled carcase and scored against the AUS-MEAT fat colour reference
standards (AUS-MEAT, 2005) – this is not an MSA requirement but is recorded by the
abattoir
• Meat colour is the predominant colour of the rib eye muscle (M. longissimus thoracis et
lumborum). It was measured on the chilled carcase at the bloomed rib eye muscle face and
was scored against AUS-MEAT colour reference standards (AUS-MEAT, 2005). Meat colour
has a scale of 1 to 7, with carcases in the range of 1B to 3 acceptable for MSA.
• MSA Marbling score is a measure of the fat deposited between individual fibres in the rib eye
muscle ranging from 100 to 1100 in increments of 10.
• Rib fat depth is the depth of subcutaneous fat in millimetres. It was measured at the
quartering site in the chilled carcase approximately 75% of the way along the rib eye muscle
(AUS-MEAT, 2005).
• Ossification score was measured following the guidelines from the United States Department
of Agriculture (Romans, Costello, Carlson, Greaser, & Jones, 1994). Ossification provides a
scale between 100 and 590 in increments of 10 for MSA which is an assessment of
physiological age of a bovine carcase. It is a measure of the calcification in the spinous
processes in the sacral, lumbar and thoracic vertebrae (AUS-MEAT, 2005).
• Ultimate pH (pHu) and loin temperature was measured in the rib eye muscle (M. longissimus
thoracis) of the chilled carcase at the quartering site approximately 20 hrs post-mortem by
the plant staff
• Eye muscle area (EMA) is the area of the surface of the M. longissimus thoracis at the ribbing
site and is calculated in square centimetres. EMA may be measured at the 10th, 11th, 12th or
13th rib.
3.2.6 Analysis of glycogen
Muscle samples (approximately 2 g from each muscle) were weighed and homogenised in a 30 mM
HCl solution using a 10:1 ratio for 45 s at 27,000 rpm using a Bosch GGS 27C Professional. Laboratory
analyses of lactate in the muscle homogenate was then carried out using the enzymatic methods for
plasma lactate as described above. Glycogen in the homogenate was hydrolised to glucose using a
double enzyme method (Passonneau & Lauderdale, 1974). Muscle homogenate (125 μl) was digested
in 1 ml of enzyme mixture (8 mg amylase and 8 mg amyloglucosidase in 50 ml of 40 mM sodium
acetate buffer pH 4.8) for 1 h in a water bath at 37 °C. Laboratory analyses of digested homogenate
was carried out using an enzymatic method for glucose (Barthelmai & Czok, 1962). Again analyses
were automated using the Olympus AU400 automated chemistry analyser (Olympus Optical Co. Ltd,
Melville, New York) and Olympus reagent kits for glucose (Olympus Cat. No. OSR6121). Total
glycogen was calculated by halving the lactate value and adding it to the glucose value, expressed as
grams of glycogen per 100 g wet muscle tissue. Total glycogen concentration was calculated to give a
reflection of muscle glycogen at the time of slaughter, even though some of the lactate may have
been in the muscle prior to the time of slaughter. The lactate in the muscle at the time of slaughter
will still contribute to the ultimate pH of the muscle, which is why it is included.

P.PIP.0743 - The Impact of Handling Conditions and New Environments on the Stress of Cattle
3.2.7 Analysis of shear force
The M. longissimus lumborum et thoracis was prepared by removing sub-cutaneous fat and
connective tissue (epimysium). Loin samples of approximately 100 g were collected from the cranial
aspect of the loin muscle. Samples were vacuum packed, aged for 5 days at 1 °C and then frozen at
−20 °C until subsequent testing. Packaged frozen samples were cooked in a water bath at 71 °C for 35
min and then cooled in running water for 30 min after cooking. Six cores (approximately 3- 4 cm long,
1 cm2) from each loin sample were cut and Warner-Bratzler shear force (WBSF) was measured on
each core sample using a Lloyd texture analyser with a Warner–Bratzler shear blade fitted (Hopkins,
Toohey, Warner, Kerr, & van de Ven, 2010). Laboratory processing of loin samples and measurement
of WBSF was performed at the University of New England Meat Science Department (Armidale, New
South Wales, Australia).
3.2.8 Analysis of intramuscular fat
The IMF% of each muscle collected in 3.28 was determined using a NIR. Samples were commercially
freeze-dried using a Cuddon FD 1015 freeze dryer (Cuddon Freeze Dry, Blenheim, New Zealand). NIR
measurements were taken using a SpectroStar 2400 calibrated against chloroform solvent extraction
as detailed by (Perry, Shorthose, Ferguson, & Thompson, 2001).
3.3 Qualitative behavioural assessment
3.3.1 Behavioural assessment filming
A sub-group of 30 cattle were selected from the 240 animals filmed at induction to the feedlot, day
70 and immediately pre-slaughter. The aim of the selection of the 30 cattle was to have
representatives from relatively poor and good temperament (flight speed) animals to compare using
the qualitative behavioural assessment (QBA) methodology. The selection process was conducted
‘blind’ to the images captured on the film clips, and the same animals in the sub-group were
observed at each of the three time points (induction, day 70 and slaughter) chosen for QBA (i.e. time
points where blood samples were collected). The collection of footage for behavioural assessment
was achieved using a digital video camera (GoPro Hero3+: GoPro Inc., San Mateo, CA, USA)
positioned to capture ‘front on’ footage in the race as the cattle approached the crush (prior to flight
speed recording when they exited the crush) or drop-box (slaughter). Footage from the camera was
cropped and trimmed to remove any indication of location or treatment, using the software package
Filmora for Windows (Wondershare, Vancouver, Canada), and to achieve an average clip length of 41
± 12 seconds (mean ± SD).
3.3.2 Qualitative behavioural assessment (QBA)
The video camera footage was used for the QBA observer sessions. A total of 31 observers were
recruited for this study from Murdoch University School of Veterinary Sciences staff and students (22
female and 9 male). Observers were given detailed instructions on completing the QBA scoring
sessions but were not given any details on the animals or the experimental treatments. Observers
completed a short survey regarding their past experiences with cattle and other domestic livestock
species prior to the QBA assessment procedure, with 39% having a rural background and 35% having
significant background working with cattle. To complete the QBA assessment procedure the

P.PIP.0743 - The Impact of Handling Conditions and New Environments on the Stress of Cattle
observers used a Fixed List procedure where a list of 8 terms were provided to them for use in
assessing the cattle. The terms were: calm, interested, curious, relaxed, nervous, annoyed,
frightened, anxious. These terms were generated from a previous QBA Free Choice Profiling
procedure carried on pre-slaughter cattle (Stockman et al., 2012) and represented the highest
ranking terms in the top two dimensions of this previous QBA study.
3.3.3 Quantification
Observers viewed and scored video clips of the 30 assessment cattle at the three time points,
randomly presented, using provided lists of the descriptive terms. The definition of each descriptive
term, as defined by the Maquarie Encyclopedic Dictionary, was explained to the observers before the
start of the assessment. Observers were instructed to score each animal’s expression by placing an
‘X’ on a 100 mm visual analogue scale next to each descriptive term, where maximum indicated the
animal could not show a behavioural expression more strongly and minimum reflected the absence
of expression of that particular descriptive term, and the distance between the minimum-point and
their mark on the scale as reflected the intensity of each animal’s expression on that term.
For the sub-group of 30 cattle that were randomly chosen for QBA, the effect of time point (i.e.
induction, day 70, slaughter) on the measures of stress, temperament and meat quality and on the
GPA scores (obtained from the QBA) for the two main dimensions were analysed using repeated
measures ANOVA with Fisher’s PLSD post hoc analysis (Genstat 2008, VSN International, UK). The
association between the measures of stress, temperament and meat quality and GPA scores for the
90 video clips were investigated using Spearman Rank Order correlation (Genstat 2008, VSN
International, UK).
About 40 observers will be recruited for this study from Murdoch University veterinary and animal
science staff and students, with each completing a demographic questionnaire regarding prior
experience with animals. Observers will be given detailed instructions on completing the QBA scoring
sessions but will not be given any details on the animals or the experimental treatments. To
complete the QBA by means of a Free Choice Profiling procedure, observers will be required to
attend two sessions; a term generation session followed by the quantification session.
In the term generation step (session 1), observers will be shown 10 video clips of spare cattle not
used in the study, depicting these cattle traversing the raceway leading to the crush. These video
clips will be chosen to demonstrate a variety of behavioural expressions to allow observers to
describe as many aspects of the cattle’s expressive repertoire as possible. After watching each clip,
observers will be given 1 minute to write down terms they thought described the animal’s
behavioural expression. There will be no limit imposed on the number of descriptive terms an
observer can generate, but terms needed to describe not what the animal was doing (i.e. physical
descriptions of the animal such as vocalising, chewing, tail flicking), but the perceived emotional
state of the animal (e.g. nervous, relaxed). Subsequent editing of the descriptive terms will be carried
out to remove terms that described actions, and terms that were in the negative form were
transformed to the positive for ease of scoring (e.g. uncomfortable becomes comfortable). The result
being a unique list of descriptive terms for each of the observers to be used for quantification in
Session 2. Each descriptive term will be attached to a visual analogue scale (minimum to maximum)
in an electronic worksheet (Microsoft Excel 2003, North Ryde, NSW, Australia). The list of terms will
be randomly arranged, although terms with a similar meaning will not be listed together.
P.PIP.0743 - The Impact of Handling Conditions and New Environments on the Stress of Cattle
In the quantification step (session 2) observers will view and score a sub-set of video clips generated
in the experiment (about 15 at each time point) using their own unique lists of descriptive terms.
Observers will be instructed to score each animal’s expression using the visual analogue scale, where
maximum indicates the animal could not show an expression more strongly and minimum reflects
the absence of expression, and the distance between the minimum-point and their mark on the scale
reflects the intensity of each animal’s expression on that term.
3.4 Statistical analysis
The difference in magnitude of stress measures between different time points was assessed using a
linear mixed effects model in SAS (SAS Version 9.1, SAS Institute, Cary, NC, USA). Each of the models
included a stress indicator (blood result or eye temperature) as the dependent variable, with fixed
effects: sex (steer or heifer) within group (to account for the lack of females in group 1), time point
(induction, day 70 or slaughter), and group (1, 2, 3, 4), along with their relevant interactions. Animal
identification within group was included as a random term to account for repeated measures. Terms
in the model were removed in a step-wise manner if terms were non-significant (P>0.05). To
determine the impact that temperament (as measured by flight speed) had on the stress indicators
at each time point, it was included as a covariate along with interactions with the fixed effects, with
animal identification within group included as a random term. Terms in the model were removed in a
step-wise manner if terms were non-significant (P>0.05).
To examine the association of the measures of temperament and blood data, initially simple
correlations were generated between terms with a correlation matrix including data collected at
each time point where applicable (induction, day 30, day 70, feedlot exit and slaughter) for:
temperament (flight speed and crush score), plasma samples (AST, CK, cortisol, lactate, glucose, BHB,
ceruloplasmin, haptoglobin, magnesium), complete blood count results (neutrophil:lymphocyte PCV,
total protein, fibrinogen) and eye temperature, with production results (average daily gain) and
meat quality assessment (muscle pH, muscle glycogen, meat colour, shear force, cook loss%, P8 fat
depth, IMF% and MSA score). Factors that had significant correlations with meat quality and
production factors were included in linear mixed effects models with production factors (average
daily gain) or meat quality trait (muscle pH, muscle glycogen, meat colour, shear force, cook loss%,
P8 fat depth, IMF%, MSA score) as the dependent variable and random a term of group. Terms in the
model were removed in a step-wise manner if terms were non-significant (P>0.05).
To determine the precision of prediction of cattle growth and carcass traits the terms identified as
being significant were included as covariates in a general linear model with the trait (average daily
gain, glycogen, shear force, hot carcass weight) the dependent variable.
To analyse the observer’s QBA recording sheets, the distance from the start of the visual analogue
scale to where the observer had made a mark for each term was calculated (where minimum = 0 and
maximum = 100) and these data were analysed by means of Generalised Procrustes Analysis (GPA)
(Genstat 2008, VSN International, Hemel Hempsteat, UK) (Wemelsfelder, Hunter, Mendl, &
Lawrence, 2000). For a detailed description of GPA analysis and output interpretation procedures see
Wemelsfelder and colleagues (Wemelsfelder et al., 2000; Wemelsfelder, Hunter, Mendl, & Lawrence,
2001). Briefly, GPA is a multivariate technique for sensory data that identifies underlying patterns in
observer assessments (i.e. descriptive terms of the animal’s behavioural expression) and calculates

P.PIP.0743 - The Impact of Handling Conditions and New Environments on the Stress of Cattle
the level of consensus between observer assessments of sheep. Because each observer scores the
same footage, the analysis captures the similarity (consensus) in scoring patterns between observers.
The statistical process whereby this best-fit pattern is identified, termed the consensus profile, takes
place without any reference to the meaning of terms used by observers. The Procrustes statistic is
calculated quantifying the percentage of variation between observers (in their assessment of
individual sheep) that is explained by the consensus. The statistical performance of the consensus
profile above chance is calculated by comparing (using a one-sample t-test) the Procrustes statistic to
the mean of a simulated distribution of 100 Procrustes statistics generated through 100 iterations of
the analysis, where the data is randomised in a different permutation each time. Significance values
in that test of P < 0.001 or better can be taken as evidence that the consensus profile was not a
methodological artefact and does represent a common pattern identified by observers. The
Procrustes statistic is also used to assess the degree of agreement between individual observers and
the overall consensus profile. To do this, Principal Component Analysis is used to reduce the many
dimensions within the consensus profile to a smaller number of dimensions, which explain the
majority of variation between observed animals. To allow for semantic interpretation of these main
dimensions, the score for individual observer terms can be correlated with the overall dimension
score (i.e. the more highly correlated an individual term is with a dimension, the more weight it has
as a descriptor – positive or negative – for that dimension). This process is entirely post hoc to the
computation of the consensus profile, but allows identification of the individual terms that best
describe the anchor points at each end of the main dimensions for purposes of interpretation.

P.PIP.0743 - The Impact of Handling Conditions and New Environments on the Stress of Cattle
4 Results
4.1 Raw data
Data was collected at induction to the feedlot, day 30, day 70, feedlot exit and at slaughter as
described in the methods. The raw data for temperament indicators (flight speed and crush score),
blood samples and eye thermography and carcase information are shown in Tables 3, 4, 5, 6 and 7.
P.PIP.0743 - The Impact of Handling Conditions and New Environments on the Stress of Cattle
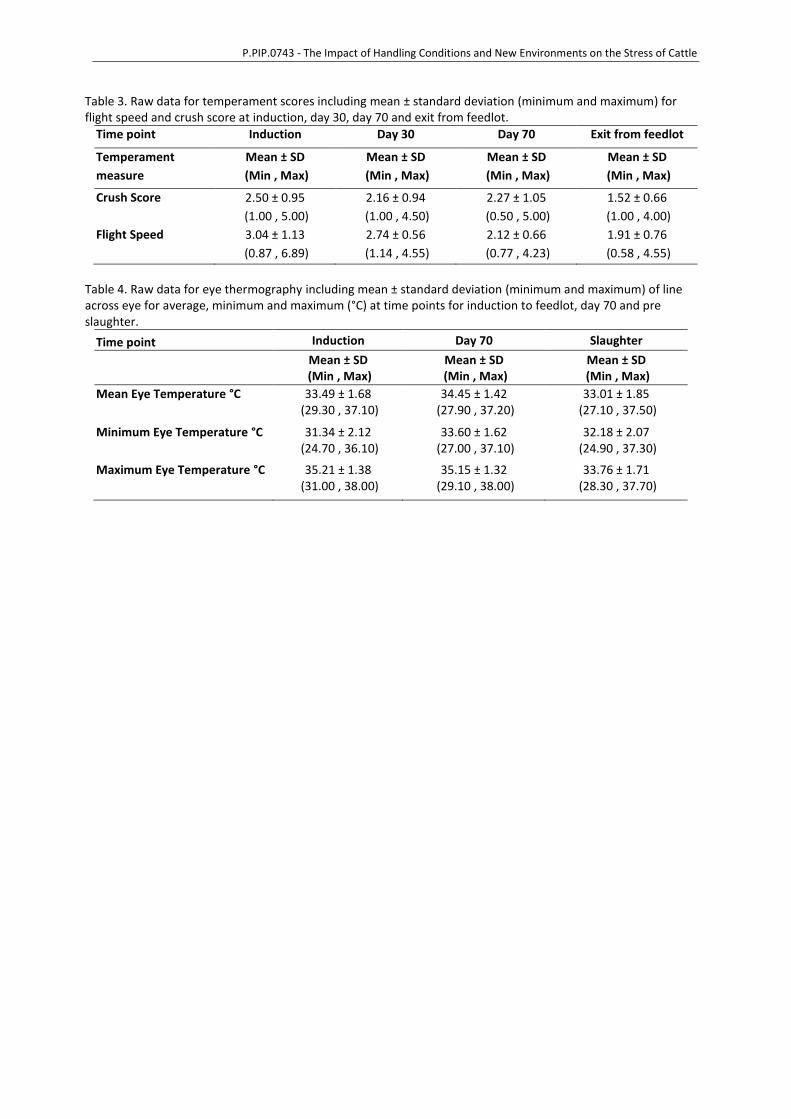
Table 3. Raw data for temperament scores including mean ± standard deviation (minimum and maximum) for flight speed and crush score at induction, day 30, day 70 and exit from feedlot.
Time point Induction Day 30 Day 70 Exit from feedlot
Temperament
measure
Mean ± SD
(Min , Max)
Mean ± SD
(Min , Max)
Mean ± SD
(Min , Max)
Mean ± SD
(Min , Max)
Crush Score 2.50 ± 0.95
(1.00 , 5.00)
2.16 ± 0.94
(1.00 , 4.50)
2.27 ± 1.05
(0.50 , 5.00)
1.52 ± 0.66
(1.00 , 4.00)
Flight Speed 3.04 ± 1.13
(0.87 , 6.89)
2.74 ± 0.56
(1.14 , 4.55)
2.12 ± 0.66
(0.77 , 4.23)
1.91 ± 0.76
(0.58 , 4.55)
Table 4. Raw data for eye thermography including mean ± standard deviation (minimum and maximum) of line across eye for average, minimum and maximum (°C) at time points for induction to feedlot, day 70 and pre slaughter.
Time point Induction Day 70 Slaughter
Mean ± SD (Min , Max)
Mean ± SD (Min , Max)
Mean ± SD (Min , Max)
Mean Eye Temperature °C 33.49 ± 1.68 (29.30 , 37.10)
34.45 ± 1.42 (27.90 , 37.20)
33.01 ± 1.85 (27.10 , 37.50)
Minimum Eye Temperature °C 31.34 ± 2.12 (24.70 , 36.10)
33.60 ± 1.62 (27.00 , 37.10)
32.18 ± 2.07 (24.90 , 37.30)
Maximum Eye Temperature °C 35.21 ± 1.38 (31.00 , 38.00)
35.15 ± 1.32 (29.10 , 38.00)
33.76 ± 1.71 (28.30 , 37.70)
P.PIP.0743 - The Impact of Handling Conditions and New Environments on the Stress of Cattle
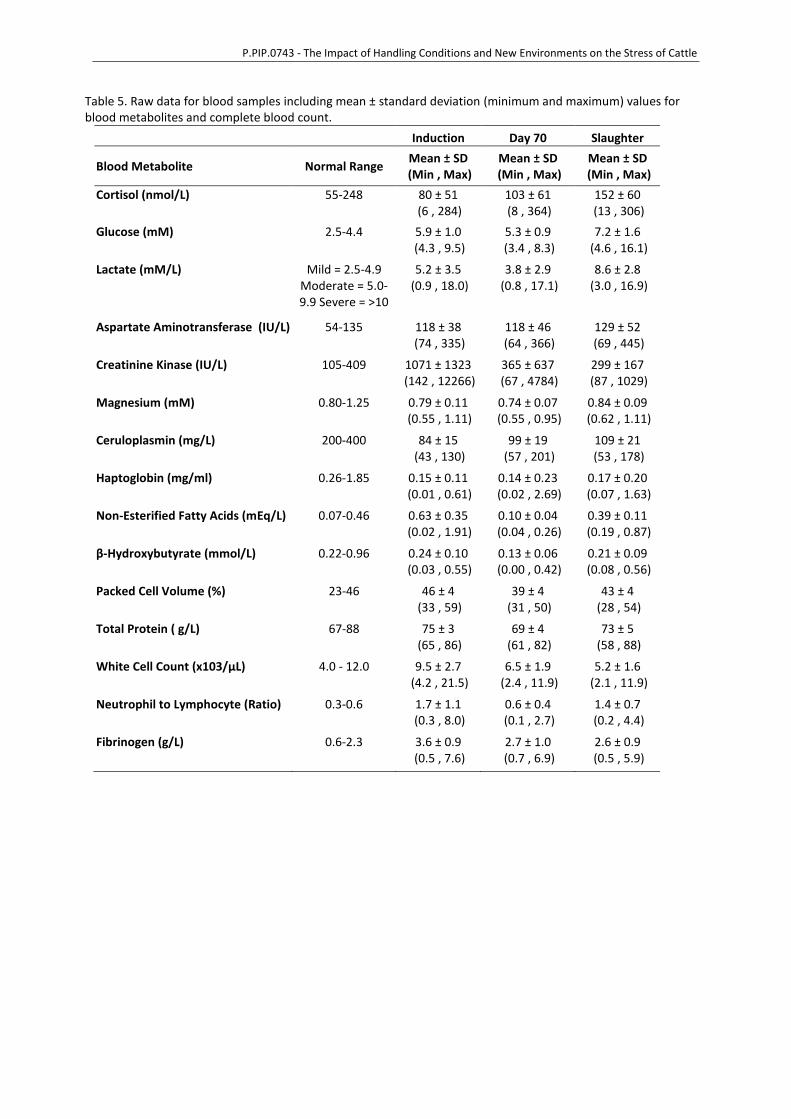
Table 5. Raw data for blood samples including mean ± standard deviation (minimum and maximum) values for blood metabolites and complete blood count.
Induction Day 70 Slaughter
Blood Metabolite Normal Range Mean ± SD
(Min , Max) Mean ± SD
(Min , Max) Mean ± SD
(Min , Max)
Cortisol (nmol/L) 55-248 80 ± 51 (6 , 284)
103 ± 61 (8 , 364)
152 ± 60 (13 , 306)
Glucose (mM) 2.5-4.4 5.9 ± 1.0 (4.3 , 9.5)
5.3 ± 0.9 (3.4 , 8.3)
7.2 ± 1.6 (4.6 , 16.1)
Lactate (mM/L) Mild = 2.5-4.9 Moderate = 5.0-9.9 Severe = >10
5.2 ± 3.5 (0.9 , 18.0)
3.8 ± 2.9 (0.8 , 17.1)
8.6 ± 2.8 (3.0 , 16.9)
Aspartate Aminotransferase (IU/L) 54-135 118 ± 38 (74 , 335)
118 ± 46 (64 , 366)
129 ± 52 (69 , 445)
Creatinine Kinase (IU/L) 105-409 1071 ± 1323 (142 , 12266)
365 ± 637 (67 , 4784)
299 ± 167 (87 , 1029)
Magnesium (mM) 0.80-1.25 0.79 ± 0.11 (0.55 , 1.11)
0.74 ± 0.07 (0.55 , 0.95)
0.84 ± 0.09 (0.62 , 1.11)
Ceruloplasmin (mg/L) 200-400 84 ± 15 (43 , 130)
99 ± 19 (57 , 201)
109 ± 21 (53 , 178)
Haptoglobin (mg/ml) 0.26-1.85 0.15 ± 0.11 (0.01 , 0.61)
0.14 ± 0.23 (0.02 , 2.69)
0.17 ± 0.20 (0.07 , 1.63)
Non-Esterified Fatty Acids (mEq/L) 0.07-0.46 0.63 ± 0.35 (0.02 , 1.91)
0.10 ± 0.04 (0.04 , 0.26)
0.39 ± 0.11 (0.19 , 0.87)
β-Hydroxybutyrate (mmol/L) 0.22-0.96 0.24 ± 0.10 (0.03 , 0.55)
0.13 ± 0.06 (0.00 , 0.42)
0.21 ± 0.09 (0.08 , 0.56)
Packed Cell Volume (%) 23-46 46 ± 4 (33 , 59)
39 ± 4 (31 , 50)
43 ± 4 (28 , 54)
Total Protein ( g/L) 67-88 75 ± 3 (65 , 86)
69 ± 4 (61 , 82)
73 ± 5 (58 , 88)
White Cell Count (x103/µL) 4.0 - 12.0 9.5 ± 2.7 (4.2 , 21.5)
6.5 ± 1.9 (2.4 , 11.9)
5.2 ± 1.6 (2.1 , 11.9)
Neutrophil to Lymphocyte (Ratio) 0.3-0.6 1.7 ± 1.1 (0.3 , 8.0)
0.6 ± 0.4 (0.1 , 2.7)
1.4 ± 0.7 (0.2 , 4.4)
Fibrinogen (g/L) 0.6-2.3 3.6 ± 0.9 (0.5 , 7.6)
2.7 ± 1.0 (0.7 , 6.9)
2.6 ± 0.9 (0.5 , 5.9)

P.PIP.0743 - The Impact of Handling Conditions and New Environments on the Stress of Cattle
Table 6. Raw carcase data including mean ± standard deviation, minimum and maximum values for
intramuscular fat %, shear force (N), cooking loss (%), post slaughter glycogen in the M. Longissimus
lumborum et thoracis, pH at 24h, hot carcase weight (kg), average daily gain (kg), eye muscle are
(cm2), ossification and MSA score.
Meat Quality Measure Mean ± SD (Min , Max)
Intramuscular Fat % 3.65 ± 1.17 (1.82 , 8.40)
Shear Force N 3.94 ± 0.67 (2.47 , 6.61)
Cook loss % 25.35 ± 2.02 (18.92 , 30.45)
Glycogen g/100g 1.25 ± 0.18 (0.64 , 1.67)
pH 5.55 ± 0.05 (5.30 , 5.69)
Hot carcase weight (kg) 346.26 ± 27.19 (269.80 , 422.80)
Average Daily Gain (kg) 2.02 ± 0.35 (0.88 , 2.88)
Eye muscle area (cm2) 85.43 ± 12.02 (60.5 , 124.00)
P8 fat depth (mm) 13.97 ± 5.31 (4.00 , 45.00)
Ossification 140.33 ± 15.47 (100.00 , 180.00)
MSA Score 61.33 ± 1.54 (52.74 , 65.64)
Table 7. Raw data showing Meat Standards Australia meat colour grading of cattle.
Meat Quality Measure 1A 1B 1C 2 3
MSA Eligibility Ungrade Adequate MSA Grade
Adequate MSA Grade
Adequate MSA Grade
Adequate MSA Grade
Number of animals 0 17 140 86 1
P.PIP.0743 - The Impact of Handling Conditions and New Environments on the Stress of Cattle
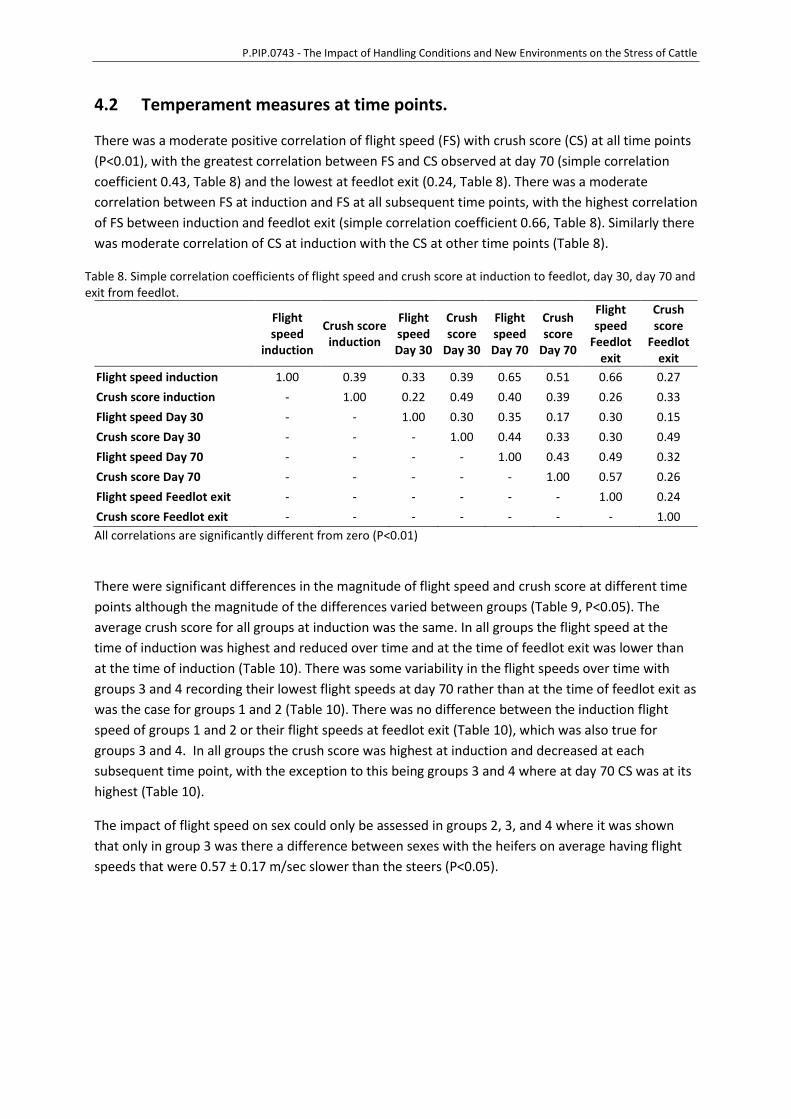
4.2 Temperament measures at time points.
There was a moderate positive correlation of flight speed (FS) with crush score (CS) at all time points
(P<0.01), with the greatest correlation between FS and CS observed at day 70 (simple correlation
coefficient 0.43, Table 8) and the lowest at feedlot exit (0.24, Table 8). There was a moderate
correlation between FS at induction and FS at all subsequent time points, with the highest correlation
of FS between induction and feedlot exit (simple correlation coefficient 0.66, Table 8). Similarly there
was moderate correlation of CS at induction with the CS at other time points (Table 8).
Table 8. Simple correlation coefficients of flight speed and crush score at induction to feedlot, day 30, day 70 and exit from feedlot.
Flight speed
induction
Crush score induction
Flight speed Day 30
Crush score
Day 30
Flight speed Day 70
Crush score
Day 70
Flight speed
Feedlot exit
Crush score
Feedlot exit
Flight speed induction 1.00 0.39 0.33 0.39 0.65 0.51 0.66 0.27
Crush score induction - 1.00 0.22 0.49 0.40 0.39 0.26 0.33
Flight speed Day 30 - - 1.00 0.30 0.35 0.17 0.30 0.15
Crush score Day 30 - - - 1.00 0.44 0.33 0.30 0.49
Flight speed Day 70 - - - - 1.00 0.43 0.49 0.32
Crush score Day 70 - - - - - 1.00 0.57 0.26
Flight speed Feedlot exit - - - - - - 1.00 0.24
Crush score Feedlot exit - - - - - - - 1.00
All correlations are significantly different from zero (P<0.01)
There were significant differences in the magnitude of flight speed and crush score at different time
points although the magnitude of the differences varied between groups (Table 9, P<0.05). The
average crush score for all groups at induction was the same. In all groups the flight speed at the
time of induction was highest and reduced over time and at the time of feedlot exit was lower than
at the time of induction (Table 10). There was some variability in the flight speeds over time with
groups 3 and 4 recording their lowest flight speeds at day 70 rather than at the time of feedlot exit as
was the case for groups 1 and 2 (Table 10). There was no difference between the induction flight
speed of groups 1 and 2 or their flight speeds at feedlot exit (Table 10), which was also true for
groups 3 and 4. In all groups the crush score was highest at induction and decreased at each
subsequent time point, with the exception to this being groups 3 and 4 where at day 70 CS was at its
highest (Table 10).
The impact of flight speed on sex could only be assessed in groups 2, 3, and 4 where it was shown
that only in group 3 was there a difference between sexes with the heifers on average having flight
speeds that were 0.57 ± 0.17 m/sec slower than the steers (P<0.05).

P.PIP.0743 - The Impact of Handling Conditions and New Environments on the Stress of Cattle
Table 9. .F values, and numerator and denominator d.f, for the effects of the time point, sex, and group on flight speed (m/sec) and crush score (1-5)
Flight speed (m/sec) Crush score (1-5)
NDF,DDF F-value NDF,DDF F-value
Time point 3,680 204.67* 3,687 92.04*
Sex(Group) 1,680 4.27* - -
Group 3,231 30.71** 3,236 4.86*
Time point*Group 9,680 21.89** 9,687 13.92*
NDF, DDF = numerator and denominator d.f. *P <0.01, **P <0.001.
Table 10. Predicted LS means ± SE for crush score and flight speed (m/sec) at time points induction,
day 30, day 70 and feedlot exit
Crush score (1-5) Flight speed (m/sec)
Group Time point Least squared means ± s.e
Group 1 Induction 2.41 ± 0.10fg 2.62 ± 0.08de Day 30 2.22 ± 0.10ef 2.69 ± 0.08ef Day 70 1.82 ± 0.10bc 2.07 ± 0.08bc Feedlot exit 1.35 ± 0.10a 1.53 ± 0.08a
Group 2 Induction 2.50 ± 0.10g 2.72 ± 0.09ef Day 30 2.13 ± 0.10de 2.73 ± 0.09ef Day 70 1.90 ± 0.10cd 1.96 ± 0.09b Feedlot exit 1.66 ± 0.10b 1.42 ± 0.09a
Group 3 Induction 2.57 ± 0.13g 3.72 ± 0.11g Day 30 2.00 ± 0.14cd 2.79 ± 0.11ef Day 70 2.99 ± 0.14h 2.38 ± 0.11d Feedlot exit 1.42 ± 0.13a 2.86 ± 0.11ef
Group 4 Induction 2.54 ± 0.14g 3.92 ± 0.12g Day 30 2.24 ± 0.14ef 2.95 ± 0.12f Day 70 3.12 ± 0.14h 2.35 ± 0.12cd Feedlot exit 1.65 ± 0.14b 2.74 ± 0.12ef a,b,c,d,e,f,g,h Values within a column with different superscripts differ significantly at P <0.05.

P.PIP.0743 - The Impact of Handling Conditions and New Environments on the Stress of Cattle
4.3 The impact of time point on measures of stress
4.3.1 Acute stress indicators
The acute stress indicators were defined as measures which change rapidly (minutes) in response to
stress such as cortisol, lactate, glucose and body temperature. There was a significant variation
within the blood measures of these acute stress indicators (cortisol, glucose and lactate) with the
results differing between groups and at different time points (P<0.05,Table 11). The statistical
models for these stress indicators described 52%, 68% and 69% of the total variance for cortisol,
glucose and lactate respectively. In all groups, the cortisol, glucose and lactate predicted at slaughter
were significantly greater than at induction (P<0.05), however, the magnitude of the differences for
each of these stress indicators varied between groups (Table 12).
The magnitude of the variation in plasma cortisol, glucose and lactate levels between groups at
induction was less than at the time of slaughter (Table 12). In all groups, the cortisol at induction to
the feedlot was lowest and was, on average across all groups, 72.7 nmol/L higher at slaughter. The
largest increase in cortisol was observed in group 4 where it increased by as much as 80.4 nmol/L
although the greatest proportional increase was observed in group 1 where the cortisol
concentration doubled, with an increase from 69.9 to 140.6 nmol/L (Table 12). Cortisol was
significantly increased at day 70 compared to induction in groups 2 and 4, however, there was no
change in cortisol in groups 1 and 3 over the same time. Cortisol levels were also increased at day 70
compared to induction in groups 2 and 4 (P<0.05, Table 12). However, at no timepoint in any of the
groups did average cortisol concentration exceed the maximum for the normal physiological
reference range value for cattle.
Similarly to cortisol, glucose was highest at slaughter in all groups compared to the time of induction,
although the greatest increase was observed in group 3 where there was a 1.75 mM increase in
glucose or 30.7% increase (Table 12). In contrast to the cortisol results, at day 70, glucose was
significantly lower than at both induction and slaughter across all groups (Table 12).
Plasma lactate was also lower at induction compared to slaughter for all groups with as much as a 4.0
mM/L increase to 7.6 mM/L (110% increase) of lactate observed at slaughter in group 1 (Table 12).
Lactate at day 70 was intermediary when compared to induction and slaughter in all groups except
Group 1 (Table 12) where it was the same as at induction. The greatest variation in lactate between
groups was observed at the time of induction (3.8 mM/L), with variation betwwen groups reduced at
slaughter (2.1 mM/L) and day 70 (1.35 mM/L) (Table 12).

P.PIP.0743 - The Impact of Handling Conditions and New Environments on the Stress of Cattle
Table 11. F values, and numerator and denominator d.f, for the effects of the time point, sex and group on plasma cortisol (nmol/L), glucose (nM/L), and lactate (mM/L) and mean eye temperature.
Cortisol (mmol/L)
Glucose (mM/L)
Lactate (mM/L)
Mean eye temperature (°C)
Effect NDF, DDF
F-value
NDF, DDF
F-value
NDF, DDF
F-value NDF, DDF
F-value
Time point 3,684 91.87*** 2,454 314.02*** 2,454 314.44*** 2,430 47.73***
Sex (Group) - - - - - - 3,430 3.41*
Group 3,234 4.92** 3,234 8.76*** 3,234 8.43*** 3,230 13.54***
Time point*Group 9,684 13.7*** 6,454 11.86*** 6,454 4.15*** 6,430 23.66***
NDF, DDF = numerator and denominator d.f. *P < 0.05, **P <0.01, ***P <0.001. Table 12. Predicted least squared means ± s.e for acute stress indicators cortisol (nmol/l), glucose (nM/L) and lactate (nM/L) at induction, day 70 and slaughter.
Cortisol
(nmol/L) Glucose (mM/L)
Lactate (mM/L)
Mean eye temperature (°C)
Group Time point Least squared means ± s.e
Group 1 Induction 69.89 ± 6.1a 5.63 ± 0.1bc 3.63 ± 0.3a 33.30 ± 0.17c Day 70 80.20 ± 6.1ab 5.23 ± 0.1ab 3.51 ± 0.3a 34.04 ± 0.17d Slaughter 140.57 ± 6.1d 6.35 ± 0.1d 7.61 ± 0.3c 32.59 ± 0.17b
Group 2 Induction 70.72 ± 6.1a 5.94 ± 0.1c 5.17 ± 0.3b 32.05 ± 0.20a Day 70 100.09 ± 6.2c 5.12 ± 0.1a 3.50 ± 0.3a 35.02 ± 0.18e Slaughter 144.40 ± 6.1de 7.68 ± 0.1e 8.79 ± 0.3d 33.65 ± 0.18cd
Group 3 Induction 92.58 ± 8.4bc 5.68 ± 0.2c 5.61 ± 0.5b 34.77 ± 0.24e Day 70 100.77 ± 8.6c 5.23 ± 0.2a 3.58 ± 0.5a 34.05 ± 0.25d Slaughter 163.61 ± 8.3ef 7.43 ± 0.2e 8.95 ± 0.5d 32.31 ± 0.23ab
Group 4 Induction 103.02 ± 8.8c 6.36 ± 0.2d 7.31 ± 0.5c 35.00 ± 0.24e Day 70 147.92 ± 8.8de 5.78 ± 0.2c 4.85 ± 0.5b 34.70 ± 0.25e
Slaughter 183.38 ± 8.9f 7.66 ± 0.2e 9.74 ± 0.5d 33.56 ± 0.25cd a,b,c,d,e,f,Values within a column with different superscripts differ significantly at P <0.05. Mean eye temperature as assessed by hand held thermography varied between time points, groups
and sexes (Table 11, P<0.05). The mean eye temperature was highly variable between time points,
with groups 1, 3 and 4 showing higher mean eye temperature at induction compared to slaughter
with the opposite true in group 2 (P<0.05, Table 12). The greatest variation in eye temperature
between groups was observed at induction where there was a 1.78°C (5.4%) difference between the
eye temperature of the highest and lowest groups.
4.3.2 Chronic stress indicators
4.3.2.1 Complete blood count results
There was significant variation in the magnitude of the results for complete blood counts with
variation between sex and groups at the different time points for packed cell volume (%), total
protein (g/L), total white cell count (x103/L), neutrophil: lymphocyte), neutrophil (x103/L),
lymphocytes (x103/L), fibrinogen (g/L) (P<0.05, Table 13).
P.PIP.0743 - The Impact of Handling Conditions and New Environments on the Stress of Cattle
Packed cell volume (PCV) was highest at the time of induction for all groups compared to slaughter
and lowest at day 70 (P<0.05, Table 14). At slaughter, the greatest decrease in PCV compared to
induction was observed in group 3 where there was a decrease of 4.8 PCV percent units which
equates to a decrease of 10.6 % in PCV from that measured at the time of induction. There was no
significant difference in total protein (g/L) between induction and slaughter in groups 3 and 4,
although in groups 1 and 2 the total protein was 3.4% and 4.7% higher at the time of induction (Table
14). Similar to PCV, in all groups the total protein was lowest at day 70 (Table 14).
The total white cell count and neutrophil counts were highest at the time of induction and lowest at
the time of slaughter with the converse true of the lymphocyte counts (Table 14). The greatest
reduction in total white cell counts were observed in groups 1 and 2 where there was a 4.8 and 6.6
X103 (55 and 42%) decrease in white cell counts between induction to the feedlot and the time of
slaughter. There was no difference between neutrophil:lymphocyte at induction and slaughter in
groups 1, 3 and 4, with the exception of group 2, which had higher neutrophil:lymphocyte at the time
of induction to the feedlot (Table 14). There was greater variation between groups of the
neutrophil:lymphocyte at the time of induction (0.94 units) compared to slaughter (0.11 units) (Table
14). Fibrinogen was highest in all groups at the time of induction compared to both day 70 and
slaughter, however the magnitude of the differences varied between groups (P<0.05, Table 13).

Page 27 of 80
Table 13. F values, and numerator and denominator d.f, for the effects of the base model and flight speed corrected models for packed cell volume (%), total protein (g/L), total white cell count (x103/L), neutrophil: lymphocyte), neutrophil (x103/L), lymphocytes (x103/L), fibrinogen (g/L).
Packed cell volume (%)
Total protein (g/L)
Total white cell count (x103/L)
Neutrophil: Lymphocyte
Neutrophil (x103/L)
Lymphocyte (x103/L)
Fibrinogen (g/L)
NDF, DDF
F-value NDF, DDF
F-value NDF, DDF
F-value NDF, DDF
F-value NDF, DDF
F-value NDF, DDF
F-value NDF,
DDF F-value
Time point 2,439 250.57** 2,454 139.09** 2,445 237.34** 2,443 102.74** 2,445 210.81*** 2,451 178.76** 2,446 79.94**
Group(Sex) 3,439 1.6 - - 3,445 2.63 3,443 3.7* 3,445 5.07** - - - -
Group 3,231 2.97* 3,234 4.49** 3,231 12.02** 3,231 4.45** 3,231 14*** 3,234 5.98** 3,234 2.73*
Time point*sex(Group) 6,439 3.95** - - 6,445 3.69** 6,443 5.4** 6,445 6*** - - - -
Time point*Group 6,439 11.49** 6,454 7.8** 6,445 32.02** 6,443 7.24** 6,445 30.83*** 6,451 6.39** 6,446 2.42*
NDF, DDF = numerator and denominator d.f. *P < 0.05, **P <0.01, ***P <0.001
Table 14. Predicted least squared means ± s.e for complete blood count results for packed cell volume (%), total protein (g/L), total white cell count (x103/L), neutrophil: lymphocyte), neutrophil (x103/L), lymphocytes (x103/L), fibrinogen (g/L) and induction, day 70 and slaughter.
Packed Cell Volume (%)
Total Protein (g/L)
Total white cell count
(x103/L)
Neutrophil to Lymphocyte
Neutrophil (x103/L)
Lymphocyte (x103/L)
Fibrinogen (g/L)
Group Time Point Least squared means ± s.e
Group 1 Induction 45.4 ± 0.4f 75.06 ± 0.46ef 10.55 ± 0.21i 1.58 ± 0.08b 5.67 ± 0.16f 4.23 ± 0.13f 3.47 ± 0.10d
Day 70 38.8 ± 0.4a 68.67 ± 0.43a 6.32 ± 0.21de 0.53 ± 0.08a 1.93 ± 0.15a 3.90 ± 0.13ef 2.97 ± 0.10c
Slaughter 44.5 ± 0.4e 72.63 ± 0.43cd 5.76 ± 0.21cd 1.41 ± 0.08b 2.93 ± 0.15d 2.33 ± 0.13b 2.78 ± 0.10bc
Group 2 Induction 47.8 ± 0.5h 75.75 ± 0.44f 11.35 ± 0.25j 2.23 ± 0.10c 6.96 ± 0.18g 3.62 ± 0.13de 3.67 ± 0.10d
Day 70 38.9 ± 0.5a 67.84 ± 0.44a 6.41 ± 0.26ef 0.65 ± 0.10a 2.17 ± 0.19ab 3.63 ± 0.13de 2.46 ± 0.10ab
Slaughter 43.2 ± 0.5d 72.57 ± 0.44bcd 4.70 ± 0.24a 1.40 ± 0.09b 2.46 ± 0.18bc 1.96 ± 0.13a 2.50 ± 0.10ab
Group 3 Induction 45.0 ± 0.6ef 74.30 ± 0.60ef 7.01 ± 0.30gh 1.29 ± 0.12b 3.43 ± 0.22e 2.99 ± 0.17c 3.50 ± 0.14d
Day 70 39.2 ± 0.6ab 71.63 ± 0.61bc 6.93 ± 0.31fgh 0.68 ± 0.12a 2.46 ± 0.23bcd 3.93 ± 0.18ef 2.57 ± 0.14ab
Slaughter 40.3 ± 0.6c 75.06 ± 0.59ef 5.01 ± 0.30ab 1.43 ± 0.12b 2.52 ± 0.22bcd 2.16 ± 0.17ab 2.35 ± 0.14a
Group 4 Induction 46.3 ± 0.6g 74.82 ± 0.63ef 7.43 ± 0.32h 1.38 ± 0.12b 3.69 ± 0.23e 3.02 ± 0.18c 3.53 ± 0.15d
Day 70 40.1 ± 0.6bc 71.01 ± 0.63b 6.64 ± 0.32efg 0.71 ± 0.12a 2.44 ± 0.23bc 3.53 ± 0.18d 2.58 ± 0.15ab
Slaughter 43.2 ± 0.7d 74.00 ± 0.63de 5.37 ± 0.33bc 1.32 ± 0.13b 2.76 ± 0.24cd 2.11 ± 0.19ab 2.65 ± 0.15abc a,b,c,d,e,f, g Values within a column with different superscripts differ significantly at P <0.05.

P.PIP.0743 - The Impact of handling Condition and New Environments on the Stress of Cattle
Page 28 of 80
4.3.2.2 Other measures of stress and metabolism
The NEFA and beta hydroxybutyrate concentrations varied between groups, time points and sexes
(Table 15, P<0.05). At the time of slaughter there were no differences between groups in the plasma
concentrations of NEFA and beta hydroxybutyrate (Table 16). Groups 1 and 2 had NEFA that was
higher at induction compared to slaughter, with as much as 185% higher plasma concentration of
NEFA in group 2 (0.69 mmol/L). The converse was true for groups 3 and 4 where slaughter NEFA
concentrations were higher than at induction (Table 16). The lowest concentrations of NEFA were
recorded at day 70 for all groups (Table 16), with the plasma concentrations of all groups also the
same at this time. Similar to NEFA, plasma concentrations of beta hydroxybutyrate were higher at
the time of induction for groups 1 and 2 compared to slaughter, however in groups 3 and 4 the
opposite was true. The betahydroxybutyrate concentrations were lowest at day 70 for groups 1 and
2, however in groups 3 and 4 were similar to that measured at induction (Table 16).
The AST concentrations varied between groups, sex and time points (Table 15, P<0.05). On average
the plasma AST was 11.9 IU/L or 9.2% higher at slaughter compared to induction (P<0.05), with no
difference between AST at induction and day 70. There was a difference in AST between groups 1
and 4 at all time points with group 1 on average having AST concentrations 16.9 IU/L lower than
group 4 (Table 16). The concentration of CK also varied between time points and sexes, however the
magnitude of the variation varied between groups (Table 15, P<0.05). The CK at induction was higher
in all groups compared to slaughter with CK as much as 880.8 IU/L higher or 410% higher at the time
of induction (Table 16). The variation in CK between groups was much higher at the time of
induction (371.3 IU/L) compared to at the time of slaughter (139.32 IU/L) (Table 16). There was no
difference between CK at day 70 and slaughter in all groups (Table 16).
In all groups ceruloplasmin was lowest at induction, increased at day 70 and highest at slaughter
(Table 16, P<0.05). From the time of induction to slaughter the increase in ceruloplasmin ranged
from 21 to 39%, which equates to a 19.6 mmol/L to 33.3 mmol/L increase in groups 2 and 4. There
was some variation in the plasma concentration at the time of induction (11.2 IU/L) and at the time
of slaughter (16.3 IU/L) (Table 16, P<0.05). At all time points, on average the ceruloplasmin
concentrations were within normal limits.
Plasma magnesium levels varied between time points and groups (Table 15, P<0.05). In groups 1 and
2 plasma magnesium decreased from the time of induction to slaughter, with the converse true of
groups 3 and 4 (Table 16, P<0.05). The lowest plasma magnesium was recorded at day 70 for all
groups with the lowest magnesium recorded in group 4 (0.7 mM) (Table 16).
The measurement of haptoglobin concentration was not different at any of the time points of any
groups (P>0.05) and remained within normal limits.
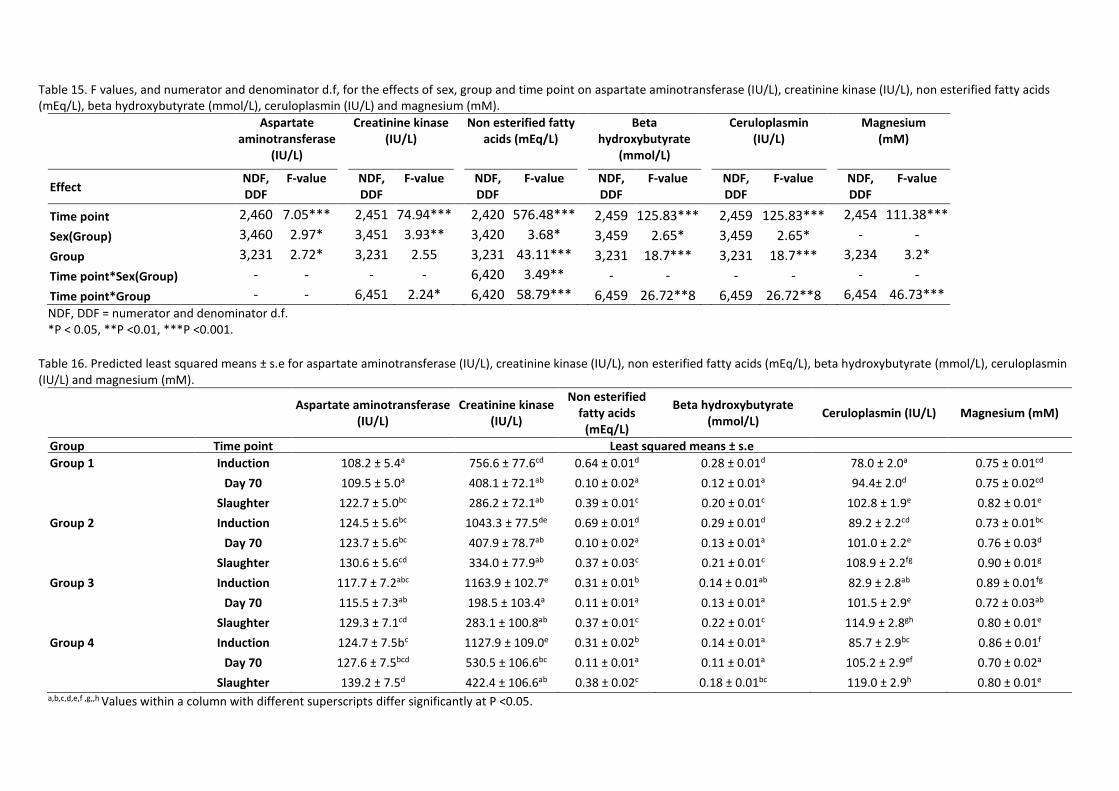
Table 15. F values, and numerator and denominator d.f, for the effects of sex, group and time point on aspartate aminotransferase (IU/L), creatinine kinase (IU/L), non esterified fatty acids (mEq/L), beta hydroxybutyrate (mmol/L), ceruloplasmin (IU/L) and magnesium (mM).
Aspartate aminotransferase
(IU/L)
Creatinine kinase
(IU/L)
Non esterified fatty
acids (mEq/L)
Beta
hydroxybutyrate (mmol/L)
Ceruloplasmin
(IU/L)
Magnesium
(mM)
Effect NDF, DDF
F-value
NDF, DDF
F-value
NDF, DDF
F-value
NDF, DDF
F-value
NDF, DDF
F-value
NDF, DDF
F-value
Time point 2,460 7.05*** 2,451 74.94*** 2,420 576.48*** 2,459 125.83***
2,459 125.83***
2,454 111.38***
Sex(Group) 3,460 2.97* 3,451 3.93** 3,420 3.68* 3,459 2.65*
3,459 2.65*
- -
Group 3,231 2.72* 3,231 2.55 3,231 43.11*** 3,231 18.7***
3,231 18.7***
3,234 3.2*
Time point*Sex(Group) - - - - 6,420 3.49** - -
- -
- -
Time point*Group - - 6,451 2.24* 6,420 58.79*** 6,459 26.72**8
6,459 26.72**8
6,454 46.73***
NDF, DDF = numerator and denominator d.f. *P < 0.05, **P <0.01, ***P <0.001.
Table 16. Predicted least squared means ± s.e for aspartate aminotransferase (IU/L), creatinine kinase (IU/L), non esterified fatty acids (mEq/L), beta hydroxybutyrate (mmol/L), ceruloplasmin (IU/L) and magnesium (mM).
Aspartate aminotransferase (IU/L)
Creatinine kinase (IU/L)
Non esterified fatty acids
(mEq/L)
Beta hydroxybutyrate (mmol/L)
Ceruloplasmin (IU/L) Magnesium (mM)
Group Time point Least squared means ± s.e
Group 1 Induction 108.2 ± 5.4a 756.6 ± 77.6cd 0.64 ± 0.01d 0.28 ± 0.01d 78.0 ± 2.0a 0.75 ± 0.01cd Day 70 109.5 ± 5.0a 408.1 ± 72.1ab 0.10 ± 0.02a 0.12 ± 0.01a 94.4± 2.0d 0.75 ± 0.02cd Slaughter 122.7 ± 5.0bc 286.2 ± 72.1ab 0.39 ± 0.01c 0.20 ± 0.01c 102.8 ± 1.9e 0.82 ± 0.01e
Group 2 Induction 124.5 ± 5.6bc 1043.3 ± 77.5de 0.69 ± 0.01d 0.29 ± 0.01d 89.2 ± 2.2cd 0.73 ± 0.01bc Day 70 123.7 ± 5.6bc 407.9 ± 78.7ab 0.10 ± 0.02a 0.13 ± 0.01a 101.0 ± 2.2e 0.76 ± 0.03d Slaughter 130.6 ± 5.6cd 334.0 ± 77.9ab 0.37 ± 0.03c 0.21 ± 0.01c 108.9 ± 2.2fg 0.90 ± 0.01g
Group 3 Induction 117.7 ± 7.2abc 1163.9 ± 102.7e 0.31 ± 0.01b 0.14 ± 0.01ab 82.9 ± 2.8ab 0.89 ± 0.01fg Day 70 115.5 ± 7.3ab 198.5 ± 103.4a 0.11 ± 0.01a 0.13 ± 0.01a 101.5 ± 2.9e 0.72 ± 0.03ab Slaughter 129.3 ± 7.1cd 283.1 ± 100.8ab 0.37 ± 0.01c 0.22 ± 0.01c 114.9 ± 2.8gh 0.80 ± 0.01e
Group 4 Induction 124.7 ± 7.5bc 1127.9 ± 109.0e 0.31 ± 0.02b 0.14 ± 0.01a 85.7 ± 2.9bc 0.86 ± 0.01f
Day 70 127.6 ± 7.5bcd 530.5 ± 106.6bc 0.11 ± 0.01a 0.11 ± 0.01a 105.2 ± 2.9ef 0.70 ± 0.02a Slaughter 139.2 ± 7.5d 422.4 ± 106.6ab 0.38 ± 0.02c 0.18 ± 0.01bc 119.0 ± 2.9h 0.80 ± 0.01e a,b,c,d,e,f ,g,,h Values within a column with different superscripts differ significantly at P <0.05.
P.PIP.0743 - The Impact of handling Condition and New Environments on the Stress of Cattle
Page 30 of 80
4.3.3 The impact of gender on blood metabolites and stress indicators
Differences between heifers and steers were only able to be determined in groups 2, 3 and 4 where
there were sufficient numbers of each sex, with some differences detected in plasma indicators and
complete blood count results with the magnitude of these results reported below.
The heifers had higher AST (20.6 IU/L) compared to the steers, however this was a small effect and
only observed in group 2. The CK was 306.4 IU/l higher in heifers (P<0.05), however this was only
observed in group 2.
There were some small differences between sexes for NEFA concentrations (Table 15, P<0.05),
however this varied between groups and time points with no consistent effect. At induction, group 2
heifers had 0.13 mEq/l less NEFA than steers and at slaughter group 2 heifers had 0.06 mEq/L less
and group 3 had 0.09 mEq/L more than the steers. For beta hydroxybutyrate the heifers had 0.03
mmol/L less than the steers 9P<0.05), however this was only true for group 2.
Heifers had on average in groups 2 and 3, 10.7 IU/L more ceruloplamin than the steers (P<0.05).
compared to steers at all time points. Other sex differences were small and only observed at certain
time points.
There were some small differences between heifers and steers with respect to PCV and
neutrophil:lymphocyte (Table 14, P<0.05), however this varied between groups and time points and
the magnitude of the effects was small.
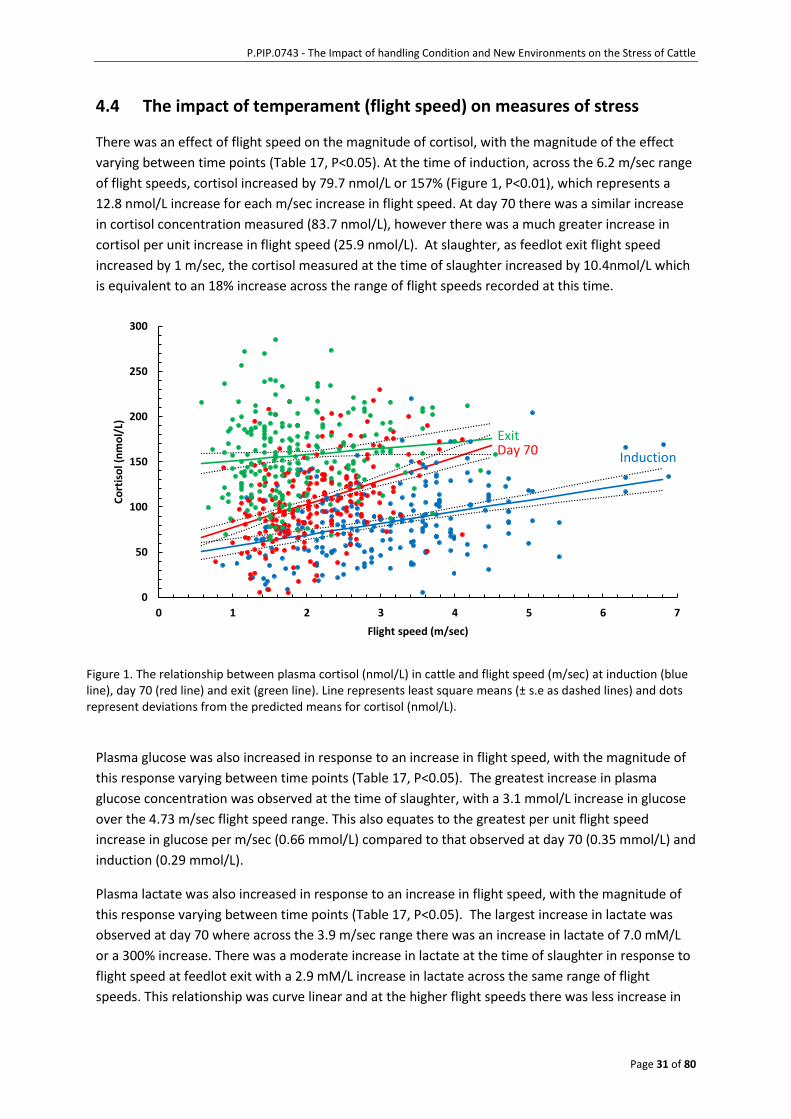
P.PIP.0743 - The Impact of handling Condition and New Environments on the Stress of Cattle
Page 31 of 80
4.4 The impact of temperament (flight speed) on measures of stress
There was an effect of flight speed on the magnitude of cortisol, with the magnitude of the effect
varying between time points (Table 17, P<0.05). At the time of induction, across the 6.2 m/sec range
of flight speeds, cortisol increased by 79.7 nmol/L or 157% (Figure 1, P<0.01), which represents a
12.8 nmol/L increase for each m/sec increase in flight speed. At day 70 there was a similar increase
in cortisol concentration measured (83.7 nmol/L), however there was a much greater increase in
cortisol per unit increase in flight speed (25.9 nmol/L). At slaughter, as feedlot exit flight speed
increased by 1 m/sec, the cortisol measured at the time of slaughter increased by 10.4nmol/L which
is equivalent to an 18% increase across the range of flight speeds recorded at this time.
Figure 1. The relationship between plasma cortisol (nmol/L) in cattle and flight speed (m/sec) at induction (blue line), day 70 (red line) and exit (green line). Line represents least square means (± s.e as dashed lines) and dots represent deviations from the predicted means for cortisol (nmol/L).
Plasma glucose was also increased in response to an increase in flight speed, with the magnitude of
this response varying between time points (Table 17, P<0.05). The greatest increase in plasma
glucose concentration was observed at the time of slaughter, with a 3.1 mmol/L increase in glucose
over the 4.73 m/sec flight speed range. This also equates to the greatest per unit flight speed
increase in glucose per m/sec (0.66 mmol/L) compared to that observed at day 70 (0.35 mmol/L) and
induction (0.29 mmol/L).
Plasma lactate was also increased in response to an increase in flight speed, with the magnitude of
this response varying between time points (Table 17, P<0.05). The largest increase in lactate was
observed at day 70 where across the 3.9 m/sec range there was an increase in lactate of 7.0 mM/L
or a 300% increase. There was a moderate increase in lactate at the time of slaughter in response to
flight speed at feedlot exit with a 2.9 mM/L increase in lactate across the same range of flight
speeds. This relationship was curve linear and at the higher flight speeds there was less increase in
0
50
100
150
200
250
300
0 1 2 3 4 5 6 7
Co
rtis
ol (
nm
ol/
L)
Flight speed (m/sec)
ExitDay 70
Induction
P.PIP.0743 - The Impact of handling Condition and New Environments on the Stress of Cattle
Page 32 of 80
lactate per unit increase in flight speed (see Figure 11 in Appendix 9.1 ). At the time of induction to
the feedlot lactate displayed a linear relationship with flight speed with a 1.0 mM/L increase in
lactate per unit increase in flight speed (m/sec) or 6.4 mM/L increase in lactate across the 6.2 m/sec
range.
An increase in flight speed resulted in an increase in the measured PCV, however this was only in
some groups and time points (Table 18, P<0.05). Group 1 at both induction and day 70
demonstrated a relationship with PCV, where each increase in flight speed by 1 m/sec resulted in an
increase in PCV by 1 unit and 2.2 units respectively.
Flight speed had an impact on AST (Table 18, P<0.001), with this model accounting for 34% of the
total variance of AST. Across the 6.2 m/sec range of flight speeds AST increased by 49.7 IU/L or a
46% increase. A relationship between flight speed and CK was only evident at the time of induction
(Table 18, P<0.05), where across the 6 m/sec range there was an increase in CK of 1256 IU/l (360%
increase). Within different groups the magnitude of the increase in CK also varied (Table 18, P<0.05),
with group 1 showing no impact of an increasing flight speed on CK.
Flight speed increases also resulted in an increase in neutrophil:lymphocyte (Table 18, P<0.05) but
response was only observed in group 1 at the time of slaughter. Across the 1.26 m/sec range of flight
speeds the neutrophil:lymphocyte increased by 1.1 (230%).
Plasma NEFA concentration decreased in response to an increase in flight speed, with the greatest
magnitude of effect observed at the time of slaughter (Table 18, P<0.05), where across the 3.9 m/sec
range of flight speeds there was a decrease in plasma NEFA or a 0.04 mEq/L decrease per unit
increase in flight speed (see Figure 12, Appendix 9.1). There was a small impact of flight speed on
plasma NEFA at induction where there was a 0.01 unit decrease in NEFA per unit increase in flight
speed. Similarly to NEFA, plasma beta hydroxybutyrate decreased in response to increasing flight
speed with the response varying between time points (Table 18, P<0.001). The greatest decrease in
beta hydroxybutyrate was observed at slaughter where for each unit increase in flight speed there
was a decrease in beta hydroxybutyrate of 0.04 mEq/L, compared to a reduction of 0.02 mEq/L and
0.01 mEq/L at day 70 and induction (see Figure 13, Appendix 9.1).
There was a direct impact of flight speed on the plasma concentration of ceruloplasmin (IU/L) (Table
18, P<0.05), where across the 6.2 m/sec range of flight speeds there was an increase in
ceruloplasmin of 12.74 IU/L (13% increase).
When flight speed at induction was examined in relation to the measures of stress at the time of
slaughter, an increasing flight speed recorded at feedlot entry was significantly related to an
increase in cortisol, lactate, glucose, CK, PCV and neutrophil:lymphocyte (P<0.05). The magnitude of
the effect of all these individual relationships is not shown in this report but may be useful to
explore as part of a more detailed analysis in the future. For cortisol at slaughter it is shown that as
flight speed as recorded at induction increases across its 5.9 m/sec range cortisol at slaughter
increased by 48% (Figure 14).

Table 17. F values, and numerator and denominator d.f, for the effects of flight speed on plasma cortisol (nmol/L), glucose (nM/L), and lactate (mM/L).
Cortisol (nmol/L) Glucose (nM/L) Lactate (mM/L)
NDF,DDF F-value NDF,DDF F-value
NDF,
DDF F-value
Time point 2, 447 18.47*** 2, 438 7.46*** 2, 432
0.71
Sex(Group) 3, 447 2.83* - - - -
Group 3, 231 7.00*** 3, 234 7.99*** 3, 234 1.35
Time point*Group 6, 447 2.39* 6, 438 12.13*** 6, 432 2.28*
Flight speed 1, 447 18.73*** 1, 438 41.54*** 1, 432 5.61*
Flight speed*Time Point 2, 447 3.6* 2, 438 3.96* 2, 432 3.41*
Flight speed*Group - - - - 3, 432 2.62*
Flight speed*Flight speed - - - - 1, 432 0.44
Flight speed*Flight speed*Time point - - - - 2, 432 4.75**
NDF, DDF = numerator and denominator d.f. *P < 0.05, **P <0.01, ***P <0.001

Table 18. F values, and numerator and denominator d.f, for the effects of flight speed on aspartate aminotransferase (IU/L), creatinine kinase (IU/L), non esterified fatty acids (mEq/L), beta hydroxybutyrate (mmol/L), ceruloplasmin (IU/L), packed cell volume (%) and neutrophil:lymphocyte
Aspartate aminotransferase
(IU/L)
Creatinine kinase (IU/L)
Non esterified
fatty acids (mEq/L)
Beta
hydroxybutyrate (mmol/L)
Ceruloplasmin
(IU/L)
Packed cell volume (%)
Neutophil:
Lymphocyte
NDF,
DDF F-value
NDF,
DDF
F-
value
NDF,
DDF F-value
NDF,
DDF F-value
NDF,
DDF F-value
NDF,
DDF F-value
NDF,
DDF F-value
Time point 2,446 12.76*** 2,438 0.62 2,404 74.8*** 2,443 17.41*** 2,445 158.34*** 2, 414 44.33*** 2,418 6.37**
Sex(Group) 6,446 2.76*- 1,438 5.45** 3,404 3.65* - - 1, 445 5.85*** 3, 414 2.19 3, 418 3.89**
Group - - 2,231 3.16* 3,231 17.96** 3,234 6.24*** 3,231 5.64*** 3, 231 0.87 3, 231 2.11
Time point*Sex(Group) - - - - 6,404 3.01** - - - - 6, 414 1.71 6, 418 5.33***
Time point*Group - - - - 6,404 43.56** 6,443 19.76** 6, 445 3.33** 6, 414 1.44 6, 418 2.36*
Flight speed 1,446 11.85*** 1,438 7.98** 1,404 6.35* 1,443 24.98*** 1, 445 4.53* 1, 414 15.38** 1, 418 4.07*
Flight speed*Time Point - - 2,438 3.57* 2,404 3.05* 2,443 3.04* - - 2, 414 8.14** 2, 418 2.25
Flight speed*Group - - 3,438 3.78* - - - - - - 3, 414 0.83 3, 418 1.29
Flight speed*Group*Time point - - - - - - - - - - 6, 414 2.24* 6, 418 2.35*
NDF, DDF = numerator and denominator d.f. *P < 0.05, **P <0.01, ***P <0.001
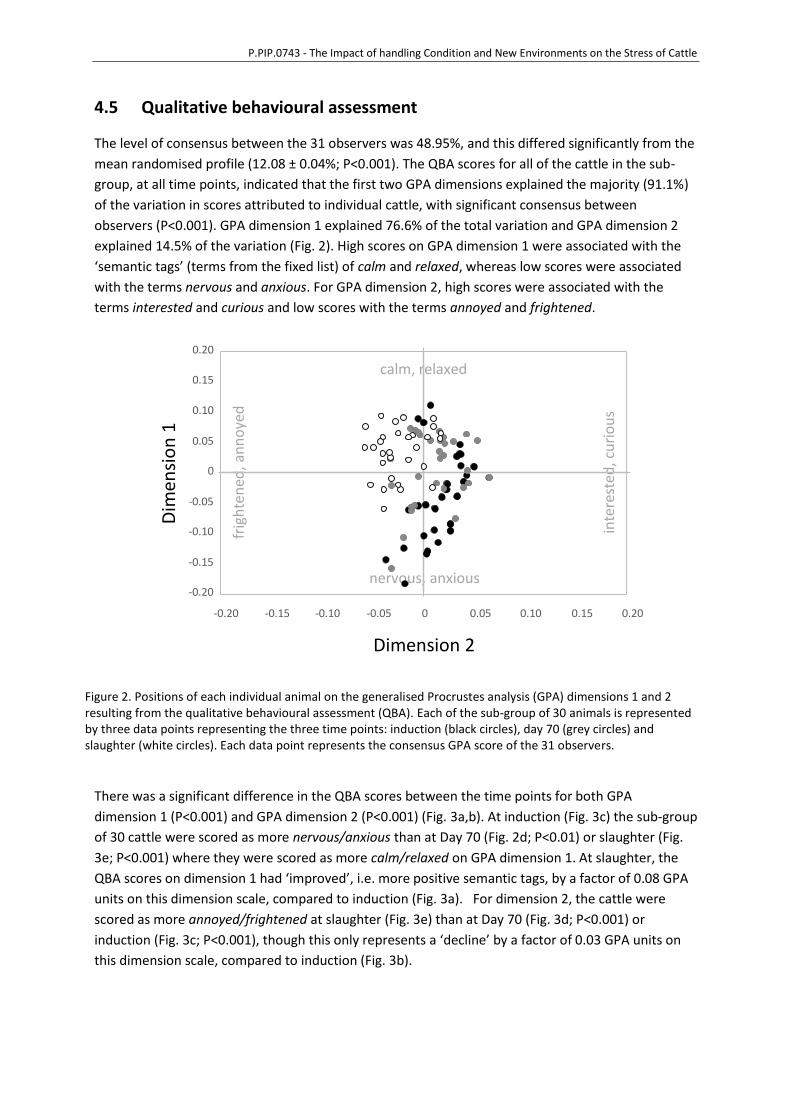
P.PIP.0743 - The Impact of handling Condition and New Environments on the Stress of Cattle
4.5 Qualitative behavioural assessment
The level of consensus between the 31 observers was 48.95%, and this differed significantly from the
mean randomised profile (12.08 ± 0.04%; P<0.001). The QBA scores for all of the cattle in the sub-
group, at all time points, indicated that the first two GPA dimensions explained the majority (91.1%)
of the variation in scores attributed to individual cattle, with significant consensus between
observers (P<0.001). GPA dimension 1 explained 76.6% of the total variation and GPA dimension 2
explained 14.5% of the variation (Fig. 2). High scores on GPA dimension 1 were associated with the
‘semantic tags’ (terms from the fixed list) of calm and relaxed, whereas low scores were associated
with the terms nervous and anxious. For GPA dimension 2, high scores were associated with the
terms interested and curious and low scores with the terms annoyed and frightened.
Figure 2. Positions of each individual animal on the generalised Procrustes analysis (GPA) dimensions 1 and 2 resulting from the qualitative behavioural assessment (QBA). Each of the sub-group of 30 animals is represented by three data points representing the three time points: induction (black circles), day 70 (grey circles) and slaughter (white circles). Each data point represents the consensus GPA score of the 31 observers.
There was a significant difference in the QBA scores between the time points for both GPA
dimension 1 (P<0.001) and GPA dimension 2 (P<0.001) (Fig. 3a,b). At induction (Fig. 3c) the sub-group
of 30 cattle were scored as more nervous/anxious than at Day 70 (Fig. 2d; P<0.01) or slaughter (Fig.
3e; P<0.001) where they were scored as more calm/relaxed on GPA dimension 1. At slaughter, the
QBA scores on dimension 1 had ‘improved’, i.e. more positive semantic tags, by a factor of 0.08 GPA
units on this dimension scale, compared to induction (Fig. 3a). For dimension 2, the cattle were
scored as more annoyed/frightened at slaughter (Fig. 3e) than at Day 70 (Fig. 3d; P<0.001) or
induction (Fig. 3c; P<0.001), though this only represents a ‘decline’ by a factor of 0.03 GPA units on
this dimension scale, compared to induction (Fig. 3b).
-0.20
-0.15
-0.10
-0.05
0
0.05
0.10
0.15
0.20
calm, relaxed
frig
hte
ned
, an
no
yed
inte
rest
ed, c
uri
ou
s
nervous, anxious
-0.20 -0.15 -0.10 -0.05 0 0.05 0.10 0.15 0.20
Dimension 2
Dim
ensi
on
1

P.PIP.0743 - The Impact of handling Condition and New Environments on the Stress of Cattle
Figure 3. Means (±SEM) of observer generalised Procrustes analysis (GPA) scores on (a) dimension 1, and (b) dimension 2, resulting from qualitative behavioural assessment (QBA) of cattle at three time points: Induction, Day70 and Slaughter. Within each dimension, exclusively different superscript letters indicate time points that were significantly different (P < 0.05). The positions of each of the sub-group of 30 individual animals on the generalised Procrustes analysis (GPA) dimensions 1 and 2 resulting from qualitative behavioural assessment (QBA) at (c) induction, (d) day 70 and (e) slaughter.
Similar to the values obtained for the temperament and stress indicators in all 240 cattle, these
indicators for the 30 animals selected for the sub-group showed similar changes related to the time
points selected for QBA: induction, day 70 and slaughter (Table 19). Both flight speed and crush score
decreased from induction to slaughter (P<0.001). Eye temperature was also influenced by the time
point (P<0.05) with eye temperature lowest at induction. For the blood indicators, cortisol (P<0.001),
glucose (P<0.001), lactate (P<0.001), and magnesium (P<0.01) increased from induction to slaughter
(P<0.001); while NEFA (P<0.001), neutrophil/lymphocyte ratio (P<0.001), haemoglobin (P<0.001),
PCV (P<0.001), WBC, P<0.001), fibrinogen (P<0.001), and total protein (P<0.001) decreased from
induction to slaughter.
A number of the measures of temperament, stress and meat quality were significantly correlated
with the GPA dimension scores (Table 19). Cattle described by the observers as being more
calm/relaxed on GPA dimension 1 from induction to slaughter (as opposed to more nervous/anxious)
-0.20
-0.15
-0.10
-0.05
0
0.05
0.10
0.15
0.20
-0.20 -0.15 -0.10 -0.05 0 0.05 0.10 0.15 0.20
-0.20
-0.15
-0.10
-0.05
0
0.05
0.10
0.15
0.20
-0.20
-0.15
-0.10
-0.05
0
0.05
0.10
0.15
0.20
Dimension 2
Dim
ensi
on
1Slaughter
Day 70
Induction
calm, relaxed
frig
hte
ned
, an
no
yed
inte
rest
ed, c
uri
ou
s
nervous, anxious
(c)
(d)
(e)
-0.06
-0.04
-0.02
0
0.02
0.04
0.06
Induction Day 70 Slaughter
Dim
ensi
on
1
-0.06
-0.04
-0.02
0
0.02
0.04
0.06
Induction Day 70 Slaughter
Dim
ensi
on
2
Time Point
a
bc
c
(a)
(b)
a a
b
calm, relaxed
frig
hte
ned
, an
no
yed
inte
rest
ed, c
uri
ou
s
nervous, anxious
calm, relaxed
frig
hte
ned
, an
no
yed
inte
rest
ed, c
uri
ou
s
nervous, anxious
P.PIP.0743 - The Impact of handling Condition and New Environments on the Stress of Cattle
had slower flight speeds (Rs = -0.50; P < 0.001), lower crush scores (Rs = -0.46; P < 0.001), lower
plasma concentrations of lactate (Rs = -0.21; P < 0.05), total proteins (Rs = -0.28; P < 0.01), creatinine
kinase (Rs = -0.26; P < 0.05), haemoglobin (Rs = -0.40; P < 0.001), PCV (Rs = -0.36; P < 0.01), and WBC
(Rs = -0.26; P < 0.05), and higher plasma concentrations of ceruloplasmin (Rs = 0.22; P < 0.05). Cattle
described by the observers as being more calm/relaxed on GPA dimension 1 at slaughter also had
lower carcase pHu (Rs = -0.35; P < 0.05).
Cattle described by the observers as being more interested/curious on GPA dimension 2 from
induction to slaughter (as opposed to more annoyed/frightened) had lower plasma concentrations of
cortisol (Rs = -0.49; P < 0.001), glucose (Rs = -0.44; P < 0.001), lactate (Rs = -0.48; P < 0.001),
ceruloplasmin (Rs = -0.36; P < 0.001), haptoglobin (Rs = -0.39; P < 0.001), and higher WBC (Rs = 0.51; P
< 0.001).

P.PIP.0743 - The Impact of handling Condition and New Environments on the Stress of Cattle
Table 19. The effect of time point on the temperament and stress parameters for the sub-group of 30 cattle at induction vs. day 70 vs. slaughter, the growth and meat quality indicators at slaughter, and correlations with the qualitative behavioural assessment (QBA) scores (GPA dimensions 1 & 2)
Parameters Time points Overall Spearman rank
order correlation (Rs)
Induction Day 70 Slaughter GPA
dimension 1
GPA
dimension 2
Flight speed (m/s) 1.4±0.3a 0.9±0.2b 1.0±0.2b -0.50*** 0.01
Crush score 2.7±0.2a 2.3±0.2a 1.4±0.1b -0.46*** 0.11
Eye temperature (°C) 33.0±0.4a 34.3±0.3b 33.5±0.3ab 0.14 -0.18
Cortisol (nM) 72.8±10.9a 109.6±13.4b 168.1±8.5c 0.00 -0.49***
Glucose (mM) 6.06±0.22a 5.30±0.19a 7.70±0.42b -0.12 -0.44***
Lactate (mM) 5.98±0.77a 4.01±0.62b 9.07±0.49c -0.21* -0.48***
NEFA (mEq/L) 0.56±0.06a 0.10±0.01b 0.41±0.02c -0.10 -0.13
BHB (mM) 0.229±0.017a 0.135±0.014b 0.224±0.018ac 0.17 0.06
Total protein (g/L) 76.7±0.6a 69.4±0.6b 73.4±0.8c -0.28** -0.11
AST(IU/L) 121.3±8.4a 113.0±5.6a 123.1±6.7a -0.14 0.03
CK (IU/L) 1042±406a 438±127a 284±23b -0.26* 0.09
Mg (mM) 0.816±0.022a 0.763±0.014ab 0.848±0.020c 0.04 -0.12
Ceruloplasmin (mg/L) 86.2±2.7a 99.1±2.4b 110.2±3.2c 0.22* -0.36***
N:L (Ratio) 1.80±0.25a 0.72±0.05a 1.39±0.12a -0.06 -0.01
FIB (g/L) 3.57±0.15a 2.60±0.15b 2.54±0.19bc -0.18 0.14
HB (g/L) 157±1.9a 140±2.2b 146±2.1c -0.40*** -0.08
Hp (mg/ml) 0.143±0.019a 0.116±0.023a 0.177±0.029a -0.12 -0.39***
PCV (%/10) 0.471±0.007a 0.394±0.006b 0.425±0.007c -0.36** -0.01
WBC (x103/µL) 9.4±0.6a 6.1±0.3b 4.5±0.2c -0.26* 0.51***
ADG (CV=17%) (kg/day) - - 1.89±0.32 0.08 0.10
IMF (CV=30%) (%) - - 3.99±1.12 -0.21 -0.14
SF (CV=15%) (N) - - 3.85±0.58 -0.09 -0.24
Glyc. (CV=12%) (g/100g) - - 1.26±0.14 -0.03 -0.22
pHu (CV=1%) - - 5.54±0.05 -0.35* -0.03
Values are means ± SEM (except for values in grey shaded region that are means ±SD). Exclusively different postscripts between time points indicate significance at P<0.05. Asterisks indicate significant correlations: * = P,0.05, ** = P<0.01, ** P<0.001. NEFA = non esterified fatty acids, BHB = beta-hydroxy butyrate, CK = creatinine kinase, Mg = magnesium, N:L = neutrophil-lymphocyte ratio, FIB = fibrinogen, HB = haemoglobin, Hp = haptoglobin, PCV = packed cell volume, WBC = white blood cell count, ADG = total average daily gain, IMF = intramuscular fat, SF = shear force, Glyc. = glycogen, pHu = ultimate pH.
In terms of the correlation of the temperament and stress indicators at specific different time points
(Table 20), cattle described by the observers as being more calm/relaxed on GPA dimension 1 had
slower flight speeds at induction (Rs = -0.48; P < 0.01) and day 70 (Rs = -0.52; P < 0.01), lower crush
scores at induction (Rs = -0.61; P < 0.01), lower plasma concentrations of cortisol at induction (Rs = -
0.64; P < 0.001), glucose at induction (Rs = -0.61; P < 0.01) and day 70 (Rs = -0.38; P < 0.05), lactate at
induction (Rs = -0.79; P < 0.001) and day 70 (Rs = -0.44; P < 0.05), AST at induction (Rs = -0.42; P < 0.05),
creatinine kinase at induction (Rs = -0.49; P < 0.01), and haemoglobin at day 70 (Rs = -0.36; P < 0.05).
Cattle described by the observers as being more interested/curious on GPA dimension 2 (as opposed
to more nervous/anxious) had lower eye temperatures at induction (Rs = -0.41; P < 0.05) and
slaughter (Rs = -0.47; P < 0.05), lower plasma concentrations of cortisol at induction (Rs = -0.52; P <
0.01), glucose at induction (Rs = -0.40; P < 0.05), lactate at induction (Rs = -0.54; P < 0.01), NEFA at day
70 (Rs = -0.46; P < 0.05), beta-hydroxybutyrate at day 70 (Rs = -0.35; P < 0.05), total protein at day 70
(Rs = -0.65; P < 0.001), ceruloplasmin at day 70 (Rs = -0.38; P < 0.05), and haptoglobin at day 70 (Rs = -
0.58; P < 0.01).
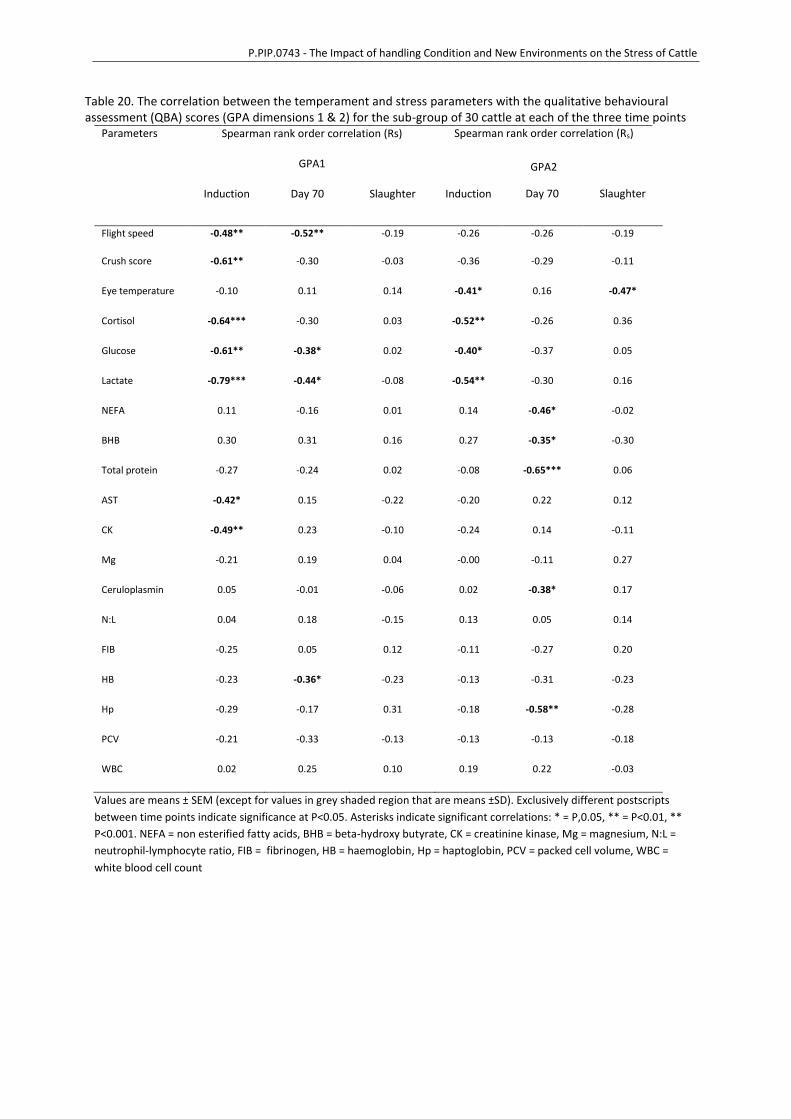
P.PIP.0743 - The Impact of handling Condition and New Environments on the Stress of Cattle
Table 20. The correlation between the temperament and stress parameters with the qualitative behavioural assessment (QBA) scores (GPA dimensions 1 & 2) for the sub-group of 30 cattle at each of the three time points
Parameters Spearman rank order correlation (Rs)
GPA1
Spearman rank order correlation (Rs)
GPA2
Induction Day 70 Slaughter Induction Day 70 Slaughter
Flight speed -0.48** -0.52** -0.19 -0.26 -0.26 -0.19
Crush score
-0.61** -0.30 -0.03 -0.36 -0.29 -0.11
Eye temperature
-0.10 0.11 0.14 -0.41* 0.16 -0.47*
Cortisol
-0.64*** -0.30 0.03 -0.52** -0.26 0.36
Glucose
-0.61** -0.38* 0.02 -0.40* -0.37 0.05
Lactate
-0.79*** -0.44* -0.08 -0.54** -0.30 0.16
NEFA
0.11 -0.16 0.01 0.14 -0.46* -0.02
BHB
0.30 0.31 0.16 0.27 -0.35* -0.30
Total protein
-0.27 -0.24 0.02 -0.08 -0.65*** 0.06
AST
-0.42* 0.15 -0.22 -0.20 0.22 0.12
CK
-0.49** 0.23 -0.10 -0.24 0.14 -0.11
Mg
-0.21 0.19 0.04 -0.00 -0.11 0.27
Ceruloplasmin
0.05 -0.01 -0.06 0.02 -0.38* 0.17
N:L
0.04 0.18 -0.15 0.13 0.05 0.14
FIB
-0.25 0.05 0.12 -0.11 -0.27 0.20
HB
-0.23 -0.36* -0.23 -0.13 -0.31 -0.23
Hp
-0.29 -0.17 0.31 -0.18 -0.58** -0.28
PCV
-0.21 -0.33 -0.13 -0.13 -0.13 -0.18
WBC
0.02 0.25 0.10 0.19 0.22 -0.03
Values are means ± SEM (except for values in grey shaded region that are means ±SD). Exclusively different postscripts
between time points indicate significance at P<0.05. Asterisks indicate significant correlations: * = P,0.05, ** = P<0.01, **
P<0.001. NEFA = non esterified fatty acids, BHB = beta-hydroxy butyrate, CK = creatinine kinase, Mg = magnesium, N:L =
neutrophil-lymphocyte ratio, FIB = fibrinogen, HB = haemoglobin, Hp = haptoglobin, PCV = packed cell volume, WBC =
white blood cell count

P.PIP.0743 - The Impact of handling Condition and New Environments on the Stress of Cattle
4.6 The association of production traits and carcase characteristics using temperament, blood results and eye temperature
Between groups there was small variation between groups for predicted production traits (average
daily gain and hot carcase weight (kg) and carcase characteristics (glycogen (g/100g), shear force (N),
cook loss %, pH at 24 hours, intramuscular fat (IMF%), P8 fat depth and MSA index (Table 21 P<0.05).
The lowest muscle glycogen was in groups 3 (1.2 g/100g) which was 0.13 g/100g lower than the
group with the highest glycogen (Table 21). The lowest IMF5 was seen in group 1 (3.5%), which also
had the lowest P8 fat depth (11.3 mm) (Table 21). Similarly the highest IMF% and P8 fat depth were
in the same group (Group 3, Table 21). There was no difference between groups in shear force (N).
The data collected at all time points (induction, day 70 and slaughter) for temperament (flight speed
and crush score), mean eye temperature and the blood parameters were analysed to determine if
relationships existed between these measures and production factors (average daily gain (kg)) and
carcase traits (hot carcase weight (kg), ultimate pH, glycogen, shear force, cook loss %, MSA Index)
with results of these models shown in Table 22.

Table 21. Predicted LS means ± SE in groups 1 to 4 for glycogen (g/100g), shear force (N), cook loss%, pH at 24 hours, hot carcase weight (kg), average daily gain (kg), P8 fat depth (mm) and MSA Index.
Glycogen (g/100g)
Shear force (N)
Cook loss % Longissimus pH
(24 hour) Intramuscular
fat % Hot carcase weight (kg)
Average daily gain (kg)
P8 fat depth (mm)
MSA Index
Least squared means ± s.e
Group 1 1.26 ± 0.02bc 3.81 ± 0.07a 25.77 ± 0.2b 5.54 ± 0.01ab 3.49 ± 0.1a 354.87 ± 2.6bc 2.20 ± 0.03c 11.27 ± 0.5a 61.57 ± 0.2b
Group 2 1.31 ± 0.02c 4.02 ± 0.08a 24.76 ± 0.2a 5.54 ± 0.01a 3.52 ± 0.1ab 358.36 ± 2.6c 2.17 ± 0.03bc 14.14 ± 0.5ab 60.92 ± 0.2a
Group 3 1.17 ± 0.03a 4.01 ± 0.10a 25.18 ± 0.3ab 5.56 ± 0.01bc 4.17 ± 0.2b 326.75 ± 3.4ab 1.68 ± 0.04a 17.16 ± 0.7c 61.44 ± 0.2ab
Group 4 1.18 ± 0.03ab 4.01 ± 0.11a 25.86 ± 0.3b 5.57 ± 0.01c 3.68 ± 0.2ab 325.31 ± 3.7a 1.72 ± 0.04ab 15.68 ± 0.8bc 61.52 ± 0.3ab a,b,c Values within a column with different superscripts differ significantly at P <0.05.

Table 22. F values, and numerator and denominator d.f, for the effects of measured blood parameters on glycogen, shear force (N), cook loss (%), ultimate pH, hot carcase weight (kg), average daily gain (kg) and Meat Standards Australia Index
Glycogen
Shear force (N)
Cook loss%
Hot carcase weight (kg)
Average daily gain (kg)
MSA Index
Time point/parameter
NDF, DDF
F value
NDF, DDF
F value
NDF, DDF
F value
NDF, DDF F value
NDF, DDF F value
NDF, DDF
F value
Induction:
Flight speed (m/sec) - -
1,233 4.30*
- -
- -
1,232 23.13***
- -
Crush score (1-5) - -
- -
- -
1,239 6.78**
1,233 6.30**
- -
Cortisol (nmol/L) - -
- -
- -
- -
1,240 4.25*
- -
Lactate (mM/L) - -
- -
- -
- -
1,230 7.58**
- -
Beta hydroxybutyrate (mmol/L) - -
- -
1,228 6.16*
1,236 9.72**
1,236 4.48*
- -
Aspartate aminotransferase (IU/L) - -
- -
- -
- -
1,230 6.28*
- -
Creatinine kinase (IU/L) - -
- -
- -
- -
1,230 7.53**
1,229 3.99*
Magnesium (mM) - -
- -
- -
1,230 9.13**
1,230 3.98*
- -
Packed cell volume (%) - -
- -
- -
1,230 6.07*
1,225 10.61***
1,229 12.27**
Total protein (g/L) - -
- -
- -
- -
- -
- -
Total white cell count (x103/L) - -
- -
- -
1,231 12.87**
- -
- -
Neutrophil:Lymphocyte - -
- -
1,224 5.6*
1,231 10.06**
- -
1,230 5.56*
Mean eye temperature (°C) 1,215 6.7*
- -
- -
- -
- -
- -
Day 70:
Flight speed (m/sec) - -
- -
- -
- -
1,229 14.8**
- -
Crush score (1-5) - -
- -
- -
- -
1,232 8.37**
- -
Crush order - -
- -
1,224 13.46**
- -
- -
- -
Cortisol (nmol/L) - -
- -
- -
- -
1,232 6.6*
1,231 4.14*
Glucose (nM/L) - -
- -
- -
- -
1,232 8.03**
- -
Lactate (mM/L) - -
1,227 5.18*
- -
- -
1,232 3.89*
- -
Beta hydroxybutyrate (mmol/L) - -
- -
- -
- -
1,230 4.22*
- -
Aspartate aminotransferase (IU/L) - -
1,227 3.97*
- -
- -
1,231 8.44**
Haptoglobin (IU/L) - -
- -
- -
- -
1,230 4.63*
- -
Ceruloplasmin (IU/L) - -
- -
- -
- -
1,230 4.6*
- -
Packed cell volume (%) - -
- -
- -
- -
1,228 12.98**
- -
Total protein (g/L) - -
- -
- -
- -
- -
1,231 5.54*

Glycogen
Shear force (N)
Cook loss%
Hot carcase weight (kg)
Average daily gain (kg)
MSA Index
Time point/parameter
NDF, DDF
F value
NDF, DDF
F value
NDF, DDF
F value
NDF, DDF F value
NDF, DDF F value
NDF, DDF
F value
Magnesium (nM) - -
- -
- -
- -
- -
1,231 7.03**
Mean eye temperature (°C) - -
- -
1,217 15.13***
- -
- -
- -
Slaughter:
Flight speed (m/sec) - -
- -
- -
1,232 4.02*
- -
- -
Crush order - -
- -
- -
1,233 5.49*
1,232 7.97**
- -
Cortisol (nmol/L) - -
- -
- -
1,239 4.17*
1,233 9.69**
- -
Glucose (nM/L) - -
1,234 6.26*
- -
1,239 6.15*
- -
Aspartate aminotransferase (IU/L) - -
1,234 4.15*
- -
- -
- -
Magnesium - -
- -
- -
1,239 4.88*
- -
1,238 7.88**
Haptoglobin (IU/L) - -
- -
- -
- -
- -
- -
Non esterified fatty acids (mEq/L) 1,232 4.88*
- -
- -
- -
- -
- -
Packed cell volume (%) 1,227 6.22*
- -
- -
- -
- -
- -
Total white cell count (x103/L) - -
- -
1,230 10.47***
- -
- -
1,237 7.76**
Fibrinogen (g/L) 1,228 6.14*
- -
- -
- -
- -
- -
Neutrophil:Lymphocyte - -
- -
- -
- -
1,238 10.43**
- -
Mean eye temperature (°C) 1,224 3.01
- -
- -
- -
- -
- -
NDF, DDF = numerator and denominator d.f. *P < 0.05, **P <0.01, ***P <0.001

4.6.1 Post slaughter muscle glycogen
There were very few parameters of those measured that predicted eating quality however glycogen
in the M. longissimus et thoracis at slaughter was associated with mean eye temperature at
induction and the slaughter measures of NEFA, PCV, fibrinogen and mean eye temperature (Table
22). Looking at the population variation in glycogen (Figure 1a), only 11 animals (4.6%) had pre-
slaughter levels lower than the recommended critical value of 1 g/100 g, and no carcases in the
study had an ultimate pH greater the MSA recommended 5.7 (Figure 1b).
Figure 4. The population frequency distribution for (a) muscle glycogen content, and (b) ultimate carcase pH. The dashed lines represent the recommended minimum glycogen and maximum pH thresholds, respectively. An increase in mean eye temperature measured at the time of induction to the feedlot (Table 22, P<0.05) and in the immediate pre slaughter period (Table 22, P=0.08) resulted in a decrease in predicted post slaughter muscle glycogen of the M. longissimus lumborum et thoracis. For mean eye temperature at induction, across the 7.6 °C increasing range of eye temperature, muscle glycogen decreased by 0.16 g/100g or by 11.9% (Figure 5). In comparison, the mean eye temperature measured pre-slaughter predicted a muscle glycogen decreased by 0.11 g/100g or 8% across the 9.4 °C eye temperature range (Figure 6). The proportion of the variance in glycogen that mean eye temperature was small, with mean eye temperature at induction and mean eye temperature pre-slaughter describing 6 and 11% of the total variance of post slaughter muscle glycogen. An increased concentration of plasma NEFA at slaughter was associated with a decrease in post slaughter muscle glycogen concentration (Table 22, P<0.05). Post slaughter muscle glycogen decreased by 0.15 mEq/100g across the 0.7 mEq/L range of NEFA measured at slaughter (Figure 7), which represents an 11.8 % reduction in muscle glycogen. The fibrinogen measured at slaughter resulted in a decrease in post slaughter muscle glycogen (Table 22, P<0.05). As fibrinogen increased across the 4.6 (g/L) range of fibrinogen glycogen decreased by 0.2 g/100g or 11.8%. Packed cell volume (%) at the time of slaughter has a small but significant impact on post slaughter muscle glycogen (g/100g) (Table 22 , P<0.05). Over the entire 20 unit range of PCV’s recorded at the
0
10
20
30
40
50
60
70
80
90
Freq
uen
cy
Ultimate pH
(b)
0
5
10
15
20
25
30
35
Freq
uen
cy
Muscle glycogen (g/100 g)
(a)
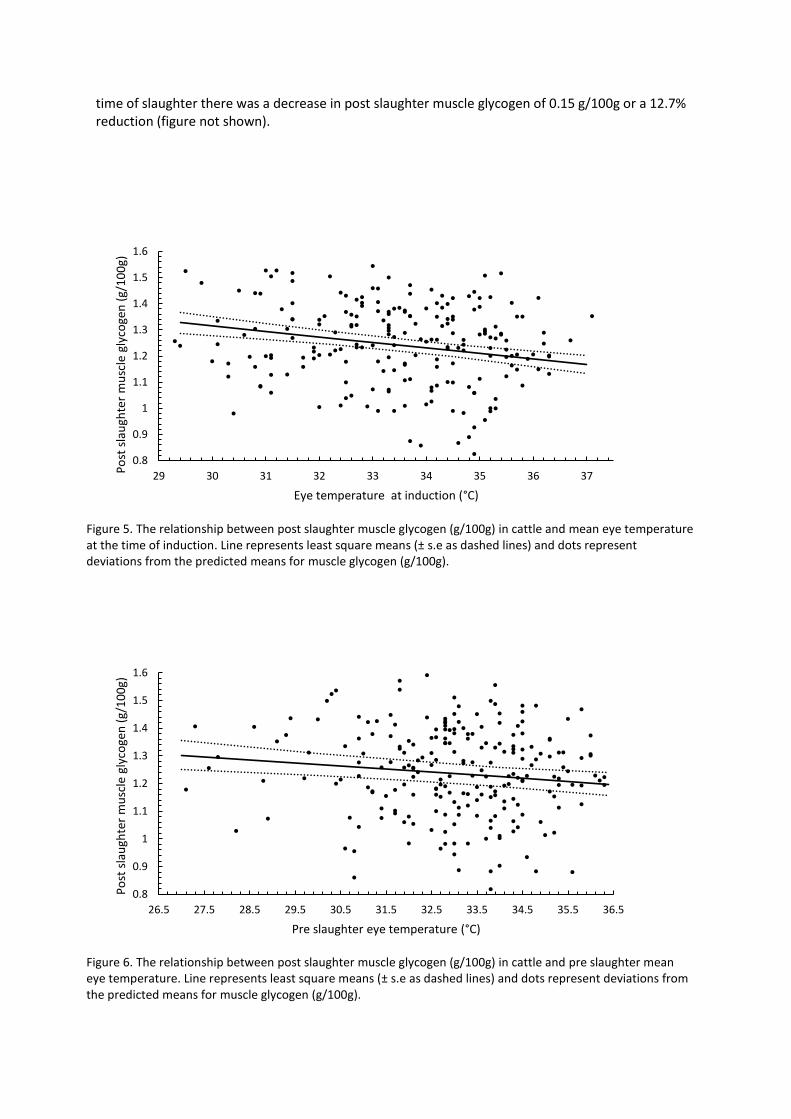
time of slaughter there was a decrease in post slaughter muscle glycogen of 0.15 g/100g or a 12.7% reduction (figure not shown).
Figure 5. The relationship between post slaughter muscle glycogen (g/100g) in cattle and mean eye temperature at the time of induction. Line represents least square means (± s.e as dashed lines) and dots represent deviations from the predicted means for muscle glycogen (g/100g).
Figure 6. The relationship between post slaughter muscle glycogen (g/100g) in cattle and pre slaughter mean eye temperature. Line represents least square means (± s.e as dashed lines) and dots represent deviations from the predicted means for muscle glycogen (g/100g).
0.8
0.9
1
1.1
1.2
1.3
1.4
1.5
1.6
29 30 31 32 33 34 35 36 37
Po
st s
lau
ghte
r m
usc
le g
lyco
gen
(g/
10
0g)
Eye temperature at induction (°C)
0.8
0.9
1
1.1
1.2
1.3
1.4
1.5
1.6
26.5 27.5 28.5 29.5 30.5 31.5 32.5 33.5 34.5 35.5 36.5
Po
st s
lau
ghte
r m
usc
le g
lyco
gen
(g/
10
0g)
Pre slaughter eye temperature (°C)

Figure 7. The relationship between post slaughter muscle glycogen (g/100g) in cattle and non-esterified fatty acids (mEq/L) measured pre-slaughter. Line represents least square means (± s.e as dashed lines) and dots represent deviations from the predicted means for muscle glycogen (g/100g).
Figure 8. The relationship between post slaughter muscle glycogen (g/100g) in cattle and fibrinogen (mEq/L) measured pre-slughter. Line represents least square means (± s.e as dashed lines) and dots represent deviations from the predicted means for muscle glycogen (g/100g).
0
0.5
1
1.5
2
2.5
0.15 0.25 0.35 0.45 0.55 0.65 0.75
Po
st s
lau
ghte
r m
usc
le g
lyco
gen
(g/
10
0g)
Non-esterified fatty acids (mEq/L)
0.6
0.8
1
1.2
1.4
1.6
0 1 2 3 4 5
Po
st s
lau
ghte
r m
usc
le g
lyco
gen
(g/
10
0g)
Fibrinogen (g/L) at slaughter

For each of the measures (blood, temperament and eye temperature) identified as having a
significant relationship with glycogen, where included in general linear models. Eye temperature at
the time of induction was no longer significant (P=0.07), with this model giving poor precision of
prediction of glycogen (R2 = 0.08, RMSE 0.17). When all blood sample and eye temperature results
from the pre-slaughter period were included as covariates in a general linear model at one time
there was relatively poor precision of prediction of glycogen (R2 = 0.17, RMSE 0.17).
4.6.2 Temperament (flight speed and crush score)
Of the temperament measures, flight speed showed better association with the eating quality
indicators and carcase traits compared to crush score. Increasing flight speed measured at induction
to the feedlot was associated with shear force (N) (Table 22, P=0.05), however this relationship
described less than 1.2 % of the total variance of shear force. Across the 5.7 m/sec flight speed
range there was an increase in shear force of the M. longissimus lumborum et thoracis of 0.4 N or
an 11.7 % increase (Figure 9). When all measures at induction were included in a general linear
model the precision of prediction of shear force was poor (R2 = 0.10, RMSE 0.66).
Figure 9. The relationship between shear force (N) of the M. longissimus et lumborum in cattle and flight speed at induction (m/sec). Line represents least square means (± s.e as dashed lines) and dots represent deviations from the predicted means for shear force (N).
0
1
2
3
4
5
6
7
0 1 2 3 4 5 6
Shea
r Fo
rce
(N)
Flight speed (m/sec)
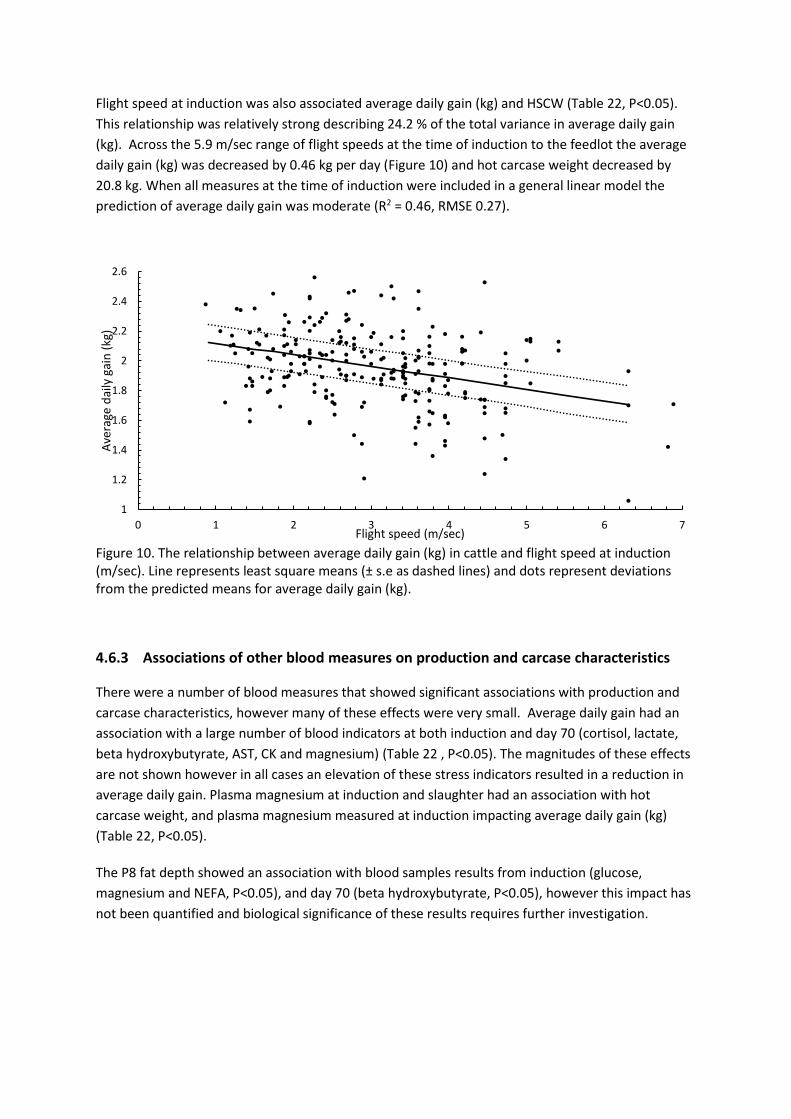
Flight speed at induction was also associated average daily gain (kg) and HSCW (Table 22, P<0.05).
This relationship was relatively strong describing 24.2 % of the total variance in average daily gain
(kg). Across the 5.9 m/sec range of flight speeds at the time of induction to the feedlot the average
daily gain (kg) was decreased by 0.46 kg per day (Figure 10) and hot carcase weight decreased by
20.8 kg. When all measures at the time of induction were included in a general linear model the
prediction of average daily gain was moderate (R2 = 0.46, RMSE 0.27).
Figure 10. The relationship between average daily gain (kg) in cattle and flight speed at induction (m/sec). Line represents least square means (± s.e as dashed lines) and dots represent deviations from the predicted means for average daily gain (kg).
4.6.3 Associations of other blood measures on production and carcase characteristics
There were a number of blood measures that showed significant associations with production and
carcase characteristics, however many of these effects were very small. Average daily gain had an
association with a large number of blood indicators at both induction and day 70 (cortisol, lactate,
beta hydroxybutyrate, AST, CK and magnesium) (Table 22 , P<0.05). The magnitudes of these effects
are not shown however in all cases an elevation of these stress indicators resulted in a reduction in
average daily gain. Plasma magnesium at induction and slaughter had an association with hot
carcase weight, and plasma magnesium measured at induction impacting average daily gain (kg)
(Table 22, P<0.05).
The P8 fat depth showed an association with blood samples results from induction (glucose,
magnesium and NEFA, P<0.05), and day 70 (beta hydroxybutyrate, P<0.05), however this impact has
not been quantified and biological significance of these results requires further investigation.
1
1.2
1.4
1.6
1.8
2
2.2
2.4
2.6
0 1 2 3 4 5 6 7
Ave
rage
dai
ly g
ain
(kg
)
Flight speed (m/sec)
5 Discussion
A key aim of this experiment was to compare putative markers of stress in the same cattle under
similar handling and environmental conditions and determine if there was a difference in any of
these stress markers at the time of slaughter compared to induction. Our hypothesis was that there
would be no difference in measures of stress between induction to the feedlot and slaughter as the
cattle were undergoing similar procedures at these times including fasting, transportation and
mixing of cattle. Given our primary hypothesis was that there would be no difference in measures of
stress at induction to the feedlot and slaughter, our secondary hypothesis was that the greatest
impact on measures of stress at each time point would be individual animal temperament as
measured by flight speed.
There are many studies that examine the impact on cattle of different environments such as
restraint, transportation and lairage however there is limited information that directly compare the
stress experienced following transportation of extensively reared cattle to a feedlot and these same
cattle in the pre-slaughter time period. This experiment has utilised cattle from the same
backgrounding property that underwent transportation to one feedlot, which were processed at the
same processing plant on different days. This allows some meaningful discussion of the relative
stress and the types of stress (e.g nutritional, physical injury, dehydration etc) at these time points.
Furthermore, the stress response of the cattle can be investigated can be benchmarked against
other studies of stress in cattle in order to determine whether the handling and management of the
cattle in the experiment is considered to be of ‘low stress’.
The measures of stress used to evaluate cattle in this experiment consisted of blood samples
collected at induction to the feed lot, at day 70 and also at slaughter. At these same times the eye
temperature was recorded using thermography and cattle temperament measured using flight
speed and crush score. In addition to these measures of stress, video recordings were taken of the
cattle for use in qualitative behavioural assessment (QBA) of the animals’ body language at the same
time points.
The association of the measures of stress and cattle production and carcase characteristics were also
undertaken to determine if there are indicators of cattle likely to display poor growth or reduced
carcase quality, in particular the association with post slaughter muscle glycogen.
5.1 Comparison of stress and temperament indicators between time points
There were differences in the magnitude of many of the stress indicators between the time of
induction and slaughter thus we broadly reject our hypothesis which was that there would be no
differences in stress indicators at these two time points. A comprehensive range of stress markers
were investigated in this study, including indicators of acute and chronic stress, fatigue, dehydration,
general health and muscle/fat metabolism which will be discussed.
5.1.1 Acute stress indicators
The acute stress indicators glucose and lactate were increased compared to normal levels at all time
points (induction, day 70 and slaughter). Cortisol concentration, while increased in certain animals,
on average did not exceed the maximum for the normal physiological reference range value for
cattle in any of the groups at any time point. The increase in these acute stress indicators was
expected as any activation of the ‘fight or flight’ response is manifested by the activation of the
hypothalamic-pituitary-adrenal (HPA) axis and the release of adrenaline from the medulla of the
adrenal gland and glucocorticoids (e.g. cortisol) from the cortex of the adrenal (Chen et al., 2015;
Shaw & Tume, 1992). Animals will experience some level of stress when normal homeostasis is
disrupted and therefore it is likely that induction to the feedlot, yarding and weighing at day 70 and
the pre slaughter period will all impact on the short-term level of stress experienced by cattle.
Animals can be stressed by either physical stresses (hunger, thirst, fatigue, injury, or thermal
extremes) or psychological stress (restraint, handling, or novelty). Procedures such as restraint in a
crush do not usually cause significant pain, but may cause a psychological stress response. This
psychological stress response is usually acute and is associated with the short-term activation of the
HPA axis, also known as the animal’s ‘fight or flight’ response. This acute response needs to be taken
into consideration when interpreting blood measures of stress as the actual procedure for
restraining the animal and obtaining a blood sample is a physical and psychological stress. In terms
of the function of an animal activating its ‘fight or flight’ system, cortisol functions to increase
cellular energy metabolites (e.g. glucose) through gluconeogenesis and to aid in the metabolism of
fat, protein, and carbohydrates. The release of cortisol and catecholamines (adrenalin) has the
secondary effect of causing increased metabolism and production of plasma lactate and glucose.
Mitchell et al (1988) also demonstrated increased levels of lactate, glucose and cortisol in cattle at
slaughter, after routine restraint and following transportation, compared to control animals.
A specific aim of the experiment was to compare the time points of induction to the feedlot and
slaughter as cattle are undergoing similar procedures at these time, e.g. feed deprivation, transport
and exposure to novel environments. This comparison was to provide baseline observations in the
same cattle exposed to the same procedures to compare the relative stress under the handling
conditions considered best practice. The results for cortisol, lactate and glucose in this study show
that slaughter is associated with an increased acute stress response compared to induction to the
feedlot. Cortisol at slaughter increased from between 1.8 and 2.0 times that at induction, which
indicates that at the time of slaughter the cattle showed increased short-term stress responses.
Grandin (1997) stated that stress due to handling and slaughter can be similar. Of course it is logical
that the comparison of stress and cortisol, in particular, at the time of slaughter and at other time
points from other studies is highly dependent on the individual circumstances surrounding their
handling and management. Grandin suggests that cortisol levels are highly variable and that it can
be difficult to compare different studies, however she suggests that mean values greater than 193
nmol/L would indicate cattle undergoing rough handling. Therefore, despite plasma cortisol
concentrations being highest at slaughter in the current study, the magnitude of the cortisol
increase is moderate in comparison to what is considered to indicate high levels of stress in cattle.
This reflects positively on handling and management of the cattle at all facilities throughout the
experiment. Therefore, to specifically address another of our research aims, the levels of stress in
cattle throughout the 100 day feedlot program was low using cortisol as a measure of short term

stress. The best practice management for stock handling, transport and lairage resulted in cortisol
levels that were within the realms of being considered normal.
It is important to note that if we compare the levels of cortisol in the current study to findings from a
meta-analysis of on-farm and pre-slaughter cortisol levels in cattle by Grandin (1997), the average
cortisol levels of many animals in this experiment lie in the normal range for cattle with their head
restrained (e.g. 75 – 175 nmol/l), and despite the statistically significant difference in cortisol at
induction and slaughter, agrees with Grandin’s statement that “properly performed cattle slaughter
seems to be no more stressful than on-farm restraint” (Grandin, 1997). However, if we consider the
top of the range in the cortisol levels of the cattle in the current study, there were individual cattle at
all time points with levels that exceeded Grandin’s suggested ‘normal range’.
The results for plasma glucose in the current experiment were higher than in other experiments
assessing glucose during transport and slaughter (Mitchell et al., 1988; Warriss, 1984b), however this
should not necessarily be interpreted as a direct comparison of the stress experienced by cattle in
the different studies. The increase in glucose in response to stress associated with transport and
slaughter appears to be lower than in cattle (Shaw & Tume, 1992).
Similarly to cortisol and glucose, plasma lactate concentrations indicated the acute stress response is
greater at the time of slaughter than at the time of induction to the feedlot. The range of plasma
lactate values in this experiment however was considerably lower than in another study assessing
temperament and its impact on stress metabolites (Coombes et al., 2014). Direct comparisons of
lactate levels is difficult, as in the study of Coombes et al (2014), lactate was only collected at the
time of slaughter and therefore a comparison to other time points in these individual cattle was
unable to be made.
The results of the current study did demonstrate habituation with a reduction in flight speed from
the time of induction to feedlot exit, however this adaptation did not ameliorate the cattle’s
response to the environment in the pre-slaughter period as their acute response to stress was
greater than at the time of induction. It is possible that the increase in these acute stress markers
from induction to slaughter may reflect the animal’s anticipation of the restraint and blood sampling
regimen rather than a chronic stress. Animals can become habituated to a restraint and blood
sampling regimen over time, especially if there is some sort of positive outcome after the
experience, e.g. food reward. But if there is no ’reward’, as in the current study, the negative
response to the procedure may increase over time as the animal can use visual, auditory and other
sensory cues to anticipate the procedure (Nicolson, 2008) despite their apparent overall habituation
to their environment with reduction in flight speeds and crush scores over time. The impact of
temperament on measures of stress will be further discussed in section 5.2.
5.1.2 Chronic stress indicators
5.1.2.1 Complete blood count results
In partial support of our hypothesis there were some indicators of stress that were similar at both
induction to the feedlot such as the neutrophil:lymphocyte ratio, however this was not consistent
across all groups. Furthermore, in 2 of the 4 groups, neutrophil:lymphocyte ratio was significantly
higher at induction compared to the time of slaughter. An elevation of this ratio is the result of
glucocorticoids (e.g. cortisol) and catecholamines causing neutrophilia (abnormally high neutrophils
levels) and lymphopenia (abnormally low lymphocyte levels) in cattle (Anderson, Watson, & Colditz,
1999) with changes in the neutrophil to lymphocyte ratio taking 1 to 2 hours . Therefore, the results
of this experiment indicate that either there was no difference between the stress measured at the
time of induction to slaughter, or that in fact, the time point of induction to the feedlot was more
stressful.
The neutrophil:lymphocyte ratio is used by ecologists across species to better assess the
hypothalamic-pituitary response to stress and is considered by some as a better assessment of stress
than cortisol alone (Davis et al., 2008). The use of neutrophil, lymphocyte and total white cell counts
alone is considered a less reliable measure of stress as there is greater baseline variables in these
parameters than when using the neutrophil:lymphocyte ratio (Davis et al., 2008). It could be argued
that leucocyte profile is not a reliable indicator of stress as changes exist in response to not only
stress, but inflammation and infection (Forget et al., 2017). However, there was concurrent
measures of haptoglobin, fibrinogen and ceruloplsmin at all time points where the
neutrophil:lympthocyte ratio was interpreted and there was no evidence of overt herd disease in
any group at any time point, which adds support to the notion that the neutrophil:lympthocyte in
this experiment is as a result of a response to stress.
Although fibrinogen remained on average within normal limits throughout the experiment in all
groups it was consistently higher at the time of induction to the feedlot compared to slaughter.
Fibrinogen is elevated in response to stressors such as the feed deprivation that occurs with
transport (Crookshank, Elissalde, White, Clanton, & Smalley, 1979), but the change in concentration
is less rapid than the change in plasma cortisol concentration (Carlson, Fradl, Leonard, Wentland, &
Reeve, 1977). The stress of transportation and unfamiliar surroundings can increase free fatty acid
concentration in the serum of beef calves (Reynaert, Marcus, De Paepe, & Peeters, 1976) and long
chain free fatty acids have been shown to increase fibrinogen synthesis (Carlson, Wentland, Leonard,
Ruder, & Reeve, 1978). Thus, one of the mechanisms for increasing fibrinogen synthesis as the result
of stress associated with fasting may relate to serum free fatty acid concentrations (see Section
5.1.4).
In contrast to our hypothesis, there were differences in packed cell volume percentage between
induction and slaughter with induction levels higher in all groups compared to day 70 and slaughter.
Packed cell volume is known to be elevated in response to both dehydration and stress-induced
catecholamine release causing splenic contractions and subsequent enterocyte release (Knowles et
al., 1993). The use of packed cell volume in combination with total protein tells a more accurate
story regarding dehydration as total protein responds to animal dehydration as substantial protein
moves in and out of the blood but is not affected by catecholamine release (Smith, 2015) and in
cattle, overnight lairage has been associated with increases in plasma total protein (Jarvis,
Harrington, & Cockram, 1996). Total protein was similar at the time of slaughter to induction to the
feedlot in half of the groups and higher at induction in the remaining groups, indicating cattle in this
experiment were more dehydrated at induction adding credence to the notion that stress was
higher at this time point compared to slaughter.
5.1.3 Muscle damage (creatine kinase and aspartate aminotransferase)
Plasma concentration of creatine kinase (CK) was higher at induction in all groups compared to
slaughter, with the magnitude of the increase at slaughter well above normal reported limits for
cattle (Smith, 2015). Although there was an increase in CK above normal limits in all groups at the
time of slaughter this was relatively small, particularly in comparison to the elevation at the time of
induction indicating that muscle damage at this time point was relatively minor. Elevations in CK are
widely considered specific and sensitive measures indicators of acute muscle damage in ruminants
(Russell & Roussel, 2007) due to their high concentration and activity in skeletal muscle.
The small but significant increase in aspartate aminotransferase (AST) at the time of slaughter in 50%
of the groups is difficult to interpret, with only one of the groups showing elevations above normal
limits. Given AST is a less specific indicator of muscle damage than CK there may be other factors
that have contributed to its increase in these groups. Furthermore, AST also has a long half-life
(Kaneko, Harvey, & Bruss, 2008), with elevations potentially persisting for a number of weeks. The
increase at slaughter maybe indicative of muscle damage that occurred earlier during the feed
lotting time period.
The results of the muscle indicators are useful for a number of reasons: firstly they indicate that at
the time of slaughter the cattle have not recently undergone significant muscle trauma which likely
reflects good handling practices during exit from the feedlot, transportation to the abattoir and
during lairage; secondly that the level of muscle damage and potential stress experienced by the
cattle as a result of transportation and induction to the feedlot is far greater than through transport
and lairage at slaughter in this experiment. The differences between time points in this experiment
are likely related to the length of time the cattle are transported from the farm of origin to the
feedlot however none-the-less are indicative of the potentially greater impact of transport on
muscle damage at the time of induction compared to slaughter.
5.1.4 Nutritional stress and metabolism
In this study plasma non-esterified fatty acids (NEFA) and β-hydroxybutyrate were higher in 50% of
the groups at the time of induction, with the converse true in the other groups. The greatest
elevation in both metabolites was observed at the time of induction to the feedlot with NEFA
concentrations 50% above the upper normal range (Smith, 2015). In the groups where NEFA and β-
hydroxybutyrate were elevated at slaughter with respect to induction the levels still remained within
normal limits at both time points. Furthermore, these two groups had access to some hay in the
period prior to blood collection at the time of induction which would account for their relatively
normal levels of NEFA and β-hydroxybutyrate at induction compared to the other 2 groups. As would
be expected the plasma NEFA and β-hydroxybutyrate concentrations at day 70 were consistently
low accounting for the fact that cattle were on feed until the time of their brief yarding and blood
collection. Non-esterified fatty acids and β-hydroxybutyrate levels generally increase under
metabolically stressful situations such nutritional deficiencies and muscular exertion in cattle (Kenny
& Tarrant, 1987). This rise is due to the mobilisation of stored adipose tissue in the process of
lipolysis which is activated through the endocrine, paracrine and autocrine signalling pathways (Stich
& Berlan, 2004). Therefore in this study although there was some variation in metabolic/nutrition
stress between groups at induction and slaughter the greatest impact of nutritional stress was
observed at induction.
Muscle glycogen and ultimate carcase pH have also been used as indicators of chronic stress in
cattle, sheep and pigs (Choe & Kim, 2014; Gregory & Grandin, 1998; Jacob, Pethick, & Chapman,
2005; Tarrant, 1989). Depletion of muscle glycogen reserves pre-slaughter due to stress has a
significant effect on several key meat quality attributes such as ultimate pH, tenderness and ageing
potential, colour and water-holding capacity (Gregory & Grandin, 1998). The normal muscle
glycogen level in cattle and sheep ranges between 1.275 and 2.04 g/100 g (Immonen, Kauffman,
Schaefer, & Puolanne, 2000; Lambert et al., 1998; Monin, 1981). If muscle glycogen reaches a critical
threshold of 0.765–0.969 g/100 g below which the normal ultimate pH in meat (5.5–5.6) will not be
attained, and dark-cutting is a likely result (Howard, 1964; Tarrant, 1989). Although the muscle
glycogen level of the majority (95%) of the cattle in the current experiment was above the critical
threshold, there were 5% of the cattle with glycogen levels below the critical threshold. However,
even though there were these animals that could have been classified as ‘at-risk of dark cutting’
based on their glycogen levels, there were no ‘dark cutters’ and no carcases in the study that had an
ultimate pH greater the MSA recommended 5.7 (Figure 1b). This further provides evidence that the
stress of slaughter for these animals was likely below normal levels as it was insufficient to affect the
ultimate pH of the ‘at risk’ cattle.
5.1.5 Other indicators of stress
There was no consistent relationship between plasma magnesium at the various time points. In 50%
of the groups magnesium was highest at induction and the other groups higher at slaughter.
Generally magnesium was lowest at day 70 post induction. The rationale for collecting plasma
magnesium levels at different time points was that low plasma magnesium has been associated with
increased stress and muscle contraction, (Ebel & Günther, 1980; Schonewille, 2013) which increases
glycogenolysis in times of stress such as the pre-slaughter period. Furthermore high plasma
magnesium has been shown to attenuate the stress response (Hubbard, 1973). Although in this
experiment there was no significant association of plasma magnesium with post slaughter glycogen
or pH, and poor correlation to measures of acute stress (cortisol, glucose and lactate), it may be
useful to continue to collect plasma magnesium or dietary magnesium in future experiments. Recent
work by Louden et al (2018) has shown that grazing pastures with >0.24% magnesium reduced the
incidence of dark cutting in pasture fed cattle.
There were a number of acute inflammatory proteins collected during blood sampling
(ceruloplasmin, haptoglobin and fibrinogen). The purpose of collecting these particular proteins was
two-fold: 1. to enable identification of cattle with potentially high levels of inflammation or infection
in the feedlot to better understand the impact of acute and chronic inflammatory and infectious
diseases on the production and eating quality characteristics; 2. Acute phase proteins have been
used to measure the response of ruminants to stress and thus were included in the blood collection
for this experiment as markers of stress and as potential predictors of animal performance (e.g.
growth) and carcase quality (shear force, post-slaughter glycogen). In this experiment plasma
ceruloplasmin and haptoglobin levels remained within normal limits, although ceruloplasmin in all
groups increased over time and were highest at slaughter, however the significance of this finding is
unknown. Elevations in ceruloplasmin and haptoglobin has been associated inflammation and
infection in ruminants (Ceciliani et al., 2012; Cray et al., 2009) and have also been used as a marker
of stress in livestock (Giannetto et al., 2011; Lomborg et al., 2008; Salamano et al., 2008). Feed and
water deprivation has also been shown to elevate their plasma concentrations (Marques, Cooke,
Francisco, & Bohnert, 2012) and may contribute to the increase in concentration at induction and
slaughter, although does not account for the elevations at 70 cattle were not withheld from food
and water. Given the association of these plasma proteins with adrenocortical hormones and stress
further exploration of the mechanisms that result in their increase may be warranted as they may be
a useful assessor of chronic or longer term stress such as cattle in the feedlot.
The use of mean eye temperature as a comparison of stress between time points was not
considered reliable with inconsistent results between time points. This is potentially due to the
variation in the environmental conditions during the on farm collection of eye thermography. For
example, time of day, exposure to light (i.e partial exposure to the sun at the feedlot compared to
the enclosed environment at the feedlot), management of cattle at the time point (i.e cattle hosed
down pre-slaughter may cool temperature). The use of mean eye temperature may be better suited
to the assessment of stress within a given time point, with eye thermography shown to correlate to
cortisol in horses (Valera et al., 2012) and changes in the autonomic nervous system in cattle
(Stewart, Webster, Stafford, Schaefer, & Verkerk, 2010). There are some good indication for the use
of eye thermography in the pre slaughter period and association with some aspects of meat quality
which is discussed in section 5.3.
5.2 Cattle temperament and the impact of temperament on measures of stress
Cattle in this experiment were shown to habituate to their environment and displayed slower flight
speeds and crush scores throughout the duration of their 100 day feedlot stay. At the time of exit
from the feedlot all groups had lower flight speeds than at the time of induction. There were some
time periods, for example day 70, where some groups had average flight speeds higher than at
feedlot exit indicating that environmental conditions can impact on the groups flight speed but that
the overall trend was for flight speed to reduce. This experiment indicates that repeated handling at
the feedlot had a positive impact on cattle temperament which is in contrast to other studies
involving feed lot cattle (Petherick et al., 2002) where flight speed increased during feedlotting.
Other studies have shown a decrease in both flight speed and crush score over time in the
backgrounding (grazing) time period, with minimal change in both parameters once admitted to the
feedlot (Cafe, Cafe, Robinson, Ferguson, & McIntyre, 2011).
The correlation of flight speed and crush score at the time of induction to the feedlot and feedlot
exit in this experiment was moderate (0.66 for flight speed and 0.33 for crush score) and higher
than reported in other studies (Cafe et al., 2011). Other studies have used average flight speed
recorded on a number of occasions to assess animal temperament (Burrow & Corbet, 1999;
Coombes et al., 2014) however a specific aim of this experiment was to examine the relationship of
the animal temperament recorded at each time point with the measures of stress taken at the same
time point. Flight speed at a variety of time points was also used to determine if flight speed taken at
any particular time period offered an advantage for predicting stress at slaughter, production
characteristics and meat quality attributes.
5.2.1 Acute stress indicators and associations with flight speed
Flight speed did impact on measures of stress however this was often limited to only certain time
points or groups, with the magnitude of the effects small in comparison to the differences between
the stress measures at the different time points. Therefore in contrast to our hypothesis, animal
temperament measured at the time of sample collection had a more limited impact on the measures
of stress compared to differences between the time periods (induction, day 70 and slaughter).
The strongest associations were between temperament/flight speed at a time point and the acute
measures of stress (cortisol, lactate and glucose). There was a good correlation between flight speed
and plasma cortisol, glucose and lactate within a time point, however the relationship between
animal temperament on these acute measures of stress varied between time points. For cortisol,
glucose, and lactate the magnitude of the response to increasing flight speed was greatest at day 70
compared to other time points despite many of mean plasma concentrations of these measures
being at their lowest throughout the study. It is possible that at day 70 the process of cattle being
yarded and run through the crush for weighing and collecting of blood is a more isolated single insult
to the sensory system of the animal which elicits a stronger more isolated response from the
sympathetic nervous system rather than the potentially more prolonged and multifactorial response
elicited at the time of induction to the feedlot and slaughter.
Previous studies have shown a good association of flight speed and the acute stress response.
Coombes et al (2014) showing that plasma lactate at slaughter is increased with average flight speed
measured in the feedlot. Similarly Gruber et al (2010) showed that steers with high flight scores had
increased adrenaline, heart rate, rectal temperature and lactate. Our experiment shows a similar
magnitude of increase of plasma lactate to Coombes et al (2014) with increasing flight speed,
however also highlights that the acute stress response varies. The variation in the association of
flight speed with measures of acute stress can be related to the animals previous experience
(Grandin, 1997). Although the precise reason for the variation in the association of cattle
temperament to acute measures of stress at the different time points is unclear it is a benchmark for
future studies assessing cattle of similar background or handling conditions.
Despite a decrease in the average flight speed of all groups from the time of induction to the feedlot
and day 70 there was not a significant reduction in plasma cortisol response measured at day 70
post induction. This is interesting from a number of perspectives and highlights that both
temperament measures and cortisol are related, but that they cannot be used as proxies for one
another.
The flight speed measured at the time of induction was significantly associated with plasma cortisol,
lactate and glucose concentrations at the time of slaughter which is similar to other studies which
have shown that animal temperament is a persistent quality in cattle (Cafe et al., 2011). In the
current experiment cattle temperament improved (as measured by decreased flight speeds) in all
groups over time, however cattle that arrive with ‘poor’ temperament were still likely to exhibit the
highest acute stress responses when exposed to a novel environment later in production system
(e.g. lairage and slaughter). Although the strength of the relationship between induction flight speed
and the acute stress response at slaughter has not been explored in detail, it is feasible to suggest
that measurement of flight speed at induction may offer an early indication of the magnitude of the
cattle’s acute stress response at the time of slaughter. This potentially allows decisions to be made

early in the feedlot process about management of highly stress responsive cattle to potentially
ameliorate their future stress responses and this is an area of research that warrants further
investigation.
5.2.2 Other indicators of stress
An increase in flight speed resulted in a marked increase in CK at the time of induction, indicating
that in this experiment cattle with poor temperament at the time of induction to the feedlot were
more likely to experience muscle damage at this time. There was no impact of flight speed measured
at the other time points (day 70 and feedlot exit) with the CK measured at these same time points.
At induction, the increase in plasma CK across the range of flight speeds was as much as the
difference in CK measured between induction and the other 2 time points (day 70 and slaughter). In
this experiment there was a generalised decrease in flight speed in all cattle groups over time
however a moderate range of flight speeds existed at day 70 and feedlot exit, therefore the reason
for this lack of impact of temperament at these time points is difficult to interpret. The flight speed
measured at feedlot entry did have a positive association with CK measured at slaughter which may
indicate that the earlier ‘wild type’ measures of animal temperament prior to habituation offer a
good indicator of the likelihood of these same animals experiencing muscle damage at slaughter.
Future experiments may help to indicate the reason for the lack of association of temperament
taken at feedlot exit with CK at the time of slaughter. Other studies have shown no effect of
temperament on CK (Francisco et al., 2015), however this same experiment did show increased
bruising in the cattle defined as being excitable. In this same study, the temperament of cattle was
determined using an average of flight speed and chute scores over a number of days rather than
examining the relationship between temperament assessments taken at the time of blood
collection. Additionally the flight speed range of cattle in this experiment were lower than in the
current experiment which may account for the lack of association of temperament and plasma CK.
The relationship of increased flight speed with elevations in AST was consistent across all time
points. Poor temperament has shown an association with AST in other experiments (Petherick,
Doogan, Venus, Holroyd, & Olsson, 2009) and indicates that the animals with poor temperament are
more likely to experience muscle damage.
Cattle with higher flight speeds did have an increase in neutrophils and an increase in
neutrophil:lymphocyte measured at the same time point, however this effect was limited to only
one group at slaughter. The impact of flight speed on the complete blood count results was
comparatively small compared to the differences that exist small compared to the differences in the
measures at various time points. There was an significant positive association of flight speed at the
time of induction to the feedlot with the neutrophil:lymphocyte at slaughter and similar to some of
the acute measures of stress such as cortisol and glucose, flight speed at assessment may offer a
good indicator of how these cattle will response to exposure to novel environments after a period of
habituation in the feedlot. Other studies have also indicated that neutrophil:monocyte increases in
more temperamental bulls (Fell et al., 1999). This current experiment was not specifically designed
to assess immune function, future work around temperament and immune function may be useful
as temperament was shown to impact on neutrophil function (Fell et al., 1999) which has
implications for cattle introduced to a feedlot.

Cattle with higher flight speeds/poor temperament had an increased ceruloplasmin levels.
Ceruloplasmin is an acute phase protein that is elevated in response to stressful procedures and
excitable temperament (Arthington et al., 2003; Cooke, Arthington, Araujo, & Lamb, 2009). Other
studies have demonstrated an increase in acute phase proteins in association with stress induced by
injection of corticotropin releasing hormone and induced stress (Cooke & Bohnert, 2011). In this
study the cattle displayed an increase in plasma haptoglobin and ceruloplasmin 54 hours after a
stress response was induced. It seems plausible that the increase in plasma ceruloplasmin will occur
in cattle of poor temperament due to these animals having higher baseline levels of cortisol and
catecholamines (Vann et al., 2004). In the evaluation of ceruloplasmin levels in cattle for health
assessments it may be useful to also consider the temperament of the cattle given the relationship
of flight speed and plasma levels of ceruloplasmin.
5.3 Prediction of cattle growth, carcase traits and meat quality traits
A secondary aim of this experiment was to determine if there are measurements or traits taken in
the feedlot and pre-slaughter period that can predict production attributes (average daily gain),
carcase measures (hot carcase weight, eye muscle area, P8 fat depth) and aspects of meat quality
(post slaughter pH, muscle glycogen, shear force, cooking loss %). Some of the measures of
temperament and stress indicators did provide insight into these production characteristics and
meat quality measures however often the association was only poor to moderate and the magnitude
of the effects were quite small. Some of the results in this experiment report similar findings to
previous studies, however have an added benefit of being able to better describe the magnitude of
some of these effects in this group of cattle. It is important to emphasise that although there was
some association of blood sample results, temperament measures and mean eye temperature with
some of the production and carcase characteristics, when used as a predictive tool the precision of
prediction was very poor. Therefore, this report although detailing the magnitude of the effects on
glycogen, shear force and cattle growth should not be interpreted as being a predictive tool for
these traits.
5.3.1 Post slaughter muscle glycogen and pH
This experiment was not specifically designed to examine factors affecting dark cutting, however
there were blood measures and eye temperature at some time points which showed a relationship
with post slaughter muscle glycogen. Low concentration of glycogen at the time of slaughter can
result in a high ultimate pH and dark cutting due to inadequate substrate for post mortem glycolysis
to lactate. A minimum level of glycogen required to achieve acceptable ultimate pH is 0.8 to 1 % with
dark cutting in beef is defined by MSA as an ultimate pH greater than 5.7 (Thompson 2002). In all
groups in this experiment the 24 hour pH was not elevated above 5.7 and glycogens fell within an
acceptable range to minimise the risk of dark cutting (> 0.8-1%), therefore it is perhaps unsurprising
that there was minimal predictive power of the data collected given the relatively small range in
glycogen and pH values.
An increase in the mean eye temperature as measured by hand held thermography at both
induction to the feedlot and also in the immediate pre-slaughter period had a negative relationship
with post slaughter muscle glycogen of the M. longissimus lumborum et thoracis. This result has not
previously been demonstrated and given the limited range of post slaughter muscle glycogen levels
in the experiment, thermography is worthy of further investigation. As mean eye temperature
increased, there was a decrease of muscle glycogen of 0.16 g/100g and 0.11 g/100g across the
respective ranges of eye temperatures at induction to the feedlot and in the pre-slaughter period.
When used as purely a predictive modality, mean eye temperature had poor precision of prediction
of post slaughter glycogen so the result in this experiment does needed to be interpreted with
caution and at this time would not be considered a reliable indicator of muscle glycogen and risk of
dark cutting at this time. There has been some previous association of thermography with beef meat
quality (Tong, Schaefer, & Jones, 1995), however further investigation is required. The biological
mechanism that links eye temperature with post slaughter muscle glycogen in this experiment can
not be determined and further investigation is required. It is likely that eye temperature is related to
the acute stress response associated with the hypothalamic-pituitary axis (Schaefer, Matthews,
Cook, Webster, & Scott, 2002; Stewart, Webster, Schaefer, Cook, & Scott, 2005). Infrared
thermography has been use to assess stress in horses undergoing show jumping (Bartolomé et al.,
2013; Valera et al., 2012) where it is considered a useful measure of stress. In the current
experiment heart rate was not monitored and there was with no direct relationship between eye
temperature and the acute measures of stress such as plasma cortisol, lactate and glucose however
future experiments may better describe the biological mechanism for the link between eye
temperature, stress indicators and the depletion of post slaughter muscle glycogen. Should the
reliability of eye temperature at induction to feedlot and the pre-slaughter be repeatable and
reliable predictor of muscle glycogen and risk of dark cutting then it may be a good management
tool for use in the feedlot and abattoir process.
There was no relationship of eye thermography and post slaughter pH, however this is not surprising
given the very small range of post slaughter muscle pH. Future experiments investigating eye
thermography should also collect information on post slaughter pH decline, ultimate pH and also
muscle glycogen. This relationship has not previously been published and is worthy or future
investigation. The identification of factors such as eye temperature that predict muscle glycogen
could potentially offer a method for predicting cattle at risk of dark cutting.
The biological significance of the decrease in post slaughter muscle glycogen associated with
increased NEFA in the pre-slaughter period is difficult to explain. Previous studies have shown that
sheep starved for 4 days did not deplete muscle glycogen (Daly, Gardner, Ferguson, & Thompson,
2006). Sheep in this particular experiment were not under any significant stress which may account
for the differences observed in this experiment. The decrease in post slaughter muscle glycogen with
elevated fibrinogen in the pre-slaughter period is also difficult to explain from a biological
perspective. However, given the association of elevated fibrinogen with starvation (Crookshank et
al., 1979), the link between fibrinogen and glycogen may be more so a reflection of pre-slaughter
NEFA and further investigation is warranted before conclusions regarding this result can be made.
5.3.2 Temperament measures, cattle growth and carcase characteristics.
5.3.2.1 Average daily gain and hot carcase weight.
Flight speed and crush score both had a significant association with average daily gain (kg) and
HCWT (kg), and of the two measures of temperament, flight speed had the strongest association.
The relationship between flight speed and production characteristics was greater than that of crush
score which indicates that flight speed may offer a superior predictor of cattle growth than crush

score. This indicates that the superior assessment of temperament for prediction of average daily
gain and carcase weight was flight speed, which is contrary to work by others (Behrends et al., 2009;
Vetters, Engle, Ahola, & Grandin, 2013) who showed both exit velocity and chute score or exit score
to predict cattle growth. Although the aim of this experiment was not to specifically quantify the
relationship between temperament and cattle growth, we report a .46 kg and a 20.8 kg reduction in
average daily gain and hot carcase weight from the best to the worst temperament animals as
assessed by flight speeds at the time of induction. This constitutes a significant difference in value
between cattle of good and poor temperament. The simple correlation coefficient of flight speed at
induction with average daily gain in this experiment (-0.49, P<0.01) is similar to that observed in
other studies (Müller & von Keyserlingk, 2006; Petherick et al., 2002; Vetters et al., 2013), although
the magnitude of the reductions in weight in other studies have not been reported. Crush score was
a less sensitive indicator in this experiment, although increased crush scores at induction showed a
significant relationship with HCWT and similarly the result did not differ between the sexes.
Future experiments may be better able to characterise the relationships between temperament as
measured by flight speed taken at the time of induction to establish the potential financial
implications of feed-lotting cattle with poor temperament. These future experiments could also test
methods of better managing cattle of poor temperament to determine if different handling or
habituation programs will improve their feedlot performance.
5.3.2.2 Shear force (N)
There was an impact of flight speed on tenderness (N) as assessed by WBS, with the flight speed at
induction to the feedlot giving the best prediction of tenderness compared to other time points. This
is similar result to that of a study in steers by (Behrends et al., 2009) where flight speed at weaning
was a better predictor of growth and tenderness was best predicted at weaning compared to those
from later time points. Other studies such as Hall et al (2011) have indicated that initial flight speed
had a similar effect of flight speed on WBS but of greater magnitude compared to our experiment
however their cattle had a greater range of tenderness. Other studies have reported that flight
speed measured at other time points had similar relationships meat tenderness (Deesinga, 1997;
King et al., 2006). The result in our study indicates that under Australian conditions in cross bred
steers and heifers there may be merit in determining flight speed of cattle at feedlot entry to predict
cattle tenderness at slaughter. Future work is required to examine a larger number of groups to
better establish the reliability of this relationship across Australian production systems and breeds
and also if this effect extends to other muscles.
5.3.3 Other findings
There was no impact in this study of kill order on meat shear force or glycogen. Stewart et al (2017)
showed in lamb that as kill order increased there was a corresponding increase in shear force and
suggested that with an increased time during pre-slaughter that stress was increased. In this current
experiment there was an increase in cortisol and lactate at slaughter associated with increased kill
order, similar to that observed in other cattle studies (Stockman et al., 2012). The magnitude of the
stress at slaughter in this current experiment is estimated to be low due to the low cortisol in
slaughter cortisol. Therefore, the lack of association of shear force and kill order may be due to the
comparatively low stress of these animals in the pre-slaughter period and the small number of cattle
in the study. Alternatively, the result in lamb (Stewart et al., 2017) was only observed in one year of

lamb slaughter in the experiment. Future experiments could include assessment of kill order with
both shear force, glycogen and pH.
Ceruloplasmin had a negative association with average daily gain (kg) with a simple correlation
coefficient of -0.49, however the prediction power of ceruloplasmin for animal growth is considered
poor. Future experiments could utilise ceruloplasmin as a marker of animal health and may be useful
in determining the underlying cause of reduced growth and aspects of eating quality in cohorts of
cattle where disease (e.g. respiratory disease) may be a factor.
In this experiment there was no association of haptoglobin with average daily gain or HCWT, which is
in contrast to previous work where as haptoglobin concentration increased there was a decrease in
average daily gain (kg) (Francisco et al., 2015). Haptoglobin has been used as a marker of stress in
livestock (Lomborg et al., 2008; Salamano et al., 2008) however in this experiment had poor
correlation with other markers of stress such as cortisol, lactate and glucose was poor, and the
association with cattle performance was limited hence is usefulness in studies assessing stress and
production characteristics may be limited.
In this experiment the blood, eye temperature and temperament measures were analysed singly as
covariates to determine the results that were significantly associated with production and carcase
characteristics. The use of multiple measures may improve the predictive power of production and
carcase traits and could be investigated in the future in a more diverse population of cattle.
5.4 Qualitative behavioural assessment
We set out to test two main objectives with the QBA procedure. Firstly, we investigated whether
observers could reach agreement in their assessments of the behavioural expression of cattle filmed
during the 100-day ‘finishing’ process and pre-slaughter. We recorded high observer agreement in
their assessments, meaning that the observers used the fixed list of terms in a similar way to score
the behavioural expression of the cattle. The level of observer agreement (49%) was similar to that
found in a similar pre-slaughter QBA cattle study (44%) we conducted previously (Stockman et al.
2012). Using QBA, our group of observers could discern behavioural patterns in cattle in the pre-
crush race at the feedlot and in the race leading towards the drop-box at the slaughterhouse. Two
main dimensions of behavioural expression, accounting for 91% of the total variation, were
distinguished by generalized Procrustes analysis (GPA). GPA dimension 1 (77% of variation) was
defined by the terms calm/relaxed versus nervous/anxious, while GPA dimension 2 (14% of
variation) was defined by the terms interested/curious versus annoyed/frightened.
The second objective of the QBA procedure was to determine if there is a correlation between the
observer interpretation of the behavioural expression of the sub-groups of 30 cattle and
physiological/temperament indicators of stress measures. We found correlation between
temperament (flight speed and crush score) that was captured at the same time as the video
footage was collected (induction, day 70 and pre-slaughter) and the GPA scores. We also found a
correlation between various plasma indicators of stress and the GPA scores. We conclude that QBA
could be a valuable method of assessing cattle welfare under the conditions tested, in that it
provided an integrative characterisation of cattle behavioural expression during the 100-day
‘finishing’ feedlot process and pre-slaughter.
One of the most striking findings of this study was that observers distinguished differences in the
behavioural expression of cattle that were significantly correlated to the pattern of habituation to
the various handling events during the 100-day feedlot process. Cattle that were observed at
induction were attributed lower scores on GPA dimension 1 (i.e. scored as more nervous/anxious)
compared with cattle that were observed at the end of the 70-day and pre-slaughter time points
(more calm/relaxed), and this correlated with the changes in temperament over this time period.
In terms of the correlation between GPA scores and indicators of meat quality, in the sub-group of
30 cattle tested, the only correlation was found between GPA dimension 1 and ultimate carcase pH,
with cattle described by the observers as being more calm/relaxed having lower ultimate carcase
pH. However, there was a very low coefficient of variation in pHu (1%) meaning that this result could
be a statistical artefact. Other measures such as muscle glycogen, shear force and intra-muscular pH
were not correlated to the GPA scores. This may be due to the relatively low sample size in the sub-
group of cattle selected for QBA, especially as there were no ‘dark cutters’ in the sub-group (or even
in the other 210 cattle sampled) in this study.
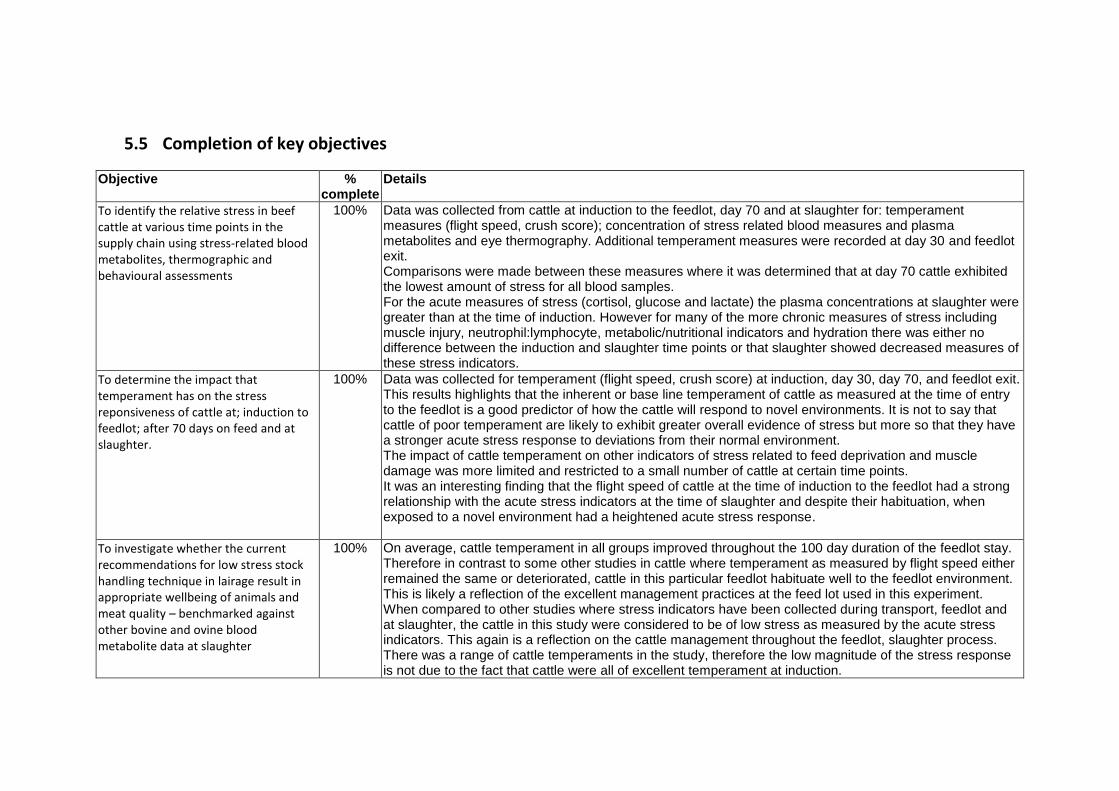
5.5 Completion of key objectives
Objective % complete
Details
To identify the relative stress in beef cattle at various time points in the supply chain using stress-related blood metabolites, thermographic and behavioural assessments
100% Data was collected from cattle at induction to the feedlot, day 70 and at slaughter for: temperament measures (flight speed, crush score); concentration of stress related blood measures and plasma metabolites and eye thermography. Additional temperament measures were recorded at day 30 and feedlot exit. Comparisons were made between these measures where it was determined that at day 70 cattle exhibited the lowest amount of stress for all blood samples. For the acute measures of stress (cortisol, glucose and lactate) the plasma concentrations at slaughter were greater than at the time of induction. However for many of the more chronic measures of stress including muscle injury, neutrophil:lymphocyte, metabolic/nutritional indicators and hydration there was either no difference between the induction and slaughter time points or that slaughter showed decreased measures of these stress indicators.
To determine the impact that temperament has on the stress reponsiveness of cattle at; induction to feedlot; after 70 days on feed and at slaughter.
100% Data was collected for temperament (flight speed, crush score) at induction, day 30, day 70, and feedlot exit. This results highlights that the inherent or base line temperament of cattle as measured at the time of entry to the feedlot is a good predictor of how the cattle will respond to novel environments. It is not to say that cattle of poor temperament are likely to exhibit greater overall evidence of stress but more so that they have a stronger acute stress response to deviations from their normal environment. The impact of cattle temperament on other indicators of stress related to feed deprivation and muscle damage was more limited and restricted to a small number of cattle at certain time points. It was an interesting finding that the flight speed of cattle at the time of induction to the feedlot had a strong relationship with the acute stress indicators at the time of slaughter and despite their habituation, when exposed to a novel environment had a heightened acute stress response.
To investigate whether the current recommendations for low stress stock handling technique in lairage result in appropriate wellbeing of animals and meat quality – benchmarked against other bovine and ovine blood metabolite data at slaughter
100% On average, cattle temperament in all groups improved throughout the 100 day duration of the feedlot stay. Therefore in contrast to some other studies in cattle where temperament as measured by flight speed either remained the same or deteriorated, cattle in this particular feedlot habituate well to the feedlot environment. This is likely a reflection of the excellent management practices at the feed lot used in this experiment. When compared to other studies where stress indicators have been collected during transport, feedlot and at slaughter, the cattle in this study were considered to be of low stress as measured by the acute stress indicators. This again is a reflection on the cattle management throughout the feedlot, slaughter process. There was a range of cattle temperaments in the study, therefore the low magnitude of the stress response is not due to the fact that cattle were all of excellent temperament at induction.
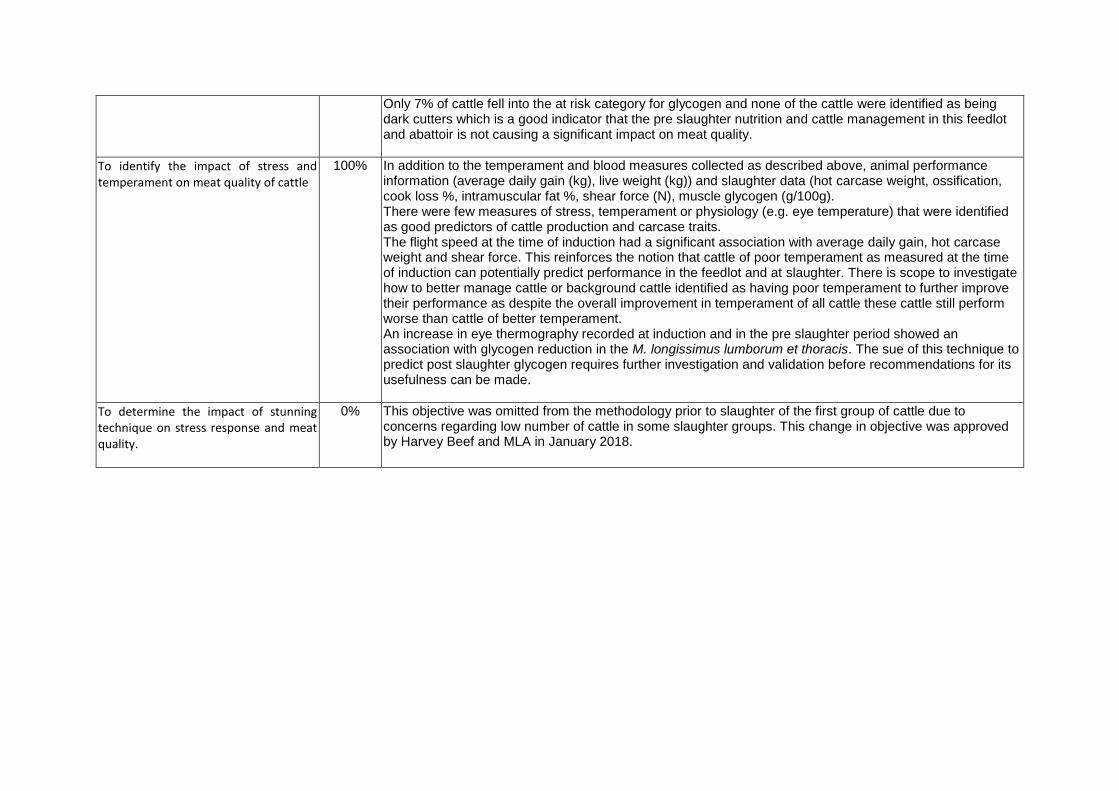
Only 7% of cattle fell into the at risk category for glycogen and none of the cattle were identified as being dark cutters which is a good indicator that the pre slaughter nutrition and cattle management in this feedlot and abattoir is not causing a significant impact on meat quality.
To identify the impact of stress and temperament on meat quality of cattle
100% In addition to the temperament and blood measures collected as described above, animal performance information (average daily gain (kg), live weight (kg)) and slaughter data (hot carcase weight, ossification, cook loss %, intramuscular fat %, shear force (N), muscle glycogen (g/100g). There were few measures of stress, temperament or physiology (e.g. eye temperature) that were identified as good predictors of cattle production and carcase traits. The flight speed at the time of induction had a significant association with average daily gain, hot carcase weight and shear force. This reinforces the notion that cattle of poor temperament as measured at the time of induction can potentially predict performance in the feedlot and at slaughter. There is scope to investigate how to better manage cattle or background cattle identified as having poor temperament to further improve their performance as despite the overall improvement in temperament of all cattle these cattle still perform worse than cattle of better temperament. An increase in eye thermography recorded at induction and in the pre slaughter period showed an association with glycogen reduction in the M. longissimus lumborum et thoracis. The sue of this technique to predict post slaughter glycogen requires further investigation and validation before recommendations for its usefulness can be made.
To determine the impact of stunning technique on stress response and meat quality.
0% This objective was omitted from the methodology prior to slaughter of the first group of cattle due to concerns regarding low number of cattle in some slaughter groups. This change in objective was approved by Harvey Beef and MLA in January 2018.

P.PIP.0743 - The Impact of handling Condition and New Environments on the Stress of Cattle
5.6 Assessment of project design and improvements
A strength of this study was that the same cattle were examined at each time point to make
meaningful comparisons of the stress exhibited. Many studies have looked at cattle assessed at the
same time points as in this study, however the use of the same cattle from induction to slaughter is
not well documented and therefore makes direct comparison of the time points more meaningful.
This study used 4 groups of cattle that were slaughtered on 4 separate days which allowed a good
assessment of these time points, however the study would have benefitted from a greater number
of cattle groups including cattle from origins or genetic lines known to be associated with dark
cutting. Future work could involve the use of a larger number of groups to assess cattle from
different origins and genetics, different feedlots, different abattoirs and different animal handlers.
The range of tests run on the blood samples collected was comprehensive and considered a strength
of the study. They included analysis of the classical acute measures of stress, such as cortisol, as well
as markers that indicated the relative impacts on other (chronic) measures of stress caused by feed
deprivation, muscle damage, and dehydration. Future studies can draw on the findings with regard
to the relative merit of these indicators to measure stress in cattle.
This experiment also collected production and slaughter data form cattle so that aside from
examining the relative stress at key time points of the 100 day feedlot program, data was collected
on a number of useful post slaughter carcase characteristics. Future studies may benefit from the
assessment of pH decline in addition to ultimate pH and muscle glycogen. Collection of slaughter
data from muscles other than the M. longissimus lumborum et thoracis may be useful to assess
impacts of stress across the carcase.
Another strong point of this study was that QBA was performed alongside the collection of the blood
and temperament data to assess the potential of this technique to add-value to current ‘race-side’
techniques for assessing stress and welfare. This technique utilises the innate skills of stock-people
to observe the body language of their animals to spot problems. Good correlations were found
between QBA and the temperament and blood indicators of ‘stressed’ cattle. Future studies would
benefit from assessing whether QBA could reliably predict meat quality by using cattle from origins
know to be associated with dark cutting.

P.PIP.0743 - The Impact of handling Condition and New Environments on the Stress of Cattle
6 Conclusions/recommendations
This study was designed to compare markers of stress in cattle under similar handling and
environmental conditions and in particular determine if there was a difference in any of these stress
markers at the time of slaughter compared to induction. Our hypothesis that there would be no
difference in measures of stress as the cattle at these time points were undergoing similar
procedures was rejected. Acute markers of stress varied between groups and time points, but
generally blood metabolites such as cortisol, glucose and lactate were increased at slaughter
compared to induction, whilst flight speeds had decreased. However, despite plasma cortisol
concentrations being highest at slaughter, the magnitude of the cortisol increase was moderate in
comparison to what is considered to indicate high levels of stress in cattle. This reflects positively on
handling and management of the cattle at all facilities throughout the experiment. Moreover, the
decreased flight speeds from induction to slaughter also highlight the beneficial habituation
processes probably occurring in the 100-day ‘finishing’ procedure. For the indicators of longer-term
stress, markers such as fibrinogen, neutrophil:lymphocyte ratio and packed cell volume also showed
a decrease from induction to slaughter. Overall in this study, induction was the more stressful event
when compared to slaughter.
Our secondary hypothesis that the greatest impact on measures of stress at each time point would
be individual animal temperament, as measured by flight speed, was also rejected. The impact of
temperament was limited mainly to the acute stress indicators where cattle identified as having high
flight speeds displayed the highest plasma cortisol, glucose and lactate concentrations. However,
although there was some impact of temperament on other stress indicators this was small and often
limited to only a small number of cattle at different time points or groups, which indicates that
temperament is not the overriding factor that influences stress. In disagreement with our
hypothesis, the data indicated that the environment (different time points) had a greater impact.
None-the-less, given that this study supports the notion that cattle of poor temperament have
reduced growth rates and carcase weight, cattle temperament will continue to be important in
feedlot production. Furthermore, given there was some association, albeit small, with aspects of
meat quality, temperament, in particular at the time of induction, should remain an area of future
experimental work. If individual cattle that have a propensity for displaying high levels of stress/poor
temperament at the time of slaughter can potentially be identified prior to, or at, feedlot entry, they
can potentially be managed differently to potentially improve their response to novel environments.
Further studies would be required to investigate the usefulness of enrichment programs on the
cattle’s response to stressful situations and also to their growth and carcase performance.
The overall findings in this experiment are also a valuable source of information for future work in
this area. Not only do the findings help document the types of stress experienced by cattle at key
time points in cattle that are finished in feedlots in Australian conditions, but has specifically
assessed a comprehensive range of acute and chronic stress indicators, as well as a range of other
stress-related measures such as muscle damage, immune response and nutritional/metabolism
indicators.
Although there was an impact of temperament on meat tenderness the magnitude of impact was
small and unlikely to significantly alter the eating quality as detected by a consumer. It does however
indicate that temperament remains a factor in beef meat quality, and the findings may have been
P.PIP.0743 - The Impact of handling Condition and New Environments on the Stress of Cattle
more revealing if the handling and management of the cattle was less ‘ideal’, possibly producing
greater stress and consequently more variation in meat quality (i.e. there were only 5% of the cattle
with glycogen levels below the critical threshold for being ‘at-risk of dark cutting’, and no carcases
classified as ‘dark cutters’).
The use of eye thermography also demonstrated a modest association with post slaughter muscle
glycogen. The mechanism whereby increased eye temperature is associated with a decrease in post
slaughter muscle glycogen is assumed to be related to the impact of acute stress affecting body
temperature. However, there was no significant association of eye temperature with cortisol,
glucose or lactate, so further studies are required to determine the mechanism that underpins the
relationship of eye temperature with glycogen. This finding does however offer a potential method
to identify cattle likely to have glycogen levels pre-slaughter (dark cutting) which could potentially be
automated and further research into thermography may be warranted.
Finally, using qualitative behavioural assessment (QBA) we found significant correlation of observers
QBA scores of animal body language with temperament (flight speed) and plasma stress indicators.
Observers distinguished differences in the behavioural expression of cattle that were significantly
correlated to the pattern of habituation to the various handling events during the 100-day feedlot
process. . QBA has previously been applied to cattle during road transport (Stockman et al., 2011;
Stockman et al., 2013) and immediately pre-slaughter without a finishing process (Stockman et al.,
2012); the present study extends the application of QBA to behaviour during the 100-day finishing
process at the feedlot before slaughter. Further experimental assessment of the behavioural
expression of dark cutters pre-slaughter would be beneficial, but requires animals to be sourced that
have a higher likelihood of being stressed pre-slaughter. In the commercial setting, our preliminary
results suggest that screening of cattle using QBA could allow identification of high-fear individuals
during the 100-day finishing process before slaughter, therefore allowing targeted management of
these animals to minimise stress responses. The QBA results also confirm the findings from the
analysis of temperaments and plasma stress indicators in the main study that found that induction
was the more stressful event when compared to slaughter.
6.1 Recommendations
• Few previous studies have reported such a large magnitude in the improvement of
temperament measures over the finishing process (i.e. decrease in cattle flight speeds and
crush scores). This is likely related to the excellent low-stress stock handling of the cattle at
the feedlot and during the pre-slaughter period. These industry examples should be
highlighted as benchmark of low-stress stock handling methodology.
• Based on the prediction data generated in this study, a stress indexing system could be
investigated using blood data collected from a subset of cattle to be used to assess stress
experienced, and the habituation progress, by cattle throughout the finishing process at the
feedlot and at the abattoir.
• Similarly, given that QBA can successfully differentiated between the levels of stress
exhibited by the subset of 30 cattle that mirrored the changes in the whole group, future
work could investigate a more simplified, rapid or automated race-side method for
measuring behavioural expressions of cattle to assess wellbeing.
P.PIP.0743 - The Impact of handling Condition and New Environments on the Stress of Cattle
• A stress indexing and/or QBA-like system incorporating collection of data from a small
number of animals within a group may allow producers or processors to assess animal
wellbeing as a tool in the beef industry to market low stress beef and provide customer
assurance of animal wellbeing throughout the entire feedlot program from induction
through to slaughter. Future work to investigate such an indexing system across a larger
number of feedlots would be required, as well as further detailed analysis of an indexing
model using the current data as an example.
• Although findings from this study indicate environment to be more important than
temperament, given that this study also indicated that cattle of poorer temperament had
reduced growth rates and carcase attributes, temperament, in particular at the time of
induction, should remain an area of future experimental work. For example, cattle that can
be identified at feedlot entry could potentially be managed differently. Further studies
would be required to investigate the usefulness of enrichment programs on the cattle’s
response to stressful situations and also to their growth and carcase performance.
• There are few reliable measures of stress and temperament that can reliably predict cattle
growth and carcass traits and although these measures are useful for describing cattle
stress. The use of eye thermography could offer a potential automated method to identify
cattle likely to have elevated short-term stress levels that may be useful pre-slaughter to
identify potential ‘dark cutters’. However further studies are needed to verify this
application.
P.PIP.0743 - The Impact of handling Condition and New Environments on the Stress of Cattle
7 Key messages
• Cattle under the handling and management strategies utilised at this feedlot showed significant improvement in their temperament over their 100-day feedlot stay. Few studies report such a large magnitude of decrease in cattle flight speeds and crush scores which is likely related to the excellent stock handling of cattle at the feedlot and in the pre-slaughter period.
• The level of stress as measured by a range of blood indicators was considered low to moderate at all time points throughout the 100-day feedlot program and slaughter process.
• Compared to slaughter, cattle having been transported and inducted to the feedlot had a greater magnitude chronic stress response as indicated by markers of immune function, muscle damage, dehydration and feed deprivation. In comparison, the acute measures of stress (cortisol, lactate and glucose) were higher at the time of slaughter compared to induction, likely reflecting the increasing anticipation (short-term psychological stress) of the blood sampling regimen by the cattle over time.
• There were few accurate indicators of cattle growth and carcase characteristics obtained from blood samples and temperament measures collected during the feedlot and pre-slaughter periods. However, one of the most useful indicators of future cattle performance was temperament as measured by flight speed at the time of induction. Cattle with poor temperament at the time of induction were shown to exhibit lower average daily gains, hot carcase weights, and increased shear force, despite habituation to the feedlot environment. These cattle were also more likely to show signs of acute stress at slaughter.
• The use of novel methods for prediction of post-slaughter muscle glycogen such as eye thermography show some promising results. However, it is important to investigate this technique in a larger population of cattle with a range of muscle glycogen with validation of the technique before any conclusion or recommendations can be made.
• Qualitative behavioural assessment (QBA) was able to differentiate between the stress levels of cattle at induction and slaughter and these results aligned well with the results of the blood and temperament indicators. QBA may be a useful adaptation for use at the feedlot and at slaughter to document stress levels of cattle and be used as an auditing system.
• The measurement of flight speed and crush score at induction to the feed lot may be the most useful time at which to assess temperament of cattle as it relates to stress measures at slaughter and some growth and carcase characteristics. Future work could focus on ways of ameliorating the stress of cattle considered to be of poor temperament to improve cattle performance. This could include backgrounding of cattle with poor temperament before entering the feedlot, or altered management within the feedlot.
P.PIP.0743 - The Impact of handling Condition and New Environments on the Stress of Cattle
8 Bibliography
Anderson, B., Watson, D., & Colditz, I. (1999). The effect of dexamethasone on some immunological parameters in cattle. Veterinary research communications, 23(7), 399-413.
Arthington, J., Eicher, S., Kunkle, W., & Martin, F. (2003). Effect of transportation and commingling on the acute-phase protein response, growth, and feed intake of newly weaned beef calves. Journal of Animal Science, 81(5), 1120-1125.
AUS-MEAT. (2005). Handbook of Australian Meat. Brisbane, Australia
Barthelmai, W., & Czok, R. (1962). Enzymatische Bestimmungen der Glucose in Blut, Liquor und Harn. Klinische Wochenschrift, 40(11), 585-589.
Bartolomé, E., Sánchez, M. J., Molina, A., Schaefer, A., Cervantes, I., & Valera, M. (2013). Using eye temperature and heart rate for stress assessment in young horses competing in jumping competitions and its possible influence on sport performance. animal, 7(12), 2044-2053.
Behrends, S., Miller, R., Rouquette Jr, F., Randel, R., Warrington, B., Forbes, T., Welsh, T., Lippke, H., Behrends, J., & Carstens, G. (2009). Relationship of temperament, growth, carcass characteristics and tenderness in beef steers. Meat science, 81(3), 433-438.
Blecha, F., Boyles, S. L., & Riley, J. G. (1984). Shipping Suppresses Lymphocyte Blastogenic Responses in Angus and Brahman× Angus Feeder Calves 1, 2. Journal of Animal Science, 59(3), 576-583.
Burdick, N., Randel, R., Carroll, J., & Welsh, T. (2011). Interactions between temperament, stress, and immune function in cattle. International Journal of Zoology, 2011.
Burrow, H. M., & Corbet, N. J. (1999). Genetic and environmental factors affecting temperament of zebu and zebu-derived beef cattle grazed at pasture in the tropics. Australian Journal of Agricultural Research, 51(1), 155-162. doi: https://doi.org/10.1071/AR99053
Cafe, L. M., Cafe, L. M., Robinson, D. L., Ferguson, D. M., & McIntyre, B. L. Cattle temperament: Persistence of assessments and associations with productivity, efficiency, carcass and meat quality traits. Journal of animal science, 89(5), 1452-1465. doi: 10.2527/jas.2010-3304
Cafe, L. M., Cafe, L. M., Robinson, D. L., Ferguson, D. M., & McIntyre, B. L. (2011). Cattle temperament: Persistence of assessments and associations with productivity, efficiency, carcass and meat quality traits. Journal of animal science, 89(5), 1452-1465. doi: 10.2527/jas.2010-3304
Carlson, T., Fradl, D., Leonard, B., Wentland, S., & Reeve, E. (1977). Fibrinogen synthesis stimulation by prostaglandin E1 and some other vasodilators. American Journal of Physiology-Heart and Circulatory Physiology, 233(1), H1-H19.
Carlson, T., Wentland, S., Leonard, B., Ruder, M., & Reeve, E. (1978). Effects of prostaglandin E2, analogs, fatty acids, and indomethacin on fibrinogen level. American Journal of Physiology-Heart and Circulatory Physiology, 235(2), H223-H230.
Ceciliani, F., Ceron, J., Eckersall, P., & Sauerwein, H. (2012). Acute phase proteins in ruminants. Journal of proteomics, 75(14), 4207-4231.
P.PIP.0743 - The Impact of handling Condition and New Environments on the Stress of Cattle
Chen, Y., Arsenault, R., Napper, S., & Griebel, P. (2015). Models and methods to investigate acute stress responses in cattle. Animals, 5(4), 1268-1295.
Choe, J., & Kim, B. (2014). Association of blood glucose, blood lactate, serum cortisol levels, muscle metabolites, muscle fiber type composition, and pork quality traits. Meat science, 97(2), 137-142.
Cooke, R., Arthington, J., Araujo, D., & Lamb, G. (2009). Effects of acclimation to human interaction on performance, temperament, physiological responses, and pregnancy rates of Brahman-crossbred cows. Journal of animal science, 87(12), 4125-4132.
Cooke, R., & Bohnert, D. (2011). Bovine acute-phase response after corticotrophin-release hormone challenge. Journal of animal science, 89(1), 252-257.
Coombes, S. V., Gardner, G. E., Pethick, D. W., & McGilchrist, P. (2014). The impact of beef cattle temperament assessed using flight speed on muscle glycogen, muscle lactate and plasma lactate concentrations at slaughter. Meat Science, 98(4), 815-821. doi: https://doi.org/10.1016/j.meatsci.2014.06.029
Cray, C., Zaias, J., & Altman, N. H. (2009). Acute Phase Response in Animals: A Review. Comparative Medicine, 59(6), 517-526.
Crookshank, H., Elissalde, M., White, R., Clanton, D., & Smalley, H. (1979). Effect of transportation and handling of calves upon blood serum composition. Journal of Animal Science, 48(3), 430-435.
Curley, K. O., Paschal, J. C., Welsh, T. H., & Randel, R. D. (2006). Technical note: Exit velocity as a measure of cattle temperament is repeatable and associated with serum concentration of cortisol in Brahman bulls1. Journal of Animal Science, 84(11), 3100-3103. doi: 10.2527/jas.2006-055
Daly, B., Gardner, G., Ferguson, D., & Thompson, J. (2006). The effect of time off feed prior to slaughter on muscle glycogen metabolism and rate of pH decline in three different muscles of stimulated and non-stimulated sheep carcasses. Australian Journal of Agricultural Research, 57(11), 1229-1235.
Davis, A., Maney, D., & Maerz, J. (2008). The use of leukocyte profiles to measure stress in vertebrates: a review for ecologists. Functional Ecology, 22(5), 760-772.
Deesinga, M. (1997). Bos lndicus-Cross Feedlot Cattle with Excitable Temperaments have Tougher Meat and a Higher Incidence of Borderline Dark Cutters. Meat Science, 46(4), 367-377.
Ebel, H., & Günther, T. (1980). Magnesium metabolism: a review. Clinical Chemistry and Laboratory Medicine, 18(5), 257-270.
Eckersall, P., Duthie, S., Safi, S., Moffatt, D., Horadagoda, N., Doyle, S., Parton, R., Bennett, D., & Fitzpatrick, J. (1999). An automated biochemical assay for haptoglobin: prevention of interference from albumin. Comparative Haematology International, 9(3), 117-124.
Fazio, E., & Ferlazzo, A. (2003). Evaluation of Stress During Transport. Veterinary Research Communications, 27(1), 519-524. doi: 10.1023/B:VERC.0000014211.87613.d9
Fell, L., Colditz, I., Walker, K., & Watson, D. (1999). Associations between temperament, performance and immune function in cattle entering a commercial feedlot. Australian Journal of Experimental Agriculture, 39(7), 795-802.
P.PIP.0743 - The Impact of handling Condition and New Environments on the Stress of Cattle
Ferguson, D., & Warner, R. (2008). Have we underestimated the impact of pre-slaughter stress on meat quality in ruminants? Meat Science, 80(1), 12-19.
Fisher, A., Niemeyer, D., Lea, J., Lee, C., Paull, D., Reed, M., & Ferguson, D. (2010). The effects of 12, 30, or 48 hours of road transport on the physiological and behavioral responses of sheep. Journal of Animal Science, 88(6), 2144-2152.
Forget, P., Khalifa, C., Defour, J.-P., Latinne, D., Van Pel, M.-C., & De Kock, M. (2017). What is the normal value of the neutrophil-to-lymphocyte ratio? BMC Research Notes, 10, 12. doi: 10.1186/s13104-016-2335-5
Francisco, C., Resende, F., Benatti, J., Castilhos, A., Cooke, R., & Jorge, A. (2015). Impacts of temperament on Nellore cattle: physiological responses, feedlot performance, and carcass characteristics. Journal of animal science, 93(11), 5419-5429.
Giannetto, C., Fazio, F., Casella, S., Marafioti, S., Giudice, E., & Piccione, G. (2011). Acute Phase Protein Response during Road Transportation and Lairage at a Slaughterhouse in Feedlot Beef Cattle. Journal of Veterinary Medical Science, 73(11), 1531-1534. doi: 10.1292/jvms.11-0157
Grandin, T. (1997). Assessment of stress during handling and transport. Journal of animal science, 75(1), 249-257.
Gregory, N. G., & Grandin, T. (1998). Animal welfare and meat science: CABI Pub.
Gruber, S. L., Tatum, J. D., Engle, T. E., & Chapman, P. L. (2010). Relationships of behavioral and physiological symptoms of preslaughter stress to beef longissimus muscle tenderness. Journal of animal science, 88(3), 1148-1159. doi: 10.2527/jas.2009-2183
Hall, N. L., Buchanan, D. S., Anderson, V. L., Ilse, B. R., Carlin, K. R., & Berg, E. P. (2011). Working chute behavior of feedlot cattle can be an indication of cattle temperament and beef carcass composition and quality. Meat science, 89(1), 52-57.
Hemsworth, P. H., Rice, M., Karlen, M. G., Calleja, L., Barnett, J. L., Nash, J., & Coleman, G. J. (2011). Human–animal interactions at abattoirs: Relationships between handling and animal stress in sheep and cattle. Applied animal behaviour science, 135(1), 24-33.
Hogan, J. P., Petherick, J. C., & Phillips, C. J. (2007). The physiological and metabolic impacts on sheep and cattle of feed and water deprivation before and during transport. Nutrition research reviews, 20(1), 17-28.
Hopkins, D., Toohey, E., Warner, R., Kerr, M., & van de Ven, R. (2010). Measuring the shear force of lamb meat cooked from frozen samples: comparison of two laboratories. Animal Production Science, 50(6), 382-385.
Howard, A. (1964). The relation between physiological stress and meat quality. The relation between physiological stress and meat quality., 11-21.
Hubbard, J. I. (1973). Microphysiology of vertebrate neuromuscular transmission. Physiological reviews, 53(3), 674-723.
Immonen, K., Kauffman, R., Schaefer, D., & Puolanne, E. (2000). Glycogen concentrations in bovine longissimus dorsi muscle. Meat Science, 54(2), 163-167.

P.PIP.0743 - The Impact of handling Condition and New Environments on the Stress of Cattle
Jacob, R., Pethick, D., & Chapman, H. (2005). Muscle glycogen concentrations in commercial consignments of Australian lamb measured on farm and post-slaughter after three different lairage periods. Australian Journal of Experimental Agriculture, 45(5), 543-552.
Jacob, R., Pethick, D., Clark, P., D’Souza, D., Hopkins, D., & White, J. (2006). Quantifying the hydration status of lambs in relation to carcass characteristics. Australian Journal of Experimental Agriculture, 46(4), 429-437.
Jarvis, A., Harrington, D., & Cockram, M. (1996). Effect of source and lairage on some behavioural and biochemical measurements of feed restriction and dehydration in cattle at a slaughterhouse. Applied Animal Behaviour Science, 50(1), 83-94.
Jones, M. L., & Allison, R. W. (2007). Evaluation of the ruminant complete blood cell count. Veterinary Clinics of North America: Food Animal Practice, 23(3), 377-402.
Jose, C., McGilchrist, P., Perovic, J. L., Gardner, G. E., & Pethick, D. W. (2015). The economic impact of dark cutting beef in Australia. Paper presented at the International congress of meat science and technology.
Kaneko, J. J., Harvey, J. W., & Bruss, M. (2008). Clinical biochemistry of domestic animals (6th ed.). Amsterdam;Boston;: Academic Press/Elsevier.
Kenny, F. J., & Tarrant, P. V. (1987). The reaction of young bulls to short-haul road transport. Applied Animal Behaviour Science, 17(3), 209-227. doi: https://doi.org/10.1016/0168-1591(87)90147-X
King, D., Pfeiffer, C. S., Randel, R., Welsh Jr, T., Oliphint, R., Baird, B., Curley Jr, K., Vann, R., Hale, D., & Savell, J. (2006). Influence of animal temperament and stress responsiveness on the carcass quality and beef tenderness of feedlot cattle. Meat science, 74(3), 546-556.
Knowles, G. (1999). A review of the road transport of cattle. The Veterinary Record, 144(8), 197. doi: http://dx.doi.org/10.1136/vr.144.8.197
Knowles, T., Warriss, P., Brown, S., Kestin, S., Rhind, S., Edwards, J., Anil, M., & Dolan, S. (1993). Long distance transport of lambs and the time needed for subsequent recovery. Veterinary Record, 133, 286-286.
Lahiri, B., Bagavathiappan, S., Jayakumar, T., & Philip, J. (2012). Medical applications of infrared thermography: a review. Infrared Physics & Technology, 55(4), 221-235.
Lambert, M., Knight, T., Cosgrove, G., Anderson, C., Death, A., & Fisher, A. (1998). Exercise effects on muscle glycogen concentration in beef cattle. Paper presented at the PROCEEDINGS-NEW ZEALAND SOCIETY OF ANIMAL PRODUCTION.
Lomborg, S. R., Nielsen, L. R., Heegaard, P. M., & Jacobsen, S. (2008). Acute phase proteins in cattle after exposure to complex stress. Veterinary research communications, 32(7), 575-582.
Losada-Espinosa, N., Villarroel, M., Maria, G. A., & Miranda-de la Lama, G. C. (2017). Pre-slaughter cattle welfare indicators for use in commercial abattoirs with voluntary monitoring systems: A systematic review. Meat science.
Loudon, K., Lean, I., Pethick, D., Gardner, G., Grubb, L., Evans, A., & McGilchrist, P. (2018). On farm factors increasing dark cutting in pasture finished beef cattle. Meat Science.
P.PIP.0743 - The Impact of handling Condition and New Environments on the Stress of Cattle
Marques, R. S., Cooke, R. F., Francisco, C. L., & Bohnert, D. W. (2012). Effects of twenty-four hour transport or twenty-four hour feed and water deprivation on physiologic and performance responses of feeder cattle1. Journal of Animal Science, 90(13), 5040-5046. doi: 10.2527/jas.2012-5425
Meat and Livestock Australia Ltd. (2006). Module 6. Meat Standards Australia Grading. Meat and Livestock Australia, Sydney, Australia 1-11.
Minka, N., & Ayo, J. (2009). Physiological responses of food animals to road transportation stress. African Journal of Biotechnology, 8(25).
Mitchell, G., Hattingh, J., & Ganhao, M. (1988). Stress in cattle assessed after handling, after transport and after slaughter. Vet Rec, 123(8), 201-205.
Monin, G. (1981). Muscle metabolic type and the DFD condition The problem of dark-cutting in beef (pp. 63-85): Springer.
Müller, R., & von Keyserlingk, M. A. G. (2006). Consistency of flight speed and its correlation to productivity and to personality in Bos taurus beef cattle. Applied Animal Behaviour Science, 99(3), 193-204. doi: https://doi.org/10.1016/j.applanim.2005.05.012
Nicolson, N. A. (2008). Measurement of cortisol. Handbook of physiological research methods in health psychology, 1, 37-74.
Passonneau, J., & Lauderdale, V. (1974). A comparison of three methods of glycogen measurement in tissues. Analytical biochemistry, 60(2), 405-412.
Perry, D., Shorthose, W. R., Ferguson, D. M., & Thompson, J. M. (2001). Methods used in the CRC program for the determination of carcass yield and beef quality. Australian Journal of Experimental Agriculture, 41(7), 953-957. doi: http://dx.doi.org/10.1071/EA00092
Petherick, J., Holroyd, R., Doogan, V., & Venus, B. (2002). Productivity, carcass and meat quality of lot-fed Bos indicus cross steers grouped according to temperament. Australian Journal of Experimental Agriculture, 42(4), 389-398.
Petherick, J. C., Doogan, V. J., Venus, B. K., Holroyd, R. G., & Olsson, P. (2009). Quality of handling and holding yard environment, and beef cattle temperament: 2. Consequences for stress and productivity. Applied Animal Behaviour Science, 120(1), 28-38. doi: https://doi.org/10.1016/j.applanim.2009.05.009
Petry, A., McGilvray, W., Rakhshandeh, A., & Rakhshandeh, A. (2017). Assessment of an alternative technique for measuring body temperature in pigs. Journal of animal science, 95(7), 3270-3274.
Pettiford, S., Ferguson, D., Lea, J., Lee, C., Paull, D., Reed, M., Hinch, G., & Fisher, A. (2008). Effect of loading practices and 6-hour road transport on the physiological responses of yearling cattle. Australian Journal of Experimental Agriculture, 48(7), 1028-1033.
Reynaert, R., Marcus, S., De Paepe, M., & Peeters, G. (1976). Influences of stress, age and sex on serum growth hormone and free fatty acid levels in cattle. Hormone and Metabolic Research, 8(02), 109-114.
Romans, J., Costello, W., Carlson, C., Greaser, M., & Jones, K. (1994). The meat we eat.,(Interstate Publishers, Inc.: Danville, IL).

P.PIP.0743 - The Impact of handling Condition and New Environments on the Stress of Cattle
Russell, K. E., & Roussel, A. J. (2007). Evaluation of the Ruminant Serum Chemistry Profile. Veterinary Clinics of North America: Food Animla Practice, 23, 403-426.
Saco, Y., Fina, M., Giménez, M., Pato, R., Piedrafita, J., & Bassols, A. (2008). Evaluation of serum cortisol, metabolic parameters, acute phase proteins and faecal corticosterone as indicators of stress in cows. The Veterinary Journal, 177(3), 439-441. doi: https://doi.org/10.1016/j.tvjl.2007.05.019
Salamano, G., Mellia, E., Candiani, D., Ingravalle, F., Bruno, R., Ru, G., & Doglione, L. (2008). Changes in haptoglobin, C-reactive protein and pig-MAP during a housing period following long distance transport in swine. The Veterinary Journal, 177(1), 110-115.
Sant’Anna, A. C., & da Costa, M. J. P. (2013). Validity and feasibility of qualitative behavior assessment for the evaluation of Nellore cattle temperament. Livestock Science, 157(1), 254-262.
Schaefer, A., Matthews, L., Cook, N., Webster, J., & Scott, S. (2002). Novel non-invasive measures of animal welfare. Paper presented at the Proceedings of Animal Welfare and Behavior: From Science to Solution; Joint NAWAC/ISAE Conference, Hamilton, New Zealand.
Schonewille, J. T. (2013). Magnesium in dairy cow nutrition: an overview. Plant and soil, 368(1-2), 167-178.
Shaw, F. D., & Tume, R. K. (1992). The assessment of pre-slaughter and slaughter treatments of livestock by measurement of plasma constituents—A review of recent work. Meat Science, 32(3), 311-329. doi: https://doi.org/10.1016/0309-1740(92)90095-L
Smith, B. P. e. (2015). Large animal internal medicine (Fifth ed.). St. Louis, Missouri: Elsevier Mosby.
Stewart, M., Webster, J., Schaefer, A., Cook, N., & Scott, S. (2005). Infrared thermography as a non-invasive tool to study animal welfare. Animal Welfare, 14(4), 319-325.
Stewart, M., Webster, J. R., Stafford, K. J., Schaefer, A. L., & Verkerk, G. A. (2010). Technical note: Effects of an epinephrine infusion on eye temperature and heart rate variability in bull calves. Journal of Dairy Science, 93(11), 5252-5257. doi: https://doi.org/10.3168/jds.2010-3448
Stewart, S., McGilchrist, P., Gardner, G., & Pethick, D. (2017). Lamb loin tenderness is not associated with plasma indicators of pre-slaughter stress. Meat Science.
Stich, V., & Berlan, M. (2004). Physiological regulation of NEFA availability: lipolysis pathway. The Proceedings of the Nutrition Society, 63(2), 369-374. doi: http://dx.doi.org/10.1079/PNS2004350
Stockman, C., Collins, T., Barnes, A., Miller, D., Wickham, S., Beatty, D., Blache, D., Wemelsfelder, F., & Fleming, P. (2011). Qualitative behavioural assessment and quantitative physiological measurement of cattle naïve and habituated to road transport. Animal Production Science, 51(3), 240-249.
Stockman, C. A., Collins, T., Barnes, A. L., Miller, D., Wickham, S. L., Beatty, D. T., Blache, D., Wemelsfelder, F., & Fleming, P. A. (2013). Flooring and driving conditions during road transport influence the behavioural expression of cattle. Applied Animal Behaviour Science, 143(1), 18-30. doi: https://doi.org/10.1016/j.applanim.2012.11.003
Stockman, C. A., McGilchrist, P., Collins, T., Barnes, A. L., Miller, D., Wickham, S. L., Greenwood, P. L., Cafe, L. M., Blache, D., & Wemelsfelder, F. (2012). Qualitative Behavioural Assessment of Angus
P.PIP.0743 - The Impact of handling Condition and New Environments on the Stress of Cattle
steers during pre-slaughter handling and relationship with temperament and physiological responses. Applied Animal Behaviour Science, 142(3), 125-133.
Tarrant, P. (1989). Animal behaviour and environment in the dark-cutting condition in beef-a review. Irish Journal of Food Science and Technology, 1-21.
Tong, A., Schaefer, A., & Jones, S. (1995). Detection of poor quality beef using infrared thermography. Meat Focus Int, 4, 443-445.
Valera, M., Bartolomé, E., Sánchez, M. J., Molina, A., Cook, N., & Schaefer, A. (2012). Changes in eye temperature and stress assessment in horses during show jumping competitions. Journal of Equine Veterinary Science, 32(12), 827-830.
Vann, R., Paschal, J., & Randel, R. (2004). Relationships between measures of temperament and carcass traits in feedlot steers. Paper presented at the JOURNAL OF DAIRY SCIENCE.
Vetters, M. D. D., Engle, T. E., Ahola, J. K., & Grandin, T. (2013). Comparison of flight speed and exit score as measurements of temperament in beef cattle1,2. Journal of Animal Science, 91(1), 374-381. doi: 10.2527/jas.2012-5122
Voisinet, B. D., Grandin, T., Tatum, J. D., O'Connor, S. F., & Struthers, J. J. (1997). Feedlot cattle with calm temperaments have higher average daily gains than cattle with excitable temperaments. Journal of animal science, 75(4), 892-896. doi: 10.2527/1997.754892x
Warner, R., Ferguson, D., Cottrell, J., & Knee, B. (2007). Acute stress induced by the preslaughter use of electric prodders causes tougher beef meat. Australian Journal of Experimental Agriculture, 47(7), 782-788.
Warriss, P., Bevis, E., Brown, S., & Ashby, J. (1989). An examination of potential indices of fasting time in commercially slaughtered sheep. British Veterinary Journal, 145(3), 242-248.
Warriss, P. D. (1984a). The behaviour and blood profile of bulls which produce dark cutting meat. Journal of the Science of Food and Agriculture, 35(8), 863-868.
Warriss, P. D. (1984b). Exsanguination of animals at slaughter and the residual blood content of meat. Veterinary Record, 115(12), 292-295.
Wemelsfelder, F., Hunter, E., Mendl, M. T., & Lawrence, A. B. (2000). The spontaneous qualitative assessment of behavioural expressions in pigs: first explorations of a novel methodology for integrative animal welfare measurement. Applied Animal Behaviour Science, 67(3), 193-215.
Wemelsfelder, F., Hunter, T. E., Mendl, M. T., & Lawrence, A. B. (2001). Assessing the ‘whole animal’: a free choice profiling approach. Animal Behaviour, 62(2), 209-220.
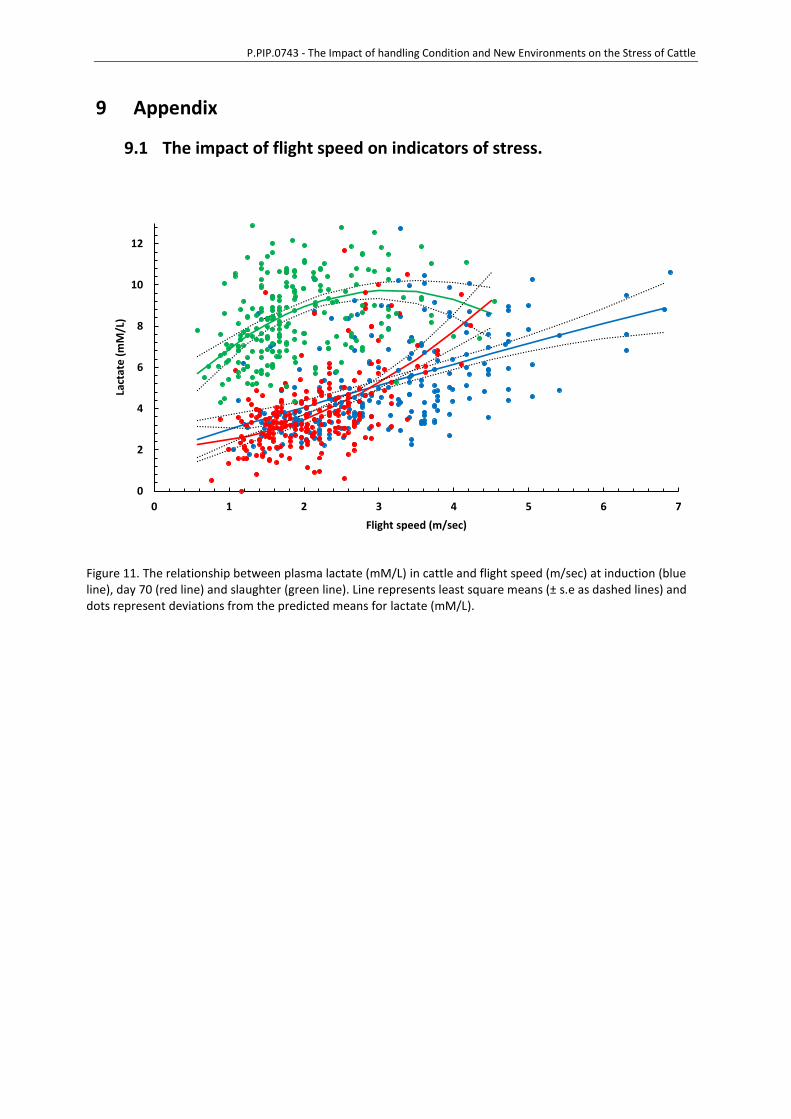
P.PIP.0743 - The Impact of handling Condition and New Environments on the Stress of Cattle
9 Appendix
9.1 The impact of flight speed on indicators of stress.
Figure 11. The relationship between plasma lactate (mM/L) in cattle and flight speed (m/sec) at induction (blue line), day 70 (red line) and slaughter (green line). Line represents least square means (± s.e as dashed lines) and dots represent deviations from the predicted means for lactate (mM/L).
0
2
4
6
8
10
12
0 1 2 3 4 5 6 7
Lact
ate
(m
M/L
)
Flight speed (m/sec)

P.PIP.0743 - The Impact of handling Condition and New Environments on the Stress of Cattle
Figure 12. The relationship between plasma nonetserified fatty acids (mEq/L) in cattle and flight speed (m/sec) at slaughter. Line represents least square means (± s.e as dashed lines) and dots represent deviations from the predicted means for nonetserified fatty acids (mEq/L).
0
0.1
0.2
0.3
0.4
0.5
0.6
0.7
0.8
0 0.5 1 1.5 2 2.5 3 3.5 4 4.5
Pla
sma
no
ne
ste
rifi
ed
fat
ty a
cid
Flight speed m/sec
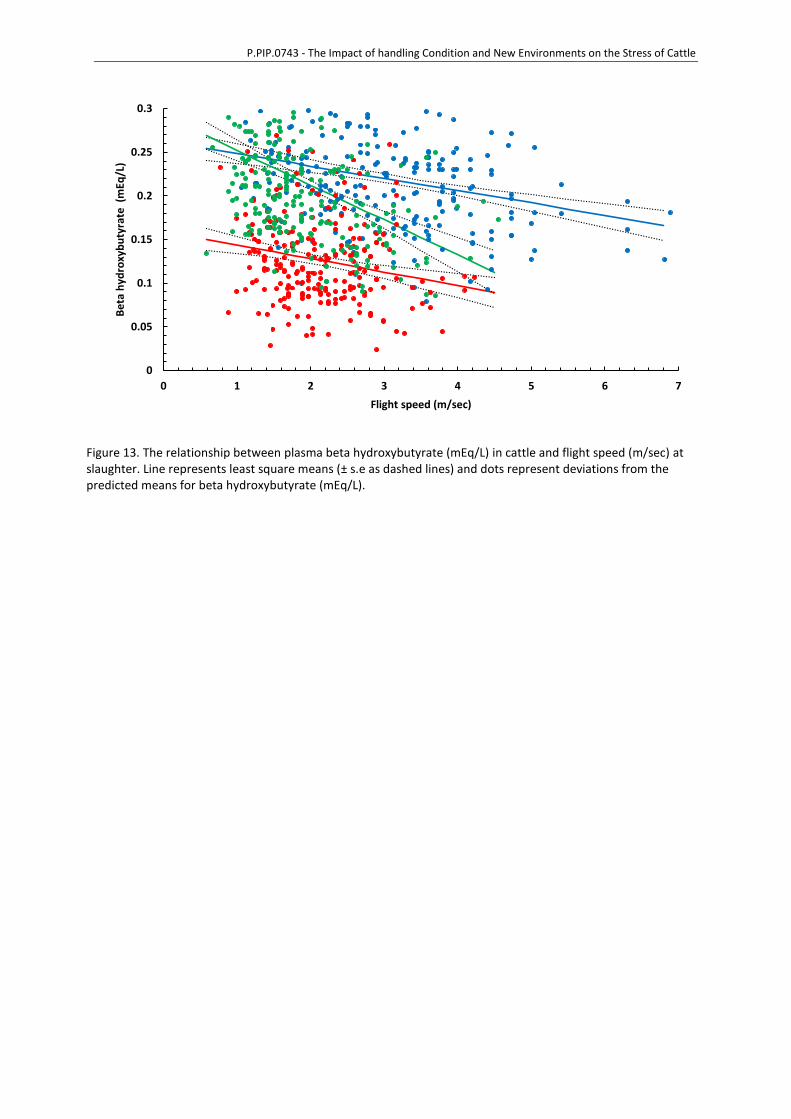
P.PIP.0743 - The Impact of handling Condition and New Environments on the Stress of Cattle
Figure 13. The relationship between plasma beta hydroxybutyrate (mEq/L) in cattle and flight speed (m/sec) at slaughter. Line represents least square means (± s.e as dashed lines) and dots represent deviations from the predicted means for beta hydroxybutyrate (mEq/L).
0
0.05
0.1
0.15
0.2
0.25
0.3
0 1 2 3 4 5 6 7
Be
ta h
ydro
xyb
uty
rate
(m
Eq/L
)
Flight speed (m/sec)
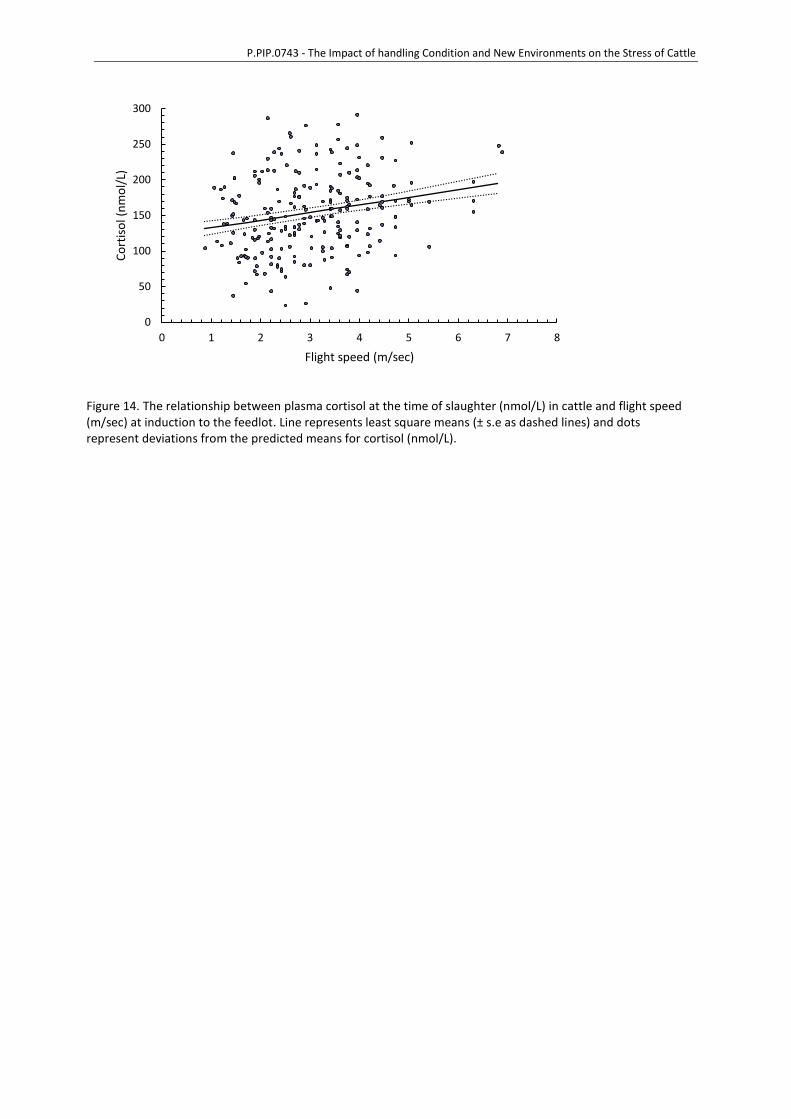
P.PIP.0743 - The Impact of handling Condition and New Environments on the Stress of Cattle
Figure 14. The relationship between plasma cortisol at the time of slaughter (nmol/L) in cattle and flight speed (m/sec) at induction to the feedlot. Line represents least square means (± s.e as dashed lines) and dots represent deviations from the predicted means for cortisol (nmol/L).
0
50
100
150
200
250
300
0 1 2 3 4 5 6 7 8
Co
rtis
ol (
nm
ol/
L)
Flight speed (m/sec)