ml081620254.pdf - nrc.gov
TRANSCRIPT
SHEMS DUNKIEL KASSEL & SAUNDERS P L L C
RONALD A. SHEMS* GEOFFREY H: HANDKAREN L. TYLER
BRIAN S. DUNKIEL** . REBECCA E. BOUCHER_ _ _ _ASSOCIATE ATTORNEYS
JOHN B. KASSEL EILEEN I. ELLIOTT
OF COUNSEL
MARK A. SAUNDERS
ANDREW N. RAUBVOGEL DOCKETEDUSNRC
June 2, 2008June 3, 2008 (8:00am)
Office of the Secretary OFFICE OF SECRETARYAttn: Rulemaking and Adjudications Staff RULEMAKINGS ANDMail Stop O- 16C1 ADJtJDICATIONS STAFF
U.S. Nuclear Regulatory CommissionWashington,'D.C. 20555-0001
Re: In the Matter of Entergy Nuclear Vermont Yankee, LLC and EntergyNuclear Operations, Inc. (Vermont Yankee Nuclear Power Station),Docket No. 50-271-LR, ASLBP No. 06-849-03-LRFiling Discussing A Proprietary Document
Dear Sir or Madam:
Please find enclosed for filing in the above-stated matter New England Coalition, Inc.'sRebuttal Statement of Position, Testimony and Exhibits. One document that Entergy has designatedproprietary is discussed in the rebuttal testimony of Dr: Joram Hopenfeld, Exhibit NEC-JH_63.
This document is:, Letter to James Fitzpatrick from EPRI (February 28, 2000). It is a letter to anEntergy staff person at the Vermont Yankee (VY) plant, stating EPRI's evaluation of the VY FACprogram, and recommending certain changes to that program.
Pursuant to the Protective Order governing this proceeding, an unredacted version of this filingwill be served only on the Board, the NRC's Office of the Secretary, Entergy's Counsel, and thefollowing persons who have signed the Protective Agreement: Sarah Hoffman and Anthony Roisman.A redacted version of this filling will be served on all other parties.
Thank you for your attention to this matter.
Sincerely,
Karen TylerSHEMS DUNKIEL KASSEL & SAUNDERS PLLC
Cc: attached service list
9 I COLLEGE STREET . BURLIN'GTON, VERMONT 0540 I
TEL 802 / 860 1003 • FAX 802 / 850 1208 - www;sdkslaw .com
•Adso admitted in the State of Maine•Also admitted in the District of Columbia
NEW ENGLAND COALITION- INC.'S REBUTTAL EXHIBIT IIST
Exhibit Number
NEC-JH_63
NEC-JH_64
NEC-JH_65
NEC-JH_66
NEC-JH_67
NEC-JH_68
NEC-JH-69
NEC-JH_70
NEC-JH-71
NEC-JH_72
NEC-RH_04
NEC-RH_05
Name of Exhibit
Prefiled Rebuttal Testimony ofJoram Hopenfeld
Electric Power Research Institute ("EPRI"), "Materials ReliabilityProgram: Guidelines for Addressing Fatigue Environmental Effectsin a License Renewal Application (MRP-47, Revision 1)" (September,2005).
EPRI, "R&D Status Report: Nuclear Power Division," EPRiJournal(Qanuary/February 1983): 52-54.
Wire, Gary L. and William J. Mills, "Fatigue Crack Propagation Ratesfor Notched 304 Stainless Steel Specimens in Elevated TemperatureWater," Journal of Pressure Vessel Technology 126 (August 2004): 318-326.
US NRC Docket Numbers 50-247-LR and 50-286-LR, "New'YorkState's Supplemental Citation in Support of Admission of.Contention',26A" (May 22, 2008).
Entergy, "Condition Report: Steam Dryer Inspection Indications,"CR-VTY-2007-02133 (May 28, 2007).
Simonen, Fredric, A. and Stephen R. Gosselin, "Life Prediction andMonitoring of Nuclear Power Plant Components for Service-RelatedDegradation," Journal of Pressure Vessel Technology 123 (February 2001):58-64.
Tennessee Valley Authority, "Memorandum: Sequoyah Nuclear PlanUnits 1 and 2 - Preliminary Report on the Condensate-FeedwaterPiping Inspection - Suspected Erosion-Corrosion Areas" January27, 1987).
Bignold, G.J. et al, "Paper 1," Water Chemisti ii, BNES (1980): 5-18.
Woolsey, I.S. et al, "Paper 96: The Infulence of Oxygen andHydrazine on the Erosion-Corrosion Behaviour and ElectrochemicalPotentials of Carbon Steel under Boiler Feedwater Conditions,"Water Chemisty of Nuclear Reactor SAystems 4 (1986): 337-44.
Prefiled Rebuttal Testimony of Rudolf Hausler
Hausler, Rudolf H., "Flow Assisted Corr6sion (FAC) and FlowInduced Localized Corrosion: Comparison and Discussion" Uune 2,2008).
I UNITED STATESNUCLEAR REGULATORY COMMISSION
ATOMIC SAFETY AND LICENSING BOARD
Before Administrative Judges:
Alex S. Karlin, ChairmanDr. Richard E. Wardwell
Dr. William H. Reed
In the Matter of ))
ENTERGY NUCLEAR VERMONT YANKEE, LLC ) Docket No. 50-271 -LRand ENTERGY NUCLEAR OPERATIONS, INC. ) ASLBP No. 06-849-03-LR
)(Vermont Yankee Nuclear Power Station) )
NEW ENGLAND COALITION, INC.'REBUTTAL STATEMENT OF POSITION
In accordance with 10 C.F.R. § 2.1207(a)(2) and the Atomic Safety and Licensing
Board's ("Board") November 17, 2006 Order,I New England Coalition, Inc. ("NEC") hereby
submits its Rebuttal Statement of Position ("Statement") on NEC's Contentions 2A and 2B
(environmentally-assisted metal fatigue analysis), 3 (steam dryer), and 4 (flow-acceleratedr
corrosion). In support of this Statement, NEC submits the attached rebuttal testimony of Dr.
Joram Hopenfeld2 and Dr. Rudolf Hausler,3 and the Exhibits listed on the attached Rebuttal
Exhibit List.
I. NEC CONTENTIONS 2A AND 2B
Licensing Board Order (Initial Scheduling Order) (Nov. 17, 2006) at 10(D) (unpublished).
2 Exhibit NEC-JH_63.
3 Exhibit NEC-RH_04.
(Environmentally-Assisted Metal Fatigue Analysis)
The evidence contained in Entergy's and the NRC Staff's direct testimony and
exhibits fails to prove the validity of Entergy's CUFen Reanalyses. Indeed, NRC Staff
witness Dr. Chang has testified that the NRC Staff cannot determine the conservatism of
Entergy's analysis, and must therefore rely on Entergy's proposed fatigue monitoring
program to demonstrate its conservatism during the period of extended operation. See"
Chang Rebuttal Testimony at Al10. The Board should therefore decide Contentions 2A
and 2B in NEC's favor. The Board should find that Entergy has failed to satisfy §
54.21(c)(1)(ii) by projecting its environmentally-assisted metal fatigue TLAA to the end
of the period of extended operation, and therefore must now rely, pursuant to* §
54.2 1(c)()(iii), on an aging management program to provide reasonable assurance of
public health and safety. NEC should then be permitted to litigate its Contention 2, now
held in abeyance, which addresses the sufficiency of Entergy's aging management plan
for environmentally-assisted metal fatigue.I7
NEC's rebuttal evidence concerning Contentions 2A and 2B is'contained in the
prefiled rebuttal testimony of Dr. Joram Hopenfeld, Exhibit NEC-JH,_63 at 2-19 and
additional rebuttal Exhibits NEC-JH_64 - NEC-JH_67.
A. The\NRC Staff Misconstrues the ReqUirements of 10 CFR §54.21(c)(1).
The NRC Staff's ("the Staff") Initial Statement of Position misconstrues 10 CFR
§ 54.21 (c)(1). By the Staff's construction of this rule, Entergy could resolve any of
NEC's Contention 2A and 2B criticisms of the CUFen reanalyses through a commitment
to continued "refinement" of these analyses after the close of the ASLB proceeding. The
Staff s position is inconsistent with standard rules of statutory and regulatory'
2

construction, as well as with this Board's treatment of NEC's Contention 2, 2A and 2B in
this proceeding to date. Most importantly, it would defeat the ability of any license
renewal intervenor to litigate an applicant's Time Limited Aging Analysis ("TLAA")
methodology.
Section 54.21 (c)(1) allows a license renewal applicant three options to address an
aging-related health and safety issue that it has evaluated under its current license
through analysis that involves time-limited assumptions. It reads as follows:
(c). An evaluation of time-limited aging analyses.
(1) A list of time-limited aging analyses, as defined in § 54.3, must be provided.
The applicant shall demonstrate that -
(i) The analyses remain valid for the period of extended operation;(ii) The analyses have been-projected to the end of the period of extendedoperation; or(iii) The effects of aging on the intended function(s) will be adequatelymanaged for the period of extended operation.
2N
10 CFR § 54.21 (c). Under § 54.21 (c)(1)(i), the applicant may demonstrate that the>
analysis performed under its current license is valid for the period of extended operation.
If the applicant is unable to satisfy § 54.21(c)(1)(i), it may project the analysis to the end
of the periodof extended operation under § 54.21 (c)(1)(ii). Finally, if the applicant is
unable to demonstrate reasonable assurance of public health and safety through a TLAA
analysis under § 54.21 (c)(i) or § 54.21 (c)(ii), it must then develop an aging management
,plan under § 54.21 (c)(1)(iii).
Entergy's CUFen reanalyses are properly subject to 10 CFR § 54.21 (c)(1)(ii) -
Entergy has performed these reanalyses in an attempt to demonstrate that its CUFen
TLAA has been projected to the end of the period of extended operation. This was the
3
NRC Staff s view in August, 2007. Then, the Staff rejected Entergy's license renewal
commitment to complete its CUFen reanalyses prior to entering the period of extended
operation on grounds that "in order to meet the requirements of 10 CFR § 54.21 (c)(1), an
applicant for license renewal must demonstrate in the LRA that the evaluation of the
time-limited aging analyses (TLAA) has been completed." See, Exhibit NEC-JH_62 at
Enclosure 2.
Now, however, the NRC Staff takes the position that Entergy's CUFen
Reanalyses constitute a "corrective action" to "manage the effects of aging" that falls
under 10 CFR 54.21 (c)(1)(iii). The Staff has thus reversed its view of when Entergy
must complete its CUFen reanalyses. It is now the Staff s opinion that Entergy may
perform the CUFen Reanalysis as part of its aging management program after its license
renewal application is granted, possibly even during the period of extended operation.
The Staff explains:
If a licensee chooses to satisfy § 54.21 (c)(1)(i) or (ii), the 'demonstration'must be in the LRA, and a commitment to perform analyses projecting 60-year CUFs prior to the period of extended operation is inconsistent withthe regulatory language. However, if the licensee chooses to satisfy §54.21 (c)(1)(iii), the licensee must instead demonstrate that effects of agingwill be adequately managed and a commitment to perform refined CUFanalyses in the future as part of an aging management program isacceptable.
NRC Staff Initial Statement of Position at 1 I-12 (emphasis'in original).
The Staff's interpretation of § 54.21 (c)(1) is inconsistent with its plain language,
and with standard rules of construction. Part 54.21 (c)(1)(iii) is properly interpreted as a
requirement to manage aging in the event the TLAA cannot be projected to the end of the
license renewal period. In other words, an applicant may avoid the obligation to develop
an aging management plan un/der § 54.21 (c)(1)(iii) if it satisfies § 54.21 (c)(1)(i) or
4
54.21 (c)(l)(ii) by including a demonstration that the TLAA is either valid or can be
projected for the period of extended operation in the LRA. Under the NRC Staff s
construction, parts 54.21(c)(1)(i) and 54.21(c)(1)(ii) collapse into part 54.21(c)(1)(iii):
that is, the TLAA demonstration becomes a component of the aging management plan,
instead of a means to avoid the obligation to develop an aging management plan. The
Staff's construction is therefore invalid. Cf Dunn v. CFTC, 519 U.S. 465, 472, 473, 117
S.Ct. 913, 137 L.Ed.2d 93 (1997) (rejecting an interpretation of a statute that would have
left part of it "without any significant effect at all," because "legislative enactments
should not be construed to render their provisions mere surplusage.").
The Staff's interpretation is also inconsistent withthe Board's interpretation of
NEC's Contentions 2, 2A and 2B in this proceeding to/date, which treats Entergy's
CUFen reanalyses as distinct from its metal fatigue aging management plan, and as an
alternative to a management plan. The Board ruled that NEC's Contention 2 addresses
the sufficiency of the metal fatigue) management program. It held Contention 2 in
abeyance, to be litigated only if NEC prevails on Contentions 2A and 2B, and Entergy
then reverts to reliance on fatigue management. The Board's Order of November 7, 2007
reads in relevant part as follows:
When this litigation began, Entergy's application showed certain CUFs tobe greater than unity, and Entergy indicated that it would manage suchmetal fatigue over the 20-year renewal period. NEC's original Contention2 challenged the adequacy of Entergy s demonstration of its metal fatiguemanagement program. Now Entergy says it has recalculated the CUFs toshow that they are all less than 1, thus eliminating the need to managemetal fatigue over the renewal period. NEC Contention 2A challengesEntergy's recalculation of the CUFs. If NEC Contention 2 is successfuland Entergy's revised CUF analyses are not shown to be sufficient, thenEntergy might return to relying on a fatigue management program as away of satisfying the Part 54 regulations.
5

*Thus, we conclude that NEC Contention 2A will be litigated now,and NEC Contention 2 will be held in abeyance. The proviso is that theparties are not to litigate Contention 2 unless and until Entergy returns toreliance on a metal fatigue management program (as would likely happenif NEC prevails on NEC Contention 2A).
Memorandum and Order (Ruling on NEC Motions to File and Admit New Contention),
November 7, 2007 at 12.
Finally, the Staff's position that Entergy's environmentally-assisted metal fatigue
TLAA analysis should be treated as a component of its metal fatigue aging management/
plan under § 54.21 (c)(1)(iii) has significant consequences for the rights of NEC and other
license renewal intervenors to obtain information about and contest the validity of
TLAAs. Per the Staff's view, the applicant may comply with § 54.21 through a
commitment to perform the TLAA analysis after the application is granted, an approach
that will obviously frustrate public scrutiny of the TLAA methodology.
These consequences are already playing out in the ASLB proceeding concerning
Entergy's license renewal application for the Indian Point plant, in which both the State
of New York and Riverkeeper, Inc. have petitioned for admission of a con-tention similarJ /
to NEC's Contention 2. Entergy hastaken the positions that it should not be required to
provide a information about its CUFen analyses for the NUREG/CR-6260 locations
until after the close of the ASLB proceeding, and the Staff should accept a commitment
to perform CUFen analyses as part of the Fatigue Monitoring Program per 10 CFR §
54.21 (e)(1)(iii); See, Exhibit NEC-JH-67 at Attachment 1, Enclosure 2, (see discussion
of D-RAI 4.3.1.8-1 and D-RAI 4.3.1.8-2). The NRC Staff has apparently acquiesced in
•Entergy's effort to avoid public scrutiny of its CUFen methodology, and withdrew
requests for this information. Id.
6
The Board should reject'the Staff's interpretation of 10 CFR § 54.21(c)(1). It should
find that Entergy's CUFen Reanalyses fall under § 54.21 (c)(1)(ii), and must be completed
as part of Entergy's License Renewal Application. The Board should further find that
Entergy cannot satisfy § 54.21 (c)(1) with a license renewal commitment to fix any
problems in its CUFen Reanalyses, demonstrate the conservatism of those analyses, or
finish those analyses after the close of the ASLB proceeding.
B. Enterly's Evidence Does Not Include Information Necessary toValidate its CUFen Reanalyses; Enteray Therefore Fails to Satisfy itsBurden of Proof.
Dr. Hopenfeld testifies that Entergy has not provided to NEC or filed in the
evidentiary record before the Board the following information necessary to validate its
CUFen Reanalyses:
I. Drawings of the VY plant piping from which it would be possibleto validate Entergy's assumptions of uniform heat transfer distribution,including orientation angles, weld locations and internal diameters,Hopenfeld Rebuttal at A18, Exhibit NEC-JH_03 at 8;
2. A complete description of the methods or models used todetermine velocities and temperatures during transients, HopenfeldRebuttal at A19, Exhibit NEC-JH_03at 9; and
3. Information regarding exactly how the number of plant transientcycles was determined for purposes of the 60-year CUF calculations, fromwhich it would be possible to evaluate the conservatism of the cycle count,Hopenfeld Rebuttal at A2 1.
Regarding the first two issues, Entergy represents that some information was
provided: 36 drawings, a copy of the Design Information Record, and some information
regarding the calculation of flow velocity in response to Counsel's inquiry. Entergy
Initial Statement of Position at 14. Dr. Hopenfeld testifies that the information Entergy
provided is insufficient. Hopenfeld Rebuttal at A18 and A19.
7
Entergy further faults NEC for failing to request any additional information it
considered necessary to a complete evaluation of the CUFen analyses in "discovery." Id.
This argument of course ignores the fact that, to its tremendous disadvantage, NEC has
no right to formal discovery in this Subpart L proceeding. See, 10 CFR § 1.1203,
Hearing file; prohibition on discovery; In the Matter of Entergy Nuclear Vermont Yankee,
LLC, and Entergy Nuclear Operations, Inc. (Vermont Yankee Nuclear Power Station), 64
NRC 131, 202, ASLBP 06-849-03-LR, (September 22, 2006)("under the 'informal'
adjudicatory procedures of Subpart L, discovery is prohibited except for certain
mandatory disclosures.").
More importantly, Entergy's argument that NEC should have requested
information in fictitious "discovery" misses the point. Entergy has the burden of proof
regarding whether its CUFen reanalyses satisfy 10 CFR § '54.2 1(c)(1)(ii), and provide
reasonable assurance of public health and safety. Entergy does not even attempt to
.explain why its record evidence concerning the VY pipe configuration and the methods
or models it used to determine velocities and temperatures during transients is sufficient
to validate its CUFen reanalyses. Entergy therefore fails to meet its burden.
With respect to the third issue above, the transient cycle count, Dr. Hopenfeld
testifies that the explanation stated in Entergy's direct testimony of its means of
determining the number of plant transients for purposes of its CUF calculations-is
inconsistent with information Entergy provided in-its LRA and in the reports of the
CUFen analyses produced to NEC. Hopefifeld Rebuttal at A21. Entergy's direct
testimony on this subject is vague, and does not indicate that an allowance was made for
the likely increase in plant transients resulting from the 20 percent power uprate or the
8
fact that the number of plant transients is likely to ihcrease as a plant ages. Id. Dr.
Hopenfeld is unabl&eto determine whether Entergy's transient cycle count is conservative.
Id.
The NRC Staff's Initial Statement of Position misrepresents the testimony of
NRC Staff witness Dr. Chang with respect to the transient cycle count. -The Statement of
Position represents that the Staff "disagrees with NEC's assertion that Entergy's
assumptions about the number of transients in its analyses are not conservative," and
states that "[t]he Staff's position is that Entergy's assumptions are appropriate." NRC
Staff Initial Statement of Position at 18. In fact and to' the contrary, Dr. Chang testifies
that the staff, like Dr. Hopenfeld, "cannot determine the level of conservatism regarding
the number of transient cycles at this time," and therefore relies on Entergy's Fatigue
Monitoring Program to "ensure that the cycle projection is valid and that the fatiaue
analysis results are conservative." Chang Rebuttal at A1O (emphasis added).
Thus, per the testimony of NRC Staff witness Dr. Chang, Entergy has not
provided information to the NRC, or filed evidence before the Board, from which it is
possible to determine whether its CUFen analysis results are conservative. Again,
Entergy has not satisfied its burden of proof, and the Board must decide Contentions 2AI, /
and 2B in NEC's favor.
C. Calculation of the Fen Multiplier
1. The NRC Staff and Entergy are Incorrect that the ASME Code DoesNot Require the Fen Correction.
Both Entergy and the NRC Staff contend that the ASME Code does not require
any accounting for the effects of coolant environment on component fatigue life. This is
incorrect. The Code requires that the code user must account for conditions in which
9

the environment is more aggressive than air. Rebuttal Testimony of Joram Hopenfeld at
A5, citing, ASME Code, Appendix B at B-2 13 1.
2. NRC Staff guidance that sanctions use of the equations andprocedure described in NUREG/CR-6583 and NUREG/CR-5704 tocalculate Fen multipliers is not dispositive. The Staff must prove thevalidity of this guidance, but has not done so.
In response to Dr. Hopenfeld's argument that Entergy used outdated statistical
equations published in NUREG/CR-6583 and NUREG/CR-5704 to calculate Fen values,
when it should have instead considered data much more recently published in
NUREG/CR-6909 (February 2007), both the NRC Staff and Entergy cite NRC guidance
stated in Section X.MI of the GALL Report, NUREG-1801, Vol. 1, which sanctions use
of the NUREG/CR-6583 and NUREG/CR-5704 equations to calculate Fen multipliers.
Entergy and the Staff also note that Regulatory Guide 1.207 recommends reference to
NUREG/CR-6909 only for fatigue analyses in new reactors.
These guidance documents are by no means dispositive of NEC's criticisms of
Entergy's method of calculating Fen values. "Agency interpretations and policies are not
'carved in stone' but must rather be subject to re-evaluation of their wisdom on a
continuing basis." Kansas Gas and Electric Co. (Wolf Creek Generating Station, Unit 1),
49 NRC 441, 460 (1999), citing, Chevron USA, Inc. v. Natural Resources Defense
Council, "Inc., 467 U.S. 837, 863-64 (1984)).
The GALL report and Regulatory Guide 1.207 do not contain legally binding
regulatory requirements. The Summary and Introduction to NUREG- 1801, Vol. 1/
includes the following explanation of its legal status:
10
Legally binding regulatory requirements are stated only in laws; NRCregulations; licenses, including technical specifications; or orders, not inNUREG series publications.
The GALL report is a technical basis document to the SRP-LR, whichprovides the Staff with Guidance in reviewing a license renewalapplication .... The Staff should also review information that is notaddressed in the GALL report or ik otherwise differentfriom that in'theGALL report.
NUREG-1801, Vol. 1, Summary, Introduction, Application of the GALL Report
(emphasis added). Likewise, the face page to Regulatory Guide 1.207 states the
following: "Regulatory Guides are not substitutes for regulations, and compliance with
them is not required." Regulatory Guide 1.207; See also, In the Matter of International
Uranium (USA) Corporation, 51 NRC 9, 19 (2000) ("[NRC NUREGS, Regulatory
-Guides, and Guidance documents] are routine agency policy pronouncements that do not
carry the binding effect of regulations...
NUREG-1801, Vol. 1 and Regulatory Guide 1.207 do not preclude this Board
from considering the question at the heart of NEC's Contentions 2A and 2B: What is the
most appropriate method of calculating the effect's of the environment on fatigue?
[NUREGs] do not rise to the level of regulatory requirements. Neither do,they constitute the only means of meeting applicable regulatoryrequirements.... Generally speaking,.., such guidance is treatedsimply as evidence of legitimate means for complying with regulatoryrequirements, and the staff is required to demonstrate the validity of itsguidance if it is called into question during the course of litigation.
In the Matter of Carolina Power & Light Company and North Carolina Eastern
Municipal Power Agency (Shearon Harris Nuclear Power Plant), 23 NRC 294 (1986),
citing, Metropolitan Edison Co. (Three Mile Island Nuclear Station, Unit 1), 16 NRC
1290, 1298-99 (1982) (emphasis added); See also, In the Matter of Connecticut Yankee
11

Atomic Power Company (Haddam Neck Point), 54 NRC 177, 184 (2001), citing, Long
Island Lighting Co. (Shoreham Nuclear Power Station, Unit 1), 28 NRC 288, 290
(1 988)("NUREGs and similar documents are akin to 'regulatory guides.' That is, they
provide guidanice for the Staff's review, but set neither minimum nor maximum
regulatory requirements."); In the Matter of Private Fuel Storage, LLC, 57 NRC 69, 92
(2003)("[A]n intervenor, though not allowed to challenge duly promulgated Commission
regulations in the hearing process... is free to-take issue with ... NRC Staff guidance
and thinking .....
The Staff is required in this proceeding to prove the &urrent validity of its
guidance concerning the calculation of Fen multipliers, but has produced little if any
evidence of this. Entergy and the NRC Staff offer only one substantive reason 4 for use of
the NUREG/CR-6583 and NUREG/CR-5704 equations over information contained in
NUREG/CR-6909: both contend that the NUREG/CR-6909 "procedure" is less
conservative and will generally producelower Fen multipliers for operating reactors.
See, Fair Rebuttal at A5 and A6, Stevens Rebuttal at A50. Dr. Hopenfeld explains that
the overall NUREG/CR-6909 "procedure" could be considered less conservative because
NUREG/CR-6909 contains new air fatigue curves thiat are less conservative that the
current ASME Code fatigue curves. Hopenfeld Rebuttal at A6. He further testifies,
however, that he has never recommended use of these new air fatigue curves. Until the
current fatigue curves in the Code are officially modified, these curves must be
considered the "best representation of fatigue life in air." Id.
/
4 The Staff also offers a nonsubstantive reason: i.e., that it would be inconvenient to change its guidancewhile a number of license renewal applications are pending or anticipated.'
12
Dr. Hopenfeld explains that the alleged greater conservatism of the NUREG/CR-
6583 and NUREG/CR-5704 "procedure" is irrelevant to his main point about how
Entergy should have used information contained in NUREG/CR-6909 in its CUFen
analyses. Hopenfeld Rebuttal at A6, A7. As Dr. Hopenfeld has previously testified, \
NUREG/CR-6909 describes many factors known to affect fatigue life that are not
accounted for in the ANL 1998 Equations contained in NUREG/CR-6583 and
NUREG/CR-5704. Dr. Hopenfeld's rebuttal testimony provides a summary of these
factors at A5, Table I', and observes that Entergy's direct testimony addresses only one of
them, surface finish. Hopenfeld Rebuttal at A5. This is the relevant information Entergy
should have taken from NUREG/CR-6909. Hopenfeld Rebuttal at A7. Entergy and
NRC staff witnesses fail to explain why this information contained in NUREG/CR-6909,
published after the GALL report, should beignored in the license renewal process.
Dr. Hopenfeld testifies that, given the current state of the technology, it simply is
not possible to calculate Fen multipliers that are precision-adjusted to plant conditions, as
Entergy purports to have done. Hopenfeld Rebuttal at A7. Given the many uncertainties
in the calculation of Fen, he recommends use of bounding values contained in
NUREG/CR-6909 - 12 for austenitic stainless steel and 17 for carbon and low alloy steel.
Id.
3. NEC's Rebuttal Evidence Concerning Calculation of Fen Multipliers
NEC witness Dr. Joram Hopenfeld's rebuttal testimony addresses the following,7 t
additional technical issues regarding the calculation the Fen multipliers raised by Entergy
and the NRC Staff.
13
N Dr. Hopenfeld disagrees with NRC witness Dr. Chang that Fen values of
12 for austenitic stainless 17 for carbon and low alloy steel represent a "worst case
scenario," or that application of these values is unreasonably conservative. Hopenfeld
Rebuttal at A9.
" Dr. Hopenfeld disagrees with Entergy witness Mr. Stevens that Fen=] 7
applies only to high oxygen and temperature environments that do not exist at VYNPS.
Hopenfeld Rebuttal at A 10.
N Dr. Hopenfeld does-not agree with Entergy and NRC Staff witnesses that
any lack of conservatism in Fen values calculated by the ANL 1998 Equations is
counterbalanced by excess conservatism in the ASME Code design fatigue curves. He
observes that there is no general agreement among researchers that the current Code is
conservative. Hopenfeld Rebuttal at A 12.
E Dr. Hopenfeld disagrees with Entergy witness Mr. Fitzpatrick that Entergy
properly accounted for surface roughness effects through use of ASME Code design
fatigue curves that include a "safety factor" to account for these effects. Hopenfeld
Rebuttal at A 13.
E Dr. Hopenfeld disagrees with Entergy witness Mr. Fitzpatrick that Entergy
has demonstrated its use of bounding values for oxygen as an input to the ANL equations
in all its CUFen analyses. Hopenfeld Rebuttal at A14. Mr. Fitzpatrick refers to steady
state values as determined by a computer Code called BWRVIA that Entergy has neither
described nor provided to NEC. Id. Mr. Fitzpatrick does not address the impact on Fen
of oxygen concentrations that occur during transients at higher levels than at steady state.
Id.
14
* Dr. Hopenfeld testifies that it was inappropriate for Entergy to exclude a
correction factor for cracking in the cladding and base metal of the feedwater nozzles
based on results of its 2007 inspection of these nozzles for cracks in the base metal.
Hopenfeld Rebuttal at A 15.
D. Calculation of 60-Year CUFs
NEC witness Dr. Joram Hopenfeld's rebuttal testimony addresses the following
issues, in addition to the above-discussed potential lack of conservatism in projecting
transient cycles, regarding the calculation the 60-year CUFs raised by Entergy and the
NRC Staff.
0 Dr. Hopenfeld disagrees that Entergy's CUFen analyses properly applied a
heat transfer equation that applies only to a fully developed turbulent flow to the VYNPS
nozzles. Specifically, he disagrees with Entergy witness Mr. Stevens that flow in the
feedwater nozzle is fully developed because the upstream horizontal pipe is 48 inches
long. Hopenfeld Rebuttal at A16. Dr. Hopenfeld further observes that Mr. Stevens did
not explain why, in transients where the flow stops and heat transfer occurs by naturalK
convection, a correction was not made for circumferential variation of the heat transfer.
both during single phase flow and during condensation. Id.
E Dr. Hopenfeld disagrees with Entergy witness Mr. Stevens that it i's
unnecessary to correct a heat transfer equation used in the CUFen Reanalyses by the ratio
of the viscosities evaluated at the bulk and wall temperatures during each transient
because there are minimal differences in temperature between the pipe wall and the bulk
of the fluid. Hopenfeld Rebuttal at A17. Mr. Stevens did not quantify actual temperature
15
differences, which could only be determined from data on wall and bulk fluid
temperature histories for sample transients. Id. Such information was not provided. Id.Nt
M Dr. Hopenfeld disagrees that Entergy's use of the simplified Green's
Function methodology in its Initial CUFen Reanalysis introduced only a small error.
Hopenfeld Rebuttal at A20. Entergy has neither explained nor investigated the physical
reasons for discrepancies between results 6btained by the Green's Function methodology
and the more exact methodology, classic NB-3200 analysis. Id. Results obtained by the
Green's Function methodology therefore incorporate unquantified uncertainties. Id.
E. Error Analysis
NEC witness Dr. Joram Hopenfeld's rebuttal testimony addresses the following
issues regarding the need for error analysis raised by Entergy and the NRC Staff.a Dr. Hopenfeld disagrees with Entergy's witness that it was not necessary
to perform an error analysis to validate its analytical techniques because the stress
analysis is based on bounding values. Hopenfeld rebuttal at A23.
0 Dr. Hopenfeld disagrees with NRC witness Dr. Chang that an error
analysis was unnecessary because of conservatism built into the ASME Code and the
ANL 1998 Equations. Hopenfeld Rebuttal at A24.
Ill. NEC CONTENTION 3 (Steam Dryer)
NEC's rebuttal evidence concerning Contention 3 is contained in the prefiled
rebuttal testimony ofDr. Joram Hopenfeld, Exhibit NEC-JH_63 at•20-24, and additional
rebuttal Exhibits NEC-JH_68 and NEC-JH'69.
A. The Issue Before the Board is Whether a Steam Dryer AgingManagement Plan Uninformed by Knowledge of Stress Loads on the
16
Dryer for Comparison to Fatigue Limits is Adequate to ProvideReasonable Assurance, of Public Safety.
The validity of the steam dryer stress load modeling Entergy conducted during
implementation of the VY power uprate as a basis for Entergy's steam dryer aging
management plan during the period of extended operations has not been litigated in this
proceeding or otherwise established. The Board has ruled that the assessment of this
modeling conducted during the EPU proceeding was not dispositive for purposes of life
extension:
Entergy's apparent assertion that the history of the steam dryer issue in theseparate EPU proceeding should resolve the issue in this proceeding is...without foundation. As demonstrated by Entergy's own pleadings,.steamdryer issues were addressed in the EPU proceeding primarily in regard tothe power ascension toward EPU levels and the first few operating cyclesthereafter.
In the Matter of Entergy Nuclear Vermont Yankee, LLC, and Entergy Nuclear
Operations, Inc.-(Vermont Yankee Nuclear Power Station), 64 NRC 131, 189
(September 22, 2006).
Moreover, Entergy represented in its Motion for Summary Disposition of NEC's
Contention 3 that its steam dryer aging management program will consist exclusively of
periodic visual inspection and monitoring of plant parameters as described in General
Electric Service Information Letter 644 (GE-SIL-644), will not involve the use of any
analytical tool to estimate stress loads on the steam dryer, and will not rely on the finite
element modeling conducted prior to implementation of the extended power uprate
(EPU) in 2006 for knowledge of steam dryer stress loads.
In partially granting Entergy's Motion for Summary Disposition, the Board
accepted Entergy's representation that its steam dryer aging management plan would not
17
rely on the pre-EPU steam dryer modeling. Memorandum and Order (Ruling on Motion
for Summary Disposition of NEC Contention 3), September 11,2007 at 10 ("Entergy's
expert confirms that this program does not require the use of the CFD and ACM
computer codes or the finite element modeling conducted during the EPU."). In doing
so, the Board rejected NEC's argument that it should be permitted to litigate the validity
of the EPU steam drer modeling as the basis for aging management. NEC's pleading in
opposition to Entergy's Motion for Summary Disposition stated the following regarding
this issue:
As stated in the attached Third Declaration of Dr. Joram Hopenfeld,Entergy's claim that its steam dryer aging management program will notinvolve any means of estimating and predicting stress loads on the dryersimply is not credible. Exhibit 1, Third Declaration of Dr. JoramHopenfeld ("Hopenfeld Declaraition 3") ¶ 6. A valid steam dryer agingmanagement program must include some means of estimating andpredicting stress loads on the steam dryer, and determining that peak loadswill fall below ASME fatigue limits. Hopenfeld Declaration ¶ 5.
Entergy represents that it did conduct this analysis as part of the, VermontYankee EPU power ascension testing using the ACM and CFD models.Hoffman Declaration ¶¶ 11-13. Entergy now proposes sole reliance onvisual inspection and plant parameter monitoring during the renewedlicense period. Such reliance must be based on Entergy's previousACM/CFD-based predictions that stress loads on the dryer will not causefatigue failures. Hopenfeld Declaration ¶ 7. NEC's concerns regardingthe validity of the ACM and CFD models and the stress and fatigueanalysis Entergy conducted using these models therefore remain currentand relevant.
New England Coalition, Inc.'s Opposition to Entergy's Motion for Summary Disposition
of NEC's Contention 3 (Steam Dryer) (May 9, 2007) at 4.
Both Entergy and the NRC Staff now contend that Entergy's steam dryer aging
management program does in fact rely on the steam dryer modeling conducted during EPU
implementation for knowledge of dryer stress loads. See, Entergy Initial Statement of
18

Position at 32 ("[T]he loadings on the dryer derive from plant geometries ... that have not
changed since the uprate was implemented, so there has been no change to the loadings on
the dryer and the resulting stresses. Therefore, there is no reason, to provide continued
instrumentation to measure loadings or further analytical efforts."); NRC Staff Initial
Statement of Position at 19 (The Staff's position is that stress analysis as a means of
estimating and predicting stress loads during operations "is not necessary because the results
of the EPU power ascension program demonstrated that the pressure loads during the EPU
operations do not result in stress on the steam dryer that exceed ASME fatigue stress
limits."). r
In light of the above-discussed procedural history, and Entergy's prior
representations, the Board must disregard these current contentions that the modeling of the
dryer during the EPU power ascension program is a proper basis for aging management.
This issue has not been determined, and the Board took it off the table in its decision of
Entergy's Motion for Summary Disposition. The issue now properly before the Board is
whether an aging management plan that consists solely of plant parameter monitoring, and
partial visual inspection, uninformed by knowledge of dryer loading, can provide reasoriable
assurance of public safety.
B. Hopenfeld Rebuttal
Dr. Joram Hopenfeld provides the following rebuttal testimony regarding the
above-stated issue properly before the Board.
N Dr. Hopenfeld testifies that the ability to estimate the probability of
formation of loose parts requires knowledge of the cyclic loads on the dryer'to ensure that
19
the dryer is not subjected to cyclic stress that would exceed the endurance limit.
Hopenfeld Rebuttal at A28.
\ Dr. Hopenfeld observes that Mr. Hoffman and Mr. Lukens do not provide
a single quantitative assessment in support of this position, discussed in A56-62 of their
testimony, that the inspection programs at VY ensure that the dryer will not fail. Id.
a Dr. Hopenfeld disagrees with Entergy witness Mr. Lukens that "operating
experience after the EPU (exemplified by the data collected during the 2007 inspection
and the subsequent year of monitoring of plant operating parameters) demonstrates that
the stresses experienced by the dryer are insufficient to initiate and propagate fatigue
cracks." Hopenfeld Rebuttal at A29.
0 Dr. Hopenfeld provides a section of the Entergy Condition Report
previously filed as Exhibit NEC-JH_59 that includes General Electric's statement that
"continued [steam dryer crack] growth-by fati'gue cannot be ruled out." This section of
the Condition Report was previously inadvertently excluded due to a clerical error.
Hopenfeld Rebuttal at A29. Dr.,Hopenfeld also disagrees with Entergy witness Mr.
Lukens that theinspection photographs provided in Entergy's Condition Report, Exhibit.
NEC-JH59 at 2-8, show that the cracks are inactive. Metallographic examinations would
be required to demonstrate this, not remote camera photos. Hopenfeld Rebuttal at A3 1.
0 Dr. Hopenfeld observes that IGSCC cracks that now exist in the VY steam
dryer can provide sites for corrosion attack which would in turn accelerate crack growth
under cycling loading. The rate of crack propagation would depend on load intensities
and duration. Id.
20
0 Dr. Hopenfeld disagrees with Entergy witness Mr. Hoffman that design
basis loads ("DBA") cannot cause dryer failure. Hopenfeld Rebuttal at A32.
[ Dr. Hopenfeld disagrees with Entergy witness Mr. Hoffman that it is not
necessary to estimate and predict dryer stresses because "[c]onfirmation that stresses on
the VY steam dryer remain within fatigue limits is provideddaily by the fact that the)
dryer has been able to withstand without damage the increased loads imparted on it
during power ascension and for the two years of operation since EPU was implemented."
Hopenfeld Rebuttal at A33. Vibration fatigue is a time-related phenomenon; the fact that
the dryer has not failed to date is not at all an indication that it will not fail in the future.
Id.
a Dr. Hopenfeld testifies that Entergy has not provided a quantitative
estimate of the probability of crack detection, but should have done so, since the entire
dryer is not accessible to visual inspection. Hopenfeld Rebuttal at A35.
IV. NEC CONTENTION 4
(Flow-Accelerated Corrosion)
NEC's rebuttal evidence concerning Contention 4 is contained in the prefiled
rebuttal testimony of Dr. Joram Hopenfeld, Exhibit NEC-JH_63 at 24-41; additional
rebuttal Exhibits NEC-JH_70- NEC-JH_72; the prefiled rebuttal testimony of Dr. Rudolf
Hausler, Exhibit NEC-RH_04; and Dr. Hausler's report titled "Flow Assisted Corrosion
(FAC) and Flow Induced Localized Corrosion: Comparison and Discussion," Exhibit
NEC-RH_05.
Entergy witness Dr. Horowitz has testified that it is not necessary to recalibrate or
"benchmark" the CHECWORKS model with plant inspection data following a twenty.
21
percent power uprate. Joint Declaration of Jeffrey S. Horowitz and James C. Fitzpatrick
on NEC Contention 4 - Flow-Accelerated Corrosion at A33, 34. Rather, Dr. Horowitz
contends that the only update to the CHECWORKS model that is necessary following a
twenty percent power uprate is the input of new values for flow rate and temperature into
the model. Horowitz at A33, 34. Dr. Horowitz bases these assertions on his view that
"[flow-accelerated corrosion (FAC)] wear rates vary roughly with velocity and do not
increase with velocity in [a] non-linear (exponential) manner. . . .", Horowitz at A49, and
his beliefs that FAC is not fundamentally a local phenomena, and the CHECWORKS
model can accurately predict any variations in FAC rates related to geometric features.
Dr. Horowitz contends that th9 CHECWORKS model accounts for any localized
variations in FAC associated with geometric features through the use of "'geometric
factors' to relate the maximum degradation occurring in a component, such as an elbow,
to the degradation predicted to occur in a straight pipe." Horowitz at A47, A48.
Dr. Hopenfeld and Dr. Hausler disagree with Dr. Horowitz that recalibration of
the CHECWORKS model is unnecessary following substantial changes in flow velocity
and changes in temperature, and respond regarding Dr. Horowitz's grounds for this
opinion as follows.
M Dr. Hausler testifies that the linear relationship between FAC rates and
fluid velocity transitions to an exponential one as the local turbulence becomes such that
erosional features become manifest. Whether such transition actually occurs when flow
velocity increases following a power uprate must be determined experimentally. Hausler
Rebuttal at A5, Exhibit NEC-RH_05.
22
M Dr. Hopenfeld stresses that "FAC is fundamentally a local phenomenon
due to variations of local turbulence in curved pipe, nozzles, tees, orifices, etc," and that
corrosion rates can be expected to "vary with location depending on the intensity of the
local turbulence." Hopenfeld Rebuttal at A42, A52, A53, A54 He also disagrees with
Dr. Horowitz that the rate of FAC corresponds weakly with the velocity, and varies less
than linearly with time, and disputes the relevance of the data Dr. Horowitz cites in
support of his position. Hopenfeld Rebuttal at A41, A46, A53, A55.
M Dr. Hausler does not agree that the CHECWORKS model, or any model,
can fully account for variations in the rate of FAC due to geometric features and
discontinuities. Hausler Rebuttal at A6; Exhibit NEC-R-H_05. Some things cannot be
specified. For example, the internal residual weld bead from the root pass may be 1/8
inch high in one case, and 'A inch high in another case. Id. The upstream and
downstream turbulence surrounding the weld bead will be more severe in the latter case,
and a power uprate may disproportionately affect the flow over the larger bead. Id.
0 Dr. Hopenfeld observes that, while Dr. Horowitz denies the need to
recalibrate CHECWORKS, he recognizes the need to increase the FAC inspection scope
by 50% to account for the power uprate. Hopenfeld Rebuttal at A48. Entergy does not
disclose what fraction of the total FAC susceptible area in the VY plant the proposed
increased monitoring would represent, and its significance is therefore entirely unclear.
Id. *
Both Dr. Hopenfeld and Dr. Hausler take issue with Dr. Horowitz's definition of
FAC as corrosion in proportion to the flow rate, Horowitz at A46, and observe that this
definition excludes the more severe forms of localized corrosion - erosion-corrosion,
23

impingement and cavitation. Hausler Rebuttal at A6; Exhibit NEC-RH_05; Hopenfeld
Rebuttal at A45. Both Hopenfeld and Hausler observe that this definition of FAC is
entirely arbitrary. Erosion-corrosion, impingement and cavitation are extensions of FAC
as the local flow intensity due to turbulence increases. The transition from one to the
others is continuous and difficult to identify. Id. If CHECWORKS is unable to predict
these more severe forms of localized corrosion related to high flow rates, which can
particularly occur after a power uprate, then this is a serious shortcoming of the model
and its application. Id.
Dr. Hausler and Dr. Hopenfeld also address the following additional issues:
0 Dr. Hausler observes that the accuraicy of CHECWORKS has been said to
be within +/- 50%, but this statement is based on an erroneous interpretation of the
graphic representation of predicted vs. measured wear. Hausler Rebuttal at A6; Exhibit
NEC-R-_05. Actually, the accuracy is within a factor of 2 - the measured wear rates
range from twice the prediction to half the prediction. Id. A factor of two difference
between measured and predicted corrosion [or corrosion rate] can be quite significant
with respect to selecting a particular item (line) for inspection during a refueling outage.
Id.
0 Dr. Hopenfeld disagrees with Dr. Horowitz's evaluation of industry FAC
experience, and his contention that this experience demonstrates the efficacy of
CHECWORKS. Hopenfeld Rebuttal at A39, A40, A49, A52, A53. Dr. Hopenfeld
specifically disagrees that, in assessing industry FAC experience, a distinction should be
drawn between pipe failures due to leaks and failures due to ruptures. Hopenfeld
Rebuttal at A44, A53.
24
* Dr. Hopenfeld faults Entergy for its failure to specify the total FAC-
susceptible area that is inspected during a typical outage. Hopenfeld Rebuttal at A43.
0 Dr. Hopenfeld disputes Dr. Horowitz's suggestion that the oxygen
concentration at VY did not change in 2003. Hopenfeld Rebuttal at A5 1.
V. CONCLUSIONS
Extended operation of VYNPS as Entergy has proposed in its LRA will
jeopardize public health and safety. The LRA should be denied unless the important)
issues addressed by NEC's Contentions 2A, 2B, 3 and 4 are resolyed.
June 2, 2008 New England Coalition, Inc.
by: I)Andrew Raubvoge()Karen TylerSHEMS DUNKIEL KASSEL & SAUNDERS PLLCFor the firm
Attorneys for NEC
25
PROPRIETARY: REDACTEDNEC-JH_63
UNITED STATES OF AMERICANUCLEAR REGULATORY COMMISSION
ATOMIC SAFETY AND LICENSING BOARD,
Before Administrative Judges:
Alex S. Karlin, ChairmanDr. Richard E. Wardwell
Dr'. William H. Reed
In the Matter ofI Docket No. 50-271-LR
ENTERGY NUCLEAR VERMONTYANKEE, LLC, and ASLBP No. 06-849-03-LRENTERGY NUCLEAR OPERATIONS, INC.
June 20, 2006(Vermont Yankee Nuclear Power Station)
PRE-FILED REBUTTAL TESTIMONY OF Dr. JORAM HOPENFELDREGARDING NEC CONTENTIONS 2A, 2B, 3 AND 4
K\
Ql.' Please state your name.
Al. My name is Joram Hopenfeld.
Q2. Have you previously provided testimony in this proceeding?
A2. Yes. I provided direct testimony in support of New England Coalition, Inc.'s (NEC)
Initial Statement of Position, filed April 28, 2008.
Q3. Have you reviewed the initial statements of position, direct testimony and exhibitsfiled by Entergy and the NRC Staff?
A3. Yes. I have reviewed Entergy's Initial Statement of Position on New England Coalition
Contentions. (May 13, 2008) and all exhibits thereto, the Joint Declaration of James C.
Fitzpatrick and Gary L. 'Stevens on NEC Contention 2A/2B - Environme~ntally-Assisted Fatigue
(May 12, 2008), the Joint Declaration of John R. Hoffman and Larry D. Lukens on NEC
Contention 3 - Steam Dryer (May 12, 2008), and the Joint Declaration of Jeffrey S. Horowitz
and James C. Fitzpatrick on NEC Contention 4 - Flow-Accelerated Corrosion (May 12, 2008). I
have also reviewed the NRC Staff Initial Statement of Position on NEC Contentions 2A, 2B, 3,
and 4 and all exhibits thereto, the Affidavit of John R. Fair Concerning NEC Contentions 2A &
2B (Metal Fatigue) (May 13, 2008), the Affidavit of Kenneth Chang Concerning NEC
Contentions 2A & 2B (Metal Fatigue) (May 12, 2008), the Chang Colrrection Letter with
Enclosures (May 22, 2008), the Affidavit of Kaihwa R. Hsu, Jonathan G. Rowley, and Thomas
G. Scarborough Concerning NEC Contention 3 (Steam Dryer) (May 13, 2008), and the Affidavit
of Kaihwa R. Hsu and Jonathan G. Rowley Concerning NEC Contention 4 (Flow-Accelerated
Corrosion) (May 13, 2008).
Q4. Entergy contends that you have no experience or expertise relevant to the testimonyyou have provided concerning NEC's Contentions 2A, 2B,,3 and 4. How do you respond?
A4. I have a Ph.D in mechanical engineering, concentrating in Heat Transfer, Applied
Electrochemistry, and Fluid Dynamics. I have 46 years of experience in the area of
material/environment interaction (corrosion, erosion, fatigue) and related instrumentation. I have
designed and conducted corrosion tests, I have reviewed and approved material fatigue-related
issues for the FFTF and the CRBR reactors, and I have participated in the development of related
codes and standards. I have participated in the evaluation of numerous material/environment
related issues, including stress corrosion cracking in BWRs. I have managed experimental
programs related to fatigue and corrosion in nuclear and fossil plants. I worked on PWR steam
generator material-related issues for eight years at the NRC. I have published many papers in
related areas in peer-reviewed scientific journals. I hold two patents relating to the detection of
2
¢
erosion/corrosion piping damage. I personally funded erosion-corrosion research studies at the
University of Virginia.
To address the issues NEC raises in its Contentions 2A, 2B, 3 and ,4 requires a broad
knowledge of heat transfer, corrosion and material fatigue. I believe that I have the expertise
necessary~to provide the Board with a competent assessment of the fatigue and FAC issues
relevant to the determination of the effects of the BWR environment on FAC and fatigue life.
The FAC and fatigue issues that I am addressing are not unique to the BWR environment, but
rather' are common to many environments.
I. NEC CONTENTIONS 2A AND 2B(environmentally-assisted metal fatigue analyses)
A. Entergy's Calculation of Environmental Correction Factor, Fen
Q5.' Does the fact that NRC guidance stated in Section X.M1 of the GALL Reportsanctions use of the NUREG/CR-6583 and NUREG/CR-5704 equations to compute Fenmultipliers demonstrate that this methodology satisfies ASME Code specifications?
A5. No. Section 111 of the ASME Code prescribes a set of curves for calculating fatigue life
for different materials. These design curves, also known as S-N curves, are presented in terms of
stress and the number of cycles to failure and are strictly based on laboratory tests in air. These
tests incorporate correction factors for the effects of surface roughness, data scatter, and
component size. See, Exhibit NEC-JH-26 at 3. These factors are not "safety margins," as
Entergy witness Mr. Fitzpatrick suggests in his direct testimony at A8; they are correction
factors. Exhibit NEC-JH-26 at 3. The Code requires that in situations where the environment is
more aggressive than air the owner must account for such conditions. ASME Code, Appendix
B at B-2131 (emphasis added). The LWR environment is known to reduce fatigue life
significantly compared to air. Exhibits NEC-JH-26 at 3 and NEC-JH-03 at 1.
3
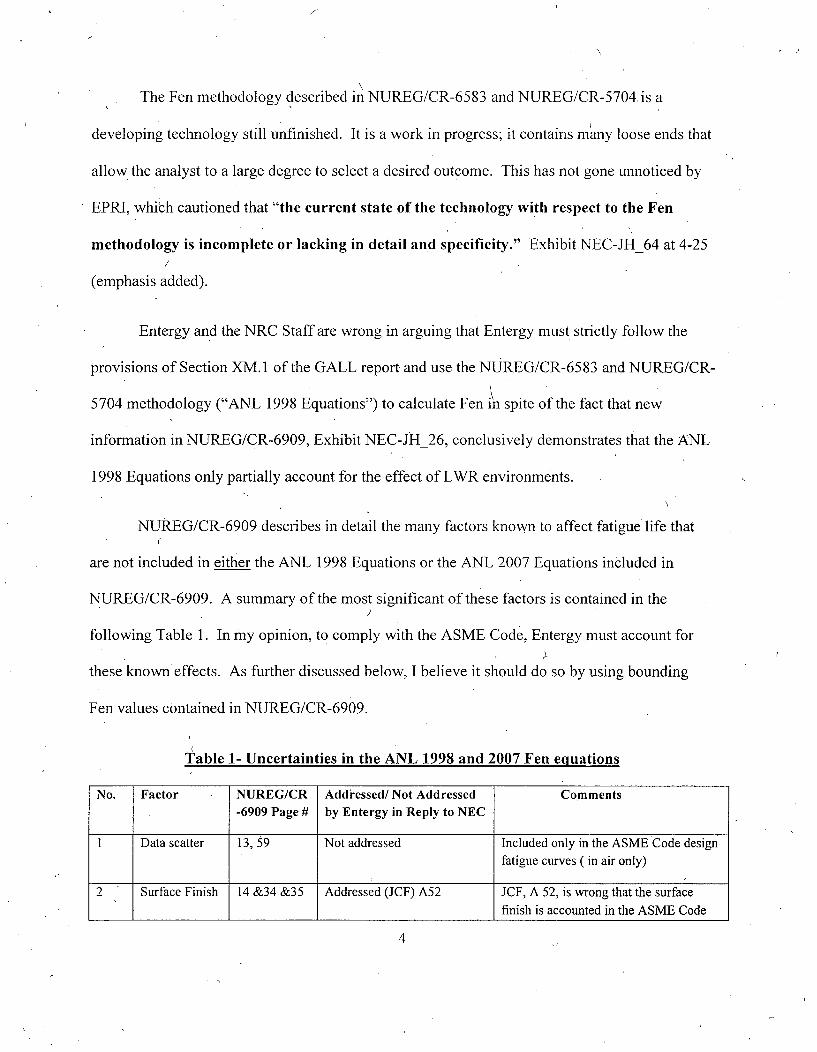
The Fen methodology described in NUREG/CR-6583 and NUREG/CR-5704, is a
developing technology still unfinished. It is a work in progress; it contains many loose ends that
allow the analyst to a large degree to select a desired outcome. This has not gone unnoticed by
EPRI, which cautioned that "the current state of the technology with respect to the Fen
methodology is incomplete or lacking in detail and specificity." Exhibit NEC-JH_64 at 4-25/
(emphasis added).
Entergy and the NRC Staff are wrong in arguing that Entergy must strictly follow the
provisions of Section XM. 1 of the GALL report and use the NUREG/CR-6583 and NUREG/CR-
5704 methodology ("ANL 1998 Equations") to calculate Fen in spite of the fact that new
information in NUREG/CR-6909, Exhibit NEC-JH_26, conclusively demonstrates that the ANL
1998 Equations only partially account for the effect of LWR environments.
NUREG/CR-6909 describes in detail the many factors known to affect fatigue life that
are not included in either the ANL 1998 Equations or the ANL 2007 Equations included in
NUREG/CR-6909. A summary of the most significant of these factors is contained in the
following Table 1. In my opinion, to comply with the ASME Code, Entergy must account for
these known effects. As further discussed below, I believe it should do so by using bounding
Fen values contained in NUREG/CR-6909.
Table 1- Uncertainties in the ANL 1998 and 2007 Fen equations
No. Factor NUREG/CR Addressed/ Not Addressed Comments
-6909 Page # by Entergy in Reply to NEC
I Data scatter 13, 59 Not addressed Included only in the ASME Code designfatigue curves ( in air only)
2 Surface Finish 14 &34 &35 Addressed (JCF) A52 JCF, A 52, is wrong that the surfacefinish is accounted in the ASME Code
4
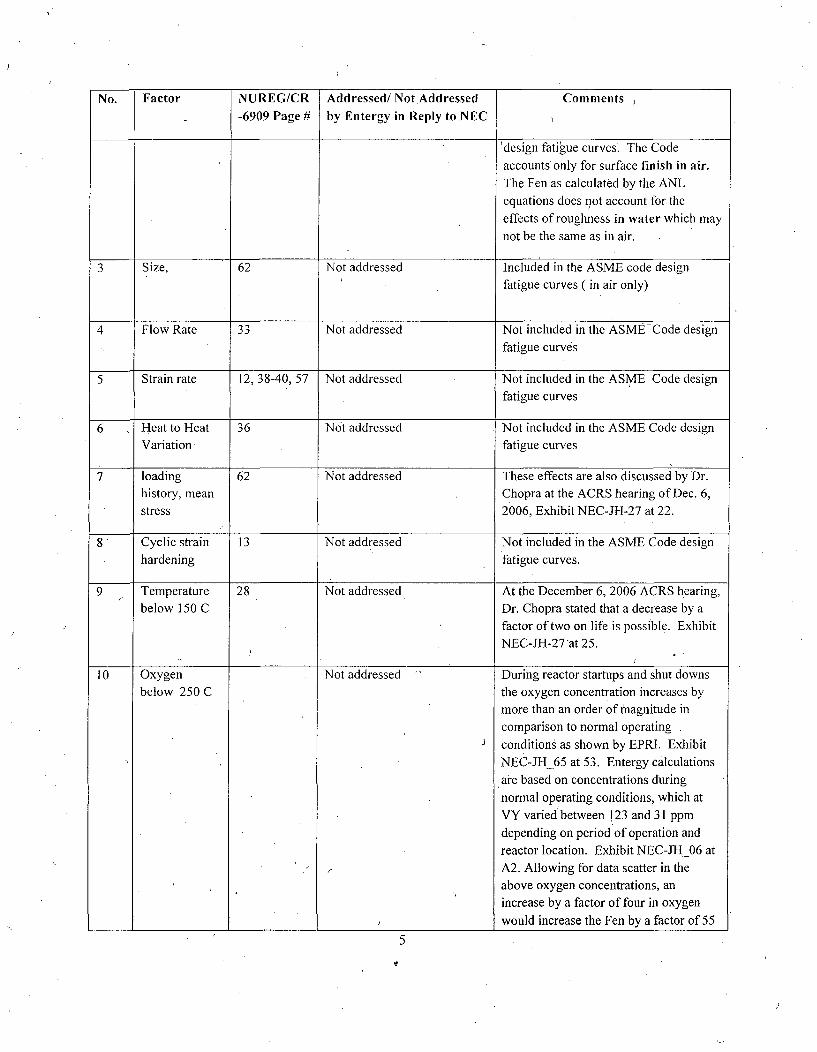
No. Factor NUREG/CR Addressed/ Not Addressed Comments
-6909 Page # by Entergy in Reply to NEC
'design fatigue curves. The Code
accounts only for surface finish in air.
The Fen as calculated by the ANL
equations does not account for the
effects of roughness in water which may
not be the same as in air.
3 Size, 62 Not addressed Included in the ASME code design
fatigue curves ( in air only)
4 Flow Rate 33 Not addressed Not included in the ASME -Code design
fatigue curves
5 Strain rate 12, 38-40, 57 Not addressed Not included in the ASME Code design
fatigue curves
6 Heat to Heat 36 Not addressed Not included in the ASME Code designVariation fatigue curves
7 loading 62 Not addressed These effects are also discussed by Dr.history, mean Chopra at the ACRS hearing of Dec. 6,
stress 2006, Exhibit NEC-JH-27 at 22.
8' Cyclic strain 13 Not addressed Not included in the ASME Code designhardening fatigue curves.
9 Temperature. 28 Not addressed At the December 6, 2006 ACRS hearing,
below 150 C Dr. Chopra stated that a decrease by a
factor of two on life is possible. ExhibitNEC-JH-27 at 25.
10 Oxygen Not addressed " During reactor startups and shut downs
below 250 C the oxygen concentration increases by
more than an order of magnitude in
comparison to normal operatingconditions as shown by EPRI. Exhibit
NEC-JH_65 at 53. Entergy calculations
are based on concentrations duringnormal operating conditions, which at
VY varied between 123 and 31 ppm
depending on period of operation and
reactor location. Exhibit NEC-JH 06 at
A2. Allowing for data scatter in theabove oxygen concentrations, an
increase by a factor of four in oxygen
/ would increase the Fen by a factor of 55
5
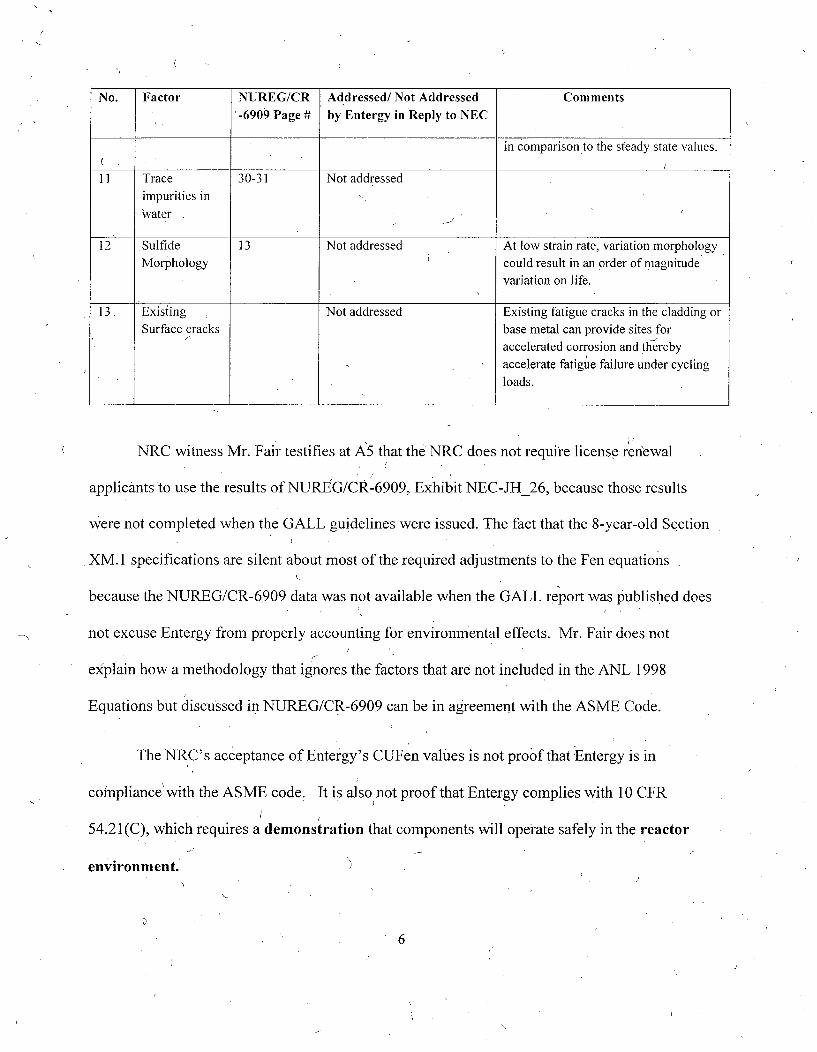
No. Factor NUREG/CR Addressed/ Not Addressed Comments-6909 Page # by Entergy in Reply to NEC
in comparison to the steady state values.
11 Trace 30-31 Not addressed
impurities inWvater
12 Sulfide 13 Not addressed At low strain rate, variation morphologyMorphology could result in an order of magnitude
variation on life.
13. Existing Not addressed Existing fatigue cracks in the cladding orSurface cracks base metal can provide sites for
accelerated corrosion and therebyaccelerate fatigue failure under cyclingloads.
NRC witness Mr. Fair testifies at A5 that the NRC does not require license renewal
applicants to use the results of NUREG/CR-6909, Exhibit NEC-JH_26, because those results
were not completed when the GALL guidelines were issued. The fact that the 8-year-old Section
XM. 1 specifications are silent about most of the required adjustments to the Fen equations
because the NUREG/CR-6909 data was not available when the GALL report was published does
not excuse Entergy from properly accounting for environmental effects. Mr. Fair does notV
ekplain how a methodology that ignores the factors that are not included in the ANL 1998
Equations but discussed in NUREG/CR-6909 can be in agreement with the ASME Code.
The NRC's acceptance of Entergy's CUFen values is not proof that 'Entergy is in
compliance'with the ASME code. It is also not proof that Entergy complies with 10 CFR
54.21 (C), which requires a demonstration that components will operate safely in the reactor
environment.
6
Q6. Do you agree-that the ANL 1998 Equations contained in NUREG/CR-6583 andNUREG/CR-5704 are more conservative and will generally yield higher Fen multipliers forcurrently operating plants than the ANL 2007 Equations contained in NUREG/CR-6909?
A6. No - the ANL 2007 Equations will yield higher Fen multipliers in some cases, and lower
Fen multipliers in other cases. -See, Exhibit NEC -JH_26 at 38. NRC witness Mr. Fair
incorrectly told the ACRS that the ANL 1998 equations result in higher Fens than the ANL 2007
equations. See, Exhibit NEC-JH_28 at 97., In the light of such blatant distortion by the NRC
staff, one cannot expect decision makers such'as the ACRS to understand the degree of
uncertainty in Entergy's methodology.
When both the Entergy and NRC Staff witnesses allege that the NUREG/CR-6583 and
NUREG/CR-5704 "procedure" is more conservative (Fair A5 and A6, Stevens A50), I believe
they are referring to the fact that NUREG/CR-6909 contains new air fatigue curves that are less
conservative than the current ASME Code fatigue curves. I have never recommended use of
these new air fatigue curves. Until (the current fatigue curves in the Code are officially modified,
these curves must be considered the "best representation of fatigue life in air" and must be
adhered to.
Most importantly, and I want-to make this very clear, Entergy's and the NRC's Staff's
discussion of the alleged greater conservatism of the NUREG/CR-6583 and NUREG/CR-5704
equations and ','procedure" are totally irrelevant to my main point about how Entergy should
have used information contained in NUREG/CR-6909 in its CUFen analyses.
Q7. What is your main point regarding the significance of NUREG/CR-6909? What,information contained in this document should Entergy have used in its CUFen Analyses?
7
A7. As I have discussed in A5, above, NUREG/CR-6909 &escribes in detail the many factors
known toaffect fatigue life that are not included in either the ANL 1998 Equations or the ANL
2007 Equations. These factors do not exist in the laboratory environment but are important .and
known to be present in the reactor environment. This i's the relevant information Entergy should
have taken from NUREG/CR-6909.
My main point is that, given the current state of the technology, it simply is not possible
to calculate Fen multipliers that are precision-adjusted to plant conditions, as Entergy purports to
have done. Given the many uncertainties in the calculation of Fen, I recommend use of
bounding values contained in NUREG/CR-6909 - 12 for austenitic stainless steel and 17 for
carbon and low alloy steel.
Q8. Please further 'explain why you used a Fen of 12 for austenitic stainless steel and aFen of 17 for carbon and low alloy steel in the CUFen recalculation stated in your report,Exhibit NEC-JH_03 at 19-20.
A8. As discussed in NUREG/CR-6909, these values are based on a review of laboratory data
from 41 sources. The reason for favoring the bounding numbers over the use of the ANL
equations is that the bounding values factor in a much wider range of parameters than the ANL
equations, such as fatigue loadings' data acquisition and material variability.
Q9. Do you agree with NRC witness Mr. Chang that Fen values of 12 for austeniticstainless 17 for carbon and low alloy steel represent a "worst case scenario," or thatapplication of these values is unreasonably conservative?
A9. No. The factors 12 and 17 may in fact represent the best-case scenario after all the
uncertainties outlined in Table 1 are considered. In addition, application of Fen values of 12 and
17 in the VY environment is not overly conservative because these values do not account for the
8
presence of cracks in the cladding and base metal of the feedwater nozzles, or for high oxygen
concentrations during transients.
J
I also note that if the ASME Code design fatigue curves are conservative as some believe,
including ANL, any lack of conservatism in the above Fen values may be compensatedby the
ASME curves. If on the other hand the ASME Code curves are not conservative, as other
researchers believe, See, Exhibit NEC-JH_26 at 71, then the Fen factors 12 and 17 will have to
be adjusted upwards.
Q10. Do you agree with Entergy witness Mr. Stevens that Fen=17 applies only to highoxygen and temperature environments that do not exist at VYNPS, in part because theplant has operated usinghydrogen water chemistry since 2003?
A10. No. I do not agree that the factor 17 is restricted to high temperature and high oxygen
environments. This factor is specified in NUREG/CR-6909 at 3 as applicable to "certain reactor
operating conditions." NUREG/CR-6909 does not indicate that the factor of 17 is restricted only
to high oxygen and high temperatures. Mr. Stevens provided no reference for his assertion that
Fen=l 7 applies only to high oxygen and temperature environments for carbon and low-alloy
steels.
I do not agree that either Fen= 12 for austenitic stainless or Fen= 17 for carbon and low
alloy steel would apply only in extreme environments. For example, my reference 3 to this
testimony is a paper by Garry Wire and-William Mills, reporting a factor of 12 for 304 stainless
steel in 288 degrees C and 20ppb oxygen concentrations. Exhibit NEC-JH_66 at 318. This
temperature is typical of BWR operations and the 20 ppb is considerably below the VY oxygen
concentrations. It is definitely not an extreme environment as claimed by Entergy. Wire and
Mills report that "[c]rack growth rates of 304 SS in water were about 12 times the air rate." Id. I
9
did not research the literature to find the exact conditions that correspond to the factor 17. 1
believe that this factor was provided by ANL as a general bounding number.
Even if Fen= 17 did apply only to high oxygen environments, I would not agree that this
factor should not be used at VY due to the 2003 switch to Hydrogen water chemistry. First,
because Entergy switched to Hydrogen chemistry relatively recently, calculations must still be
conducted for the higher oxygen concentrations. Second, as discussed below, Entergy does not
know what the actual oxygen concentration is during transients at the surface of a given
component and therefore an adequately conservative analysis must assume that this
concentration is high.
Qll. Entergy and the NRC Staff argue that NUREG/CR-6909 does not recommend use ofthe bounding Fen values you used in your CUFen recalculation. How do you respond?
All. Di. Chopra, author of NUREG/CR-6909, understands the limitations of the Fen
Imethodology very well, but he can only describe the "state of the art." He is not in a position to
recommend or not recommend use of bounding Fen values. It is up to the user to assess his
specific conditions and make the appropriate corrections to the ANL equations. Entergy has not
done so. It selected a procedure that would produce CUFens less than unity. /
Q12. Do you agree that any lack of conservatism in Fen values calculated by the ANL1998 Equations is counterbalanced by excess conservatism in the ASME Code designfatigue curves?
A12. No. The Fen issue must be kept separate from.the ASME Code design fatigue curve
issue. One is not justified to use an arbitrary number for the Fen because one believes that the
Code is conservative. There'is no general agreement among researchers that the current
Code is conservative. Until the current fatigue curves in the Code are officially modified, these
curves must be considered the "best representation of fatigue life in air" and must be adhered to.
10
Entergy's and the NRC's opinions regarding the ASME code are irrelevant. Entergy and the
NRC should not be allowed to create their own rules concerning how to adjust the ASME code,
which in essence is exactly what they are doing by using a non-conservative Fen in the hope that
this will be compensated by a perceived conservatismo in the existing ASME fatigue curves. If all
the users of the ASME Code were to follow Entergy's example it would render the ASME Code
useless. /
C
Q13. Do you agree with Entergy witness Mr. Fitzpatrick that Entergy's CUFen analysesproperly accounted for surface roughness effects through use of ASME Code design fatiguecurves that include a "safety factor" to account for these effects.?
A13. No. The ASME Code incorporates a factor-of about four on surface finish-to account for
different fabrication processes (on the order of 0.5 mils). Surfaces exposed to the LWR
environment are subject to corrosion, erosion and pitting, exhibiting a combination of smooth
surfaces, ridges and holes of various sizes, making it difficult to compare such surfaces to
machined surfaces. Until data show that the corroded surfaces and machined surfaces equally
affect fatigue, possible differences cannot be ignored because surface holes and grooves may
provide sites for accelerated corrosion attack; the corrosion reactions could then accelerate crack
growth under cyclic loads. Mr. Fitzpatrick did not provide any support for his statement that the
ASME Code design fatigue curves already incorporate the relevant surface roughness.
Mr Fitzpatrick is also wrong in representing at several points in his testimony that the
ASME Code includes safety factors for environmental effects. As discussed in NUREG/CR-
6909 at 3, surface finish, size and scatter are adjustments, not safetyrmargins.
Q14. Do you agree with Entergy witness Mr. Fitzpatrick that Entergy used boundingvalues for oxygen as an input to the ANL equations in all its CUFen analyses?
11
A14. No. First, Mr. Fitzpatrick is referring to steady state value as determined by a computer
code called BWRVIA that Entergy has neither described nor provided to NEC. Second, Mr.
Fitzpatrick completely ignores the high oxygen concentrations that occur during transients. See,
Exhibit NEC-JH_65 at 52-53. To the best of my knowledge, there is no technology that can
predict the oxygen concentration at a given surface during reactor transients. Furthermore, no
analysis has been presented to show how such temporary high oxygen concentrations affect the
Fen. Mr. Fitzpatrick also stated that the BWRVIA has been calibrated-in steam under
unspecified conditions that he'did not describe. Such calibration does not address the oxygen
concentrations in water during transients.
Q15. Was it appropriate for Entergy's Fen calculations to exclude any correction forcracking in the cladding and base metal of the feedwater nozzles based on results ofEntergy's 2007inspection of these nozzles for cracks in the base metal?
A15. No. Entergy stated in RAI 4.3-H-02 that the feedwater nozzle cladding may contain
cracks and that such cracks could grow into the base metal. NRC Staff Exhibit 1 at 4-26 - 4-27.
Entergy's 2007 inspection report stated that "No relevant information was recorded". Exhibit 2-
33 at 4. Without stating the probability of detecting cracks at the clad metal interface and
defining "relevant," the inspection results are useless. Even if thed cad cracks have not yet
penetrated the base metal, the interface between the clad'and the base metal is a site for crack
initiation where corrosion products can accumulate. Such surface cracks when discovered in
pressure systems are usually ground out to prevent fast crack growth under cycling loads. The
ANL equations were not corrected for the presence of known surface cracks even if they did not
yet penetrate the base metal.
BliB. Enter•-y's Calculation of 60-Year CUFs in Air
12
Q16. You have testified that Entergy's CUFen analyses improperly applied a heattransfer equation that applies only to a fully developed turbulent flow to the VYNPSnozzles where flow most likely is not fully developed. Entergy witness Mr. Steven's has
testified (A 54) that flow in the feedwater nozzle is fully developed because the upstreamhorizontal pipe is 48 inches long. How do you respond?
A16. Both the local distribution and the absolute rate of the heat transfer to or from thewalls of
the pipes affect fatigue loading. The CUF results are very sensitive to the heat transfer
coefficients. See, Exhibit NEC- JH_15.
Mr. Stevens is wrong in stating (A 54) that the flow in the feedwater nozzle is fully,
developed because the upstream horizontal pipe is 48 inches long. Since the inside diameter of
the nozzle is 9.7 inches, the L/D is approximately 5, which is not sufficient to estabiish a fully
developed flow. See, Exhibit NEC- JH_29. About 30 to 60 diameters, depending on the
Reynold's number, are required to establish a fully developed flow through the nozzle. Mr.
Stevens did not provide the straight section lengths upstream of the recirculation and spray
nozzles. If that length is also on the order of 48 inches the flow in these nozzles will not befully
developed because the diameter of these nozzles is larger than the diameter of the feedwater
nozzle. Because the flow in the'nozzles is not fully developed, variation in the heat transfer
coefficient both axially and circumferentially can be expected. Data on wall thinning in the
upstream sections of the straight pipe where the flow is not fully developed is also required
because it may affect the velocity distribution in the nozzle.
In transients where the flow stops and heat transfer occurs by natural convection, Mr.
Stevens did not answer the question why a correction was not made for circumferential variation
of the heat transfer both during single phase flow and during condensation. It appears that Mr.
13
Stevens does not understand the issue because he refers to axial variations and not variations in
the vertical direction that is inherent in natural convection flows.
Mr. Stevens' statement that Equation,( 3 ) is "bounding" is meaningless without any
further explanation.
Q17. You have testified that Entergy improperly failed to .correct a heat transfer equationused in its CUFen Reanalyses by the ratio of the viscosities evaluated at the bulk and walltemperatures during each transient. Entergy witness Mr. Stevens states that thiscorrection is unnecessary when there are minimal differences in temperature between thepipe wall and the bulk of the fluid. How do you respond?
A17. Mr. Stevens is correct that when there are minimal differences in temperature between
the pipe wall and the bulk of the fluid, variations in viscosity can be neglected. However, Mr.
Stevens did not quantify actual temperature differences. A difference of 100 degrees F would
affect the heat transfer coefficient by about 4%. The actual effect can only be determined from
data on wall and bulk fluid temperature histories for sample transients. Such information was not
provided.
Q18. You have testified that Entergy's reports of its CUFen Reanalyses do not include,and Entergy did not produce to NEC, drawings of plant piping from which you couldobtain information necessary to validate Entergy's assumption of uniform heat transferdistribution. Entergy notes that it'supplied NEC With 36 drawings. How do you respond?
A18. Exhibit NEC-JH-25 is illustrative of the "piping diagrams"; Entergy produced. It would
be virtually impossible to extract information necessary to determine the flow conditions from•
such sketches - for instance, orientation angles, weld location and internal diameters as they
exist today.
Q19. ' You have testified that Entergy's reports of its CUFen Reanalyses do not include,and Entergy did not produce to NEC, a complete description of the methods or modelsused to determine velocities and temperatures during transients. Entergy represents that
14
this information was conveyed to NEC through counsel on April 14, 2008. How do you,respond?
A19. I do not agree that information sufficient to validate Entergy's analysis either appears in
Entergy's reports of its analyses or was conveyed on April 14, 2008. Tor calculate flow velocity,
Entergy advised on April 14, 2008 that I should take the flow rates (of unknown accuracy) and
divide them by flow area. It failed to indicate how one does this when the flow is zero. At the
January 2008 public meeting between Entergy and the NRC Staff, Entergy's Counsel
specifically instructed Entergy representatives not to answer any of my questions regarding the
above issues. NEC requested information about the methods that were used to calculate
temperatures during the transients, but Entergy did not supply that information, contrary to what
is claimed in Entergy's Initial Statement of Position at 36.
I believe that Entergy's strategy in this and, other. proceedings has been to withhold the
information necessary to support a thorough assessment of its analyses by intervenors. Notably,
Entergy has now taken the position in the ASLB proceeding concerning Entergy's License
Renewal Application for the Indian Point plant that it is not required to provide a information
about its CUFen analyses for the NUREG/CR-6260 locations until after the close of the ASLB
proceeding. Exhibit NEC-JH_67 at Attachment 1, Enclosure 2, (see discussion of D-RAI
4.3.1.8-1 and D-RAI 4.3.1.8-2). The NRC Staff has apparently acquiesced in Entergy's effort to
avoid public scrutiny of its CUFen methodology, and withdrew requests for this information. Id.
Q20. Entergy claims that its use of the simplified Green's Function method in its initialCUFen Reanalysis introduced only a small error. Do you agree?
A20. No. Unlessihe analyst can explain the physical reasons for discrepancies between results
obtained by the Green's Function methodology and the more exact methodology, classic NB-,
15
3200 analysis, the results of the Green's Function methodology will incorporate unquantified
uncertainties. At the'January 2008 meeting between Entergy and the NRC Staff, Entergy was not
able to. explain such differences, and Entergy witness Mr. Stevens has now testified atA58 that
"[t]he reason for this difference was not specifically investigated:'
After arguing for months that the analysis with Green's Function produces conservative
results, i.e. large CUFen values, Entergy agreed to prove this by using the classical NB-3200
analysis without Green's Function. The demonstration showed that the CUFen was 0.35341,
seemingly confirming that the use of Green's Function produces conservative results because
this value is smaller than 0.6392 (the value Entergy calculated with the Green's Function). See,
Exhibit NEC-JH_03 at 6. This result, however, was obtained by lowering the Fen to 3.97 instead
of keeping it at the 10.05 level for a valid comparison. When the correct value of Fen was used,
10.05, Entergy obtained a CUFen of 0.8930, which is substantially greater than 0.63 92 (obtained
with the Green's Function). Thus the u'se of the Green's Function may generate non-conservative
results. My report, Exhibit NEC-JH_03 at 6, includes a table of the four different CUFen values
Entergy has calculated for the feedwater nozzle. It is interesting to note that Entergy does not
explain why an internal Entergy audit did not discover that the analyst was using incorrect Fen
numbers before the NRC audit discovered that this was the case.
Q21. Has Entergy fully explained how it determined the number of plant transients, orprovided information from which you could conclude that Entergy assumed a conservativenumber of transient cycles?
A21. No. Entergy has provided inconsistent and vague information regarding how it
determined the number of transient cycles, and has not indicated that it made any allowance for
the likely increase in plant transients resulting from the 20 percent power uprate or the fact that
16
the number of plant transients is likely to increase as a plant ages. NRC Staff witness Mr. Chang
has testified at A 10 that "the staff cannot determine the level of conservatism regarding the
number of transient cycles at this time."
Based on the documentation provided to NEC, Entergy determinedthe number of
transients, N,. for the total 60-year reactor life by counting the number of transients that the plant
has experienced up to a'certain date, n, and adjusting this number proportionally i.e. N= n x 60/t,
where t is the number of years as of the above date. This procedure is described in License
Renewal Application Table 4.3-2, Note 2; and Exhibit NEC-JH_ 8 at 3-18, Table 3-10, Note 2.
Both of these documents state that CUF results are based on "actual cycles to date and projected
to 60 years." Table 4.3-2 defines the projection as a linear extrapolation.
Entergy witness Mr. Fitzpatrick has testified at A55 that the procedure described in the
License Renewal Application and in Exhibit NEC-JH_18 actually was not followed; instead the
following was done:
VY projections for 60 years were made based on all ,availablesources, including the numbers of cycles for 40 years in the VYreactor pressure vessel Design Specification, the numbers of cyclesactually analyzed in the VY Design Stress Report, and the numbersof cycles experienced by VY after approximately 35 years of,operation (July 2007).
The above method of determining the number of cycles appears to be different from what was
- described in Tables 3-10 and 4.3.2, which are referenced above. In any event, the above
description is too vague to allow one to determine how the number of transients was actually
calculated. Mr. Fitzpatrick did not provide a reference that would explain how the above
procedure was implemented.
17
Q22. You used the CUF values Entergy originally provided in its License RenewalApplication in the CUFen recalculation stated in your report, Exhibit NEC-JH_03 at 19-20.Why did you use these values?
A22. Due to the many uncertaiInties and errors in Entergy's calculation of plant-specific 60-
year CUFs discussed in this rebuttal testimony and in my direct testimony and report, Exhibit
NEC-JH_03, I used the more conservative design basis CUFs which were produced by Entergy
in Table 4.3-3 of the LRA.
C. Error Analysis
Q23. Entergy contends that it was not necessary to perform an error analysis to validateits analytical techniques because the stress analysis is based on bounding values. How doyou respond?
A23. Because the level of uncertainty in Entergy's analysis is very high and the amount of
valid data is meager, properly identified assumptions and a competent assessment of their
relative effects on the CUFens is paramount. Entergy considered such an approach unnecessary
and apparently found it sufficient to label their assumptions "bounding." Without quantifying b'y
how much the various parameters are "bounding," Entergy's statement is meaningless. It has
already been demonstrated that the heat transfer coefficients and the Fen factors are not bounding
the'results conservatively.
Q24. NRC Staff witness Mr. Chang contends that an error analysis was unnecessarybecause of conservatism built into the ASME Code and the ANL 1998 Equations, which heclaims "have been adjusted for uncertainties in life." How do you respond?
A24. As I have discussed in A 12 of this testimony, there is no agreement among researchers
that the ASME Code design fatigue curves are conservative. With respect to the ANL 1998
Equations, Mr. Chang does not explain how adjustments were made for the factors listed in the
Table I included in A5 of this testimony. Ten years of data and research have been accumulated
18
since the ANL 1998 Equations were published; Mr. Chang does not explain why the license
renewal process should ignore this data.
Q25. You have stated that Entergy's CUFen Reanalyses should be reviewed by anindependent third party. Why do you make this recommendation? /
A25. In addition to the uncertainties in heat transfer coefficients, Green's Function and the
number of transients used in the analysis, there are many other uncertainties that are not possible
to assess: The results of the stress analysis largely depend on the judgment of the analyst
because he alone decides where the maximum stress points are and how to link transient pairs.
The changes that were made in the Fen, discussed in A20 of this testimony, which resulted in an
erroneously low CUFen is an example of how the analyst can affect the results. In the absence
of an independent review by an unbiased third party without financial ties to Entergy, Entergy's
60-year CUF calculations are of questionable validity.
D. References
Q26. Please list any references to this testimony that were not filed as Exhibits to yourdirect testimony.
A26.
1. Materials Reliability Program: Guidelines For Addressing Env'ironmental FatigueLicense Effects in License Renewal Applications, EPRI- MPR-47 Rev. 1, September,2005. Exhibit NEC-JH_64.
2. R&D Status Report, EPRI Journal, Jan/Feb 1983. Exhibit NEC-JH_65.
3. Gary L. Wire and William J. Mills, "Fatigue Crack Propagation Rates for Notched 304Stainless Steel Specimen in Elevate Temperature,", Journal of Vessel PressureTechnology. Exhibit NEC-JH_66.
4. New York State's Supplemental Citation In Support of Admission of Contention 26A,Docket Nos. 50-247-LR and 50-286-LR (May 22, 2008), and the attached NRC May 8,2008 Summary of an April 3, 2008 Telephone Conference Between Entergy and NRCStaff. Exhibit NEC-JH_67.
19
Q27. Does this conclude yourrebuttal testimony regarding NEC's Contentions 2A and2B?
A27'. Yes.
II. NEC CONTENTION 3
(steam dryer aging management program)
Q28. Please summarize your disagreement with Entergy regarding the validity of itssteam dryer aging management program.
A28. My position regarding the steam dryer at VY is simple: I disagree with Entergy that an.
aging management plan that consists solely of plant parameter monitoring and partial visual
inspection, uninformed by knowledge of dryer loading, complies with the General Design
Criteria insofar as they require that protection must be provided against the dynamic effects of
loss of coolant accidents ("LOCAs").
Entergy's strategy is based on monitoring moisture carryover, steam, flow, water level
and dome pressure and periodic visual inspections. Entergy witness Mr. Hoffman was asked in
Q33 whether these activities "enable Entergy to determine whether a dryer crack is about to
form?" He responded in A33 that they do not. Of course no one can predict the exact time for
transition from crack initiation to crack propagation. The question that was asked of Mr.
Hoffman is almost irrelevant. The questions that should have been asked are as follows: (a) are
all of the above precautionary measures- sufficient to ensure that the probability of the formation
of loose parts under DBA loads will be very low?; and (b) is Entergy taking all practical
measures to minimize the probability of such failures? As discussed in my report submitted to
the ASLB on April 28, 2008, Exhibit NEC-JH_54' the answer to both of these questions is no.
20
Entergy's witnesses, Mr. Hoffman and Mr. Lukens, described in detail various
procedures of steam dryer inspection and the operational experience with the dryer, but they
either dismissed or did not address properly the above two issues. The ability to estimate the
probability of formation of loose parts requires knowledge of the cyclic loads on the dryer to
ensure that the dryer ,is not subjected to cyclic stress that would exceed the endurance limit. In
A56-62 of their testimony, Mr Hoffman and Mr. Lukens discuss this key issue and state that the
prediction of cyclic stresses on the dryer is not required because there are no specific regulatory
requirements to do so, and the inspection pro'rams at VY ensure that the dryer will not fail. Mr.
Hoffman and Mr. Lukens did not provide even a single quantitative assessment in support of
these opinions.
I agree that there is no regulatory requirement to estimate dryer stresses. However, the
fact that dryers at other plants have failed following power uprates, the fact that this was a
surprise to General Electric ("GE"), the fact that even small pressure fluctuations can give rise to
stresses that exceed the endurance limit and the fact that the formation of loose parts can lead to
major safety problems are all factors that must be considered even though there are no specific
NRC requirements to calculate stresses on the dryer.
Q29. Entergy witness Mr. Lukens testified at A56 that "operating experience after theEPU (exemplified by the data collected during the 2007 inspection and the subsequent yearof monitoring of plant operating parameters) demonstrates that the stresses experienced bythe dryer are insufficient to initiate and propagate fatigue cracks." How do you respond?
A29. Mr. Lukens is wrong that the inspection data he mentions is a measure of cyclic stresses.
The only way of determining stresses on the dryer is to actually measure them. Fatigue cracking
is a time-dependent phenomenon; the fact that cracks have not developed after a short period of
time proves nothing. General Electric ("GE"), which conducted both the RF026 and the 2007
steam dryer inspections at VY, did not exclude the possibility of crack growth by fatigue. GE21
stated: "The dryer unit end plates -are located in the dryer interior and are not subjected to any
direct main steam line acoustic loading. However, continued growth by fatig ue cannot be
ruled out." Exhibit NEC-JH_68 at "Evaluation of Steam Dryer Indications" attachment
(emphasis added).
Q30. Mr. Lukens at A57 denied that GE made the statement that "continued growth byfatigue cannot be ruled out," and testified that the reference you cited for this statement,Exhibit NEC-JH_59, did not contain it. How do you respond?
.A30. Mr. Lukens misread my statement, which referred to GE's observations following the
RF026 inspection. Due to a clerical error, Exhibit NEC-JH_59 included only part of the GE
report; the full GE report is now provided as an Exhibit to this testimony. See, Exhibit NEC-
JH_68. In any event, Mr. Lukens is the engineer responsible for the inspection of the dryer at
VY; he should have been of aware of GE's conclusions, which are very material to the results of
the inspection.Q31. Mr. Lukens testified at A58 that all IGSCC cracks identified in the VY steam dryer
to date are inactive. How do you respond?
A31. In stating that the IGSCC cracks are not active, Mr. Lukens essentially dismissed the
possibility of continued growth of cracks by fatigue. He apparently did not recognize that
IGSCC can provide sites for corrosion -attack which would in turn accelerate crack growth under
cycling loading. The rate of crack propagation would depend on load intensities and duration./
Moreover, I cannot' agree with Mr. Lukens that the inspection photographs provided in Entergy's
Condition Report, Exhibit NEC-JH_59 at 2-8, show that the cracks are inactive. Metallographic
examinations would be required to demonstrate this, not remote camera photos.
Q32. Mr. Hoffman testifies at A59 that design basis loads ("DBA") cannot cause dryerfailure. How do you respond?
22
A32. I disagree. If the dryer has been sufficiently weakened by cracks, there is no reason to
believe that DBA loads could not fracture the dryer. Instead of making speculative statements,
Mr. Hoffman should have provided calculations showing that even if some parts of the dryer had
long and deep cracks, those parts would withstand DBA loads.
Q33. Mr. Hoffman testifies at A61 and A62 that it is not necessary to estimate and predictdryer stresses because "[c]onfirmation that stresses on the VY steam dryer remain withinfatigue limits is provided daily by the fact that the dryer has been able to withstand withoutdamage the increased loads imparted on it during power ascension and for the two years ofoperation since EPU was implemented." Do you agree?
A33. No, I do not agree that it is not necessary to estimate stresses because the dryer has thus
far withstood the increase in steam velocities followed ihe uprate. Vibration fatigue is a time-
related phenomenon; the fact that the dryer has not failed to date is not at all an indication that it
will not fail in the future. Mr. Hoffman is speculating that the loads on the dryer cannot change.
Even a small increase in steam velocity can bring vortex shedding frequency closer to the natural
frequency of the dryer, thereby inducing resonance vibrations and increasing the loads on the
dryer.
Q34. Mr. Hoffman testified at A63 that the analytical tools used to estimate stress loadson the steam dryer during the power ascension phase of EPU implementationdemonstrated that loads on the dryer would be below the endurance limit. Do you agree?
A34. No. Mr. Hoffman stated at A63 that the analytical tools demonstrated that the loads on
*the dryer would be acceptable. The analytical tools were based on small-scale experiments,
small-scale tests (ACM) and questionable scaling laws, as was pointed out by the ACRS. See,
Transcript of Proceedings, NRC Advisory Committee on Reactor Safeguards, 5 2 8 1h Meeting
(December 7, 2005) at 9, 12-14, 25, 29, 60.
Q35. Has Entergy provided information sufficient to demonstrate the validity of its steam
dryer aging management program?
23
A35. No. Mr. Hoffman and Mr. Lukens at A21-A53 provided a very lengthy and detailed
'description of the inspection techniques and parameter monitoring at VY. Even though the
entire dryer is not accessible to visual inspection, Mr. Hoffman and Mr. Lukens did'not provide a
quantitative estimate of the probability of crack detection, POD. They should have provided this
information./
Q36. Do you have any further comments regarding NEC'; Contention 3?
A36. 'Yes. Entergy provided an opinion that the dryer will not be the source of loose parts that
could present a safety risk during normal operations and during design basis accidents. Entergy
believes that the formation of cracks from flow-induced vibrations can be detected in time by
periodic visual inspections and plant parameter monitoring; I do not share this opinion. Rather I
am more inclined to agree with the researchers from the Pacific Northwest National Laboratory:
"Unlike the previously discussed mechanisms (corrosion). vibration fatigue does not lend
itself to periodic in-service examinations (volumetric, surface, etc) as a means of managing
this degradation mechanism." The main reason for this is: "Once a crack initiates failure
quickly follows." Fredric A. Simonen and Stephen R. Gosselin, "Life Prediction and
Monitoring of Nuclear Power Plant<Components for Service-Related Degradation" J. of Pressure
Vessel Technology V. 123, Feb. 2001, P, 62., Exhibit NEC-JH_69 at 62.
'Q37. Please list any references to this testimony that were not filed as Exhibits to yourdirect testimony.
A37.
1. Efitergy Condition Report, CR-VTY-2007-02133, including all attachments.
Exhibit NEC-JH 68.
24
2. Fredric A. Simonen and Stephen R. Gosselin, "Life Prediction and Monitoring ofNuclear Power Plant Components for Service-Related Degradation", J. ofPressure Vessel Technology V. 123, Feb. 2001. Exhibit NEC-JH_69.
Q37. Does thisconclude your rebuttal testimony regarding NEC's Contention 3?
A37. Yes.
III. NEC CONTENTION 4/
(flow-accelerated corrosion management plan)
Q38. In response to Entergy's Prefiled Testimony on NEC Contention 4, pleasesummarize your view of Entergy's proposed Aging Management Program (AMP) for FlowAccelerated Corrosion at Vermont Yankee Nuclear,Power Station
A38. The NEC position on Flow Accelerated Corrosion, FAC, is that Entergy does not haye a
reliable plan to monitor FAC and therefore the public has no assurance that susceptible 'reactor
components will be repaired and replaced in time to prevent pipe rupture or major leaks. Such
damage to piping must be prevented not only during normal plant operation but also during
design basic accidents (DBAs) in accordance with 10 CFR 50.49 (b) (2). The LRA must include
.an adequate plan to monitor FAC pursuant to 10 CFR 54.21 (a) (3).
The reason Entergy's FAC plan as described in the LRA is inadequate is because it is
based on EPRI guidelines NSAC-202 L, which largely rely on an unproven computer code called
CHECWORKS to predict corrosion rates and therefore the scope of the inspection. I evaluated
the NSAC/CHECWORKS methodology and provided the results to the ASLB on April 28, 2008.
Exhibit NEC-JH_36. I concluded that 12-15 years would be required to benchmark
CHECWORKS at VY at the uprate conditions and with a smaller inspection grid size. I also
recommended a methodology that 'Would more adequately inspect pipes for potential failures
from FAC.
25
I"
I pointed out that several factors contribute to the inability of the NSAC/ CHECWORKS
methodology to prevent pipe ruptures from unpredicted wall thinning: (a) incorrect local
inspection procedures, i.e selection of grid size, (b) unscientific sampling of components, (c)
inability to reliably predict corrosion rates between inspections, (d) no online instrumentation to
monitor the potential for corrosion, and (e) lack of independent assessment by competent
experts.
Q39. In your opinion, does Entergy's prefiled testimony appropriately address the issuesraised in your assessment of Entergy's aging management program for FAC?
A39. No. Rather than provide a reply to the NEC and describe scientifically why NEC and
Entergy differ regarding the various uncertainties in predicting wall-thinning rates, Entergy
produced several documents that stated that CHECWORKS is .a reliable predictive tool.
For instance, Entergy submitted an EPRI document (E4-09), which is no more than a
sales brochure; it provided the sale price of CHECWORKS and informed the reader that no plant
that acquired CHECWORKS has experienced FAC failures in pipes larger than 2 inches. No
comparison was made with the plants and components that were not included in the
CHECWORKS program since it was introduced in 1987 and also no explanation was given as to
why the pipe size was that significant. This brochure also did not tell the reader that FAC was
defined in a manner that would exclude pipe failures from erosion/corrosion, droplet
impingement and cavitations erosion.
Entergy's statement that no one was killed in plants that used CHECWORKS, and the
fact that pipes larger than 2 inches did not rupture in such plants is certainly not a credible
26
demonstration that the use of CHECWORKS would satisfy 10 CFR 50.49 (b) (2) and 10 CFR
54.21 (a) (3).
Q40. Entergy witness Dr. Horowitz testifies that unanticipated piping failures that haveoccurred despite the widespread use of CHECWORKS are not an indicator of the relativeefficacy of CHECWORKS. Do you agree?
N
A40. No, I do not. CHECWORKS is a proprietary product of EPRI and Dr. Horowitz is
EPRI's contractor; thus, it is understandable that Dr. Horowitz would zealously defend
CHECWORKS. He fails, however, to credibly explain away CHECWORKS' failure to predictI
the hundreds of unanticipated FAC-related failures that occurred in PWRs and BWRs. Dr.
Horowitz testified (A52) that the problem was not with CHECWORKS and its predecessorJ
programs, but rather the unpredicted failures occurred because of (a) improper use of
CHECWORKS, (b) exclusion of components from the program, (c) modeling errors, (d)
improper inspection, (e) poor communication, and (f) failures from erosion rather than FAC
(A46). The fact that many components were not included in the CHECWORKS programs and
that Dr. Horowitz selected a very narrow definition of FAC, or that CHECWORKS is susceptible
to improper use provides no assurance to the public that pipe failures from wall thinning will be
prevented and people and property will not be at risk. Even if, for the sake of argument,
CHECWORKS has the potential to predict wall thinning with extreme accuracy but, as Dr.
Horowitz says, many components may be excluded from the program, and CHECWORKS i s
prone to user's errors, then CHECWORKS cannot be considered a reliable predictive FAC tool
for purposes of assuring public health and safety. Dr Horowitz failed to state what percentage of
the total susceptible area in a given plant is included in the CHECWORKS program during a
typical outage..,J
27

Q41. Do you agree with Entergy's position regarding the effect of flow velocity on FAC?
A41. No, I do not. NEC's presentation of how FAC rates vary with flow velocity is
significantly different from Entergy's. NEC's position is based on data from tests that were
conducted by the Central Electricity Research Laboratories at Leatherhead. The data was
discussed and presented on pages 4 and 20 of Exhibit NEC-JH_36, showing the dependence of
measured corrosion rates on the mass transfer coefficient for carbon and mild steel. The
dependence of the mass transfer coefficient on velocity was discussed in NEC-JH-_36 at 4. Also,
the relation between corrosion and material composition was discussed on, pages 4 and 21.
Copper was not included in this discussion since it is not a common piping material in nuclear
plants.
'According to Entergy's witness Dr. Horowitz, the data in CHECWORKS is based on
references given in E-4-22 and E-4-23. The first paper presented data on the local variation of
the mass transfer with velocity and the second paper presented data on the dependence of the
corrosion rate of copper with the velocity in flowing hydrofluoric acid. These papers hardly
support Entergy's position that the corrosion rate corresponds very weakly with the velocity and
therefore the velocity change due to the power uprate is of no significance. Dr. Horowitz did not
demonstrate that the mechanism of copper dissolution in acids is the same as the dissolution of
iron in the LWR environment.
It is beyond NEC's scope to conduct an uncertainty study on the impact of the various
assumptions that were incorporated in CHECWORKS.
As discussed in my assessment of Entergy's FAC program, Exhibit NEC-JH_36, the
NRC has developed specific guidelines for how computer codes that are used for licensing bases
28
should be qualified. There is no indication that CHECWORKS has been thoroughly reviewed by
the NRC or by a third party with no financial interest in the outcome of the review.
Dr. Horowitz provided no data that shows a comparison between CHECWORKS
predictions and VY plant data prior to the power uprate. He stated-that 4.5 years will be
sufficient to assure that CHECWORKS will predict FAC reliably at the 20% power uprate. Dr.
Horowitz provided no support whatsoever to this statement.
Q42. In your opinion, has Entergy satisfactorily addressed the major variables affectingthe rates at which pipe thinning may occur?
A42. No, Entergy has failed to.either take into account numerous physical phenomena
affecting FAC, or to credibly explain why these well-knovn physical phenomena should not be
considered in aging management of plant piping.,
For example, despite overwhelming evidence to the contrary, Dr Horowitz denies that
FAC is fundamentally a local phenomenon due to the variations of local turbulence in. curved
pipes, nozzles,'tees, orifices, etc. See, Exhibits NEC -JH_53 at 48, 65 and NEC-JH_40 (It is
common knowledge, for example, that the wall thinning on the extrados of elbows is
considerably higher than on the intrados).
Further, Entergy's witness also denied (A47) that FAC varies with time and supported his
claim with inadequate laboratory data because the test period was relatively very short. Data
from longer tests, but still relatively short compared to plant life, show that corrosion rates
generally vary with time. See, Exhibit'NEC-JH_53 at 58.
These factors are important because they determine the scope of the FAC inspection
program. Dr., Horowitz found it sufficient to dismiss these issues by summarily stating without
29
supporting documentation (A42) that analytical work done by the industry and
NSAC/CHECWORKS guidelines are adequate and sufficient and therefore a more thorough
inspection with denser grids as discussed in my report, NEC-JH_36 at 15, is not required.
Q43. In your opinion, are there other factors affecting the prediction of pipe thinning thatEntergy should have considered and yet failed to discuss?
A43. Yes, Entergy witness Dr. Horowitz did not address in a meaningful manner any of the
following factors:
0 How the effects of flow disturbances due to discontinuities, including those that
were created by local corrosion, are accounted for in CHECWORKS
0 How variation in local velocities in elbows, tees, orifices and nozzles are
accounted for in grid size selection.
N How an empirical code such as'CHECWORKS, which is based on data scatter of
+60% and - 70%, can be considered a reliable predictive tool for corrosion rates.
M What is the scientific basis for component selection for the CHECWORKS
program?
0 What fraction of the total FAC-susceptible area is inspected during atypical
plant outage?,K
M Why was there no significant reduction in total pipe failures from FAC following
the release of CHECWORKS to the industry in mid 1987?
Q44. In considering aging management of piping, should a distinction be drawn betweenpiping failures due to leaks and piping failures due to ruptures?
30
A44. Not really. Apparently to diminish the significance of failures from local corrosion, Dr.
Horowitz makes a distinction (A47) between pipe failures due to leaks and failures from
ruptures. It is absurd to make'such a distinction without relating the "rupture" and the "leak," to a
particular accident scenario. As an extreme example, under certain accident scenarios the
aggregate flow from many small leaks in a pipe can exceed the choked flow from a single
ruptured pipe. In any event, the NRC has not yet adopted the "leak before break" scenario. If
Dr. Horowitz is trying to justify the use of CHECWORKS because leaks from local corrosion
and failures in piping under 2 inches in diameter are less important than ruptures from larger
diameter pipes, he should cite the appropriate authorities that reached such conclusions, or he
should present the differences between leaks and ruptures in terms of their contribution to the
core damage frequency.
Q45. Do you agree with Entergy's witness at A5 that FAC nfay be defined by excluding
corrosion where there is m abrasion of the protective oxide layer at A5?
A45. I do not think that this is apractical definition of FAC. This is a very narrow definition
of FAC that has been introduced in the last 15 years or so. Prior to that time, FAC was
commonly referred to as erosion/corrosion. According to Dr. Horowitz's definition, FAC is
defined as a process where there is no abrasion of the protective oxide layer. As discussed in
Exhibit NEC-RH_03 at 8 and 9, the shear at the wall as a result of the velocity gradient can, if
not destroy, definitely damage the protective oxide film. Therefore, there is no theoretical
justification for such a narrowing of definitions., Moreover, there is no practical way to
determine whether a given failure was caused'by pure metal dissolution or in combination with
oxide layer damage by shear- or cavitations-induced stresses. In areas where there is a large
pressure drop, such as in discharge piping from pumps, both cavitations and FAC may cause
31
wall thinning. Since, according to Dr. Horowitz, CHECWORKS is limited to predicting wall
thinning by dissolution, only that type of potential pipe failure will be detected.
Dr. Horowitz also implies at A5 that small leaks result from erosion, not from FAC. I
don't believe that this has been shown to be the case. The need to prevent wall thinning and
piping leaks is dictated by safety considerations and not by selective and narrow definitions.
Other causes of wall thinning (droplet impingement, cavitation, erosion, pitting) should not be
excluded from inspection programs because CHECWORKS predictions of wall thinning do not
account for such mechanisms.
Q46. At A34, Entergy's witness asserts that there is no need to calibrate CHECWORKS
following the power uprate at VY. Did he provide support for this assertion?
A46. No. Dr. Horowitz provides no support for his assertion that there is no need to calibrate
CHECWORKS following the power uprate at VY. As I have discussed in my report, Exhibit
NEC-JH_36 at 4, the corrosion rate can vary by as much as the velocity to the 6th power.
Q47. At A38, Dr. Horowitz states that NEC is only concerned with CHECWORKS andnot with the FAC program at VY. Is that a correct interpretation of NEC's position?
A47. No, it wis not. NEC is conceirned with the FAC program because its validity is based in
large part on the use of CHECWORKS, which NEC considers unreliable. The scope of the FAC\
program, mainly how many components are inspected, what is the grid size, and how often to
inspect a given component depend on the ability to predict corrosion rates. Since Entergy
identified CHECKWORKS as the only tool that predicts and selects components for inspection,
obviously CHECKWORKS is a focus of attention. Entergy never provided any specific
information about other tools that are used to detect wall thinning.
32
Q48. At A39, 40 and 41, Dr. Horowitz denies that 10-15 years would be required tocalibrate CHECWORKS. Does he provide supporting data? And do you now agree withhis position?
A48. Entergy's witness provides absolutely no data to support his position. Paraphrasing the
EPRI guidelines NSAC 202L and pointing out that VY has been collecting FAC data since 1989
does not explain how an empirical code, which presumably was calibrated under one set of
operating conditions, can reliably predict FAC under different conditions without recalibration.
Dr., Horowitz does not discuss how CHECWORKS meets the NRC requirements for using
analytical codes in power plants. Such codes must be assessed and benchmarked against
measured plant data. The benchmarking must be valid within the range in which the data was
provided. Exhibit NEC-JH_35 at 190
I absolutely disagree with Entergy's witness. FAC in most cases is a slow process; the
fact that some selected components have as yet shown no measurable wall thinning as a result of
the uprate proves nothing. As pointed out in NEC -JH_36 at 15 and 16, this is the reason why 12
to 15 years would be required to monitor all the susceptible components to establish' confidence
in the ability of predicting the scope of FAC inspection during refueling outages.
Contrary to commonly accepted engineering principles, Entergy's witness insists that
there is no need to calibrate the code even though plant conditions have changed. Further, even
though he does not characterize it as calibration, Dr. Horowitz recognized the need to increase
the inspection scope by 50% to account for the power uprate. He did not disclose, however,
what fraction of the total FAC-susceptible area in the VY plant the proposed increased
monitoring would represent.
33
Q49. At A42, Mr. Fitzpatrick and Dr. Horowitz claim that CHECWORKS and EPRI
guidelines and 30 years of research have eliminated the need to increase the scope of FACinspection as recommended by NEC. Are they correct?
A49. No. Entergy's witnesses failed to point out the hundreds of pipe failures both small and
large in the last 30 years, including the Surry accidents. They dismiss many as not relevant
because CHECWORKS was either not available or was not properly used. They failed to
mention that EPRI guidelines were published before the Surry and-the Trojan accidents. See,
Erosion/Corrosion in Nuclear Steam Plant Piping: Causes and Inspection Program Guidelines,
EPRI 3944s, April 1985.
Q50. Dr. Horowitz has complained at A39, A40 and A41 of his testimony that failures atSan Onofre Unit 3, Millstone and Sequoyah were not included in the 16 years averagedescribed in Exhibit NEC-JH_36 at Table 2. How do you respond?
A50. Table 2 was not intended to cover all reactor accidents. It was focused primarily on
major and risk-significant components and included both short exposure time and long exposure
time failures. Contrary to Dr. Horowitz's statement, Sequoyah was included in Table 2. I agree
with him that many more components could have been included in Table 2, however, I doubt that
expanding the list would affect the conclusion that more than 15 years can pass before a major
FAC-related failure would occur.
Q51., At A44, Dr. Horowitz appears to suggest that the oxygen concentration at VY did
not change in 2003. Is he wrong? /
A51. Yes, as shown below he is wrong, and his statements are misleading. See, Exhibit NEC-
JH_36 at 15. VY did reduce the oxygen content in the plant in 2003. Exhibit NEC-JH_1 8 at 3.2
states the date when the switch from NWC to HWC was made. Entergy's CUFen calculations at
lower oxygen concentrations, which NEC's Contentions 2A and 2B address, were based on that
34
date. Plant data on oxygen concentrations show that, with the exception of the feedwater line,
there was a significant, reduction in oxygen in the plant. See, Exhibit NEC-JH_06 at A2.
Furthermore,
If Dr. Horowitz restricts his comment to the feedwater line only, he is misrepresenting
NEC's position, which clearly indicated that discussion was not restricted to the feedwater line.
Q52. At A45, Dr. Horowitz stated that he does not agree to the following statement youmade in your report, Exhibit NEC-JH 36 at 15: "The observation that CHECWORKS canbound plant data between 100-200 mils/year . . . without specifying how each variable
separately effects corrosion, does not address the issue of how the corrosion rate at a givenlocation would be affected when the velocity changes by 20% at a• given plant." How doyou respond?
Even though the above is a key issue in NEC Contention 4, Dr. Horowitz finds it
sufficient to provide a non-specific and non-quantitative reply. He completely ignores the
lengthy discussion in my report, Exhibit NEC-JH_36,at 2-6.
Dr. Horowitz merely states at A45:
As discussed above, the correlations built into CHECWORKS are based onlaboratdry experiments on modeled geometries, published correlations, andoperating data from many nuclear units.
Dr. Horowitz did not provide any correlations, that are used in CHECWORKS. And the data that
was published (See, Exhibit NEC-JH_36 at 24) shows clearly that CHECWORKS predictions
are not consistent with plant observations.. Moreover, the predictions vary between + 60% and
35

70%. Further, the predictions do not indicate how the local corrosion for a given component
would be affected by. changes in velocity.
Dr. Horowitz's reference E4-09 provides only a list of several plants with recent uprates
above. 15% and a statement that there were no major piping failures in the above plants. I
emphatically do not agree with Entergy's witness that this somehow constitutes a scientific proof
that CHECWORKS can predict FAC rates following changes in plant operating conditions.
Again, he has neglected to indicate what fraction of the total piping would be included in the
CHECWORKS program.
Q53. At A47, Dr. Horowitz states that you are incorrect that FAC is a non-linear
phenomenon. Please respond.
A53. In my report, Exhibit NEC-JH_36 at 4 and 19, I provided an-explanation as to why FAC
varies locally and may not be linear. It should also be noted that the time~scale for the
nonlinearity was not specified in the model. Since FAC represents a slow process,/the time scale
may be on the order of years, not hours.
Dr. Horowitz cites Exhibit E4-19, Figures 7-6, and E-4-08 Figures 3-6 and 3-7. These
figures do not support his statement by any stretch of the imagination. As discussed in Exhibit
NEC-JH_36 at 5, laboratory data introduce scaling issues and the test duration is limited. The
tests in E4-19 are short duration tests (500-2000 hrs). Even if one accepts Dr. Horowitz's
argument that 4.5 yearswould be sufficient to benchmark CHECWORKS, the cited tests/
represent a time period which is only 1-5 % of the total time of interest. The tests were
conducted on small mild steel specimens of unknown initial surface finish.
36
The extrapolation of the above results to real components (including plain carbon steel)
that have been exposed to the reactor environment for 35 years under a range of operating
conditions is ludicrous.
The tests in Figures E4-08, Figures 3-6 and 3-7, were conducted for an even shorter
period of time (400-650 hrs ). They were conducted to test the effect of copper ions on
corrosion, and provide no information whatsoever on the linearity of FAC. Furthermore the
corrosion rates were determined by measuring very small changes in activity of the specimen.
They represent only the average corrosion rate at the surface of the entire specimen. This has
nothing to do with the time-dependent phenomena discussed in my report, Exhibit NEC -JH_36
at 4 and 19.
At A47, Dr. Horowitz makes the following statement:
With respect to the allegedly local nature of FAC wear, although local FAC wearis occasionally seen - normally near a geometric discontinuity - such local wearusually results in only minor effects (e_, leaks).; The normal feature of FACwear - widespread wear over an extended area- is what causes significantproblems (e..g the need for pipe replacements or the occurrence of piperuptures).
Welds, entrance and exits to and from nozzles, elbows, and surface roughness, as discussed in
Exhibit NEC -JH_36 at 4 and 1'9, are all discontinuities. I cannot fathom how Dr. Horowitz can
imply that these are not important.
Dr. Horowitz also misinterprets the use of the word local. In the context of this
discussion, "local" refers to pipe segments which can vary from a square inch or so to hundreds
of square inches. It- also can refer to surface discontinuities.. Surfaces will exhibit a combination
of uniform, smooth and rough areas. As already mentioned above, the corrosion in elbows is
37
p\
normally found on the extrados, whether or not it is uniform. The wall thinning is local with
respect to the elbow and it can be approximately uniform within a given section of the
component. When the corrosion is not linear with time and the corrosion attack can be highly
local, it makes prediction of future rates and wall thickness measurements very difficult.
Dr. Horowitz is distracting from this issue by focusing on making distinctions between
pipe ruptures and pipe leaks. His characterization of the failure at Surry is completely wrong.
Dr. Horowitz stated at A47: "By contrast, at Surry, there was not localized wall thinning," and
"The global nature of the FAC damage is consistent with experience of FAC induced rupture."
Dr Horowitz is contradicted by a TVA, document authored by D. W. Wilson, Project Engineer at
Sequoyah. Referring to the Surry accident, Mr. Wilson stated: "The rupture was caused by
localized wall thinning at a pipe to elbow weld. The thinning was identified as erosion-
corrosion." Exhibit NEC-JH-_70 at 2.
I personally have not conducted a detailed failure analysis, but I did notice the
combination of uniform and non-uniform appearance of the elbow surfaces while visiting the
Surry plant shortly after the accident in December 1986.
Dr. Horowitz appears to be confusing the nature of wall thinning with' pipe rupture or a
pipe leak. Whether a pipe ruptures or develops a small leak would depend on the degree of wall
thinning and the nature and intensity of the applied loads. Making a distinction between a pipe
rupture or a large leak is rnot important unless one can demonstrate that a given leak will not lead
to a catastrophic core melt. The NRC has not yet accepted the. concept of "leak before break."
The three ruptures that Dr. Horowitz described at A47 occurred at normal operating conditions.
A valid FAC program must also protect the pipes from design basis loads. It is apparent to me
38
that Dr. Horowitz, though he is undeniably very zealous about CHECWORKS, has not
considered the many different safety issues which are associated with wall thinning.
Q54. At A48, Dr. Horowitz disputes your view that it is'the local velocity and not thecalculated average velocity that controls local turbulence. Please respond.
A54. Dr. Horowitz misrepresents my view of this issue stated in Exhibit NEC-JH_36 at 3. It is
incorrect for Dr. Horowitz to state that I have stated that a pressure drop across complex
geometries would have required CFD type calculations because of my statement that wall
thinning varies with the local characteristics of FAC. See,.Exhibits NEC -JH_53 at 48, 65 and
NEC-JH_40. I never stated that pressure drop calculations would commonly require CFD type
analysis. The analogy with pressure drop is not valid, because here one is interested in the
pressure drop across the entire co'mponent, not in the local variation of the pressure drop,
experimental Kc values are sufficient to determine pumping requirements. Failures due to FAC
are local and require the local velocity for valid assessment. A simple proof of this point is the
fact that surfaces on the outer diameter of bends wear faster than those on the inner diameter. As
pointed out in Exhibit NEC-JH_36 at 3, the average velocity may remain the same but the local
corrosion rate may increase due to local geometry changes.
Table 3-1 and Table 7-1 in E4-08 contain average mass transfer coefficients as discussed
in NEC-JH_36 at 2, 3 and 4. These coefficients can be-obtained in any mass or heat. transfer
handbook; they have little to do with the determination of the local variation of corrosion rates in
various components. This only indicates that CHECWORKS can be used as a general screening
tool, i.e. comparing various geometries with respect to their vulnerability to FAC damage, a fact
which NEC never denied. Figure 7-2 only verifies NEC's contention that corrosion rates vary
with location depending on the intensity of the local turbulence. The factor A in that figure
39
comes from EDF data and varies by an order of magnitude, depending on the component, with
an RMS of 50%. A represents the total mass transfer coefficient, not the local variation of the
mass transfer coefficient. The equation A =A + BxA is not referenced and its validity is not
explained. It is apparently an attempt to account for local variations of turbulence under some
unspecified condition. The above equation may be used for screening components but not to
predict local corrosion rates as, for example, described in Exhibits NEC-JH_53 at 65 and NEC -
JH_36 at 3, where the increase in the local turbulence intensifies the rate of corrosion. If wall
thinning was measured at Unit 1 at the Ohi power station according to an equation of the type
shown above, it would not have predicted the intense local thinning at the end of the curved
section of the pipe. See, Exhibit NEC -JH_53 at 65.
Q55. NEC-JH_36 at 3 explained in detail that the local mass transfer coefficients incurved pipes in turbulent flow are expected to vary as the velocity square becauseturbulent mixing is promoted by the centrifugal force which varies with the square of thevelocity. Also as indicated in NEC-JH_40 at Eq 22, erosion by droplet impingement varieswith the square of droplet velocity At A49, Dr, Horowitz disputes this observation. Howdo you respond?
A55. Dr. Horowitz provided no relevant data to support his statement in A49. The figures in
E4-22 and 23 do not dispute the dependence of the mass transfer coefficient in fully developed
turbulent flow straight tubes and curved pipes. They are completely irrelevant to the issue raised
by Q49.
With regard to my observation that the mass transfer coefficient varies with the 0 .8 th
power, Dr. Horowitz appears to agree by saying that the mass transfer varies between 0.5 and
1.0. The 0.5 is related to laminar flow and my observation was addressed to turbulent flow.
Without providing any support, Dr. Horowitz makes the bald statement that the corrosion rate is
40
directly proportional to the mass transfer coefficient. In NEC-JH_36 at 4 and 20, 1 discussed and
provided a considerable amount of data showing that the corrosion rate may vary as the cube of
the mass transfer coefficient, and therefore as a power of 2.4 to 6 of the velocity.
Dr. Horowitz's unsupported statement that data from all sources shows that erosion rate
varies less than linearly is-simply not true.
Q56. At A50, Dr. Horowitz states that "the successful use of CHECWORKS and it's [sic]predecessor programs for more than 20 years provides additional support for the claimthat CHECWORKS is an effective tool for inspection planning." Please respond.
A56. The hundreds of pipe failures during this period, as documented by NEC, certainly do
not support that statement. See, Exhibit NEC-JH_36 at 8, 9 and 10.
Q57. At A56, Dr. Horowitz comments on your statement that Entergy believes that "thelength and the highest velocities control corrosion." Dr. Horowitz asserts that this quote islifted from ACRS transcripts. Is he correct?
A57. Dr. Horowitz is wrong. This statement was not taken from ACRS transcripts. It is not
taken out of context, nor is it misunderstood. The statement was made by Entergy directly in
reply to NECks Petition and not in a reply to the ACRS. See, Entergy's Answer to New England
Coalition's Petition for Leave to Intervene, Request for Hearing, and Contentions (June 22,
2006) at 33.
Q58. Please list any references to this testimony that were not filed as Exhibits to yourdirect testimony.
A58.
1. Memorandum to H.L. Abercrombie, Site Director, Sequoyah Nuclear Plant fromD.W. Wilson, Project Engineer, Sequoyah Nuclear Plant, "Sequoyah NuclearPlant Units 1 and 2 - Preliminary Report on the Condensate-Feedwater PipingInspection - Suspected Erosion-Corrosion Areas (January 27, 1987). ExhibitNEC-JH_70.
41
I also now submit two papers cited as references to my FAC report in support of NEC's
Statement of Initial Position, Exhibit JH-NEC_36:
1. G.J. Bignold, et al, Paper 1, Water Chemnistry II, BNES, 1980. Exhibit NEC-J1H71.
2. I.S. Woolsey. et. al., "Paper 96. The influence of oxygen and hydrazine on theerosion-corrosion behavior and electrochemical potentials of carbon steel underboiler feedwater conditions. Exhibit NEC-JH_72.
Q59. Does that complete your rebuttal testimony?
A59. Yes.
lK
142
OG/02/20"8 1: 26 3017623511 NOVERFLO PAGE 01
I declare under penalty of perjury that the foregoing is true and oaTctrt.
i•im Hopelife d,
,=;Z. e)a
At , Maryland, this day of May, 2008 personally appearedJoram Hopenfeld, and having subscribed his name acknowledges his signature to be hisfree act and deed.
Before me:
Notary Phtblic
My Commission Expires
NEC-JH_64
I~I~2 iiELECTRIC POWER~IRESEARCH MNSTITUTE
Materials. Reliability Program:Guidelines for Addressing FatigueEnvironmental Effects in a LicenseRenewal Application(MRP-47, Revision 1),
Technical Report
Materials Reliability Program:Guidelines for Addressing ,FatigueEnvironmental Effects in a LicenseRenewal Application(MRP-47 Revision 1) I
1012017
Final Report, September 2005
EPRI Project ManagerJ. Carey
ELECTRIC POWER RESEARCH INSTITUTE3420 Hillview Avenue, Palo Alto, California 94304-1395 • PO Box 10412, Palo Alto, California 94303-0813 ° USA
800.313.3774 * 650.855.2121 - [email protected] ° www.epri.com
DISCLAIMER OF WARRANTIES AND LIMITATION OF LIABILITIES
THIS DOCUMENT WAS PREPARED BY THE ORGANIZATION(S) NAMED BELOW AS ANACCOUNT OF WORK SPONSORED OR COSPONSORED BY THE ELECTRIC POWER RESEARCHINSTITUTE, INC. (EPRI). NEITHER EPRI, ANY MEMBER OF EPRI, ANY COSPONSOR, THEORGANIZATION(S) BELOW, NOR ANY PERSON ACTING ON BEHALF OF ANY OF THEM:
(A) MAKES ANY WARRANTY OR REPRESENTATION WHATSOEVER, EXPRESS OR IMPLIED, (I)WITH RESPECT TO THE USE OF ANY INFORMATION, APPARATUS, METHOD, PROCESS, ORSIMILAR ITEM DISCLOSED IN THIS DOCUMENT, INCLUDING MERCHANTABILITY AND FITNESSFOR A PARTICULAR PURPOSE, OR (11) THAT SUCH USE DOES NOT INFRINGE ON ORINTERFERE WITH PRIVATELY OWNED RIGHTS, INCLUDING 'ANY PARTY'S INTELLECTUALPROPERTY, OR (111) THAT THIS DOCUMENT IS SUITABLE TO ANY PARTICULAR USER'SCIRCUMSTANCE; OR
(B). ASSUMES RESPONSIBILITY FOR ANY DAMAGES OR OTHER LIABILITY WHATSOEVER(INCLUDING ANY CONSEQUENTIAL DAMAGES, EVEN IF EPRI OR ANY EPRI REPRESENTATIVEHAS BEEN ADVISED OF THE POSSIBILITY OF SUCH DAMAGES) RESULTING FROM YOURSELECTION OR USE OF THIS DOCUMENT OR ANY INFORMATION, APPARATUS, METHOD,PROCESS, OR SIMILAR ITEM DISCLOSED IN THIS DOCUMENT.
ORGANIZATION(S) THAT PREPARE'D THIS DOCUMENT
Structural Integrity Associates, Inc.
ORDERING INFORMATION
Requests for copies of this report should be directed to EPRI Orders and Conferences, 1355 WillowWay, Suite 278, Concord, CA 94520, (800) 313-3774, press 2 or internally x5379, (925) 609-9169,(925) 609-1310 (fax). (
Electric Power Research Institute and EPRI are registered service marks of the Electric PowerResearch Institute, Inc.
Copyright © 2005 Electric Power Research Institute, Inc. All rights reserved.
CITATIONS
This report was prepared by
Structural Integrity Associates, Inc.6855 South Havana Street, Suite 350Centennial, CO 80112
Authors:Gary L. Stevens, P.E.
and:
J Michael Davis, P.E.Duke Energy
This report describes research. sponsored by the Electric Power Research Institute (EPRI).
The report is a corporate document that should be cited in the literature in the following manner:
Materials Reliability Program: Guidelines for Addressing Fatigue Environmental Effects in aLicense Renewal Application (MR'P-47 Revision 1). EPRI, Palo Alto,CA: 2005. 1012017.
iii
REPORT SUMMARY
For about the last 15 years, the effects of light water reactor environment on fatigue have beenthe subject of research in both the United States and abroad. Based on a risk study reported in.NUREG/CR-6674, the NRC concluded that reactor water environmental effects were not asafety issue for a 60-year operating life, but that some limited assessment of its effect would berequired for a license renewal extended operating period beyond 40 years. This guideline offersmethods for addressing environmental fatigue in a license renewal submittal.
BackgroundMany utilities are currently embarking upon efforts to renew their operating licenses. One of thekey areas of uncertainty in this process relates to fatigue of pressure boundary components.Although the NRC has determined that fatigue is not a significant contributor to core damagefrequency, they believe that the frequency of pipe leakage may increase significantly withoperating time and have requested that license renewal applicants perform an assessment todetermine the effects of reactor water coolant environment on fatigue, and, where appropriate,manage this effect during the license renewal period. As the license renewal application processprogressed starting in 1998, several utilities addressed this request using different approaches. Inmore recent years, a unified approach has emerged that has obtained regulator approval andallowed utilities to satisfactorily address this issue and obtain a renewed operating license for 60years of plant operation.
Objectives-. To provide guidance for assessment and management of reactor coolant environmental
effects
To minimize theamount of plant-specific work necessary to comply with NRC requirementsfor addressing this issue in a license renewal application
To provide "details of execution" for applying the environmental fatigue approach currentlyaccepted by the NRC in the license renewal application process.
/
ApproachThe project team reviewed previous work by EPRI and utilities related to fatigue environmentaleffects and license renewal including reports on this subject created by EPRI, NRC, and NRCcontractors. Recent license renewal applications, NRC Requests for Additional Information, andthe commitments made by the past license renewal applicants provided insight into NRCexpectations. After evaluation of all this information, the project team developed alternatives foraddressing fatigue environmental effects. This revision provides guidelines based on industryexperience, consensus, and insight gained from more than six years of experience with this issueand the license renewal approval process.
v

ResultsThe report describes a fatigue environmental effect license renewal approach that can be appliedby any license renewal applicant. It provides guidelines for performing environmental fatigueassessments using fatigue environmental factors from currently accepted Fen methodology.
EPRI PerspectiveUtilities have committed significant resources to license renewal activities related to fatigue.Based on'intut from applicants to-date, NRC requirements for addressing fatigue environmentaleffects, continued to change for the first few applicants, but more recently have become moreunified. These guidelines were developed to provide stability, refined guidance, and assurance ofNRC acceptance and include an approach that may be taken to address fatigue environmentaleffects in a license renewal application. Use of the approach provided in this document shouldlimit the amount of effort necessary by individual license renewal applicants in addressing thisrequirement and putting activities in place for the extended operating period to manage-reactorwater environmental effects on fatigue.
KeywordsFatigueLicense RenewalReactor Water Environmental Fatigue Effects
vi
/
ABSTRACT
For about the last 15 years, the effects of light water reactor environment on fatigue have beenthe subject of research in both the United States and abroad. The conclusions from this researchare that the reactor water temperature and chemical composition (particularly oxygen content orECP) can have a significant effect on the fatigue life of carbon, low alloy, and austenitic stainlesssteels. The degree of fatigue life reduction is a function of the tensile strain rate during atransient, the specific material, the temperature, and the water chemistry. The effects of otherthan moderate environment were not considered in the original development of the ASME CodeSection III fatigue curves.
This issue has been studied by the Nuclear Regulatory Commission"(NRC) for many years. Oneof the major efforts was a program to evaluate the effects of reactor water environment for bothearly and late vintage plants designed by all U.S. vendors. The results of that study, published inNUREG/CR-6260, showed that there were a few high usage factor locations in all reactor types,and that the effects of reactor water environment could cause fatigue usage factors to exceed the-ASME Code-required fatigue usage limit of 1.0. On the other hand, it was demonstrated thatusage factors at many locations could be shown acceptable by refined analysis and/or fatiguemonitoring of actual plant transients.
Based on a risk study reported in NUREG/CR-6674, the NRC concluded that reactor waterenvironmental effects were not a safety issue for a 60-year operating life, but that some limitedassessment of its effect would be required for a license renewal extended operating periodbeyond 40 years. Thus, for all license renewal submittals to-date, there have been formal -
questions raised on the topic of environmental fatigue and, in all cases, utility commitments toaddress the environmental effects on fatigue in the extended operating period. Many plants havealready performed these commitments.
/This guideline offers methods for addressing environmental fatigue in a license renewalsubmittal. It requires that a sampling of the most affected fatigue sensitive locations beidentified for evaluation and tracking in the extended operating period. NUREG/CR-6260locations are considered an appropriate sample for Fe, evaluation as long as none exceed theacceptance criteria with environmental effects considered. If this occurs, the sampling is to beextended to other locations. For these locations, evaluations similar to those conducted inNUREG/CR-6260 are required. In the extended operating period, fatigue monitoring is used forthe sample of locations to show that ASME Code limits are not exceeded, If these limits areexceeded, corrective actions are identified for demonstrating acceptability for continued-operation.
vii

.Using the guidance provided herein, the amount of effort needed to justify individual licenserenewal submittals and respond to NRC questions should be minimized, and a more unified,consistert approach should be achieved throughout the industry. More importantly, this revisionprovides "details of execution" for applying the environmental fatigue approach currentlyaccepted by the NRC in the license renewal application process.
viii
CONTENTS
1 INTRODUCTION .................................................................................................................... 1-1
1 .1 O b je c tiv e s ....................................................................................... ............................... 1 -1
1.2 Compliance Responsibilities ........................................... 1-2
2 BACKGROUND .... ............................................................................................................... '2-1
2 .1 R ese a rc h R e su lts ............................................................................................................ 2 -1
2.2 License Renewal Environmental Fatigue Issue .............................................................. 2-2
2 .3 Industry/E P R I P rogram s ................................................................................................. 2-2
3 LICENSE RENEWAL APPROACH ........................................................................................ 3-1
3 .1 O v e rv ie w ......................................................................................................................... 3 -1
3.2 Method for Evaluation of Environmental Effects ............................................. I ............... 3-3
3.2.1 Identification of Locations for Assessment of, Environmental Effects ...................... 3-4
3.2.2 Fatigue Assessment Using Environmental Factors ................................................. 3-7
3.3 Alternate Fatigue Management in the License Renewal Period ................................... 3-10
3.4 Guidance-for Plants with B31.1- Piping Systems ........................................................... 3-10
3.5 Consideration of Industry Operating Experience ........................... I ....... 3-11
4 GUIDANCE FOR PERFORMING ENVIRONMENTAL FATIGUE EVALUATIONS ............... 4-1
4.1 Environmental Fatigue Factor (Fen) Relationships ....................................................... 4-1
4.2 Guidelines for Application of the Fen Methodology .......................................................... 4-3
4.2.1 Contents of a Typical Fatigue Evaluation ................................................................. 4-4
4.2.1.1 "O ld" C alculation (Figure 4-1) ......................................................................... 4-5
4.2.1.2 "New" Calculation (Figures 4-2 through 4-4) .................................................... 4-7
4.2.2 T ransform ed Strain R ate, k * ................................................................................ 4-11
4.2.3 Transformed Sulfur Content, S* ........................................................................... 4-16
4.2.4 Transformed Temperature, T* ...................................................................... ....... 4-16
J4.2.5 Transformed Dissolved Oxygen, 0* ..................................................................... 4-19
ix

4.2.6 A dditional C onsiderations ...................................................................................... 4A23
4.2 .7 S am ple C alculation ................................................................................................ 4-23
4.3 Issues Associated With Fen Methodology ................................. 4-25
5 C O N C LU S IO N S ..................................................................................................................... 5-1
6 R E FE R EN C ES ........................................................................................................................ 6-1
A SURVEY OF APPROACHES USED TO-DATE FOR ADDRESSING FATIGUEENVIRONMENTAL EFFECTS IN THE EXTENDED OPERATING PERIOD ........................ A-1
2
J/
x
LIST OF FIGURES
Figure 3-1 Overview of Fatigue Environmental Effects Assessment and Management ............ 3-4
Figure 3-2 Identification of Component Locations and Fatigue Environmental EffectsA sse ssm e nt ................ I .................................................................................................... 3 -6
Figure 3-3 Fatigue Management if Environmental Assessment Conducted .............. 3-9
Figure 4-1 Example of "Old" Fatigue Calculation ..................................................................... 4-6
Figure 4-2 Example of "New" Fatigue Calculation - CUF Calculation ....................................... 4-8
Figure 4-3 Example of "New" Fatigue Calculation - Load Pair Definitions ................................. 4-9
Figure 4-4 Example of 'New" Fatigue Calculation - Transient Definitions .............. 4-10
Figure 4-5 Detailed and Integrated Strain Rate Calculation ............... .................... ......... 4-15
Figure 4-6 Fen Values as a Function of Temperature ............................................................... 4-18
Figure 4-7 Fen Values as a Function of DO Level .................................................................... 4-22
Figure 4-8 Sample Environmental Fatigue Calculation ............................ 4-25
Figure 4-9 Issue of T ransient Linking ....................................................................................... 4-25
xi
INTRODUCTION
1.1 Objectives
The nuclear industry has discussed the issue of reactor water environmental fatigue effects withthe U. S. Nuclear Regulatory Commission (NRC) staff for several years. All of the licenserenewal applicants to-date have been required to commit to an approach to evaluate the effects ofreactor water environment on specific Class 1, reactor coolant system components for the licenserenewal term in order to obtain approval for a renewed license.
This report provides discussion of an approach that may be used for addressing reactor waterenvironmental effects on fatigue of reactor coolant system components in the extended operatingperiod (after 40 years). Specific guidance for calculating environmental fatigue usage factors forNUREG/CR-6260 [2] locations is provided using the methodology documented in NUREG/CR-6583 [3] and NUREG/CR-5704 [4]. This report does not provide guidance on addressing fatigueas a Time Limiting Aging Analysis (TLAA) per 10CFR54. The details of monitoring thermalfatigue for acceptance are contained in Reference [23].
k/
Thus; the objectives of this report are as follows:
1. To provide guidance for evaluating the effects of reactor water environmental effects onfatigue for license renewal applicants,
2. To provide specific guidance on the use of NUREG/CR-6583 for carbon and low alloy steels[3] and in NUREG/CR-5704 for austenitic stainless steels [4] in plant specific evaluations ofthe effects of reactor water environmental effects on fatigue,
3. To provide separate guidance for pressurized water reactors (PWRs) and boiling waterreactors (BWRs) to assist in the development of reasonable estimates for the significantparameters (e.g., oxygen, temperature, and strain rate) required by the environmental fatigueassessment methodology at evaluated locations,
4. To provide approaches for removing excess conservatism in existing fatigue analyses tooffset the impact of environmental effects,
5. To provide alternatives for managing environmental effects using flaw tolerance evaluationand inspection,
6. To provide guidance that minimizes the amount of effort needed to justify individual licenserenewal submittals and respond to NRC questions, and promote a more unified, consistentapproach throughout the industry, and
7. Incorporate "Lessons Learned" from ASME Code activities supported by the, MRPassociated with this topic.
1-1
Introduction
This guideline document includes appropriate logic to allow users to efficiently performienvironmental fatigue calculations for a plant pursuing license renewal activities. The-logic isprovided such that some components can be evaluated using simplified methods, whereas otherscan be evaluated using more complex methods.\
Finally, this document Mso summarizes the approaches for addressing fatigue environmentaleffects in the extended operating period used by those applicants that have already submitted thelicense renewal applications.
1.2 Compliance Responsibilities
The Industry Guidelines contained in this-report are considered to be "Good Practice".
1-2
2 /BACKGROUND
2.1 Research Results
NRC research in the area of reactor water environmental effects on fatigue began in the early1990s. Based on testing both in Japan and in the U.S., fatigue life in a light water reactor (LWR)environment was determined to be adversely affected by certain water chemistries, strainamplitude, strain rate, temperature and material sulfur content (for ferritic steels). Whereas LWRpressure boundary components are in contact with the reactor water at elevated temperatures, thefatigue curves in Section III of the ASME Boiler and Pressure Vessel Code were based on testingin air, primarily at room temperature, adjusted by a structural factor in-part to compensate fortemperature and "industrial" environments. In 1993, a set of "interim" fatigue curves for carbon,low alloy, and stainless steels were published in NUREG/CR-5999 [1] based on the results ofresearch testing at that point in time.
To determine the effects of the environment in operating nuclear plants during the current 40-year licensing term and for an assumed 60-year extended period, Idaho National EngineeringLaboratories (INEL) evaluated fatigue-sensitive component locations, and documented theirresults in NUREG/CR-6260 [2]. Using information from existing reactor component stressreports, supplemented by additional evaluations, cumulative fatigue usage factors (CUFs) werecalculated for plants designed by all four nuclear steam supply system (NSSS) vendors utilizingthe interim fatigue curves provided in NUREG/CR-5999 [1]. The results showed that CUFswould exceed 1.0 at several-locations, although the CUFs at many of these were shown to be lessthan 1.0 if excessive conseryatisms were removed from the evaluations.
Continued research led to changes to the fatigue curves utilized in deriving the results presentedin NUREG/CR-6260 [2]. The latest proposed environmental fatigue correlations are presentedin NUREG/CR-6583 [3] for carbon and low alloy steels and in NUREG/CR-5704 [4] foraustenitic stainless steels. These approaches do not use the revised fatigue curve approachoriginally defined in NUREG/CR-5999, but'instead employ a. selective environmental fatiguemultiplier, or Fe., approach that is defined as follows:
Nar
Fen =-airN water
2
where:, F environmental fatigue multiplierN. fatigue life (number of cycles) in air, at room temperature,N ..... fatigue life (number of cycles) in water (environment), at
temperature
2-1
Background
The fatigue usage derived from air curves is multiplied by F., to obtain the fatigue usage in theassociated environment.
More recently, an evaluation was conducted to assess the implications of LWR environments onreducing component fatiguefor a 60-year plant life. This study, based on the information inNUREG/CR-6260 [2] and documented in NUREG/CR-6674 [5], concluded that theenvironmental effects of reactor water on fatigue curves had an insignificant contribution to coredamage frequency. However, the frequency of pipe leakage was shown to increase in some cases.
2.2 License Renewal Environmental Fatigue Issue
The environmental fatigue issue for license renewal reached the current disposition via thecloseout of Generic Safety Issue 190 (GSI-190) [6] in December 1999. In a memorandum fromNRC-RES to NRC-NRR [7], it was concluded that environmental effects would have anegligible impact on core damage frequency, and as such, no generic regulatory action wasrequired. However, since NUREG/CR-6674 [5] indicated that reactor coolant environmentalfatigue effects would result in an increased frequency of pipe leakage, the NRC required'thatutilities applying for license renewal must address the effects of reactor water environments onfatigue usage in selected examples of affected components on a plant specific basis.
2.3 Industry/EPRI Programs
Following the issuance of NUREG/CR-6260 [2], EPRI performed several studies toquantitatively address the issue of environmental fatigue during the license renewal period.
The initial efforts were focused on developing a simplified method for addressing environmentalfatigue effects and evaluating more recent research results. The calculations reported inNUREG/CR-6260 [2] were based on the interim fatigue design curves given in NUREG/CR--5999 [1]. The conservative approach in NUREG/CR-6260 [2] and NUREG/CR-5999 [1] over-penalized the component fatigue analysis, since later research identified that a combination ofenvironmental conditions is required before reactor water environmental effects becomepronounced. The strain rate must be sufficiently low and the strain range mus't be sufficientlyhigh to cause repeated rupture of the protective oxide layers that protect the exposed surfaces ofreactor components. Temperature, dissolved oxygen content, metal sulfur content, and waterflow rate are examples of additional variables to be considered.
In order to take these parameters into consideration, EPRI and GE jointly developed a method,commonly called the Fen approach [8], which permits reactor water environmental effects to beapplied selectively, as justified by evaluating the combination of effects that contribute toincreased fatigue susceptibility.
2-2
Background
The F " approach was used in several EPRI projects to evaluate fatigue-sensitive componentlocations in four types of nuclear power plants: an early-vintage Combustion Engineering (CE)PWR [9], an early-vintage Westinghouse PWR [10], and both late-vintage [LI ] and early-vintage[12] General Electric (GE) BWRs. Component locations similar to those evaluated inNUREG/CR-6260 [2] were examined in these generic studies.
The NRC staff has not accepted the studies performed by EPRI [13], primarily because theenvironmental fatigue effects were based on data that was developed prior to the issuance of laterreports by Argonne National Laboratory (ANL) [3, 4]. The following issues were raised in aletter from NRC to the Nuclear Energy Institute [13]:
" The environmental fatigue correction factors developed in the EPRI studies were not basedon the latest ANL test report.
* The environmental factors developed in the EPRI studies were not based on a comparison ofenvironmental data at temperature to air data at room temperature.
* The NRC did not agree with the use of the reduction factors (Z-factors) of four (for carbonsteel) and two (for stainless steel) to account for moderate environmental effects (i.e., Feffectiv
Fen/Z-factor). Instead, the NRC staff believed that the maximum factors that could be usedwere three (for carbon steel) and 1.5 (for stainless steel).
" There was disagreement on the strain thresholds that were used.
* The NRC staff did not agree that credit could be taken for the cladding in omittingconsideration of environmental effects for the underlying carbon steel/low alloy steelmaterials, unless fatigue in the cladding was specifically addressed.
* The staff agreed with the use of a weighted average strain rate for computing environmentaleffects only if the maximum temperature of the transient was used.
Based on NRC review of more recent Japanese and ANL data, NRC believes that no creditshould be given for inherent margins with regard to moderate environmental effects [14], i.e., theabove factor of 4 (EPRI)/3 (NRC) for carbon and low alloy steels, and 2/1.5 for stainless steelsshould not exceed 1.0.
The Pressure Vessel Research Council (PVRC) Steering Committee on Cyclic Life andEnvironmental Effects (CLEE) has reviewed published environmental fatigue test data and theFo, methodology. Basedon this review, the most recent findings by ANL have been incorporatedinto the equations for the environmental factors. More importantly, it was concluded that theenvironmental factors could be reduced, by factors of 3.0 for carbon/low-alloy steel and 1.5 forstainless steel, to credit moderate environmental effects included in the current ASME Codefatigue design curves. The PVRC recommendations have been forwarded to the Board ofNuclear Codes and Standards (BNCS) [15]. The recommended evaluation procedure ispublished in Welding Research Council (WRC) Bulletin No. 487 [18]. WRC-487 includesevaluations based on recent data that would support reduction factors of 3.0 for carbon/low-alloy -
steel and 1.5 for stainless steel.
2-3
Background
(
In conjunction with the PVRC efforts, the MRP reviewed all published industry fatigue data anddocumented their review of the data and recommended assessment methodologies [19]. Basedon those findings, in 2003, the industry pursued a formal response t6 the NRC regarding theabove areas of disagreement. for carbon and low alloy steels [20]. The NRC staff ruled againstthis response in January 2004 [21] citing that an adequate technical basis was not provided tosupport several of the assumptions used in the industry's proposal. As a result, EPRI.has chosento work with the license renewal applicants on an industry guideline that defines evaluationtechniques that plants can use to satisfactorily achieve resolutions to the issues. These prototyperesolutions are formulated for use with Fe, expressions whether from NRC, NUREG, PVRC orother sources, with discussion provided for the NUREG methodology since that methodology iscurrently accepted for use by license renewal applicants. The industry is pursuing longer-termapplication of the PVRC rules through ASME Code changes.
2-4
3LICENSE RENEWAL APPROACH
3.1 Overview
This document describes how the technical issues associated with reactor water fatigueenvironmental effects evaluation may be addressed, and guidelines are provided on how toperform environmental fatigue evaluations using the methodologies documented in NUREG/CR-6583 [3] and NUREG/CR-5704 [4]. To assess the effects of reactor water environment onfatigue life, a limited number of components (including those in NUREG/CR-6260 [2] for theappropriate vintage/vendor plant) are to be assessed considering the effects of recentenvironmental fatigue data. As explained below, NUREG/CR-6260 locations are considered anappropriate sample for Fen evaluation as long as none exceed the acceptance criteria withenvironmental effects considered. If this occurs, the sampling is to be extended to otherlocations. These component locations serve as the leading indicators to assess the significance ofenvironmental effects. For this limited number of components, the effects of the environment onfatigue life must be addressed and adequately managed in the extended operating period.
The process chosen to address environmental effects by the first few applicants for licenserenewal varied. After a series of requests for additional information, the process that the NRCaccepted for Calvert Cliffs and Oconee involved an analytical approach coupled with futureplanned refinements in their plant fatigue monitoring. Since that time, there has been acceptanceof the approaches used by other applicants, and some applicants have committed to performevaluation only just before entering into the license renewal period (i.e., prior to. the end of 40years). Appendix A provides the results of an industry survey of license renewal applicants to-date describing the varied approaches that have been used'.
In many cases, the commitment to perform evaluation later by some of the license renewalapplicants has been based on uncertainty and lack of consensus on this topic throughout theindustry, and reflects a,"wait-and-see" attitude and an avoidance of expending resources now onan issue that may change later. Therefore, it is the intent of this report to develop guidelines foraging management of reactor water fatigue effects for license renewal, so that an acceptable andmore unified approach for addressing this issue will be clearly documented for future licenserenewal applicants.
These guidelines provide a process to address environmental effects in the License RenewalApplication, and provide specific guidance on the use of currently accepted environmentalfatigue evaluation methodologies. Where necessary, these guidelines are consistent with theThermal Fatigue Licensing Basis Monitoring Guidelines [23], based on today's knowledge andindustry experience. The elements of this approach may change in the future as moreinformation becomes available. Attributes of the fatigue management activity are as follows:
3-1

License Renewal Approach
1. SCOPE
The scope is discussed in.detail in Section 2.5.2 of Reference [23]. NUREG/CR-6260locations will be captured and thus automatically included by the activity steps discussedtherein.
2. PREVENTIVE ACTIONS
Cracking due to thermal fatigue of locations specifically designed to preclude such crackingis prevented by assuring that the thermal fatigue licensing basis remains valid for the periodof extended operation. The actions taken in Thermal Fatigue Licensing Basis Monitoring arebased on reliance on the standards established in ASME Section III and ASME Section XI.
3. PARAMETERS MONITORED OR INSPECTED
Monitored parameters are defined and discussed in detail in Sections 2.5.2 and 2.6 ofReference [23].
4. DETECTION OF AGING EFFECTS
The only detectable aging effects of fatigue are the presence of cracks. These cracks mayinitiate earlier in life and grow to a detectable size sometime after the CUF exceeds 1.0. TheInservice Inspection Plan as governed by ASME Section XI administers a set of actionsrelative to the inspection for, detection of, and disposition of crack like indications. Thisguideline is a sister guideline to the Thermal Fatigue Licensing Basis Monitoring Guidelinebut is not a part of it.
The Thermal Fatigue Licensing Basis Monitoring Guideline tracks the margin allotted to thepoint of CUF = 1 (or to a lesser threshold point) as a way of tracking the life expended priorto the onset of structurally relevant fatigue cracking. Refer to Sections 2.5.2 and 2.6 ofReference [23] for a discussion of the parameters monitored for this purpose.
5. MONITORING & TRENDING
Sections 2.5.2 and 2.6 of Reference [2.3] provide a discussion of the parameters monitoredand the trending of those parameters as the component fatigue life is expended.
6. ACCEPTANCE CRITERIA
Sections 2.5.2 and 2.6 of Reference [23] provide a discussion of the parameters monitored,the establishment of acceptance criteria for those parameters, and the trending of thoseparameters as the component fatigue life is expended.
7. CORRECTIVE ACTION
Section 2.6.3 of Reference [23] provides a detailed discussion of the application of thecorrective action requirements.
8. CONFIRMATION PROCESS
The confirmation process is part of the corrective action program.
3-2
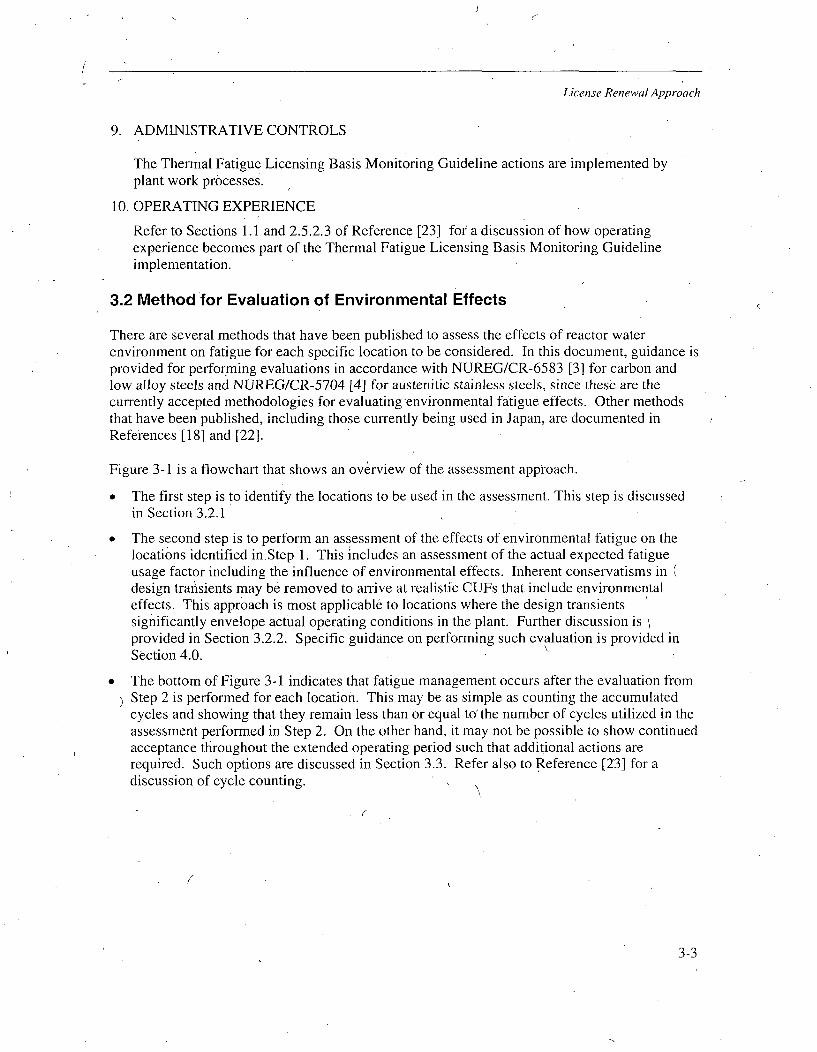
License Renewal Approach
9. ADMINISTRATIVE CONTROLS
The Thermal Fatigue Licensing Basis Monitoring Guideline actions are implemented byplant work processes.
10. OPERATING EXPERIENCE
Refer to Sections 1.1 and 2.5.2.3 of Reference [23] for a discussion of how operatingexperience becomes part of the Thermal Fatigue Licensing Basis Monitoring Guidelineimplementation.
3.2 Method for Evaluation of Environmental Effects
There are several methods.that have been published to assess the effects of reactor waterenvironment on fatigue for each specific location to be considered. In this document, guidance isprovided for performing evaluations in accordance with NUREG/CR-6583 [3] for carbon andlow alloy steels and NUREG/CR-5704 [4] for austenitic stainless steels, since these are thecurrently accepted methodologies for evaluating environmental fatigue effects. Other methodsthat have been published, including those currently being used in Japan, are documented inReferences [18] and [22].
Figure 3-1 is a flowchart that shows an overview of the assessment approach.
* The first step is to identify the locations to be used in the assessment. This step is discussedin Section 3.2.1
* The second step is to perform an assessment of the effects of environmental fatigue on thelocations identified in.Step 1. This includes an assessment of the actual expected fatigueusage factor including the influence of environmental effects. Inherent conservatisms indesign transients may be removed to arrive at realistic CUFs that include environmentaleffects. This approach is most applicable to locations where the design transientssignificantly envelope actual operating conditions in the plant. Further discussion isprovided in Section 3.2.2. Specific guidance on performing such evaluation is provided inSection 4.0.
* The bottom of Figure 3-1 indicates that fatigue management occurs after the evaluation fromStep 2 is performed for each location. This may be as simple as counting the accumulatedcycles and showing that they remain less than or equal to' the number of cycles utilized in theassessment performed in Step 2. On the other hand, it may not be possible to show continuedacceptance throughout the extended operating period such that additional actions arerequired. Such options are discussed in Section 3.3. Refer also to Reference [23] for adiscussion of cycle counting.
3-3
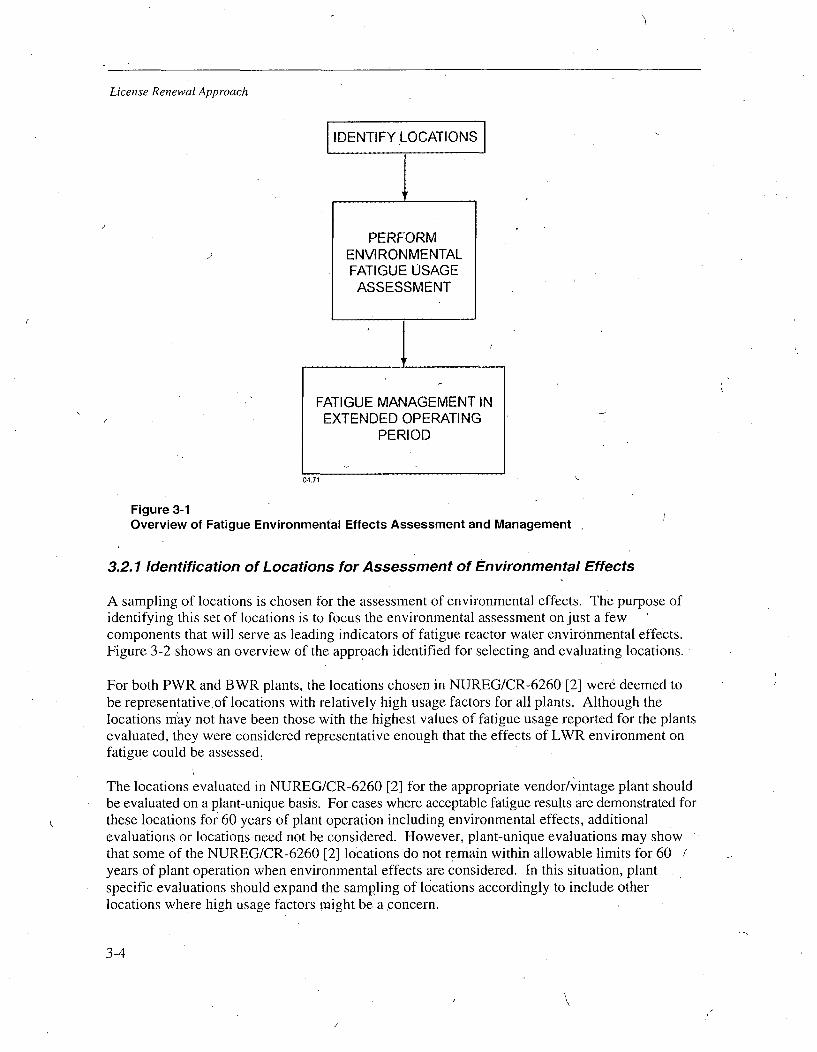
License Renewal Approach
IDENTIFY LOCATIONS
PERFORMENVIRONMENTALFATIGUE USAGE
ASSESSMENT
IFATIGUE MANAGEMENT INEXTENDED OPERATING
PERIOD
04.71
Figure 3-1Overview of Fatigue Environmental Effects Assessment and Management
3.2.1 Identification of Locations for Assessment of Environmental Effects
A sampling of locations is chosen for the assessment of environmental effects. The purpose ofidentifying this set of locations is to focus the environmental assessment on just a fewcomponents that will serve as leading indicators of fatigue reactor water environmental effects.Figure 3-2 shows an overview of the approach identified for selecting and evaluating locations.
For both PWR and BWR plants, the locations chosen in NUREG/CR-6260 [2] were deemed tobe representative of locations with relatively high usage factors for all plants. Although thelocations may not have been those with the highest values of fatigue usage reported for the plantsevaluated, they were considered representative enough that the effects of LWR environment onfatigue could be assessed.
The locations evaluated in NUREG/CR-6260 [2] for the appropriate vendor/vintage plant shouldbe evaluated on a plant-unique basis. For cases where acceptable fatigue results are demonstrated forthese locations for 60 years of plant operation including environmental effects, additionalevaluations or locations need not be considered. However, plant-unique evaluations may showthat some of the NUREG/CR-6260 [2] locations do not remain within allowable limits for 60 f
years of plant operation when environmental effects are considered. In this situation, plantspecific evaluations should expand the sampling of locations accordingly to include otherlocations where high usage factors might be a concern.
3-4

License Renewal Approach
In original stress reports, usage factors may have been reported in many cases that areunrealistically high, but met the ASME Code requirement for allowable CUF. In these cases,revised analysis may be conducted to derive a more realistic usage factor or to show that therevised usage factor is significantly less than reported.
If necessary, in identifying the set of locations for the expanded environmental assessment, it isimportant that a diverse set of locations be chosen with respect to component loading (includingthermal transients), geometry, materials, and reactor water environment. If high usage factorsare presented for a number of locations that are similar in geometry, material, loading conditions,and environment, the location with the highest expected CUF, considering typical environmentalfatigue multipliers, should be chosen as theo bounding location to use in the environmental fatigueassessment. Similar to the approach taken in NUREG/CR-6260 [2], the final set of locationschosen for expanded environmental assessment should include several different types oflocations that are expected to have the highest CUFs and should be those most adversely affectedby environmental effects. The basis of location choice should be described in the individualplant license renewal application.
In conclusion, the following steps should be taken to identify the specific locations that are to beconsidered in the environmental assessment:
0 Identify the locations evaluated in NUREG/CR-6260 [2] for the appropriate vintage/vendorplant.
a Perform a plant-unique environmental fatigue assessment for the NUREG/CR-6260locations.
* If the CUF results for all locations above are less than or equal to the allowable (typically1.0) for the 60-year operating life, the environmental assessment may be consideredcomplete; additional evaluations or'locations need not be considered.
* If the CUF results for any locations above are greater than the allowable for the 60-yearoperating life, expand the locations evaluated, considering the following:
- Identify all Class 1 piping systems and major components. For the reactor pressurevessel, there may be multiple locations to consider.
- For each system or component, identify the highest usage factor locations. By reasons ofgeometric discontinuities or local transient severity, there will generally be a fewlocations that have the highest usage factors when considering environmental effects.
From the list of locations that results from the above steps, choose a set of locations thatare a representative sampling of locations with the highest expected usage factors whenconsidering environmental effects. Considerations for excluding locations can include:(1) identification of excess conservatism in the transient grouping or other aspects of thedesign fatigue analysis, or (2) locations that have similar loading conditions, geometry,material, and reactor water environment compared to another selected location.
3-5
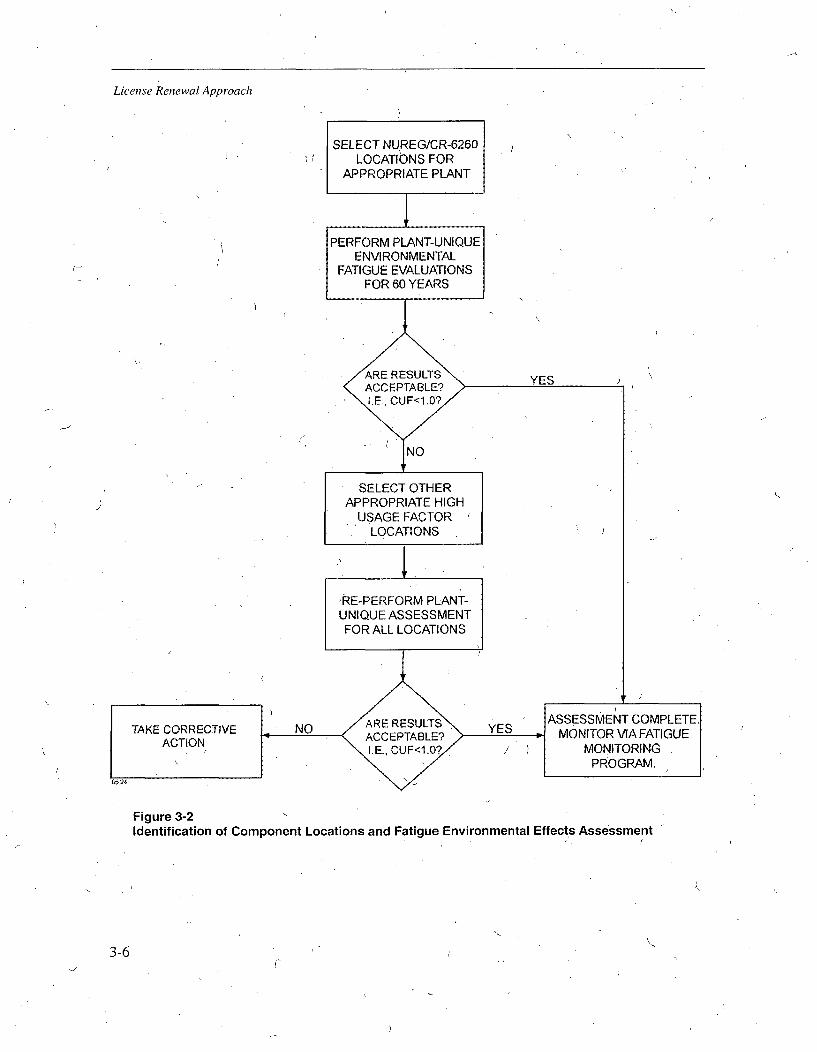
License Renewal Approach
SELECT NUREG/CR-6260LOCATIbNS FOR
APPROPRIATE PLANT
j
PERFORM PLANT-UNIQUEENVIRONMENTAL
FATIGUE EVALUATIONSFOR 60 YEARS
(,.
SELECT OTHERAPPROPRIATE HIGH
USAGE FACTORLOCATIONS
,'RE-PERFORM PLANT-UNIQUE ASSESSMENTFOR ALL LOCATIONS
Figure 3-2Identification of Component Locations and Fatigue Environmental Effects Assessment
3-6
License Renewal Approach
3.2.2 Fatigue Assessment Using Environmental Factors
In performing an assessment of environmental fatigue effects, factors to account forenvironmental effects are incorporated into an updated fatigue evaluation for each selectedlocation using the F.. approach documented in NUREG/CR-6583 [3] for carbon and low alloysteels and NUREG/CR-5704 [4] for austenitic stainless steels. Excess conservatism in theloading definitions, number of cycles, and the fatigue analyses may be considered. Figure 3-3shows the approach for performing the assessment and managing fatigue in the extendedoperating period.
Determination of Existing Licensing Basis
Existing plant records must be reviewed to determine the cyclic loading specification (transientdefinition and number of cycles) and stress analysis for the location in question. Review of theanalysis may or may not show that excess conservatism exisis. Reference [23] providesguidance on reviewing the original design basis, the operating basis, and additions imposed bythe regulatory oversight process, to determine the fatigue licensing basis events for which thecomponent is required to be evaluated.
Consideration of Increased Cycles for Extended Period
As a part of the license renewal application process, the applicant must update the projectedcycles to account for 60 years of plant operation. The first possible outcome is that the number,of expected cycles in the extended operating period will remain at or below those projected forthe initial 40-year plant life. In this case, the governing fatigue analyses will not requiremodification to account for the extended period of operation.
The second possibility is that more cycles are projected to occur fdr 60 years of plant operationthan were postulated for the first 40 years. In this case, an applicant must address the increasedcycle counts. One possible solution is to perform a revised fatigue analysis to confirm that theincreased number of cycles will still result in a CUF less than or equal to the allowable. Asecond possibility is to determine the number of cycles at which the CUF would be expected toreach the allowable. This cycle quantity then becomes the allowable against which the actualoperation is tracked. Section 3.3 discusses options to be employed if this lower allowable isprojected to be exceeded.
(
Fatigue Assessment
Fatigue assessment includes the determination of CUF considering environmental effects. Thismay be accomplished conservatively using information from design documentation andbounding F factors from NUREG/CR-6583 [3] and NUREG/CR-5704 [4], or it may require amore extensive approach (as discussed in Section 4.0).
A revised fatigue analysis may or may not be required. Possible reasons for updating the fatigueanalysis could include:
* Excess conservatism in original fatigue analysis with respect to modeling, transientdefinition, transient grouping and/or use of an early edition of the ASME Code.
3-7

r
License Renewal Approach
" For piping, use of an ASME Code Edition prior to 1979 Summer Addenda, which included
the AT, term in Equation (10) of NB-3650. Use of a later code reduces the need to applyconservative elastic-plastic penalty factors.
* Re-analysis may be needed to determine strain rate time histories possibly not reported inexisting component analyses, such that bounding environmental multipliers (i.e., very low or"saturated" strain rates) would not have to be used.
A simplified revised fatigue analysis may be performed using results from the existing fatigueanalysis, if sufficient detail is available. Alternatively, a new complete analysis could beconducted to remove additional conservatisms. Such an'evaluation would not necessarily needthe full pedigree of a certified ASME Code Section III analysis (i.e., Certified DesignSpecification, etc.), but it should utilize all of the characteristic methods from Section III forcomputing CUF., In the environmental fatigue assessment, the environmental fatigue usage maybe calculated using the following steps:
* For each load set pair in the fatigue analysis, determine an environmental factor Fen. Thisfactor should be developed using the equations in NUREG/CR-6583 [3] or NUREG/CR-5704 [4]. (Section 4.0 provides specific guidance on performing an F., evaluation)
* The environmental partial fatigue usage for each load set pair is then determined bymultiplying the original partial usage factor by F... In no case shall the F,, be less than 1.0.
* The usage factor is the sum of the partial usage factors calculated with consideration ofenvironmental effects.
Fatigue Management Approach
As shown in Figure 3-3, the primiary fatigue management approaches for the extended operatingperiod consist of tracking either the CUF or number of accumulated cycles.
* For cycle counting, an updated allowable number of cycles may be needed if the fatigueassessment determined the CUF to be larger than allowable. One approach is to derive areduced number of cycles that would limit the CUF to less than or equal to the allowablevalue (typically 1.0). On the other hand, if the assessed CUF was shown to be less than orequal to the allowable, the allowable number of cycles may remain as assumed in theevaluation, or increased appropriately. As long as the number of cycles in the extendedoperating period remains within this allowed number of cy-6les, no further action is required.
* For CUF tracking, one approach would be to utilize fatigue monitoring that accounts for theactual cyclic operating conditions for each location. This approach would track the CUF dueto the actual cycle, accumulation, and would take credit for the combined effects of alltransients. Environmental factors would have to be factored into the monitoring approach orapplied to the CUF results of such monitoring. No further action is required as long as thecomputed usage factor remains less than or equal to the allowable value.
Prior to such time that the CUF is projected to exceed the allowable value, or the number of-actual cycles is projected to exceed the allowable number of cycles, action must be taken suchthat the allowable limits will not be exceeded. If the cyclic or fatigue limits are expected to beexceeded during the license renewal period, further approaches to fatigue management would berequired prior to reaching the limit, as described in Section 3.3. Further details on guidelines forthermal fatigue monitoring and compliance/mitigation options are provided in Reference [23].
3-8
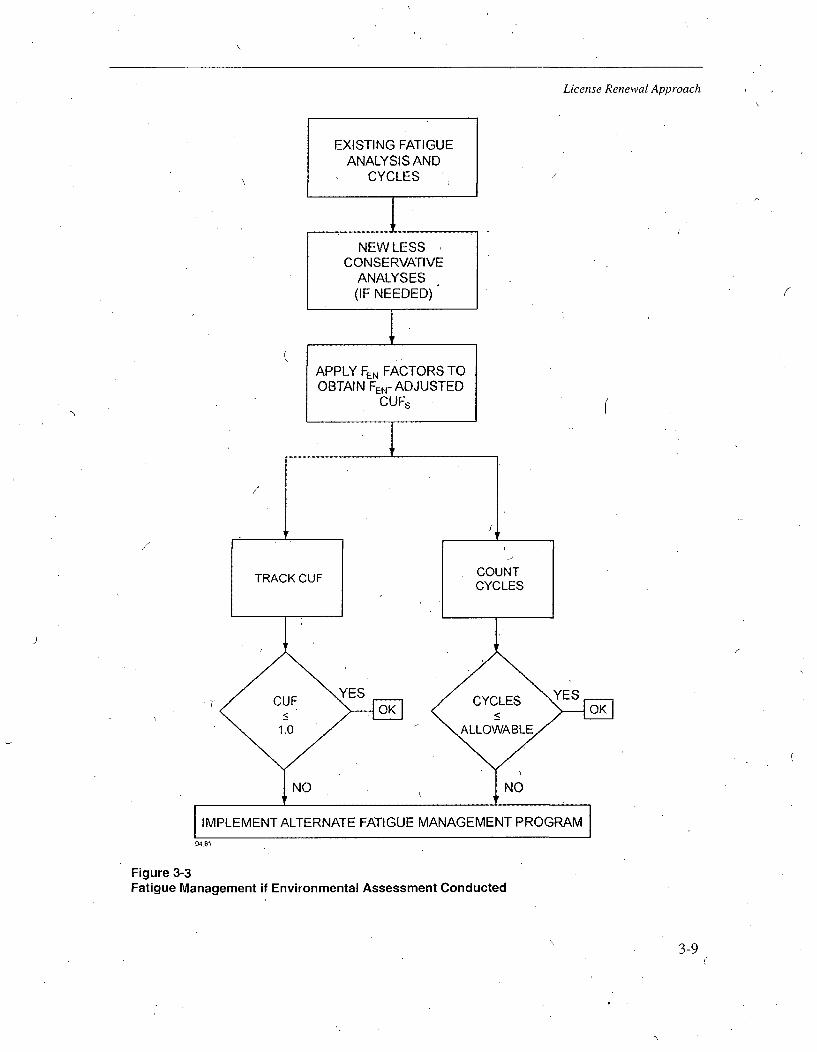
License Renewal Approach
Figure 3-3Fatigue Management if Environmental Assessment Conducted
3-9
License Renewal Approach
3.3 Alternate Fatigue Management in the License Renewal Period
As identified in Section 3.2, and discussed in detail in Reference [23], results from cyclecounting or fatigue monitoring may predict that established limi'ts are exceeded during theextended operating period. If this occurs, there are several alternative approaches which may beused to justify continued operationvwith the affected component in service without having toperform repair or replacement, as follows:
* Reanalysis
* Partial Cycle Counting
* Fatigue Monitoring
* Flaw Tolerance Evaluation and Inspection
* Modified Plant Operations
* Evaluation of Similar Components
In addition, the fatigue management program may need to be expanded if plant-unique orindustry experience shows that fatigue limits are exceeded or if cracking is discovered, due toeither anticipated or unanticipated transients. Refer to Reference [23] for a comprehensivediscussion of these items.
3.4 Guidance for Plants with B31.1 Piping Systems
Many plants that were designed in the 1960s had piping systrems that were designed inaccordance with the rules of the ANSI B31.1 Power Piping Code. This Code did not require anexplicit fatigue analysis. Howeve~r, the effects of thermal expansion cycles were included. If thenumber of equivalent full range thermal expansion cycles was greater than 7,000, the allowablerange of thermal expansion stress was reduced. There was no consideration of stresses due tothrough-wall thermal gradients, axial temperature gradients, or bi-metallic welds.
Although ANSI B3 1.1 and ASME Code, Section III, Class 1 piping rules are fundamentallydifferent, experience in operating plants has shown that piping systems designed to B3 1.1 areadequate. An evaluation of fatigue-sensitive B31.1 piping systems by EPRI [17] showed thatthere were only very limited locations in piping systems that exhibited high usage factors. Ineach case, these locations could be easily identified. It was concluded that high ,usage factorsoccurred only at locations that experienced significant thermal transients such as steptemperature changes. In addition, the locations with high usage factors were always at astructural or material discontinuity, such as pipe-to-valve or pipe-to-nozzle transition welds. Thereport also noted that the design features of B3 1.1 plants are essentially no different than those inmore modem plants designed to ASME Code, Section III, Class 1.
The high usage factor locations evaluated in NUREG/CR-6260 [2] were primarily associatedwith piping system discontinuities and occurred due to severe transients, except for PWR surgelines where a high number of stratification transients contributed to high usage factors.
3-10
License Renewal Approach
The operation of B3 1.1 plants is also not different from that of plants designed to ASME Code,Section III, Class 1. All have limitations on heatup/cooldown rates as required by ASME Code,Sections III and'XI, and 1OCFR50 Appendix G. The NSSS vendors have also providedcontinued feedback to plant operators to reduce the thermal fatigue challenges to componentsbased on industry experience. Thus, the approach taken by an applicant with ANSI B31.1 pipingsystems need not be significantly different than that taken-for a more modern plant:
" The locations of NUREG/CR-6260 [2] for the appropriate vintage/vendor plant are selected.For systems without specified design transients, a set of transients for tracking in theextended operating period must be established.
" Evaluations shall be undertaken to establish the usage factors at each of the selectedlocations. This may be based on similarities in geometry, materials, and transient cyclesrelative to other similarly designed plants. In addition, the information provided inNUREG/CR-6260 [2] may be used. Alternately, an ASME Code, Section III, Class I'analysis can be conducted. Such an evaluation would not necessarily need the full pedigreeof a certified ASME Code, Section III analysis (i.e., Certified Design Specification, etc.), butit should iutilize all of the characteristic methods from Section III for computing CUF. Suchan analysis would be used to establish the baseline fatigue usage without environmentaleffects for the plant.
" Using this information, the approach previously described for the ASME Code, Section III,Class 1 plants can be used to evaluate and manage fatigue environmental effects.
3.5 Consideration of Industry Operating Experience
Consistent with current practice, industry experience with fatigue cracking will continue to bereviewed. The assessment of any fatigue cracking in the extended operating period will considerthe effects of environment as a potential contributor. Monitoring of industry experience mustconsider fatigue cracking for both anticipated and unanticipated transients. An MRP integratedfatigue management guideline is currently under preparation that will consider all aspects offatigue management, including consideration of industry -experience. See Reference [24].
3-11

4GUIDANCE FOR PERFORMING ENVIRONMENTALFATIGUE EVALUATIONS
This section provides guidance for performing plant specific environmental fatigue evaluationsfor selected locations. The intent is to unify the process used by applicants to addressenvironmental effects in the License Renewal Application, and provide specific guidance on theuse of currently accepted environmental fatigue evaluation methodologies.
There are several methods that have been published to assess the effects of reactor, waterenvironment on fatigue for each specific location to be considered. The currently acceptedmethodologies for evaluating environmental fatigue effects are documented in NUREG/CR-6583[3]for carbon and low alloy steels and NUREG/CR-5704 [4] for austenitic stainless steels.Although other methods have been developed and published, guidance is only provided for usingNUREG/CR-6583 [3] and NUREG/CR-5704 [4]. However, all methods currently published aresimilar in terms of variables and applicability (i.e., they all use an Fee factor apprioach), so theguidance'that follows has general applicability to all methods. For reference, the other publishedmethods, including those currently being used in Japan, are documerited in References [18] and[22].
4.1 , Environmental Fatigue Factor (Fen) Relationships
An environmental correction factor (F..) is defined as the ratio of fatigue usage withenvironmental effects divided by fatigue usage in air, or allowable cycles to fatigue crackinitiation in air divided, by allowable cycles with water reactor environmental effects'. Fe,equations are provided in the latest ANL reports for carbon and low alloy steel [3] and stainlesssteel [4].
From NUREG/CR-5704 [4], the F. relative to room-temperature air for Types 304 and 316stainless steel is given by the following expression:
F,.= exp(0.935 - T 0*)
The constants for transformed temperature (T*), transformed strain rate (i ), and transformeddissolved oxygen (O*) in the above expression are defined as follows:
"Fatigue crack initiation" is an investigator determined quantity, often related to a 25% load drop in a load-controlled laboratory fatigue test. This usually corresponds to significant crack depths, typically of the order of25% of the specimen thickness for the deepest crack.
4-1
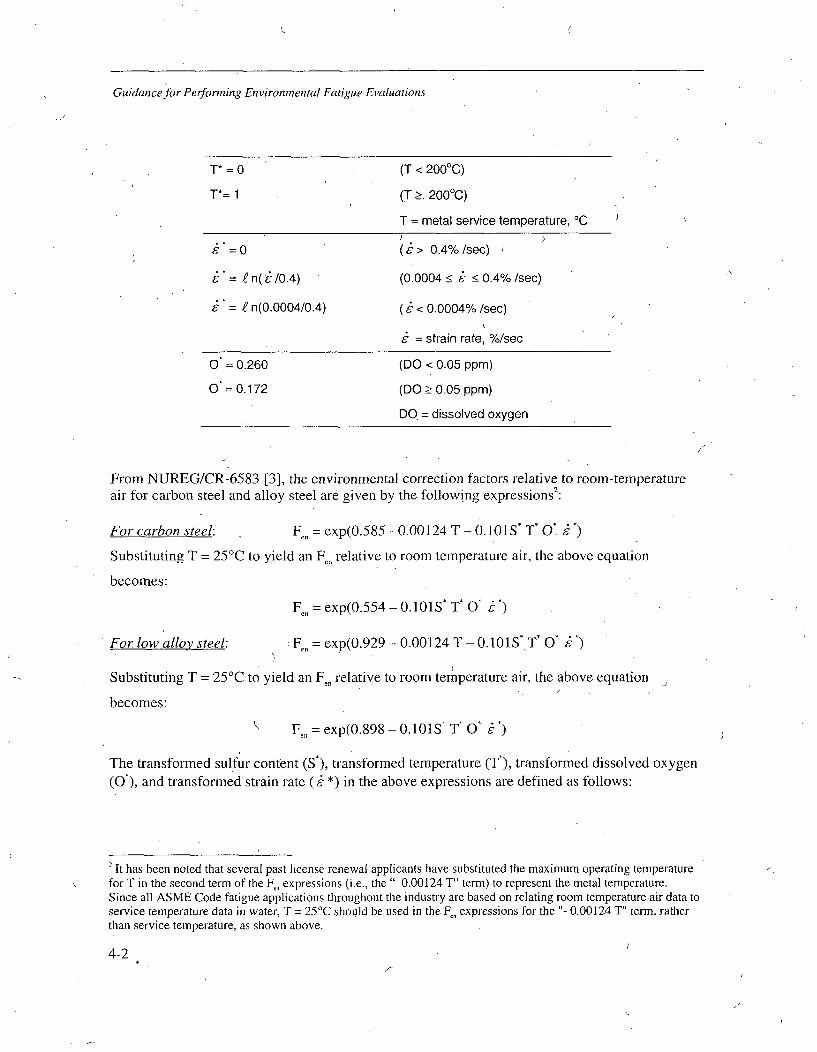
Guidance for Perfonning Environmental Fatigue Evaluations
T* = 0 (T < 2000C)
T*= 1 (T 2:. 20000)
T = metal service temperature, 0C
S= 0 (t> 0.4%/sec)
"= e n(i"/0.4) (0.0004 _ •0.4%/sec)
" = f n(0.0004/0.4) < 0.0004% /sec)
, = strain rate, %/sec
O = 0.260 (DO < 0.05 ppm)
O =0.172 (DO 0.05 ppm)
DO. = dissolved oxygen
From NUREG/CR-6583 [3], the environmental correction factors relative to room-temperature2
air for carbon steel and alloy steel are given by the following expressions
For carbon steel: Fen = exp(0.585 -,0.00124 T - 0.101S* T* O' t *)
Substituting T = 25°C to yield an F - relative to room temperature air, the above equation
becomes:
F,,' = exp(0.554.- 0.101S* TV O )
For low alloy steel: Fe. = exp(0.929 - 0.00124 T - 0.101S* T* O* 5)
Substituting T = 25°C to yield an F., relative to room temperature air, the above equation
becomes:
\ FF,, = exp(O.898 - 0.101S* T* O' )
The transformed sulfur content (S ), transformed temperature (T), transformed dissolved oxygen(0), and transformed strain rate (i *) in the above expressions are defined as follows:
- It has been noted that several past license renewal applicants have substituted the maximum operating temperature
for T in the second term of the F_, expressions (i.e., the" 0.00124 T" term) to represent the metal temperature.Since all ASME Code fatigue applications throughout the industry are based on relating room temperature air data toservice temperature data in water, T = 25°C should be used in the F,,, expressions for the "- 0.00124 T' term, ratherthan service temperature, as shown above.
4-2
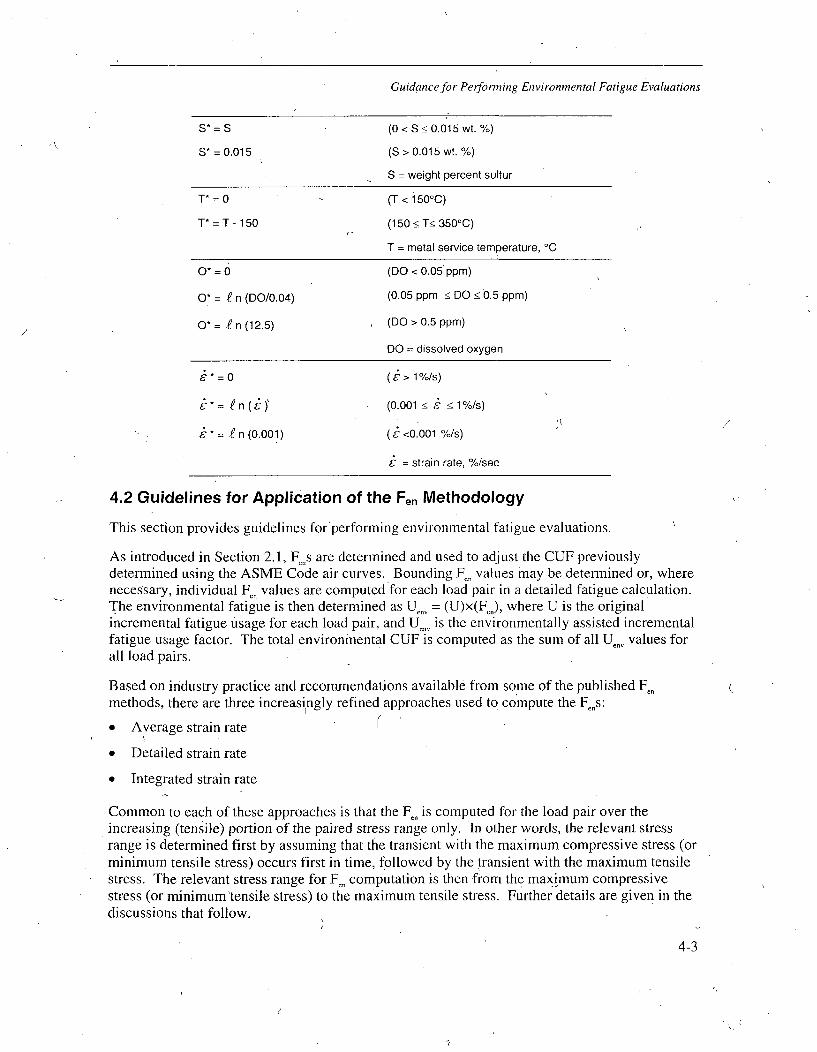
Guidance for Perfonning Environmental Fatigue Evaluations
S* = S (0 < S_< 0.015 wt. %)
S* = 0.015 (S > 0.015 wt. %)
S = weight percent sulfur
T* = 0 (T < 150°C)
T* = T - 150 (150 _< T_< 350°C)
T = metal service temperature, °C
0* = 0 (DO < 0.05 ppm)
0* = f n (DO/0.04) (0.05 ppm _< DO •0.5 ppm)
0* = e n (12.5) (DO > 0.5 ppm)
DO = dissolved oxygen
*0 ( 1-/>1%/s)
6*= £n (6' (0.001 "1%/s)
n (0.001) (6<0.001 %/s)
= strain rate, %/sec
4.2 Guidelines for Application of the Fen Methodology
This section provides guidelines for performing environmental fatigue evaluations.
As introduced in Section 2.1, F s are determined and used to adjust the CUF previouslydetermined using the ASME Code air curves. Bounding Fo, values may be determined or, wherenecessary, individual F., values are computed for each load pair in a detailed fatigue calculation.The environmental fatigue is then determined as U-n = (U)x(Fo.), where U is the originalincremental fatigue usage for each load pair, and U.,v is the environmentally assisted incrementalfatigue usage factor. The total environmental CUF is computed as the sum of all U_ values forall load pairs.
Based on industry practice and recommendations available from some of the published Fe_methods, there are three increasingly refined approaches used to compute the Fens:
Average strain rate r" Detailed strain rate
* Integrated strain rate
Common to each of these approaches is that the Fe. is computed for the load pair over theincreasing (tensile) portion of the paired stress range only. In other words, the relevant stressrange is determined first by assuming that the transient with the maximum compressive stress (orminimum tensile stress) occurs first in time, followed by the transient with the maximum tensilestress. The relevant stress range for Fe- computation is then from the maximum compressivestress (or minimum 'tensile stress) to the maximum tensile stress. Further details are given in thediscussions that follow.
4-3
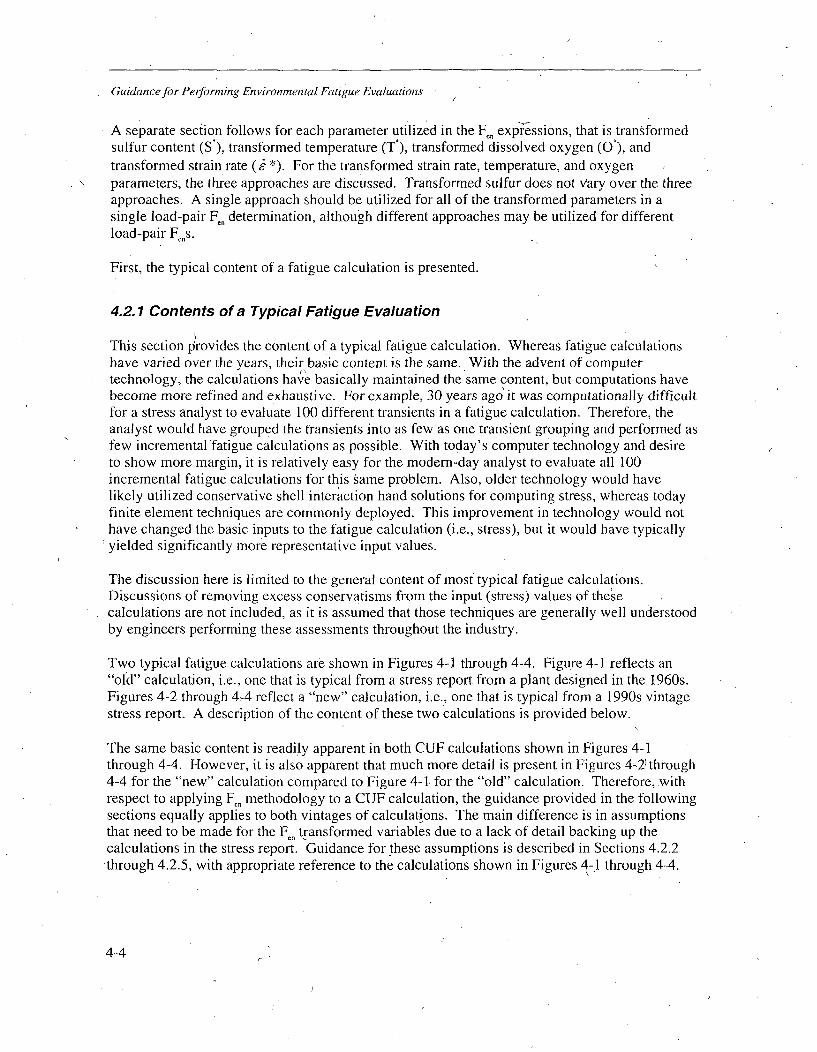
Guidance for Performing Environmental Fatigue Evaluations
A separate section follows for each parameter utilized in the F., expressions, that is transformedsulfur content (S*), transformed temperature (T*), transformed dissolved oxygen (0), andtransformed strain rate (C *). For the transformed strain rate, temperature, and oxygenparameters, the three approaches are discussed. Transformed sulfur does not Vary over the threeapproaches. A single approach should be utilized for all of the transformed parameters in asingle load-pair Fen determination, although different approaches may be utilized for differentload-pair F,,s.
First, the typical content of a fatigue calculation is presented.
4.2.1 Contents of a Typical Fatigue Evaluation
This section provides the content of a typical fatigue calculation. Whereas fatigue calculationshave varied over the years, their basic content is the same. With the advent of computertechnology, the calculations havre basically maintained the same content, but computations havebecome more refined and exhaustive. For example, 30 years ago'it was computationally difficultfor a stress analyst to evaluate 100 different transients in a fatigue calculation. Therefore, theanalyst would have grouped the transients into as few as one transient grouping and performed asfew incremental fatigue calculations as possible. With today's computer technology and desireto show more margin, it is relatively easy for the modem-day analyst to evaluate all 100incremental fatigue calculations for this same problem. Also, older technology would havelikely utilized conservative shell interaction hand solutions for computing stress, whereas todayfinite element techniques are commonly deployed. This improvement in technology would nothave changed the basic inputs to the fatigue calculation (i.e., stress), but it would have typicallyyielded significantly more representative input values.
The discussion here is limited to the general content of most typical fatigue calculations.Discussions of removing excess conservatisms from the input (stress) values of theecalculations are not included, as it is assumed that those techniques are generally well understoodby engineers performing these assessments throughout the industry.
Two typical fatigue calculations are shown in Figures 4-1 through 4-4. Figure 4-1 reflects an"old" calculation, i.e., one that is typical from a stress report from a plant designed in the 1960s.Figures 4-2 through 4-4 reflect a "new" calculation, i.e., one that is typical from a 1990s vintagestress report. A description of the content of these two calculations is provided below.
The same basic content is readily apparent in both CUF calculations shown in Figures 4-1through 4-4. However, it is also apparent that much more detail is present in Figures 4-2; through4-4 for the "new" calculation compared to Figure 4-1. for the "old" calculation. Therefore, withrespect to applying F., methodology to a CUF calculation, the guidance provided in the followingsections equally applies to both vintages of calculations. The main difference is in assumptionsthat need to be made for the F,, transformed variables due to a lack of detail backing up thecalculations in the stress report. Guidance for these assumptions is described in Sections 4.2.2through 4.2.5, with appropriate reference to the calculations shown in Figures 4-1 through 4-4.
4-4
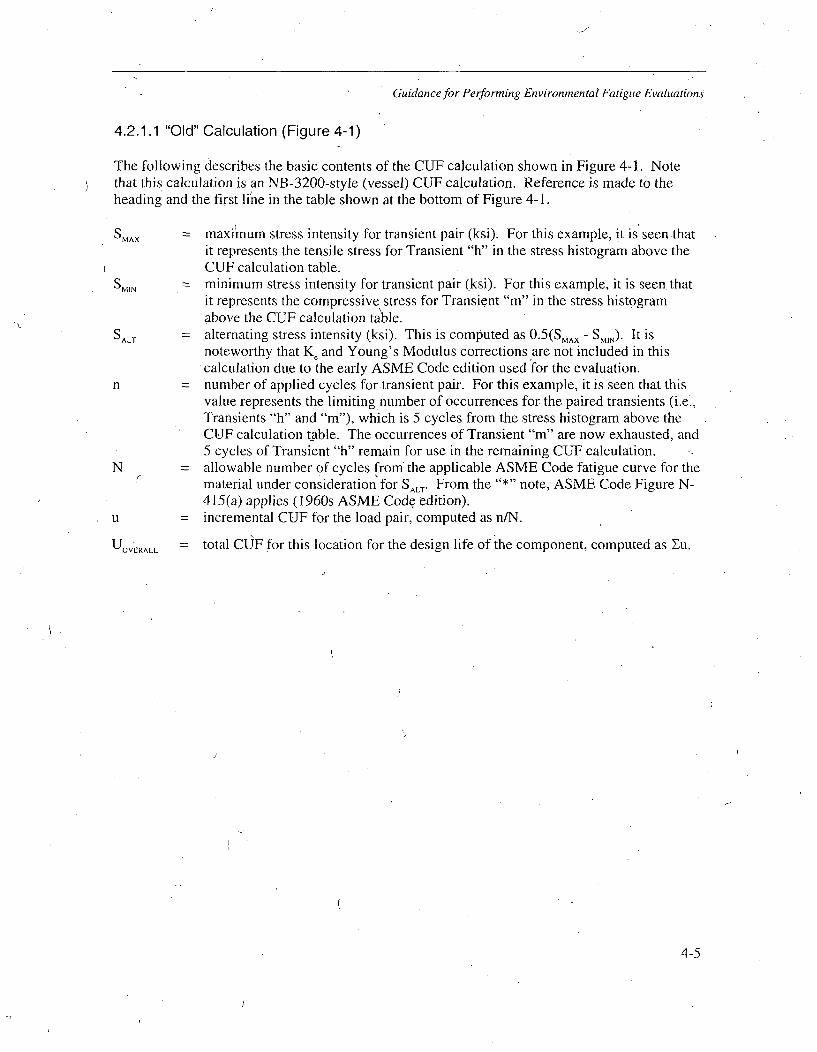
Guidance for Performing Environmental Fatigue Evaluations
4.2.1.1 "Old" Calculation (Figure 4-1)
The following describes the basic contents of the CUF calculation shown in Figure 4-1. Notethat this calculation is an NB-3200-style (vessel) CUF calculation. Reference is made to theheading and the first li'ne in the table shown at the bottom of Figure 4-1.
SMAX = maximum stress intensity for transient pair (ksi). For this example, it is seen thatit represents the tensile stress for Transient "h" in the stress histogram above theCUF calculation table.
SMIN = minimum stress intensity for transient pair (ksi). For this example, it is seen. thatit represents the compressive stress for Transient "in" in the stress histogramabove the CUF calculation table.
SALT = alternating stress intensity (ksi). This is computed as 0. 5 (SMAX - SM N). It isnoteworthy that K. and Young's Modulus corrections are not included in this
,calculation due to the early ASME Code edition used for the evaluation.n number of applied cycles for transient pair. For this example, it is seen that this
value represents the limiting number of occurrences for the paired transients (i.e.,Transients "h" and "m"), which is 5 cycles from the stress histogram above theCUF calculation table. The occurrences of Transient "in" are now exhausted, and5 cycles of Transient "h" remain for use in the remaining CUF calculation. --
N allowable number of cycles from the applicable ASME Code fatigue curve for thematerial under consideration for SALT. From the "*" note, ASME Code Figure N-
415(a) applies (1960s ASME Code edition).u incremental CUF for the load pair, computed as n/N.
UOV'ERALL total CUJF for this location for the design life of the component, computed as Zu.
4-5
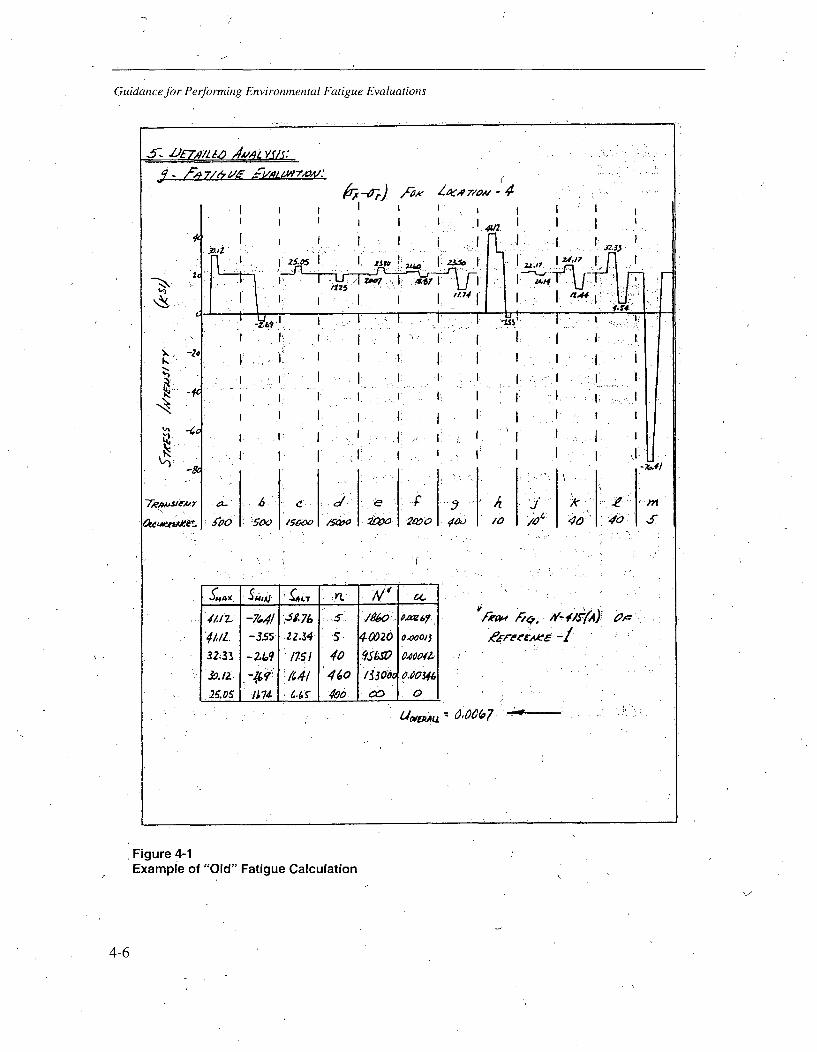
Guidance for Performing Environmental Fatigue Evaluations
Figure 4-1Example of "Old" Fatigue Calculation
4-6
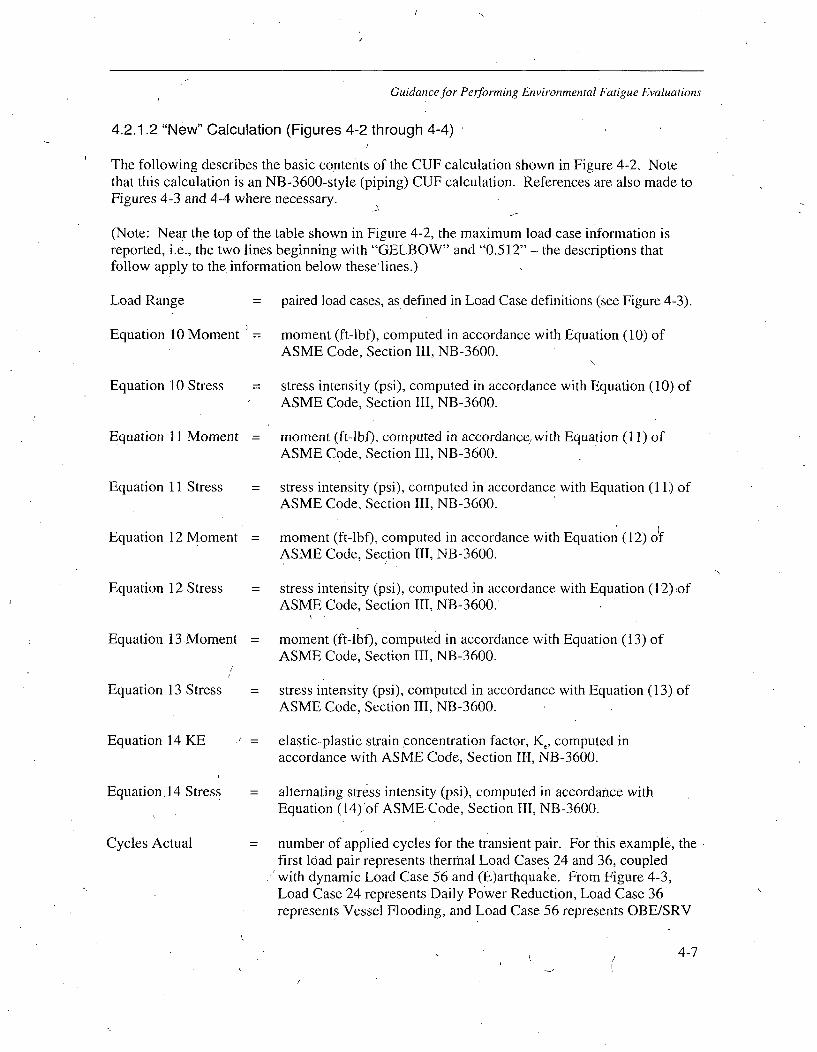
Guidance for Performing Environmental Fatigue Evaluations
4.2.1.2 "New" Calculation (Figures 4-2 through 4-4)
The following describes the basic contents of the CUF calculation shown in Figure 4-2, Notethat this calculation is an NB-3600-style (piping) CUF calculation. References are also made toFigures 4-3 and 4-4 where necessary.
(Note: Near the top of the table shown in Figure 4-2, the maximum load case information isreported, i.e., the two lines beginning with "GELBOW" and "0.512" - the descriptions thatfollow apply to the information below these lines.)
Load Range
Equation 10 Momen
Equation 10 Stress
Equation 11 Momen
Equation 11 Stress
Equation 12 Momen
Equation 12 Stress
Equation 13 Moment
Equation 13 Stress
Equation 14 KE
Equation,14 Stress
Cycles Actual
= paired load cases, as defined in Load Case definitions (see Figure 4-3).
t moment (ft-lbf), computed in accordance with Equation (10) ofASME Code, Section III, NB-3600.
stress intensity (psi), computed in accordance with Equation (10) ofASME Code, Section III, NB-3600.
t = moment (ft-lbf), computed in accordance/ with Equation (11) ofASME Code, Section III, NB-3600.
stress intensity (psi), computed in accordance with Equation (11) ofASME Code, Section III, NB-3600.
t moment (ft-lbf), computed in accordance with Equation (12) ofASME Code, Section III, NB-3600.
stress intensity (psi), computed in accordance with Equation (12):ofASME Code, Section III, NB-3600.
= moment (ft-lbf), computed in accordance with Equation (13) ofASME Code, Section 1II, NB-3600.
stress intensity (psi), computed in accordance with Equation (13) ofASME Code, Section III, NB-3600.
- elastic-plastic strain concentration factor, K., computed inaccordance with ASME Code, Section I.I, NB-3600.
= alternating stress intensity (psi), computed in accordance withEquation (14)of ASME.Code, Section III, NB-3600.
= number of applied cycles for the transient pair. For this example, thefirst load pair represents thermal Load Cases 24 and 36, coupledwith dynamic Load Case 56 and (E)arthquake. From Figure 4-3,Load Case 24 represents Daily Power Reduction, Load Case 36represents Vessel Flooding, and Load Case 56 represents OBE/SRV
4-7
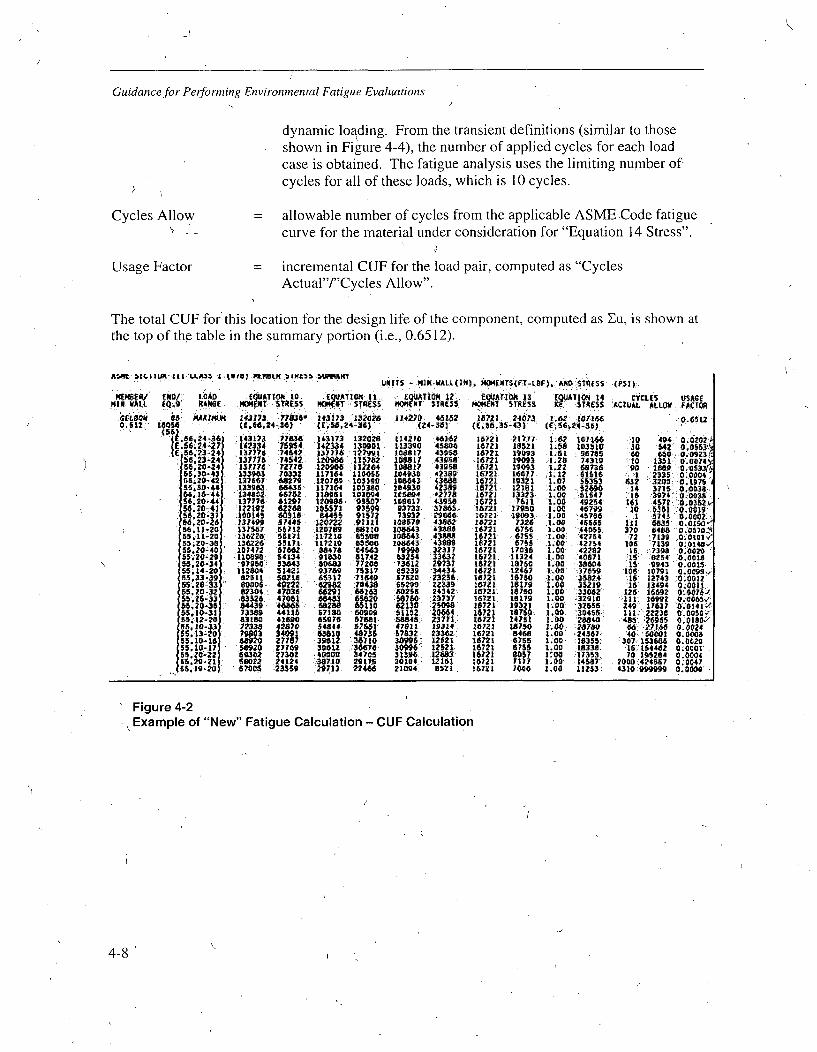
Guidance for Performing Environmental Fatigue Evaluations
dynamic loading. From the transient definitions (similar to thoseshown in Figure 4-4), the number of applied cycles for each loadcase is obtained. The fatigue analysis uses the limiting number ofcycles for all of these loads, which is 10 cycles.
Cycles Allow
Usage Factor
allowable number of cycles from the applicable ASME Code fatiguecurve for the material under consideration for "Equation 14 Stress".
= incremental CUF for the load pair, computed as "CyclesActual"/"Cycles Allow".
The total CUF for this location for the design life of the component, computed as Zu, is shown atthe top of the table in the summary portion (i.e., 0.6512).
A~ ~14.hIU~ III LLA3~ £ 13101 MRU1M 13K1~ ~1MIANYUJNITS -MIWlWALL(IM), 4 i4Sfl5.ARKIE (1)
AI W(ALL 1 .0 AG
0.512: 10054
IE56.2431 4
15. 23.ý2455.20- 465,)04355.20-4256.30-4466.25-44
5820-41
56,20.21DO. Z04655.11-2055. 20-38
5.20-2955.20344
$5.33 3955. 26ý3355.20-32S5.25-33bS.20-3555,3 041
15.5.10-.1365.13-2055. 10-.l655.10.-1754,0472116 20:21
5519-20
EPIATION 10. EATION It."ON. A 05R5S M(4aW TR$M15
143173 7736- 143173 132029(0.54,2444) (E.56,24-36)
143173 77114034 759$4137776 74542.137778 74542137770 72 78.133 70332S376617 18279
137778 61297:122192 Ma28e:100145 60310.37499 57445137557 56712136•265, Hi712
1136224 55171.107472 57662
-:11089e. 541341 :97950 510 IR4.3112404 $1421
W251i 502158005.. or1 222.820. 4703083)26. 4705184439 4644 "733M9 4411653180 41690Y2)33 41=60•al03 34091
g8920 77075492O .2775959302 2730255022 .2412457005 23319
143173 13202Re14J3 1309011,17•tza
120966 111782120004 11I22841171•4 1100•11207•9 . 10390117104 10530011851 103094
105571 *93199564 .91572
12072Z .9)111
W1210 60108117210 65)0088478 $0456391830 5174280483 77208:93.,769 75317, 7 7043'8621 661636083 " 65020
.68230 65110$7180 60909• 878 57151
'43.410 4.57),-39412 3671039612 :36476
.40000 3470536710: 2911529713. 22464
EJUATI0N 12000MTSTRESS
11427+0 451152
11,4210 451.6 .62
11339•0 45100817 4391108811 439568Idea7 4395104030 42389104643 4M38.10493 42349IO 4 ..42778104l1 43950
03733 3)965-739)2 296"
10857. 43842108543 4308810543 .411$M1085643 4385
432,4 3361273412 :2917305239. 3443457520 23236:552"9 ZZ339"60258 2434258760 23737
12130 25095112, 20464458445: 2371.08711 19314.57832 a23342:3mb95 12521.3099 1252131396 128530104,• 1216121094 0521.
• MiA1I0R C 3 1"QATIIM 14 4 CYcLE$ 'A540EP919157"5 C ,8 STArES ACtUAL ALLIM FACTOR
16721 24013 i.62 t071016.0.)((.0,35-s43) IE(.5, 26-30)..
1621 21777 1.02 101164 .10 494 0.420i.s16821 18521 1.5 103510 .30 .542 0,05$1672I 19 •3 1;51 95780 '" 650 0,9973ý68721 19093 1-8 74310 to 135 .016721 19093 1.22 68730 90 M a59 0.53X,'.
16721 160717 1.ta ais1 1 2335, .0004,15721 19321 1.01 51353 632 3200 00197515721 12181 1.00 56090 14 3716 ,0,0501.6721 M3313.00 . ,51547 Is5 :3974 0.00318721 . 7811 1.00 49264 161 4572 0•0;-0316721 17950 1.00 4679 10 ..1361 :0,00191I1BMZ 19093. 1,00 45•70 - 1 5743 ..04002.16721 1326 1.06 45555 li d3 6 .05 '•as16721 6756 1.00 44055 370 6468 '"0.0570-,18711 -.675), 1.00, 42714 '72 7132 0.0'Ml10721 8755 .1.00 42114 10 713" 001.'04-,1[721 17035 1.00 .42262 15 71"90 001010721. 11324..1.00 0571 15' 52543 0.001516721 1at50 :100 304 .15' 9943 0.001516721 124467 1.00 13759 t10 10791 0.0098,016121 167)I .l00) 382.4 "15 12743 '0.001216791 10179. 1.00 35219M 15' 13494 040011.15721 10750. 1.00 33042 126 16892 0.0075115721 18179 1.00 -32910 ''11.' 1692 0.0065v:38721 19321• 1.0 "32555 249 17637 0.0141W14721 187W0. 1.00 .30456, 1llv:27238 0.0050V'16721 14751 1.00 2M880 48. 06905 010I80D10721 487)0 L.0O W 2,70 41-27168 0.002410721 .8401 1.00: 2:4367: 40- 50001 •.00016721 6755 1.00 103554 .30-. 1536 4 0.002016721 715 1500 15t338. 15 154402 0:000116721 0017 1-.00 17353. 70 195624 0.000410121 7177 1 0 14087. 2000:424557 04004716721 IM 1,00 11233' 4310'9999 0.0000
Figure 4-2,Example of "New" Fatigue Calculation - CUF Calculation
f
4-8
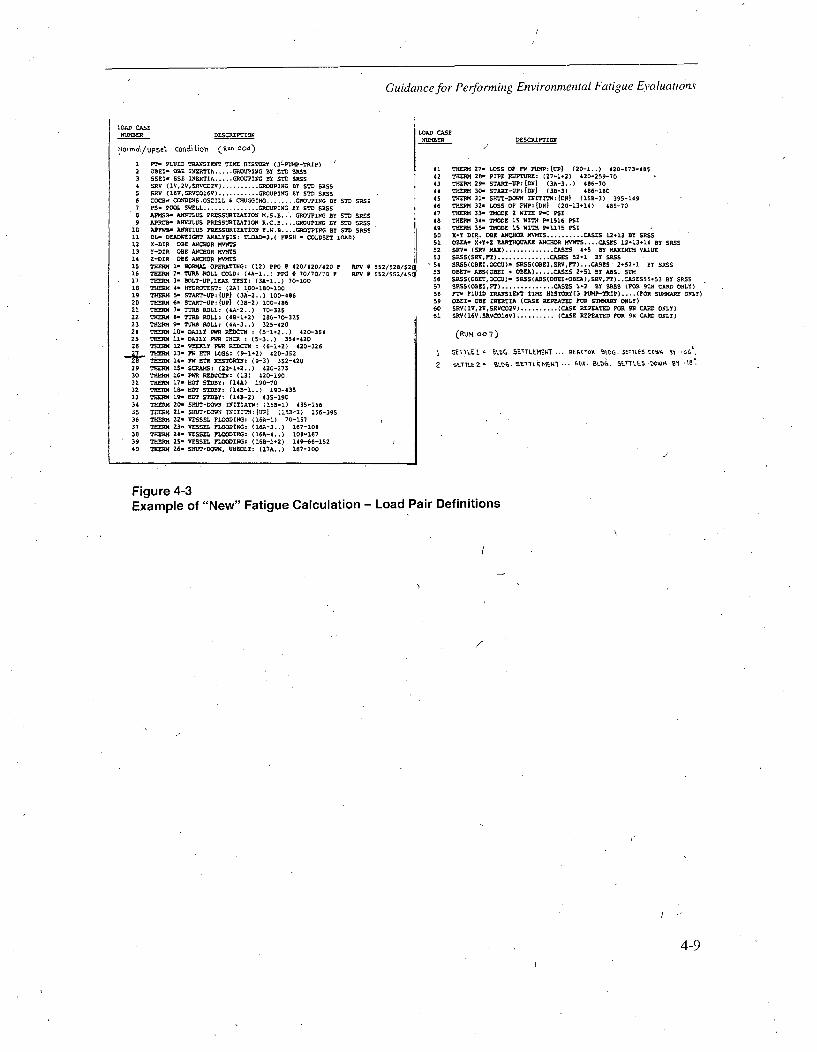
Guidance for Performing Environmental Fatigue Evaluations
LOAD CASE
NUMIBER DESCRIPrBS
NOjo: o UpSet Conditioy) (Run 004)
LOAD CASEXOMB ED DESCRIPTIBON
I PT FLUID TRANSIENT TIME HISTORY (31-PMP-TRIP)2 OBEI- OZE IERTIA ..... ROUPING BY ST•DSDSS3 SSEI SSE INEIA ..... OUPING BY S SRSS4 SR (1V,2V, SVCO2V) .. ::..... :GROUPING BY BID SRSS5 DRV (16VSRVCOI6V) ......... GROUPI BY D ST RSS6 COCE- CONDEN$.OSCILL & CHUGGING ........ GROUPING BY SOD SRS7 PS- POOL SWELL ............... GROPING BY STD SBSSSAPmSB ANNULUS PEDBSEITB E m.S.B... GROUPING BY sBO 5s50
B APRC- ANNULS PRESSURIZATION R.C., .... GOUPING BY STD SRS3LB APFWB- ANNLUS PRESUR17ATION P.W.BE....OGROUING BY STD SDSBLi DL- DEADWEDIGT ANALYSIS: TLOAD3,( FSH - CLDSET LOAD)12 X-DIR OBE ANCHOB HOTS13 Y-DIR OBE ANCHOR KVMT14 Z-DIR ObE ANCHOR M3490Ls THENN I• ORMAL OPEPATIBG: (12) P0 @ 420/620/420 F DPV 01B TKEM 2: TRD DOLL COLD: ()4-I..) PPG 0 70/70/70 F RPV17 THERM 3- LT-UP,LEAM TEST: (3A-I..) 70-1001B TH0ERM 4: HYRBOTE: (2A) 100-18-10019 TOHERM B- BARTUDP:{UP} (3i-2..) ODD•-B620 THERM 6 START-UP:{UP] (3B-2) 100-49621 THM 7 TIRE ROLL: (&A-2..) 70-325D2 THERM a B TIDE ROLL: (4B-1-2) 180-70-32523 THEM 9- TURB, ROLL: (4A-3..) 325-42024 THEM 1 DAILY 4 REDETE : (5-12..) 420-30425 THER 11. DAILY PWR tEC : (0-3..) 354-420DE TOD4 12- HE=DL PUN BESCOB (6-1-2) 420-326L 70 BTD LOSS: (9-1-2) 420-352
29 THEm LB. SCRAMS: (22-1-2..) 420-27B30 THEM 16 PWB BEDUOCN: (13) 020-19031 THER 17. HOT BTDBY: (14A) 190-7032 THEM LB_ HOT OTDBY: (149-I..) 190-43533 THIDH 19- HOT TBEY: (141-2) 435-19034 TOHEBM 20- OHIT-DOWN 20r1IAT0: (L5B-L) 435-15635 TEB 21- 5H)T-DB 00IT)3: IUP} (150-2) 156-39536 THEM 122 VESSEL FLOODING: (16A-L) 70-15737 THERN 23- VESSEL PLOODIBG: (16A-3..) 167-LOB38 THE 24- VESBSE FLOODBNG (16A-4..) 100-16739 TOERN 20- VESSEL PLOODIBG: (16B-1-2) 1491-6-152D0 THRm 264 SBHU-DOHN, UNBOLT: (17A..) 167-100
4142434445494s
51
525354555651
6061
THERM 27- LOSS OF P0 PUMP:{(UP) (20-1..) 420-573-4B5THERM 28- PIPE RUPTURE: (27-1.2) 420-259-70THENM 29- STA•T-UP:{DH) (30A-3..) 486-70THERM 30- START-UP:{SB) (3B-3) E86-180THEM 31- 5)31-DOWN INErD : ID}O (LB-3) 395-149THEE 32- LOSS OF FWP:{D}) (20-13104) 4E5-70THEM 33. T00DS 2 WITH -0 SPSITHE9M 34- THOSE 00 WITH P-1516 PSITHERE) 3D. 040DB Is WITH 9-1105 PSIxBY DIR. ODB ANCHOR VTS ......... CASES 12-13 BY ODDSOBm. D.D EARTHQBARUE ANCHOR ES.... CA.SS 12-13+14 BY DOSSDRY- (DBRV M30) . . . C... 4+5 BY MAXIMUM VALUE
VS(SRV,7) .............. CASES 02.0 BY DOSSORSS(0BEI,)CC). EDS(OBEI,SRV,DT).. CASES -2+52-1 BY SSSOBET- A•S(OBED ) ..... CASES 2.51 BY ADS. S50DSRS(OBET,OCCU)- RBSS(ADS(OBEI+BBEA),SRV.FT)..CASESD5D53 BY SR55SRSS)OBEB.0T)......... CASES 0.3 BY SASS (FOD 9C0 CARD 0)N.Y)FrT PLUID TRANSIENT TIM BBSTYOY(3 PUMP-TRIP) .... (FOR SUMMARY ONLY)OBE IBE IRIERTA (CASE REPETED POD IE•BM4AY O3L20)SRV)(V,2V.DRVC0IV) .......... (CASE REPEATED FOR 9N CARD ONLY)SDV(16V .SRVCOLEV)...... (WAE REPEATED POD 9N CADS 00N.Y)
552/528/S21552/552/45(
(RUiN 007)
I SDTILF-1 z100 tLDC,5TThD.HET ..... DEO BLDGS. 5ET710 D0%9 M0 1.4"
2 5E270D2- BLOB. SDEILEO.0041 ... AU0. BLDGS.0OL5.0 .003) DoOt S1 -
Figure 4-3Example of "New" Fatigue Calculation - Load Pair Definitions
6
4-9
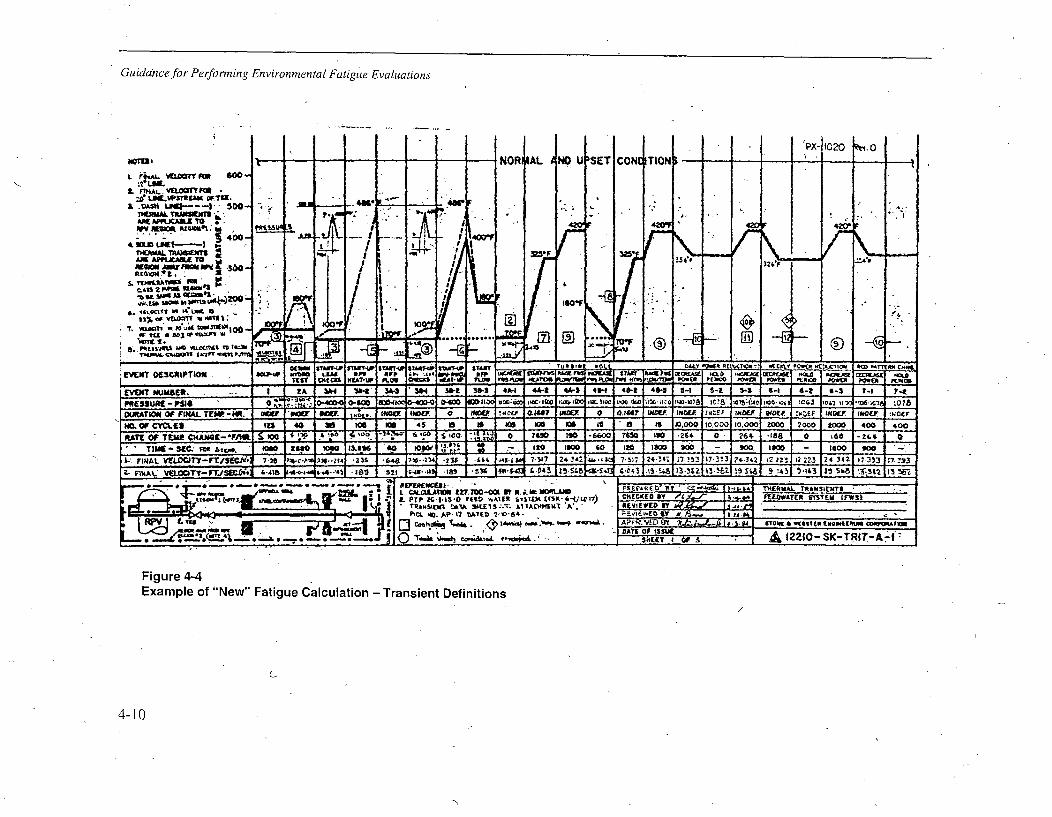
Guidance for Performing Environmental Fatigue EvalIuations
?X-11020 0.0
WOMB NO--N R AL IND.U'SET CONETION-----------
L r'WLW8T 0
"Mg~TtkM 0TWII.&.2"S'M U0 1) 500 - 4W L!_ .4W F.
!nIPua sauaw 4..00-
F4400
TERAL TRAJO~t3l
5. J44awmit.- X.
~.n2 IW10 F
"ADMt .... .... 1EaUZ To~O UF10its - j -. ~j~] ~Jno
9.~ AD~O~A t -~___rum ~UWm a"i- smvwsu u-, Ap l A. M, VAR MOLL ~ IMLY Otht~7$ %KIO T W POCER DfX'Oq bm SftlT :0 C
TES 0106 ESTIF LW ~S AY- 11.6 u 4A05 m~.40 CY1 P0"M 5100alOE MCA PE*5z POW01 POWER K(1,0
UVI UE3 . Z M 3-It 3A-3 3*-H Wt- WS 4*-I 4A-2 41-1 434 4 4-1 491-3 31- 5.1 5.3 6.4 4-1 6.3 ?.1 74Y-
.04Z"NO F*M "M-* dOO4W*--4O--------------------------- --AO m&aIM1to"108 078'78(101,0a"103h0- I .0-4t-.7
DMATM ~ ~ ~ S CW SW" ,,E. -MR.~ ow-lw (SF n wo 0 No&.~ -Onf101? sNam 0 0.1">? IPIDE INOOF r,,:F rnocP ewotg .0,7F I?40EJ tutQCI !NOCV
NOM Of CMECLL In 40 0 M0 11011 45 15 Is Is 106 m 45 '6 is i0,00 (0000 10.000 ZO000 2000 W0OO 400 400AM~Tt Ofo TEMP. ''MlE*A~ S Ica, " 0 7450 to0 -6600 755 M I0 -264 0 264 -186 0 lab -264 0
Tim -m. "l L 51W IQ" 13.1 W 1 100 ism .s 20 ,0 la 090 - 500.120 - coo0 I0 M
1*?IAL'd0QY-t/2C~.7. 'c- 24.)133 *~4 74.)4.34 45 *D- 7Q1 2'_3421Zw-s 7-3:7 124-34111-711W333 17324,3421 t32 22,2223 24-34Z 17-333 1773 33
Z- MAL VELOUY~c-plFs(5D- 4-416 4-.-i IA404-lAS 189 321 1.15-44 _418 .. 5% 4At- 1.85 5 15-5 -.4 .160. 2-1. 13&L 61 :43 5.t43 3 1 3I S3.
41-0 .1 .*-*-* % ~ ArmestRC4C . I
L ' T 2 6.13? -1,5.0 7,1,0 ,.Alflt s'Sl~t xfsx- ('-iiwi') oteot sSIWAE Acy11(5 £FS1 1'I%0. A0 -%7 DATED 2,40-BA4 A 4Jn.
Figure 4-4Example of "New" Fatigue Calculation - Transient Definitions
4-10
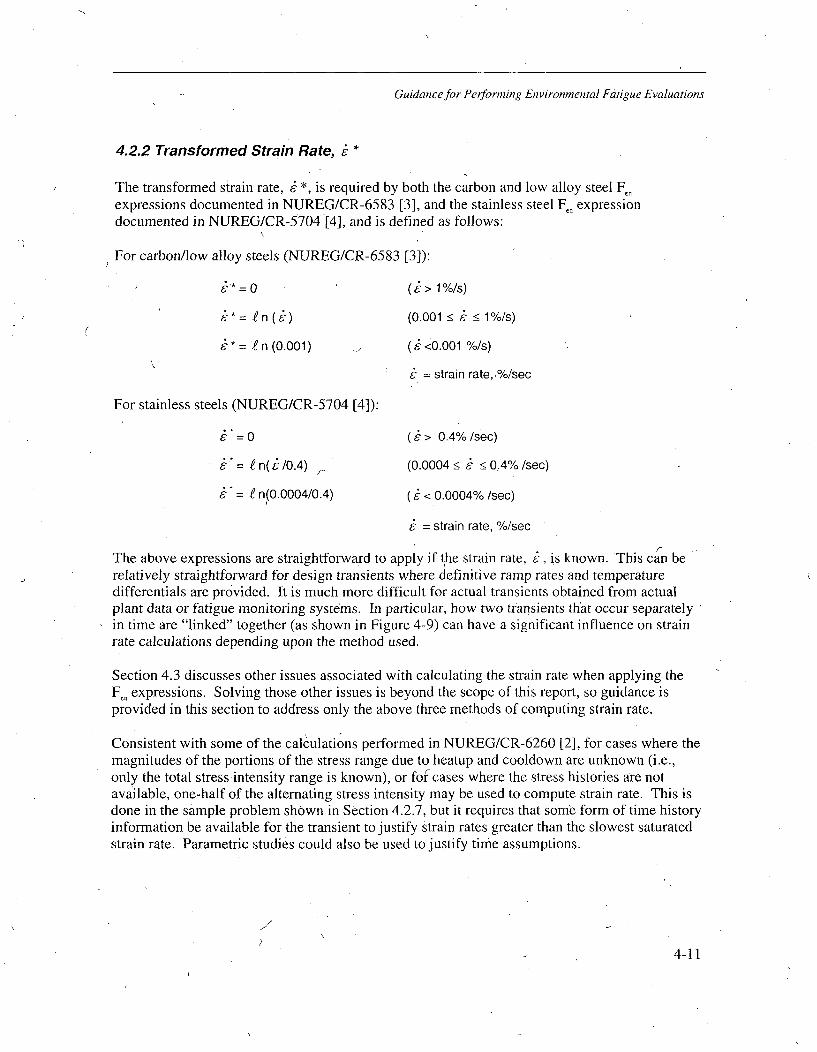
Guidance for Performing Environmental Fatigue Evaluations
4.2.2 Transformed Strain Rate, • *
The transformed strain rate, • *, is required by both the carbon and low alloy steel F onexpressions documented in NUREG/CR-6583 [3], and the stainless steel Fen expressiondocumented in NUREG/CR-5704 [4], and is defined as follows:
For carbon/low alloy steels (NUREG/CR-6583 [3]):
(> 1%/s)
' = n ((0.001 s 1%/s)
• =.e n (0.001) ( <0.001 %/s)
strain rate,,%/sec
For stainless steels (NUREG/CR-5704 [4]):
" = 0 (> 0.4%/sec)
= f n(t/0.4) (0.0004•e E "< 0.4%/sec)f= n(0.0004/0.4) ( < 0.0004% /sec)
= strain rate, %/sec
The above expressions are straightforward to apply if the strain rate, i, is known. This can berelatively straightforward for design transients where definitive ramp rates and temperaturedifferentials are provided. It is much more difficult for actual transients obtained from actualplant data or fatigue monitoring systems. In particular, how two transients that occur separatelyin time are "linked" together (as shown in Figure 4-9) can have a significant influence on strainrate calculations depending upon the method used.
Section 4.3 discusses other issues associated with calculating the strain rate when applying theF., expressions. Solving those other issues is beyond the scope of this report, so guidance isprovided in this section to address only the above three methods of computing strain rate.
Consistent with some of the calculations performed in NUREG/CR-6260 [2], for cases where themagnitudes of the portions of the stress range due to heatup and cooldown are unknown (i.e.,only the total stress intensity range is known), or fof cases where the stress histories are notavailable, one-half of the alternating stress intensity may be used to compute strain rate. This isdone in the sample problem shown in Section 4.2.7, but it requires that some form of time historyinformation be available for the transient to justify strain rates greater than the slowest saturatedstrain rate. Parametric studies could also be used to justify time assumptions.
44-11
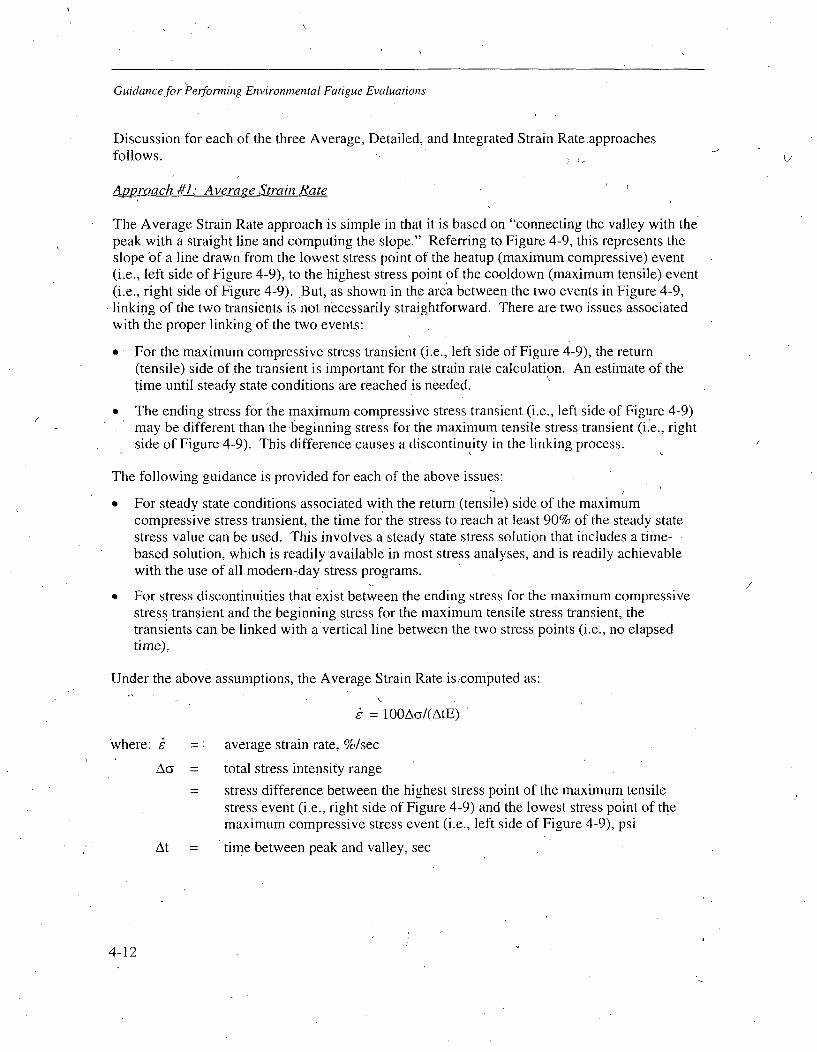
Guidance for Performing Environmental Fatigue Evaluations
Discussion for each of the three Average, Detailed, and Integrated Strain Rate approachesfollows.
Approach #1: Average Strain Rate
The Average Strain Rate approach is simple in that it is based on "connecting the valley with thepeak with a straight line and computing the slope." Referring to Figure 4-9, this represents theslope of a line drawn from the lowest stress point of the heatup (maximum compressive) event(i.e., left side of Figure 4-9), to the highest stress point of the cooldown (maximum tensile) event(i.e., right side of Figure 4-9). But, as shown in the area between the two events in Figure 4-9,linking of the two transients is not necessarily straightforward. There are two issues associatedwith the proper linking of the two events:
" For the maximum compressive stress transient (i.e., left side of Figure 4-9), the return(tensile) side of the transient is important for the strain rate calculation. An estimate of thetime until steady state conditions are reached is needed.
" The ending stress for the maximum compressive stress transient (i.e., left side of Figure 4-9)may be different than the beginning stress for the maximum tensile stress transient (i.e., rightside of Figure 4-9). This difference causes a discontinuity in the linking process.
The following guidance is provided for each of the above issues:
" For steady state conditions associated with the return (tensile) side of the maximumcompressive stress transient, the time for the stress to reach at least 90% of the steady statestress value can be used. This involves a steady state stress solution that includes a time-based solution, which is readily available in most stress analyses, and is readily achievablewith the use of all modern-day stress programs.
* For stress discontinuities that exist between the ending stress for the maximum compressivestress transient and the beginning stress for the maximum tensile stress transient, thetransients can be linked with a vertical line between the two stress points (i.e., no elapsedtime).
Under the above assumptions, the Average Strain Rate iscomputed as:
= 100AG/(AtE)
'where: e average strain rate, %/sec
Ac = total stress intensity range
= stress difference between the highest stress point of the maximum tensilestress event (i.e., right side of Figure 4-9) and the lowest stress point of themaximum compressive stress event (i.e., left side of Figure 4-9), psi
At = time between peak and valley, sec
4-12
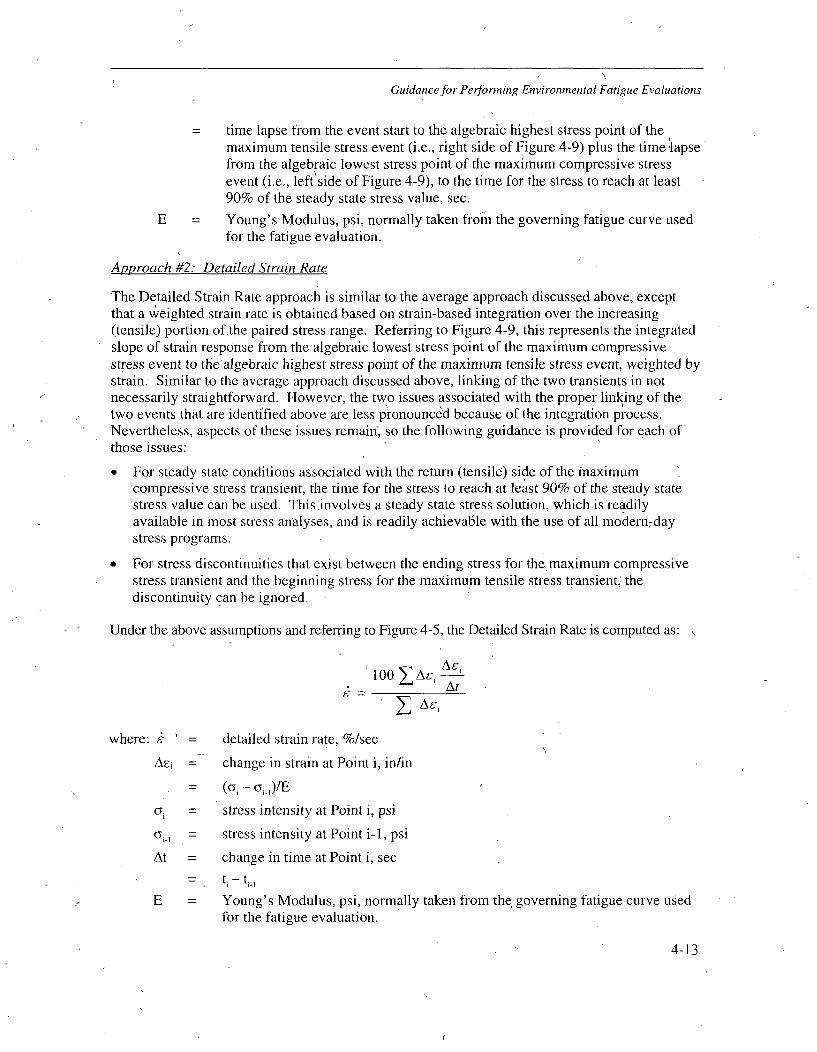
Guidance for Performing Environmental Fatigue Evaluations
time lapse from the event start to the algebraic highest stress point of themaximum tensile stress event (i.e., right side of Figure 4-9) plus the time lapsefrom the algebraic lowest stress point of the maximum compressive stressevent (i.e., left side of Figure 4-9), to the time for the stress to reach at least90% of the steady state stress value, sec.
E Young's Modulus, psi, normally taken froim the governing fatigue curve usedfor the fatigue evaluation.
Approach #2: Detailed Strain Rate
The Detailed Strain Rate approach is similar to the average approach discussed above, exceptthat a Neighted strain rate is obtained based on strain-based integration over the increasing(tensile) portion of the paired stress range. Referring to Figure 4-9, this represents the integratedslope of strain response from the algebraic lowest stress point of the maximum compressivestress event to the algebraic highest stress point of the maximum tensile stress event, weighted bystrain. Similar to the average approach discussed above, linking of the two transients in notnecessarily straightforward. However, the two issues associated with the proper linking of thetwo events that are identified above are less pronounced because of the integration process.Nevertheless, aspects of these issues remain, so the following guidance is provided for each ofthose issues:
* For steady state conditions associated with the return (tensile) side of the maximumcompressive stress transient, the time for the stress to reach at least 90% of the steady statestress value can be used. This involves a steady state stress solution, which is readilyavailable in most stress analyses, and is readily achievable with the use of all modern7daystress programs.
• For stress discontinuities that exist between the ending stress for the maximum compressivestress transient and the beginning stress for the maximum tensile stress transient, thediscontinuity can be ignored.
Under the above assumptions and referring to Figure 4-5, the Detailed Strain Rate is computed as:
100 AE Ac,At
SAc,
where: c = detailed strain rate, %/sec
Ai= change in strain at Point i, in/in
(C51- - j,,)/E
G = stress intensity at Point i, psi
i_,= stress intensity at Point i-1, psi
At = change in time at Point i, sec= t - ti.I
E = Young's Modulus, psi, normally taken from the governing fatigue curve usedfor the fatigue evaluation.
4-13
Guidancefor Performing Environmental Fatigue Evaluations
The summation is over the range from Point (3) to (4) and the range from Point (1) to (2). In thefigure, Points (1) and (4) are assumed coincident. Point (4) is actually taken as the point wherethe stress returns to at least 90% of the steady state stress value. The strain discontinuitybetween this point and Point (1) is accounted for by omitting this increment from the total strainrange in the denominator.
If two tensile transients are being ranged, the summation ranges from the algebraic minimum of,the two Point (1)s to the algebraic maximum of the two Point (2)s. If two compressive transients,are being ranged, the summation ranges from the algebraic minimum of the two Point (3)s to thealgebraic maximum of the two Point (4)s. If a tensile transient is being ranged with itself (its'zero' state), the summation ranges from Point (1) to Point (2). If a compressive transient isbeing ranged with itself (its 'zero' state), the summation ranges from,Point (3) to Point (4) withPoint (4) again taken where the stress returns to at least 90% of the steady state stress value.
Approach #3: Integrated Strain Rate
The Integrated Strain Rate approach is similar to the detailed approach discussed above, exceptthat an Fen factor is computed at multiple points over the increasing (tensile) portion of the pairedstrain range, and an overall F. is integrated over the entire tensile portion of the strain range (i.e.,from the algebraic lowest stress point of the maximum compressive stress event to the algebraichighest stress point of the maximum tensile stress event in Figure 4-9). Thus, this process ismore specifically an "integrated F., approach", where strain rate is computed as a part of theprocess. Similar to the two approaches discussed above, linking of the two transients remains anissue with this method. However, similar to the detailed approach, the two issues associated withthe proper linking of the two events are less pronounced because of the integration process. Thefollowing guidance is provided for each of those issues:
" For steady state conditions associated with the return (tensile) side of the maximumcompressive stress transient, the time for the stress to reach at least 90% of the steady statestress value can be used. This involves a steady state stress solution, which is readilyavailable in most stress analyses, and is readily achievable with the use of all modem-daystress programs.
* For stress discontinuities that exist between the ending stress for the maximum compressivestress transient and the beginning stress for the maximum tensile stress transient, thediscontinuity can be ignored.
Under the above assumptions and referring to Figure 4-5, the Integrated Strain Rate F.. iscomputed as:
Z Fen,iAei
where: F,,, F o computed at Point i, based on t 100Ac!/At and transformed parametersS .(T) and (0) computed using the respective Integrated Strain Rateapproaches for each, discussed below.
A~i = change in strain at Point i, in/in
4-14
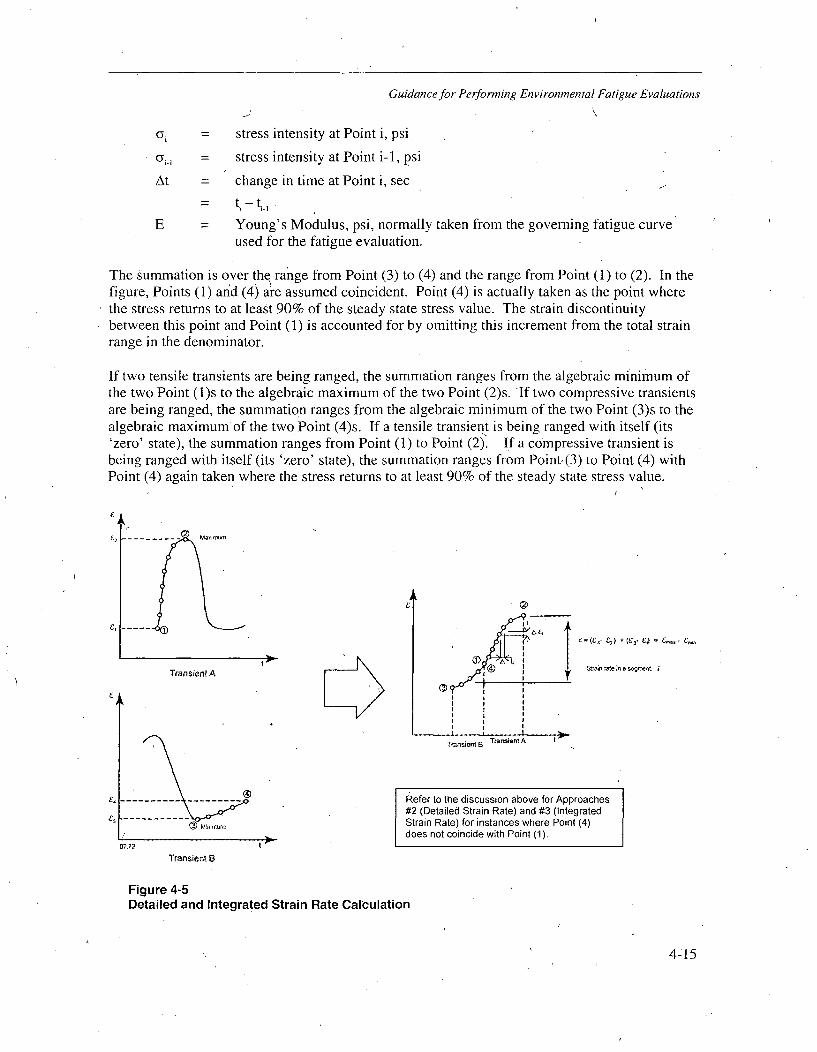
Guidance for Performing Environmental Fatigue Evaluations
At
E
stress intensity at Point i, psi
stress intensity at Point i-1, psi
change in time at Point i, sec
= t-t
Young's Modulus, psi, normally taken from the governing fatigue curveused for the fatigue evaluation.
The summation is over the range from Point (3) to (4) and the range from Point (1) to (2). In thefigure, Points (1) and (4) aire assumed coincident. Point (4) is actually taken as the point wherethe stress returns to at least 90% of the steady state stress value. The strain discontinuitybetween this point and Point (1) is accounted for by omitting this increment from the total strainrange in the denominator.
If two tensile transients are being ranged, the summation ranges from the algebraic minimum ofthe two Point (1)s to the algebraic maximum of the two Point (2)s. If two compressive transientsare being ranged, the summation ranges from the algebraic minimum of the two Point (3)s to. thealgebraic maximum of the two Point (4)s. If a tensile transient is being ranged with itself (its'zero' state), the summation ranges from Point (1) to Point (2). If a compressive transient isbeing ranged with itself (its 'zero' state), the summation ranges from Point,(3) to Point (4) withPoint (4) again taken where the stress returns to at least 90% of the steady state stress value.
L
tsnTransient A
(D
Tmrel9TaminA
e = (El C-0 - (Ef 6) e-
Refer to the discussion above for Approaches#2 (Detailed Strain Rate) and #3 (IntegratedStrain Rate) for instances where Point (4)does not coincide with Point (1).
IMminmu
07 72
Transient B
Figure 4-5Detailed and Integrated Strain Rate Calculation
4-15
Guidance for Performing Environmental Fatigue Evaluations
4.2.3 Transformed Sulfur Content, S*
The transformed sulfur content, S*, is required, only by the carbon and low alloy steel Fen
expressions documented in NUREG/CR-6583 [3], and is defined as follows:
S*=S (0 < S •< 0.015 wt. %)
S* = 0.015' (S > 0.015 wt. %)
S = weight percent sulfur
There are no ambiguities associated with computing S*, as it is a function of the material sulfurcontent for the location under consideration. Normally, sulfur content would be obtained fromCertified Material Test Reports (CMTRs) that are usually readily available. However, due to thesecondary effect of this variable in the Fe. expressions, most analyses to-date have assumed highsulfur content (i.e., S* = 0.015) for simplicity.
4.2.4 Transformed Temperature, T*
The transformed temperature, T*, is required by both the carbon and low alloy steel Feeexpressions documented in NUREG/CR-6583 [3], and the stainless steel Fe. expressiondocumented in NUREG/CR-5704 [4], and is defined as follows:
For carbon/low alloy steels (NUREG/CR-6583 [3]):-
T* = 0 (T < 1500C)
T* = T - 150 (150 •< T• 350°C)
T = metal service temperature, 0C
For stainless steels (NUREG/CR-5704 [4]): ,
T* = 0 (T < 200'C)
T*= 1 (T >_. 2000C)
T = metal service temperature, °C
The above expressions are straightforward to apply if the metal service temperature, T, is known.
As discussed in Section 4.3, there are other issues associated with temperature when applying theFe, expressions. Generally, the issue is, "what temperature should be used for the generaltransient pairing shown in Figure 4-9?" The answer to this question is dependent upon therefinement on the evaluation used to compute the Fen factor. As discussed above at the start ofSection 4.2, there are three increasingly refined approaches used to compute the Fen factor:Average, Detailed, and Integrated Strain Rate.
4-16
Guidance for Performing Environmental Fatigue Evaluations
The following recommendations are made for determining the temperature, T, for each of theabove three approaches:
Aypproach #1: F,_ Factor Calculated Based on Average Strain Rate Calculation
For this approach, a constant temperature that is the maximum of the fluid temperatures of bothpaired transients over the'time period of increasing tensile stress should be used. Referring toFigure 4-9, this would include the maximum temperature that occurs during any of the followingtime periods:
* For the maximum compressive stress transient (i.e., left side of Figure 4-9), beginning at thetime of algebraic minimum stress until the end of the transient.
For the maximum tensile stress transient (i.e., right side of Figure 4-9), beginning at the startof the transient until the time of algebraic maximum stress.
Fluid temperature is an acceptable substitute for the above specified metal temperature in thatfluid temperature is more readily available in CUF calculations, as it is a required input withrespect to transient definitions. This is true for both older-vintage and modern-day evaluations.Since the maximum fluid temperature envelopes any metal temperature, this is conservative.
Approach #2: F Factor Calculated Based on Detailed Strain Rate
For this approach, the maximum fluid temperature of both paired transients over the time periodof increasing tensile stress should be used (i.e., same as Approach #1 above).
Approach #3: F Factor Calculated Based on Integrated Strain Rate
For this approach, F- is computed in an integrated fashion at multiple points between thetransient pair stress valley and peak. For this case, the maximum metal temperature of both localtime points considered over the period of increasing tensile stress should be used. Referring toFigure 4-5, this represents the maximum of Points i and i-1, or T = MAXIMUM(T,, T,-,). Metaltemperature is more appropriate and avoids potential excess conservatism that would result fromusing fluid temperature in a heating evenit and inappropriate omission of effects in a coolingevent.
For all three approaches described above, a conservative, simplified, and bounding evaluationwould be to use the maximum operating temperature for the component location being evaluated.Note that it is not obvious that the use of maximum temperature in the Foo expressions isbounding (due to subtraction of the temperature terms), but routine application of the expressionshas demonstrated that the use of the maximum temperature is bounding in all of the Fe,expressions. This is also shown in Figure 4-6, which shows F , values as a function oftemperature.
4-17

Guidance for Performing Environmental Fatigue Evaluations
Stainless Steel Fen
18.0 T
16.0 Low 02 + Lowz, Low 02 + Int.
1 - - Low 02+Hight
14.0 - High 02 +'Low
- - - High 02 + Int.
9 n . ...... High 02 + High i
0/1'0.0
L-
8.0
6.0
4.0
2.0
525 5750.0
275 325 375 425 475
Temperature, 'F
Carbon Steel Fen
160
- High 02 - Low t
High 02 - Int. t
-- High 02 + High t120
t-Int. 02 + Lowt
- - - Int. 02 + Int. t100•
------ Int. 02 + Hight
LOw 02 + LOw L80
60-
40
20-
150 200 250 300 350 400 450 500 550 600 650
Temperature, *F
Figure 4-6Fen Values as a Function of Temperature
4-18
Guidance for Performing Environmental Fatigue Evaluations
4.2.5 Transformed Dissolved Oxygen, 0*
The transformed oxygen, 0*, is required by both the carbon and low alloy steel Fe, expressionsdocumented in NUREG/CR-6583 [3], and the stainless steel F., expression documented inNUREG/CR-5704,[4], and is defined as follows:
For carbon/low alloy steels (NUREG/CR-6583 [3]):
O* = 0 (DO < 0.05 ppm)
0* = t n (DO/0.04) (0.05 ppm _ DO _ 0.5 ppm)
0* = g n (12.5) (DO > 0.5-ppm)
DO = dissolved oxygen
For stainless steels (NUREG/CR-5704 [4]):
O = 0.260 (DO < 0.05 ppm)
O = 0.172 (DO Ž_ 0.05 ppm)
DO = dissolved oxygen
The above expressions are straightforward to apply if the dissolved oxygen level, DO, is known.Although DO measurements are normally available through routine chemistry measurements,they are typically very limited with respect to frequency of collection and locations collected inthe reactor coolant system (RCS). Therefore, there 'are several difficulties associated withdetermining the DO that is appropriate for use in the F., expressions:
* The DO level is not known at the component location being evaluated. For example, it is theDO directly at the surface of the component that is required, e.g., for a BWR componentexposed to saturated steam, the (much lower) DO in the condensate film is really what isapplicable to an environmental fatigue analysis, not the much higher DO content of the steamitself.
* The DO level is not known at all times during a transient (i.e., perhaps'DO data is onlycollected once per day as opposed to confinuously during a transient).
As discussed in Section 4.3, there are other issues associated with DO ,when applying the Fenexpressions. Solving those other issues is beyond the scope of this report, so guidance isprovided in this section to address only the above two issues and answering the question, "whatDO level should be used for the general transient pairing shown in Figure 4-9?" As with T*, theanswer to this question is dependent upon the refinement on the evaluation used to 'compute theF_, factor. Section 4.2 contains the definitions and details for each of these three approaches.The following_ recommendations are made for determining the dissolved oxygen, DO, for each ofthe three approaches:
4-19
Guidance for Performing Environmental Fatigue Evaluations
Approach #1: F Factor Calculated Based on Average Strain Rate Calculation
For this approach, the maximum DO level (for carbon and low alloy steels), or the minimum DOlevel (for stainless steels) of both paired transients over the time period of increasing tensilestress should be used. Referring to Figure 4-9, this would include the maximum (or minimum)DO level that occurs during any of the following time periods:
" For the maximum compressive stress transient (i.e., left side of Figure 4-9), beginning at thetime of algebraic minimum stress until the end of the transient.
* For the maximum tensile stress transient (-i.e., right side of Figure 4-9), beginning at the startof the-transient until the time of algebraic maximum stress.
\.
Approach #2: F Factor Calculated Based on Detailed Strain Rate
For this approach, the maximum DO level (for carbon and low alloy steels), or the minimum DOlevel (for stainless steels) of both paired transients over, the time period of increasing tensilestress should be used (i.e., same as Approach #1 above).
Approach #3:. F Factor Calculated Based on Integrated Strain Rate
For this approach, F-n is computed in an integrated fashion at multiple points between thetransient pair stress valley and peak. For this case, the maximum DO level (for carbon and lowalloy steels), or the minimum DO level (for stainless steels) of both local points considered overthe time period of increasing tensile stress should be used. Referring to Figure 4-5, thisrepresents the maximum of Points i and i-1 (DO = MAXIMUM[DO, DOJ]) for carbon and lowalloy steels, or the minimum of Points i and i-i (DO MINIMUM[DO, DO,]) for stainlesssteels.
For all three approaches described above, the following guidance is provided for establishing theDO level:
" In rare cases, DO level measurements are available at or near the component location beingevaluated via plant instrumentation. For this case, the plant data is used directly for DO.
" In the majority of cases, DO level measurements are available at periodic intervals duringplant operation. These measurements are routinely made remotely from the componentlocation of interest. In some cases, the remote reading may be valid for application at thecomponent location. For these cases, "typical" values can normally be determined based onconsultation with the plant chemistry personnel. The typical values should be used with abrief write-up describing the basis for the values. Consideration should be given forvariations in the DO level, i.e., consideration of bounding values, as described below, shouldbe factored into the estimates.
* For cases where DO levels have changed over the course of plant operation (i.e., implementationof HWC after plant startup), a time-based average DO level is recommended, based onexpected DO levels, as follows:
4-20
Guidance for Performing Environmental Fatigue Evaluations
DO = DO 1 Time, + DO 2 Time 2 + DO 3 Time 3 +
Time1 + Time 2 + Time 3 +
where: DO time-averaged DO levelDO[ average DO level for time period Time,Time, time period #1 where DO level was relatively constantDO 2 average DO level for time period Time2Time2 = time period #2 where DO level was relatively constantDO3 = average DO level for time period Time 3Time 3 time period #3 where DO level was relatively constantetc.
Thus, for a case where a BWR operated 20 years under NWC (typical DO = 200 ppb), 10 yearswith 50% HWC availability (typical DO = 5 ppb), and is projected to complete operation to 60years with 95% HWC availability, the following DO level is calculated:
'DO =(200x20) + (200x0.5x10) + (5x0.5x10) + (5x30) = 86.25 ppb(20+10+30)
Alternatively, F., factors could be computed for each time period and an overall Fen factorcalculated based on the weighted average, as follows:
Fn,2o0 ppb x20.-+ IF,,211 ppb x 0.5 x 10 + Fn,5 ppb x 0.5 x 10 + Fe,5x + ppb x30
e, =(20+10+30)
Another alternative method involves assigning a DO value to each logged transient according tothe date it occurred. This is more involved than the above in that the range pair table would needto be apportioned into subsets over the past and future history of the unit and the incremental U-sre-calculated: An approximation of this would be to do a simple apportioning of the range pairU-s according to an assumed linear distribution of the occurrences, n, over the past and futurehistorical DO values.
Similar to that described for T*, a simplified, conservative and bounding evaluation would be touse the maximum DO level (for carbon and low alloy steels), or the minimum DO level (forstainless steels) for the component location being evaluated. Note that it is not obvious that theuse of these maximum or minimum DO levels in the F_ expressions is bounding (due tosubtraction of the oxygen terms), but routine application of the expressions has demonstrated thatthe use of the maximum DO level is bounding in all of the F., expressions for carbon and lowalloy steels, and the minimum DO level is bounding in all of the F., expressions for stainlesssteels. This is also shown in Figure 4-7 which shows F_, values as a function of DO level.
4-21
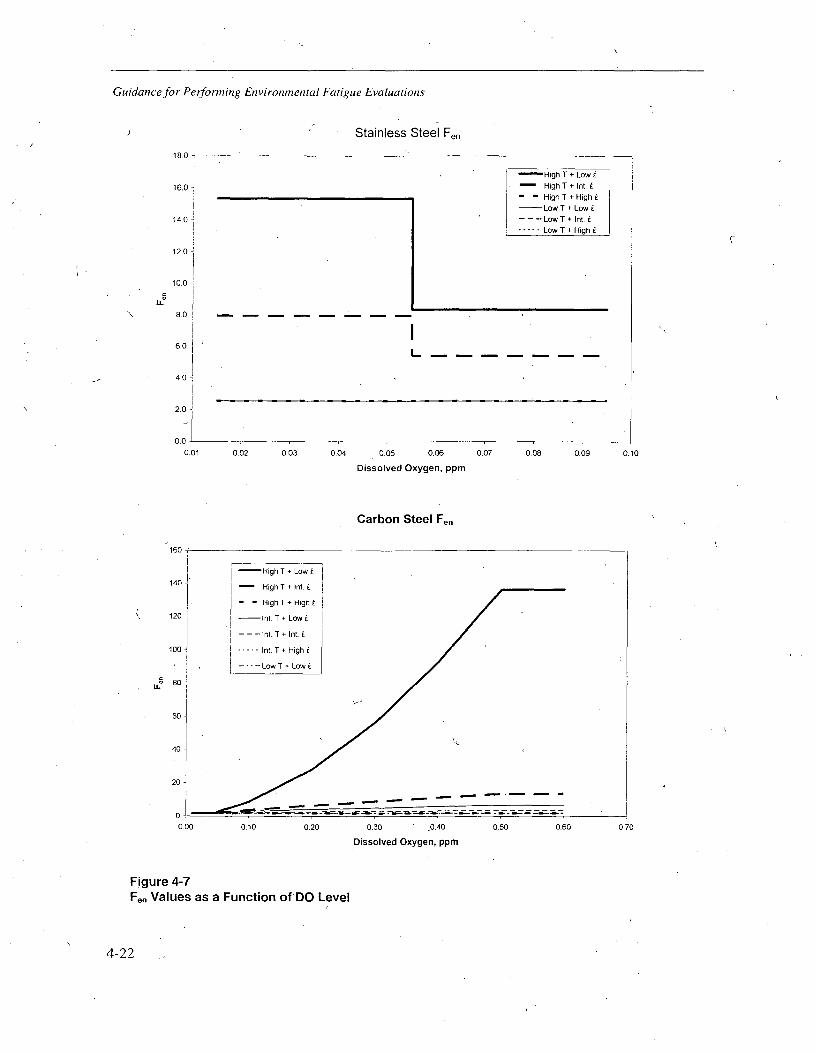
Guidance for Performing Environmental Fatigue Evaluations
Stainless Steel Fen
18.0
16.0
14.0 !
12.0
10.0•
8.0k
6,0
4.0k
2.0 J
0'00.01
High T + Low E
High T + Int.
- - High T + HighELow T + Low
- - -- Low T + Int. i----- Low T + High
C
I
0.02 0.03 0.04 0.05 0.06
Dissolved Oxygen, ppm
0.07 0.08 0.09 0.10
Carbon Steel Fen
160
140
1
120
100
" 80
60
40
0.00 0.10 0.20 0.30 0.40 0.50 0.60 0.70
Dissolved Oxygen, ppm
Figure 4-7Fe,, Values as a Function of DO Level
4-22
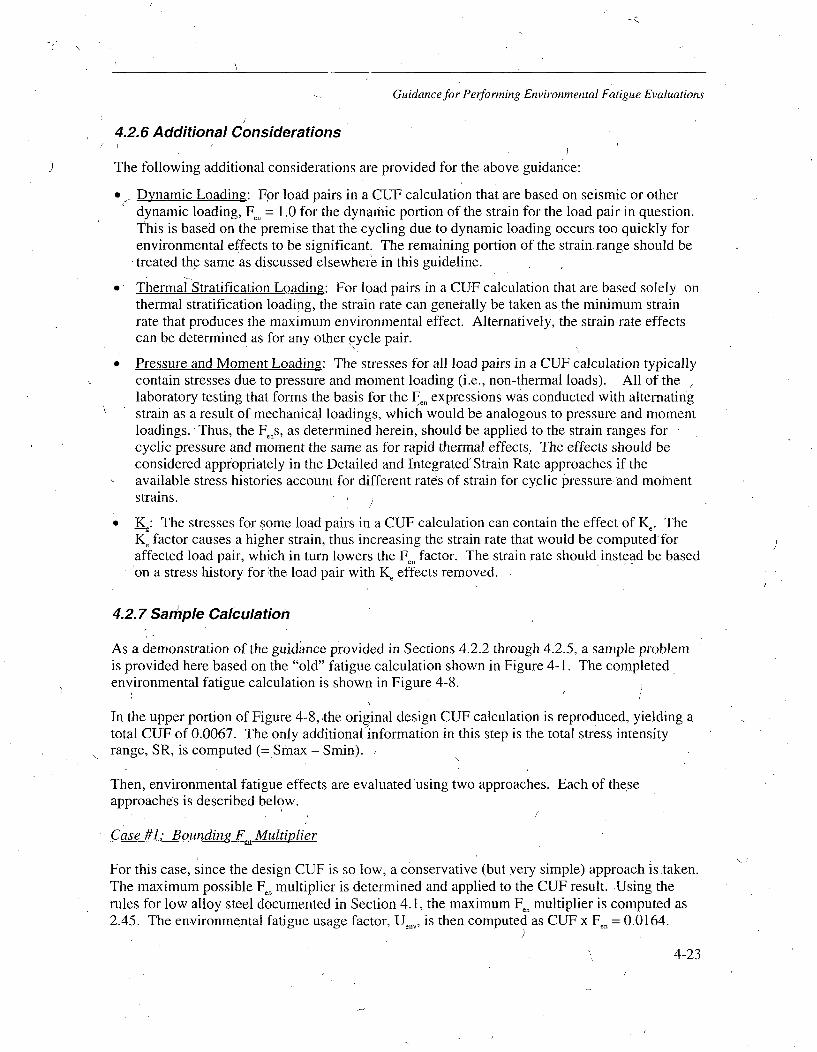
Guidance for Performing Environmental Fatigue Evaluations
4.2.6 Additional Considerations
The following additional considerations are provided for the above guidance:
Dynamic Loading: For load pairs in a CUF calculation that are based on seismic or otherdynamic loading, Fe, = 1.0 for the dynamic portion of the strain for the load pair in question.This is based on the premise that the cycling due to dynamic loading occurs too quickly forenvironmental effects to be significant. The remaining portion of the strain range should betreated the same as discussed elsewhere in this guideline.
* Thermal Stratification Loading: For load pairs in a CUF calculation that are based solely onthermal stratification loading, the strain rate can generally be taken as the minimum strainrate that produces the maximum environmental effect. Alternatively, the strain rate effectscan be determined as for any other cycle pair.
* Pressure and Moment Loading: The stresses for all load pairs in a CUF calculation typicallycontain stresses due to pressure and moment loading (i.e., non-thermal loads). All of the /
laboratory testing that forms the basis for the F expressions was conducted with alternatingstrain as a result of mechanical loadings, which would be analogous to pressure and momentloadings. Thus, the Fes, as determined herein, should be applied to the strain ranges forcyclic pressure and moment the same as for rapid thermal effects. The effects should beconsidered appropriately in the Detailed and Integrated' Strain Rate approaches if theavailable stress histories account for different rates of strain for cyclic pressure and momentstrains.
K: The stresses for some load pairs in a CUF calculation can contain the effect of K. TheK, factor causes a higher strain, thus increasing the strain rate that would be computed foraffected load pair, which in turn lowers the Fe, factor. The strain rate should instead be basedon a stress history for the load pair with Ke effects removed.
4.2.7 Sample Calculation
As a demonstration of the guidance provided in Sections 4.2.2 through 4.2.5, a sample problemis provided here based on the "old" fatigue calculation shown in Figure 4-1. The completedenvironmental fatigue calculation is shown in Figure 4-8.
In the upper portion of Figure 4-8, the original design CUF calculation is reproduced, yielding atotal CUF of 0.0067. The only additional information in this step is the total stress intensityrange, SR, is computed (= Smax - Smin).
Then, environmental fatigue effects are evaluated'using two approaches. Each of theseapproaches is described below.
Case #1: Bounding F_ Multiplier
For this case, since the design CUF is so low, a conservative (but very simple) approach is taken.The maximum possible Fe, multiplier is determined and applied to the CUF result. Using therules for low alloy steel documented in Section 4.1, the maximum Fen multiplier is computed as2.45. The environmental fatigue usage factor, U,,,, is then computed as CUF x Fon = 0.0164.
)',, 4-23

Guidance for Performing Environmental Fatigue Evaluations
Case #2. Compute F Multipliers For Each Load Pair
For this case, a more refined approach is taken compared to the first approach. Fo, multipliers arecomputed for each load pair. Using the rules -for low alloy steel documented in Section 4.1, theoverall Fon multiplier is also 2.45 for this approach, since the F., does not vary with temperaturedue to the low DO. The environmental fatigue usage factor, U, . for this case is also computedas 0.0164.
The following descriptions are provided for the calculations for Load Pair #1:
Salt alternating stress intensity from design CUF calculation, psi
t time for tensile portion of stress range in load pair, sec. Obtained from stressreport from the tensile portions of both transients = 3 seconds.
Strain Rate computed using the Average Strain Rate approach as 100(Salt/2)/(Et)100(58.77/2)/(30,000x3) = 0.03265%/sec
MAX T maximum fluid temperature for tensile portion of stress range, 'F. Obtained fromstress report from the tensile portions of both transients 550°F.
T* = T-150 since T> 150'C (550'F = 287.8'C) = 287.8 - 150 = 137.8
0* 0 since DO < 0.05 ppm (5 ppb = 0.005 ppm)
c-dot* In(Strain Rate) since 0.001 < Strain Rate 1 1%/sec. ln(0.03265) = -3.422
Fe-, = exp(0.898- 0.101S*T*O*e-dot*
exp(0.898 - 0.101x0.015x137.8xOx-3.422)
exp(0.898)
2.45
4-24
4-24
(
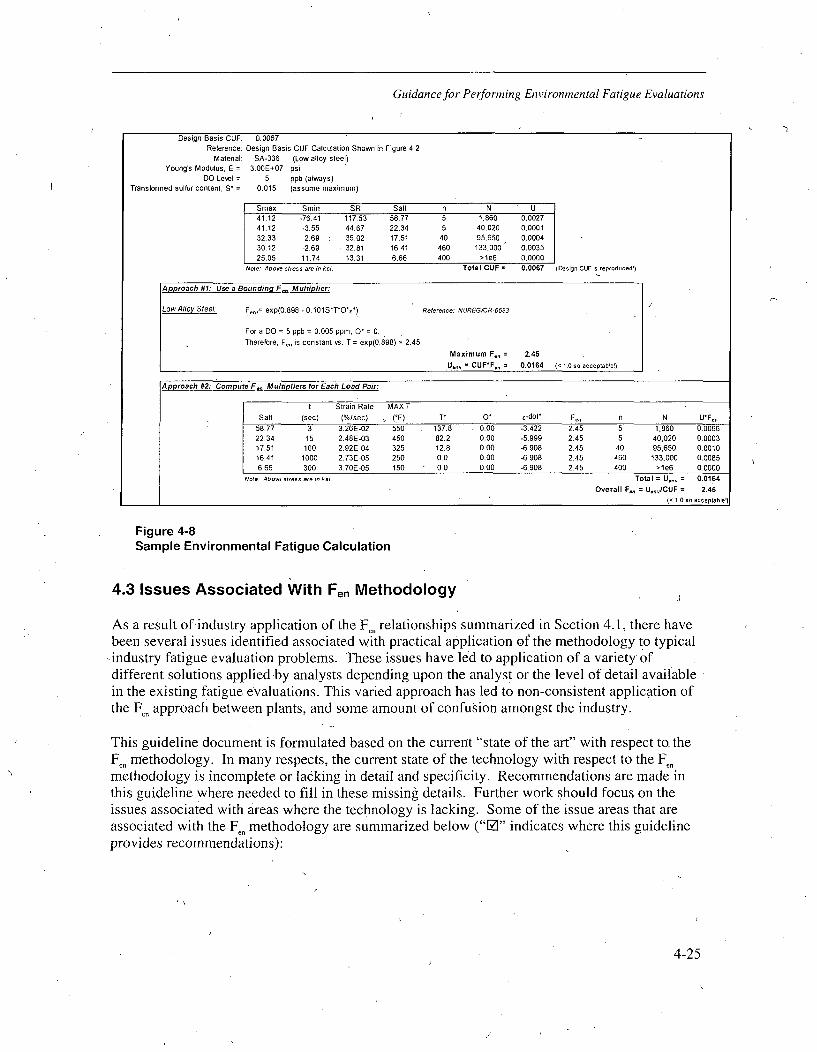
Guidance for Performing Environmental Fatigue Evaluations
Design Basis CUF: 00067Reference: Design Basis CUF Calculation Shown in Figure 4-2
Material: SA-336 (Low alloy steel)Young's Modulus, E = 3.00E+07 psi
DO Level = 5 ppb (always)Transformed sulfur content. S" = 0.015 (assume maximum)
Smax Smin SR Salt n N U41.12 -7641 117.53 58.77 5 1,860 0.002741.12 -3.55 44.67 22.34 5 40,020 0.000132.33 -2.69 ! 35.02 17.51 40 95,650 0.000430.12 -2.69 32.81 16.41 460 133,000 0.003525.05 11.74 13.31 6.66 400 >le8 0,0000
Note: Above stress are in ksi, Total CUF = 0.0067 (Design CUF is reproducedl)
Approach #1: Use a Bounding F_ Multiplier
Low Alloy Steel: Fen.= exp(0.898 - 0.101S*T*O*•v*) Reference: NUREG/CR-6583
For a DO = 5 ppb = 0.005 ppm, O* = 0,Therefore, Fen is constant vs. T = exp(0.89
8) = 2.45:
Maximum F., = 2.45U... CUF*F., = 0.0164 (< 1.0 so acceptable!)
Approach #2: Compute F_, Multipliers for Each Load Pair;
t Strain Rate MAX T
Salt )sec) (%/sec) (°F) T 0 0. s-dot* F.n n N U*F,,58.77 3 3.26E-02 550 137.8 0.00 -3.422 2.45 5 1.860 0.006622,34 15 2.48E-03 450 82.2 0.00 -5.999 2.45 5 40,020 0.000317.51 100 2.92E-04 325 12.8 0.00 -6.908 2.45 40 95,650 0.001016.41 1000 2.73E-05 250 0.0 0.00 -6.908 2.45 460 133,000 0.00856.66 300 3.7011-05 150 0.0 0.00 -6.908 2.45 400 >1e6 0.0000
Note: Above stress are in ksi. Total = U... = 0.0164
Overall F., = Uv1CUF = 2.46(< 1.0 so acceptable!l
Figure 4-8Sample Environmental Fatigue Calculation
4.3 Issues Associated With Fen Methodology J
As a result of industry application of the F_, relationships summarized in Section 4.1, there havebeen several issues identified associated with practical application of the methodology to typical
-industry fatigue evaluation problems. These issues have led to application of a variety ofdifferent solutions applied-by analysts depending upon the analyst or the level of detail availablein the existing fatigue evaluations. This varied approach has led to non-consistent application ofthe Fen approach between plants, and some amount of confusion amongst the industry.
This guideline document is formulated based on the current "state of the art" with respect to. theF,, methodology. In many respects, the current state of the technology with respect to the Fe,methodology is incomplete or lacking in detail and specificity. Recommendations are made inthis guideline where needed to fill in these missing details. Further work should focus on theissues associated with areas where the technology is lacking. Some of the issue areas that areassociated with the F ,, methodology are summarized below ("10" indicates where this guidelineprovides recommendations):
4-25
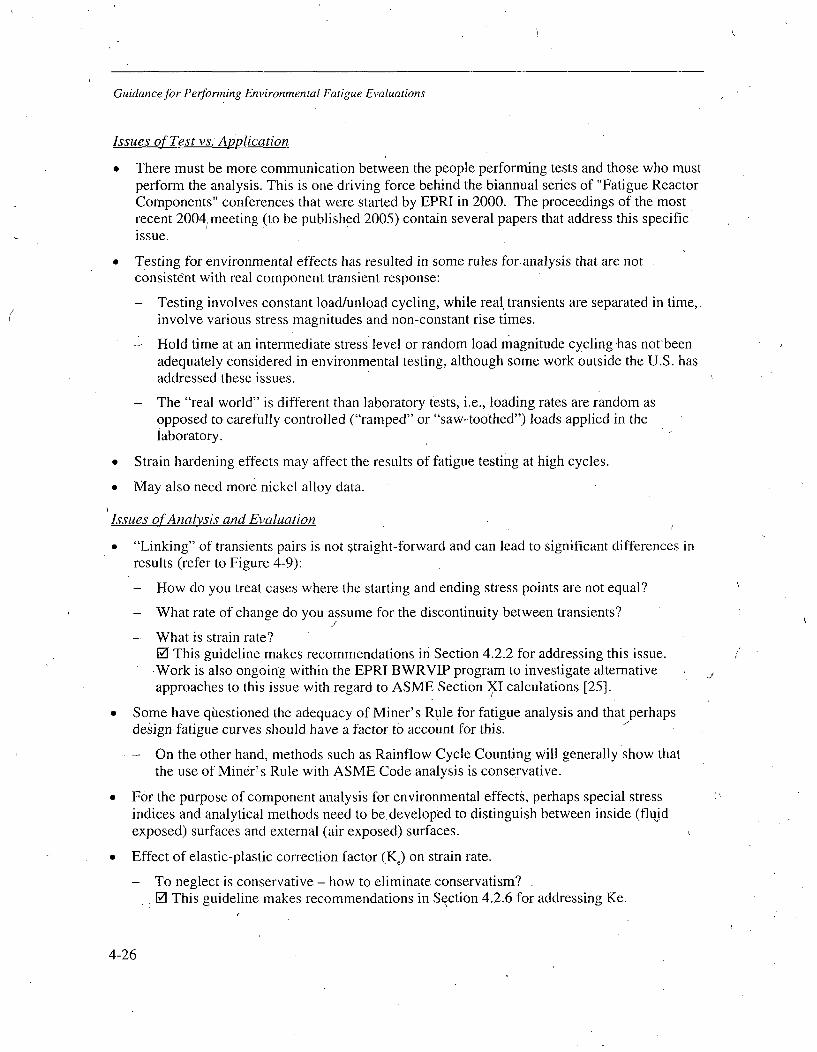
Guidance for Performing Environmental Fatigue Evaluations
Issues of Test vs. Application
* There must be more communication between the people performing tests and those who mustperform the analysis. This is one driving force behind the biannual series of "Fatigue ReactorComponents" conferences that were started by EPRI in 2000. The proceedings of the mostrecent 2004,meeting (to be published 2005) contain several papers that address this specificissue.
* Testing for environmental effects has resulted in some rules foranalysis that are notconsistent with real component transient response:
- Testing involves constant load/unload cycling, while real transients are separated in time,,involve various stress magnitudes and non-constant rise times.
- Hold time at an intermediate stress level or random load magnitude cycling has notbeenadequately considered in environmental testing, although some work outside the U.S. hasaddressed these issues.
- The "real world" is different than laboratory tests, i.e., loading rates are random asopposed to carefully controlled ("ramped" or "saw-toothed") loads applied in thelaboratory.
* Strain hardening effects may affect the results of fatigue testing at high cycles.
" May also need more nickel alloy data.
Issues of Analysis and Evaluation
" "Linking" of transients pairs is not 5traight-forward and can lead to significant differences inresults (refer to Figure 4-9):
- How do you treat cases where the starting and ending stress points are not equal?
- What rate of change do you assume for the discontinuity between transients?/
- What is strain rate?[D This guideline makes recommendations in' Section 4.2.2 for addressing this issue.Work is also ongoing within the EPRI BWRVIP program to investigate alternativeapproaches to this issue with regard to ASME Section XI calculations [25].
* Some have qiiestioned the adequacy of Miner's Rule for fatigue analysis and that perhapsdesign fatigue curves should have a factor to account for this.
- On the other hand, methods such as Rainflow Cycle Counting will generally show thatthe use of Miner's Rule with ASME Code analysis is conservative.
" For the purpose of component analysis for environmental effects, perhaps special stressindices and analytical methods need to be. developed to distinguish between inside (fluidexposed) surfaces and external (air exposed) surfaces.
* Effect of elastic-plastic correction factor (K.) on strain rate.
- To neglect is conservative - how to eliminate conservatism?0 This guideline makes recommendations in Section 4.2.6 for addressing Ke.
4-26
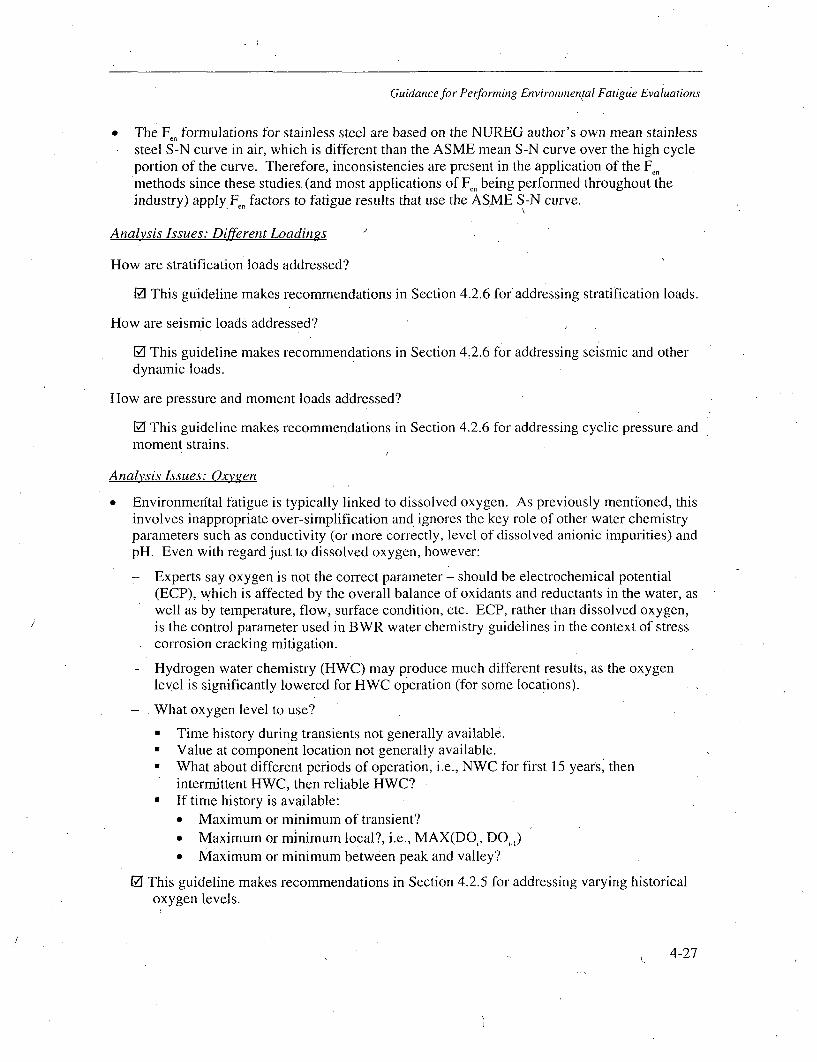
Guidance for Performing Environmental Fatigue Evaluations
0 The Fo, formulations for stainless steel are based on the NUREG author's own mean stainlesssteel S-N curve in air, which is different than the ASME mean S-N curve over the high cycleportion of the curve. Therefore, inconsistencies are present in the application of the F_,methods since these studies. (and most applications of F,, being performed throughout theindustry) apply F,, factors to fatigue results that use the ASME S-N curve.
Analysis Issues: Different Loadings
How are stratification loads addressed?
10 This guideline makes recommendations in Section 4.2.6 for addressing stratification loads.
How are seismic loads addressed?
10 This guideline makes recommendations in Section 4.2.6 for addressing seismic and otherdynamic loads.
How are pressure and moment loads addressed?
10 This guideline makes recommendations in Section 4.2.6 for addressing cyclic pressure andmoment strains.
Analysis Issues: Oxygen
* Environmerital fatigue is typically linked to dissolved oxygen. As previously mentioned, thisinvolves inappropriate over-simplification and. ignores the key role of other water chemistryparameters such as conductivity (or more correctly, level of dissolved anionic impurities) andpH. Even with regard just to dissolved oxygen, however:
- Experts say oxygen is not the correct parameter - should be electrochemical potential(ECP), which is affected by the overall balance of oxidants and reductants in the water, aswell as by temperature, flow, surface condition, etc. ECP, rather than dissolved oxygen,is the control parameter used in BWR water chemistry guidelines in the context of stresscorrosion cracking mitigation.
- Hydrogen water chemistry (HWC) may produce much different results, as the oxygenlevel is significantly lowered for HWC operation (for some locations).
What oxygen level to use?
* Time history during transients not generally available.* Value at component location not generally available.* What about different periods of operation, i.e., NWC for first 15 years, then
intermittent HWC, then reliable HWC?* If time historyis available-
* Maximum or minimum of transient?* Maximum or minimum local?, i.e., MAX(D01 , DO.)* Maximum or minimum between peak and valley?
R1 This guideline makes recommendations in Section 4.2.5 for addressing varying historicaloxygen levels.
4-27
Guidance for Performing Environmental Fatigue Evaluations
Analysis Issues. Temperature
Temperature:
- What temperature to use?
* Metal? (not generally available)* Fluid?* Maximum of transient?* Maximum local?, i.e., MAX(Ti, Ti_,)* Maximum between peak and valley?
I] This guideline makes recommendations in Section 4.2.4 for addressing temperature.
Analysis Issues: Defining Design Loads
* The strain range (and therefore the CUF) decreases as an imposed temperature change isapplied over a longer time period. The longer time period results in a slower strain rate and,all other things being equal, the slower strain rate produces a larger Fe.. Therefore, achallenge presents itself with respect to defining a set of transients (and their associatedtemperature ramp rates) that are bounding for design purposes: Component-specificpreliminary studies have shown that the Fen-adjusted CUF for a variation of temperature ramprates reaches a maximum when the temperature variation is on the order of 1,000°F/hour orhigher [26]. Further investigations are expected to show that it will be possible to definedesign transients in a manner that will determine the maximum Fo -adjusted CUF as thetemperature ramp rate (and thus the strain rate) is varied in a narrow range fromapproximately 1,000°F/hour (or other component-specific rates) to infinite rates. Theseefforts mirror similar work on crack growth in reactor components through corrosion fatigue[25], and it is expected that such efforts will demonstrate that the issue of defining a transientwith a range of ramp rates, extracting the strain rates, performing the design, and monitoringfor compliance are all very manageable when utilizing the F_ approach for design.
As noted, several of the issues identified above were addressed earlier in this report. Thoserecommendations are intended to serve as a guide for performing environmental fatigueevaluations. The remaining issues that are not addressed in this report are beyond the scope ofthe work associated with this report at the current point in time, and some are impossible toresolve with information currently available. An example would be the issue of usingECP/conductivity as a more appropriate parameter for assessing environmental effects. Allcurrent F,, methodologies are based on measured dissolved oxygen, as that was the only waterchemistry parameter recorded during laboratory testing. The remaining non-addressed issuesrepresent the limitations on the current state of the art. As further industry work is completed toaddress some of the remaining issues summarized above, refinements or additions to these*guidelines may be made to further define and enhance plant specific evaluations. Therefore,these guidelines can be thought of as an "instruction manual" for performing plant specificenvironmental fatigue evaluations based on the current state of technology and informationavailable. Resolution of the remaining non-addressed issues is not-needed in order for licenserenewal applicants to satisfy the current regulatory requirements of addressing reactor waterenvironmental effects.
4-28
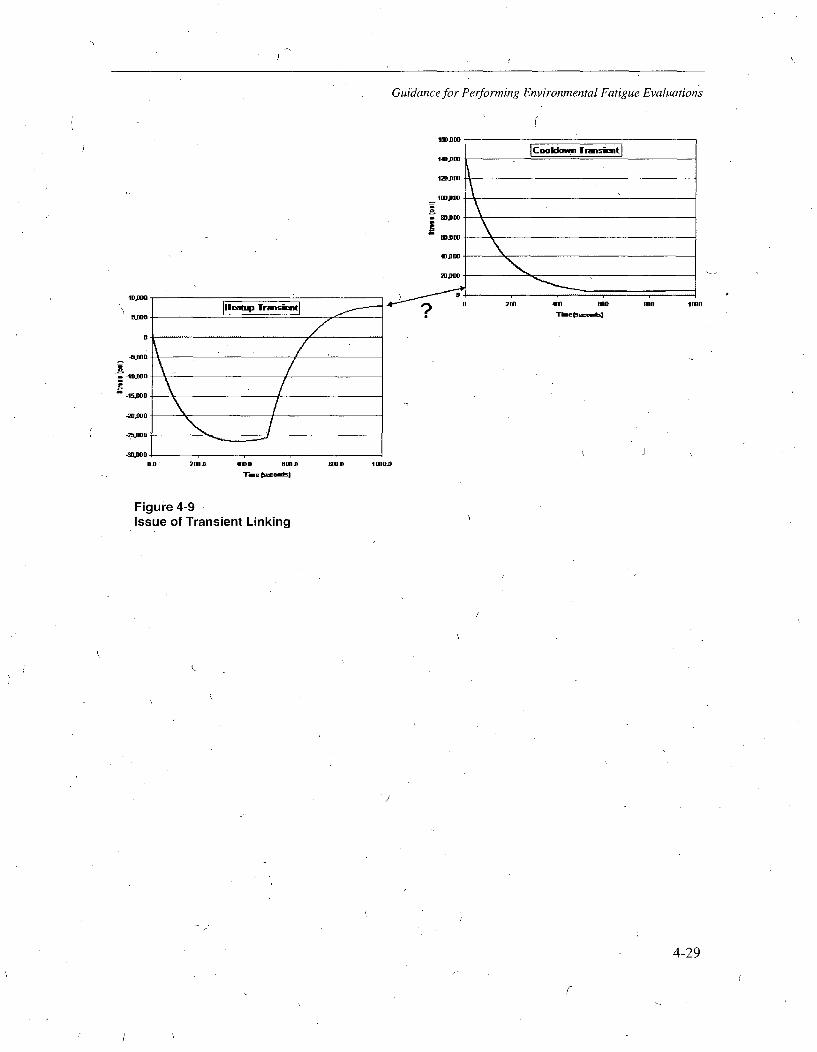
Guidance for Performing Environmental Fatigue Evaluations
5.000
M.D 2DOD M1OD. aD
Ti.. ae .. hd
Figur'e 4-9,Issue of Transient Linking
4D WDDToMe C.-O.d)
.D =llD
4-29
5CONCLUSIONS
This report has provided guidance that may be used by individual license renewal applicants toaddress the environmental effects on fatigue in a license renewal application. The approachesdocumented in this report are geared to allow individual utilities to determine the optimumapproach for their plants, allowing different approaches to be taken for different locations.
The overall approach taken for license renewal is to select a sampling of locations that might beaffected by reactor water environmental effects. NUREG/CR-6260 locations are considered an,appropriate sample for Fen evaluation as long as none exceed the acceptance criteria withenvironmental effects considered. If this occurs, the sampling is to be extended to other locations.An assessment of the chosen locations is undertaken: (1) to show that there is sufficientconservatism in the design basis transients to cover environmental effects, or (2) or to derive anexpected fatigue usage factor including environmental effects. Then, either through tracking ofreactor transient cycles or accumulated fatigue usage, utilities can determine if further steps mustbe taken to adequately manage fatigue environmental effects in the extended operating period.
Different methods are outlined for managing fatigue in the extended license renewal periodshould fatigue limits be exceeded. These include component re-analysis, fatigue monitoring,partial cycle counting, etc. Flaw tolerance evaluation as outlined in ASME Code, Section XI,Nonmandatory Appendix L, coupled with component inspection verifying the absence of flaws,is also included, although further work is underway by the Code to satisfy past regulatoryconcerns. Component repair/replacement is also a possibility, but this option is typicallyreserved to instances where other more economical approaches"cannot show acceptable results.
Consistent with current'ASME Code, Section XI philosophy for conducting additionalexaminations when flaws are found in service, the recommendations in this guideline includeexpansion of the number of locations tracked if fatigue limits are exceeded in the extendedoperating period. In addition, utilities will/continue to monitor operating plant fatigueexperience, especially with respect to cracking that might indicate a strong contribution fromfatigue environmental effects.
Guidance for performing plant specific environmental fatigue evaluations for selected locationsis provided. The intent is to unify the process used by applicants to address environmentaleffects in the License Renewal Application, and provide specific guidance on the use of currentlyaccepted environmental fatigue evaluation methodologies. The guidance provided by this reportis considered to be "Good Practice".
Using the guidance. provided in this report, the amount of effort needed to justify individuallicense renewal submittals and respond to NRC questions should be minimized,.and a moreunified, consistent approach throughout the industry should be achieved.
5-1
REFERENCES
1. NUREG/CR-5999 (ANL-93/3), "Interim Fatigue Design Curves for Carbon, Low-Alloy, and-• Austenitic Stainless Steels in LWR Environments," April 1993.,2. NUREG/CR-6260 (INEL-95/0045), "Application of NUREG/CR-5999 Interim Fatigue
Curves to Selected Nuclear Power Plant Components,":March 1995.
3. NUREG/CR-6583 (ANL-97/18), "Effects of LWR Coolant Environments on Fatigue DesignCurves of Carbon and Low-Alloy Steels," March 1998.
4. NUREG/CR-5704 (ANL-98/3 1), "Effects of LWR Coolant Environments on Fatigue DesignCurves of Austenitic Stainless Steels," April 1999.
5. NUREG/CR-6674 (PNNL-13227), "Fatigue Analysis of Components for 60-Year PlantLife," June 2000.
6. U. S. Nuclear Regulatory Commission, Generic Safety Issue 190, "Fatigue Evaluation ofMetal Components for 60-Year Plant Life."
7. Memorandum, Ashok C. Thadani, Director, Office of Nuclear Regulatory Research, toWilliam D. Travers, Executive Director for Operations, Closeout of Generic Safety Issue190, "Fatigue Evaluation of Metal Components for 60 Year Plant Life," U. S. NuclearRegulatory Commission, Washington, DC, December 26, 1999.
.8. _ "An Environmental Factor Approach to Account for ReactorWater Effects in Light WaterReactor Pressure Vessel and Piping FatigueEvaluations," TR-105759, EPRI, Palo Alto, CA,December 1995.
9. "Evaluation of Thermal Fatigue Effects on Systems Requiring Aging Management Reviewfor License Renewal for the Calvert Cliffs Nuclear Power Plant," TR-107515, EPRI, PaloAlto, CA, January 1998.
10. "Evaluation of Environmental Fatigue Effects for a Westinghouse Nuclear Power Plant," TR-110043, EPRI, Palo Alto, CA, April 1998.
11. "Evaluation of Environmental Thermal Fatigue Effects on Selected Components in a BoilingWater Reactor Plant," TR-110356, EPRI, Palo Alto, CA, April 1998.
12. "Environmental Fatigue Evaluations of Representative BWR Components," TR-107943,EPRI, Palo Alto, CA, May 1998.
13. Letter from Chris Grimes (NRC) to Doug Walters (NEI), "Request for AdditionalInformation on the Industries Evaluation of Fatigue Effects for License Renewal,"August 6, 1999.
14. Kalinousky, D., and Muscara, J., "Fatigue of Reactor Components: NRC Activities,"Presented at EPRI International Fatigue Conference, Napa, California,, August 2000.
6-1
References
15. Letter from Greg Hollinger (PVR) to J. H. Ferguson, Chairman Board of Nuclear Codes andStandards, October 31, 1999.
16. Mehta, H. S., "An Update on the Consideration of Reactor Water Effects in Code FatigueInitiation Evaluations for Pressure Vessels and Piping,"/PVP-Volume 410-2, pp. 45-5 1,American Society of Mechanical Engineers, 2000.
17. "Fatigue Comparison of Piping Designed to ANSI B31.1 and ASME Section IIl, Class IRules," TR-102901, EPRI, Palo Alto, CA, December 1993.
18. Welding Research Council, Inc. Bulletin 487, "PVRC's Position on Environmental Effectson Fatigue Life in LWR Applications," W. Alan Van Der Sluys, December 2003.
19. "Materials Reliability Program (MRP): Evaluation of Fatigue Data Including Reactor WaterEnvironmental Effects (MRP-49)," TR-1003079, EPRI, Palo Alto CA, December 2001.
20. Letter from Alexander Marion (NEI) to P. T. Kuo (NRC), "Revision 1 to Interim StaffGuidance (ISG)- I1: Environmental Assisted Fatigue for Carbon/Low Alloy Steel," October3, 2003.
21. Letter from Pao-Tsin Kuo (NRC-NRR) to Fred A. Emerson (NEI), "Evaluation of ProposedInterim Staff Guidance (ISG)- 11: Recommendations for Fatigue Environmental' Effects in aLicense Renewal Application," January 21, 2004.
22. "Guidelines for Environmental Fatigue Evaluation for LWR Component," Thermal andNuclear Power Engineering Society (TENPES), June 2002 (Translated into English inNovember 2002).
23. "Materials Reliability Program (MRP): Thermal Fatigue Licensing Basis MonitoringGuideline (MRP-149)," TR-1012018, EPRI, Palo Alto CA, September 2005.
24. "Materials Reliability Program (MRP): Integrated Fatigue Management Guideline (MRP-148),"TR-101 1957, EPRI, Palo Alto CA, September 2005.
25. S. Ranganath and J. Hickling, "Development of a Possible Bounding Corrosion FatigueCrack Growth Relationship for Low Alloy Steel Pressure Vessel Materials in BWREnvironments," 3rd International EPRI Conference on Fatigue of Reactor Components,Seville, Spain, October 2004.
26. Assessment of Environmental Fatigue (F o) Approaches, PVP2005-71636, G.L. Stevens,J.J. Carey, J.M. Davis, A.F. Deardorff, Proceedings of PVP2005: 2005 ASME PressureVessels and Piping Division Conference, July 17-21, 2005, Denver, Colorado USA (inpreparation).
6-2 )
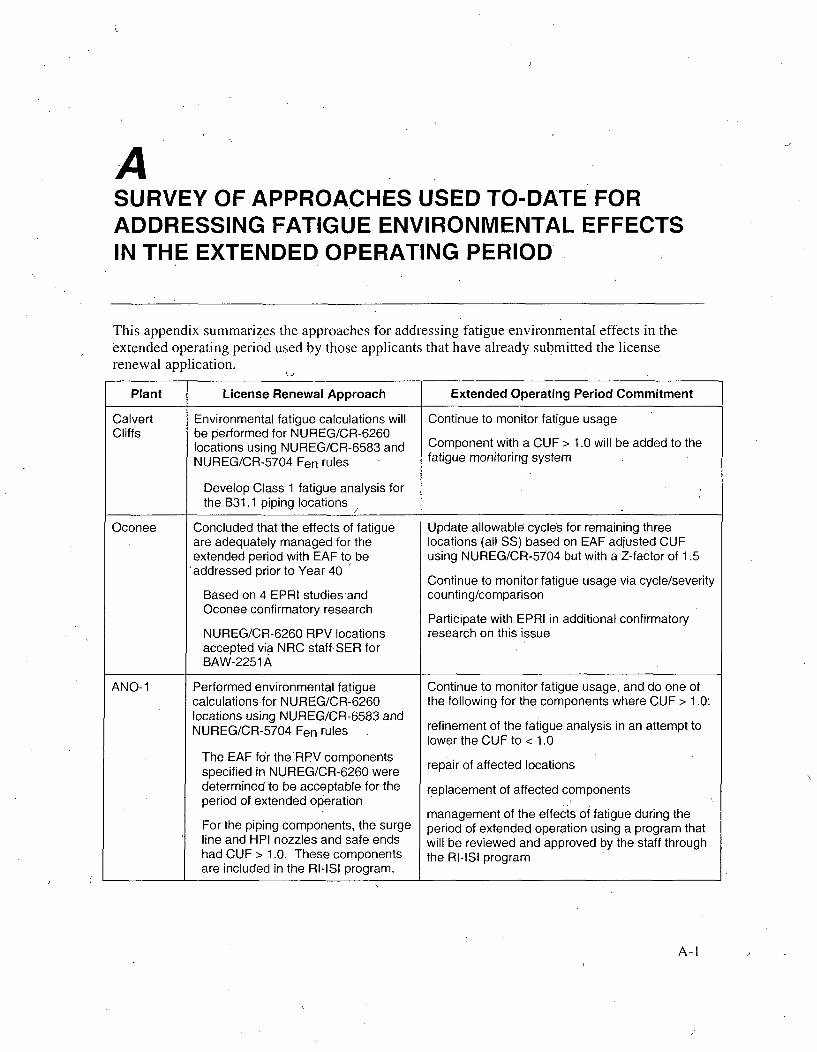
ASURVEY OF APPROACHES USED TO-DATE FORADDRESSING FATIGUE ENVIRONMENTAL EFFECTSIN THE EXTENDED OPERATING PERIOD
This appendix summarizes the approaches for addressing fatigue environmental effects in theextended operating period used by those applicants that have already submitted the licenserenewal application.
k_1
Plant License Renewal Approach Extended Operating Period Commitment
Calvert Environmental fatigue calculations will Continue to monitor fatigue usageCliffs be performed for NUREG/CR-6260
locations using NUREG/CR-6583 and Component with a CUF > 1.0 will be added to the
NUREG/CR-5704 Fen rules - fatigue monitoring system
Develop Class 1 fatigue analysis forthe B31.1 piping locations
/
Oconee Concluded that the effects of fatigue Update allowable cycles for remaining threeare adequately managed for the locations (all SS) based on EAF adjusted CUFextended period with EAF to be using NUREG/CR-5704 but with a Z-factor of 1.5addressed prior to Year 40
Continue to monitor fatigue usage via cycle/severityBased on 4 EPRI studiesand counting/comparisonOconee confirmatory research Participate with EPRI in additional confirmatoryNUREG/CR-6260 RPV locations research on this issueaccepted via NRC staffSER forBAW-2251 A
ANO-1 Performed environmental fatigue Continue to monitor fatigue usage, and do one ofcalculations for NUREG/CR-6260 the following for the components where CUF > 1.0:locations using NUREG/CR-6583 andNUREG/CR-5704 Fen rules d refinement of the fatigue analysis in an attempt tolower the CUF to < 1.0
The EAF for the'RPV components rspecified in NUREG/CR-6260 were repair of affected locations
determined to be acceptable for the replacement of affected componentsperiod of extended operation I_
management of the effects of fatigue during theFor the piping components, the surge period of extended operation using a program thatline and HPI nozzles and safe ends will be reviewed and approved by the staff throughhad CUF > 1.0. These components the RI-ISI programare included in the RI-ISI program.
A-I

Survey of Approaches Used to-Date for Addressing Fatigue Environmental Effects in the Extended OperatingPeriod L
Plant License Renewal Approach Extended Operating Period Commitment
Hatch Performed environmental fatigue Continue to monitor fatigue usage, perform acalculations for NUREG/CR-6260 refined analysis for feedwater piping andlocations using NUREG/CR-6583 and recirculation nozzles before Year 40NUREG/CR-5704 Een rules
Assumed HWC conditions
Used 60-year projections of actualcycles and actual fatigue usage to-date (higher than 40-year designbasis in some cases)
Environmental CUF < 1.0 for 60years at all locations except reactorrecirculation nozzles and feedwaterpiping
Turkey Performed environmental fatigue Continue to monitor fatigue usage, agingPoint calculations for NUREG/CR-6260 management for surge line
locations using NUREG/CR-6583 andNUREG/CR-5704 Fen rules
Revised NUREG/CR-6260calculations to incorporate poweruprate and NUREG/CR-6583 and -
5704 methods
Used 60-year projections of actual2cycles (same as design basis)
Environmental CUF < 1.0 for 60years at all locations except surgeline hot leg nozzle
North Performed environmental fatigue Continue to monitor fatigue usage, agingAnna/Surry calculations for NUREG/CR-6260 management for surge line
locations using NUREG/CR-6583 andNUREG/CR-5704 Fen rules
Scaled plant-specific results basedon results in NUREG/CR-6260
Used 60-year projections of actualcycles (same as design basis)
Environmental CUF < 1.0 for 60years at all locations except surgeline elbow
Peach Did not perform environmental fatigue Continue to monitor fatigue usage, performBottom' calculations for NUREG/CR-6260 environmental fatigue calculation before Year 40
locations
Committed to do so before Year 40
A-2

/Survey of Approaches Used to-Date for Addressing Fatigue Environmental Effects in the Extended OperatingPeriod
Plant License Renewal Approach Extended Operating Period Commitment4 +
St. Lucie Performed environmental fatiguecalculations for NUREG/CR-6260locations using NUREG/CR-6583 andNUREG/CR-5704 Fen rules
Refined several Class 1 fatigueanalyses to offset Fen impact
Used 60-year projections of actualcycles (same as design basis)
Environmental CUF < 1.0 for 60years at all locations except surgeline elbow
Continue to monitor fatigue usage, agingmanagement for surge line
Ii i
Ft. Calhoun Performed environmental fatiguecalculations for NUREG/CR-6260locations using NUREG/CR-6583 andNUREG/CR-5704 Fen rules
Revised NUREG/CR-6260calculations to incorporateNUREG/CR-6583 and -5704methods
Used 60-year projections of actualcycles (same as design basis)
Refined surge line Class 1 fatigueanalysis to offset Fen impact
-Note from OPPD: The refinedsurge line analysis has alreadybeen completed because ofpressurizer replacement and poweruprate activities, so the surge linehad to be reanalyzed for otherreasons and wasn't done forLicense Renewal alone.Otherwise, it probably would still bea pending action.
Environmental CUF < 1.0 for 60years at all locations
Continue to monitor fatigue usage
A-3
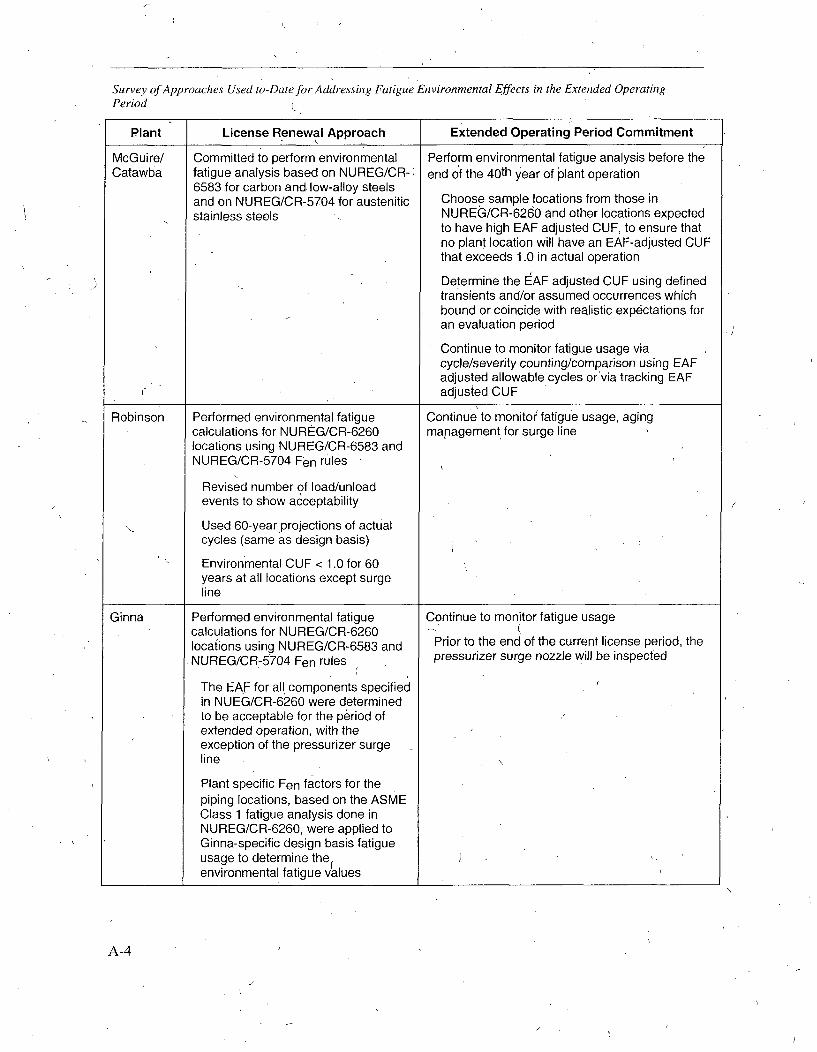
Survey of Approaches Used to-Date for Addressing Fatigue Environmental Effects in the Extended OperatingPeriod
Plant License Renewal Approach Extended Operating Period Commitment
McGuire/ Committed to perform environmental Perform environmental fatigue analysis before theCatawba fatigue analysis based on NUREG/CR-) end of the 40th year of plant operation
6583 .for carbon and low-alloy steelsand on NUREG/CR-5704 for austenitic Choose sample locations from those in
stainless steels NUREG/CR-6260 and other locations expectedto have high EAF adjusted CUF, to ensure thatno plant location will have an EAF-adjusted CUFthat exceeds 1.0 in actual operation
Determine the EAF adjusted CUF using definedtransients and/or assumed occurrences whichbound or coincide with realistic expectations foran evaluation period
Continue to monitor fatigue usage viacycle/severity counting/comparison using EAFadjusted allowable cycles or'via tracking EAF
C. adjusted CUF
Robinson Performed environmental fatigue Continue to monitor fatigue usage, agingcalculations for NUREG/CR-6260 management for surge linelocations using NUREG/CR-6583 andNUREG/CR-5704 Fen rules
Revised number of load/unloadevents to show acceptability
Used 60-year projections of actualcycles (same as design basis)
Environmental CUF < 1.0 for 60years at all locations except surgeline
Ginna Performed environmental fatigue Continue to monitor fatigue usagecalculations for NUREG/CR-6260locations using NUREG/CR-6583 and Prior to the end of the current license period, the
NUREG/CR-5704 Fen rules pressurizer surge nozzle will be inspected
The EAF for all components specifiedin NUEG/CR-6260 were determinedto be acceptable for the period ofextended operation, with theexception of the pressurizer surgeline
Plant specific Fen factors for thepiping locations, based on the ASMEClass 1 fatigue analysis done inNUREG/CR-6260, were applied toGinna-specific design basis fatigueusage to determine therenvironmental fatigue values
A-4
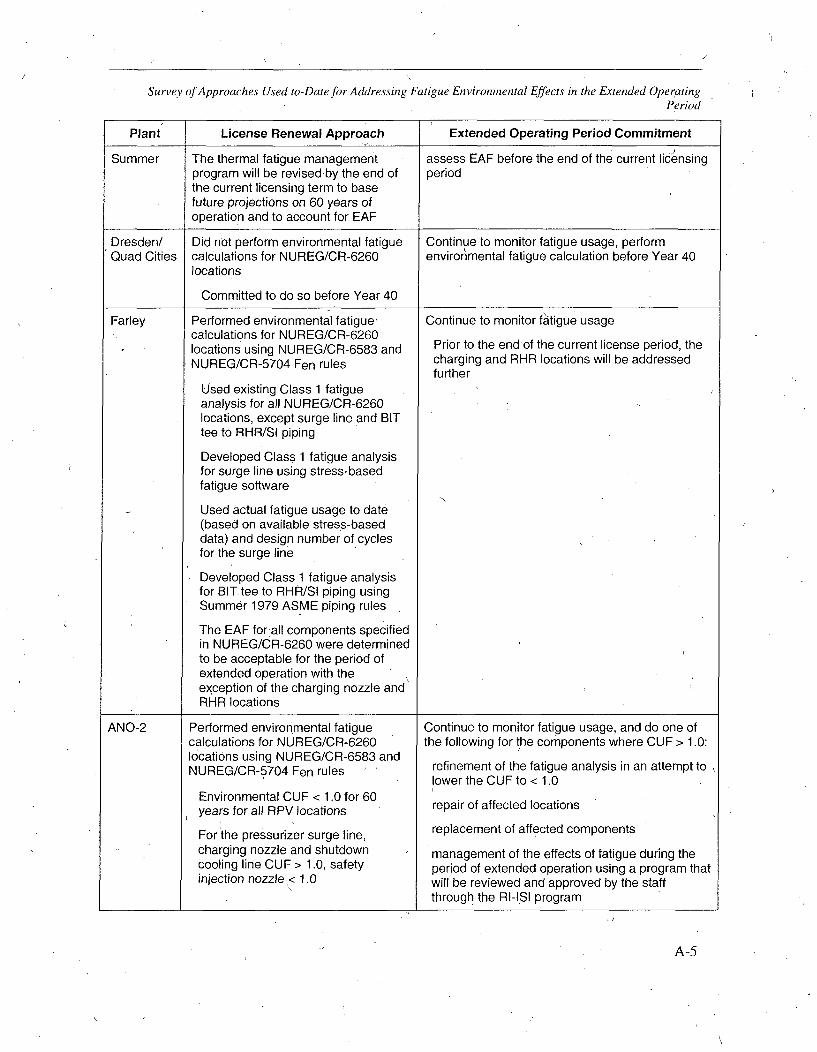
Survey of Approaches Used to-Date for Addressing Fatigue Environmental Effects in the Extended OperatingPeriod
Plant License Renewal Approach Extended Operating Period Commitment
Summer The thermal fatigue management assess EAF before the end of the current licensingprogram will be revised by the end of periodthe current licensing term to basefuture projections on 60 years ofoperation and to account for EAF
Dresden/ Did not perform environmental fatigue Continue to monitor fatigue usage, performQuad Cities calculations for NUREG/CR-6260 envirornmental fatigue calculation before Year 40
locations
Committed to do so before Year 40
Farley Performed environmental fatigue, Continue to monitor fatigue usagecalculations for NUREG/CR-6260locations using NUREG/CR-6583 and Prior to the end of the current license period, the
NUREG/CR-5704 Fen rules charging and RHR locations will be addressedfurther
Used existing Class 1 fatigueanalysis for all NUREG/CR-6260locations, except surge line and BITtee to RHR/SI piping
Developed Class 1 fatigue analysisfor surge line using stress-basedfatigue software
Used actual fatigue usage to date(based on available stress-baseddata) and design number of cyclesfor the surge line
Developed Class 1 fatigue analysisfor BIT tee to RHR/SI piping usingSummer 1979 ASME piping rules
The EAF for all components specifiedin NUREG/CR-6260 were determinedto be acceptable for the period ofextended operation with theexception of the charging nozzle andRHR locations
ANO-2 Performed environmental fatigue Continue to monitor fatigue usage, and do one ofcalculations for NUREG/CR-6260 the following for the components where CUF > 1.0:locations using NUREG/CR-6583 andNUREG/CR-5704 Fen rules refinement of the fatigue analysis in an attempt to
lower the CUF to < 1.0Environmental CUF < 1.0 for 60years for all RPV locations repair of affected locations
For the pressurizer surge line, replacement of affIcted componentscharging nozzle and shutdown management of the effects of fatigue during thecooling line CUF > 1.0, safety period of extended operation using a program thatinjection nozzle< 1.0 will be reviewed and approved by the staff
through the RI-ISI program
A-5
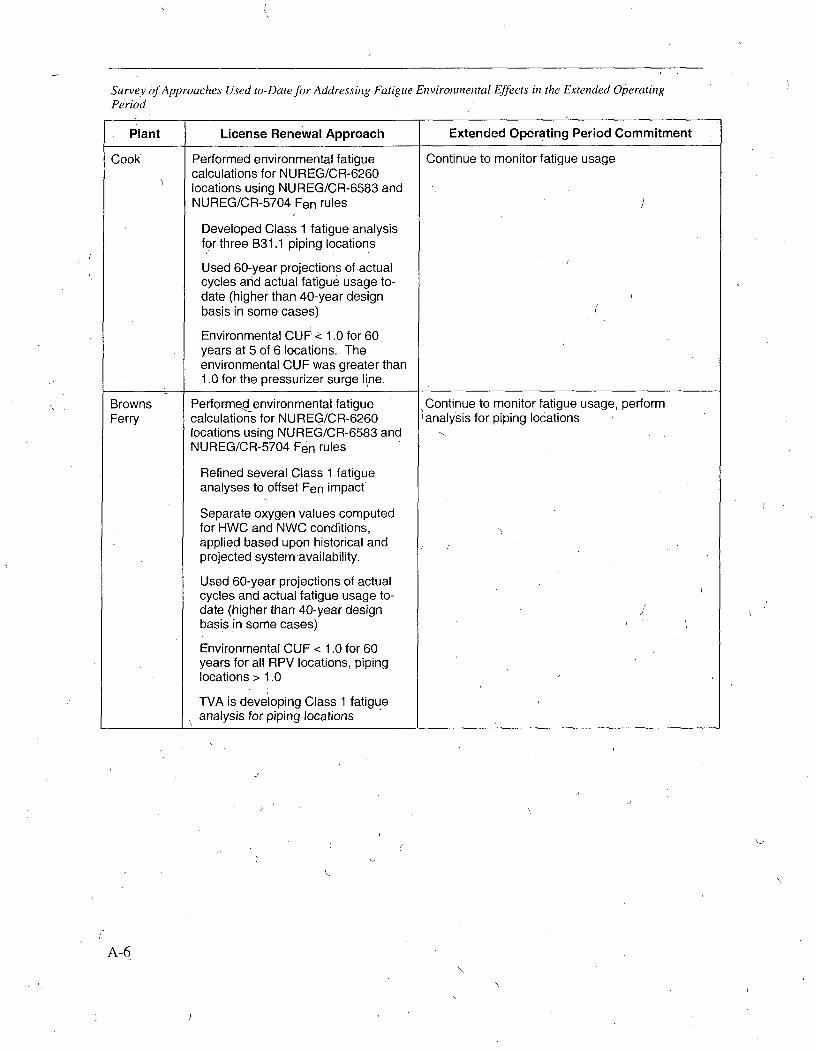
Survey of Approaches Used to-Date for Addressing Fatigue Environmental Effects in the Extended OperatingPeriod
Plant License Renewal Approach Extended Operating Period Commitment
Cook Performed environmental fatigue Continue to monitor fatigue usagecalculations for NUREG/CR-6260locations using NUREG/CR-6583 andNUREG/CR-5704 Fen rules
Developed Class 1 fatigue analysisfor three B31.1 piping locations
Used 60-year projections of actualcycles and actual fatigue usage to-date (higher than 40-year designbasis in some cases)
Environmental CUF < 1.0 for 60years at 5 of 6 locations. Theenvironmental CUF was greater than1.0 for the pressurizer surge line.
Browns Performed environmental fatigue Continue to monitor fatigue usage, performFerry calculations for NUREG/CR-6260 /analysis for piping locations
locations using NUREG/CR-6583 andNUREG/CR-5704 Fen rules
Refined several Class 1 fatigueanalyses to offset Fen impact
Separate oxygen values computedfor HWC and NWC conditions,applied based upon historical andprojected system availability.
Used 60-year projections of actualcycles and actual fatigue usage to-date (higher than 40-year designbasis in some cases)
Environmental CUF < 1.0 for 60years for all RPV locations, pipinglocations > 1.0
TVA is developing Class 1 fatigueanalysis for piping locations
A-6
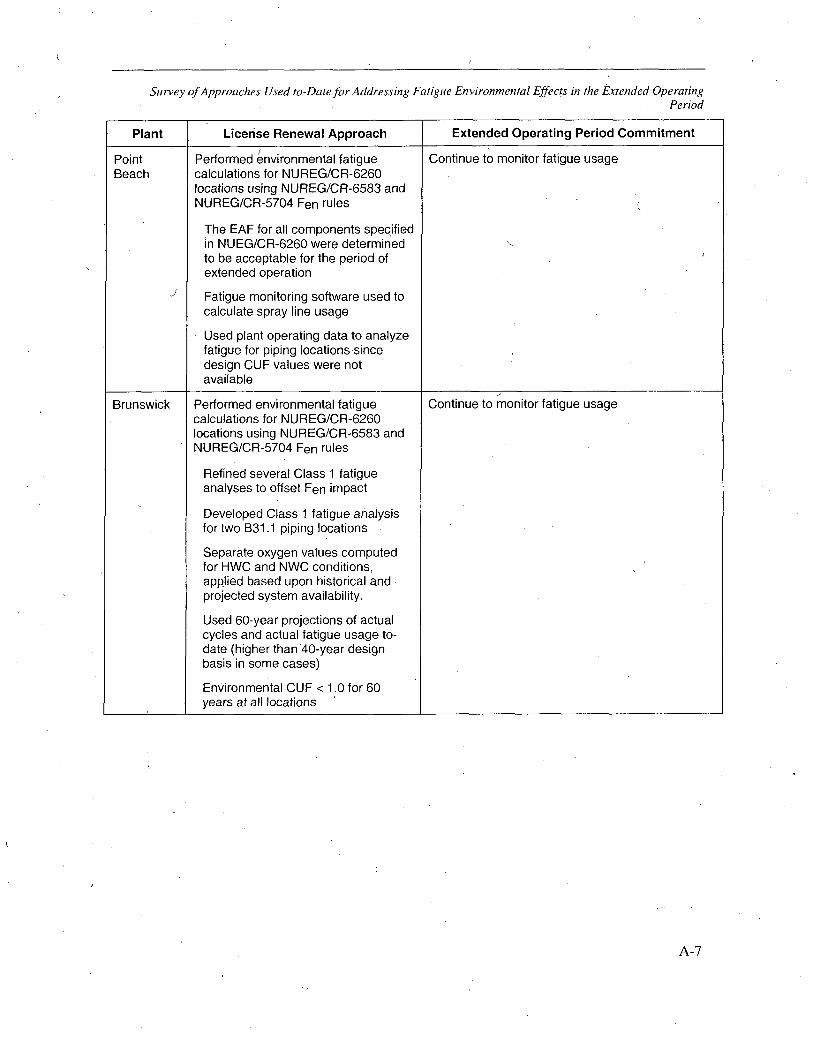
Survey of Approaches Used to-Date for Addressing Fatigue Environmental Effects in the Extended OperatingPeriod
Plant License Renewal Approach Extended Operating Period Commitment
Point Performed environmental fatigue Continue to monitor fatigue usageBeach calculations for NUREG/CR-6260
locations using NUREG/CR-6583 andNUREG/CR-5704 Fen rules
The EAF for all components specifiedin NUEG/CR-6260 were determinedto be acceptable for the period ofextended operation
-J Fatigue monitoring software used tocalculate spray line usage
Used plant operating data to analyzefatigue for piping locations sincedesign CUF values were notavailable
Brunswick Performed environmental fatigue Continue to monitor fatigue usagecalculations for NUREG/CR-6260locations using NUREG/CR-6583 andNUREG/CR-5704 Fen rules
Refined several Class 1 fatigueanalyses to offset Fen impact
Developed Class 1 fatigue analysisfor two B31.1 piping locations
Separate oxygen values computedfor HWC and NWC conditions,applied based upon historical andprojected system availability.
Used 60-year projections of actualcycles and actual fatigue usage to-date (higher than 40-year designbasis in some cases)
Environmental CUF < 1.0 for 60years at all locations
A-7
Export Control Restrictions
Access to and use of EPRI Intellectual Property is granted with
the specific understanding and requirement that responsibility
for ensuring full compliance with all applicable U.S. and
foreign export laws and regulations is being undertaken by
you and your company. This includes an obligation to ensure
that any individual receiving access hereunder who is not.a
U.S. citizen or permanent U.S. resident is permitted access
under applicable U.S. and foreign export laws and
,regulations. In the event you are uncertain whether you or
your company may lawf6lly obtain access to this EPRI
Intellectual Property, you acknowledge that it is your
obligation to consult with your company's legal counsel to
determine whether this access is lawful. Although EPRI may,
make available on a case-by-case basis an informal
assessment of the applicable U.S. export classification for
specific EPRI Intellectual Property, you and your company
acknowledge that this assessment is solely for informational
purposes and not for reliance purposes. You and •your
company acknowledge that it is still the obligation of you and
your company to make your own assessment of the applicable
U.S. export classification and ensure compliance accordingly.
You and your company understand and acknowledge your
obligations to make a prompt report to EPRI and the
appropriate authorities regarding any access to or use of EPRI
Intellectual Property- hereunder that may be in violation of
applicable U.S. or foreign export laws or regulations.
© 2005 Electric Power Research Institute (EPRI), Inc. All rights reserved.
Electric Power Research Institute and EPRI are registered service marks of
the Electric Power Research Institute, Inc.
E Printed on recycled paper in the United States of America
The Electric Power Research Institute (EPRI)
The Electric Power Research Institute (EPRI), with major locations in
Palo Alto, California, and Charlotte, North Carolina, was established
in 1973 as an independent, nonprofit center for public interest
energy and environmental research. EPRI brings together members,
participants, the Institute's scientists and engineers, and other leading
experts to work collaboratively on solutions to the challenges of electric
power. These solutions span nearly every area of electricity generation,
delivery, and use, including health, safety, and environtment. EPRI's
members represent over 90% of the electricity generated in the
United States. International participation represents nearly 15% of
EPRI's total research, development, and demonstration program.
Together.. Shaping the Future of Electricity
i
Program:.
Nuclear Power
1012017
ELECTRIC POWER RESEARCH INSTITUTE
3420 Hillview Avenue, Palo Alto, California 94304-1395 - PO Box 10412, Palo Alto, California 94303-0813 USA800.313.3774 * 650.855.2121 * [email protected] * www.epri.com
f
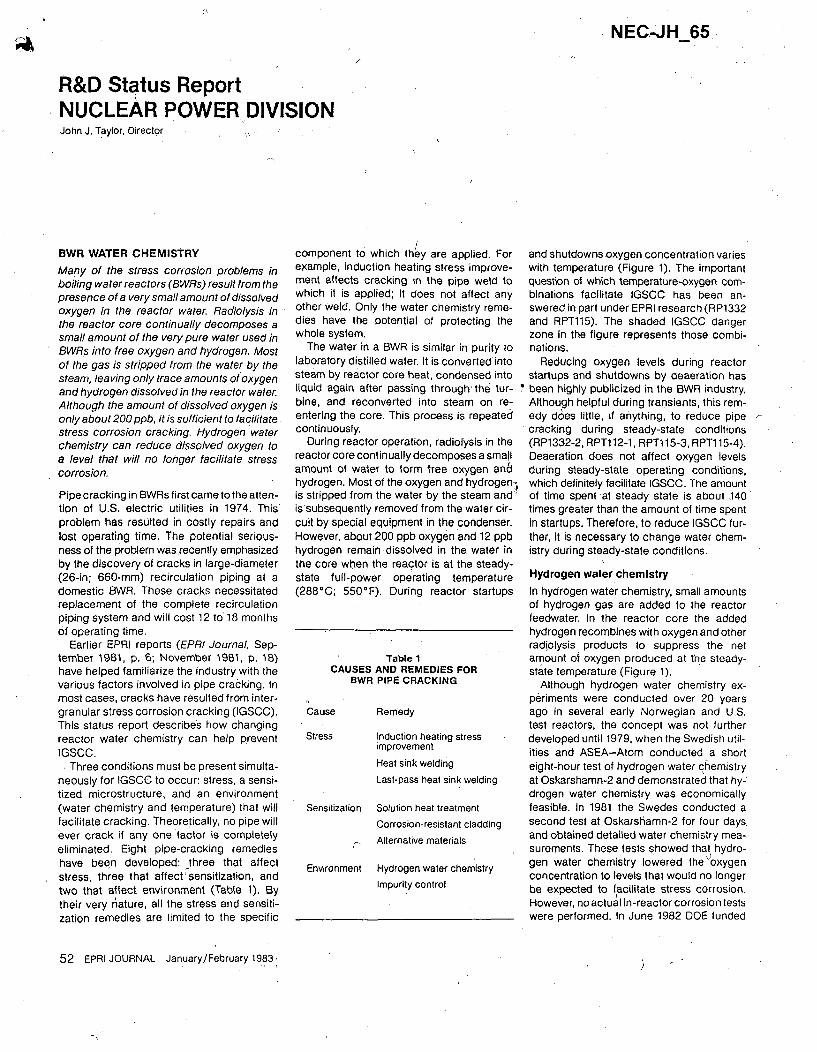
NEC-JH 65
R&D Status ReportNUCLEAR POWER-DIVISIONJohn J. Taylor, Director
BWR WATER CHEMISTRY
Many of the stress corrosion problems inboiling water reactors (BWRs) result from thepresence of a very small amount of dissolvedoxygen in the reactor water Radiolysis inthe reactor core continually decomposes asmall amount of the very pure water used inBWRs into free oxygen and hydrogen. Mostof the gas is stripped from the water by thesteam, leaving only trace amounts of oxygenand hydrogen dissolved in the reactor water.Although the amount of dissolved oxygen isonly about 200 ppb, it is sufficient to facilitatestress corrosion cracking. Hydrogen waterchemistry can reduce dissolved oxygen toa level that will no longer facilitate stresscorrosion.
Pipe cracking in BWRs first came to the atten-tion of U.S. electric utilities in 1974. Thisproblem has resulted in costly repairs andlost operating time. The potential serious-ness of the problem was recently emphasizedby the discovery of cracks in large-diameter(26-in; 660-mm) recirculation piping at adomestic BWR. These cracks necessitatedreplacement of the complete recirculationpiping system and will cost 12 to 18 monthsof operating time.
Earlier EPRI reports (EPRI Journal, Sep-tember 1981, p. 6; November 1981, p. 18)have helped familiarize the industry with thevarious factors involved in pipe cracking. Inmost cases, cracks have resulted from inter-granular stress corrosion cracking (IGSCC).This status report describes how changingreactor water chemistry can help preventIGSCC.. Three conditions must be present simulta-
neously for IGSGC to occur: stress, a sensi-tized microstructure, and an environment(water chemistry and temperature) that willfacilitate cracking. Theoretically, no pipe willever crack if any one factor is completelyeliminated. Eight pipe-cracking remedieshave been developed: three that affectstress, three that affect sensitization, andtwo that affect environment (Table 1). Bytheir very rAature, all the stress and sensiti-zation remedies are limited to the specific
52 EPRI JOURNAL January/February 1983.
component to which they are applied. Forexample, induction heating stress improve-ment affects cracking in the pipe weld towhich it is applied: it does not affect anyother weld. Only the water chemistry reme-dies have the potential of protecting thewhole system.
The water in a BWR is similar in purity tolaboratory distilled water. It is converted intosteam by reactor core heat, condensed intoliquid again after passing through'the tur-bine, and reconverted into steam on re-entering the core. This process is repeatedcontinuously.
During reactor operation, radiolysis in thereactor core continually decomposes a smallamount of water to form free oxygen antlhydrogen. Most of the oxygen and hydrogen-is stripped from the water by the steam and'issubsequently removed from the water cir-cuit by special equipment in the condenser.However, about 200 ppb oxygen and 12 ppbhydrogen remain -dissolved in the water inthe core when the reactor is at the steady-state full-power operating temperature(288°C; 550°F). During reactor startups
and shutdowns oxygen concentration varieswith temperature (Figure 1). The importantquestion of which temperature-oxygen com-binations facilitate IGSCC has been an-swered in part under EPRI research (RP1332and RPT115). The shaded IGSCC dangerzone in the figure represents those combi-nations.
Reducing oxygen levels during reactorstartups and shutdowns by deaeration hasbeen highly publicized in the BWR industry.Although helpful during transients, this rem-edy does little, if anything, to reduce pipecracking during steady-state conditions(RP1332-2, RPT1 12-1, RPT1 15-3, RPT1 15-4).Deaeration does not affect oxygen levelsduring steady-state operating conditions,which definitely facilitate IGSCC. The amountof time spent at steady state is about .140times greater than the amount of time spentin startups. Therefore, to reduce IGSCC fur-ther, it is necessary to change water chem-istry during steady-state conditions.
I
Hydrogen water chemistry
In hydrogen water chemistry, small amountsof hydrogen gas are added to the reactorfeedwater. In the reactor core the addedhydrogen recombines with oxygen and otherradiolysis products to suppress the netamount of oxygen produced at the steady-state temperature (Figure 1).
Although hydrogen water chemistry ex-periments were conducted over 20 yearsago in several early Norwegian and U.S.test reactors, the concept was not furtherdeveloped until 1979, when the Swedish util-ities and ASEA-Atom conducted a shorteight-hour test of hydrogen water chemistryat Oskarshamn-2 and demonstrated that hy-drogen water chemistry was economicallyfeasible. In 1981 the Swedes conducted asecond test at Oskarshamn-2 for four days,and obtained detailed water chemistry mea-surements. These tests showed that hydro-gen water chemistry lowered the)oxygenconcentration to levels that would no longerbe expected to facilitate stress corrosion.However, no actual in-reactor corrosion testswere performed. In June 1982 DOE funded
Table 1CAUSES AND REMEDIES FOR
BWR PIPE CRACKING
Cause
Stress
Remedy
Induction heating stressimprovement
Heat sink welding
Last-pass heat sink welding
Sensitization Solution heat treatment
Corrosion-resistant cladding
Alternative materials
Environment Hydrogen water chemistry
Impurity control
i
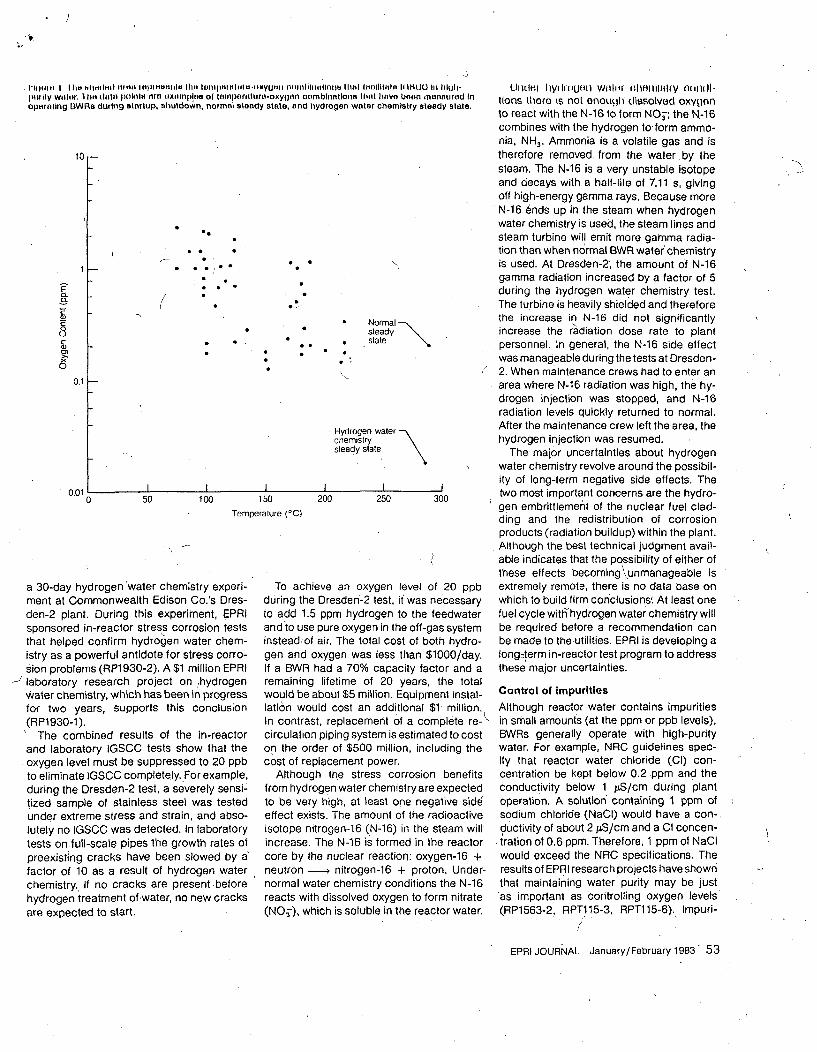
I I liki ,tilt'toil ~itimi Iotiit~i~te tihe III 18111dI#ItII11d-11MYU8bI jiniililiI it ity WiVaior. 'I ht it Inta polnla nore it nihrptno or tornpornturo-oxygon cooporoling l3WRs during startup, shutdow~n, normal seandy state, and h
10
I
0)
* *
I~tll(lInt Illail Itioilllfil IItM UO litMll hu - OLdM• h1yOll0UH11 Willlil (Ill If'iltlllly {fl(lillJ-mblnntlona Ihlt lirvo boon monaured tnios there Is not enoulh dissolved oxygniydrogen water chemistry steady stale.
to react with the N-16 to form NOT, the N-16combines with the hydrogen toform ammo-nia, NH3 . Ammonia is a volatile gas and istherefore removed, from the water by thesteam. The N-16 is a very unstable isotopeand decays with a half-life of 7.11 s, givingoff high-energy gamma rays. Because moreN-16 ends up in the steam when hydrogenwater chemistry is used, the steam lines andsteam turbine will emit more gamma radia-tion than when normal BWR water chemistry
". is used. At Dresden-2; the amount of N-16gamma radiation increased by a factor of 5during the hydrogen water chemistry test.The turbine is heavily shielded and therefore
* Normal the increase in N-16 did not significantlysteady increase the radiation dose rate to plant
* state personnel. In general, the N-16 side effect
,• • was manageable during the tests at Dresden-/ 2. When maintenance crews had to enter an
area where N-16 radiation was high, the hy-drogen injection was stopped, and N-16radiation levels quickly returned to normal.
Hydrogen water After the maintenance crew left the area, thechemistry hydrogen injection was resumed.steady state The major uncertainties about hydrogen
water chemistry revolve around the possibil-ity of long-term negative side effects. The
200 250 300 two most important concerns are the hydro-gen embrittlemernt of the nuclear fuel clad-ding and the redistribution of corrosionproducts (radiation buildup) within the plant.Although the best technical judgment avail-able indicates that the possibility of either ofthese effects becoming unmanageable is
eve an oxygen level of 20 ppb extremely remote, there is no data base onDresden-2 test, it was necessary which to build firm conclusions. At least oneppm hydrogen to the feedwater fuel cycle witlhydrogen water chemistry willpure oxygen in the off-gas system be required before a recommendation canair. The total cost of both hydro- be made to theutilities. EPRI is developing a
oxygen was less than $1000/day. long=term in-reactor test program to addresshad a 70% capacity factor and a these major uncertainties.
0.1 I-
0.0110 50 100 150
I Temperature ('C)
a 30-day hydrogen water chemistry experi-ment at Commonwealth Edison Co.'s Dres-den-2 plant. During this experiment, EPRIsponsored in-reactor stress corrosion teststhat helped confirm hydrogen water chem-istry as a powerful antidote for stress corro-sion problems (RP1930-2). A $1 million EPRI
- laboratory research project on ;hydrogenwater chemistry, which has been in progressfor two years, supports this conclusion(RP1930-1).' The combined results of the in-reactorand laboratory IGSCC tests show that theoxygen level must be suppressed to 20 ppbto eliminate IGSCC completely. For example,during the Dresden-2 test, a severely sensi-tized sample of stainless steel was testedunder extreme stress and strain, and abso-lutely no IGSCC was detected. In laboratorytests on full-scale pipes the growth rates ofpreexisting cracks have been slowed by a"factor of 10 as a result of hydrogen waterchemistry. If no cracks are present beforehydrogen treatment of water, no new cracksare expected to start.
To achiduring theto add 1.5and to useinstead ofgen and oIf a BWRremaining lifetime of 20 years, the totalwould be about $5 million. Equipment instal-lation would cost an additional $1 million.In contrast, replacement of a complete re-<
circulation piping system is estimated to coston the order of $500 million, including thecost of replacement power.
Although the stress corrosion benefitsfrom hydrogen water chemistryare expectedto be very high, at least one negative side6effect exists. The amount of the radioactiveisotope nitrogen-16 (N-16) in the steam willincrease. The N-16 is formed in the reactorcore by the nuclear reaction: oxygen-16 +neutron -- nitrogen-16 + proton. Under-normal water chemistry conditions the N-16reacts with dissolved oxygen to form nitrate(NOi-), which is soluble in the reactor water.
Control of Impurities
Although reactor water contains impuritiesin small amounts (at the ppm or ppb levels),BWRs generally operate with high-puritywater. For example, NRC guidelines spec-ify that reactor water chloride (CI) con-centration be kept below 0.2 ppm and theconductivity below 1 pS/cm during plantoperation. A solution containing 1 ppm ofsodium chloride (NaCI) would have a con-.ductivity of about 2 pS/cm and a Cl concen-tration of 0.6 ppm. Therefore, 1 ppm of NaCIwould exceed the NRC specifications. Theresults of EPRI research projects have shownthat maintaining water purity may be just'as important as controlling oxygen levels(RP1563-2, RPT115-3, RPT115-6). Impuri-
EPRI JOURNAL January/February 1983- 53
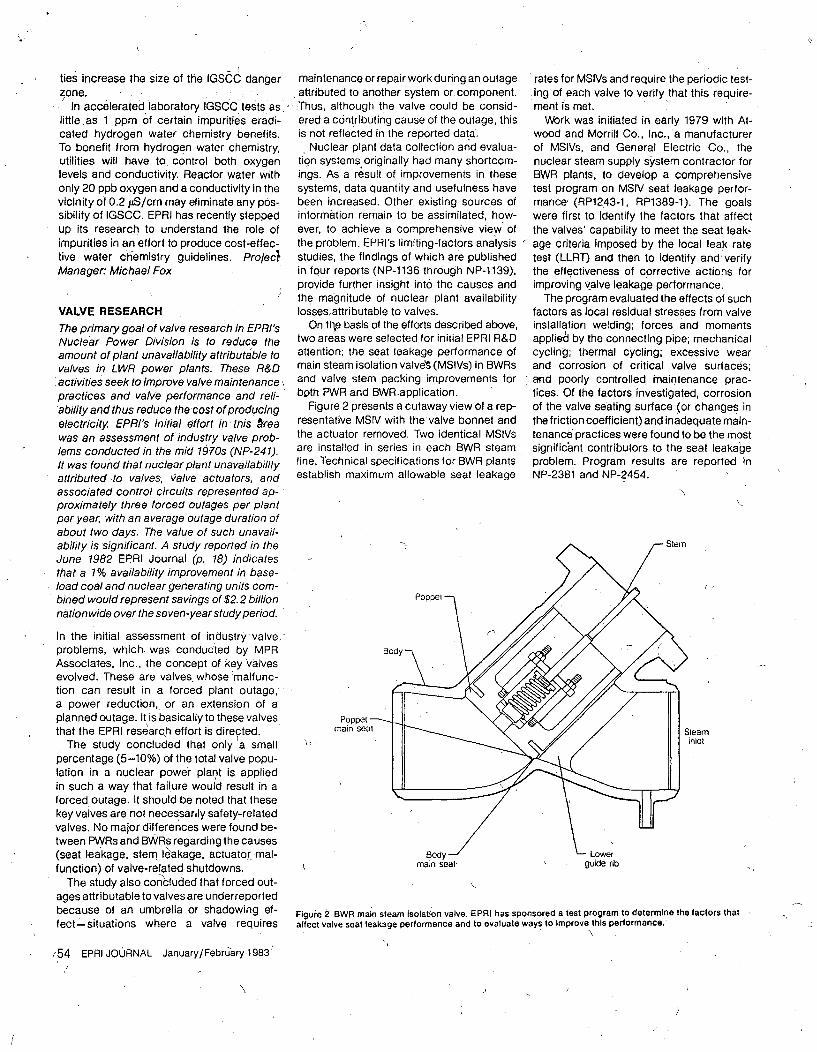
ties increase the size of the IGSCt dangerzone.
In accelerated laboratory IGSCC tests aslittle as 1 ppm of certain impurities eradi-cated hydrogen water chemistry benefits.To benefit from hydrogen water chemistry,utilities will have to control both oxygenlevels and conductivity. Reactor water withonly 20 ppb oxygen and a conductivity in thevicinity of 0.2 PS/cm may eliminate any pos-sibility of IGSCC. EPRI has recently steppedup its research to understand the role ofimpurities in an effort to produce cost-effec-tive water cthemistry guidelines. Projecl,Manager: Michael Fox
VALVE RESEARCHThe primary goal of valve research In EPRI'sNuclear Power Division is to reduce theamount of plant unavailability attributable tovalves in LWR power plants. These R&Dactivities seek to improve valve maintenancepractices and valve performance and reli-ability and thus reduce the cost of producingelectricity. EPRI's initial effort in this Areawas an assessment ofindustry valve prob-lems conducted in the mid 1970s (NP-241).It was found that nuclear plant unavailabilityattributed to valves, valve actuators, andassociated control circuits represented ap-proximately three forced outages per plantper year, with an average outage duration ofabout two days. The value of such unavail-ability is significant. A study reported in theJune 1982 EPRI Journal (p. 18) indicatesthat a 1% availability improvement in base-load coal and nuclear generating units com-bined would represent savings of $2.2 billionnationwide over the seven-year study period.
In the initial assessment of industry valve,,problems, which. was conducted by MPRAssociates, Inc., the concept of key valvesevolved. These are valves, whose :malfunc-tion can result in a forced plant outage,a power reduction, or an extension of aplanned outage. It is basically to these valvesthat the EPRI research effort is directed.
The study concluded that only 'a smallpercentage (5-10%) of the total valve popu-lation in a nuclear power plant is appliedin such a way that failure would result in aforcedoutage. It should be noted that thesekey valves are not necessarily safety-relatedvalves. No major differences were found be-tween PWRs and BWRs regarding the causes(seat leakage, stem Ilakage, actuator mal-function) of valve-related shutdowns.
The study also concluded that forced out-ages attributable to valves are underreportedbecause of an umbrella or shadowing ef-fect-situations where a valve requires
(54 EPRI JOURNAL January/Februiary 1983'
maintenance or repair work during an outageattributed to another system or component.Thus, although the valve could be consid-ered a contributing cause of the outage, thisis not reflected in the reported data.
Nuclear plant data collection and evalua-tion systems originally had many shortcom-ings. As a result of improvements in thesesystems, data quantity and usefulness havebeen increased. Other existing sources ofinformation remain to be assimilated, how-ever, to achieve a comprehensive view' ofthe problem. EPRIs limiting-factors analysisstudies, the findings of which are publishedin four reports (NP-1136 through NP-1139),provide further insight into the causes andthe magnitude of nuclear plant availabilityIosses~attributable to valves.
On the basis of the efforts described above,two areas were selected for initial EPRI R&Dattention: the seat leakage performance ofmain steam isolation valve'S (MSIVs) in BWRsand valve stem packing improvements forboth PWR and BWR-application.
Figure 2 presents a cutaway view of a rep-resentative MSIV with the valve bonnet andthe actuator removed. Two identical MSIVsare installed in series in each BWR steamline. Technical specifications for BWR plantsestablish maximum allowable seat leakage
rates for MSIVs and require the periodic test-ing of each valve to verify that this require-ment is met.
Work was initiated in early 1979 with At-wood and Morrill Co., Inc., a manufacturerof MSIVs, and General Electric Co., thenuclear steam supply system contractor forBWR plants, to develop a comprehensivetest program on MSIV seal leakage perfor-manceý (RP1243-1, RP1389-1). The goalswere first to identify the factors that affectthe valves' capability to meet the seat leak-age criteria imposed by the local leak ratetest (LLRT) and then to identify and'verifythe effectiveness of corrective actions forimproving Valve leakage performance.
The program evaluated the effects of suchfactors as local residual stresses from valveinstallation welding; forces and momentsapplieýl by the connecting pipe; mechanicalcycling; thermal cycling; excessive wearand corrosion of critical valve surfaces;and poorly controlled maintenance prac-tices. Of the factors investigated, corrosionof the valve seating surface (or changes inthe friction coefficient) and inadequate main-tenance practices were found to be the mostsignificbrnt contributors to the seat leaka'geproblem. Program results are reported inNP-2381 and NP-2454.
Poppel -main seal Steam
inlet
Figuie 2 BWR main steam isolation valve. EPRI has sponsored a test program to determine the factors thataffect valve seat leakage performance and to evaluate ways to Improve this performance.
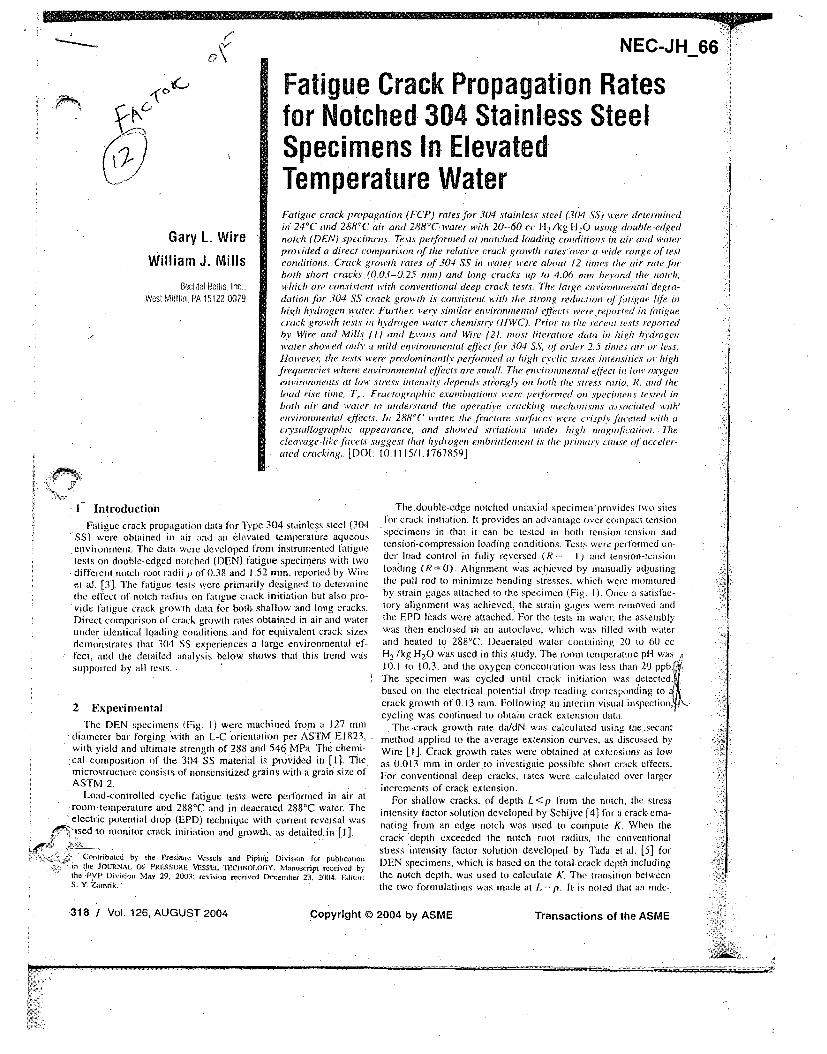
A
AK
Gary L. Wire
William J. Mills
Bl.,i, i Behis. Inc1 .West M itt. PA 15122-0079
NEC-JH 66.7-
Fatigue Crack Propagation Ratesfor Notched 304 Stainless SteelSpecimens In Elevated ATemperature WaterFatigue crack propagation (FCP), roles for 304 stainless steel (304 SS) were determoined
in 24YC and 288RC air and 288'C water with 20-60 cc 112 /kg 1lO using double-edgednotch (DEN) sp.ecimens. Tests perjfrnied at iati:hed loading conditions in air and waterprovided a direct comparison oi'the relative crack grawth rates over a wide range o/test
conditions. Crack growth rates of 304 .5 in water were about 12 tines the air rate Jorboth short cracks (0.03-0.25 min) and long cracks up to 4.06 mm beyond the notch,which are consistent with conventional deep crack tests. Phe large environinental degra-
dation fr)r 304 .S crack growth is consistent i ith the strong reduction ofafitigue life in
high hydrogen water: Further. verv similair envirotniental e4Pets wete.repoited in fatiguecrack grioth tests in hydrtiogen water chemistiy (HWC). Prior to the recent tests reportedbv Wire and Mills I I I nd Evaos and Wire (21, most literature data in high hydrogeniwater showed only/ a mild en virtonnental effct ifar 304 SS, of order 2.5 tiaes air olr less.
Howevet; the tests were predominantvl perfritied at high cyclic struss intenisities or highfIrequencies where environmental c/ffects ore sinall. The enrviroinienital cf/.ci in /a iv oxygen elenvironments at lhw stress intensity depends stongl/y oin both the stress ratio, R, and theload rise time, T, . Fractographic examinations were peifJiried oii specieteiis tested inboth air and water, to understand the operative cracking ntec/hsntisiis associared with'environmental e./Pets, hi 28'° i w'titt; the fracqture suwfaces t were crisjply faceted with acrystallograp/hic appearance, and showied striations under hig/h magnificatlioi ihecleai'age-like facets suggest dial hydrogen embrittlenient is the primary catse qf acceler-ated cracking.. [1)O1: 10. 1115/1. 1767859]
- I Introduction
Fatigue crack propagation data for.Type 304 stainless steel (304SS) were obtained in air and an elevated temperature aqueouwenvironrnent. The data were developed fromn instrumented t.atiguetests on double-edged notched (DEN) fatigue specimens with two
• different notch root radii p of 0.38 and 1.52 rmn, reported by Wireet al. [3]. The fatigue tests were primarily designed to determinethe effect (if notch radius on fatigue crack initiation but also pro-
* vide fatigue crack growth data for both shallow and long cracks.Direct comparison of crack growth rates obtained in air and waterunder identical loading, conditions and for equivalent crack sizes
demonstrates that 304 SS experiences a large environmental ef-
feet, and the, detailed analysis below shows that this trend was
supported by all tests.
2 Experimnental
The DEN specimens (Fig. 1) were machined from a 127 mindiaameter bar forging with an L-C orientation per ASTM E1823,with yield and ultimate strength of 288 and 546 MPa. The chemi-
.cal composition of the 304 SS material is provided in [1]. Themicrostructure consists of nonscnsitized grains with a grain size ofASTM 2.
Load-controlled cyclic fatigue tests were performed in air atroom temperature and 288'C and in deaerated 288'C water. Theelectric potential drop (EPD) technique with current reversal wasu"-sed-to monitor crack initiation and growth, as detailedin [1].
5, ,P-v •. ,
Coniributcd by the Prtes;sure Vessels anid Pipirig Division for publicationtll tile JOUnRNAL OF PREiSiiRE VE'.SSEL tECiCNOLOiGY, Maiuscript received by
the PVP Divison May 29, 2003; reviision received December 23, 2004. Fditor:S_ Y. Z/mnikn
The double-edge notched uniaxial specimen provides two siesfor crack initiation. It provides an advantage over compact tension
specimeens in that it can be tested in both tension-tension andtensiion-compression loading conditions. Tests were performed un-der load control in fully reversed (R ... I) and tension-iensionloading (R=0). Alignment was achieved by manually adjustingthe pull rod to minimize bending stresses, which were monitoredby strain gages attached to the specimen (Fig. I). Once a satisfac-tory alignment was achieved, the strain gages were removed andthe FPD leads were attached. For the tests in water, the assemblywas then enclosed in art autoclave, which was filled with waterand heated to 288"C. Deacrated water containiing 20 to 60 ccH2 /kg H20 was used in this study. The room temperature pH was10.1 to 10.3. and the oxygen concentration was less than 20 ppb.1,)/The specimen was cycled until crack initiation was detected.•based ott the electrical potential drop reading corresponding to "
crack growth if 0.13 nam. Following an interim visual inspection,•,,cycling was continued to obtain crack extension data.
The crack growth rate.da/dN was calculated using the~secantmethod applied to the average extension curves, as discussed byWire [1]. Crack growth rates were obtained at extensions as lowas 0.013 mm in order to investigate possible short crack effects.For conventional deep cracks. rates were calculated over largerincrements of crack extension.
For shallow cracks, of depth L<p from the notch, the stressintensity factor solution developed by Schijve [4] for a crack, ema-nating from an edge notch was used to compute K. When thecrack depth exceeded the notch root radius, the contventionalstress intensity factor solution developed by Tatla et al. [5] forDEN specimens, which is based on the total-crack depth includingthe notch depth. was used to calculate K. The transition betweenthe two formulations was made at L=p. It is noted that an inde-
318 / Vol. 126, AUGUST 2004 Copyright 0 2004 by ASME Transactions of the ASME
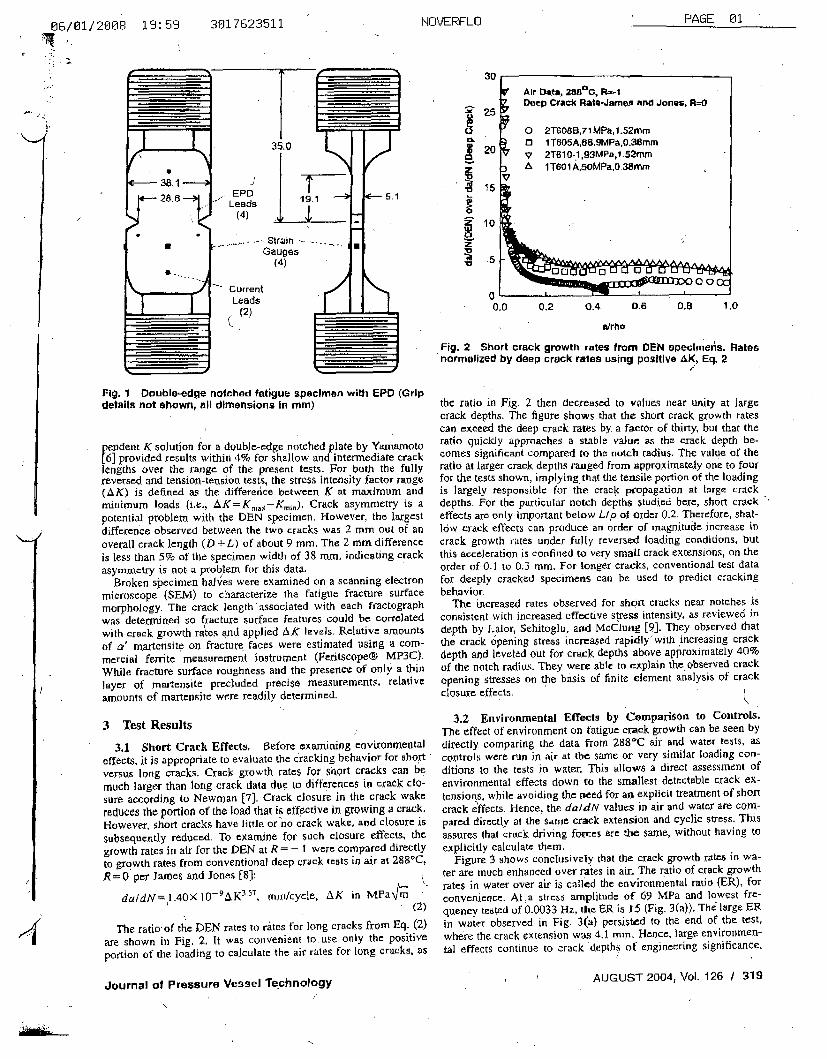
86/81/2086 19:59
//
2--
3017623511 NOVERFLO
CL
ZI
PAGE 01
0.0 0,2 0.4 0.6 0,1 1.0
a/rho
/
Fig. 1 Double-edge notched fatigue specimen with EPD (Gripdetails not shown, all dimensions In mm)
Ferndent K solution for a double-edge notched plate by Yasmamoto[6] provided results within 4% for shallow and intermediate crack
lengths over the range of the present tests. For both the fullyreversed and tension-tension tests, the stress intensity factor range(AK) is defined as the differedice between K at maximum andminimum loads (i.e., AK=K,,jx-Kmni,). Crack asymmetry is apotential problem with the DEN specimen. However, the largestdifference observed between the two cracks was 2 mm out of anoverall crack length (D +L) of about 9 mm, The 2 mm differenceis less than 5% of the specimen width of 38 rmin, indicating crackasymrouetry is not a problem for this data.
Broken specimen halves were examined on a scanning electronmicroscope (SEM) to characterize the fatigue fracture surfacemorphology. The crack length associated with each ffactographwas detemnirted so fracture surface features could be correlatedwith crack growth rates and applied AK levls. Relative amountsof a' martensite on fracture faces were estimated using a com-mercial ferrite Imeasurement instrument (Fexitscope® MP3C).While fracture surface roughness and the presence of only a thinlayer of martensite precluded precise measurements, relativeamounts of martensite were readily determined.
3 Test Results
3.1 Short Crack Effects. Before examining environmentaleffects. it is appropriate to evaluate the cracking behavior for shortversus long cracks. Crack growth rates for short cracks can bemuch larger than long crack data due to differences in crack clo-
sure according to Newman f7). Crack closure in the crack wakereduces the portion of the load that is effective in growing a crack.However, shoti cracks have little or no crack wake. and closure issubsequently reduced. To examine for such closure effects, thegrowth rates in air for the DEN at R = - I were compared directlyto growth rates from conventional deep crack tests in air at 288'C,R = 0 per James and Jones (8]:
da/dN-.1AOX0lO-AK 3 '7 , mm/cycle, AK in Mlarn(2)
The ratio'of the DEN rates to rites for long cracks from Eq. (2)
are shown in Fig. 2. It was convenient to use only the positiveportion of the loading to calculate the air rates for long cracks.;as
Fig. 2 Short crack growth rates from DEN speclmeds. Ratesnormalized by deep crack rates using positive AK, Eq, 2
the ratio in Fig. 2 then decreased to values near unity at largecrack depths. The figure shows that the short crack growth ratescan exceed the deep crack rates by a factor of thirty, but that theratio quickly approaches a stable value as the crack depth be-comes significant compared to the notch radius. The value of theratio at larger crack depths ranged from approximately one to fourfor the tests shown, implying that the tensile portion of the loadingis largely'responsible for the crack propagation at large crackdepths. For the particular notch depths studied here, short crackeffects are only important below LIp of order 0.2. Therefore, shal-low crack effects can produce an order of magnitude increase incrack growth rates under fully reversed loading conditions, butthis acceleration is confined to very small crack extensions, on theorder of 0.1 to 0.3 mm. For longer cracks, conventional test datafor deeply cracked specimens can be used to predict crackingbehavior.
The increased rates observed for short cracks near notches isconsistent with increased effective stress intensity, as reviewed indepth by Lalor, Sehitoglu, and McClung [9]. They observed thatthe crack 6pening stress increased rapidly'with increasing crackdepth and leveled out for crack depths above approximately 40%of the notch radius. They were able to explain the) observed crackopening stresses on the basis of finite element analysis of crackclosure effects.
3.2 Environmental Effects by CompariSOn to Controls.The effect of environment on fatigue crack growth can be seen bydirectly comparing the data from 288"C air and water tests, ascontrols were run in air at the same or very similar loading con-ditions to the tests in water. This allows a direct assessment ofenvironmental effects down to the smallest detectable crack ex-tensions, while avoiding the rced for an explicit treatment of shortcrack effects. Hence, the daldN values in air and water are com-pared directly at the same crack extension and cyclic stress. Thisassures that crack driving fortes are the same, without having toexplicitly calculate them,
Figure 3 shows conclusively that the crack growth rates in wa-ter are much enhanced over raItes in air. The ratio of crack growthrates in water over air is called the environmental ratio (ER), forconvenience. Ata stress amplitude of 69 MPa and lowest fre-quency tested of 0.0033 Hz, the ER is 15 (Fig. 3(a)). The large E'Rin water observed in Fig. 3(a) persisted to the end of the test,where the crack extension was 4,1 mm. Hence. large environmen-tal effects continue to crack depths of engineering significance,
i
AUGUST 2004, Vol. 126 / 319Journal of Pressure Vessel Technology
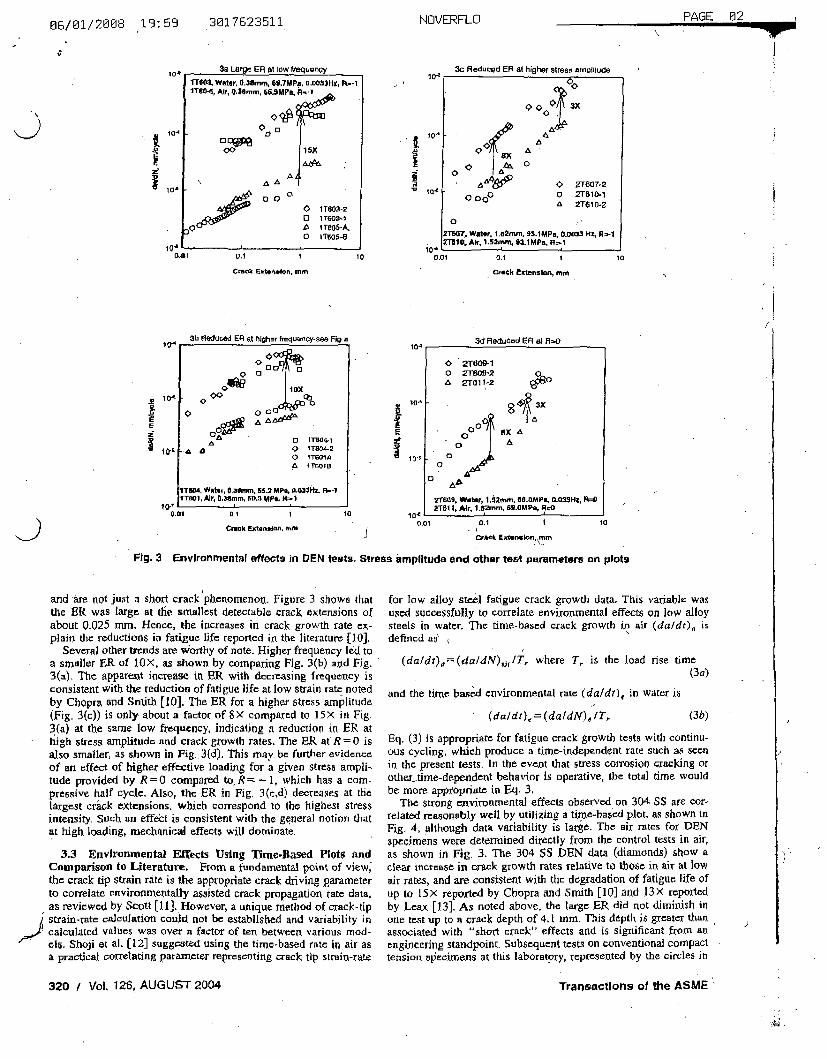
06/01/2008 13:53 3017623511 NOVERFLO PAGE 02
V
I.t
10'
*1
0.01 0.1 I 10
Crook EbtkMson. mm CaCk Extenslon, ¶Mn
/
In.'- 313 FledUced ER at Nlgher trequocy-aae F49 a3d Meducod ER at F1Oin..
10" 1
II
* 000;&g.
lox00
00, MOOIA,., 1 T 1804-20 'TTGOi•A
a1 Toiot B
ITaSM, WOtW¢, 0.36mm. 55-2 MPI, 0.022iH R-4ETaOlJ Air, O.Amm, 50.3 MFie, 8.-1
0 2T609-10 2T500'2*I 2T"611,2 0
3M%
ý.aII
10' 1
eX AA
to'"1o's 0
0o
A4
M1,"Olt/ 0.1 1
Croak Extension. Mno
10
2T609, wMter, 1.52mm, for. 0L033"1, R=NO2TO1 , Air, 1.8,2mm, SOMP,, RI.
0.01 0.1 11
CrAok Extrn.Ion mm.1Fig. 3 Environmental effects in DEN tests. Stress amplitude end other test parameters on plots
and 're not just a short crack phenomenon. Figure 3 shows thatthe ER was large at the smallest detectable crack extensions ofabout 0.025 rnm. Hence, the increases in crack growth rate ex-plait) the reductions in fatigue life reported in the literature [10].
Several other trends are worthy of note. Higher frequency led toa smaller ER of 1OX, as shown by comparing Fig, 3(b) and Fig.3(a). The apparent increase in ER with decreasing frequency isconsistent with the reduction of fatigue life at low strain rate notedby Chopra and Smith [10]. The ER for a higher stress amplitude(Fig. 3(c)) is only about a factor of 8) compared to 15X in Fig.3(a) at the same low frequency, indicating a reduction in ER athigh stress amplitude and crack growth rates. The ER at'R = 0 isalso smaller, as shown in Fig. .3(d). This may be further evidenceof an effect of higher effective loading for a given stress ampli-tude provided by R = 0 compared (o R-? - 1, which has a com-pressive half cycle, Also, the ER in Fig. 3(c,d) decreases at thelargest crack extensions, which correspond to the highest stressintnsity. Such an effect is consistent with the general notion thatat high loading, mechanical effects will dominate.
3.3 Environmental Effects Using Time-Based Plots andComparison to Literature. From a fundamental point of view;the crack tip strain rate is the appropriate crack driving parameterto correlate environmentally assisted crack propagation rate data,as reviewed by Scott (11 ]. However, a unique method of crack-tip
/ strain-rate calculation could not be established and variability incalculated values was over a factor of ten between various mod-els. Shoji et al. (12] suggested using the time-based rate in air asa practical correlating parameter representing crack tip strain-rate
for low alloy steel fatigue crack growth data. This variable wasused successfully to correlate environmental effects on low alloysteels in water. The time-based crack growth in air (da/dt), isdefined ae
(da/dt)a=(da/dN),j,rIT, where T, is the load rise time
(3a)
and the time based environmental rate (da/dt), in water is
(d/dr), = (da/dN),/T, (3b)
Eq. (3) is appropriate for fatigue crack growth tests with continu-ous cycling, which produce a time-independent rate such as seenin the present tests. In the event that stress con'osion cracking orothettime-dependent behavior is operative, the total time wouldbe more appropriate in Eq. 3,
The strong environmental effects observed on 304 SS are cor-related reasonably well by utilizing a time-based plot, as shown inFig. 4, although data variability is large. The air rates for DENspecimens were deteruined directly from the control tests in air,as shown in Fig. 3. The 304 SS DEN data (diamonds) show aclear i•crease in crack growth rates relative to those in air at lowair rates, and are consistent with the degradation of fatigue life ofup to 15X reported by Chopra and Smith [10] and 13X reportedby Leax [13]. As noted above, the large ER did not diminish inone test up to a crack depth of 4.1 mim. This depth is greater thanassociated with "short crack" effects and is significant from anengineering standpoint- Subsequent tests on conventional compacttension specimens at this laboratory, represented by the circles in
320 / Vol. 126, AUGUST 2004 Transactions of the ASME
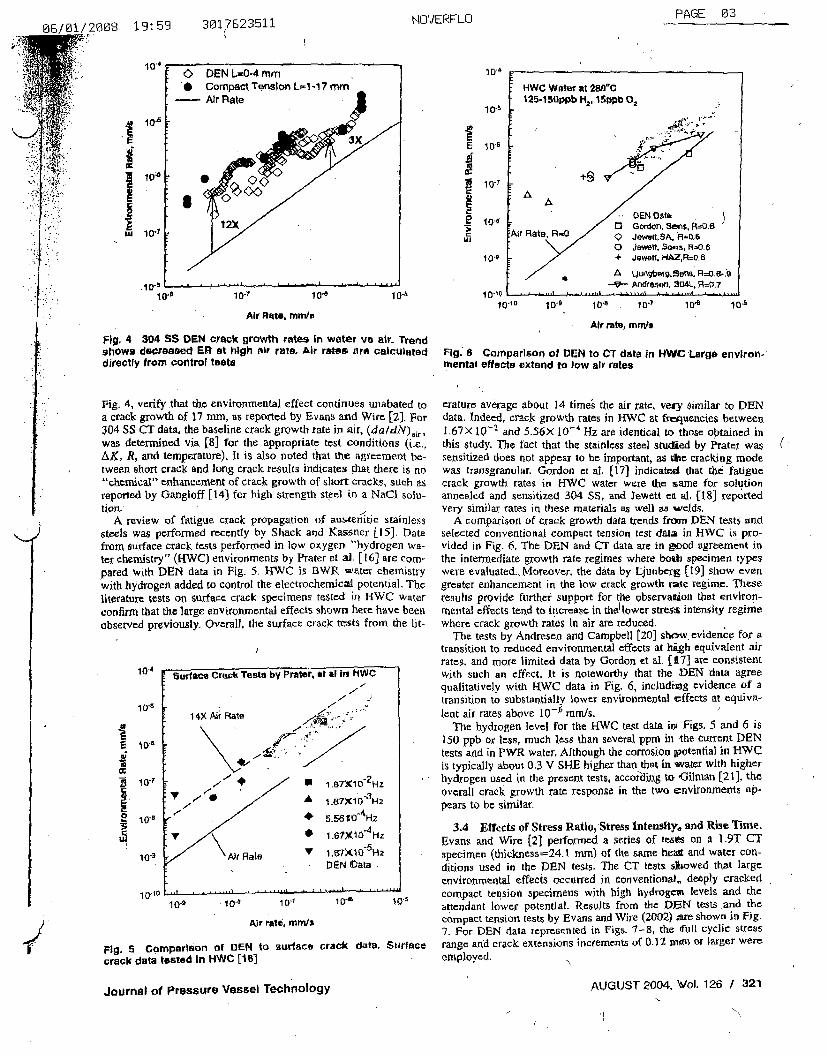
'2008 19:59 3017623511 NOVERFLOPAGE 03
10-" 1 D-4
10 t
HWC Water at 2W8C125-1 5appb h2, 1 Sppb 0,
4~4,".
I*110~0
*1E.9
10.6
+9S 'V10-1
10-i
lI Q4
A
DEN OCt&. /~~ G] oron, ser$, R--O.6
EAir Rate, R-0 Q Jewut,SA. H-.0,6
XMo G•nawo, Sens, R=O.8
+ .Joawtt. HAZR=O.6A wugerg.sena. R=O0.>9
,t0-8 -lO0- 10-A 10e e 10-m
Air Rat*, rm/dn
10-1010-
, I J ..... I I J • I"hl I I Itt&*•l L • .L &.L•,I t i .•..*
101 D-9 10's . 1o'? i Do 10-6
Fig. 4 304 SS DEN crack growth rates in water vs air. Trendshows decroased ER at high air rate. Air rates are calculateddirectly from control tests
Fig, 4, verify .that the environmental effect continues unabated toa crack growth of 17 nim, as reported by Evans and Wire [2]. For
304 SS CT data, the baseline crack growth rate ini air, (da/dN),ir,was determined via [8] for the appropriate test conditions (i.e.,AK, R, and temperature), It is also noted that the agreement be-tween short crack and long crack results indicates that there is no"chemical" enhancement of crack growth of short cracks, such asreported by Gal.gloff [14) for high strength steel in a NaCi solu-tion.
A review of fatigue crack propagation of austenitjc stainlesssteels was performed recently by Shack and Kassner [15]. Datafrom surface crack tests performed in low oxygen "hydrogen Wa-ter chemistry" (HWC) environments by Prater et al. [ 16] are com-
pared with DEN data in Fig. 5. HWC is BWR water chemistrywith hydrogen added to control the electrochemical potential. Theliterature tests on surface crack specimens tested in HWC water
confirm that the large environmental effects shown here have beenobserved previously. Overall, the surface crack tests from the lit-
Air rate, mm/s
Fig. 6 Comparison of DEN to CT data in H1WC Large environ-
Mental effect. extend to low air rates
erature average about 14 times the air rate, vety similar to DENdata. Indeed, crack growth rates in HWC at fnpquencies between
1.67X 10⁻² and 5.56X 10 4 Hz are identical to those obtained in
this study. The fact that the stainless steel studied by Prater wassensitized does not appear to be important, as trie cracking modewas transgranular. Gordon ct al. [17] indicated that the fatigue
crack growth rates in HWC water were the same for solutionannealed and sensitized 304 SS, and Jewett et. al. (t18 reportedvery similar rates in these materials as well as welds.
A comparison of crack growth data trends from DEN tests and
selected conventional compact tension test data in HWC is pro-vided in Fig. 6. The DEN and CT data are in good agreement in
the intermediate growth rate regimes where both specimen typeswere evaluated., Moreover, the data by Ljunberg [19] show evengreater enhancement in the low crack growth rate regime. These
results provide further support for the observation that environ-mental effects tend to increase in thellower stress intensity regimewhere crack growth rates In air are reduced.
The tests by Andresen and Campbell [20] show. evidence for atransition to reduced environmental effects at htgh equivalent airrates, and more limited data by Gordon et al. [17] are consistentwith such an effect. It is noteworthy that the DEN data agree
qualitatively with HWC data in Fig, 6, including evidence of atransition to substantially lower environmental cffects at equiva-
lent air rates above l0-9 am/s, .
The hydrogen level for the HWC test data in' Figs. 5 and 6 is
150 ppb ox less, much less than several ppm in the current DENtests and in PWR water, Although the corrosion potential in HWCis typically about 0.3 V S4E higher than that in water with higherhydrogen used in the present tests, accoiding to Oilman [21], the
overall crack growth rate response in the two environments ap-pears to be similar.
(K
i1-0
I3 10-8
I0"9
3-A Effects of Stress Ratio, Stress Intensity,, and Rise Time.
Evans and Wire (2) performed a series of teals on a l.9T CT
specimen (thickness=24.-1 mm) of the same heat and water con-
ditions used in the DEN tests. The CT tests. showed that large
environmental effects occurred in conventional, deeply cracked
compact tension specimens with high hydrogcm levels and the
10' attendant lower potential. Results from the DEN tests and the
compact tension tests by Evans and Wire (2002) arie shown in Fig,
7. For DEN data represented in Figs- 7-8, the full cyclic stress
lurface range and crack extensions increments of 0.32 man or larger were
employed,
10-"s 1 0"1 1 0.7 1 0-M
Air rale, mrnan
DEN to surface crack data. etin •i Cnatnnnrisfn of
crack data tested In HWC [I1)
Journal of Pressure Vessel TechnologyAUGUST 2004, Vol. 126 / 321
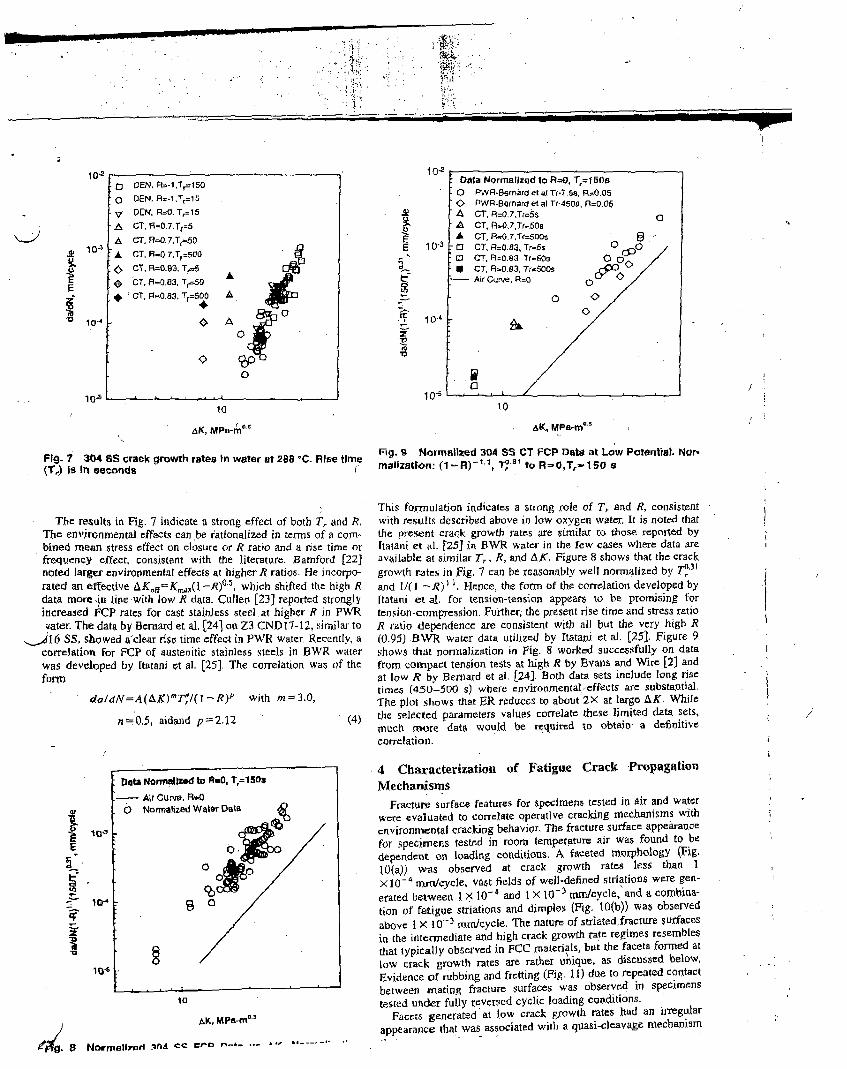
1- ii
I.
_j
: Data Normalized to R10. T,=l 50so PWR,Brnaro et at Tr-7.•s•, •0.050 PWR-Bernord et al Tr-4508, R=0.05
S
I,I
E 10-3
A- U1, t=U./,Ito .S, 0A CT, R-0,?,Trý.60aA CT, R--.7,Tl=sOOs ,
-0 CT, R=C.8a, Ty-5; s 00 CT, R=0.03, Tr-60a 0* CT, R0.0.63, TrsSOOs
AlkCurve, R=O 0
- 00
C. , T
10-'
1O-S1 -Z
10
AK, hlPs-r'n
Fig- 7 304 SS crack growth rates In water at 288 *0. Rise time(T,) is In seconds
The reaults in Fig. 7 indicate a strong effect of both Tr and R.The environmental effects can be rationalized in terms of a com-bitled mean stress effect on closure or R ratio and a rise time orfreqxency effect, consistent with the literature. Bamford [221noted larger environmental effects at higher R ratios. He incorpo-rated an effective AKoff = Kr 5,(l -,R), which shifted the high Rdata more ,in line with low R data. Cullen [23) reported stronglyincreased FCP rates for cast stainless steel at higher R in PWRwater. The data by Brnard et al. (241 on Z3 CND17-12, similar to
,._Al6 SS, showed a&clear rise time effect in PWR Water. Recently, acorrelation for FCP of austenitic stainless steels in BWR waterwas developed by [tatani et al. (25]. The correlation was of thefoarm
da/dN=A(AK)'•TI,(l -R)P with m--3,0,
ný0,5, aidand p=2.12 (4)
10
AK, MP--m
Fig. 9 Normalized 304 SS CT FCP Dats at Low Potential. Nor-malization: (1-R)-, Tr-3' to R-0,T,-150 a
This formulation indicates a strong role of T, and R, consistentwith results described above in low oxygen water, It is noted thatthe present crack growth rates are simila.r to those reported byItatani et Al. t25] in BWR water in the few cases where data areavailable at similar T,., R, and AKX Figure 8 shows that the crackgrowth rates in Fig. 7 can be reasonably well normalized by T 5'and 1/0 -R)) . Hence, the form of the correlation developed byItatani et al, for tension-tension appears to be promising fortenlsionl-compression. Further, the present rise time and stress ratioR ratio dependence are consistent with all but the very high R(0.95) .BWR water data utilized by ItatanJi t al. [25], figure 9shows that normalization in Fig. 8 worked successfully on datafrom compact tension tests at high R by Evans and Wire [2) andat low R by Bernard et al. [24]. Both data sets include long risetimes (450-500 s) where environmental',effects are substantial.The plot shows that ER reduces to about 2x at large AK. Whilethe selected parameters values correlate these limited data sets,much rore data would be required to obtain- a definitivecorrelation.
.4 Characterization of Fatigue Crack PropagationMechanisms
Fracture surface features for specimens tested in air and waterwere evaluated to correlate operative cracking mechanisms withenvironmental cracking behavior, The fracture surface appearacefor specimens tested in room temperature air was found to bedependent on loading conlditions. A faceted Morphology (Fig.10(a)) was observed at crack growth rates less than I>< 10i- 4 rb-cycle. vast fields of well-defined striations were gen-erated between I X lo-4 and I X l0-3 mn/cycle, and a combina-tion of fatigue striations and dimples (Fig. 10(b)) was observedabove I x 10-3 mm/cycle. The nature of striated fracture surfacesit the intermediate and high crack growth rate regimes resemblesthat typically observed in FCC materials, but the facets formed atlow crack growth rates are rather untique, as discussed below,Evidence of rubbing and fretting (Fig. 11) due to repeated contactbetween mating fracture surfaces was observed in specimenstested under fully reversed cyclic loading conditions.
Facets generated at low crack growth rates had an irregularappearance that was associated with a quasi-cleavage mechanism
Data Normalized to R.0. t,=--• 0K r Curve. R*Oo Normalized Waler Daot
100 :.I
Mc4
10-6
to
mAK, MPa-M'0
Mal 9 Nonrmali~a ,I CL€c Cr0 n--- . , .*

.... .. wr L2 va axV. Nrrmalzalon:; inat was operative tor both shajlow and deep cracks, as long as31 to R=O, T,-15O crack growth rates were less than I X IO4 mnilcycje. Because
322 / VoL 126, AUGUST 2004Trensactlons of the ASME
/
N,V
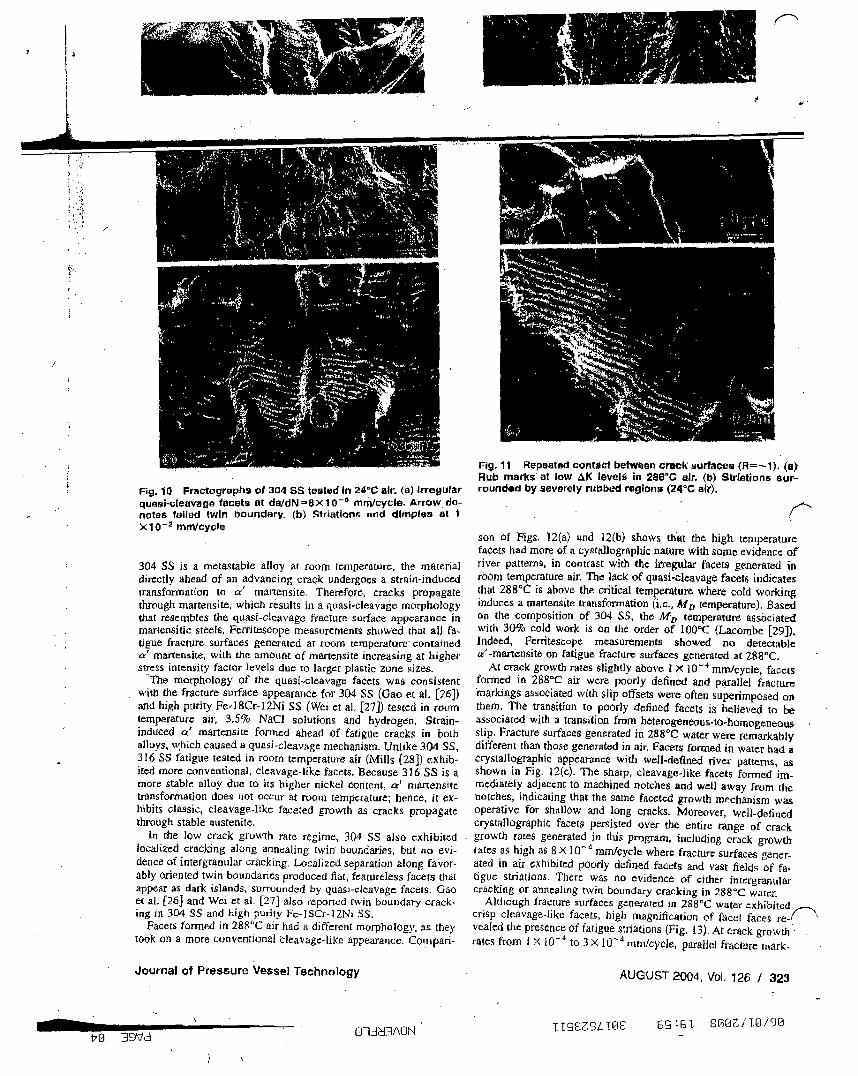
4
Fig. 10 Fractographs of 304 SS tested In 24CC air. (a) Irregularquaai-cleavage facets at da/dN=ex1 0-5 mrnlcycle. Arrow de-notes tailed twin boundary. (b) Striations and dimples' at 1X10⁻² mn/cycle
304 SS is a metastable alloy at room temperature, the materialdirectly ahead of an advancing crack undergoes a strain-inducedtransformation to ix' martensite. Therefore, cracks propagatethrough martensite, which results in a quasi-cleavage morphologythat resembles the quasi-cleavage fracture surface appearance inmartensitic steels. Fetritescope measurements showed that all fa-tigue fracture surfaces generated at room temperature containeda' martensite, with the amount of martensite increasing at higherstress intensity factor levels due to larger plastic zone sizes.The morphology of the quasi-cleavage facets was consistentwith the fracture surface appearance for 304 SS (Gao et al. [263)and high purity Fel gCr- I 21Ni SS (Wei ct al. [27]) tested in roomtemperature air, 3,5% NaCI solutions and hydrogen, Strain-induced a' martensite formed ahead of fatigue cracks in bothalloys, wyhich caused a quasi-cleavage mechanism- Unlike 304 SS,316 SS fatigue tested in room temperature air (Mills (28]) exhib-ited more conventional, cleavage-like facets. Because 316 SS is amore stable alloy due to its higher nickel content, a' martensitetransformation does not occur at room temperature; hence, it ex-hibits classic, cleavage-likc faceted growth as cracks propagate
through stable austenite,In the low crack growth rate regime, 304 SS also exhibitedlocalized cracking along annealing twin' boundaries, but no evi-dence of intergranular cracking. Localized separation along favor-ably oriented twin boundaries produced fiat, featureless facets thatappear as dark islands, surrounded by quasi-cleavage facets. Gaoet al. [263 and Wei et al. [27) also reported twin boundary track-ing in 304 SS and high purity Fe-ISCr-l2Ni SS,
Facets formed in 2880 C air had a different morphology, as theytook on a more conventional cleavage-like appearance. Coinpari-
Journal of Pressure Vessel Technology
Fig. 11 Repeated contact between crack surfaces (R=-1). (a)Rub marks at low AK levelt in 2880C air. (b) Striations sur-rounded by severely rubbed regions (240C air).
son of Figs. 12(a) and 12(b) shows that the high temperaturefacets had more of a cyatallographic nature with some evidence ofriver patterns, in contrast with the Irregular facets generated inroom temperature air. The lack of quasi-cleavage facets indicatesthat 2880 C is above the critical temperature where cold workinginduces a martensite transformation (i.e., M0 temperature). Basedon the composition of 304 SS, the MD temperature associatedwith 30% cold work is on the order of 1000 C (Lacombe [29]).Indeed, Ferritescope measurements showed no detectablea'-martensite on fatigue fracture surfaces generated at 2880 C.At crack growth rates slightly above 1 X 1O-4 mm/cycle, facetsformed in 288'C air were poorly defined and parallel fracturemarkings associated with slip offsets were often superimposed onthem, The transition to poorly defined facets is believed to beassociated with a transition from heterogeneous-to-homogeneousslip. Fracture surfaces generated in 288M0 water were remarkablydifferent than those generated in air. Facers formed in water had acrystallographic appearance with well-defined river patterns, asshown in Fig. 12(c). The sharp, cleavage-like facets formed im-mcdiately adjacent to machined notches and well away from thenotches, indicating that the same faceted growth mechanism wasoperative for shallow and long cracks. Moreover, well-definedcrystallographic facets persisted over the entire range of crackgrowth rates generated in this program, including crack growthrates as high as 8 X 10- m4m/cycle where fracture surfaces gener-ated in air exhibited poorly defined facets and vast fields of fa-tigue striations. There was no evidence of either intergranularcracking or annealing twin boundary cracking in 288'C waterAlthough fracture surfaces generated in 288'C water exhibitedcrisp cleavage-like facets, high magnification of facet faces re- 'vealed the presence of fatigue striations (Fig. 13). At crack growthrates from I X 10-4 to 3 X 10⁻⁴ mn/cycle, parallel fracture mark-
AUGUST 2004, Vol. 126 / 323
89 :ST 8R3/i/BVO DG 01N3dBiON
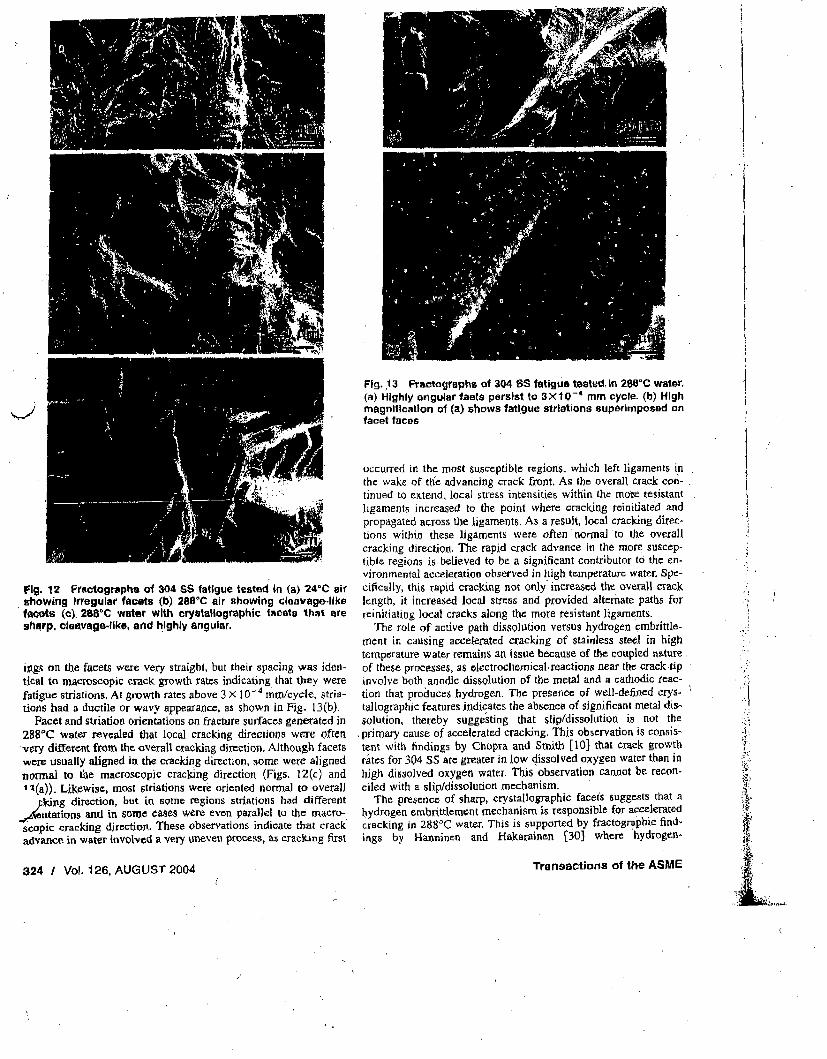
Fig. 12 Feactographe ol 304 SS fatigue tested In (a) 24"C airshowing Irregular facets (b) 2880C air showing cleavage-likefacets (c), 2886C water with crystallographic facets that aresharp. cleavage-like, and highly angular.
utg. on the facets were very straight, but their spacing was iden-tical to macroscopic crack growth rates indicating that they werefatigue striations, At growth rates above 3 X l0-4 mtn/cyvIe, stria-tions had a ductile or wavy appearance, as shown in Fig- 13(b).
Pacet and striation orientations on fracture surfaces generated in288'C water revealed that local cracking directions were oftenIvery different from the overall cracking direction. Although facetswere usually aligned in the cracking direction, some were alignednormal to the macroscopic cracking direction (Figs. 12(c) andI'1(a)). Likewise, most striations were oriented normal to overall
.kivg direction, but in some rgions striationus had differenttateons and in sorne cases were even parallel to the macro-
scopic cracking direction, These observations indicate that crackadvance in water involved a very Oneven ptocess, as crackling first
324 I Vol. 126, AUGUST 2004
Fig. 13 Fractographs of 304 SS fatigue tested, In 288'C water,(a) Highly angular faets persist to 3X10⁻⁴ mm cycle. (b) Highmagnification of (a) shows fatigue siriations suparimposed anfacet faces
occurred irk the most susceptible regions, which left ligaments inthe wake of t!he advancing crack front. As the overall crack con-tinued to extend, local stress intensities within the more resistantligaments increased to the point where cracking reinitiated andpropagated across the ligaments. As a result, local cracking direc-tions within these ligaments were often* normal to the overallcracking direction, The rapid crack advance in the more suscep-tible regions is believed to be a significant contributor to the en-vironmental acceleration observed in high temperature water. Spe-cifically, this rapid cracking not ondy increased the overall cracklength, it increased local stress and provided alternate paths forreinitiating local cracks along the more resistant ligaments.
The role of active path dissolution versus hydrogen embrittle-mrent in causing accelerated cracking of stainless steel in hightemperature water remains an issue because of the coupled nature,of these processes, as clectrocliemical, reactions near the crack tipinvolve both anodic dissolution of the metal and a cathodic reac-tion that produces hydrogen. The presence of well-defined crys-tallographic features indicates the absence of significant metal dis-solution, thereby suggesting that slip/dissolution, is not theprimary cause of accelerated cracking, This observation is consis-tent with) findings by Chopra and Stnith [10] that crack growthrtes for 304 SS are greater in low dissolved oxygen water then inhigh dissolved oxygen water. This observation cannot be recon-ciled with a slip/dissolution mechanism.
The presence of sharp, crystallographic facets suggests that ahydrogen embrittlement mechanism is responsible for acceleratedcracking in 288'C water. This is supported by fractograpbic find-ings by Haoninen and Hakarainen [30) where hydrogen-
Transactions of the ASME
:a:
L.
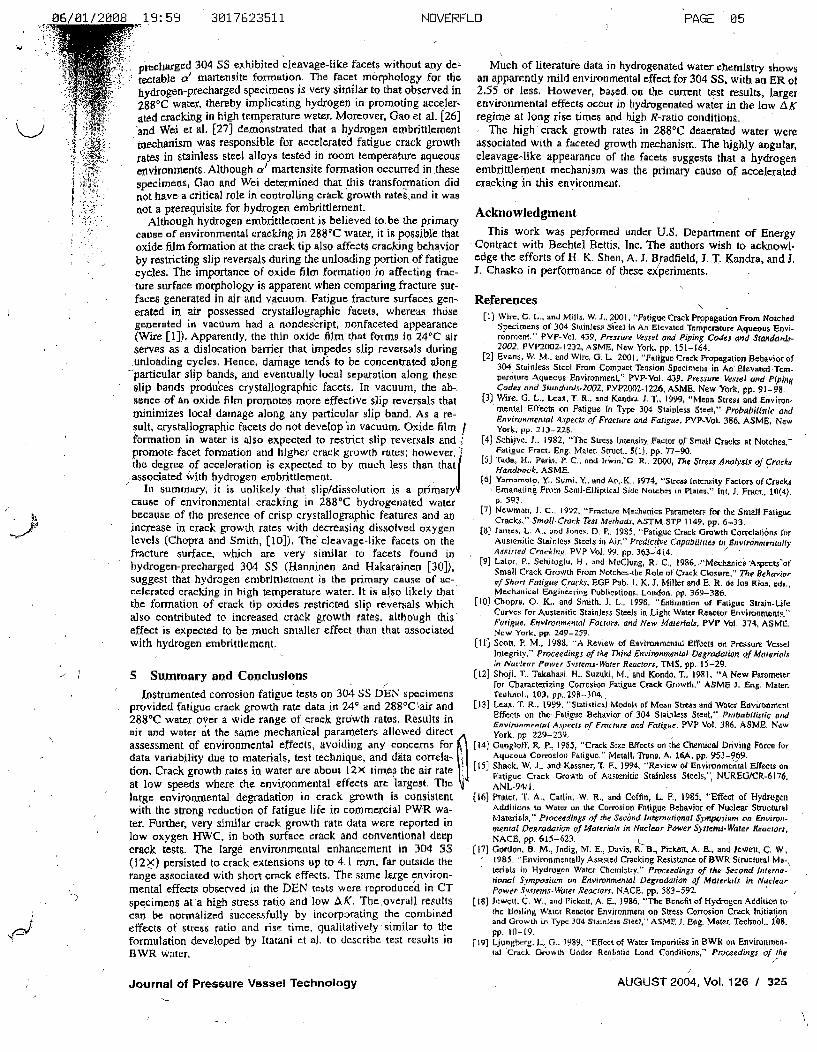
06/01/2008 19:59 3017623511 NOVERFLO PAGE 05
precharged 304 SS exhibited cleavage-like facets without any de-tectable a' martensite formation. The facet morphology for thehydrogen-precharged specimens is very similar to that observed in2880 C water, thereby implicating hydrogen in promoting acceler-ated cracking in high temperature water, Moreover, Gao et al. [26]'and We6 et RI. [273 demonstrated that a hydrogen ewbrittlementmechanism was responsible for accelerated fatigue crack growthrates in stainless steel alloys tested in room temperature aqueouscivirommfnts- Although ca martensite formation occurred in.thesespecimens, Gao and Wei determined that this transformation didnot have a critical role in controlling crack growth ratesand it wasnot a prerequisite for hydrogen embrittlement.
Although hydrogen embrittlernt is believed to. be the primarycause of environmental cracking in 2881C water, it is possible thatoxide film formation at the crack tip also affects cracking behaviorby restricting slip reversals during the unloading portion of fatiguecycles. The importance of oxide film formation in affecting frac-ture surface morphology is apparent when comparing fracture sur-faces generated in air and vacuum. Fatigue fracture surfaces gen-
Much of literature data in hydrogenated water chemistry showsan apparently mild environmental effect for 304 SS. with an ER ot2.55 or less. However, based on the current test results, largerenvironmental effects occur in hydrogenated water in the low AKregime at long rise times and high K-ratio conditions.
The high' crack growth rates in 2880C deacrated water wereassociated with a faceted growth mechanism. The highly angular,cleavage-like appearance of the facets suggests that a hydrogenembrittler-ent mechanism was the primary cause of acceleratedcracking in this environment,
Acknowledgment
This work was performed under U.S. Department of EnergyContract with Bechtel Bettis, Inc. The authors wish to acknowl-edge the efforts of H. K. Shen, A. I. Bradfield, J. T- Kandra, and J.I. Chasko in performance of these experiments.
Referencescl,'"u n aLs cli p osseVa ctya•tL lC•i;t'ala.J JI't'-IZ' WL t111)0e [1] Wire, G. L-., and Mills, W. J_2001, "Fatigue Crack Prpagation From Notchedgenerated in vacuum had a nondes'cript, nonfaceted appearance Specirmens of 304 Stainless Sfeel in An Elevated Temperature Aqueous Envi-(Wire [1]). Apparently, the thin oxide film that forms in 24 0 C air ronroent," PVF-Vol. 439, Pre•uure Verjet and Piping Co•es and Srandap,.-serves as a dislocation barrier that impedes slip reversals during 2002, PvP-2002-1232, ASME, New York, pp. 151-164.
uetend to be concentrated along [2) Evans, W. M,. and Wire, G. L.. 2001, "Fatijuo Crack Propagation Behavior of-,unloading cycles. Hence, damage 304 StaIn Steol From Compact Tlbnsion Specimens in An Eltvated,Tcm.'particular slip bands, and eventually local separation along these pera(ure Aqueous Environment," P'VP-Vol. 439. Priesure Vessel and Pipslg
slip bands produces crystallographic facets, In vacuum, the ab-. Codes and Jtundurds.2002, PVP2002-1226. ASME. New York, pp. 91-98.sence of an oxide 'film promotes more effective slip reversals that (3) Wire, G. L., L.ax, T.R.. and Kandra, J. T,, 1999, 'Mean Stresi and Environ,minimizes local damage along any particular slip band. As a re- mental Effects on Fatigue In Type 304 Stajnless Steel," Probabillstlk aad
yEnvironnental Aspects of Fracture and Fatigue, PYP-VoI. 306, ASME, Newsuit, crystallographic facets do not develop n vacuum. Oxide film I York, pp. 213-225.formation in water is also expected to restrict slip reversals and (4) Schijvc. 1.. 1982. "The Stress tIteosirty Factor of Small Cracks at Notches,"promote facet formation and higher crack growth rates; however. Fatiguc Fract. Eng, Mater, Stret., 5(1), pp. 77-90.the degree of acceleration is expected to by much less than that [5] Toda, H., Paris, P. C., and lr-,in$.G. R., 2000, The Sross Analysis of Cryekst Handbook, ASME.associated w'ith hydrogen embrittlement. (6,j Yarnanoto. Y.. Semi, Y,, and Aon K., 1974. "Stress Intcnsity Factors of Cracks
In summary, it is unlikely that slip/dissolution is a primary Emanoating Prom Semi-Elliptical Side Nt)tcbes in Plates." tnt. J. Fract.. 10(4).cause of environmental cracking in 288VC hydrogenated water p. 593.because of the presence of crisp crystallographic features and an (7) Newman, 1. C., 1992, "Fracture Mecbanicrs Parameters for the Small Fatigue
Cracks," Smoll Crao'k Test Methado, ASTM STP 1149, pp, 6-33.increase in crack growth rates with decreasing dissolved oxygen [(] lames, L- A.. and Jones. D. F.. 1985. "Fatigue Crack Growth Corrtlatibns Aorlevels (Chopra and Smith, t10]), The" cleavage-like facets on the Auacnitic Stainles Ste4ls it) Air," Prudictive Captbfllrtes ft Envft~rnrnntullyfracture surface, which are very similar to facets found in Ascisred Craeklng, PVP Vol. 99, pp. 363-;414.hydrogen-precharged 304 SS (Hanninen and Hakaraine• [30]), [~] Lalur, P, Sehitoglu, H ., and McClung, R, C., 3986,A'Mechasie0 -A.spcctst'fStall Crack Girowth From Notcha.f-the Role of Crack Closure," The Behaviorsuggest that hydrogen embrittlement is the primary cause of ac- of Short Fatigue C7rauk, EGF Pub. I, K, J. Miller and E. R. de los Rio., rcdh.,celerated cracking in high temperature water. It is also likely that Mechanical E~ngineerig Publications, London. pp. 369-386.the formation of crack tip oxides restricted slip reversals which ['01 Chopra, 0. K.. and Smith. J. L., 1995, "Eatimation of Fatigue Strain-Lifethis Curves For Ausmtnitic Stainless Steels in Light Water Reactor Fnvironments."also contributed to increased crack growth rates, although this Fa ,tilronmeatal Factors, and New Materlsb, PVP Vol. 374, ASME_effect is expected to be much smaller effect than that associated New York. pp. 249-239.with hydrogen embrittlement, (It') Scott, P. M., 1988, "A Review of Eavl'orassal Elfeta on Preasure Vcral
Integrity," Proc'edings of the Third Envimnnental Dtgradatioa nif Morerialsin Nuclear Power Systems- Wafer Reactors. TMvS. pp. 15-29.
5 Summary and Conclusions (12) Shoji, T.. Takahasi. H.. Suzuki, MJ and Kondo. T,. I981, "A New Parometer-for Characteriina Corrosion Fatigue Crack Growth," ASME J. Eng. Mater.
Instrumented corrosion fatigue tests on 3045S DEN specimens Technol., 103. pp,. 2 90-3 04,provided fatigue crack growth rate data in 2 4 ' and 288 Cxair and [)31 LCAx, T. R., t999, "Statislical Modols of Mean Stress and Water Eavieonment2880 C water over a wide range of crack growth rates. Results in Effects on t'h. Fatigue Uchavior of 304 Stainless Steal," Praisabilistic a•d
cEnvironmental Aspects, of Fracture and Fatigiue, PVP Vol. 386, ASME. Newair and water ait the saone mechanical parameters allowed direct York. pp 229-239,assessment of environmental effects, avoiding any concerns for (141 Gaogloff, P. P.. 3913, "Crack Size Efforts an the Chermical Driving Force fordata variability due to materials, test technique, and dýta correla- fl Aqueous Corrosion Fatigue." Metall. TYans, A, lclA, pp. 953-969.
)[15 Shack, W. J.. and Kassner, T. F, 1994, "'Review or Environmentral Effelct ondion. Crack growth rates in water are about 12X times the air rate V1'atiue Crack Growth of Au.senlrle Stainless Steels,", NUREGfCR-6176.at low speeds where the environmental effects are largest. The ANL-94/l.large envirnmental degradation in crack growth is consistent (16) Prt(or., '. A.. Catlin, W. R.. and Coffin, L. P., 1985, "Effect of t4ydrogenwith the strong reduction of fatigue life in commercial PWR wa- Additions to Water on the Corrosion Fatigue Behavior of Nuclea Structural
ter. Further, very similar crack growth rate data were reported in Mvaterials," Ptoceedines of the Sec6nd h!remationol Symposium on Environ-mental Degrodatiun of Materials is Nuclear Power Syn'teacs Water Reaclors,
low oxygen HWC. in both surface crack and conventional deep NACE, PP. 605-623.crack tests. The large environmental enhancement in 304 55 '17] Gordon, b. M., IndiE, M. E., Davis, R. a., Pickett, A. E.. and Jewett, C. W.,(12?<) persisted to crack extensions up to 4.1 amm. far outside the 1985. "Envimnmentally Assisted Cracking Resistance of BWR Structural Ma-•(12))persistedto crack e fpts.Te same larg- teals in Hydrojgen Water Chrmnistry." Proceedings of thk Second Interna.range associated with short crack effects, The stme large environ- aionel Sympa3ium on Envfronmental Degradation of Mate,'lslts in Nuclea,mental effects observed in the DEN tests were reproduced in CT Power Syvlrems-lare, Reactors, NACE. pp, 583-592. 1
specimens at'a high stress ratio and low AK. Theoverall results [181 Jowett, C. W., and Pickctt, A. f-, 1986, "The Benefit of Hydrogen Addition tocan be normalized successfully by incorporating 'the combined the Boiling Water Reactor Environment on Stress Corrosion Crack lnitiation
effects of stress ratio and rise time, qualitatively 'similar to the and Growth in Type 304 Staintlen Stael," ASME 3. &fug. Moter. Tech'ol.. 1,08.
formulation developed by Itatani et al. to describe test results in pp .jngbere, L. G.. 1989. "Effect of Watr" Impurities in BW9 o. Environrnn-
BWR Water. tal Crack Growth Under Realistic Load Conditions," Promeedings of the
Journal of Pressure Vassel Technology AUGUST 2004, Vol, 126 / 325
4J Founh IJnremorionoi Sy^rwosijnz on Environmental Degradotioi of MAierlu.lsin Nuclear Power Sysrem'- Water Re~tctor.r. t4ACE. pp, 4-59-4-75.[20] Andresen. P. L., and Cornpbell. P. G., 1989, "The Uffc(•' of Crack Closure inHigh Thmpcratuic Water and Ite Role in Inllueseing' CrTAck Closure Data,"Proceedisigs of the Fourth /ttmnationat Symposiunr on &mtironmental Degraodalion of Material x be Nuclear Power 5yeens' Wetter Reactrs, Jekyll lslectd,
NACER, pp. 4-86-4-110.[21] Gilman, I. D.. 1988, "Corrosion-Fatiguc CratA-Q-rowth Race. in Austeniie
Stainless Steels in Uigbh Water RPeactor F0nvirontmentn," 1w,. ], Prcemure Ve,4rFlKPiping, 31, pp. 55-68.
(22] Barrfdord, W. H4., 1979, "Fatigue Crack Growth of Staitless Steel Piping in aPress•riszed Water keacwtr Environient,' ASME J. Pres,%tsu Vesel T'hrcsrol.101, pp. 73-79.
(23] Culen, W. 9,, 1985, "Patiguc Crack Growtb Ra(en of Low-Carbon and Stain-ljeas Piping Steels in PWR (Pre.sutizod Water Reactor) Environmetnt,"NUREOUCR-3945, MEA,2055,[24] Bernard, 1, L., Slamsa, G.. and Rabbe, P., 1979, "'nflue(ce of PWR Environ-ment on Fatigue Crack Growth Behavior of Slainlexs Stelas," Time and LoaSdDep•endent Degrddation of Pts.fure Bouocdory Mcterlals, IWO.RRPC-79/2,Interancional Atomic Energy Agency, pp. 27-36.
[25)] Itstai, M., Aacno, M.. Yikuchi, M.. 5uzul. 3,, and lida, K. 2001. "'FatigueCrack Growth Curve for Ausletitic Stainless Steels in BWR Environmcnt,'"ASME J. Pressure Vessel TechnoL, 123. pp, 166-172(26] Gao, M.. Chen, S., and Wei, R. P, 1992, "Crack Paths, Micrnsutecture, andFatigue Crack Grnwth in Annealed and Cold-Rolled AISI 304 StainlessStce.l," MvieatI. Trans. A, Z3A. pp. 355-371.[27] Wei, R. P., and Gao, M_. 1993, "MiCroMechAnisat for Corrosion Fatigue CrackGrowth ire Metastable Ausmritiic Stainless Steels, " C,'irrrslon-Dbftnatietrn
In-terrrtio't Leas Editions de. Physique, tea Ulis, France, pp, 619-629.(28) Mills. W. I., and'James, L. A., 1988, "Fatigue Crack Propagation Behavior of'Type 316 Stainless Stee at Elevated Temperature in a Vacuum," Ilo. J. Va-tipse. 10, pp. 33-36.
[z2j Lacombe, P., and iBeraItgcr. C., 1993, "Structure and Elquilibrium Diagrams ofVarious Stainless Stoel Grades," Stainless Steels. Les Editions de Physique.Les Uls, France, pp. J5-58.
[30)] Kt'anne', V4., and l4akarainen, T., 1961, "On the Effeccs of a' MaNrtensite inHydrogen Ecmhrittletnetlt or a Cathudlcally Charged M4ST Type 304 AusteniticStainless Steel," Corrosion (R-Iuswtoc), 36. pp. 47-5t.
-x
2

326 / VoL 126, AUGUST 2004 o• ~~Transactions of the ASME.I:,
2
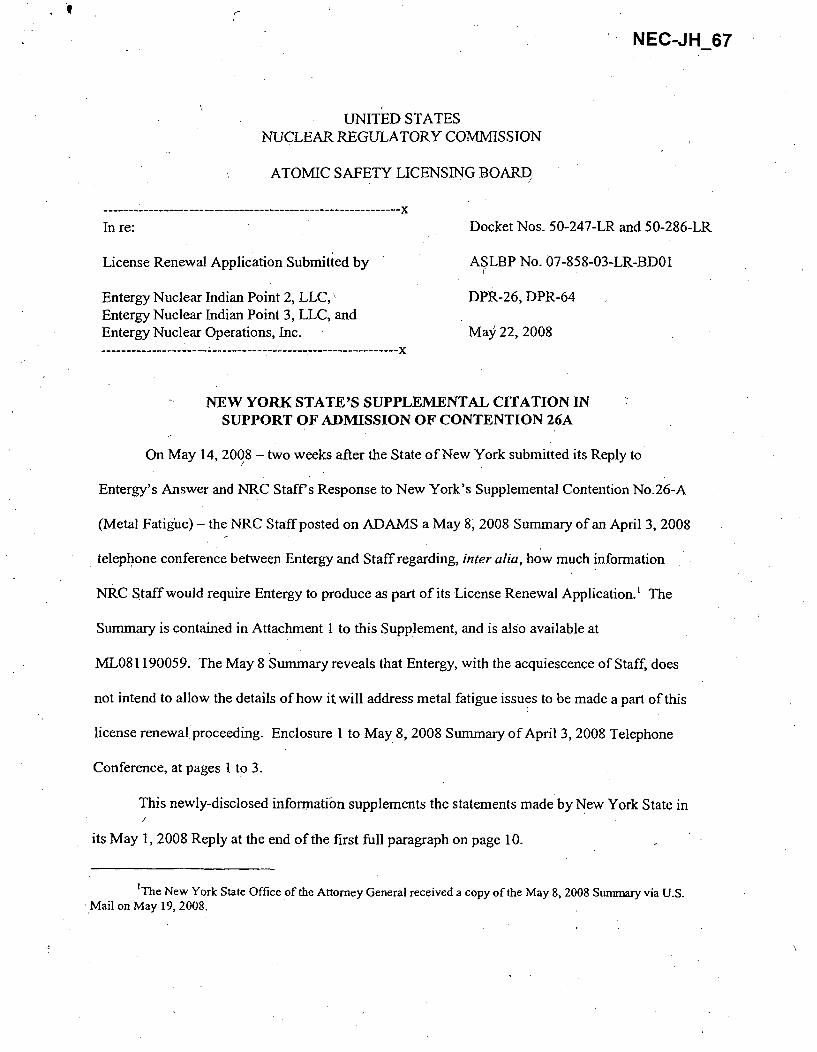
NEC-JH 67
UNITED STATESNUCLEAR REGULATORY COMMISSION
ATOMIC SAFETY LICENSING BOARD
-- -----.---------.................-------------------------- xIn re: Docket Nos. 50-247-LR and 50-286-LR
License Renewal Application Submitted by ASLBP No. 07-858-03-LR-BD01
Entergy Nuclear Indian Point 2, LLC, DPR-26, DPR-64Entergy Nuclear Indian Point 3, LLC, andEntergy Nuclear Operations, Inc. May 22, 2008
-------------------------- x
NEW YORK STATE'S SUPPLEMENTAL CITATION INSUPPORT OF ADMISSION OF CONTENTION 26A
On May 14, 2008 - two weeks after the State of New York submitted its Reply to
Entergy's Answer and NRC Staff's Response to New York's Supplemental Contention No.26-A
(Metal Fatigue) - the NRC Staff posted on ADAMS a May 8, 2008 Summary of an April 3, 2008
telephone conference between Entergy and Staff regarding, inter alia, how much information
NRC Staff would require Entergy to produce as part of its License Renewal Application.' The
Summary is contained in Attachment I to this Supplement, and is also available at
ML081190059. The May 8 Summary reveals that Entergy, with the acquiescence of Staff, does
not intend to allow the details of how it will address metal fatigue issues to be made a part of this
license renewal proceeding. Enclosure I to May 8, 2008 Summary of April 3, 2008 Telephone
Conference, at pages 1 to 3.
This newly-disclosed information supplements the statements made by New York State in/
its May 1, 2008 Reply at the end of the first full paragraph on page 10.
'The New York State Office of the Attorney General received a copy of the May 8, 2008 Sununary via U.S.Mail on May 19, 2008.
Respectfully submitted,May 22, 2008
J bk. SiposJanice A. DeanAssistant Attorneys GeneralOffice of the Attorney General
for the State of New YorkThe CapitolAlbany, New York 12224
,(518) [email protected]
Joan Leary MatthewsSenior Attorney for Special ProjectsNew York State Departmentof Environmental Conservation
625 Broadway, 14th floorAlbany, New York 12233-5500(518) [email protected]
John Louis Parker, Esq.Regional AttorneyNew York State Departmentof Environmental Conservation
21 South Putt Comers RdNew Paltz, NY 12561-1620
r
ATTACHMENT 1
NRC May 8, 2008 Summary of an -
April 3, 2008 telephone conference between Entergy and NRC Staff
also available at ML081190059
(
UNITED STATESNUCLEAR REGULATORY COMMISSION
wiZ WASHINGTON, D.C. 20555-0001
May 8, 2008
LICENSEE: Entergy Nuclear Operations, Inc.
FACILITY: Indian Point Nuclear Generating Unit Nos, 2 and 3
h._
SUBJECT:' SUMMARY OF TELEPHONE CONFERENCE CALL HELD ON APRIL 3,2008,BETWEEN THE U.S. NUCLEAR REGULATORYCOMMISSION AND ENTERGYNUCLEAR OPERATIONS, INC,, CONCERNING RESPONSES TO REQUESTFOR ADDITIONAL INFORMATION RELATED TO THE INDIAN POINT NUCLEARGENERATING UNIT NOS. 2 AND 3, LICENSE RENEWAL APPLICATION-METAL FATIGUE, BOLTED CONNECTIONSt AND BORAFLEX
The U.S. Nuclear Regulatory Commission (NRC or the staff) and repr~esentatives of EntergyNuclear operations. Inc., held a telephone -conferencecall on April 3, 2008, to discuss andc.,larify the staffs draft request for additional information (D-.RAI) concerning the Indian PointNuclear Generating Unit Nos. 2 and 3, license renewal application. The telephone conferencecall was useful in clarifying the intent of the staff's D-RAI.
Enclosure 1 provides a listing of the participants and Enclosure 2.contains a listing of theD-RAI items discussed with the applicant, including a brief description on the status of the items.
The applicant had an opportunity to comment on this summary.
Kimberly Green, Safety.Project ManagerProjects Branch 2DMsion. of License RenewalOffice obf Nuclear ReactorRegulation
Docket Nos. 50-24,7 and 50-286
Enclosures:1. List. of Participants2., Summary of Discussion
cc w/encls: See next pageTh
Indian Point Nuclear GeneratingUnits 2 and 3
cc:
Senior Vice PresidentEntergy Nuclear Operations, Inc.P.O. Box 31995Jackson, MS 39286-1995
Vice President OversightEntergy Nuclear Operations, Inc.P.O. Box 31995Jackson, MS 39286-1995
Senior Manager, Nuclear Safety &LicensingEntergy Nuclear Operations, Inc.P.O. Box 31995Jackson, MS 39286-1995
Senior Vice President and COOEntergy Nuclear Operations, Inc.440 Hamilton Avenue,White Plains, NY 10601
Assistant General CounselEntergy Nuclear Operations, Inc.440 Hamilton AvenueWhite Plains, NY 10601
Manager, LicensingEntergy Nuclear Operations, Inc.Indian Point Energy Center450 Broadway, GSBP.O. Box 249Buchanan, NY 10511-0249
Mr. Paul D. TonkoPresident and CEONew York State Energy Research and
Development Authority17 Columbia CircleAlbany, NY 12203-6399
Mr. John P. SpathNew York State Energy, Research and
Development Authority17 Columbia CircleAlbany, NY 12203-6399
Mr. Paul EddyNew York State Department
of Public Service3 Empire State PlazaAlbany, NY 12223-1350
Regional Administrator, Region IU.S. Nuclear Regulatory Commission475 Allendale RoadKing of Prussia, PA 19406
Senior Resident Inspector's OfficeIndian Point 2U.S. Nuclear Regulatory CommissionP.O. Box 59Buchanan, NY 10511
Senior Resident Inspector's OfficeIndian Point-3U.S. Nuclear Regulatory CommissionP.O. Box 59Buchanan, NY 10511
Mr. Charles Donaldson, EsquireAssistant Attorney GeneralNew York Department of Law120 BroadwayNew-York, NY 10271
Mr. Raymond L. AlbaneseFour County Coordinator200 Bradhurst AvenueUnit 4 Westchester CountyHawthorne, NY 10532
Mayor, Village of Buchanan236 Tate AvenueBuchanan, NY 10511
Indian Point Nuclear GeneratingUnits 2 and 3
cc:
Mr. William DiProfioPWR SRC Consultant48 Bear Hill RoadNewton, NH 03858
Mr. Garry RandolphPWR SRC Consultant1750 Ben Franklin Drive, 7ESarasota, FL 34236
Mr. William T. RussellPWR SRC Consultant400 Plantation LaneStevensville, MD 21666-3232
Mr. Jim RiccioGreenpeace702 H Street, NWSuite 300Washington, DC 20001
Mr. Phillip MusegaasRiverkeeper, Inc.828 South BroadwayTarrytown, NY 10591
Mr. Mark JacobsIPSEC46 Highland DriveGarrison, NY 10524
Mr. R. M. WatersTechnical Specialist Licensing450 BroadwayP.O. Box 0249Buchanan, NY 10511-0249
Mr. Sherwood Martinelli351 DyckmanPeekskill, NY 10566
Ms. Susan Shapiro, Esq.21 Perlman DriveSpring Valley, NY 10977
-2-
John SiposAssistant Attorney GeneralNew York State Department of LawEnvironmental Protection BureauThe CapitolAlbany, NY 12224
Robert SnookAssistant Attorney GeneralOffice of the Attorney GeneralState of Connecticut55 Elm StreetP.O. Box 120Hartford, CT 06.141-0120
Ms. Kathryn M. Sutton, Esq.Morgan, Lewis & Bockius, LLP1111 Pennsylvania Avenue, NWWashington, DC 20004
Mr. Paul M. Bessette, Esq.Morgan, Lewis &,Bockius, LLP1111 Pennsylvania Avenue, NWWashington, DC 20004
Mr. Martin J. O'Neill, Esq.Morgan, Lewis & Bockius, LLP1111 Pennsylvania Avenue, NWWashington, DC 20004
The Honorable Nita Lowey222 Mamaroneck Avenue, Suite 310White Plains, NY 10605
Joan Leary MatthewsSenior Counsel for Special ProjectsOffice of General CounselNYS Department of Environmental
Conservation -
625 BroadwayAlbany, NY 12233-5500
)
TELEPHONE CONFERENCE CALL KINDIAN POINT NUCLEAR GENERATING UNIT NOS. 2 AND 3
LICENSE RENEWAL APPLICATION
LIST OF PARTICIPANTSAPRIL 3, 2008
PARTICIPANTS
Kim Green
On Yee
Peter Wen
Jim Davis
Bo Pham
Jim Medhoff
Mike Stroud
Garry Young
Alan Cox
Ted Ivy
Don Fronabarger
Charlie Caputo
John Curry
Nelson Azevedo
Charlie Jackson
AFFILIATIONS
U.S. Nuclear Regulatory Commission (NRC)
NRC
NRC
NRC
NRC
NRC
Entergy Nuclear Operations, Inc. (Entergy)
Entergy
Entergy
Entergy
Entergy
,Entergy
Entergy
Entergy
Entergy
ENCLOSURE1
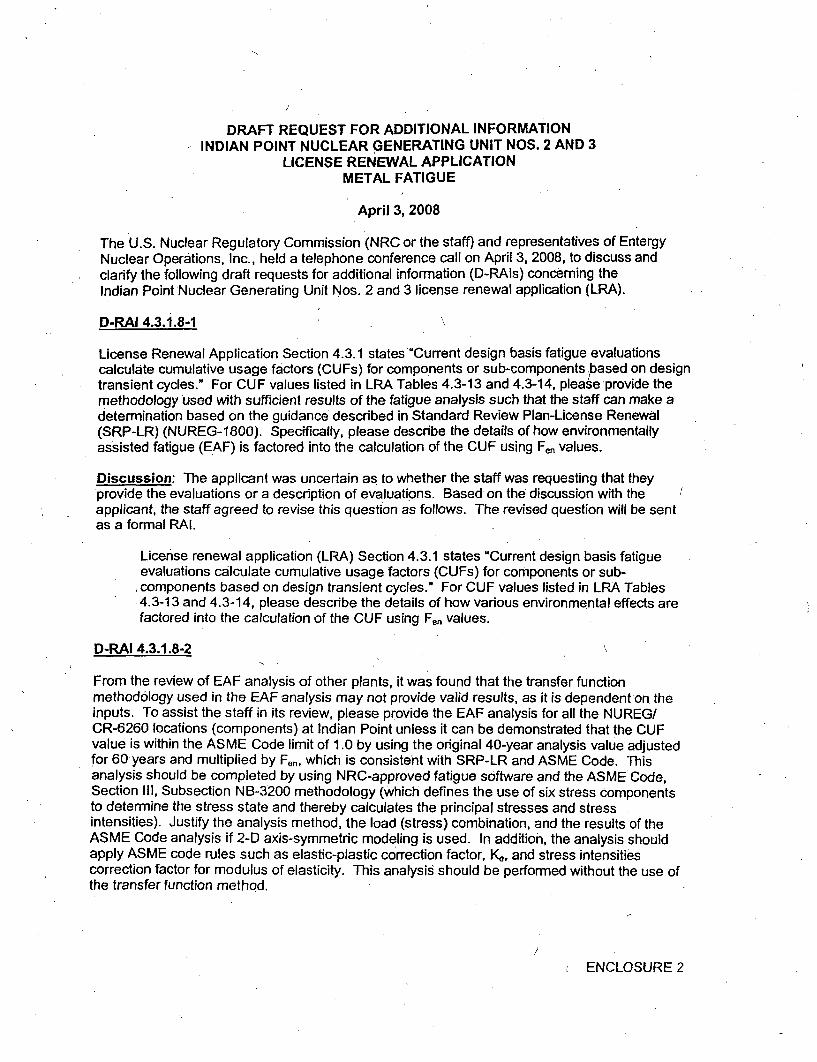
DRAFT REQUEST FOR ADDITIONAL INFORMATIONINDIAN POINT NUCLEAR GENERATING UNIT NOS. 2 AND 3
LICENSE RENEWAL APPLICATIONMETAL FATIGUE
April 3, 2008
The U.S. Nuclear Regulatory Commission (NRC or the staff) and representatives of EntergyNuclear Operations, Inc., held a telephone conference call on April 3, 2008, to discuss andclarify the following draft requests for additional information (D-RAIs) concerning theIndian Point Nuclear Generating Unit Nos. 2 and 3 license renewal application (LRA).
D-RAI 4.3.1.8-1
License Renewal Application Section 4.3.1 states "Current design basis fatigue evaluationscalculate cumulative usage factors (CUFs) for components or sub-components ,based on designtransient cycles." For CUF values listed in LRA Tables 4.3-13 and 4.3-14, please provide themethodology used with sufficient results of the fatigue analysis such that the staff can make adetermination based on the guidance described in Standard Review Plan-License Renewal(SRP-LR) (NUREG-1800). Specifically, please describe the details of how environmentallyassisted fatigue (EAF) is factored into the calculation of the CUF using Fen values.
Discussion: The applicant was uncertain as to whether the staff was requesting that theyprovide the evaluations or a description of evaluations. Based on the discussion with theapplicant, the staff agreed to revise this question as follows. The revised question will be sentas a formal RAI.
License renewal application (LRA) Section 4.3.1 states "Current design basis fatigueevaluations calculate cumulative usage factors (CUFs) for components or sub-
,components based on design transient cycles." For CUF values listed in LRA Tables4.3-13 and 4.3-14, please describe the details of how various environmental effects arefactored into the calculation of the CUF using Fen values.
D-RAI 4.3.1.8-2 N
From the review of EAF analysis of other plants, it was found that the transfer functionmethodology used in the EAF analysis may not provide valid results, as it is dependent on theinputs. To assist the staff in its review, please provide the EAF analysis for all the NUREG/CR-6260 locations (components) at Indian Point unless it can be demonstrated that the CUFvalue is within the ASME Code limit of 1.0 by using the original 40-year analysis value adjustedfor 60 years and multiplied by Fen, which is consistent with SRP-LR and ASME Code. Thisanalysis should be completed by using NRC-approved fatigue software and the ASME Code,Section III, Subsection NB-3200 methodology (which defines the use of six stress componentsto determine the stress state and thereby calculates the principal stresses and stressintensities). Justify the analysis method, the load (stress) combination, and the results of theASME Code analysis if 2-D axis-symmetric modeling is used. In addition, the analysis shouldapply ASME code rules such as elastic-plastic correction factor, K,, and stress intensitiescorrection factor for modulus of elasticity. This analysis should be performed without the use ofthe transfer function method.
ENCLOSURE 2
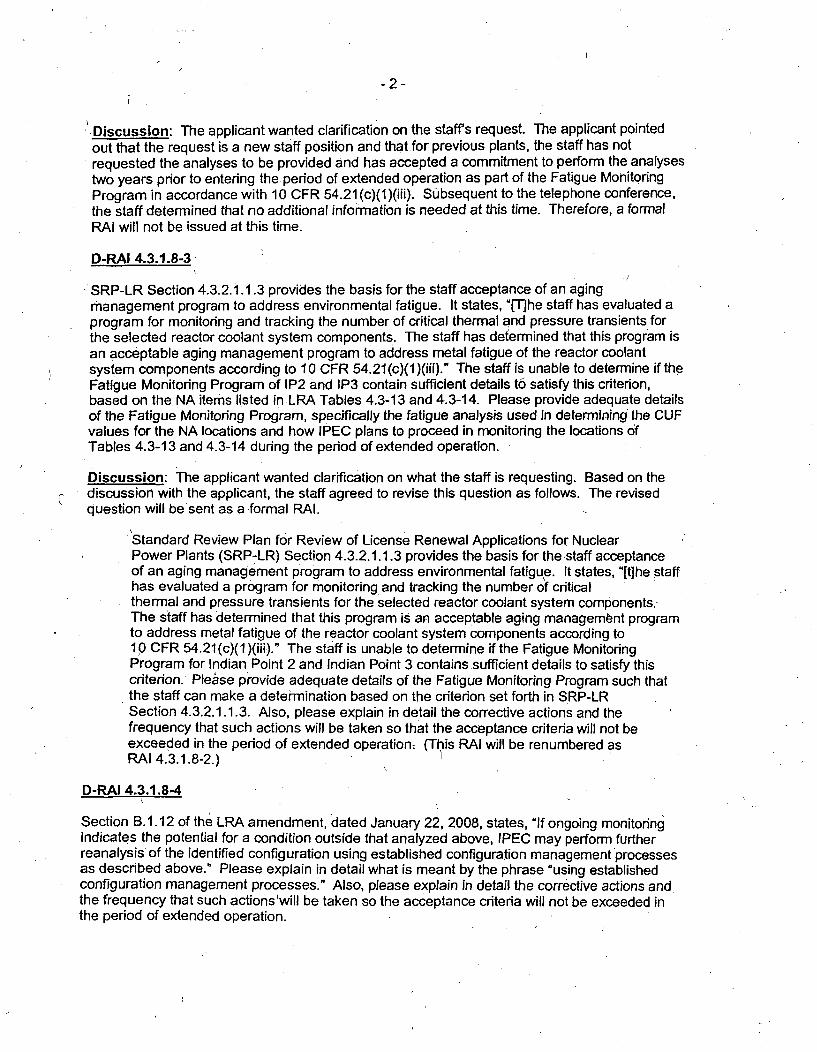
Discussion: The applicant wanted clarification on the staff's request The applicant pointedout that the request is a new staff position and that for previous plants, the staff has notrequested the analyses to be provided and has accepted a commitment to perform the analysestwo years prior to entering the period of extended operation as part of the Fatigue MonitoringProgram in accordance with 10 CFR 54.21 (c)(1)(iii). Subsequent to the telephone conference,the staff determined that no additional information is needed at this time. Therefore, a formalRAI will not be issued at this time.
D-RAJ 4.3.1.8-3
SRP-LR Section 4.3.2.1.1.3 provides the basis for the staff acceptance of an agingmanagement program to address environmental fatigue. It states, "[Tihe staff has evaluated aprogram for monitoring and tracking the number of critical thermal and pressure transients forthe selected reactor coolant system components. The staff has determined that this program isan acceptable aging management program to address metal fatigue of the reactor coolantsystem components according to 10 CFR 54.21(c)(1 )(iii)." The staff is unable to determine if theFatigue Monitoring Program of IP2 and IP3 contain sufficient details to satisfy this criterion,based on the NA items listed in LRA Tables 4.3-13 and 4.3-14. Please provide adequate detailsof the Fatigue Monitoring Program, specifically the fatigue analysis used in determining the CUFvalues for the NA locations and how IPEC plans to proceed in monitoring the locations ofTables 4.3-13 and 4.3-14 during the period of extended operation.
Discussion: The applicant wanted clarification on what the staff is requesting. Based on thediscussion with the applicant, the staff agreed to revise this question as follows. The revisedquestion will be sent as a formal RAI.
Standard Review Plan for Review of License Renewal Applications for NuclearPower Plants (SRP-LR) Section 4.3.2.1.1.3 provides the basis for the.staff acceptanceof an aging management program to address environmental fatigue. It states, "[tjhe staffhas evaluated a program for monitoring and tracking the number of criticalthermal and pressure transients for the selected reactor coolant system components.-The staff has determined that this program is an acceptable aging management programto address metal fatigue of the reactor coolant system components according to10 CFR 54.21(c)(1)(iii)." The staff is unable to determine if the Fatigue MonitoringProgram for Indian Point 2 and Indian Point 3 contains sufficient details to satisfy thiscriterion. Please provide adequate details of the Fatigue Monitoring Program such thatthe staff can make a determination based on the criterion set forth in SRP-LRSection 4.3.2.1.1.3. Also, please explain in detail the corrective actions and thefrequency that such actions will be taken so that the acceptance criteria will not beexceeded in the period of extended operation; (This RAI will be renumbered asRAI 4.3.1.8-2.)
D-RAI 4.3.1.8-4
Section B.1.12 of the LRA amendment, dated January 22, 2008, states, "If ongoing monitoringindicates the potential for a condition outside that analyzed above, IPEC may perform furtherreanalysis of the identified configuration using established configuration management processesas described above." Please explain in detail what is meant by the phrase "using establishedconfiguration management processes." Also, please explain in detail the corrective actions andthe frequency that such actions'will be taken so the acceptance criteria will not be exceeded inthe period of extended operation.
-3-
Discussion: The applicant stated that it was unclear about the staffs request regarding"configuration management processes." In a subsequent call, the applicant explained that theconfiguration management processes referred to are those governed by its 10 CFR Part 50,Appendix B Quality Assurance program, and include design input verification and independentreviews which ensure that valid assumptions, transients, cycles, external loadings, analysismethods, and environmental fatigue life correction factors will be used in the fatigue analyses.Therefore, this portion of question is withdrawn and will not be sent as a formal RAI. Theportion of the request that deals with corrective actions will be added to RAI 4.3.1.8-2 (asrenumbered).
Non-EQ Bolted Cable Connection AMP
D-RAI 3.0.3.3.6-1
-With regard to Indian Point Aging Management Program (AMP) B.1.22, "Non-EQ Bolted CableConnection Program," the license renewal application states that inspection methods mayinclude thermography, contact resistance testing, or other appropriate methods including visual,based on plant configuration and industry guidance. In Generic Aging Lessons Learned (GALL)AMP XI.E6, the staff recommends thermography, contact resistance testing, or other'appropriate methods based on plant configuration and industry guidance for detecting loss ofpreload or bolt loosening. In the case where visual inspection will be the only method used,provide a technical basis of how this will be sufficient to detect loss of preload or loosening ofbolted connections.
Discussion: The applicant stated that this question is similar to an audit question that has beenanswered and subsequently discussed during two telephone conferences. This issue is beingreviewed by the Division of Engineering and, therefore, is withdrawn at this time., However,when the staff has reached a determination, a formal RAI may be issued at such time.
Boraflex AMP-
D-RAI 3.0.3.2.3-1
Indian Point 2 Updated Final Safety Analysis Report, Revision 20, dated 2006, Section 14.2.1on page 55 of 218, states in part that:
"Northeast Technology Corporation report NET-173-01 and NET-1 71-02 arebased on conservative projections of amount of boraflex absorber paneldegradation assumed in each sub-region. These projections are valid through theend of the year 2006."
Please confirm that the Boraflex neutron absorber panels in the Indian Point Unit 2 spent fuelpool have been re-evaluated for service through the end of the current licensing period. Also,please discuss the plans for updating the Boraflex analysis during the period of extendedoperation.
Discussion: The applicant indicated that the question is clear. This D-RAI will be sent as aformal RAI.
UNITED STATES OF AMERICANUCLEAR REGULATORY COMMISSION
ATOMIC SAFETY LICENSING BOARD
-2-------------------------- 6
Docket Nos. 50-247-LR and 50-286-LRIn re:
License Renewal Application Submitted by
Entergy Nuclear Indian Point 2, LLC,Entergy Nuclear Indian Point 3, LLC, andEntergy Nuclear Operations, Inc.
--------------------------. x
ASLBP No. 07-858-03-LR-BDO0
DPR-26, DPR-64
CERTIFICATE OF SERVICE
Pursuant to 28 U.S.C. § 1746 Teresa Fountain hereby declares:
I am over 18 years old and am an employee in the New York State Office of the AttorneyGeneral.
I hereby certify that on May 22, 2008, copies of "The State of New York's SupplemenitalCitation In Support of Contention 26A" were served upon the following persons via electronicmail and by deposit in the U.S. Postal Service with first class postage:
Lawrence G. McDade, ChairAdministrative JudgeAtomic Safety and Licensing Board PanelU.S. Nuclear Regulatory CommissionMailstop 3 F23Two White Flint North11545 Rockville PikeRockville, MD [email protected].
Richard E. WardwellAdministrative JudgeAtomic Safety and Licensing Board PanelU.S. Nuclear Regulatory CommissionMailstop 3 F23Two White Flint North11545 Rockville PikeRockville, MID [email protected]
Kaye D. LathropAdministrative JudgeAtomic Safety and Licensing Board PanelU.S. Nuclear Regulatory Commission190 Cedar Lane E.Ridgway, CO [email protected]
Atomic Safety and Licensing Board PanelU.S. Nuclear Regulatory CommissionMailstop 3 F23Two White Flint North11545 Rock-ville PikeRockville, MD 20852-2738
Zachary S. Kahn, Esq.Law ClerkAtomic Safety and Licensing Board PanelU.S. Nuclear Regulatory CommissionMailstop 3 F23Two White Flint North11545 Rockville PikeRockville, MD [email protected]
-1-
Marcia CarpentierLaw ClerkAtomic Safety and Licensing Board PanelU.S. Nuclear Regulatory CommissionMailstop 3 E2BTwo White Flint North11545 Rockville Pike.Rockville, MD [email protected]
Office of Commission Appellate AdjudicationU.S. Nuclear Regulatory Commission
* Mailstop 16 G4One White Flint North11555 Rockville PikeRockville, MD [email protected]
Office of the SecretaryAttn: Rulemaking and Adjudications StaffU.S. Nuclear Regulatory CommissionMailstop 3 F23Two White Flint North11545 Rockville PikeRockville, MD [email protected]
Sherwin E. Turk, Esq.David E. Roth, Esq.Marcia J. Simon, Esq.Beth N. Mizuno, Esq.Jessica A. Bielecki, Esq.Office of the General CounselU.S. Nuclear Regulatory CommissionMailstop 15 D21One White Flint North11555 Rockville PikeRockville, MD 20852-2738set@[email protected]@nrc.govbnm [email protected]@nrc.gov
Kathryn M. Sutton, Esq.Paul M. Bessette, Esq.Martin J. O'Neill, Esq.Mauri T. Lemoncelli, Esq.Morgan, Lewis & Bockius LLP1111 Pennsylvania Avenue, NWWashington, DC [email protected]@morganlewis.commartin.o'[email protected]@[email protected]
Elise N. Zoli, Esq.Goodwin Procter, LLPExchange Place53 State StreetBoston, MA [email protected]
WilliamC. Dennis, Esq.Assistant General CounselEntergy Nuclear Operations, Inc.440 Hamilton Avenue /White Plains, NY [email protected]
Robert D.- Snook, Esq.Assistant Attorney GeneralOffice of the Attorney GeneralState of Connecticut55 Elm StreetP.O. Box 120Hartford, CT [email protected]
Justin D. Pruyne, Esq.Assistant County AttorneyOffice of the Westchester County AttorneyMichaelian Office Building148 Martine Avenue, 6th FloorWhite Plains, NY [email protected]
Daniel E. O'Neill, MayorJames Seirmarco, M.S.Village of BuchananMunicipal Building236 Tate AvenueBuchanan, NY [email protected]
Daniel Riesel, Esq.Thomas F. Wood, Esq.Jessica Steinberg, J.D.Sive, Paget & Riesel, P.C.460 Park AvenueNew York, NY [email protected]@sprlaw.com
Michael J. Delaney, Esq.Vice President - Energy DepartmentNew York City Economic Development Corporation(NYCEDC) • "I 10 William StreetNew York, NY [email protected]
-2- )
Arthur J. Kremer, ChairmanNew York Affordable Reliable Electricity Alliance(AREA)347 Fifth Avenue, Suite 508New York, NY [email protected]@rnfpc.com
Manna Jo Greene, DirectorHudson River Sloop Clearwater, Inc.112 Little Market St.Poughkeepsie, NY [email protected]
Stephen Filler, Esq.Board MemberHudson River Sloop Clearwater, Inc.Suite 222303 South BroadwayTarrytown, NY [email protected]
Susan H. Shapiro, Esq.Wesehester Citizen's Awareness Network(WestCan), Citizens Awareness Network (CAN),etc.21 Perlman DriveSpring Valley, NY [email protected]
Nancy Burton147 Cross HighwayRedding Ridge, CT [email protected]
Richard L. Brodsky, Esq.AssemblymanSuite 2055 West Main StreetElmsford, NY [email protected]@msn.com
Sarah L. Wagner, Esq.Room 422Legislative Office BuildingAlbany, NY [email protected]
John LeKayFUSE USA351 Dyckman StreetPeekskill, NY 10566fus'[email protected]
Diane Curran, Esq.Harmon, Curran, Spielberg & Eisenberg, LLPSuite 6001726 M Street, NWWashington, DC [email protected]
Phillip Musegaas, Esq.Victor Tafur, Esq.Riverkeeper, Inc.828 South BroadwayTarrytown, NY [email protected]@riverkeeper.org
I declare under penalty of perjury that the foregoing is true and correct.
Executed on:
this 22nd day of May 2008Albany, New York
Teresa Fountain
-3-
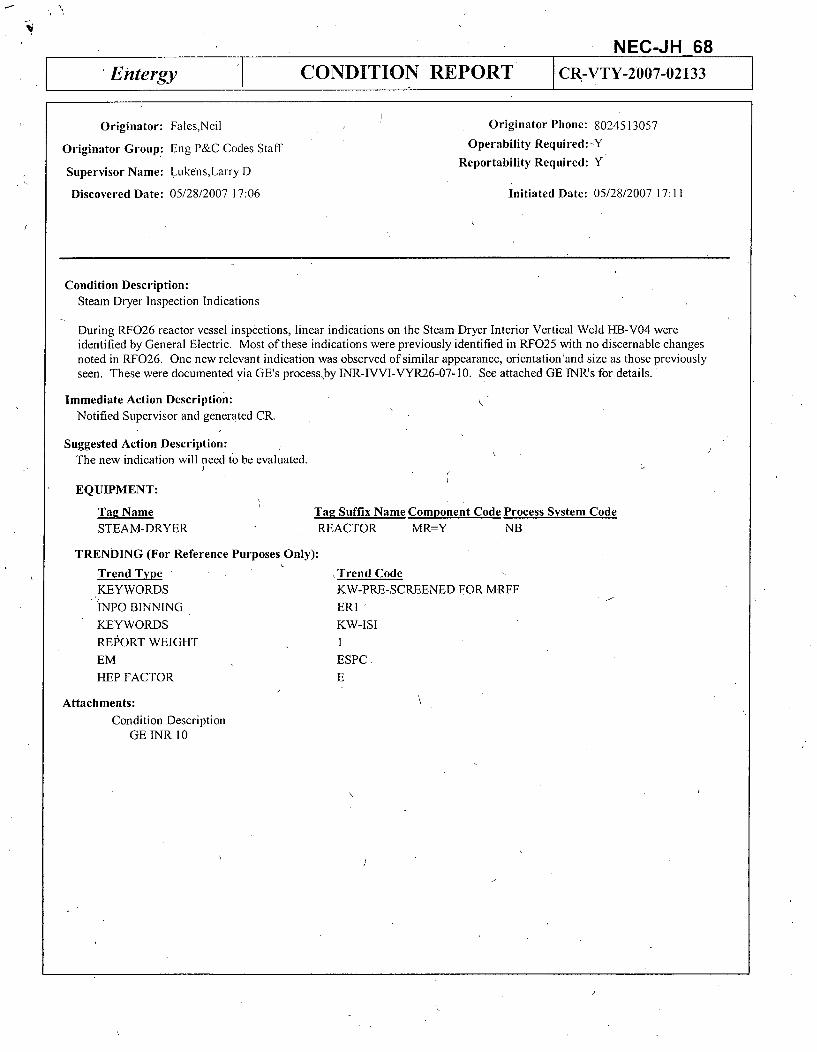
NEC-JH 68
Entergy CONDITION REPORT CR-VTY-2007-02133
Originator: Fales,Neil
Originator Group: Eng P&C Codes Staff
Supervisor Name: LukensLarry D
Discovered Date: 05/28/2007 17:06
Originator Phone:ý 8024513057
Operability Required&-Y
Reportability Required: Y
Initiated Date: 05/28/2007 17:11
Condition Description:
Steam Dryer Inspection Indications
During RF026 reactor vessel inspections, linear indications on the Steam Dryer Interior Vertical Weld HB-V04 wereidentified by General Electric. Most of these indications were previously identified in RFO25 with no discernable changesnoted in RF026. One new relevant indication was observed of similar appearance, orientation 'and size as those previouslyseen. These were documented via GE's process~by INR-IVVI-VYR26-07-10. See attached GE INR's for details.
Immediate Action Description:Notified Supervisor and generated CR.
Suggested Action Description:The new indication will need to be evaluated.
EQUIPMENT:
Tag Name T
STEAM-DRYER
TRENDING (For Reference Purposes Only):
Trend TypeKEYWORDS
INPO BINNING
KEYWORDS
REPORT WEIGHT
EM
HEP FACTOR
ag Suffix Name Component Code Process System CodeREACTOR MR=Y NB
,Trend CodeKW-PRE-SCREENED FOR MRFF
ER1 '
KW-ISII
ESPC
E
Attachments:
Condition DescriptionGE INR 10
Entergy ADMIN I CR-VTY-2007-02133
Initiated Date: 5/28/2007 17:11 Owner Group :Eng P&C Codes Mgmt
Current Contact: vw
Current Significance: 'C - INVEST & CORRECT
Closed by: Taylor,James M ) . 6/18/2007 16:06
Summary Description:Steam Dryer Inspection Indications
During RF026 reactor vessel inspections, linear indications on the Steam Dryer Interior VerticalWeld HB-V04 wereidentified by General Electric. Most of these indications were previously identified in RF025 with no discernable changesnoted in RF026. One new relevant indication was observed of similar appearance, orientation and size as those previouslyseen. These were documented via GE's process by JNR-IVVI-VYR26-07-10. See attached GE INR's for details.
Remirks Description:
Closure Description:CR closure review performed.
y
..)

Attachment Header
Document Name:
luntitled
Document Location
j~ondition Description
Attach Title:
jGE INR 10
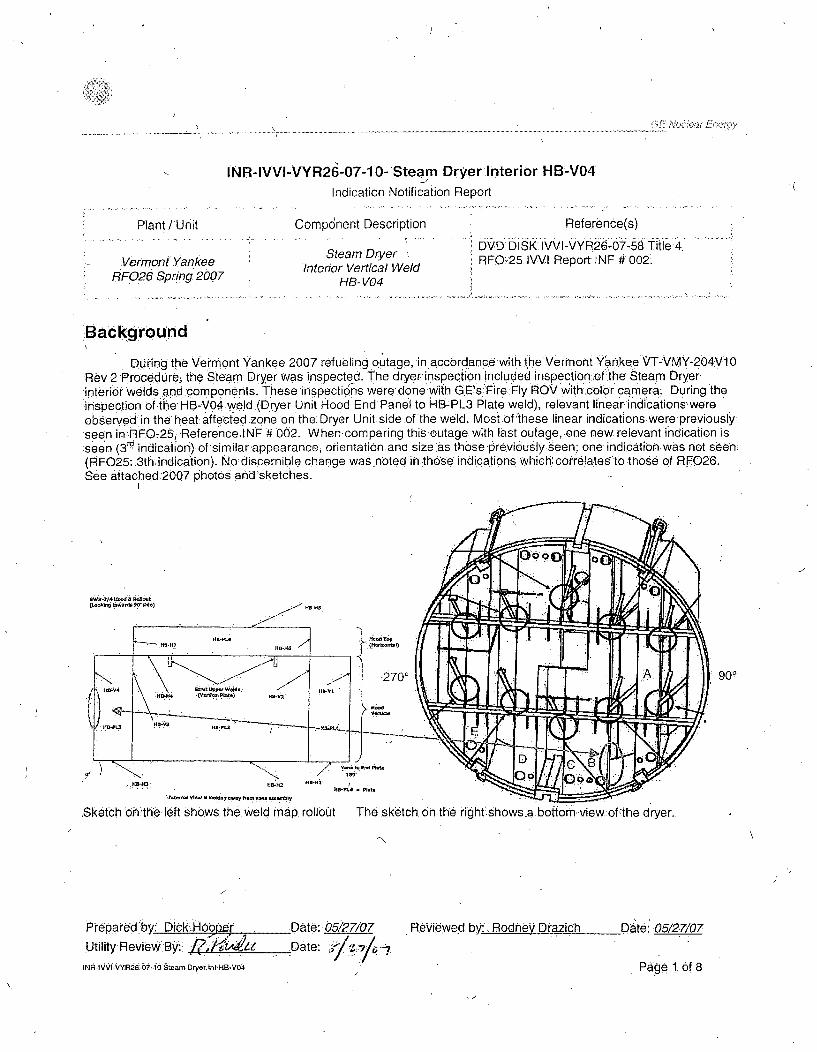
INIR-IVVI-VYR26-07-1 0- Steam Dryer Interior HB-V04
Indication Notification Report
Plant/ Unit
Vermont .YankeeRF026 Spring 2007
Comp6nent Description
Steam DryerInterior Vertical Weld
HB-V04
Reference(s). .. . . ... . . ... . .. .. ..... .. . . ... . . .. . . .... . . . . . . . . .. ..... ...... . .
DVD DISK IVVI-VYR26-07-58 Title 4RFO-25 IVVI Report INF # 002.
Background
During the Veirmont Yankee 2007 refueling outage, in accordance with the Vermont Yankee VT-VMY-204V10Rev 2 Procedurej the Steam Dryer was inspected. The dryer inspection included inspection. of the Steam Dryerinterior welds and components. These inspectio6ns were done with G.E'sFire.Fly ROV withcolor camera During theinspection of the HB-V04 weld (Dryer Unit Hood End Panel to HB-PL3 Plate weld), relevant linear.indicationsvwere
observed in the heat affected.zone on the: Dryer Unit side of the weld. Most.of these linear indications were previously*seen in:.RFO-25, Reference-INF # 002. When comparing this outage with last outage,.one new relevant indication isseen (300 indication) of similar appearance, orientation and size as those previ6usly.seen; one indication was not seen.(RFO25. 3th:.indication). No discernible change was noted in those indications which correlates to those of RF026.See attached 2007 photos and sketches.
SW R3 n t
tone, e an r Top
. 2700 A 90
.Sketch on the left shows the weld mnap. rollout The sketch, on the right'shows a. bottom% view of~the dryer.
N
Prepared'by Dick..Hoopr . Date: 05127/07
Utility Review. By: ___________Date: i ,
INR4-VVI-VYR26807-1O Steam Dryer lot HB.V04
Reviewed by: .Rodney Drazich Date- 0512_7/07
Page !. of. 8
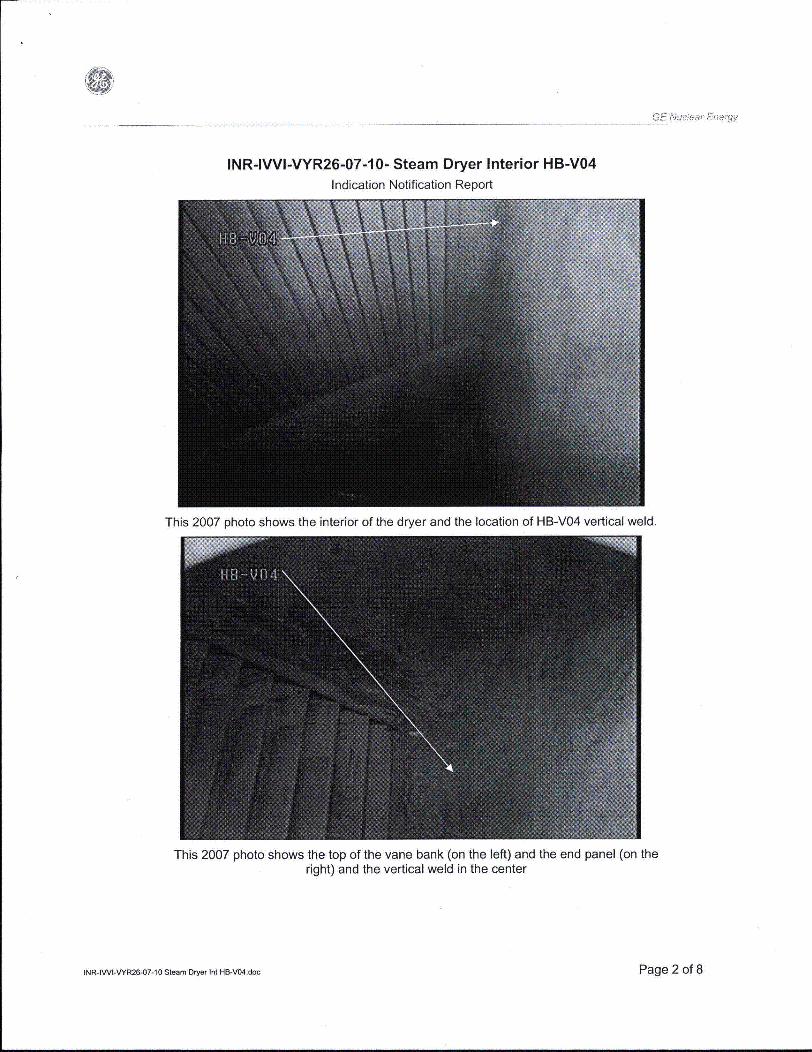
GE Nucre ea- ETer"gy
INR-IVVI-VYR26-07-10- Steam Dryer Interior HB-V04Indication Notification Report
This 2007 photo shows the interior of the dryer and the location of HB-V04 vertical weld.
This 2007 photo shows the top of the vane bank (on the left) and the end panel (on theright) and the vertical weld in the center
INR-IWI-VYR26-07-10 Steam Dryer Int HB-V04.doc Page 2 of 8
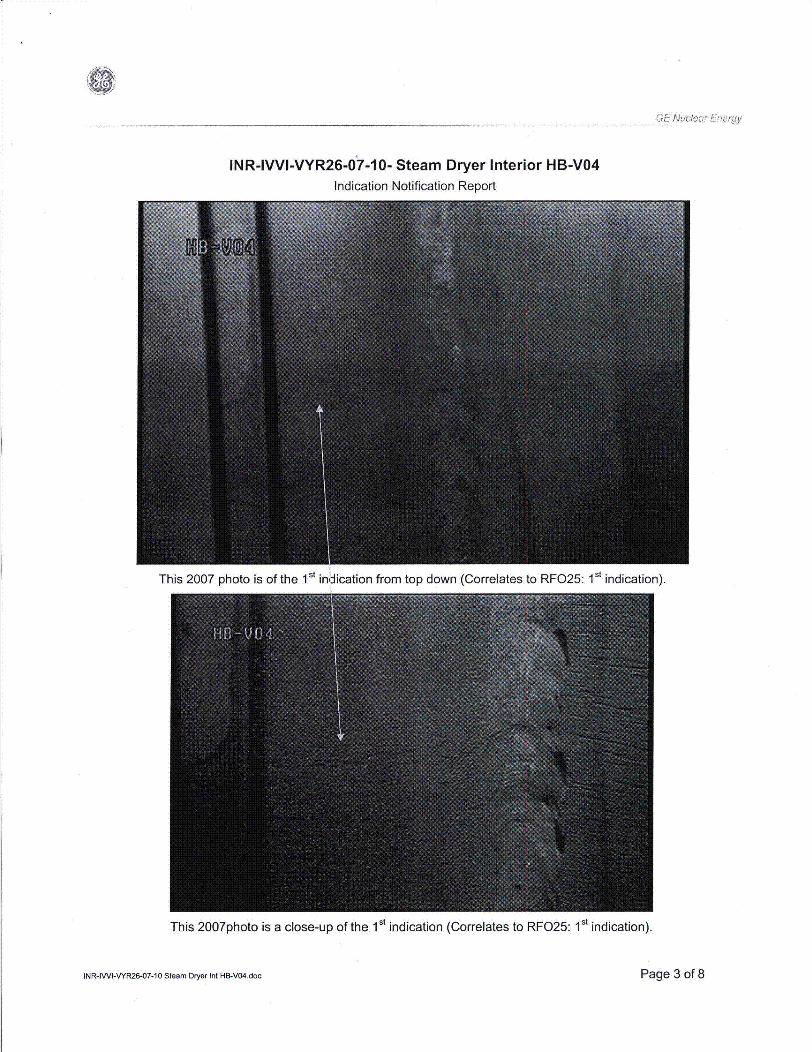
GE Nuclear E7ergy
INR-IVVI-VYR26-07-10- Steam Dryer Interior HB-V04Indication Notification Report
This 2007 photo is of the 1st indication from top down (Correlates to RF025: 1 st indication).
This 2007photo is a close-up of the 1 s indication (Correlates to RF025: 1 st indication).
INR-IWI-VYR26-07-10 Steam Dryer Int HB-V04.doc Page 3 of 8
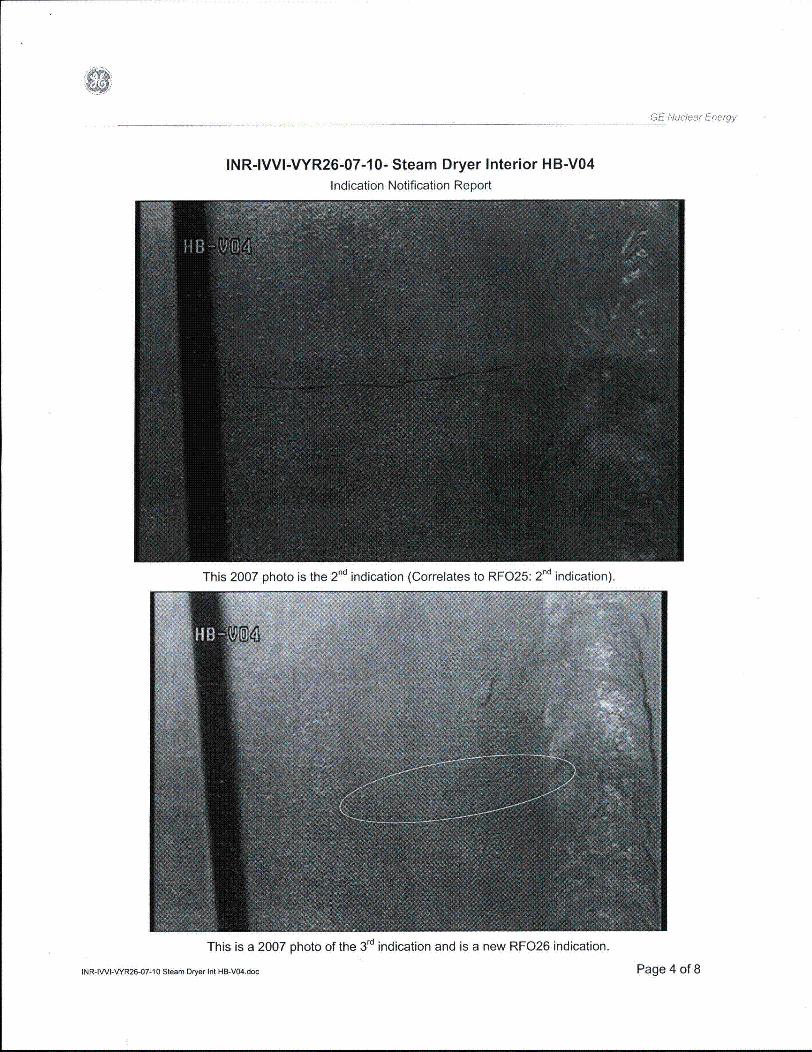
GE Nuiuea! Eýeqiy
INR-IVVI-VYR26-07-10- Steam Dryer Interior HB-V04Indication Notification Report
This 2007 photo is the 2 nd indication (Correlates to RF025: 2 nd indication).
This is a 2007 photo of the 3 rd indication and is a new RF026 indication.
INR-IWI-VYR26-07-10 Steam Dryer Int HB-V04.doc Page 4 of 8
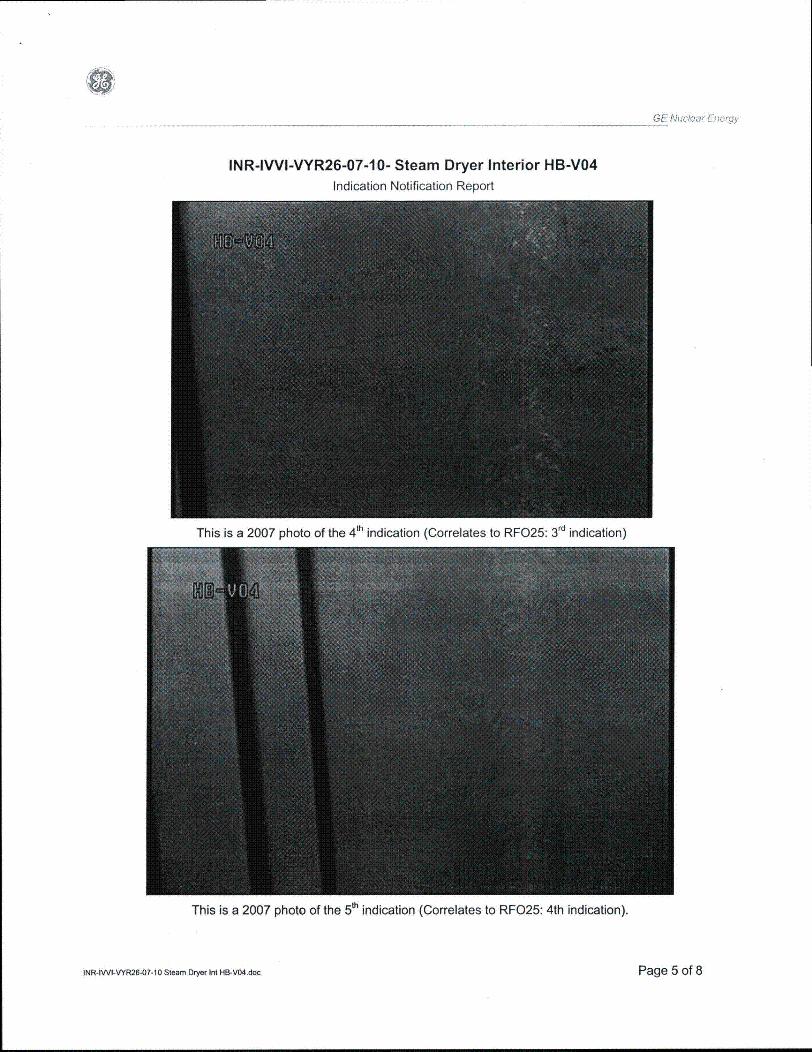
GE Nclear EUeru,ý
INR-IWI-VYR26-07-10- Steam Dryer Interior HB-V04Indication Notification Report
This is a 2007 photo of the 4 th indication (Correlates to RF025: 3 rd indication)
This is a 2007 photo of the 5th indication (Correlates to RF025: 4th indication).
INR-IWI-VYR26-07-10 Steam Dryer Int HB-VO4.doc Page 5 of 8
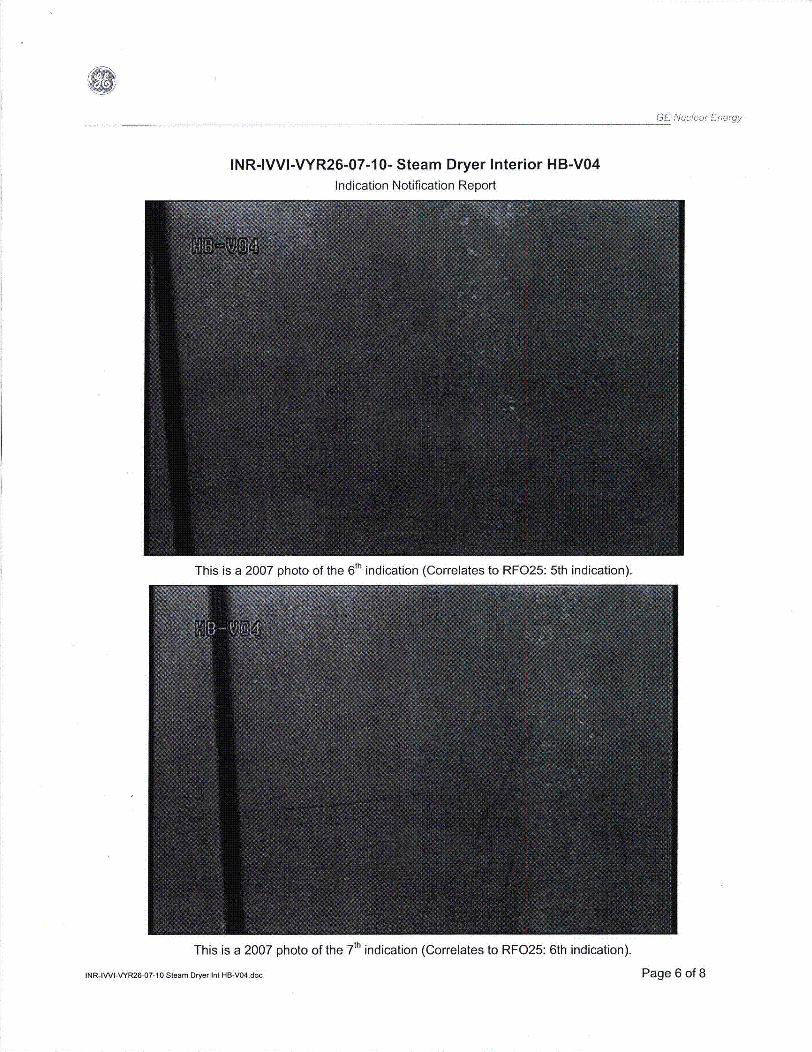
INR-IVVI-VYR26-07-1 0- Steam Dryer Interior HB-V04Indication Notification Report
This is a 2007 photo of the 6 th indication (Correlates to RF025: 5th indication).
This is a 2007 photo of the 7 th indication (Correlates to RF025: 6th indication).
INR-IWI-VYR26-07-10 Steam Dryer Int HB-V04.doc Page 6 of 8
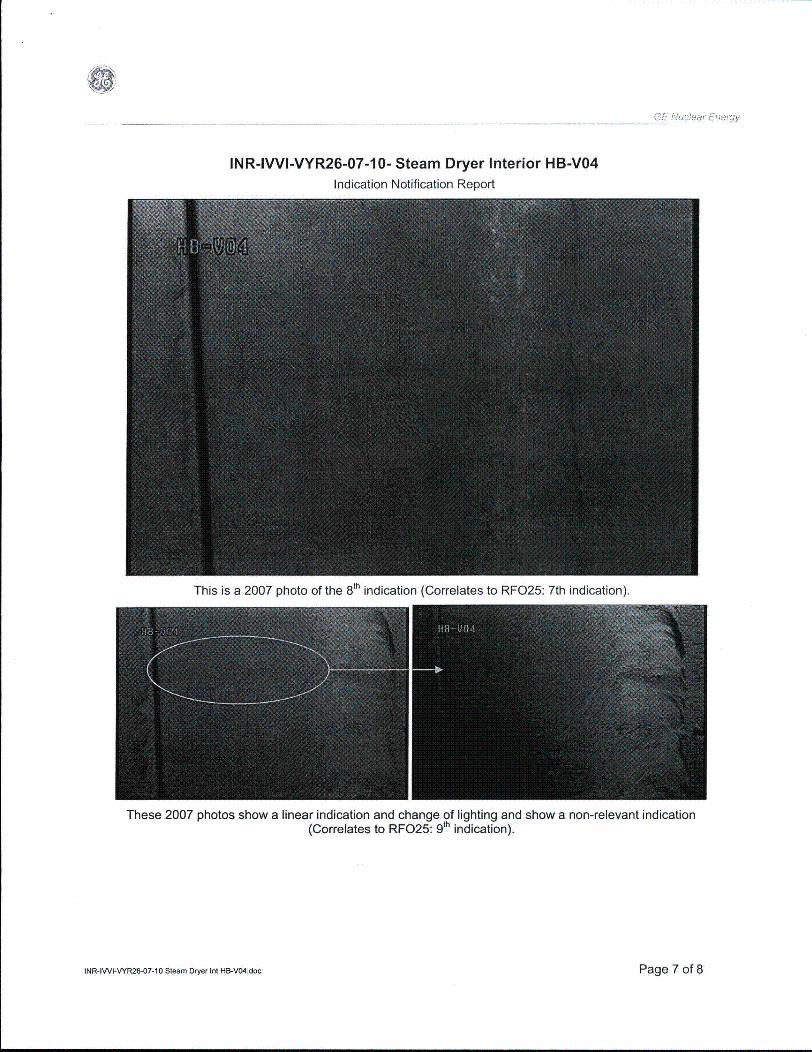
INR-IWI-VYR26-07-10- Steam Dryer Interior HB-V04Indication Notification Report
This is a 2007 photo of the 8th indication (Correlates to RF025: 7th indication).
These 2007 photos show a linear indication and change of lighting and show a non-relevant indication(Correlates to RF025: 91 indication).
INR-IWI-VYR26-07-10 Steam Dryer Int HB-V04.doc Page 7 of 8
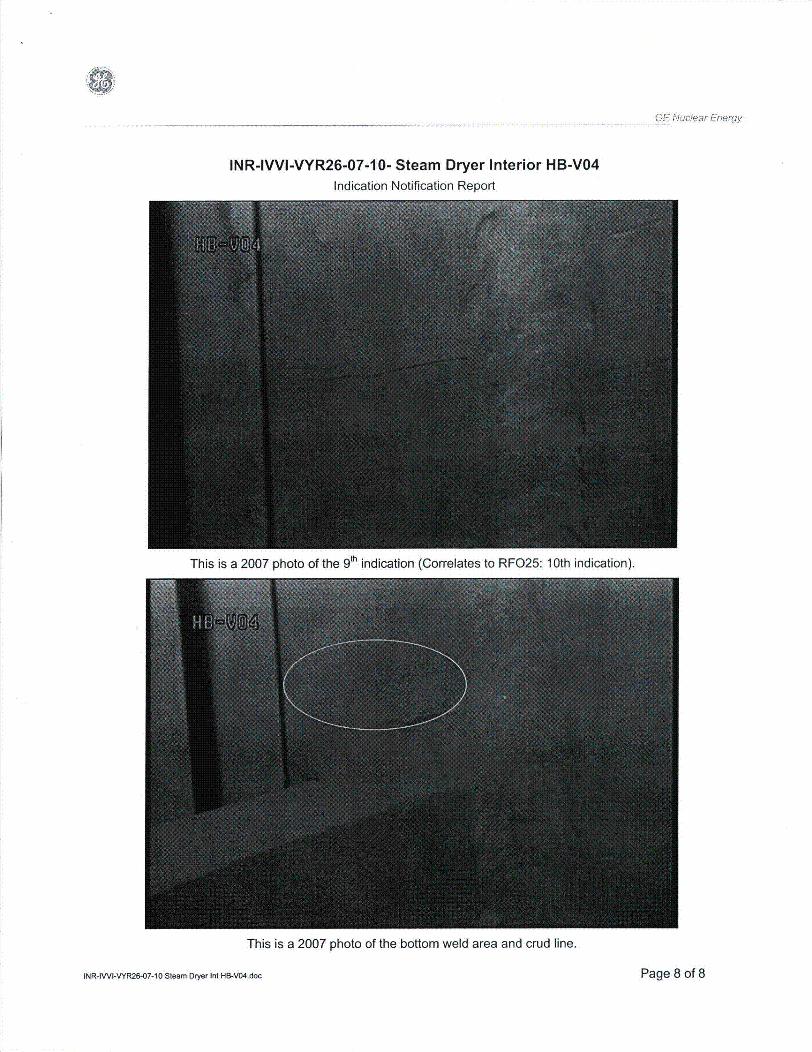
.. . .. .. . ...____GE Nuclear Energy
INR-IVVI-VYR26-07-10- Steam Dryer Interior HB-V04Indication Notification Report
This is a 2007 photo of the 9 th indication (Correlates to RF025: 10th indication).
This is a 2007 photo of the bottom weld area and crud line.
INR-IWI-VYR26-07-10 Steam Dryer tnt HB-V04.doc Page 8 of 8
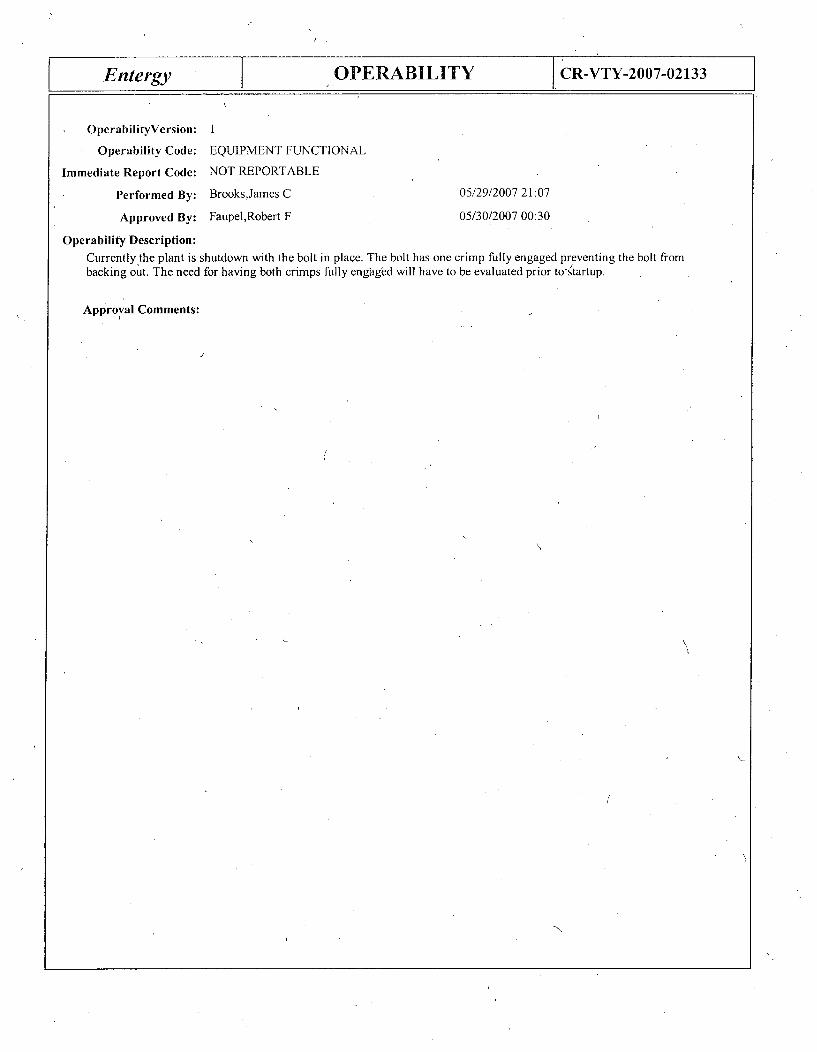
Entergy OPERABILITY CR-VTY-2007-02133
OperabilityVersion: 1
Operability Code: EQUIPMENT FUNCTIONAL
Immediate Report Code: NOT REPORTABLE
Performed By: Brooks,James C 05/29/2007 21:07
Approved By: Faupel,Robert F 05/30/2007 00:30
Operability Description:
Currently the plant is shutdown with the bolt in place. The bolt has one crimp fully engaged preventing the bolt frombacking out. The need for having both crimps frilly engaged will have to be evaluated prior to-startup.
Approval Comments:

ntergyA S S I G N M E N S CR-VTY-2007-02133
Version: 2
Significance Code: C - INVEST & CORRECT
Classification Code: C
Owner Group: Eng P&C Codes Mgmt
Performed By: Wren,Vedrana
Assignment Description:
05/30/2007 13:04
I I
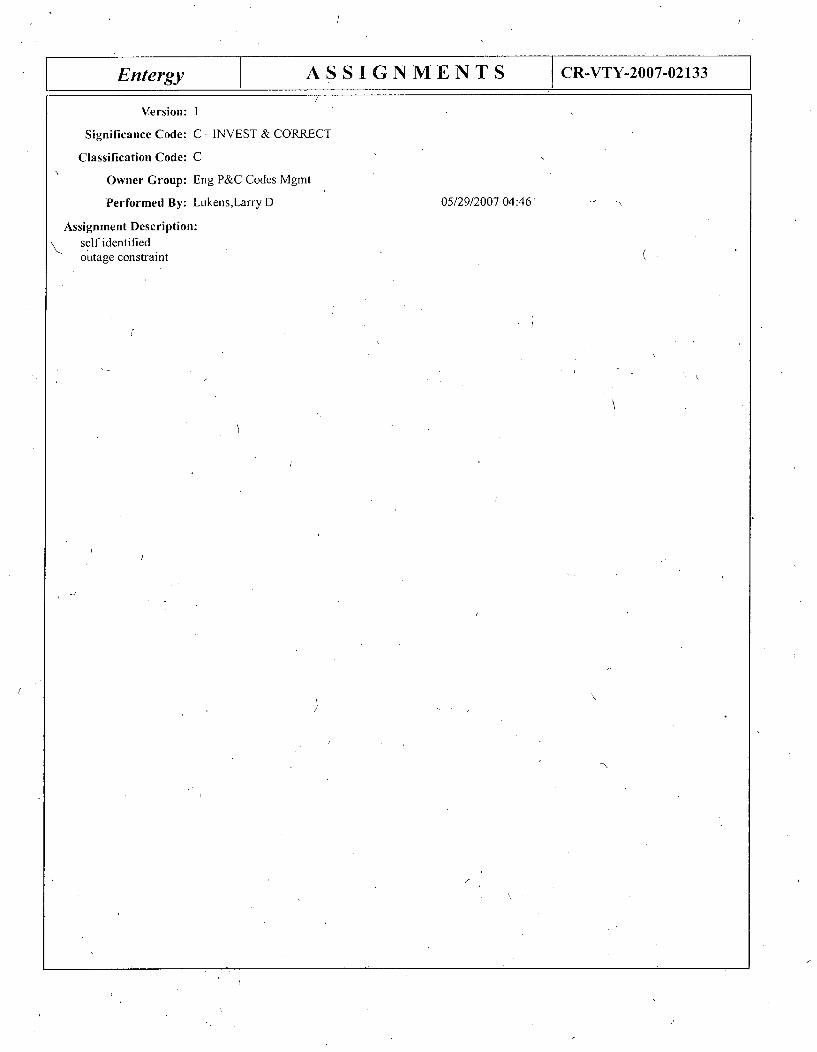
Entergy A S S I G N M E N T S CR-VTY-2007-02133
Version: I
Significance Code: C - INVEST & CORRECT
Classification Code: C
Owner Group: Eng P&C Codes Mgmt
Performed By: Lukens,Larry D
Assignment Description:self identifiedoutage constraint
05/29/2007 04:46
Entergy REPORTABILITY [CR-VTY-2007-02133
Reportability Version: I
Report Number:
Report Code: NOT REPORTABLE
Boilerplate Code: NOT'REPORTABLE
Performed By : Devincentis,James M 05/29/2007 08:09
Reportability Description.
Not reportable - This condition does not meet the Reportability screening criteria contained in AP00l0 or AP0156. TheSteam Dryer is NNS and performs no safety releted functions. VY has a commitment to provide the results of the steamdryer inspections to the NRC following startup.
7-
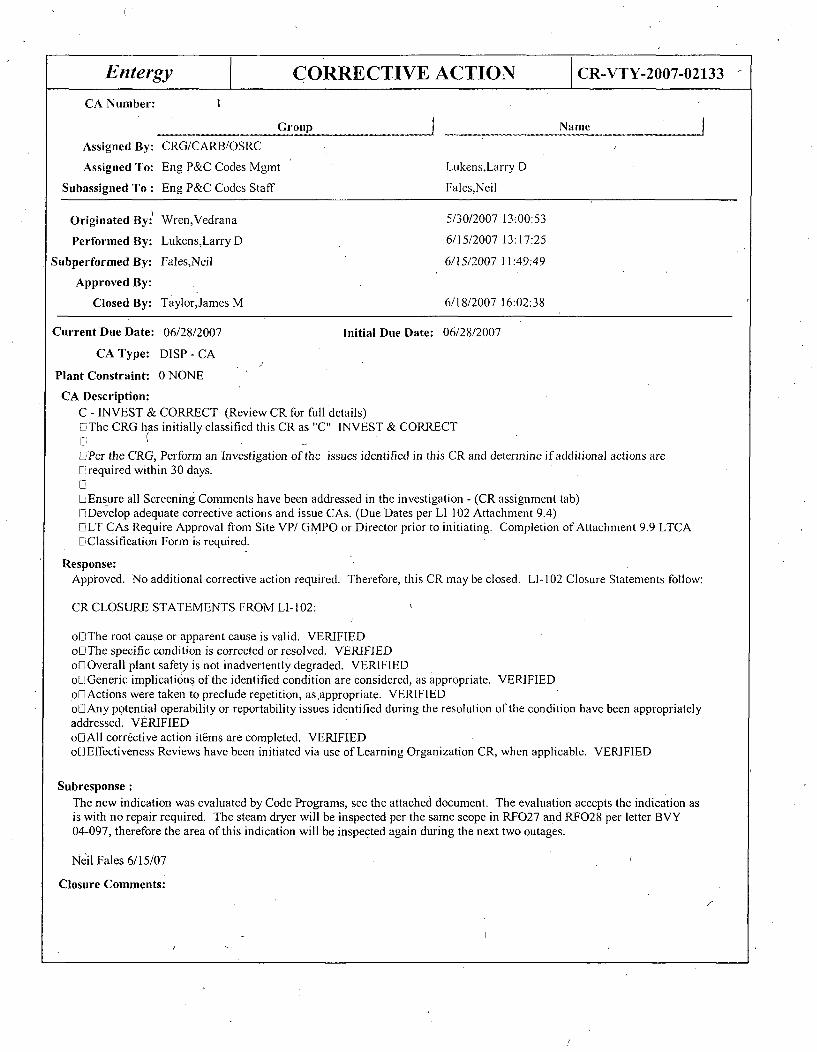
Entergy CORRECTIVE ACTION CR-VTY-2007-02133
CA Number:
Group _ NameAssigned By: CRG/CARB/OSRC
Assigned To: Eng P&C Codes Mgmt Lukens,Larry D
Subassigned To : Eng P&C Codes Staff Fales,Neil
Originated By: Wren,Vedrana 5/30/2007 13:00:53
Performed By: Lukens,Larry D 6/15/2007 13:17:25
Subperformed By: Fales,Neil 6/15/2007 11:49:49
Approved By:
Closed By: Taylor,James M 6/18/2007 16:02:38
Current Due Date: 06/28/2007 Initial Due Date: 06/28/2007
CA Type: DISP - CA
Plant Constraint: 0 NONE
CA Description:C - INVEST & CORRECT (Review CR for full details)DThe CRG has initially classified this CR as "C" INVEST & CORRECTI-3
EPer the CRG, Perform an Investigation of the issues identified in this CR and determine if additional actions areE required within 30 days.ELEnsure all Screening Comments have been addressed in the investigation - (CR assignment tab)- Develop adequate corrective actions and issue CAs. (Due Dates per LI 102 Attachment 9.4)OLT CAs Require Approval from Site VP/ GMPO or Director prior to initiating. Completion of Attachment 9.9 LTCA[-'Classification Form is required.
Response:Approved. No additional corrective action required. Therefore, this CR maybe closed. LI-102 Closure Statements follow:
CR CLOSURE STATEMENTS FROM L1-102:
oDThe root cause or apparent cause is valid. VERIFIEDoDThe specific condition is corrected or resolved. VERIFIEDoOlOverall plant safety is'not inadvertently degraded. VERIFIEDo[Generic implicati6ns of the identified condition are considered, as appropriate. VERIFIEDoLActions were taken to preclude repetition, asappropriate. VERIFIEDolAny potential operability or reportability issues identified during the resolution of the condition have been appropriatelyaddressed. VERIFIEDoDAII corr6ctive action items are completed. VERIFIEDoL]Effectiveness Reviews have been initiated via use of Learning Organization CR, when applicable. VERIFIED
Subresponse:
The new indication was evaluated by Code Programs, see the attached document. The evaluation accepts the indication asis with no repair required. The steam dryer will be inspected per the same scope in RF027 and RF028 per letter BVY04-097, therefore the area of this indication will be inspected again during the next two outages.
Neil Fales 6/15/07
Closure Comments:

Entergy CORRECTIVE ACTION CR-VTY-2007-02133
Attachments:Subresponse Description
Evaruation
K.

Attachment Header
Document Name:
luntitled
Document Location
jSubresponse Description
Attach Title: "
Evaluation
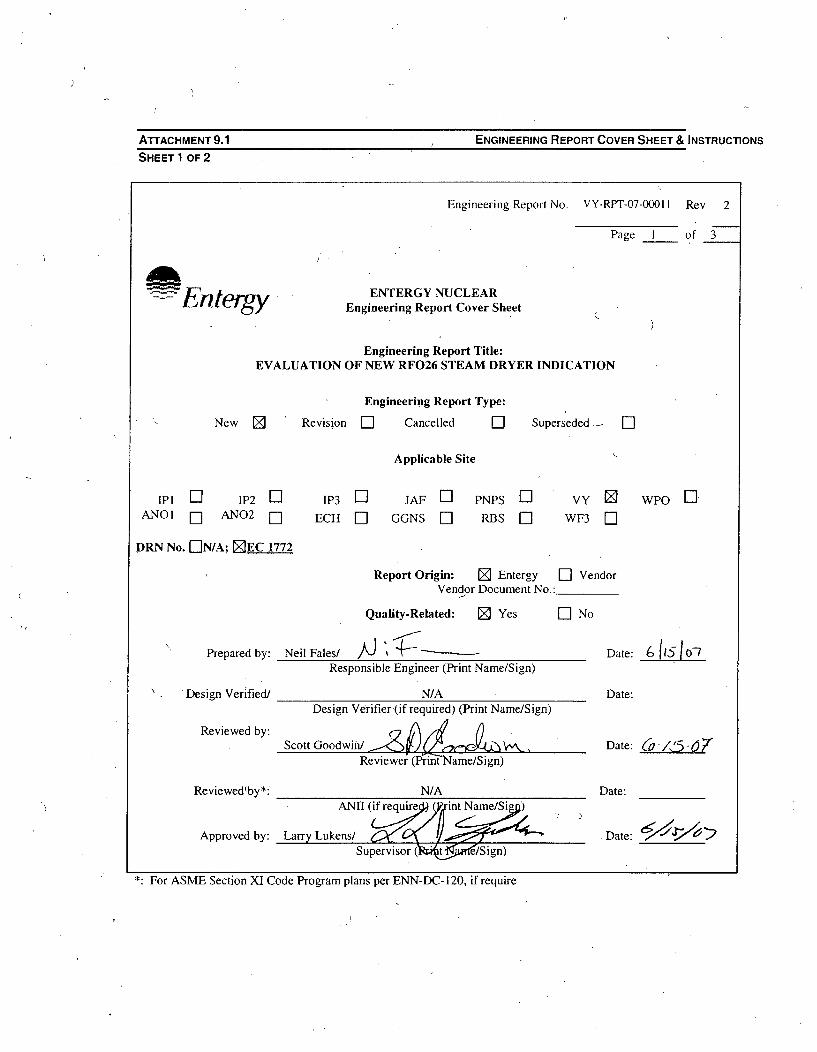
ATTACHMENT 9.1 M 9ENGINEERING REPORT COVER SHEET & INSTRUCTIONS
SHEET 1 OF 2
Engineering Report No. VY-RPT-07-00011 Rev 2
Page I of 3
~EntergyENTERGY NUCLEAR
Engineering Report Cover Sheet
Engineering Report Title:EVALUATION OF NEW RF026 STEAM DRYER INDICATION
Engineering Report Type:
New [] Revision EI Cancelled El Superseded.__ []
Applicable Site
jpjlANO I El
IP2 DANO2 LI
IP3 ElECH E] JAF LI
GGNS [_
PNPS ELRBS LI
VY
WF3 LIwPo nI
DRN No. [-IN/A; EEC 1772
Report Origin: Z Entergy [] VendorVendor Document No.:
Quality-Related: Z Yes LI No
Prepared by: Neil Fales/ /,.J " + -Responsible Engineer (Print Name/Sign)
Design Verified/
Reviewed by:
Reviewedlby*:
Approved by:
N/ADesign Verifier.(if required) (Print Name/Sign)
Scott Goodwin! _.- . .-,, N V.&
Date: 6 1 07
Date:
Date: Co5•,5 -0 7
Date:
Date: 6'•zj 6
Reviewer (Printaame/Sign)
N/AANH (if require~ int Name/Si
Larry Lukens/ /Supervisor ( l Sign)
*: For ASME Section X1 Code Program plans per ENN-DC-120, if require
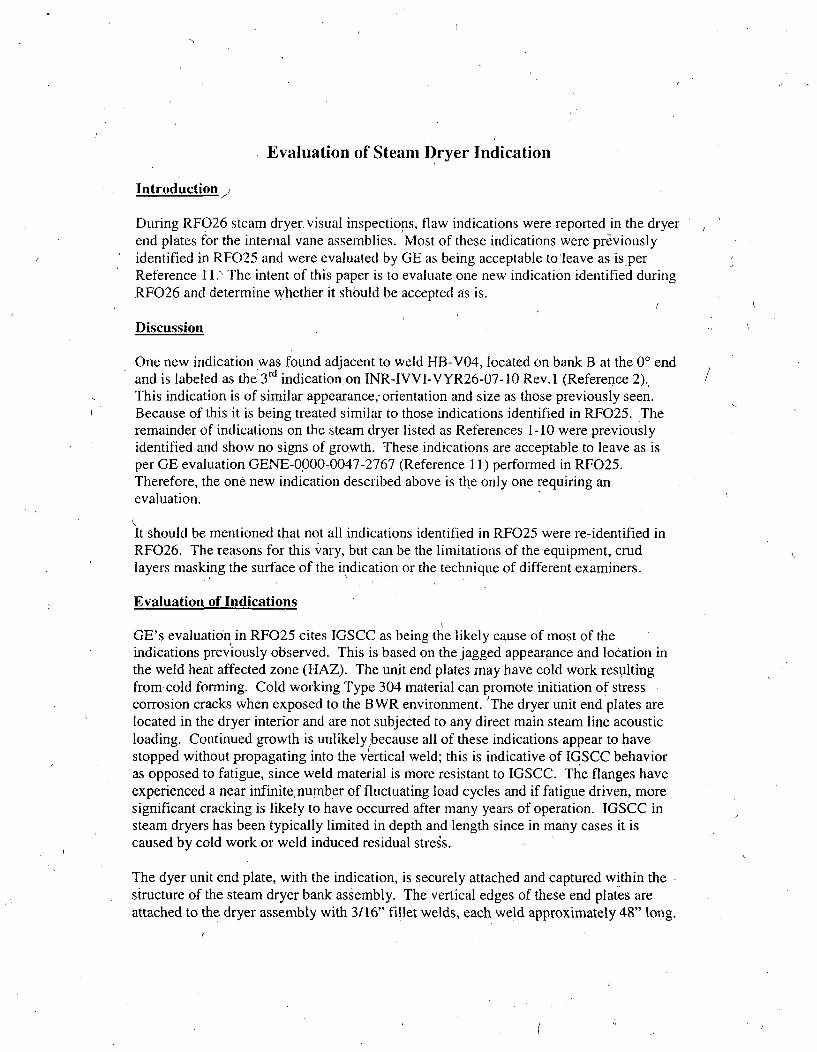
Evaluation of Steam Dryer Indication
Introduction,,
During RF026 steam dryer, visual inspections, flaw indications were reported in the dryerend plates for the internal vane assemblies. Most of these indications were previouslyidentified in RF025 and were evaluated by GE as being acceptable to leave as is perReference I 1. The intent of this paper is to evaluate one new indication identified duringRF026 and determine whether it should be accepted as is.
Discussion
One new indication was found adjacent to weld HB-V04, located on bank B at the 0' endand is labeled as the 3rd indication on INR-IVVI-VYR26-07-10 Rev. 1 (Reference 2).This indication is of similar appearance; orientation and size as those previously seen.Because of this it is being treated similar to those indications identified in RF025. Theremainder of indications on the steam dryer listed as References 1-10 were previouslyidentified and show no signs of growth. These indications are acceptable to leave as isper GE evaluation GENE-0,000-0047-2767 (Reference 11) performed in RF025.Therefore, the one new indication described above is the only one requiring anevaluation.
It should be mentioned that not all indications identified in RF025 were re-identified inRF026. The reasons for this vary, but can be the limitations of the equipment, crudlayers masking the surface of the indication or the technique of different examiners.
Evaluation of Indications
GE's evaluation in RF025 cites IGSCC as being the likely cause of most of theindications previously observed. This is based on the jagged appearance and location-inthe weld heat affected zone (HAZ). The unit end plates may have cold work resultingfrom cold forming. Cold working Type 304 material can promote initiation of stresscorrosion cracks when exposed to the BWR environment. 'The dryer unit end plates arelocated in the dryer interior and are not subjected to any direct main steam line acousticloading. Continued growth is unlikely (because all of these indications appear to havestopped without propagating into the vertical weld; this is indicative of IGSCC behavioras opposed to fatigue, since weld material is more resistant to IGSCC. The flanges haveexperienced a near infinite number of fluctuating load cycles and if fatigue driven, moresignificant cracking is likely to have occurred after many years of operation. IGSCC insteam dryers has been typically limited in depth and length since in many cases it iscaused by cold work or weld induced residual stress.
The dyer unit end plate, with the indication, is securely attached and captured within thestructure of the steam dryer bank assembly. The vertical edges of these end plates areattached to the dryer assembly with 3/16" fillet welds, each weld approximately 48" long.
There were no relevant indications reported in these vertical welds. The geometricconfiguration of the unit end plates is such that the steam dryer assembly mechanicallycaptures the upper and lower edges. The reported horizontal indications were seen in theinlet side end plate flange. The vanes prevent inspection of the central, end plate surface,but inspection of the outlet side end plate flanges at both locations found no indications.If it is postulated that the end plate horizontal indications propagate across the entire8.75" unit end plate width including both the inlet and outlet side flange, such full width,through-thickness cracks would have no structural impact. Nor is there any concern forloose parts. The separated end plate sections are still attached and will continue tofunction.
/
Safety
The steam dryer assembly has no safety function. See BWRVIP-06A for additionaldiscussion of steam dryer assembly safety. The flaw indications, reported in the steamdryer INR's from RF026 will not likely result in any lost parts at operating conditions.Therefore, there is no safety concern with continued operation~with the Reference 1-10indications left as is.
Conclusions and Recommendations
The dryer unit end plates flaw, assessment is based on the following factors: (1) it is ahighly redundant structure and there is no structural consequence of the cracking and (2)postulated significant flaw extension leading to the flaw reaching the full section of thechannel geometry would not create the opportunity for loose parts. Field- experiencesupports this as-is operation decision in the context that the indications will be re-inspected at the next outage. It is recommended that the new visual indication given inReference 2 be accepted as is. Repair is not recommended.
References
1. GE INR-IVVI-VYR26-07-09 Rev. 12. GE INR-IVVI-VYR26-07-10 Rev. 13. GE INR-IVVI-VYR26-07-114. GE INR-IVVI-VYR26-07-125. GE INR-IVVI-VYR26-07-136. GE INR-IVVI-VYR26-07-147. GE INR-IVVI-VYR26-07-158. GE INR-IVVI-VYR26-07-169. GE INR-IVVI-VYR26-07-1810. GE INR-IVVI-VYR26-07-1'911. GENE-0000-0047-2767
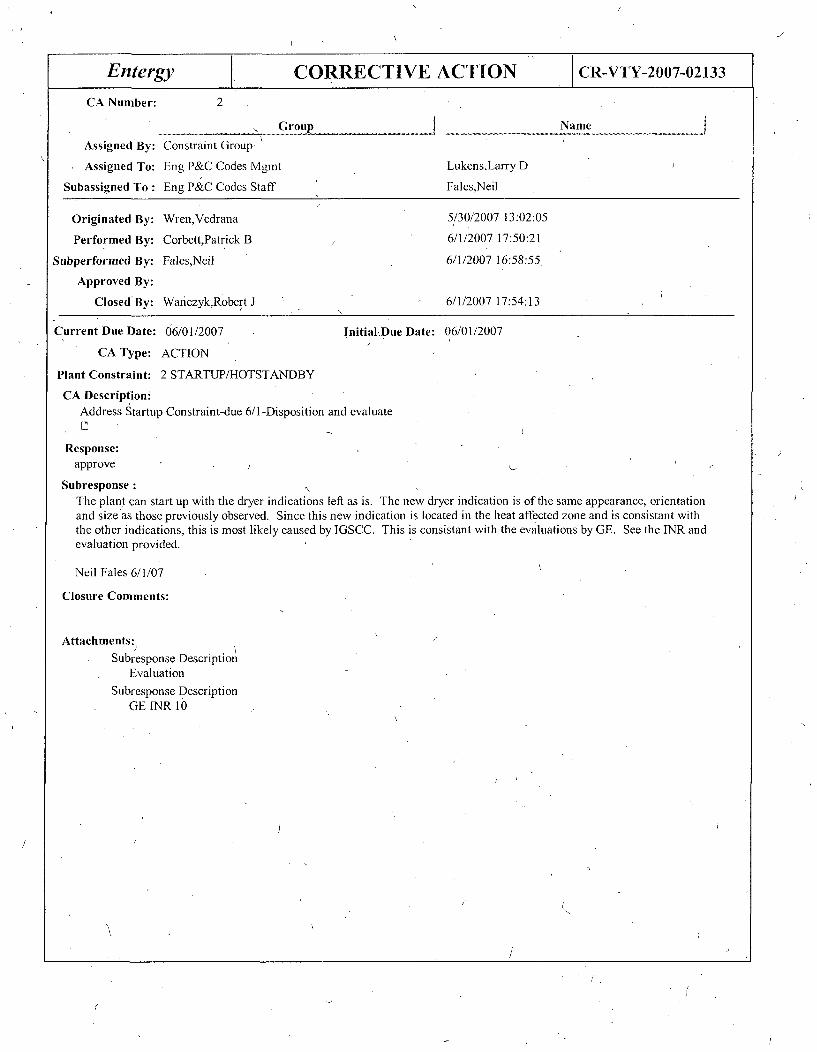
Entergy CORRECTIVE ACTION CR-VTY-2007-02133
CA Number: 2
-______. Group _
Assigned By: Constraint Group.
Assigned To: Eng P&C Codes Mgmt
Subassigned To : Eng P&C Codes Staff
Name JLukensLarry D
Fales,Neil
Originated By: Wren,Vedrana 5/30/2007 13:02:05
Performed By: Corbett,Patrick B 6/1/2007 17:50:21
Subperformed By: Fales,Neil 6/1/2007 16:58:55
Approved By:
ClosedBy: Wanczyk,Robert J 6/1/2007 17:54:13
Current Due Date: 66/01/2007 Initial.Due Date: 06/01/2007
CA Type: ACTION
Plant Constraint: 2 STARTUP/HOTSTANDBY
CA Description:Address Startup Constraint-due 6/1-Disposition and evaluate
Response:approve I
Subresponse:The plant can start up with the dryer indications left as is. The new dryer indication is of the same appearance, orientationand size as those previously observed. Since this new indication is located in the heat affected zone and is consistant withthe other indications, this is most likely caused by IGSCC. This is consistant with the evaluations by GE. See the INR andevaluation provided.
Neil Fales 6/1/07
Closure Comments:
AttachmentsSubresponse Description
EvaluationSubresponse Description
GE INR 10

Attachment Header
Document Name:
untitled
Document Location
ISubresponse Description
Attach Title:
jEvaluation
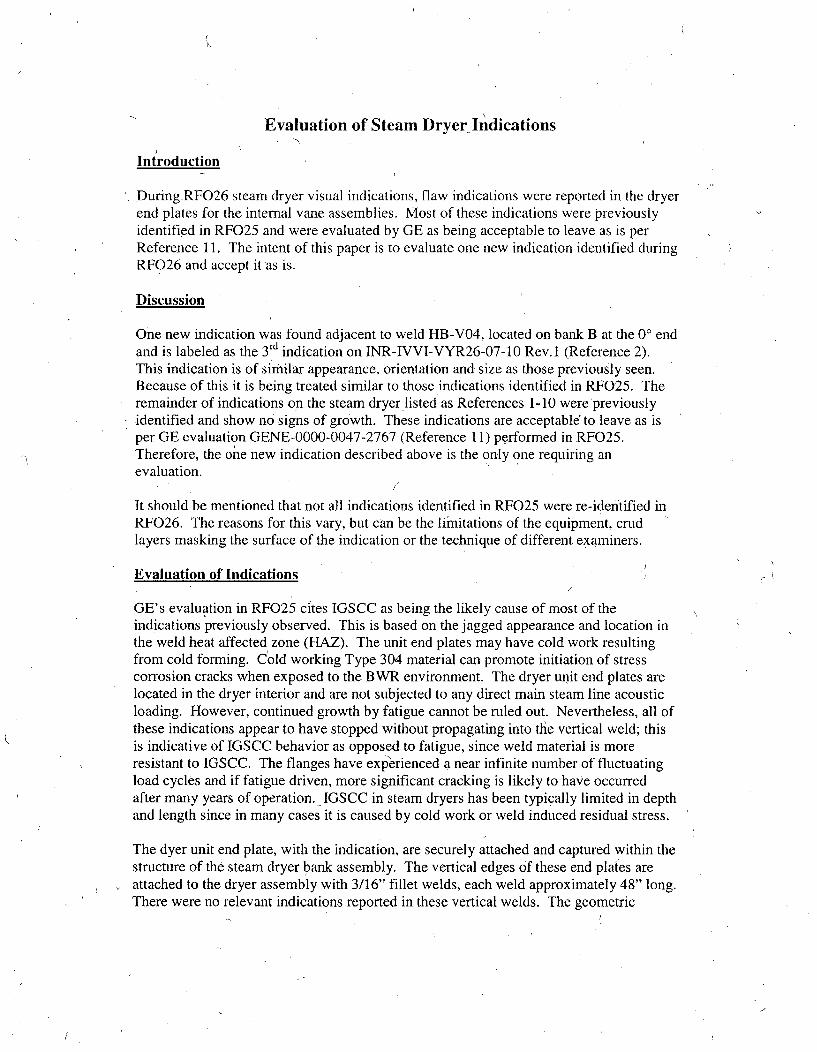
Evaluation of Steam Dryer Indications
Introduction
During-RFO26 steam dryer visual indications, flaw indications were reported in the dryerend plates for the internal vane assemblies. Most of these indications were previouslyidentified in RF025 and were evaluated by GE as being acceptable to leave as is perReference 11. The intent of this paper is to evaluate one new indication identified duringRF026 and accept it 'as is.
Discussion
One new indication was found adjacent to weld HB-V04, located on bank B at the 0' endand is labeled as the 3d indication on INR-IVVI-VYR26-07-10 Rev. 1 (Reference 2).This indication is of similar appearance, orientation and size as those previously seen.Because of this it is being treated similar to those indications identified in RF025. Theremainder of indications on the steam dryer listed as References 1-10 were 'previouslyidentified and show no signs of growth. These indications are acceptable& to leave as isper GE evaluation GENE-0000-0047-2767 (Reference 11) performed in RF025.Therefore, the one new indication described above is the only one requiring anevaluation.
It should be mentioned that not all indications identified in RF025 were re-identified inRF026. The reasons for this vary, but can be the limitations of the equipment, crudlayers masking the surface of the indication or the technique of different examiners.
Evaluation of Indications
GE's evaluation in RF025 cites IGSCC as being the likely cause of most of theindications previously observed. This is based on the jagged appearance and location inthe weld heat affected zone (HAZ). The unit end plates may have cold work resultingfrom cold forming. Cold working Type 304 material can promote initiation of stresscorrosion cracks when exposed to the BWR environment. The dryer unit end plates arelocated in the dryer interior and are not subjected to any direct main steam line acousticloading. However, continued growth by fatigue cannot be ruled out. Nevertheless, all ofthese indications appear to have stopped without propagating into the vertical weld; thisis indicative of IGSCC behavior as opposed to fatigue, since weld material is moreresistant to IGSCC. The flanges have expierienced a near infinite number of fluctuatingload cycles and if fatigue driven, more significant cracking is likely to have occurredafter many years of operation. IGSCC in steam dryers has been typically limited in depthand length since in many cases it is caused by cold work or weld induced residual stress.
The dyer unit end plate, with the indication, are securely attached and captured within thestructure of the steam dryer bank assembly. The vertical edges of these end plates areattached to the dryer assembly with 3/16" fillet welds, each weld approximately 48" long.There were no relevant indications reported in these vertical welds. The geometric
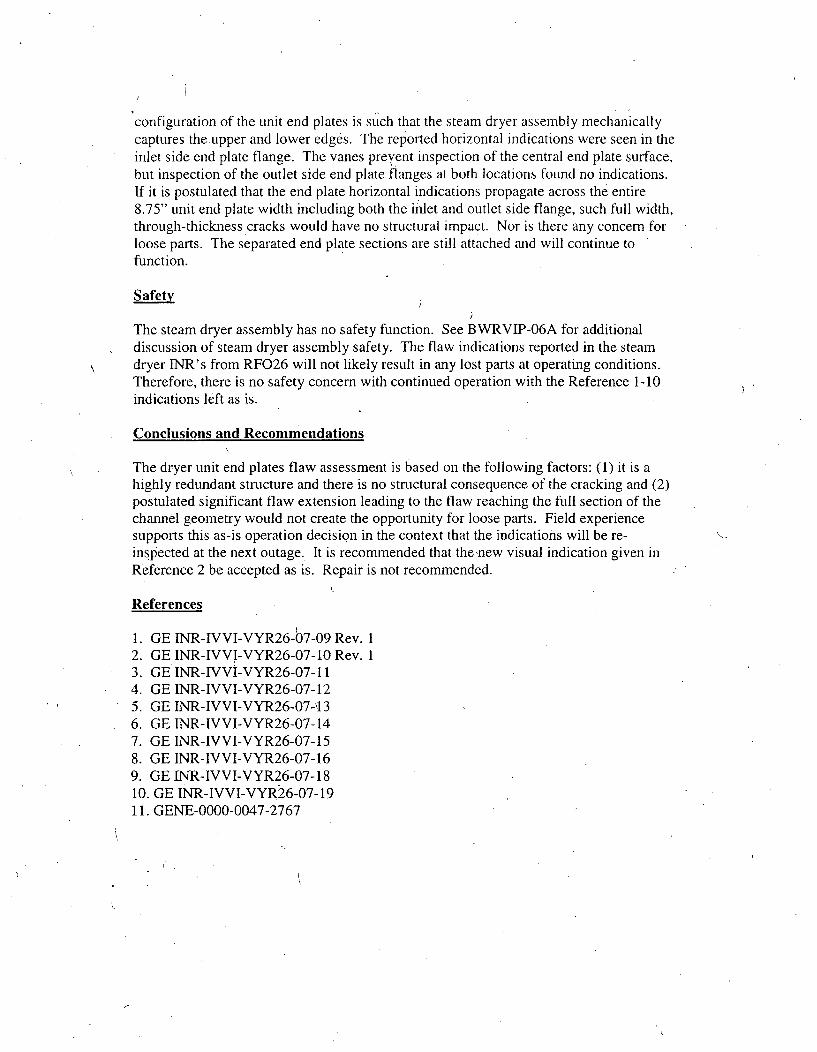
configuration of the unit end plates is such that the steam dryer assembly mechanicallycaptures theupper and lower edges. The reported horizontal indications were seen in theinlet side end plate flange. The vanes preyent inspection of the central end plate surface,but inspection of the outlet side end plate flanges at both locations found no indications.If it is postulated that the end plate horizontal indications propagate across the entire8.75" unit end plate width including both the inlet and outlet side flange, such full width,through-thickness cracks would have no structural impact. Nor is there any concern forloose parts. The separated end plate sections are still attached and will continue tofunction.
Safety
The steam dryer assembly has no safety function. See BWRVIP-06A for additionaldiscussion of steam dryer assembly safety. The flaw indications reported in the steamdryer INR's from RF026 will not likely result in any lost parts at operating conditions.Therefore, there is no safety concern with continued operation with the Reference 1-10indications left as is.
Conclusions and Recommendations
The dryer unit end plates flaw assessment is based on the following factors: (1) it is ahighly redundant structure and there is no structural consequence of the cracking and (2)postulated significant flaw extension leading to the flaw reaching the full section of thechannel geometry would not create the opportunity for loose parts. Field experiencesupports this as-is operation decision in the context that the indications will be re-inspected at the next outage. It is recommended that the ,new visual indication given inReference 2 be accepted as is. Repair is not recommended.
References
1. GE INR-IVVI-VYR26-07-09 Rev. I2. GE INR-IVVI-VYR26-07-10 Rev. 13. GE INR-IVVI-VYR26-07-114. GE INR-IVVI-VYR26-07-125. GE INR-IVVI-VYR26-07-\136. GE INR-IVVI-VYR26-07-147. GE INR-IVVI-VYR26-07-158. GE INR-IVVI-VYR26-07-169. GE INR-IVVI-VYR26-07-1810. GE INR-IVVI-VYR26-07-1911. GENE-0000-0047-2767

Attachment Header2
Document Name:
Document Location
Subresponse Description
Attach Title:
[GE INR 10
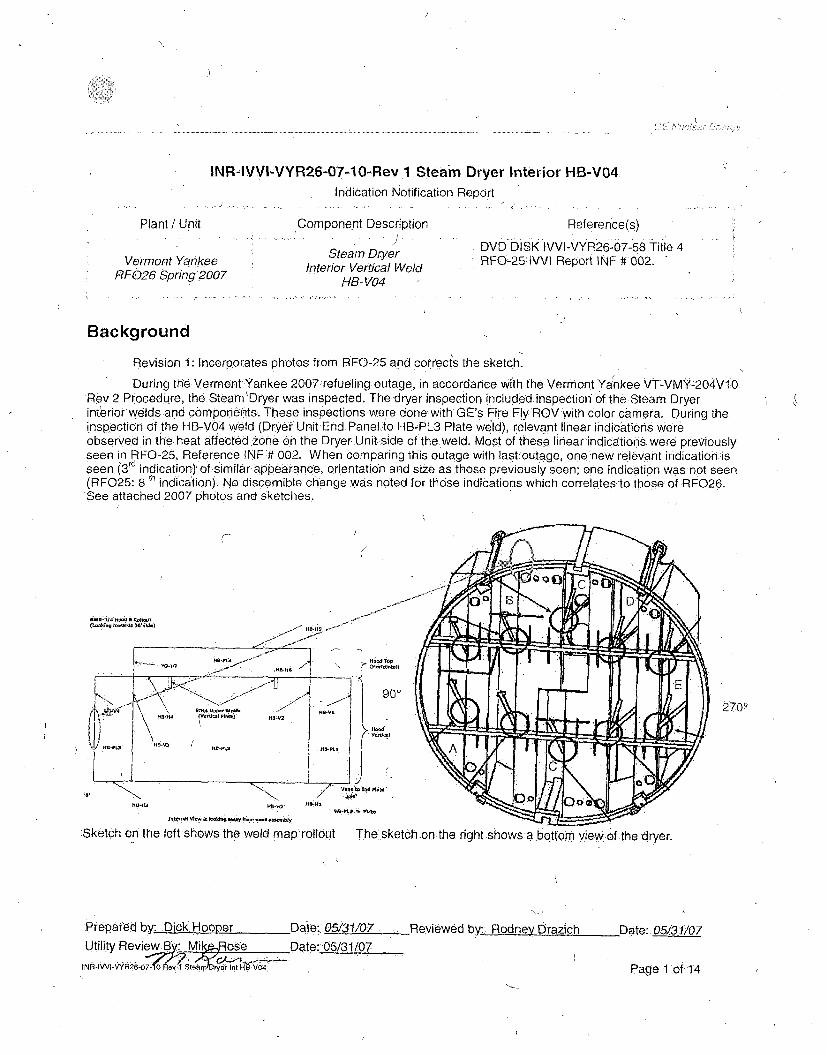
INR-IVVI-VYR26-07-10-Rev 1 Steam Dryer Interior HB-V04Indication Notification Report
Plant / Unit Component Description
Steam DryerInterior Vertical Weld
HB- V04
Reference(s)
DVD DISK IVVI-VYR26-07-58 Title 4RFO-25 IVVI Report INF # 002.Vermont Yankee
RF026 Spring 2007
Background
Revision 1: Incorporates photos from RFO-25 and correctis the sketch.
During the Vermont Yankee 2007 refueling outage, in accordance with the.Vermont Ya nkee VT-VMY-204V1 0
Rev 2 Procedure, the Steam Dryer was inspected. The dryer inspection included inspection of the Steam Dryerinterior welds and components. These inspections were done with GE's Fire Fly ROV with Color camera. During theinspection :of the HB-V04 weld (Dryer UnitEnd Panel-to HBwPL3 Plate weld), relevant linear.indications wereobserved in the heat aff ected zone on the Dryer :Unit. side of the weld. Most of these linearindicatioris. were previously
seen in. RFO-25, Reference INF # 002. When comparing this outage with last outage, 0nejnew relevant indication is
seen (3 rd indication) of similar appearance, orientation and size as those previously seen; one indication was, not seen(RF025: 8 th indication). No discernible change was noted for those indications which correlates to those of RF026.See attached 2007 photos and sketches.
BWR-aJ4 00003 000001(L~o~d..
0boo..100 00*.l~1o)
2700
Yana W &4 MAW
01 0 0 1 W0 0 0 00 0 000 f o . 0 0 0 O
*Sketch on the left shows the weld map rollout The sketch .on the right showsi a bottom view of the dryer.
Preparied by: Dick Hooper Da Date:, 05/31/07 -Reviewed by: Rodney Drazich Date:. 05/31/07
Utility Review Mi oSe Date: 05/31/07
,NR,-iVVWF•26-o7. 0 •e•v'Stearrrya Int HB-VO4 Page 1 of 14
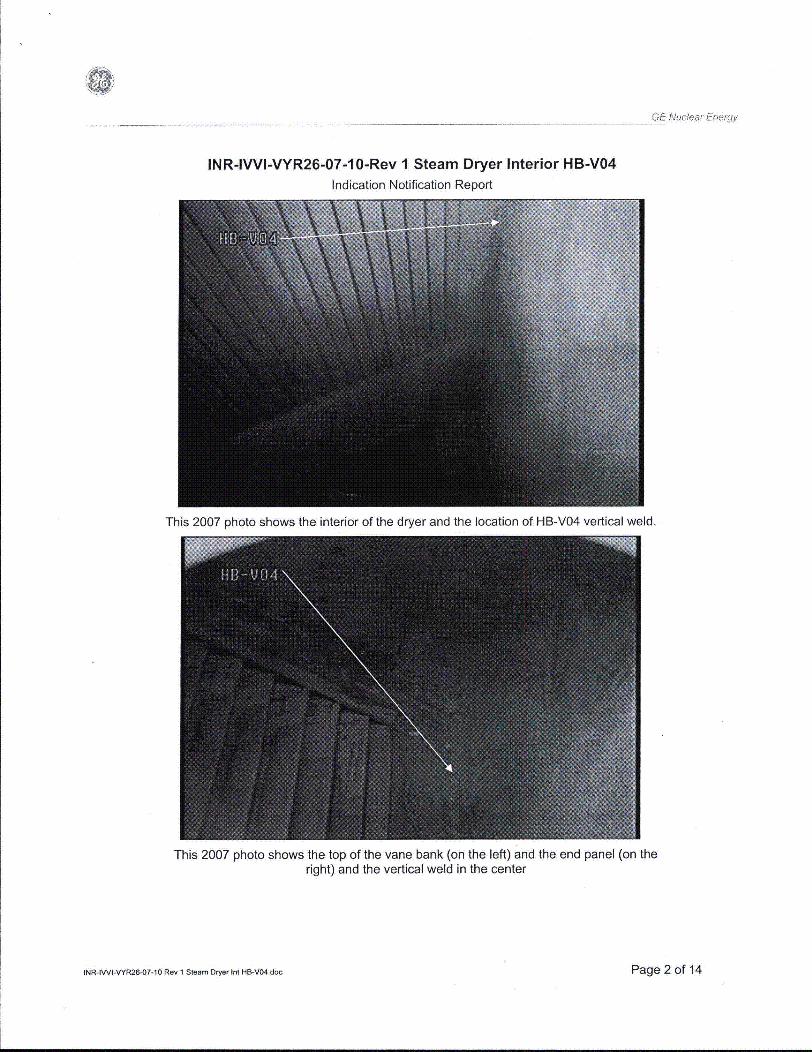
GE Nuclear Eoetqy
INR-IVVI-VYR26-07-10-Rev I Steam Dryer Interior HB-V04Indication Notification Report
This 2007 photo shows the interior of the dryer and the location of HB-V04 vertical weld.
This 2007 photo shows the top of the vane bank (on the left) and the end panel (on theright) and the vertical weld in the center
INR-IVVI-VYR26-07-10 Rev 1 Steam Dryer Int HB-V04.doc Page 2 of 14
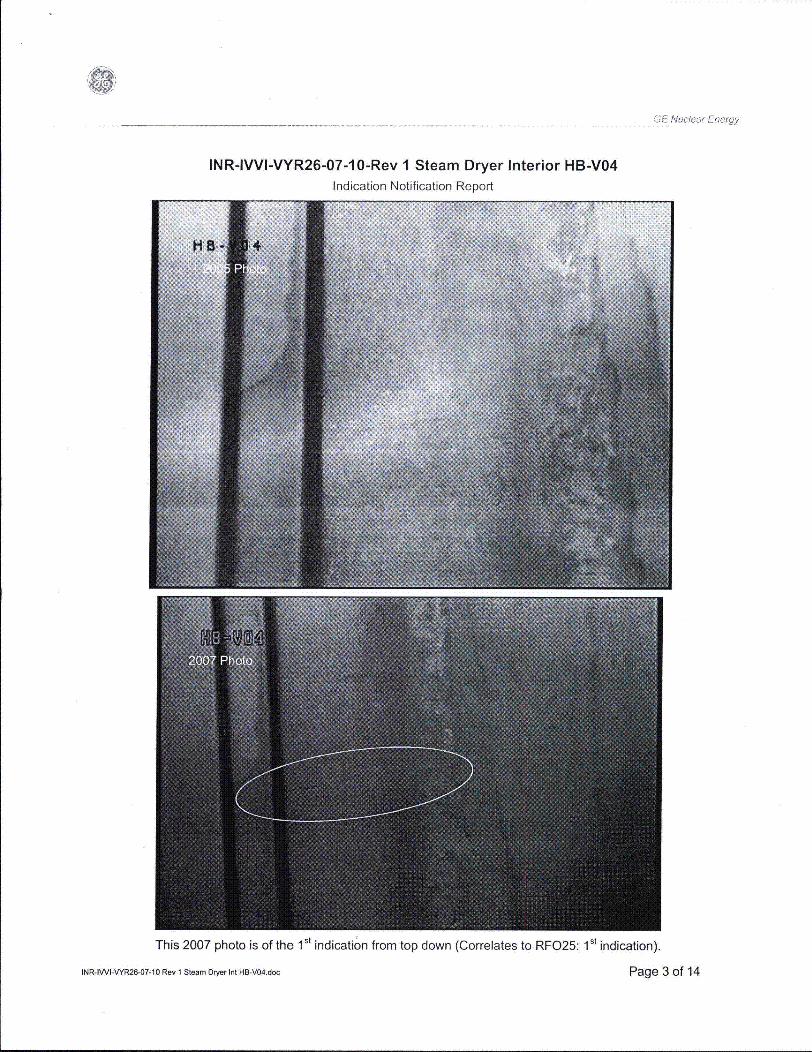
GE .Noclear E&;eqjy
INR-IVVI-VYR26-07-10-Rev 1 Steam Dryer Interior HB-V04Indication Notification Report
This 2007 photo is of the 1 s' indication from top down (Correlates to RF025: 1st indication).
INR-IWI-VYR26-07-10 Rev 1 Steam Dryer Int HB-V04.doc Page 3 of 14
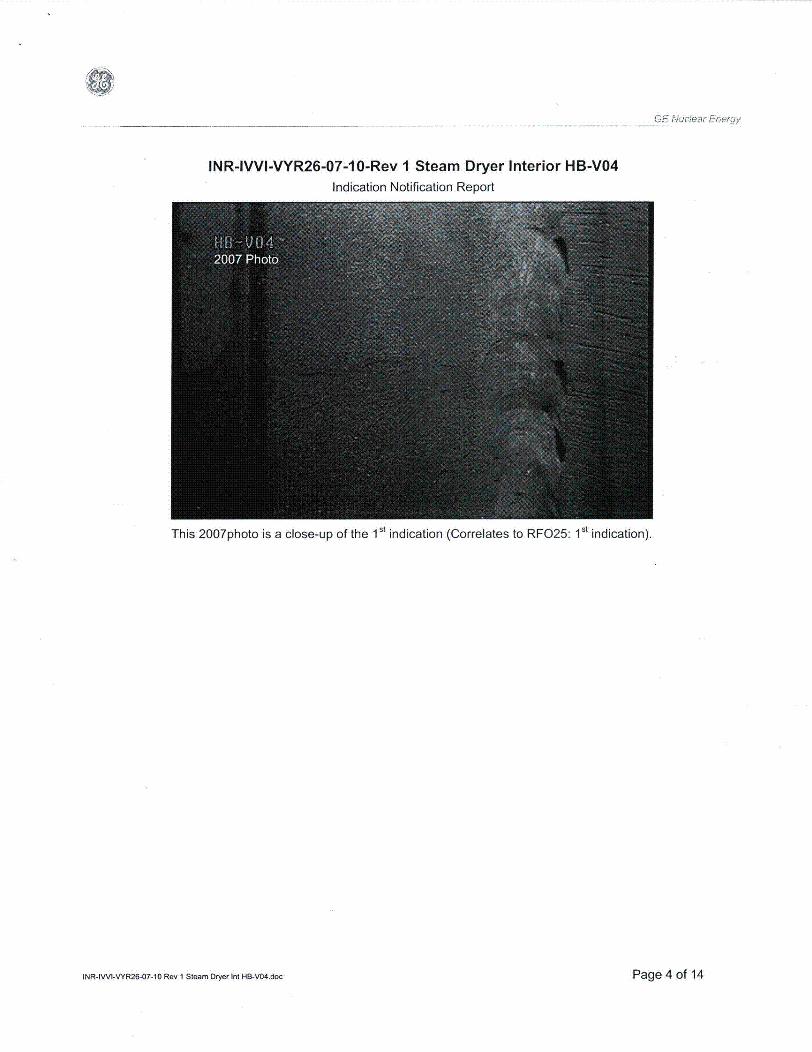
AIi~
GE Nuclear Enerqay
INR-IVVI-VYR26-07-10-Rev I Steam Dryer Interior HB-V04Indication Notification Report
This 2007photo is a close-up of the ls indication (Correlates to RF025: 1 st indication).
INR-IWI-VYR26-07-10 Rev 1 Steam Dryer Int HB-V04.doc Page 4 of 14
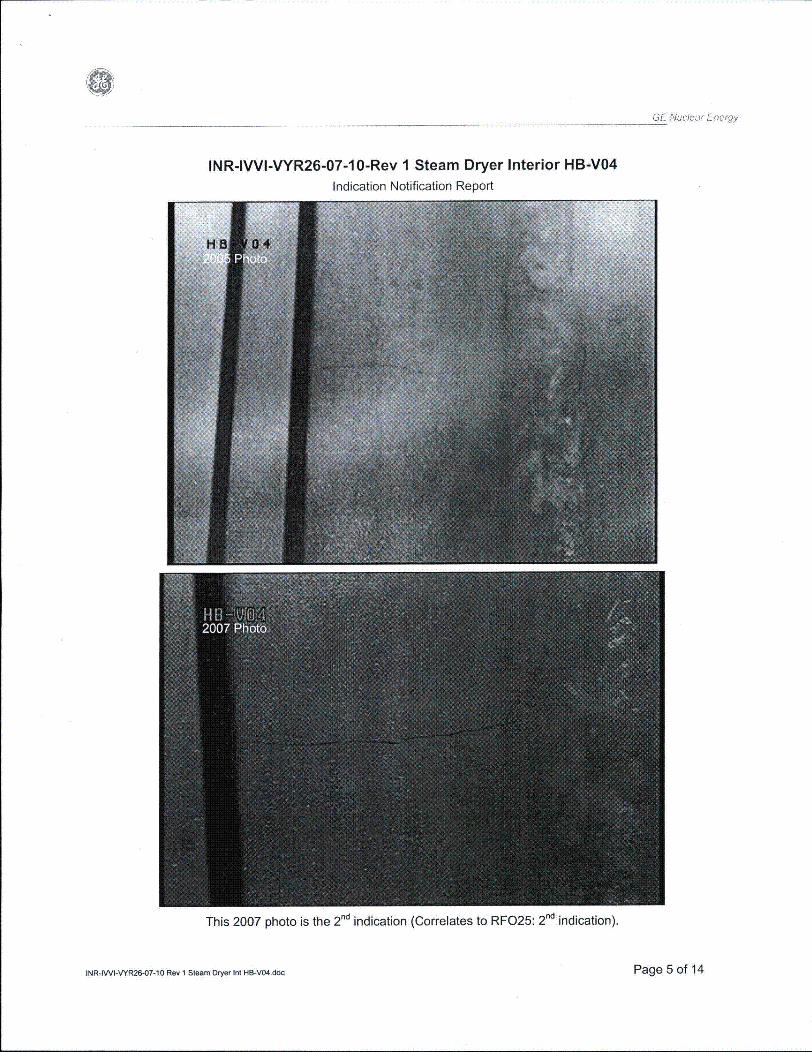
E. ,"uc'erD Energy
INR-IWI-VYR26-07-10-Rev 1 Steam Dryer Interior HB-V04Indication Notification Report
This 2007 photo is the 2 nd indication (Correlates to RF025: 2d indication).
INR-IWI-VYR26-07-10 Rev 1 Steam Dryer Int HB-V04.doc Page 5 of 14

GE Noulear Er•-e,,gy
INR-IVWI-VYR26-07-10-Rev I Steam Dryer Interior HB-V04Indication Notification Report
This is a 2007 photo of the 3rd indication and is a new RF026 indication.
INR-IWI-VYR26-07-10 Rev I Steam Dryer Int HB-V04.doc Page 6 of 14
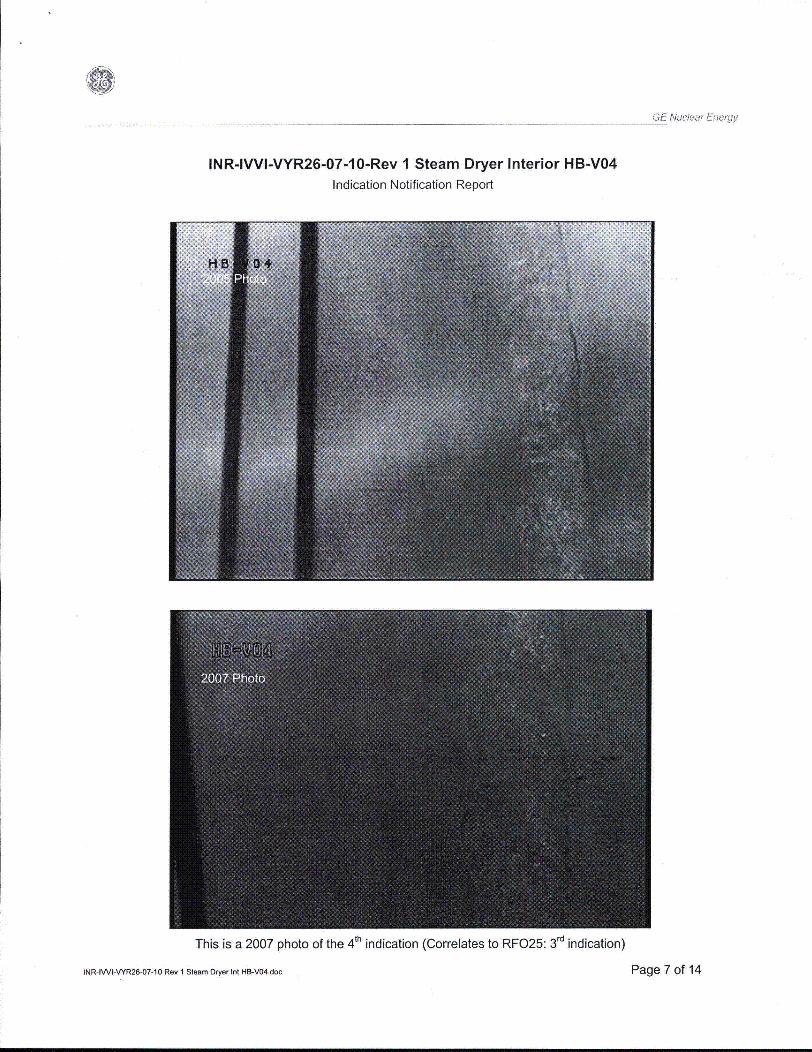
GE Nuclear Enerqy
INR-IVVI-VYR26-07-10-Rev 1 Steam Dryer Interior HB-V04Indication Notification Report
This is a 2007 photo of the 4th indication (Correlates to RF025: 3 rd indication)
INR-IWI-VYR26-07-10 Rev 1 Steam Dryer Int HB-V04.doc Page 7 of 14
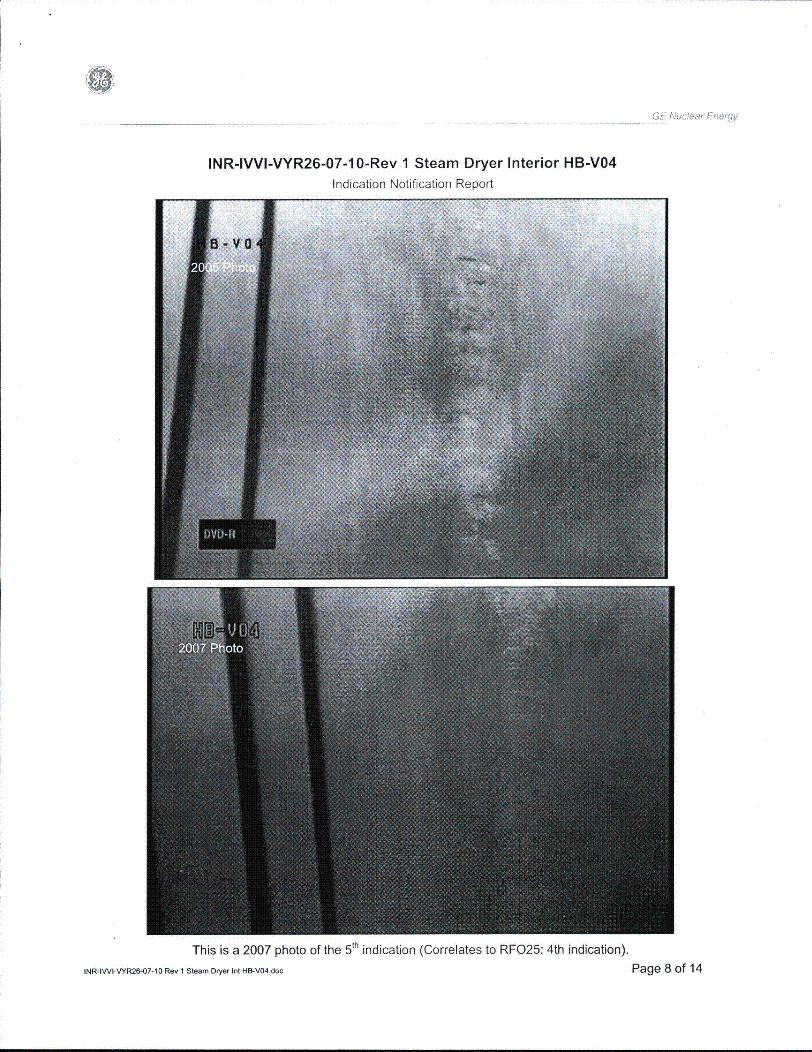
GE: Nocleat
INR-IVVI-VYR26-07-10-Rev 1 Steam Dryer Interior HB-V04Indication Notification Report
This is a 2007 photo of the 5th indication (Correlates to RF025: 4th indication).
INR-IWI-VYR26-07-10 Rev 1 Steam Dryer Int HB-V04.doc Page 8 of 14
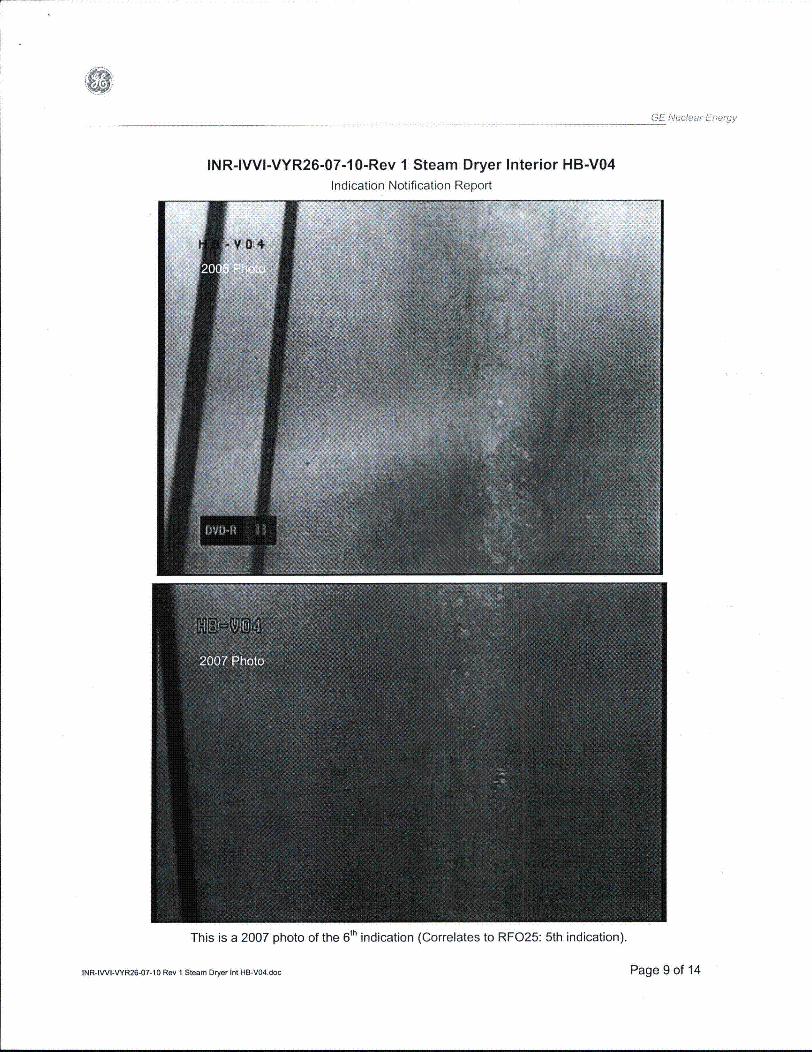
_________ (E Nuc',ew Lutermy
INR-IVVI-VYR26-07-10-Rev 1 Steam Dryer Interior HB-V04Indication Notification Report
This is a 2007 photo of the 6 1h indication (Correlates to RF025: 5th indication).
INR-IWI-VYR26-07-10 Rev I Steam Dryer Int HB-V04.doc Page 9 of 14
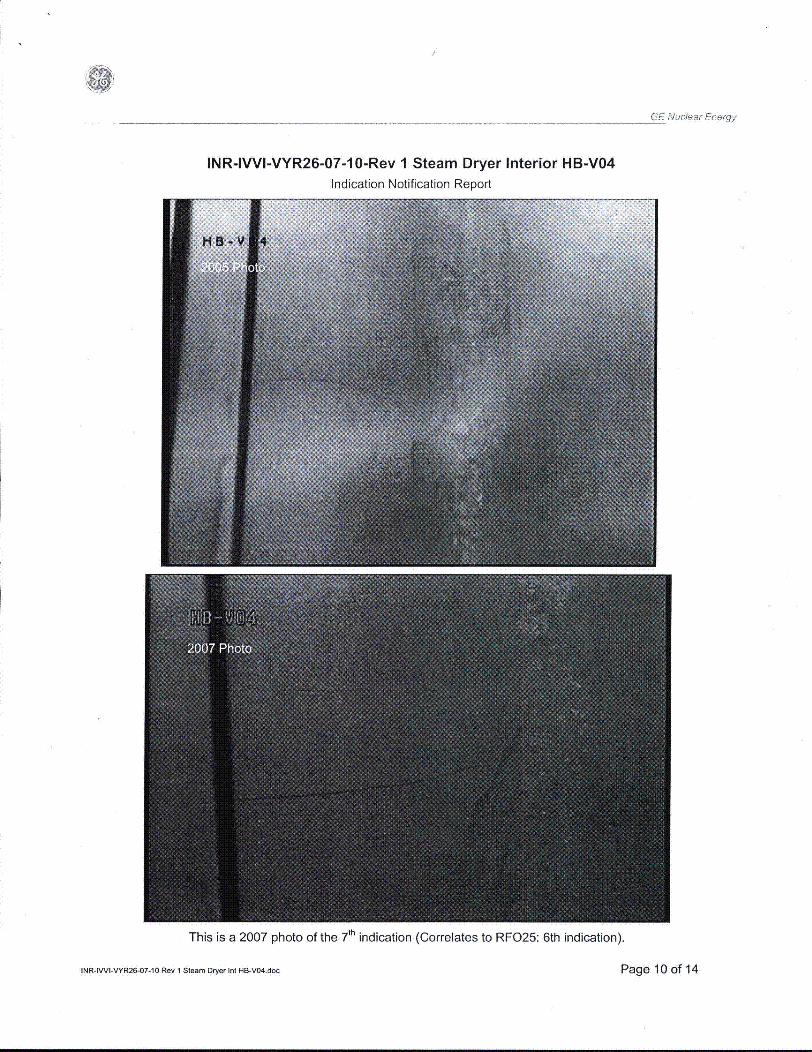
GE Nuclear Energy
INR-IVVI-VYR26-07-10-Rev 1 Steam Dryer Interior HB-V04Indication Notification Report
This is a 2007 photo of the 7Zh indication (Correlates to RF025: 6th indication).
INR-IVVI-YR26-07-10 Rev 1 Steam Dryer Int HB-V04.doc Page 10 of 14
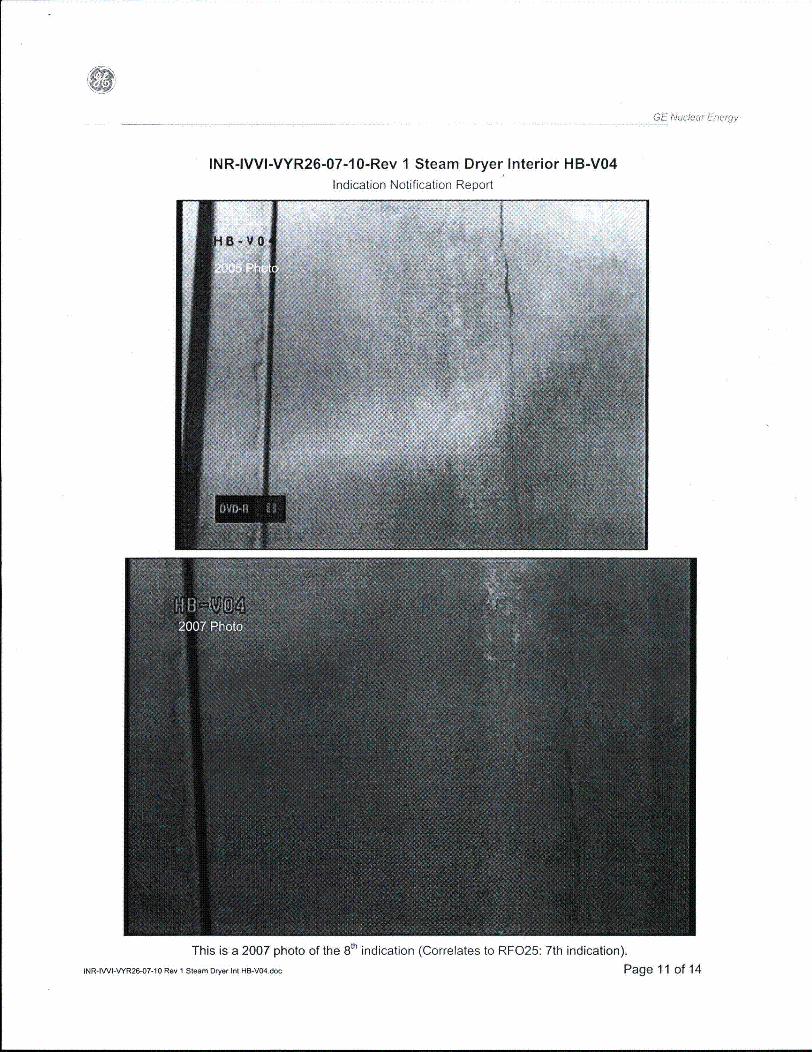
GE NucleaIr Derlgy
INR-IVVI-VYR26-07-10-Rev 1 Steam Dryer Interior HB-V04Indication Notification Report
This is a 2007 photo of the 8 th indication (Correlates to RF025: 7th indication).INR-IWI-VYR26-07-10 Rev 1 Steam Dryer Int HB-V04.doc Page 11 of 14
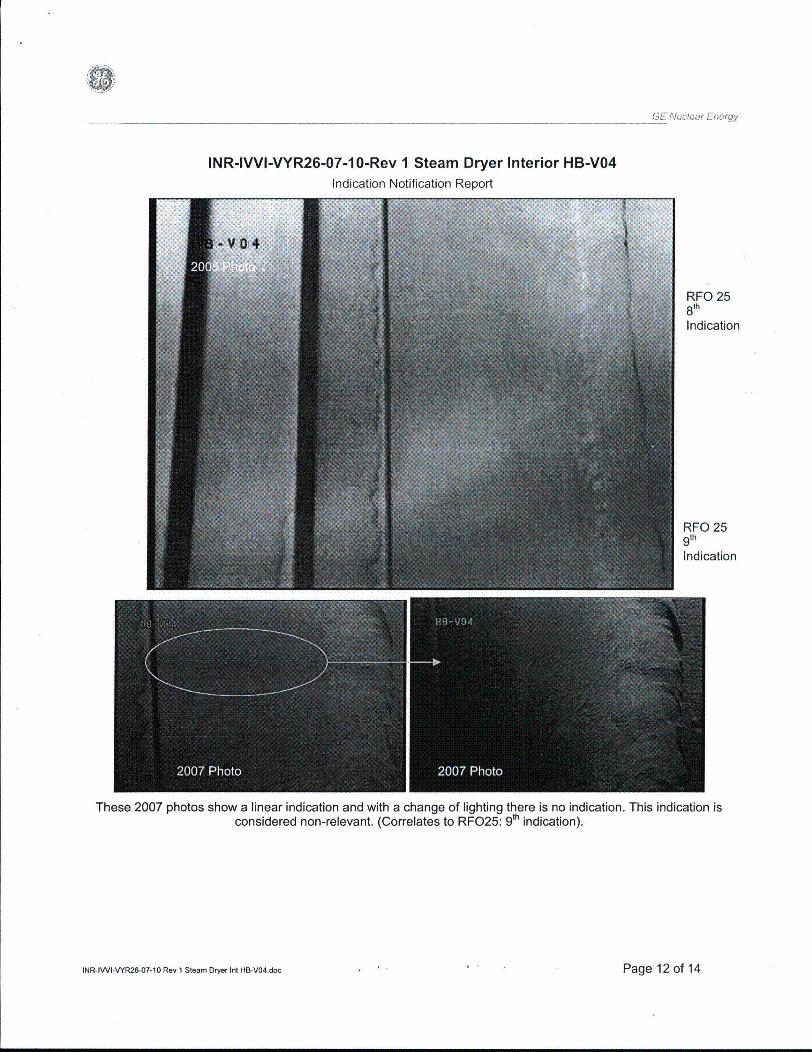
GE Nuear Energy
INR-IVVI-VYR26-07-10-Rev 1 Steam Dryer Interior HB-V04Indication Notification Report
RFO 258
th
Indication
RFO 259 th
Indication
These 2007 photos show a linear indication and with a change of lighting there is no indication. This indication isconsidered non-relevant. (Correlates to RF025: 9th indication).
INR-IVVI-VYR26-07-10 Rev 1 Steam Dryer Int HB-V04.doc Page 12 of 14

GE Ndeia-r E ry
INR-IVVI-VYR26-07-1 0-Rev 1 Steam Dryer Interior HB-V04
Indication Notification Report
This is a 2007 photo of the 9 th indication (Correlates to RF025: 10th indication).
INR-IWI.VYR26-07-10 Rev 1 Steam Dryer Int HB-V04.doc Page 13 of 14
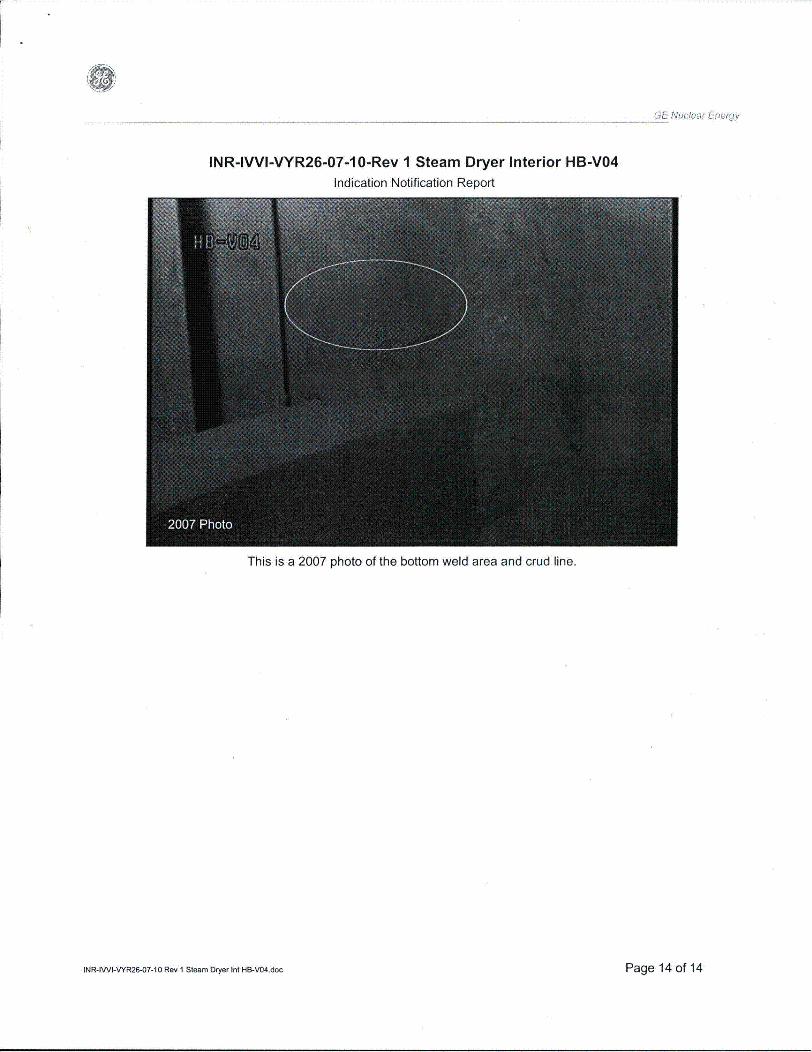
GE Nuclear L.:f•el&?y
INR-IVVI-VYR26-07-1 0-Rev I Steam Dryer Interior HB-V04Indication Notification Report
This is a 2007 photo of the bottom weld area and crud line.
INR-IWI-VYR26-07-10 Rev 1 Steam Dryer Int HB-V04.doc Page 14 of 14
Fredric A. Simonen
Stephen R. Gosseline-nail: sip•hepacsseirl@v>ý QGv
Pacific Northwes4 National Laboralory:': ,ichland, WA f9352
Introduction
f Evaluations of nuclear power plant safer•.passive components such as pressure vessel.,i have very low failure probabilities, such t
conmponents make only negligible contributiicore damage frequency), In the U.S. and otsign, fabrication. inspection. and maiintenancsel+;;,+s have followed the conservative enghnec
bed by the American Society of Mechanica'i Boiler and Pressure'Vessel Codes. The relati'
iignificant failures that have occurred duringdemonstrated the soundtnss of the As?
vever, many plants will he aipproaching th,0 Vy.r), with the expectatio•t that continuled o
'5 original desien period will need to be just'-'!assumption of continued high levels of stru
qutres an extrapolation beyond the current bpertience. that. must be addressed as part ofefforts.
-Whereas the replacement of active cornsn'l elyctrical) is a routine part of plant mainreplacements of vessel and piping componec.all feasible. The.challenge is to make reali
,amn to estabhlsh a hieh level of confidence in'desired objective is to ensure that passive con
make only negligible contributions to planteasily t anaged contributions to risk such acOmponientS and operator errors.•-Fatigue damage was originally identified(1eoradation mechanism for tnany pressure ves,oancnts during the designofniuclear power p
ypopulation of operating phans, certain strut•eceed their originial design lives based oni,0tigue usage lactors, although tlhere has been
,ladltion as the predicted fatigue lives haveexceeded, On the-.other hand, various degrauch: i:as. thermal fatigue, environmentally ass
CorrosiOn cracking. and flow-accelerated cr
':!Paetit" Notnhvst National Laboratory is operated forFrtergv by Rattelle Mcreoria) Institate utiter Contract DE-
•-c i ttributedt by tUse Pressure Vessels antd Pipint Divisi"Al- o" , PprsSURE VESSEL. I'tCHNOLOty. M•nusc
ion.n Januvary 20t)! re.ised masttucript rceirivcd Ocib
58 : Vol 123 FEBRUARY 2001
NEC
Life Prediction and Monitoring ofNuclear Power Plant Components,for Service-Related Degradation
=-JH¶!9elý
bc
gCre,
A:This paper describes industrv programs to 111anage soretiotrai degradation and to junatfycomttinttd opieration of nuilear conimpnttis wtthe une.pected degrodolioo /tos been en-cotuttered due to design materials antd/ot operational prohlems. Other issues hitoe beenrelated to operatint if comnponents beyond their original design life int cases where thereiS1 no evidence of fitigue crack initiation or other forims of struct'oal deitodetjit., Datafrom plant operating e.+terience have been apllied in combinhion tn lith itnserw'ice Inspec-tions and degradation mtnagenienr programs to ensure that the degradation nechanismsd1 not advein-el/ impact plant ste, t. Prohatilistic firctitre mechanics calcudt ionsv trepresetted to demonstrate how tomponlent failure probabilities can be tianaged thiroughatsugmented inservice inspection programs. [DO: 10. 1 I11 -1. 1344237.
ticipated during design, and have resulted in actual structural fail-have a ed that ures and early replacements and repairs to components.
y have assumed5 that This paper describes efforts in the nuclear industry to justifys fand piping systems continued operation. with parlicuhar alttenttion to componentts that')at failres of these have exhibited degradation or which may exceed original limitstus to plant risk (e.g.. based on predicted design lives. Two technical bases for cotttin-her countries the de- nied operation are presented. The first approach makes use ofC of piping and yes- knowledge gained from plant operating experience to identify aidring practices spcci- mrtanage degradation mnechanismss. These mechanisms ,nay notI Engineers . ASMEt have been anticipated during the design of the phlnt, but givenvely small nutnber of iheir actual occurrence have the potential to cause failuies byoperating experience stnall leaks, large leaks, or ruptures. The second approach ad-elE code procedures. dresses failure mnechanistis, such as fatigue. due to anticipatedcirfdesign lives (e.g.. plant operating transients. which design calculations show the po-peration beyond the tential for occurrence, but for which plant operating experience
ified: Therefore, the has not yet shown any evidence of actual occurrence. Probabilistic
Ictural reliability re- fracture mechanics calculations demonstrate that an augmented
aIse of operatitg ex- level of inservice inspection can ensure acceptahle fainture prob-
plant life extension abilities for fatigue critical components.
ponents (mechanical Management Programs for Service-Related Degrada-nteuauce, ae-ae
tits is not econoi- tionstic life predictions, Studies by Bush [ 1,2]. Janali [3]. Thomas 14J. and Wright et al.these predictions. A [5] have shtown that piping failures are generally due to opera-iponcnls continuecto tional conditions, materials selection, and design features that.risk relative to less were not adequately addressed or perhaps not addressed at all inus failures of active the design of plant systems. On the other hand, those tmechanisits
such as mechanical fatigue due to anticipated operational tran-as t[te life-limiting sients. which have been considered as part of the plant design.sel and piping cort- have been addressed in a very effective manner and ar' seldom (iflants. With an aging ever) fie cauIsC of service related failures.tural locations may Given the large number of potential service-related degradationcalculated values of mechanismns. the, tuclear insdustry has adopted monitoring and
no evidence of deg- mattaging practices, rather than life prediction and retirement
been approached or practices, to ensure safe and reliable systems. The strategy in-
dation mechanisms, volves the following steps:isted fatigue, stress - a reporting system to ensure that the industry can respond toosion. were not an- adverse operating experience (detecting of cracking or leakage)
-t . .t before unanticipated degradation mechanisms impact a large nuns-r[ie U.S. Department of ber of plants and/or result in safety significant. structural faitlures:
ACo6-76RIAt) 1830, augmented iiservice inspectiots that are targeted. to specilicrit frpicaived by he systems. materials, and/or operating conditions to ensure detection:ripi received• by the PVP
cr23, 2000. Editor: S. Y, of early stages (small cracks or minimal wall thinning) of degra-dation mechanisms:
Transactions. of the ASME
t
lotiteinthtprColpla19t
1g.'is-i
-455
55
'4
425
5-45'4- 5
-W
~r.
555
'1t-',
I'
era(Alder
.. (Al
(XSet
Sim,
rant
foretive
flit"uredesi(i.e.limi.met)
Ser
SttitalFailttion
I.,,'
51.?... .
iv
Fig, 1
Jour.
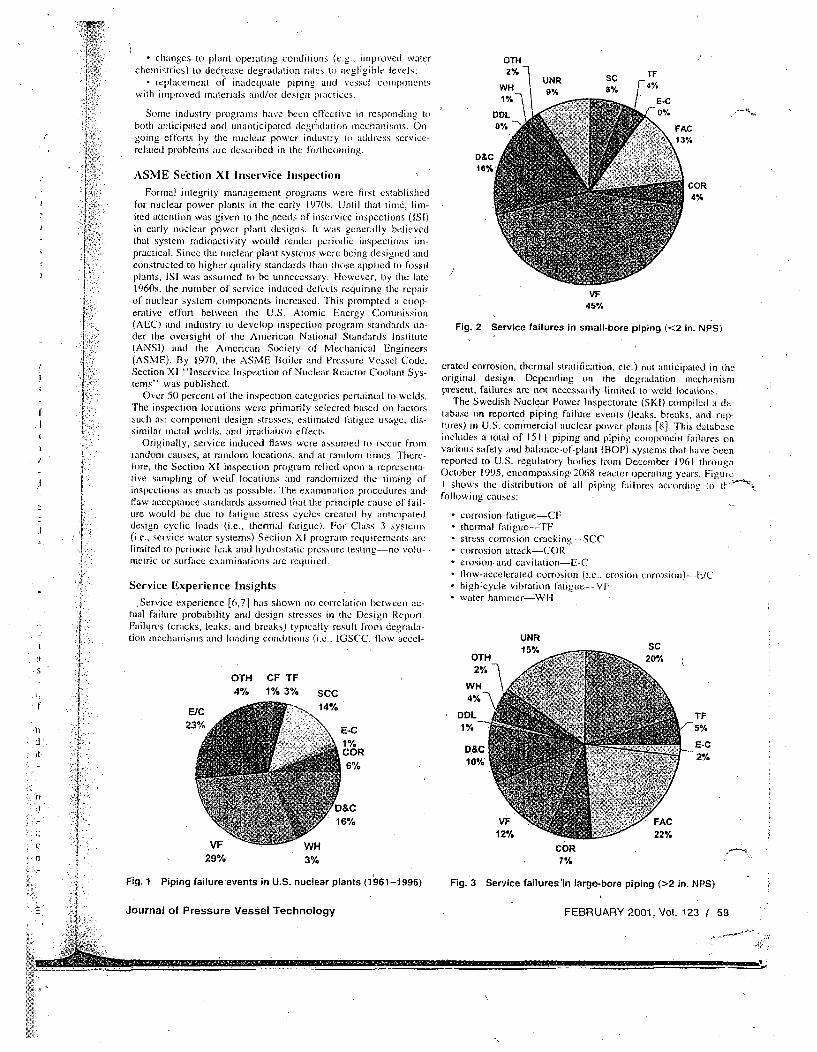
L * changes to plant operating conditions (e.g.. improved waterchemistries) to decease degradation rates to negligible levels:
- replacement of inadequate piping and vessel componentswith improved materials and/or design practices.
OTHUNR
WH 9%
DDL0% - ,
SC TF
8% E4%I•.d E-C0%•For
?
I
ft
f
Some industry programs have been elTectivc in responding toboth anticipated and unanticipated degradation mechanisms. On-going efforts by the nuclear power industry to address service-related problems are described in the fortltcomoing.
ASME Setction XT Inservicie InspectionFormal integrity management programs were first established
for nuclear power plants in the early 1970s. Until that tinet, lim-ited attention was given to the .needs of inservice inspections (ISI)in early nuclear power plant designs. It was generally believedthat system radioactivity would render periodic inspections im-practical. Since the nuclear plant systems were being designed aridconstructed to higher quality standards than those applied to fossilplants, ISI was assumed to be unnecessary. However, by the late1960s. the number of service induced delifcts requiring the repairof' nuclear system components increased. This prompted a coop-erative effort between the U.S. Atomic Energy Cotmmission(AEC) and industry to develop inspection program standards un-der the oversight of the American National Standards Institute(ANSI) and the American Society of Mechanical Engineers(ASME). By 1970, the ASME Boiler and Pressure Vessel Code,Section X1 :1'Inservice Inspection tof Nuclear Reactor Coolant Sys-teins' was published.
Over 50 percent of the inspection categories pertained to welds.The inspection locations were primarily selected based on factorssuch as: component design stresses, estiitated fatigue usage, dis-similar metal welds, and irradiation effects.
Originally, service--induced flaws were assumed to occur fromrandom causes, at random locations, and at random times. There-fore, the Section XI inspection program relied upon a representta-tive sampling of weld locations and randomized the timing ofinspections as much as possible. The examination procedures andflaw acceptance standards assumed that the principle cuise of fail-tire would be due to fatigue stress cycles created by anticipateddesign cyclic loads (i.e., thermal fatigue). For Class 3 systems(i.e., service water systems) Section XI program requirements arelimited to periodic leak and hydrostatic pressure testing-no volu-
* metric or surface examinations are required.
. Service Experience Insights
Service experience [6,7] has shown no correlation between ac-" tual failure probability anid design stresses in the Design Report.
Failures (cracks, leaks, and breaks) typically result from degrada-tion mechanisms and loading conditions (i.e.. IGSCC. flow accel-
COR4%
FAC
13%
VF45%
Fig. 2 Service failures in small-bore piping (<2 in. NPS)
crated corrosion, thermal stratification, etc.) not anticipated in theoriginal design. Depending on the degradation mechanismpresent, failures are not necessarily limited to weld locations.
The Swedish Nuclear Power lnspectorate (SKI) compiled a da-tabase on reported piping failure events (leaks. breaks, and rup-tures) in U.S. commercial nuclear power plants [8]. This databaseincludes a total of 151 I piping and piping ctnponent failures onvarious safety and balance-.of-plant (BOP) systetns that have beenreported to U.S. regulatory bodies frtom December 1961 throughOctober 1995, encomnpassing 2068 reactor operating years. FigureI shows the distribution of all piping failures according to tffollowing causes:
* corrosion tatigue-CF* thermal fatigue--'F-
s stress corrosion cracking---SCC* corrosion attackICOR
erosion and cavitation-E-Cflow-accelerated corrosion (i.e.. erosion corrosion)--...E/C
* high-cycle vibration fatitue-..-.VF* water hanumer--WH
D&C16%j
F UNR15%
'.1
m-$f
• n
it
e
n
IOTH CF TF4% 1% 3% SCC
14%E/C23%
OTH2%
WH
DDL1%
D&C10%
E-C1%COR
6%
TF/_5%
E.G2%
'D&C16%
VF29%
COR7%
Fig. 3 Service failures'in large-bore piping (>2 in. NPS)Fig. 1 Piping failure'events in U.S. nuclear plants (1§61-1996)
L:• Journal of Pressure Vessel Technology FEBRUARY 2001, Vol. 123 1 59
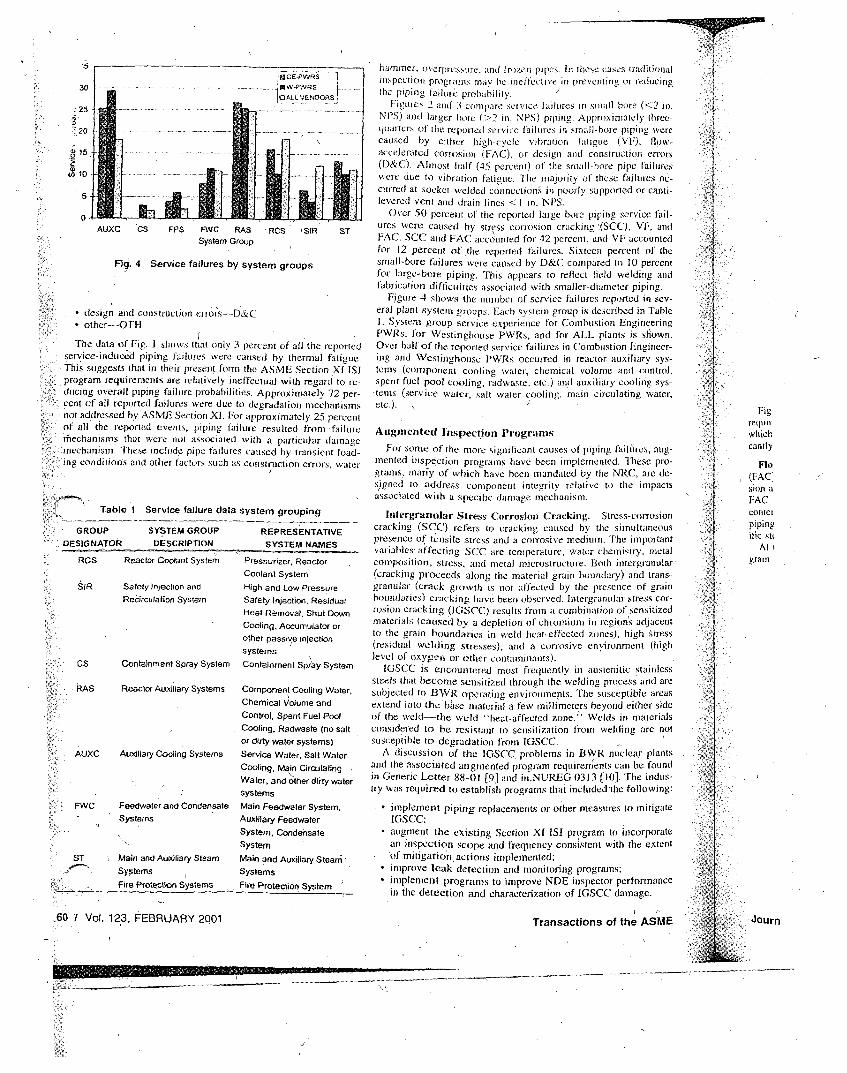
30- RW-PWRSO0ALLVENOORS
20
AUXC CS FPS FWC RAS RCS SIRSystem Group
Fig. 4 Service failures by system groups
. design and construction crrors--D&C- other-. -OTH
The data of Fig. I shows that only 3 percent of all the reportedservice-induce'd piping failures were caused by thermal fatigue.This suggests that itt their present firm the ASME Section Xt ISI.program requirements are relatively ineffectual with regard to re-ducing overall piping failure probabilities. Approximately 72 per-cent of all reported failures were due to degradation mechanisms"* not addressed by ASME Section X1. For approximately 25 percentof all the reported events, piping failure resulted from -faiturerfmechanisms that were not associated with a particular damagemechanism. These include. pipe failures caused by transient load-* ing conditions and other factors such as consttrction errors, water
Table 1 Service failure data system grouping
hamtnet, overpressure. and frozen pipes, In these cases traditionalinspection programs may be ineffective in preventing or reducingtie piping ta iluii probability. JFicures 2. and 3 compare service failuores in small bore (<2 in.NI'SI and larger bore (>2 in. NPS) piping. Approximately three-qumitcrs of tie reported service failures in small-bore piping werecaused by either hihv..cycle vibration fatigue (VF). flow-accelerated corrosion (FA). or design and construction errors(D&C). Almost half (45 percent) of the small-bore pipe failureswere due to vibration fatigue. The majority of these failures oc-curred at socket-welded connections in poorly supported or canti-levered vent and drain lines <I in. NPS.
Over 50 percent of the reiported large bore piping service fail-ures were caused by stress corrosion cracking fSCC). VF, andlFAC. SCC and FAC accounted for 42 percent, and VF accountedfor 12 percent of the reported failures. Sixteen percent of thesmall-bore failures were caused by D&C compared to 10 percentfor large-bore piping. This appears to reflect field welding andfabrication difficuilties associated with smaller-diameter piping.Figure 4 shows the ntumber of" service failures reported in sev-eral plant systetm groups. Each system group is described in TableI. System group service experience for Combustion EnigineeringPWRs, for Westinghouse PWRs. and for ALL plants is shrewn.Over half of the reported service failures in Combustion Engineer-ing and Westinghouse PWRs occurred itt reactor auxiliary sys-tetns (ColTmponent cooling water, chemical V/lunite and control.spent fuel pool cooling, radwaste. etc.) and auxiliary cooling sys-.terns (service water, salt water cooling, main circulating water,etc.).
Augmented Inspection ProgramrksFor some of the more significant causes of piping failiures, tug-mented iispection programs have been implemented. These pro-grams., maiy of which have been mandated by the NRC. are de-signed to address component integrity relative to the impactsassociated with a specific damage mechanism,Intergrassular Stress Corrosion Cracking. Stress-corrosioncracking (SCC) refers to cracking caused by tile simultaneouspresence of tensile stress and a corrosive mnedium. The importantvariables, affecting SCC are temperature, water chemistry, metalcomposiition, stress, arid metal inicrostnicture. Both intergranular(cracking proceeds alotg the material grain boundary) and trans-granular (crack growth is not affected by the presence of grainboundaries) cracking have been observed. Intergranular stress cor-rosion cracking (IGSCC) results from a coitbination of sensitizedmaterials (caused by a depletion of chromium in regions adjacentto the grain boundaries in weld heat-effected zones), high stress(residual welding stresses), and a corrosive environmeqt (highlevel of oxygen or other contaminants,).
IGSCC is encountered most frequently in austenitic stainlesssteels that become sensitized through the welding process and aresubjected to BWR operating environments. The susceptible areasextend into the baise material a few millimeters heyond either sideof the weld--the weld "heat-affected zone."? Welds in materialsconsidered to be resistant to sensitization fromn welding are notsusceptible to degradation from IGSCC.A discussion of the IGSCC problems in BWR nuclear plantsand the associated augmented program requirements can be foundin Generic Letter 88-01 [9] and intNUREG 0313 [10]. The indus-try was required to establish programs that included the following:* implement piping replacements or other measures to mitigate1GSCC:* augment the existing Section XI IS] program to incorporatean inspection scope and frequency consistent with the extentof mitigation actions irmplementedt• improve leak detection arid monitoring programs;
implement programs to improve NDE inspector performancein the detection and characterization of IGSCC damage.
Transactions of the ASME
GROUP SYSTEM GROUPDESIGNATOR DESCRIPTION
REPRESENTATIVE
SYSTEM NAMESRCS Reactor Coolant System
SIR Safety Injection and
Recirculation System
CS Containment Spray System
RAS Reactor Auxiliary Systems
AUXC Auxiliary Cooling Systems
FWC Feedwater and Condensate- ISystems
Pressurizer, ReactorCoolant SystemHigh and Low PressureSafety Injection, ResidualHeat Removal, Shut DownCooling, Accumulator orother passive injectionsystems
Containment Spray System
Component Cooling Water,Chemical Volume andControl, Spent Fuel PoolCooling, Radwaste (no saltor dirty water systems)
Service Water; Salt WaterCooting, Main CirculatingWater, and other dirty watersystems
Main Feedwater System,Auxiliary FeedwaterSystem, Condensate
System
Main and Auxiliary Steam 'Systems
Figreqkmilwhichcantdy
Fin(FACsion aFACcontetpipingioic sti
Atigrain
Journ
ST Main and Auxiliary Steam
Systems- Fire Protection Systems . Fire Protection System
60 I Vol. 123, FEBRUARY 2001
.. ..... .. ..g1l 11111111

1,20
e, 1.00
0.80
0.60
040
V)
0.20
0.00
NRC Bulletin 88-01 and____NLRW -0313 Rtev 2
bicdustry IryWiertents recirc ppk"gaugmrented irmpectlons andkxsplctior 305M pertorrnlncedemnvrstration - -
60 62 64 66 68 70 72 74 76 78 80 82 84 86 88 90 92 94
Fig. 5 BWR SCC failures per plant year
.Figure 5 shows that since the implementation of these program
reqtiretitents, the frequency Of IGSCC caused piping failures,
=:hich might otherwise have increased, has instead been signifi-
cantlv reduced,
Flow-Accelerated Corrosion. Flow-accelerated corrosion
(FAC) is a complex phenomenon that exhibits attributes of ero-
sion and corrosion in combination. Factors that influence whether
FAC is an issue are velocity, dissolved oxygen. pH. moisture
content of steam, and material chiromitum content. Carbon steel
piping with chromium content greater than I percent and austen-
itic steel piping is not susceptible to degradation front FAC.At the end of 1996, industry initiated efforts to develop a pro-
grran to address erosion-corrosion. These initial efforts were di-
rected at single-phase systetms.t Initial inspections were completedon all single-phase systems by 1989. Erosion-corrosion programswere in place on both single and two-phase by 1990 [I 1]. Sincethat time, service experience (Fig. 6) suggests that the'number offailures due to erosion-corrosion has been reduced.
EPRI report NSAC/202L [ 12] provides general guidelines forthe identilication and inspection of components subject to FACdegradation,
Corrosion Attack in Service Water Systems. - Uniformn cor-rosion attack in service water piping, microbiologically inducedcorrosion (MIC). crevice corrosion, and pitting were typicalcauses of failure events of pipe components grouped itt this cat-egory. Of these, MIC is the predominant corrosion mcrhantismn itt
0.
0i.
I.L.
70 72 74 76 78 80 82 ,84 86 88 90 92 94
Fig. 6 Erosion-corrosion failures per plant year
Journal of Pressure Vessel Technology
3'
FEBRUARY 2001, Vol. 123 /-61
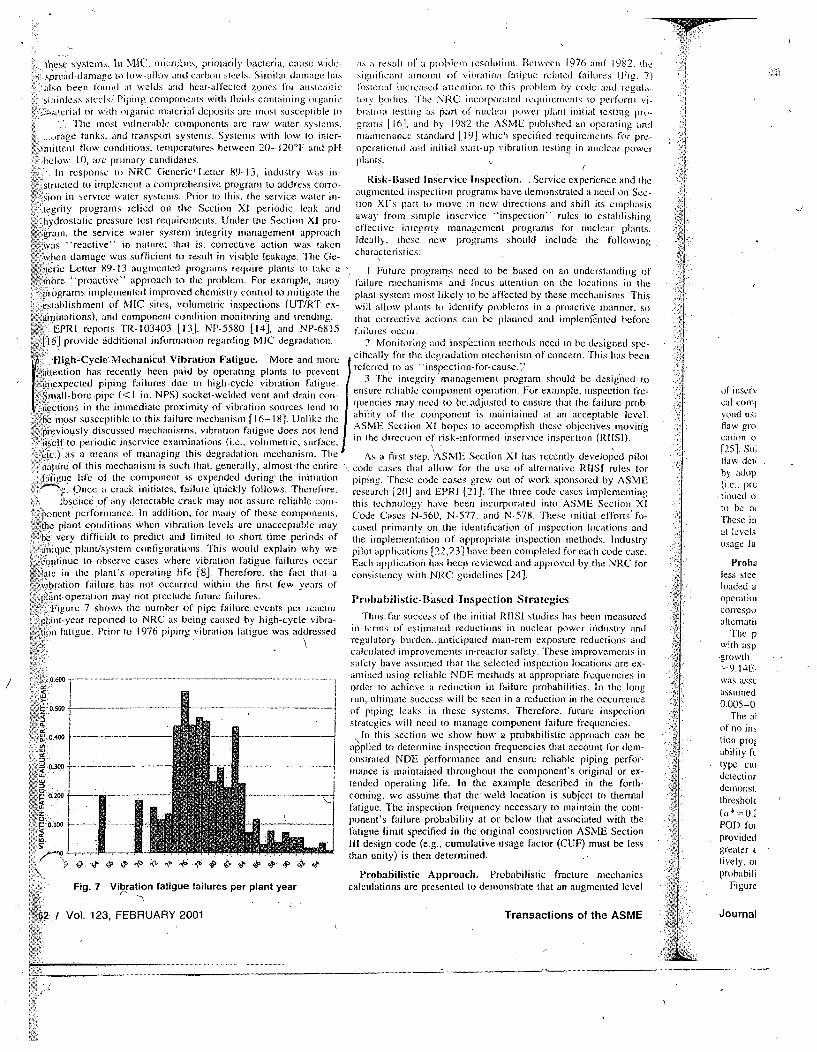
.1!ese systems. In MIC. nuicrobes, primarily bacteria, cause wIdC-sprc adodalaige to low-alloy and carbon steels. Similar damage has
also been found at welds and heat-affected z ones for austen iticsiinlessa seels: Pi fpipmg c( niopfnlnits With fluids containing organic
, erial or with organic material deposits are o'iost susceptible toThe most vulnerable components are raw water systems.
-rage tanks, and transport systems. Systems with low to inter-Ilittenlt flow conditions. lemperatures between 20 1201F and pft
be.low 10. are primary candidates.fin responsc to NRC Generic' Letter 89-13, industry was in-
st,'ucted to implement a comprehensive program to address corro-ison in service water systems. Prior to this. the service water in-
tegrity programs relied on the Section XI periodic leak antdh drostatic pressure test requirements. Under the Section XI pro-g rarn, the service water system integrity management approachwas 'reactive" in nature: that is. corrective action was takenaxhen damage was sufficient to result in visible leakaee. The Ge-
as a result of' a problem resolution. f3etwecen 1976 ,ind 19'82, disignilicani a moint if vilbration fatigue related failures (Fig.fostered increased attention to this problem by code and rea uhti,ry bodies. The NRC incorporated requirernelits to perforni vbratoin testing ;a part of' nuclear power plant initial testing prograrns [ 161, and by 1982 the ASME published an operating anmaintenance standard [19] which specified requirenients [or preoperational and initial start-up vibralion testing in nuclear powCplants,
Risk-Based Inaservice Inspection. ,.Service experience and IllatugmentCd i[nspectiori programs have demonstrated a need oin Secoion XI's part to move in new directions and shift its emphasi
away from simple inservice "inspection" rules to establishinleffective integrity management programns for nuclear plantsIdeally, these new programs should include the followincharacteristics:
IQ
7)
s
g
ncheric Letter 89-13 augmented programs require plants to take a , I Future prograns need to be based on an understanding of;'limnrc "proactive' approach to the problem. For example, many failure iechanisis and focus attention on the locations in the
programs implemented inmproved chemistry control to mitigate the plant system most likely to be affected by these mechanisms. Thiseotablishment of MIC sites, volumetric inspections (UT/RT ex will allow plants Ct identify problemns in a proactive manner, so•aininations), and component condition monitoring arid trending,. that corrective actions can be planned and implemented before
EPRI reports TR-103403 [131, NP-5580 [14], and NP-6815 failures occur.5[]iprovide additional information regarding MIC degradation. 2" Monitoring and inspection methods need to be designed spe-
High-Cycle.Mechanical V ibration Fatigue. More and more cifically for the degradation mechanism of concern. This has been
'atttention has recently been paid by operating plants to prevent referred to as "'insfieion-for-cause.'.
tunexpected piping faimlures hile to high.cyre vibration fatigue. 3 The integrity management program should be designed to
Sroall-bore pipe (< I in). NPS) socket-welded vent and drain con- ensure reliable component operation..For example, inspection fre-
n.ctions in the immediate proximity of vibration sources tend (o quencies may need Co beadjusted to ensure that the failure prob-be most susceptible to this failure tnechanisin [ 16-I1i. Unlike the ability of the component is maintained at ant acceptable level.
previously discussed mechanisins, vibration fatigue does not lend ASME Section Xl hopes to accoiplish these objectives movimig
itsel f to periodic inservice exam inations (i.e.. volumetric, sur. ace, in the direction ofs risk-urarn.ed inservice inspection (RIISI).etc . ýas a means iilmanagin eig this degaato mhaii.Te Aafrstepdgradation mechanism. Tie As a firstep. ASME Section XI has recently developed pilotnture oflthis rnechlnism is such that- generally, almost the entire code cases that allow for the use of alterative RIISI rules forfaleitiue life of the component is expended during the initiation piping. These code cases grew out of work sponsored by ASME
V. Once a crack initiates, failure iluickly follows. Therefore. research j201 and EPRI 01J. The three code cases implementing,.bsence of any detectable crack may not assure reliable coin- this technology have been incorporated into ASME Section Xl
poincnt performance. In addition, for many of these components, Code Cases N-560, N-577, and N-578. These initial efforts fo-ithe plant conditions when vibration levels are unacceptable may cused primarily on the identification of inspection locations and
"be very difficult to predict and limited to shoil time periods of the implementation of appropriate inspection methods. Industrytillique plant/system configurations. This would explain why we pilot applications [22 ,23] have been completed for each code case.cobntinuLe to observe cases where vibration fatigue failures occur Each application has been reviewed and approved by the NRC for1Aite in the plant's operating life [8]. Therefore, the fact that a consistencyv with NRC guidelines [24].sibration failure has not occurred within the first few vears ofpl:nt operation may not preclude future failures. Probahilistic-Based Inspection Strafegies
Fim ure 7 shows the number of pipe failure events per reactor Thus Carisucc ess e in itia Strategiesp1imt-year reported to NRC as being caused by high-cycle vibra- 'his far success of the initial RI1SI studies has been measuredlnon fatigue. Prior to 1976 piping vibration fatigue was addressed in terms of estimated reductions in nuclear power induistry and
:.
o tf i nset:'
cal cotilvond us;flaw procation o
125.1. Suiflaw detby adop(i.e.. pFictinued oto be atThese inat levelsusage fa
Probeless steeloaded aoperatiomcorrespoalhernatim
The pwith asp
•; .griowilto9.14F.
was aggs'
assunmed0(005-0
The aiiif no inolion profability fctype cuidetection
deionst.threshol,:(a* = 0.POT) fotprovidedgreaterlively, ni
probabili, Figure
5500'-'---. --.-----. -.-.------
05. .........-.--.--.. .1 0500
P 03100 ...... ..
Fig. 7 Vibration fatigue failures per plant year
62 I Vol. 123, FEBRUARY 2001
regulatory buroen., aiiticipated noan-rem exposure reductions andcalculated improvements innreactor safety. These improvements insafety have assumed that the selected inspection locations are ex-arnited using reliable NDE methods at appropriate frequencies inorder to achieve a reduction in failure probabilities. In the longrun, ultimate success will be seen in a reduction in the occurrenceof piping leaks in these systems. Therefore, future inspectionstrategies will need to manage component failure frequencies.
lin this section we show how a probabilistic approach call beapplied to determine inspection frequencies that account for dem.i-onstrated NDE performance and ensure reliable piping perfor-tiance is maintained throughout the component's original or ex-
tended operating life. In the example described in the forth-coniing, we assume that the weld location is subject to thermalfatigue. The inspection frequency necessary to maintain the cont-ponent's failure probability at or below that associated with thefatigue limit specified in the original construction ASME SectionIll design code (e.g., cumulative usage factor (CUF) must be lessthan unity) is then determined.
Probabilistic Approach. Probabilistic fracture mechanicscalculations are presented to demonstrate that an augmented level
Transactions of the ASME I Journal
............. ..........
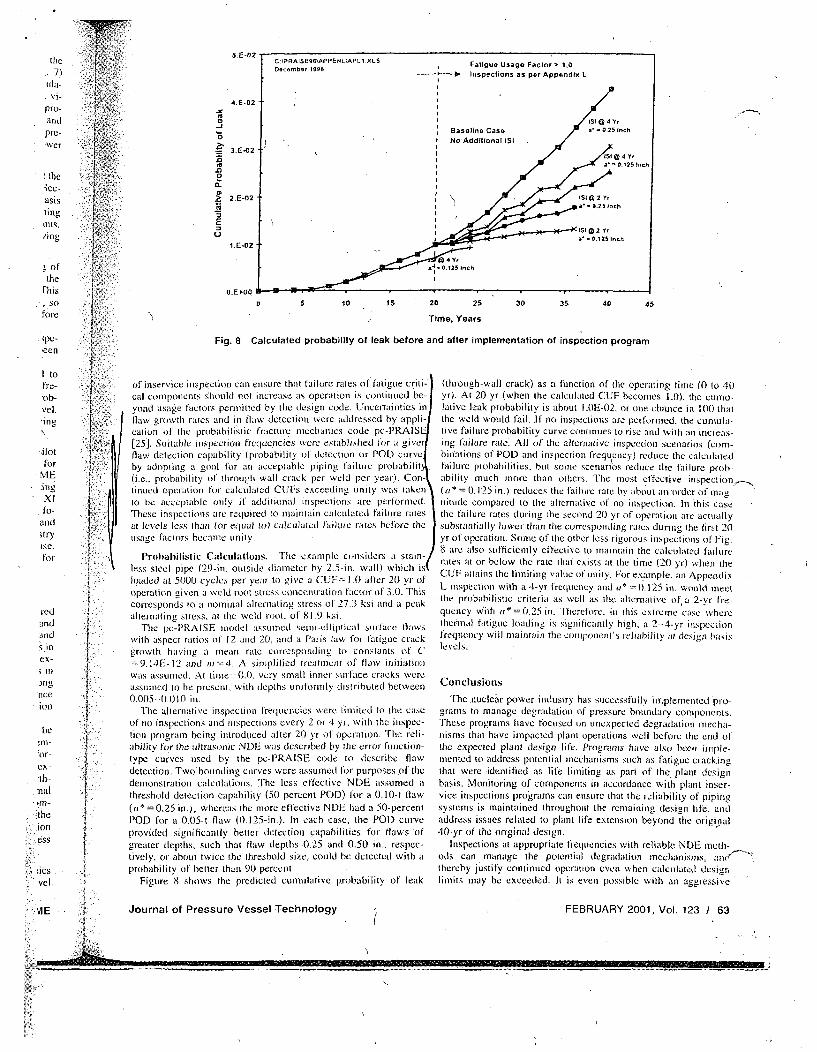
the.7)
ilia-vt-
pro-andpre-,Wer
the;ee-asislinglilt ,
ofthe
Fhis. sot•ore
• ;pe-een
I tolre--ob-vel.,ing
ilotfor
• ME:ing
* XIfo-
and3tryise,
for
redand-inds inex-
riceion
he,ral-
or-
.'Ih-
.,the
.ioness
• vel
IS SI @ 4 Y'..Baseline Case 2' = 0.25 55h" NsNo Additional ISI
3.E-02a" • D11 l5 1,
a.
._ 2.E-02
E-- a*IS] 0 25 Ync
a"=0.125 I-
1.E-02
II10 4 Y,
1-J 0.125 1-~h
OE0 0 lb05 10 Is 20 25 3D 35 40 45
Time, Years
Fig. 8 Calculated probability of leak before and after implementation of inspection program
of inservice inspection can ensure that failure lates of fatigue criti-"cal conponcnts sir ho o(. not increase as operation is cohtin Ued be-
yond usage factors permitted by the design code. Uncertainties inflaw growth rates aInd iin taw detection were addressed by appli-cation of the probabilistic fracture nmechanics code pc-PRAIS
(25]. Suitable inspection frequencies were establishied for a givefHaw detection capability iprobability of detection or POD curveby adopting a goal for art acceptable piping failure ptobabilitl(i.e.. probability of through-wall crack per weld per yearl. Coni-tinued ope~ratios for calculated CUFs exceeding unity was lakessto be acceptable onily itf additional inspectionst are performed.These inspections are required to maintain calculated failure ratesat levels less than for equal to) calculated failure rates befbre theusage factors becatne unity.
Probabilistic Calculations. The example considers a stain-less steel pipe (29-in, outside diameter by 2.5-in. wall) wihich isloaded at 5000 cycles per year to give a CUF= 1.0 after 20 yr ofoperation 6iven a weld root stress concentration factor of 3.0. Thiscorresponds to a nominal alternating stress of 27.3 ksi and a peakalternating stress. at the weld root, of 81.9 ksi.
The pc-PRAISE model assusned seisi-elliptical surface flawswith aspect ratios of 12 and 20, and a Paris law for fatigue crackgrowth having a Mean rate corresponding to constants of C=-9. I-4E- 12 and nr -4. A simplified treatment of flaw initiation
was assumed, At tiise=0.0, very small ttner surface cracks wereassurmed to be present, with depthsr uniformly distrihuted between0,0105. 0.0)10 in.
The alternative inspection frequencies were lisited to the caseof tno inspections and inspections every 2 or 4 yr. with the irspec-lion program being introduced after 20 yr of operation. The reli-ability fo)r the ultrasonic NDE was described by the error function-type curves used by the pc-PRAISE code to describe flawdetection. Two bounding curves were assumed for purposes of thedemonstration calculations. The less effective NDE assumed athreshold detection capability (50 percent POD) for a 0.10-t flaw((* =0.25 in.), whereas tile more effective NDIE had a 50-percentPOD for a 0.05-t flaw {0,.125-in.). hi each case, the POD curve
provided significantly better detection capabilities for flaws ofgreater depths, such that flaw depths .0.25 and 0.50 in., respee-Lively. or about twice the threshold size, could be detected with aprobability of belter than 90 percent.
Figure 8 shows the predicted cumulative probability of leak
(through-wall crack.) as a futnction of the operatinrg irme (0 it) 40yrl. At 20 yr (when the calculataed CUF becomes 1.0). tile cumu-lative leak probability is about I.0E-02, or one chance in 100 thatthie weld would fail. If rio inspections are perforimted, the cuntula-tive failure probability curve continues to rise and wiith as increas-ing failure rate, All (if the alternative irnspection scenarios (cort-binations of POD and inspection frequerincy) reduce the calculatedfailure probabilities. but some scenarios reduce the failure prob.ability much snore than others. The most effective inspection---,,(a* = 0. 125 in.) reduIces rite failure rate by about an order of rat__"tritude compared to tire alternative ofi no inspection. In this casetire failure rates during the second 20 yr of operation are actuallysubstantially lower than the corresponding rates during tile irst 2f1yr of operation. Sorte of tire other less rigorous inspections of Fig.8 are also suIfficiently effective to mairtain the calculated failurerates at or below tire rate that exists at the stime (20 yr) when theCIJ 'IF attains the limiting value o1 unity. For exaarnple. ain AppendixL inspection with a 4-yr frequency and a* = f. 125 ill. would meetthe probabilistie criteria as well as tire alternative of a 2-yr fre-quency sith s * = 0.25 itt. Therefore, in this extreme case wherethermal fatigue loading is significantly high, a 2 4-yr inspectionfreCtleicy will maintain file coripotteni's reltabiliti al designt ba.tsislevels.
Conclusions
The nuclear power industry has successfully implemtented pro-grans to manage degradation of pressure botndatry cornponentis.These programs have focused in utcxpected degradation rnecha-nissnls that have impacted plant operations well before trie end oftire expected plant design life. Programs have also breen iriple-rIented to address potential mechanisms suich as fatigue crackingthat were identified as life linriting as pan of tile plant designbasis. Moinitoring of components in accordance with plant inser-vice inspections programs can ensure that tite reliability of pipingsystetms is maintained throughout the remainingr design life, andatldress issues related to plant life extension beyond the original40 yr of the original design. r
Inspections at appropriate frequencies with reliable NDE stetlh-ods can manage the potential degradation mechanists, :'111thereby justify continued operation even when calculated desigtrlimits may be exceeded. It is even possible with asi aggressive
VIE Journal of Pressure Vessel Technology FEBRUARY 2001, Vol. 123 / 63
... .. ...... ..........
Itinspctiont pi rogratin to decrease fail ire freil tie ncies dlJ i J11 thC • eI"peniods of plant life to the same levcels that exisled rcla•tively carly
[ ... iii life.
1:By applying probabilistic methods, tutule iltspc)Ci t st A lelgICs
,-'~. cannot only be consistein with the s.rvice conditions and the dtcm-onst rated peiformane levels of the Nf)F. methods, but will etisirrethat the reliability of the piping is maintained over perioris ofCi:t" jontted operalion. Inspection stratleiclsC designed in this lash-ion, xill he a powerful addition to current risk-based ISImodels.
References
Hi tlusi, S. tl.. 198_ "Sta istic,- oI Pressune Vessel and Pipsng Failures."- A.,IFJ. Piesstue Vessel Techinol., 114, pit. 389-1959
121 lusth. S. I., 1992. "Failure Mechanisms in Nuclear Power Plant Piping Syst:.i.s.' AS;MII J. Pressure Vessel Technol.. JIt, pp. 225-233.
131 Jamali. K.. 1992, Pipe Fjiluresv in U.S. NCleaneiaj N l'er P ?ir Phtnts.EPRI TR 100380. prepared by tlatibutrion NUS, Gaithersburg. Maryland. forNorth.a hst Utilities Service Comp:ny and the Electric Power Research lnstilute.
01 Thosnas. H. M.. 1981, "Pipe and Vessel Failure Probatbiltlt." Pelhrthli, Fn-gi,,eers,,. 2. pp. 83- 124.
15] Wright. R. E.., Stevensot, J. A., and Zuroftl. W. F._ 19.54, Pip,. ,roci FeA -qiuer"cy k risaetforr JtaNuclear l-sier Pla-is, NIJRtSG/CR-4457, hd•o Na-tional ]Engineering L.aboratory, Idaho Falls. II).
[6) Kulal. S., Riccardella. P.. and Fougerousse. R.. 1995, 11-"thii, fjlnss-rirehIsprctirion Requirernnts.esr Clas.i 1, Caregor, H-J1 Presmer Retinin. WVelatrin Piping, ASME Section.Xl Task Group on IS1 Optiizu:ation. White PaperReport No. 92-01-01.
][7 EPRI, 19901, M•etl Fftigue in Operating Nar.heor Pooer- lantr.A Re,'ir- soit,':sr en sign Man ironioing Requi r-enrt.i FcotFailure lxperisn'.ce. and Reier.:nendsaionsfior ASME Section XI Action, prepared by ASME Boiler and Pres-sure Vessel Code., Section Xl Task Group on Fatigue in Operating Plants. tolSection Xi Winking Group on Operating Plant Criteria.
181 Bush. S. H.. Do. IM.I. t Slavich. A. L. and Chockie. A. D., 1996, Pipingl. ihtrres im thie Unieted Staites Ntucleatr Posier Plants: 1961...1995, SKI Reptrt1
[9] Miraglia. F,: J. Jr., 198,1, NRC PIositiouona, IGSCC in BWR Austenific Swttile.isSteel Piptrg--Ge-.Cerri Letter 88.01. U.S. Nuclear. Regulatory Coltnlissiton.
1t0' Ilazelota, W.. and Koo. W. HI., 1988, Terrni,:al Rep-tt t, Mteial.-Ii-ehcrroian'! 'Isi,.ee Gutiderliiie fssr CWR Clt~tirrt Pre' ..rite Btturttutr Pituting.NUREGY-0313. Rev. 2, U.S. Nuclear Regulatory Commnrission, Washinrgton,
i LiC, .
fillti: [ Ij 11. . C.. 19Rt), 1-rosfion/1Grro.sotn-hfucnd Pip, Wal~l 11 fnmng in U.S.
Mssr I " Po-,r l,'a I.i.NUJREG 1344, Division ot Eti'ci iimg atd Sv!ecttim+1t:rttolsgv.. !..SNR{-'. Washington. DC
2 I 1 FTRI. 1993,5. Ri.s...tr.t.,latia,ts 6i,r (i.. :'/f',t - I!' m / s-A( d ,' iNSAC.21}II... Eectric PFaser Resttrch hsmitts Id, Aili,. C.A.
It,,cktiu.s, P. R.. 09 3). i-rvi'e r ,Sct ret (ss,ttrsetr rtt;d Lt,'s, ti,,,S! fl'csb,,A . (PRI TR-103403, Electric Power Rest',:lrch lthi,ti rue, i
1h Alit,
.l4 1 i'tiroi. G . L . 198.S. ,Siin'r/i oo .ir M...../tr /.hirtlrt hTsA' ;/n/!uft , ( 'ttoson miN-.,sct' tv,'-r Planst NP- 5580, Elecric Powei Research Ilstitute. Palo Alto,(,A.
I L5 I .itina. G,. 1.. I1990. D eection W Cr trt l o! Mo c'r icologiciilly I. f'e-',ed"-,t ,t,•m -An I- i'.enrr•itn " rite So r elrct, k fiur ,ti;,cr init gitsi/t It!!ts rl .d
'1,.r..sion, NP-6815. Electric Powe r Research Institute, Palt Alto, CA.I 6j i)li ) 0. H., 1485, "Piping Vibration Experier nc Power Piann i ,t " i't is.:rr
V, .sm!(I art d/ Piprig TT'rh h.•gy --A D ec aid, of Pro gerss, Pressure Vessel lndPiping Division, ASME. NY, pp. 689-705.
[I7] EPR1. 1994, EPRI Fartiguei *fanaigteentr liiirirok. I.PRI TR-1104 53-4. Ft:eu itPower Re.5 ,tch Ilstitult, Pailo Alto. CA.
1181 Riccardella. P. C., Rosario, 1. A., and Gosselin, S. R., 1997, "Fraciure Me-chanics Analysis of Socket Welds undier High I Cyle Viliratirial l.,tding,."ASMENI PVP-.Vol. 353, pp. 3-:34.
[ 19J ASME, 199 1. .ASAE Cirde fri" Operration andl s•tli,,eutaice sI1 Nuiclea, P.s-erPlaons. Part .3. Requiremnentr fir P'rpteratiional antiil lial Stort-Utp T'sri,,gof Nucleor Potter iont Pil'fing Sy.rles, Ametican Society of MechanicalEngineers, New York. NY.
[210] ASME Resiachi t['ask Furce on Risk-Baed Inspection Guidcelites. 1992, Risk-Bt,.r,-d I•ia•p recr i - iD. vet'l'lln eur suf " (... iJeliti.o.' Vol,-iere 2.JA- '! P o Lic' fit lotte,
Reicrtor (LWR) Nuclear Pori, Piant Crntponentrs, 17RI'D-Vol. 2012, pub-lished by the American Society of Mechanical Fingincers Center foi Resercthaind iTechnoilogy Development.
[21] F'1RI. 1996. Risk-l forriimIet ,i iic-e In.specttr n Evaluation P rocedures. EPRITR-I16706. I l.:titric Poweir Researech Institute. Pak) Alto. CA.
1.22) Westinghouse Electric Coprpo}ration. 1997. Westinghsusie Otee.i (;,r,,q, Apli-retion i, Risk lnformed-Method- to Piping Trserice h,•rcpition - 7"opi'ts Re.purtr Revision II WECAP 14572. Revision I, work pe forimed by We.iimghouScElectric Ciorporation in collaboration with Northeast Utilitues and Viginia ,jPi..er fIn the Westinghouse Owners Group..
[231 ,EPR I, 1997. Applir.attior sf EPRt Risk--Infortned bnsireice ilspection Guide-linei to (..'I Phins, EPRI TR-107531. Volumes I and 2, Electric Power Re-search Institute. Paloi Alto. CA.,
[211 USNRC. 1997. Drafit Regulatoir Giuide DG1063- Atr Apt.... rss, ftr Plant-Speciric. Risk Inrformed Decistoinking: Inservice hlspecisii •1f Piping. U.S.Nuclear Regulaitory- Commissin,. Aug.
1251 Harris. D. 0.. and Dedhi.a, I, 1991. Th-r-i tirt'i anti U ,,rs M nual Irr, p, -PRAISE. A P,'oblbiistic Fttr rie W'chnitsi (;ootputer Case t 1e Piping Re-
liibilirstn Anrl.is, NUREG/CR-5864, U.S. Nuctra, Regulatory Co .o.iruissioni
Washingirni. DC.
.5
.5/"
{!
[
64 I Vol. 123, FEBRUARY-2001 Transactions ofthe ASME . -
1
a
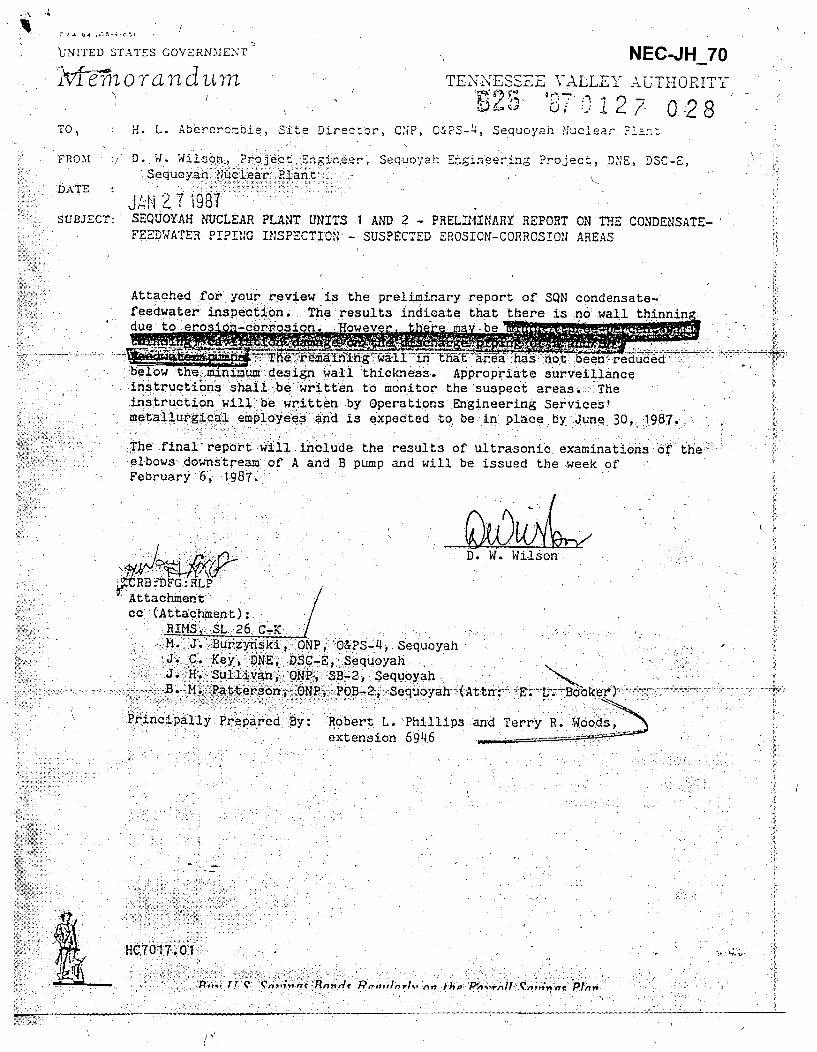
IUNITED STATES GOVERNIMENT
ivt morcandumNEC-JH 70
TENNESSEE VA_-LLEY. AUTHORITY
20 .Q, U 2? 0:28TO, H. L. Abercrc-_ie, Site Director, CNP, O&PS-4, Sequoyah Nuclear Fln:
FROM 0.W. Wilson, Project E-ginr-e, Sequoyah Engineering Project, DONE, DSC-E,Sequoyah Nuclear Plant
DlATE "
JA.,,'7 i98TSUBJECT: SEQUOYAH NUCLEAR PLANT UNITS I AND 2 - PRELfI1INARY REPORT ON THE CONDENSATE-
FEEDWATER PIPINGO ISPECTION SUSPECTED EROSION-CORROSIO,%l AREAS
Attached for your review is the preliminary report of SQN condensate-feedwater inspection. The results indicate that there is no wall thinningdue to ero -"corrosion. o~wevC h'emvb m"
-ae h*a~s not been reduced----:.below the minimum design wall thickness. Appropriate surve illanceinstructions shall be written to monitor the suspect areas. '.Theinstruction will be written by Operations Engineering Services'metallurgical employees and is expected to be in place by June,30, 1987.
The final report will include the results of ultrasonic examinations of theelbows downstream of A and B pump and will be issued the week ofFebruary 6, 1987.
D. W. Wilson
•RB FG:LrAttachment
cc (ALttachment):RIMS, SL 26ý C-_KM. J. Burzynski, ONP '&,PS.-4, ..Sequoyah
" J. C. Key, DNE, DSC-E, Sequoyah.J. H. Sullivan, ONP, SB-2, Sequoyah.
-B 14 Ptesn NPOB-2, Sequoyah- (Attn:, E. L--B6o-keor)-
Principally Prepared By: Robert L. Phillips
extension 694.6and Terry R. Woods~
I HC7017-01
P.. FT Q .Rn4Poll, n'h-.nwl*V";vrPlan"
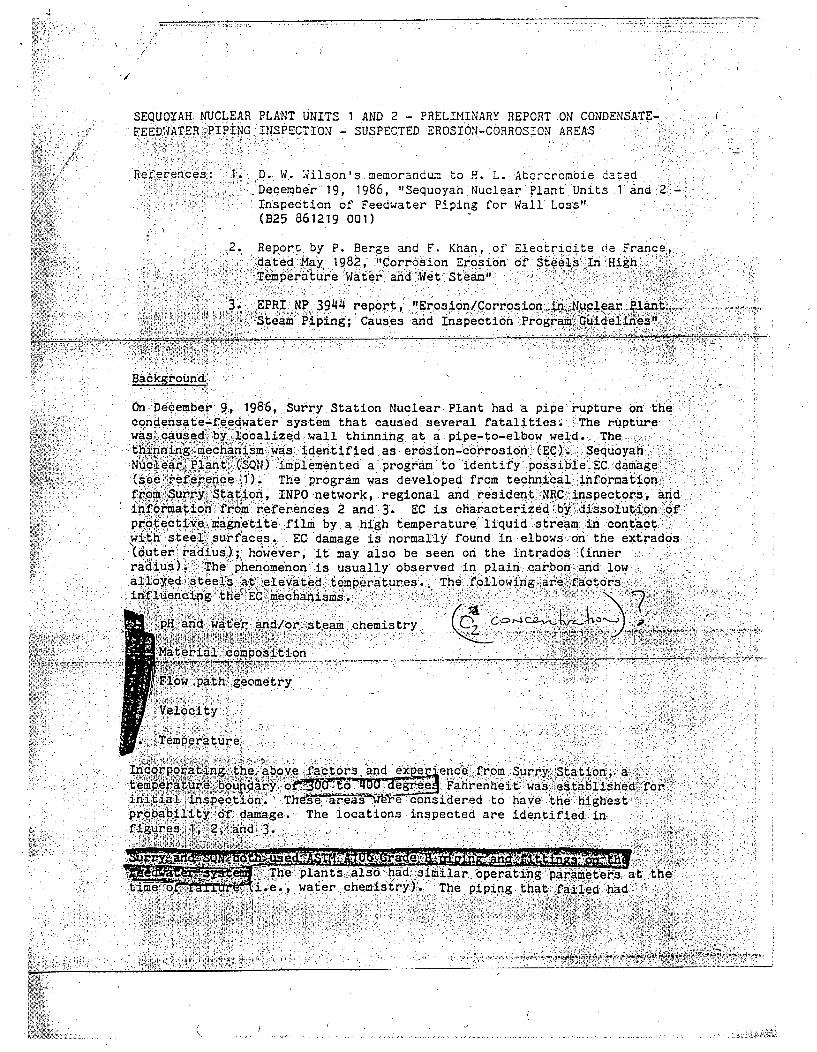
SEQUOYAH NUCLEAR PLANT UNITS 1 AND 2 - PRELIMINARY REPORT ON CONDENSATE--EEDATER PIPING INSPECTION SUSPECTED :EROSION-CORROSION AREAS.
Re..erences : D. W. Wilson's memorandu•z to H. L. Atcrcrombie da!-ad.. December" 19, 1986, "Sequoyah Nuclear Plant Units 1 and 2
Inspection of Feedwater Piping for Wall Loss"•C(B25 861219 001)
2. Report by P. Berge and F. Khan, of Electricite de France,
dated May. 1982, "Corrosion Erosion' of Ste•ls "in High: ., Te mperature Water and Wet Steam"
3. EPRI NP 39414 report, ".rso Cre o..iNc aPatSteam Piping;* Causes and Inspection Progra~m' Guiidelines".
Background
On-December 9, 1986, Surry Station Nuclear Plant had a pipe" rupture on thecondensate-feedwater system that caused several fatalities. !'The rupturewas caused by.localized wall thinning at a pipe-to-elbow weld. Thethinngni m chan*i'sm:was:identified as erosion-corrosion' (EC). Sequoya . .
(sNuclearelntc, 1Q). h iprogrmen a* program to 'identify possible EC dauiage''seerefrence..1Y,.. The program was developed from technical information: .from Surry, Station,, INPO network, regional and resident NRC inspectors, andinformation from:,references 2 and 3. EC is characterized by dissolutionofprotective. magnetite film by a high temperature liquid stream. in contact
..wi'th steelA surfaces. EC damage is normally found in elbows. on the extrados* (outer 'adius;) however, it may also be seen on the intrados (inner
radius). The& phenomenon is usually observed in plain carbon and lowalloyed steel~s'at elevated temperatures.~ The following are factorsinfluencing the E'C mechan.isms.....
pH and water and/or, steam chemistry C) C Z fe'
Material composition . ......
ýFlow path'geometry.
',Temperature
I1nQoppozating .the above factors and ex e *ecefrmury'atoa
temp.er.a.tue ..boundary E6. ee..ahrenheit was esinitial rinspect~ion. Thse. areas e considered to have the highestprobability of damage. The locations inspected are identified in
figures.l,ý2,.ahd 3.. . . , . .
- -' '' • . t"-• ": ' " •i''••';? ;'•• )" : ,
TTeplants, als~o had. similar operating p&araeters at theiewater chemistry)..', The piping that' failed had
• :~~~A. .' ', ' heA '.*...
K ; 7 ... ..
08/01/2008 20: 24 3017623511 NUVE'FLU O u.
The UT data was uniform and consistent and indicated that there was nothinning occurring as a result of EC, which would appear to be localizenareas of non-uniform thinning. With one exception, there were no readingsbelow the minimum thickness established in accordance with ANSIspecifications. -Wall thicknuess measurements taken on the discharge side ofthe feedwater pump on a 24- by lb-inch reducing elbow (Grid 2-FW-9) showedsome evidence of wall loss. This wall reduetion is believed to haveresulted from cavitation damage because of the large pressure drop thatexists at that Iccation. Although three-percent wall reduction was noted,the minimum wall acceptance criteria for this fitting had not beenviolated, and this area will be monitored for wall reduction in thefuture.
The Division of Nuclear Engineeving (DNE) had provided-fl--L~r~m• •J for the areas identified for
'UTer I rflfT . The inspections showed that. . -
Metallurgical Inspection
Metallurgical inspections were performed on A and C trains of units 1 and 2number 2 feedwater heaters. The locations are shown on figure 16. Boththe inlet and discharge piping and fittings were inspected. The inletpiping had some superficial patterns on its wall because of directimpingement from the number _ htank piging g re ematitewas observed on the ID, and .(seelocation 3,, figure 16). At -ocation 2, no req mSt. eo e-posed basemetal'was observed. On the discharge piping, the results were similar.Also, there was a backing-ring that had'. been pushed into the flow phthduring original installation. It showed no signs of wear and was coveredwith the protective magnetite film, even though it was in a severeenvironment.
Discussion
UT and metallurgical inspections indicated that no EC damage or significantthinning by other means was detected, although SQN has conduciveee ns. Hoee , II IIIIO PEMIPMR
The historyo -6 if Ma -3 Mgrry station isown. Previous inspections on the number 3.heater drain tank, the steamgenerator feedring header, and the feedring tee did-not reveal s rvice-
Induced damage. a~wfn(hJ-tuL~s were A106M aTaei §rDW ~~doije we-re as. g31 ft/sec.) Velocity of the 24- and 30-inch headers and fittings were12 ft/sec and 14 ft/sec respectively (see table 3). The propensity ofthe EC decreases with a decrease in velocity.
£

O6,!F1/2008 19:59 3017623511 NOVERFLO PAGE 05
K
Conclusions and Recommendations
The test data and inspection results indicared that EC damage had not
occurred in the areas examined. The selected areas were identified as the
highest probability areas. However, there may be other thinning mecnanasMs
occurring, t.e. cavitation. The lowest readings were found on the
discharge side of the feedwater pump on 24- by 16-inch reducing elbows.
None of these readings were below the design minimum wall thickness
specified by DUE. The elbows further downstreamQZthe A-and B pumps will
be examined ýa__final repon. The.i2in gupstrea of thea
a eedWater pbu should'es• ••p m aigne• pi a UamnaoDTCO
minimize the potential for EC damage throughout the balance of the lant
RLF:HC1/26/87HC7017.01 -
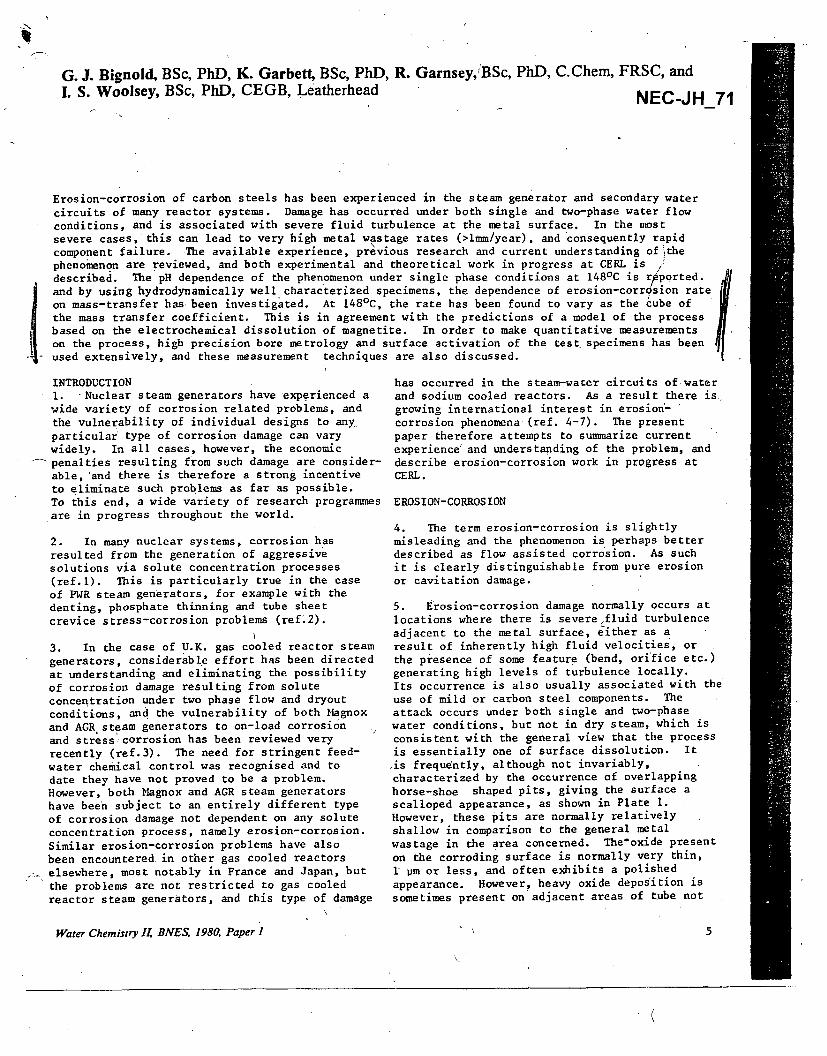
G. I. Bignold, BSc, PhD, K. Garbett, BSc, PhD, R. Garnsey,'BSc, PhD, C.Chem, FRSC, andI. S. Woolsey, BSc, PhD, CEGB, Leatherhead NEC-JH_71
Erosion-corrosion of carbon steels has been experienced in the steam generator and secondary watercircuits of many reactor systems. Damage has occurred under both single and two-phase water flowconditions, and is associated with severe fluid turbulence at the metal surface. In the mostsevere cases, this can lead to very high metal wastage rates (>1mm/year), and 'consequently rapidcomponent failure. The available experience, previous research and current understanding ofithephenomenon are reviewed, and both experimental and theoretical work in progress at CERL is /described. The pH dependence of the phenomenon under single phase conditions at 148 0 C is rfported.and by using hydrodynamically well characterized specimens, the dependence of erosion-corrosion rateon mass-transfer has been investigated. At 148 0 C, the rate has been found to vary as the cube ofthe mass transfer coefficient. This is in agreement with the predictions of a model of the processbased on the electrochemical dissolution of magnetite. In order to make quantitative measurementson the process, high precision bore metrology and surface activation of the test specimens has beenused extensively, and these measurement techniques are also discussed. qINTRODUCTION1. Nuclear steam generators have experienced awide variety of corrosion related problems, andthe vulnerability of individual designs to any-particular type of corrosion damage can varywidely. In all cases, however, the economicpenalties resulting from such damage are consider-able, 'and there is therefore a strong incentiveto eliminate such problems as far as possible.To this end, a wide variety of research programmesare in progress throughout the world.
2. In many nuclear systems, corrosion hasresulted from the generation of aggressivesolutions via solute concentration processes(ref.l). This is particularly true in the caseof PWR steam generators, for example with thedenting, phosphate thinning and tube sheetcrevice stress-corrosion problems (ref.2).
3. In the case of U.K. gas cooled reactor steamgenerators, considerable effort has been directedat understanding and eliminating the possibilityof corrosion damage resulting from soluteconcentration under two phase flow and dryoutconditions, and the vulnerability of both Magnoxand AGR. steam generators to on-load corrosionand stress corrosion has been reviewed veryrecently (ref.3). The need for stringent feed-water chemical control was recognised and todate they have not proved to be a problem.However, both Nagnox and AGR steam generatorshave been subject to an entirely different typeof corrosion damage not dependent on any soluteconcentration process, namely erosion-corrosion.Similar erosion-corrosion problems have alsobeen encountered in other gas cooled reactorselsewhere, most notably in France and Japan, butthe problems are not restricted to gas cooledreactor steam generators, and this type of damage
has occurred in the steam-water circuits of waterand sodium cooled reactors. As a result there is.,growing international interest in erosion- 'corrosion phenomena (ref. 4-7). The presentpaper therefore attempts to summarize currentexperience' and understanding of the problem, anddescribe erosion-corrosion work in progress atCERL.
EROSION-CORROSION
4. The term erosion-corrosion is slightlymisleading and the phenomenon is perhaps betterdescribed as flow assisted corrosion. As suchit is clearly distinguishable from pure erosionor cavitation damage.
5. Erosion-corrosion damage normally occurs atlocations where there is severe fluid turbulenceadjacent to the metal surface, either as aresult of inherently high fluid velocities, orthe presence of some feature (bend, orifice etc.)generating high levels of turbulence locally.Its occurrence is also usually associated with theuse of mild or carbon steel components. Theattack occurs under both single and two-phasewater conditions, but not in dry steam, which isconsistent with the general view that the processis essentially one of surface dissolution. It
,is frequently, although not invariably,characterized by the occurrence of overlappinghorse-shoe shaped pits, giving the surface ascalloped appearance, as shown in Plate I.However, these pits are normally relativelyshallow in comparison to the general metalwastage in the area concerned. The-oxide presenton the corroding surface is normally very thin,I Vm or less, and often exhibits a polishedappearance. However, heavy oxide deposition issometimes present on adjacent areas of tube not
Water Chemistry II. BNES, 1980, Paper I 5
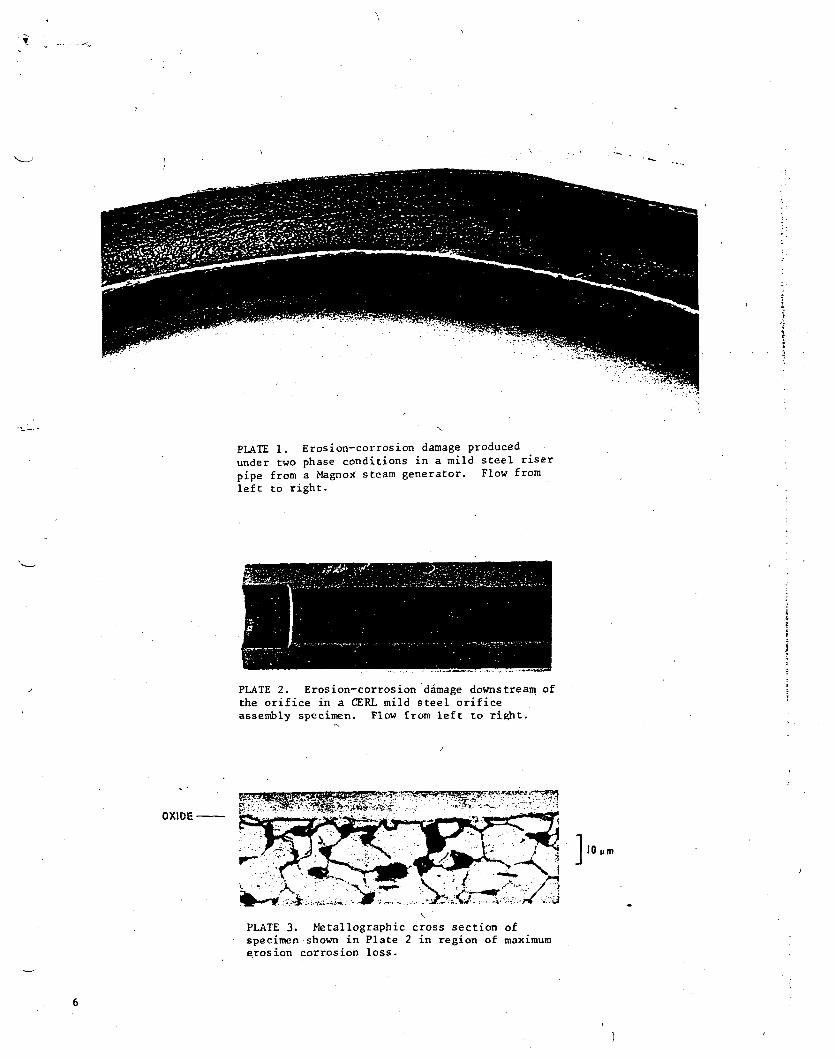
PLATE 1. Erosion-corrosion damage producedunder two phase conditions in a mild steel riserpipe from a Magnox steam generator. Flow fromleft to right.
4
PLATE 2. Erosion-corrosion damage downstream ofthe orifice in a CERL mild steel orificeassembly specimen. Flow from left to right.
OXIDE -
110 Pm
*N~- ~N7 )~
PLATE 3. Metallographic cross section ofspecimen-shown in Plate 2 in region of maximumerosion corrosion loss.
ý6
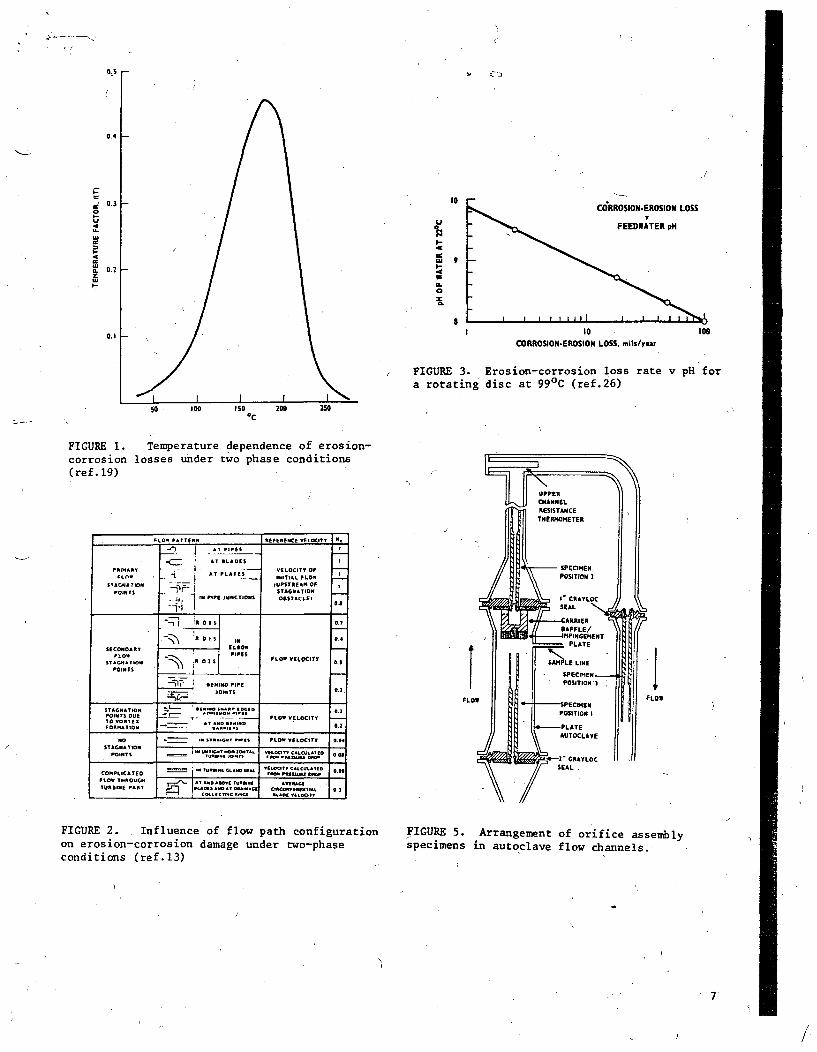
0.4
0.3
0- 0U
w
0,!
I0
U0
0-4
w .9I-43IL0z
S
CORROSION-EROSION LOSS
I I I ~ I I I~ it I J I I,"
I I0 100.CORROSION-EROSION LOSS. mil/yev
FIGURE 3. Erosion-corrosion loss rate v pH fora rotating disc at-990 C (ref.26)
ISo, C
FIGURE 1. Temperature dependence of erosion-corrosion losses under two phase conditions(ref. 19)
;tOw P'TTERN REFPRENCE VELOCITY Kc
- ! AT SLADES
PIM.ARY . . - VELOCITY OFFL .-. AT P. INITIAL FLOW
POINTS STAGNATION-T-IIAIORIN PIPE IUNCTIONS OOSTACLEI
0.3
'It D I S 0.4
SECONOART EL:ONFLOW PIPES
ST. T Z N 02$ FLOW VELOCITY
I.)
DOINTS
-'"•• SENINO pipe'
JOINTS
STAGNATION L 0(11.0 $MAIt 60000POINTS OUE •r-- , FLO V LO ITTO VORTEX I I.- FLOW VELOCITY -0
STAGNATION
POINTS T.a..,I~ ,f5ONWN
CONPLIC.STEO _SA PRS' *WA.Nss.o 0...FLOW TARO UG H r -- . AT AATIRA- I
FICURE 2. . Influence of flow path configurationon erosion-corrosion damage under two-phaseconditions (ref.13)
IPLOW FLOW
FIGURE 5. Arrangement of orifice assemblyspecimens in autoclave flow channels.
7
/1
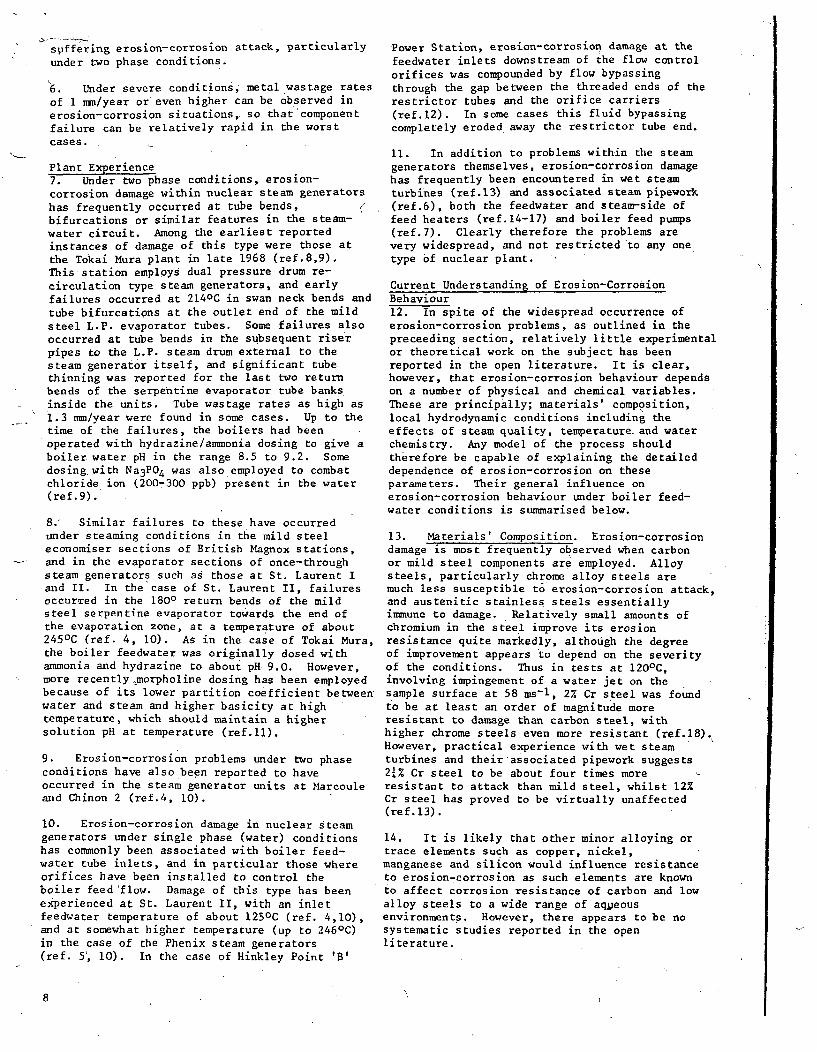
s ffering erosion-corrosion attack, particularly
under two phase conditions.
6. Under severe conditions, metal wastage ratesof I rm/year or even higher can be observed in
erosion-corrosion situations, so that component
failure can be relatively rapid in the worst
cases.
Plant Experience7. Under two phase conditions, erosion-corrosion damage within nuclear steam generators
has frequently occurred at tube bends,bifurcations or similar features in the steam-water circuit. Among the earliest reportedinstances of damage of this type were those atthe Tokai Mura plant in late 1968 (ref.8,9).This station employs dual pressure drum re-
circulation type steam generators, and earlyfailures occurred at 2140C in swan neck bends andtube bifurcations at the outlet end of the mildsteel L.P. evaporator tubes. Some failures alsooccurred at tube bends in the subsequent riserpipes to the L.P. steam drum external to thesteam generator itself, and significant tubethinning was reported for the last two returnbends of the serpentine evaporator tube banksinside the units. Tube wastage rates as high as1.3 mm/year were found in some cases. Up to thetime of the failures, the boilers had beenoperated with hydrazine/ammonia dosing to give aboiler water pH in the range 8.5 to 9.2. Somedosing.with Na 3 PO 4 was also employed to combatchloride ion (200-300 ppb) present in the water(ref.9).
8.' Similar failures to these have occurredunder steaming conditions in the mild steeleconomiser sections of British Magnox stations,and in the evaporator sections of once-throughsteam generators such as those at St. Laurent Iand II. In the case of St. Laurent II, failuresoccur-red in the 1800 return bends of the mildsteel serpentine evaporator towards the end ofthe evaporation zone, at a temperature of about2450C (ref. 4, 10). As in the case of Tokai Mura,the boiler feedwater was originally dosed withammonia and hydrazine to about pH 9.0. However,more recently •morpholine dosing has been employedbecause of its lower partition coefficient betweenwater and steam and higher basicity at hightemperature, which should maintain a highersolution pH at temperature (ref.ll).
9. Erosion-corrosion problems under two phaseconditions have also been reported to haveoccurred in the steam generator units at Marcouleand Chinon 2 (ref.4, 10).
10. Erosion-corrosion damage in nuclear 9teamgenerators under single phase (water) conditionshas commonly been associated with boiler feed-water tube inlets, and in particular those whereorifices have been installed to control theboiler feed 'flow. Damage of this type has beenexperienced at St. Laurent II, with an inletfeedwater temperature of about 1250C (ref. 4,10),and at somewhat higher temperature (up to 246 0 C)in the case of the Phenix steam generators(ref. 5!, 10). In the case of Hinkley Point 'B'
Power Station, erosion-corrosion damage at the
feedwater inlets downstream of the flow controlorifices was compounded by flow bypassingthrough the gap between the threaded ends of therestrictor tubes and the orifice carriers(ref.12). In some cases this fluid bypassingcompletely eroded away the restrictor tube end.
11. In addition to problems within the steamgenerators themselves, erosion-corrosion damagehas frequently been encountered in wet steamturbines (ref.13) and associated steam pipework(ref.6), both the feedwater and steam-side offeed heaters (ref.14-17) and boiler feed pumps(ref.7). Clearly therefore the problems arevery widespread, and not restricted to any onetype of nuclear plant.
Current Understanding of Erosion-CorrosionBehaviour12. In spite of the widespread occurrence oferosion-corrosion problems, as outlined in thepreceeding section, relatively little experimentalor theoretical work on the subject has beenreported in the open literature. It is clear,however, that erosion-corrosion behaviour dependson a number of physical and chemical variables.These are principally; materials' composition,local hydrodynamic conditions including theeffects of steam quality, temperature. and waterchemistry. Any model of the process shouldtherefore be capable of explaining the detaileddependence of erosion-corrosion on theseparameters. Their general influence onerosion-corrosion behaviour under boiler feed-water conditions is summarised below.
13. Materials' Composition. Erosion-corrosiondamage is most frequently observed when carbonor mild steel components are employed. Alloysteels, particularly chrome alloy steels aremuch less susceptible to erosion-corrosion attack,*and austenitic stainless steels essentiallyimmune to damage. Relatively small amounts ofchromium in the steel improve its erosionresistance quite markedly, although the degreeof improvement appears to depend on the severityof the conditions. Thus in tests at 120 0 C,involving impingement of a water jet on thesample surface at 58 ms- 1 , 2% Cr steel was foundto be at least an order of magnitude moreresistant to damage than carbon steel, withhigher chrome steels even more resistant (ref.18).However, practical experience with wet steamturbines and their associated pipework suggests21% Cr steel to be about four times moreresistant to attack than mild steel, whilst 12%Cr steel has proved to be virtually unaffected(ref. 13).
14. It is likely that other minor alloying ortrace elements such as copper, nickel,manganese and silicon would influence resistanceto erosion-corrosion as such elements are knownto affect corrosion resistance of carbon and lowalloy steels to a wide range of aqueousenvironments. However, there appears to be nosystematic studies reported in the openliterature.
8
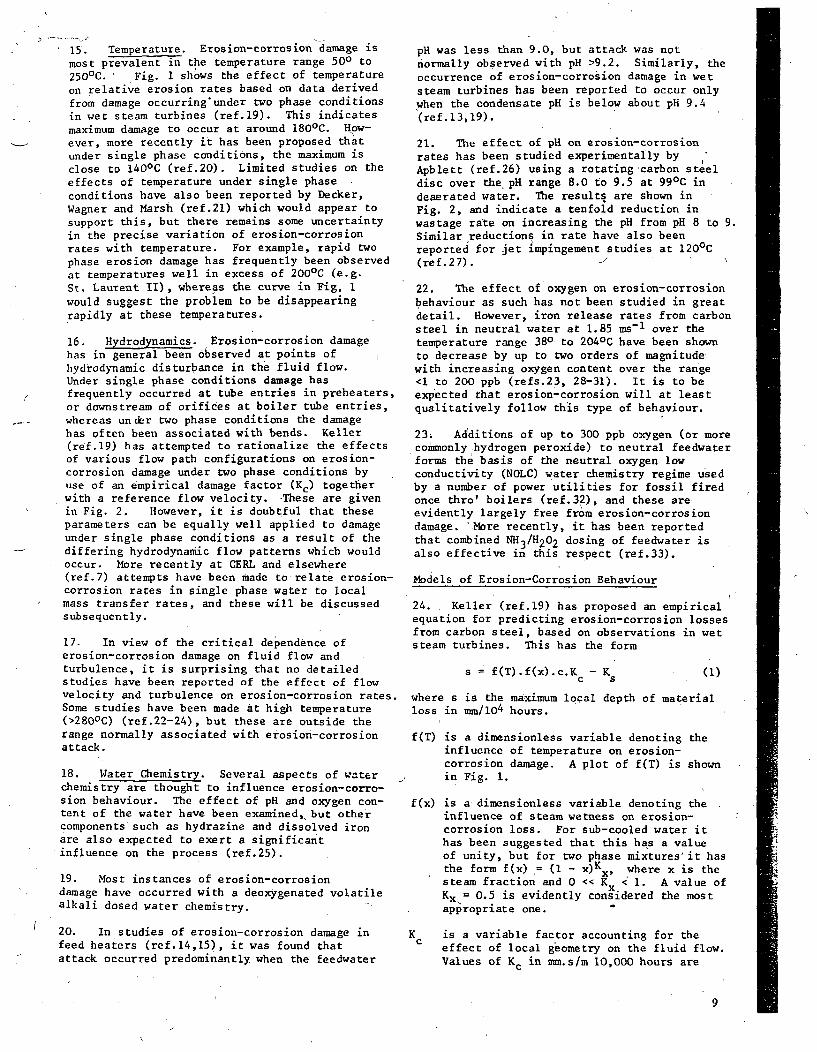
15. Temperature. Erosion-corrosion damage is
most prevalent in the temperature range 500 to
250 0 C. Fig. 1 shows the effect of temperatureon relative erosion rates based on data derived
from damage occurring'under two phase conditionsin wet steam turbines (ref.19). This indicatesmaximum damage to occur at around 180 0 C. How-
ever, more recently it has been proposed thatunder single phase conditions, the maximum is
close to 140 0 C (ref.20). Limited studies on theeffects of temperature under single phaseconditions have also been reported by Decker,Wagner and Marsh (ref.21) which would appear tosupport this, but there remains some uncertaintyin the precise variation of erosion-corrosionrates with temperature. For example, rapid twophase erosion damage has frequently been observedat temperatures well in excess of 2000 C (e.g.St. Laurent II), whereas the curve in Fig. Iwould suggest the problem to be disappearing
rapidly at these temperatures.
16. Hydrodynamics. Erosion-corrosion damagehas in general been observed at points ofhydrodynamic disturbance in the fluid flow.Under single phase conditions damage has
( frequently occurred at tube entries in preheaters,or downstream of orifices at boiler tube entries,whereas under two phase conditions the damagehas often been associated with bends. Keller(ref.19) has attempted to rationalize the effects.of various flow path configurations on erosion-corrosion damage under two phase conditions byuse of an empirical damage factor (Kc) togetherwith a reference flow velocity. -These are givenin Fig. 2. However, it is doubtful that theseparameters can be equally well applied to damageunder single phase conditions as a result of thediffering hydrodynamic flow patterns which wouldoccur. More recently at CERL and elsewhere(ref.7) attempts have been made to relate erosion-corrosion rates in single phase water to localmass transfer rates, and these will be discussedsubsequently.
17. In view of the critical dependence oferosion-corrosion damage on fluid flow andturbulence, it is surprising that no detailed
studies have been reported of the effect of flowvelocity and turbulence on erosion-corrosion rates.Some studies have been made at high temperature(>280 0 C) (ref.22-24), but these are outside therange normally associated with erosion-corrosionattack.
18. Water Chemistry. Several aspects of waterchemistry are thought to influence erosion-corro-sion behaviour. The effect of pH and oxygen con-tent of the water have been examined;, but othercomponents such as hydrazine and dissolved ironare also expected to exert a significantinfluence on the process (ref.25).
19. Most instances of erosion-corrosiondamage have occurred with a deoxygenated volatilealkali dosed water chemistry.
20. In studies of erosion-corrosion damage infeed heaters (ref.14,15), it was found thatattack occurred predominantly when the feedwater
pH was less than 9.0, but attack was notnormally observed with pH >9.2. Similarly, theoccurrence of erosion-corrosion damage in wetsteam turbines has been reported to occur onlywhen the condensate pH is below about pH 9.4(ref.13,19).
21. The effect of pH on erosion-corrosionrates has been studied experimentally byApblett (ref.26) using a rotating-carbon steeldisc over the pH range 8.0 to 9.5 at 99 0 C indeaerated water. The results are shown inFig. 2, and indicate a tenfold reduction inwastage rate on increasing the pH from pH 8 to 9.Similar reductions in rate have also beenreported for jet impingement studies at 1200 C(ref.27).
22. The effect of oxygen on erosion-corrosionbehaviour as such has not been studied in greatdetail. However, iron release rates from carbonsteel in neutral water at 1.85 ms- 1 over thetemperature range 380. to 2040 C have been shownto decrease by up to two orders of magnitudewith increasing oxygen content over the range<1 to 200 ppb (refs.23, 28-31). It is to beexpected that erosion-corrosion will at leastqualitatively follow this type of behaviour.
23. Additions of up to 300 ppb oxygen (or morecommonly hydrogen peroxide) to neutral feedwaterforms the basis of the neutral oxygen lowconductivity (NOLC) water chemistry regime usedby a number of power utilities for fossil firedonce thro' boilers (ref.32), and these areevidently largely free from erosion-corrosiondamage. 'More recently, it has been reportedthat combined NH3 /H 2 02 dosing of feedwater isalso effective in this respect (ref.33).
Models of Erosion-Corrosion Behaviour
24. Keller (ref.19) has proposed an empiricalequation for predicting erosion-corrosion lossesfrom carbon steel, based on observations in wetsteam turbines. This has the form
s = f(T).f(x).c.K - Kc 5 (1)
where s is the maximum local depth of materialloss in mm/10 4 hours.
f(T) is a dimensionless variable denoting theinfluence of temperature on erosion-corrosion damage. A plot of f(T) is shownin Fig. 1.
f(x) is a dimensionless variable denoting theinfluence of steam wetness on erosion-corrosion loss. For sub-cooled water ithas been suggested that this has a valueof unity, but for two phase mixtures' it hasthe form f(x)= (I - x)K where x is thesteam fraction and 0 << Kx <1 . A value ofKx. = 0.5 is evidently considered the mostappropriate one.
Kc is a variable factor accounting for the
effect of local geometry on the fluid flow.
Values of Kc in mm.s/m I10,000 hours are
9

( (I-.0
,-.------5 -.-.- IAir release valve
Deinied atr nk PupL.R t nf BL.R. ionOeiniedwtetan pmpA e change exchangeMain circulation pump
Cartridge liler -C T
PAPC
Tank PC !ankVCP TankC PC tan I PressurizerI A / B /C L
4-OP T )
PA P T P T
,~ ~ ~ ~~ ~~~~~- Man -/- • ,. '""-'<"Misspl
N~
I BypassPurn um Priming T 0IK/
A metcoolerer-3 Kg/h
Main
Flow Mains supply
Mains ooling I
Condu~ctivity I " - - . / J --
supplyy
mCotroiervity
Mainais Coolngp
Conductivitytycotole Coln water
--- o -- T
F IfI i
Venturi I5
I I I
I T
I IC- F -. F•
Venturi 1 I Vent
Heater 1 Up to 1031 Kg/h each plate sample
T
Venturi4
Tube Tubesample 1 sampfe2
Vri 3
Venturi 3
P T/C
Healer2
T
208 Kg/h either sample, not both
P Pressure gaugeT ThermometerTC Thermometerlcontrot
*F Flow indicator/controlPC Pressure controlL Level indicator/control
FIGURE 4. Isothermal Rig flow diagram
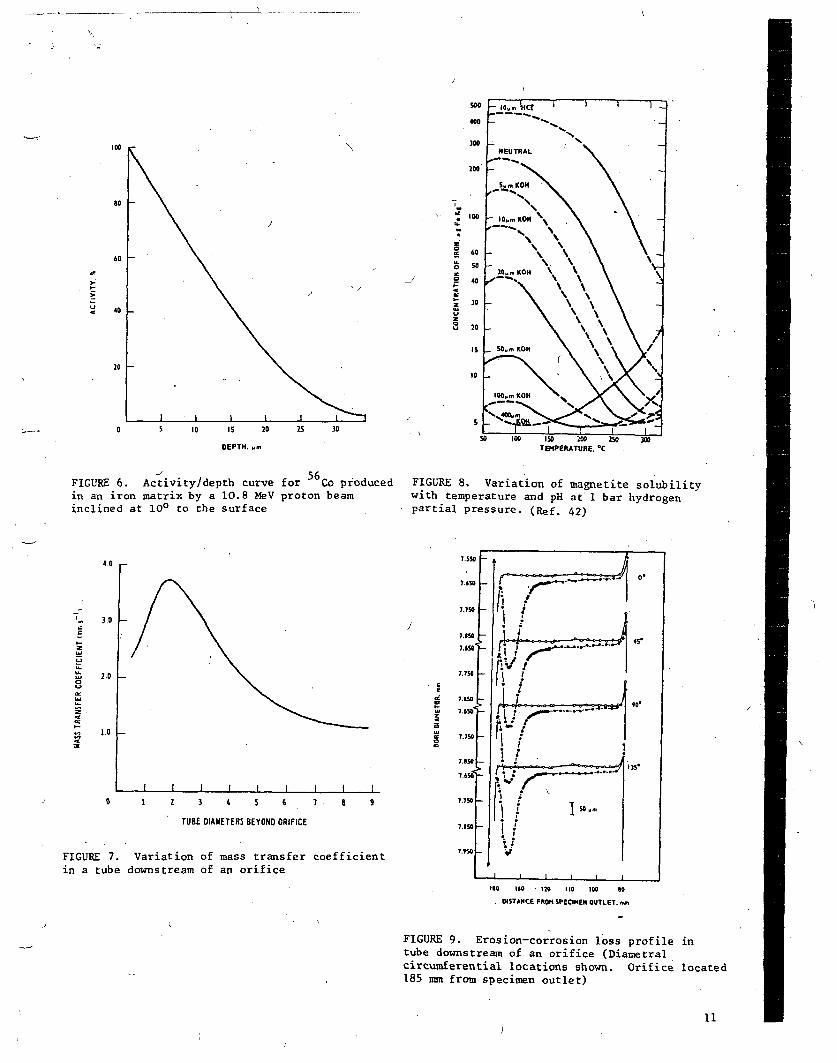
500
400
100
80
60
40
Do0
200
100
S 60
Sso
2 4o
U 20
0t.
Is
20 to
0 10
DEPTH.. TEMPERATURE. °C
56FIGURE 6. Activity/depth curve for Co producedin an iron matrix by a 10.8 MeV proton beaminclined at 100 to the surface
FIGURE 8. Variation of magnetite solubilitywith temperature and pH at' bar hydrogenpartial pressure. (Ref. 42)
4.0 F-
EE
I-
0
30 j
2.0 1- U
U
1.0
I I I I I I I I I
1 2 3 4 5 6 7 a 9
TUBE DIAMETERS BEYOND ORIFICE
FIGURE 7., Variation of mass transfer coefficient
in a tube downstream of an orifice
ItO 160 , 120 Ito 100 t0
, DISTANCE F""04 SPECIMEN OUTLET. -
FIGURE 9. Erosion-corrosion loss profile in
tube downstream of an orifice (Dianetralcircumferential locations shown. Orifice located
185 mm from specimen outlet)
11
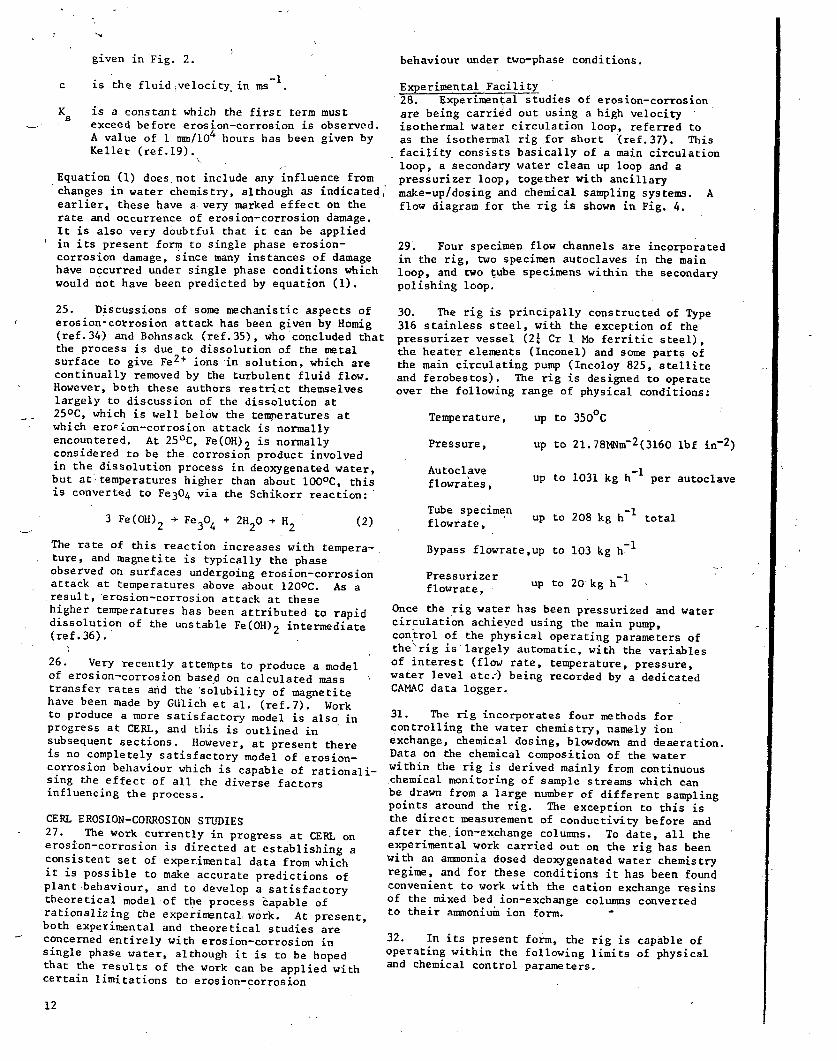
given in Fig. 2.
c is the fluid velocity in ms-1
K is a constant which the first term mustexceed before erosion-corrosion is observed.A value of 1 mm/lO4 hours has been given by
Keller (ref.19).
Equation (1) does not include any influence fromchanges in water chemistry, although as indicated"earlier, these have a very marked effect on therate and occurrence of erosion-corrosion damage.
It is also very doubtful that it can be appliedin its present form to single phase erosion-corrosion damage, since many instances of damagehave occurred under single phase conditions whichwould not have been predicted by equation (1).
25. Discussions of some mechanistic aspects oferosion-corrosion attack has been given by Homig(ref.34) and Bohnsack (ref.35), who concluded thatthe process is due to dissolution of the metalsurface to give Fe 2 + ions in solution, which arecontinually removed by the turbulent fluid flow.However, both these authors restrict themselveslargely to discussion of the dissolution at250C, which is well below the temperatures atwhich erosion-corrosion attack is normallyencountered. At 25 0 C, Fe(OH) 2 is normallyconsidered to be the corrosion product involvedin the dissolution process in deoxygenated water,but at, temperatures higher than about lOOoC, thisis converted to Fe 3 0 4 via the Schikorr reaction:,
behaviour under two-phase conditions.
Experimental Facility28. Experimental studies of erosion-corrosion
are being carried out using a high velocity
isothermal water circulation loop, referred to
as the isothermal rig for short '(ref. 37). This
facility consists basically of a main circulation
loop, a secondary water clean up loop and a
pressurizer loop, together with ancillary
make-up/dosing and chemical sampling systems. A
flow diagram for the rig is shown in Fig. 4.
29. Four specimen flow channels are incorporated
in the rig, two specimen autoclaves in the mainloop, and two tube specimens within the secondarypolishing loop.
30. The rig is principally constructed of Type316 stainless steel, with the exception of thepressurizer vessel (21 Cr 1 Mo ferritic steel),the heater elements (Inconel) and some parts of
the main circulating pump (Incoloy 825, stelliteand ferobestos). The rig is designed to operateover the following range of physical conditions:
Temperature,
Pressure,
Autoclaveflowrates,
Tube specimenflowrate,
up to 350 0C
up to 21.78NNB-2 (3160 lbf in- 2 )
up to 1031 kg h-1 per autoclave
up to 208 kg h-1 total3 Fe(OH) 2 -÷ Fe 3 0 4 + 2H2 0 + H2 (2)
The rate of this reaction increases with tempera-ture, and magnetite is typically the phaseobserved on surfaces undergoing erosion-corrosionattack at temperatures above about 1200C. As aresult, erosion-corrosion attack at thesehigher temperatures has been attributed to rapiddissolution of the unstable Fe(OH) 2 intermediate
(ref. 36).
26. Very recently attempts to produce a modelof erosion-corrosion based on calculated masstransfer rates and the 'solubility of magnetitehave been made by GUlich et al. (ref.7). Workto produce a more satisfactory model is also inprogress at CERL, and this is outlined insubsequent sections. However, at present thereis no completely satisfactory model of erosion-corrosion behaviour which is capable of rationali-sing the effect of all the diverse factorsinfluencing the process.
CERL EROSION-CORROSION STUDIES27. The work currently in progress at CERL onerosion-corrosion is directed at establishing aconsistent set of experimental data from which
it is possible to make accurate predictions ofplant-behaviour, and to develop a satisfactorytheoretical model of the process Zapable ofrationalizing the experimental, work. At present,both experimental and theoretical studies areconcerned entirely with erosion-corrosion insingle phase water, although it is to be hopedthat the results of the work can be applied withcertain limitations to erosion-corrosion
Bypass flowrate,up to 103 kg h.1
Pressurizerflowrate,
up to 20 kg h-1
Once the rig water has been pressurized and watercirculation achieyed using the main pump,conirol of the physical operating parameters ofthe\rig is'largely automatic, with the variablesof interest (flow rate, temperature, pressure,water level etc.) being recorded by a dedicatedCAMAC data logger..
31. The rig incorporates four methods forcontrolling the water chemistry, namely ionexchange, chemical dosing, blowdown and deaeration.Data on the chemical composition of the waterwithin the rig is derived mainly from continuouschemical monitoring of sample streams which canbe drawn from a large number of different samplingpoints around the rig. The exception to this isthe direct measurement of conductivity before andafter the. ion-exchange columns. To date, all theexperimental work carried out on the rig has beenwith an ammonia dosed deoxygenated water chemistryregime, and for these conditions it has been foundconvenient to work with the cation exchange resinsof the mixed bed ion-exchange columns convertedto their amnonium ion form.
32. In its present form, the rig is capable ofoperating within the following limits of physicaland chemical control parameters.
12
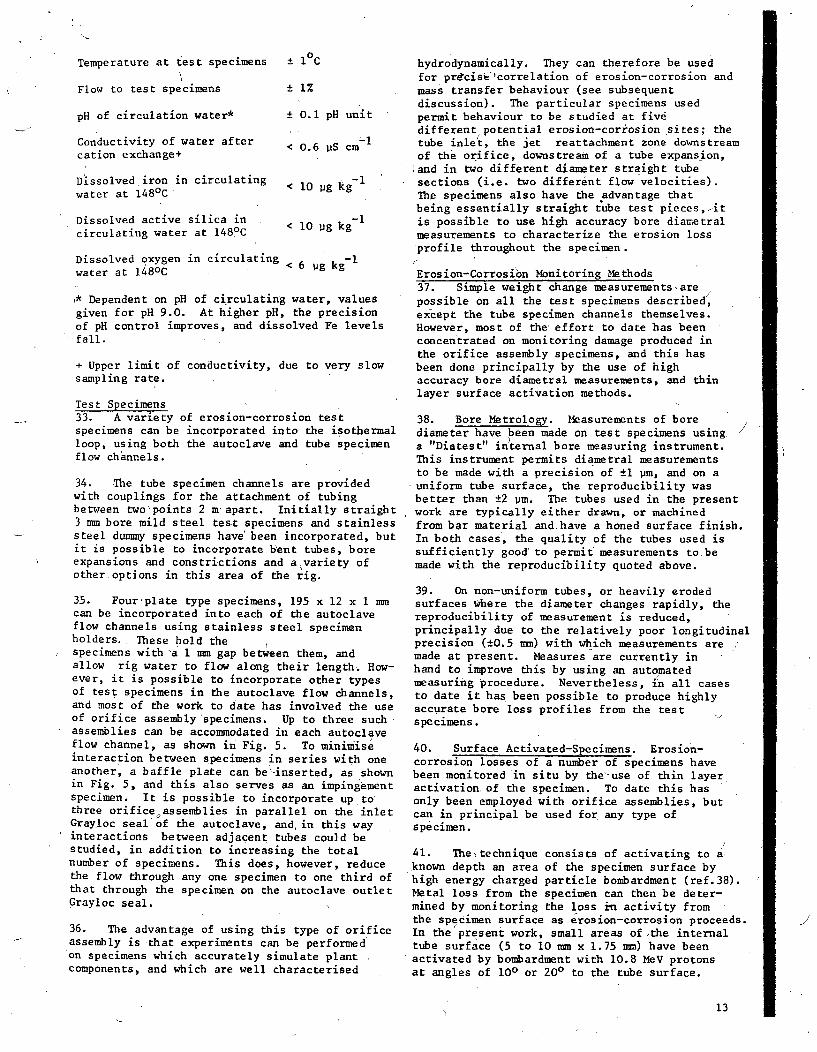
N-
Temperature at test specimens
Flow to test specimens
pH of circulation water*
Conductivity of water aftercation exchange+
Dissolved iron in circulatingwater at 148 0 C
Dissolved active silica incirculating water at 148 0 C
Dissolved oxygen in circulatingwater at 148 0 C
loC
± 1%
- 0.1 pH unit
< 0.6 PS cm-I
< 10 Pg kg-
< 10 pg kg-
< 6 pg kg-I
,* Dependent on pH of circulating water, valuesgiven for pH 9.0. At higher pH, the precisionof pH control improves, and dissolved Fe levelsfall.
+ Upper limit of conductivity, due to very slowsampling rate.
Test Specimens33. A variety of erosion-corrosion testspecimens can be incorporated into the isothermalloop, using both the autoclave and tube specimenflow channels.
34. The tube specimen channels are providedwith couplings for the attachment of tubingbetween two'points 2 m-apart. Initially straight3 mm bore mild steel test specimens and stainlesssteel dummy specimens have' been incorporated, butit is possible to incorporate bent tubes, boreexpansions and constrictions and a~variety ofother options in this area of the rig.
35. Fourplate type specimens, 195 x 12 x I mmcan be incorporated into each of the autoclaveflow channels using stainless steel specimenholders. These hold thespecimens with -a I mm gap between them, andallow rig water to flow along their length. How-ever, it is possible to incorporate other typesof test specimens in the autoclave flow channels,and most of the work to date has involved the useof orifice assembly specimens. Up to three suchassemblies can be accommodated in each autoclaveflow channel, as shown in Fig. 5. To minimiseinteraction between specimens in series with oneanother, a baffle plate can be-inserted, as shownin Fig., 5, and this also serves as an impingementspecimen. It is possible to incorporate up tothree orifice assemblies in parallel on the inletGrayloc seal of the autoclave, and, in this wayinteractions between adjacent tubes could bestudied, in addition to increasing the totalnumber of specimens. This does, however, reducethe flow through any one specimen to one third ofthat through the specimen on the autoclave outletGrayloc seal.
36. The advantage of using this type of orificeassembly is that experiments can be performedon specimens which accurately simulate plantcomponents, and which are well characterised
hydrodynamically. They can therefore be usedfor prdcise'correlation of erosion-corrosion andmass transfer behaviour (see subsequentdiscussion). The particular specimens usedpermit behaviour to be studied at fivedifferent potential erosion-corrosion sites; thetube inlet, the jet reattachment zone downstreamof the orifice, downstream of a tube expansion,
land in two different diameter straight tubesections (i.e. two different flow velocities).The specimens also have the advantage thatbeing essentially straight tube test pieces,-itis possible to use high accuracy bore diametralmeasurements to characterize the erosion lossprofile throughout the specimen.
Erosion-Corrosion Monitoring Methods37. Simple weight change measurements-arepossible on all the test specimens described,except the tube specimen channels themselves.However, most of the' effort to date has beenconcentrated on monitoring damage produced inthe orifice assembly specimens, and this hasbeen done principally by the use of highaccuracy bore diametral measurements, and thinlayer surface activation methods.
38. Bore Metrology. Measurements of borediameter have been made on test specimens usinga "Diatest" internal bore measuring instrument.This instrument permits diametral measurementsto be made with a precision of ±I pm, and on auniform tube surface, the reproducibility wasbetter than ±2 pm. The tubes used in the presentwork are typically either drawn, or machinedfrom bar material and.have a honed surface finish.In both cases, the quality of the tubes used issufficiently good' to permit measurements to bemade with the reproducibility quoted above.'
39. On non-uniform tubes, or heavily erodedsurfaces where the diameter changes rapidly, thereproducibility of measurement is reduced,principally due to the relatively poor longitudinalprecision (±0.5 mm) with which measurements aremade at present. Measures are currently inhand to improve this by using an automatedmeasuring procedure. Nevertheless, in all casesto date it has been possible to produce highlyaccurate bore loss profiles from the testspecimens.
40. Surface Activated-Specimens. Erosion-corrosion losses of a number of specimens havebeen monitored in situ by the'-use of thin layeractivatioa of the specimen. To date this hasonly been employed with orifice assemblies, butcan in principal be used for any type ofspecimen.
41. The~technique consists of activating to a,known depth an area of the specimen surface byhigh energy charged particle bombardment (ref.38).Metal loss from the specimen can then be deter-mined by monitoring the loss in activity fromthe specimen surface as erosion-corrosion proceeds.In the present work, small areas of •the internaltube surface (5 to 10 mm x 1.75 mm) have beenactivated by bombardment with 10.8 MeV protonsat angles of 100 or 200 to the tube surface.
13
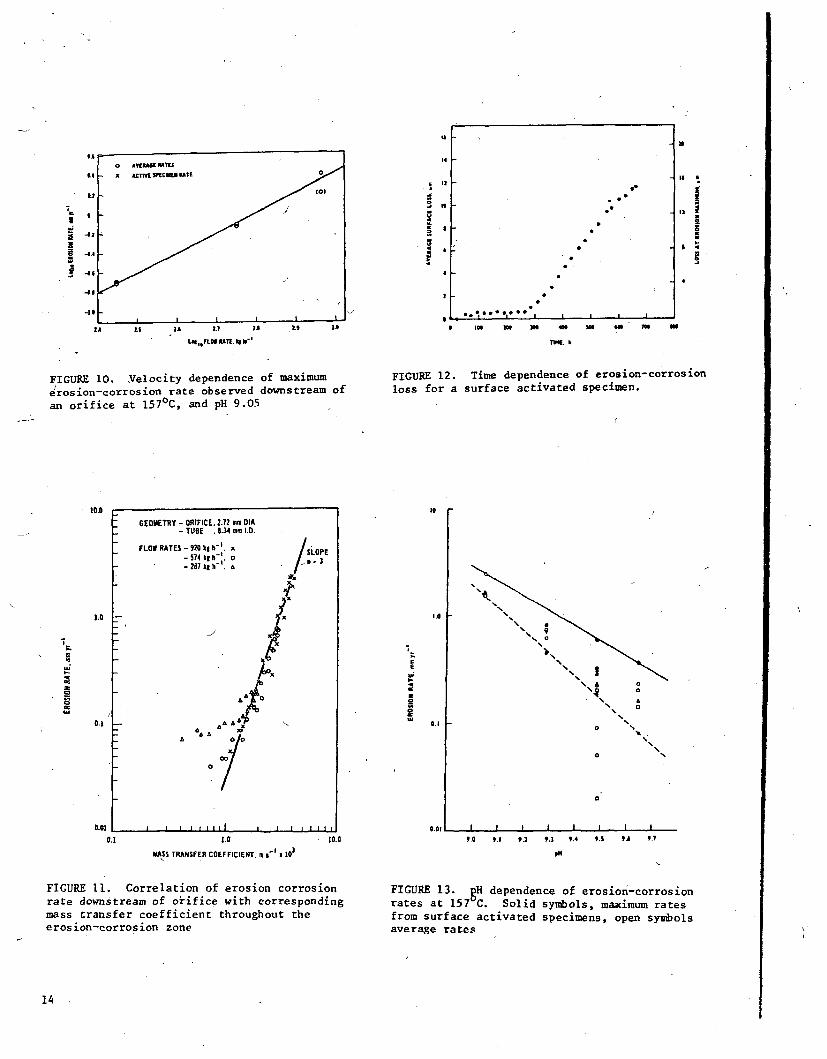
I' N
I
aIaIa
LI
.42
.4.4
4.8
a
I,
11I, S
42
9a44
-LO
2A
*.~SSUU~4*S I I I ~
L*i,*FLO AE. 18 k-.I In " in 4W so 60 "S. M
TIM. b
FIGURE 10. Velocity dependence of maximume rosion-corrosion rate observed downstream ofan orifice at 1570C, and pH 9.05
FIGURE 12. Time dependence of erosion-corrosionloss for a surface activated specimen.
10.0
1.0
2..SS
U0
GEOMETRY - ORIFICE. 2.72 mm DIA- TUBE .8.34 mm I.D.
FLO$ RATES - 920 kI h-1. x / SLOPE
-574 ,, 0,,. o i .3.-o'- 287 ki h'. a,
A.
6A AAA
S
8~4,
1.0 I-4'% 6%%90
•'S .
10
i.
0
4,~'. I N
"6 00
~5 £4, ~
4,'4
'4o "
4..4'
9.A
0.0110.1
.I I I I I tI I I I I I • i, . . , . . , 1 1 A ---- L"_LJAj I u.gl I J I I i I , I I1.0
MASS TRANSFER COEFFICIENT. mi s-1 1 10
10.0 9.0 9.1 9.2 9.3 9.4 9.5 9. 9.7
PH
FIGURE 11. Correlation of erosion corrosionrate downstream of orifice with correspondingmass transfer coefficient throughout theerosion-corrosion zone
FIGURE 13. gH dependence of erosion-corrosionrates at 157 C. Solid symbols, maximum ratesfrom surface activated specimens, open symbolsaverage rates
14
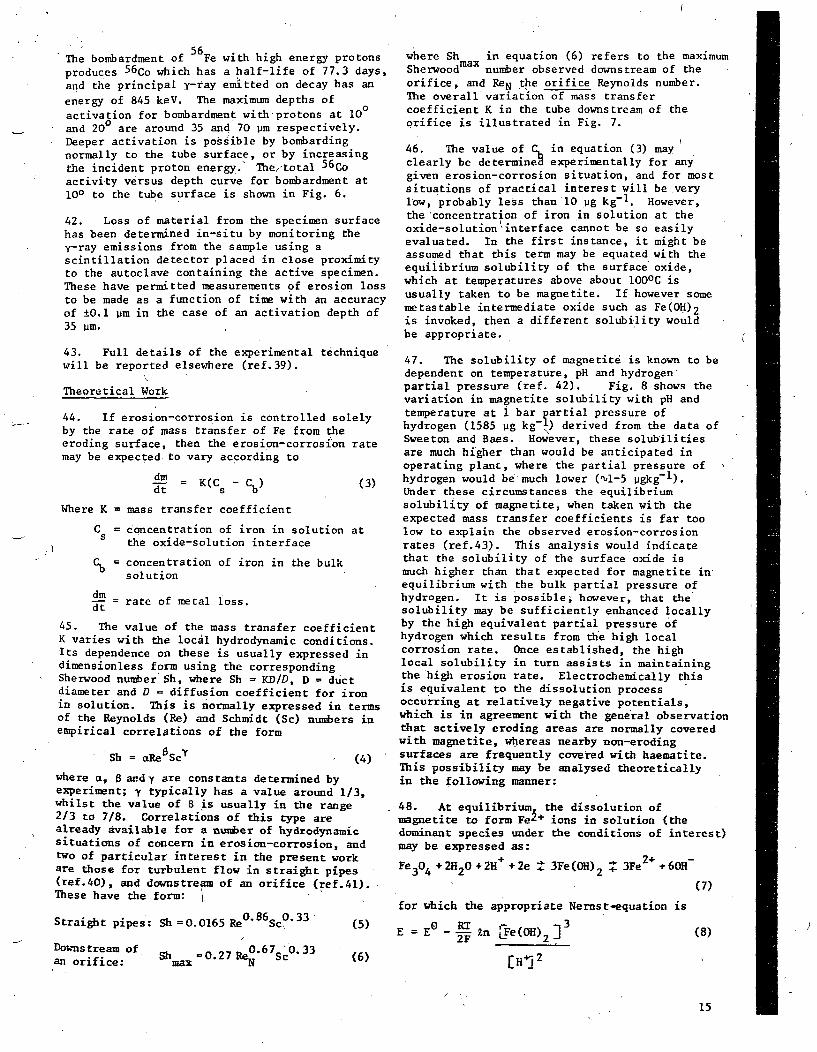
The bombardment of Fe with high energy prcproduces 5 6 Co which has a half-life of 77.3and the principal y-ray emitted on decay has
energy of 845 keV. The maximum depths ofactivation for bombardment withprotons at Iand 200 are around 35 and 70 pm respectivel3Deeper activation is possible by bombardingnormally to the tube surface, or by increasithe incident proton energy.' The,-total 5 6 Coactivity versus depth curve for bombardment100 to the tube surface is shown in Fig. 6.
42. Loss of material from the specimen suihas been determined in-situ by monitoring thy-ray emissions from the sample using ascintillation detector placed in close proxito the autoclave containing the active speciThese have permitted measurements of erosionto be made as a function of time with an accof ±0.1 pm in the case of an activation dept35 Um.
43. Full details of the experimental technwill be reported elsewhere (ref.39).
Theoretical Work
44. If erosion-corrosion is controlled solby the rate of mass transfer of Fe from theeroding surface, then the erosion-corrosionmay be expected. to vary according to
d = K(C - C)dt s b
Where K = mass transfer coefficient
C = concentration of iron in solutionS the oxide-solution interface
C= concentration of iron in the bulksolution
dm = rate of metal loss.dt
45. The value of the mass transfer coefficjK varies with the local hydrodynamic conditi(Its dependence on these is usually expresseddimensionless form using the correspondingSherwood number Sh, where Sh = KD/D, D = ductdiameter and D = diffusion coefficient for iiin solution. This is normally expressed in tof the Reynolds (Re) and Schmidt (Sc) numbersempirical correlations of the form
Sh = aReaScy
where n, B andy are constants determined byexperiment; y typically has a value around I/whilst the value of a is usually in the range2/3 to 7/8. Correlations of this type arealready available for a number of hydrodynamisituations of concern in erosion-corrosion, atwo of particular interest in the present worare those for turbulent flow in straight pipe(ref.40), and downstream of an orifice (ref.4These have the form: .
0.86 0.33Straight pipes: Sh =0. 0165 Re Scý
)tons where Sh in equation (6) refers to the maximum
days, Sherwood number observed downstream of thean orifice, and ReN the orifice Reynolds number.
The overall variation of mass transfer
I00o coefficient K in the tube downstream of theorifice is illustrated in Fig. 7.
.ng 46. The value of C. in equation (3) mayclearly be determine5 experimentally for anyat given erosion-corrosion situation, and for most
situations of practical interest will be verylow, probably less than 10 jg kg- 1 . However,
-face the 'concentration of iron in solution at theae oxide-solution'interface cannot be so easily
evaluated. In the first instance, it might be
[mi ty assumed that this term may be equated with the
men. equilibrium solubility of the surface' oxide,
loss which at temperatures above about 1000 C is
:uracy usually taken to be magnetite. If however someuaof metastable intermediate oxide such as Fe(OW2
is invoked, then a different solubility wouldbe appropriate.
ique 47. The solubility of magnetite is known to be
dependent on temperature, pH and hydrogenpartial pressure (ref. 42). Fig. 8 shows thevariation in magnetite solubility with pH and
ely temperature at I bar partial pressure ofhydrogen (1585 pg kg-y) derived from the data of
rate Sweeton and Baes. However, these solubilitiesare much higher than would be anticipated inoperating plant, where the partial pressure of
(3) hydrogen would be much lower (il-5 pgkg-1 ).Under these circumstances the equilibriumsolubility of magnetite, when taken with theexpected mass transfer coefficients is far too
at low to explain the observed erosion-corrosionrates (ref.43). This analysis would indicatethat the solubility of the surface oxide ismuch higher than that expected for magnetite in'equilibrium with the bulk partial pressure ofhydrogen. It is possible; however, that thesolubility may be sufficiently enhanced locally
Lent by the high equivalent partial pressure of
ins. hydrogen which results from the high local
in corrosion rate. Once established, the highlocal solubility in turn assists in maintainingthe high erosion rate. Electrochemically thisis equivalent to the dissolution process.,on
:erms occurring at relatively negative potentials,
in which is in agreement with the general observationthat actively eroding areas are normally coveredwith magnetite, whereas nearby non-eroding
(4) surfaces are frequently covered with haematite.This possibility may be analysed theoreticallyin the following manner:
3,48. At equilibrium the dissolution ofmagnetite to form Fel+ ions in solution (the
c dominant species under the conditions of interest)nd may be expressed as:ks Fe304 +2H 20+2H 3Fe(OH) 2 M 2+ +60H-
1). (7)
for which the appropriate Nernst-equation is
(5) E -=Zn RTe(o1) 2 ]3E=E j-• Zn (H (8)
Downstream of,an orifice:
0.67 '0.33Shmax =0. 2 7 Re" Sc (6) 1H12
15
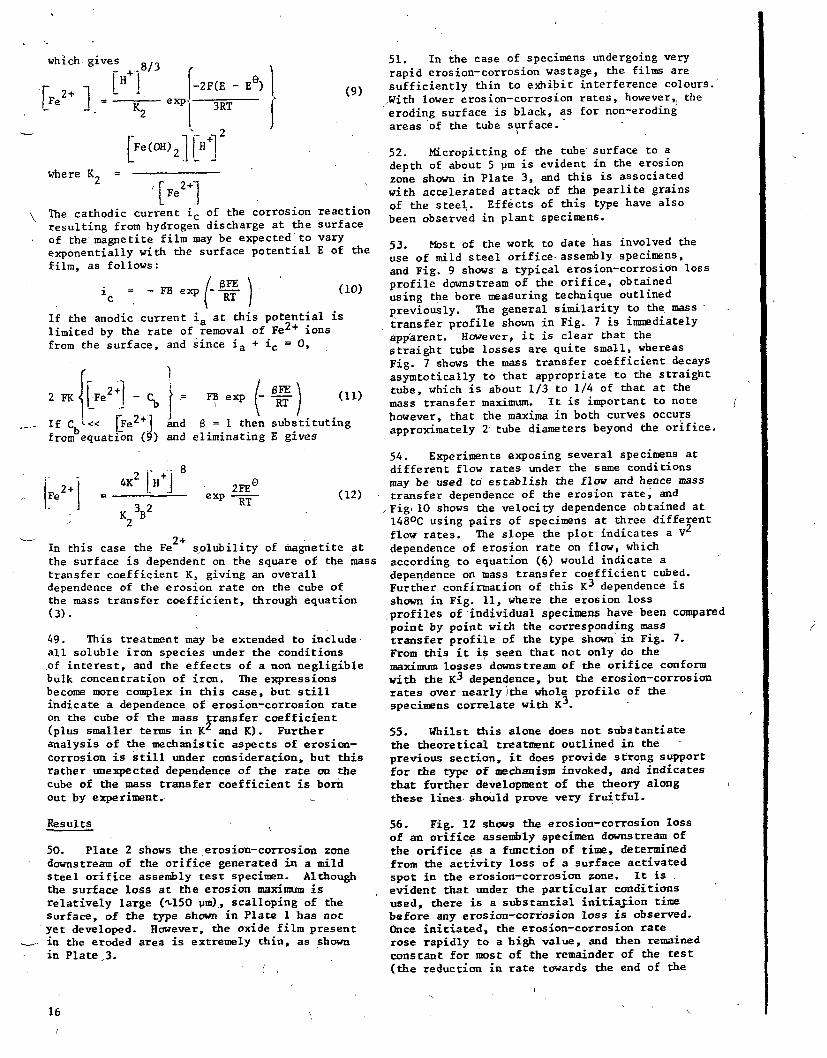
which. gives ./
F ~../ 2fH -ep -2FCE - E)
[Fe (OH) 211H] 2
"Is
I
51. In the case of specimens undergoing veryrapid erosion-corrosion wastage, the films are
(9) sufficiently thin to exhibit interference colours.jWith lower erosion-corrosion rates, however,, theeroding surface is black, as for non-erodingareas of the tube surface.
where K2 =
The cathodic current ic of the corrosionresulting from hydrogen discharge at theof the magnetite film may be expected toexponentially with the surface potentialfilm, as follows:
i = - FB exp --n-c R
52. Micropitting of the tube surface to adepth of about 5 pm is evident in the erosionzone shown in Plate 3, and this is associatedwith accelerated attack of the pearlite grainsof the steel. Effects of this type have alsobeen observed in plant specimens.
reactionsurface
varyE of
If the anodic current ia at this potential islimited by the rate of removal of Fe 2 + ionsfrom the surface, and since ia + ic = 0,
2 FK Fe2+- FBexp
if C. ý Ie e 2+] and I then substitutinfrom equation (9) and eliminating E gives
the 53. Most of the work to date has involved theuse of mild steel orifice-assembly specimens,and Fig. 9 shows a typical erosion-corrosion loss
[0) profile downstream of the orifice, obtainedusing the bore measuring technique outlinedpreviously. The general similarity to the masstransfer profile shown in Fig. 7 is immediatelyapparent. However, it is clear that thestraight tube losses are quite small, whereasFig. 7 shows the mass transfer coefficient decaysasymtotically to that appropriate to the straight
11) tube, which is about 1/3 to 1/4 of that at themass transfer maximum. It is important to notehowever, that the maxima in both curves occursapproximately 2 tube diameters beyond the orifice.
2 = 4K22 H ]8
32
2FE0
exp - (12
In this case the Fe2+ solubility of magnetite atthe surface is dependent on the square of the mastransfer coefficient K, giving an overalldependence of the erosion rate on the cube ofthe mass transfer coefficient, through equation(3).
49. This treatment may be extended to includeall soluble iron species under the conditionsof interest, and the effects of a non negligiblebulk concentration of iron. The expressionsbecome more complex in this case, but stillindicate a dependence of erosion-corrosion rateon the cube of the mass transfer coefficient(plus smaller terms in K2 and K). Furtheranalysis of the mechanistic aspects of erosion-corrosion is still under consideration, but thisrather unexpected dependence of the rate on thecube of the mass transfer coefficient is bornout by experiment.
Results
50. Plate 2 shows the erosion-corrosion zonedownstream of the orifice generated in a mildsteel orifice assembly test specimen. Althoughthe surface loss at the erosion maximum isrelatively large (%,150 um), scalloping of thesurface, of the type shown in Plate I has notyet developed. However, the oxide film presentin the eroded area is extremely thin, as shownin Plate 3.
54. Experiments exposing several specimens atdifferent flow rates under the same conditionsmay be used to establish the flow and hence masstransfer dependence of the erosion rate, and
- Fig, 10 shows the velocity dependence obtained at1480 C using pairs of specimens at three differentflow rates. The slope the plot indicates a V2
dependence of erosion rate on flow, whichSs according to equation (6) would indicate a
dependence on mass transfer coefficient cubed.Further confirmation of this K3 dependence isshown in Fig. 11, where the erosion loss,profiles of individual specimens have been comparedpoint by point with the corresponding masstransfer profile of the type shown in Fig. 7.From this it is seen that not only do themaximum losses downstream of the orifice conformwith the K3 dependence, but the erosion-corrosionrates over nearly the whole profile of thespecimens correlate with K3.
55. Whilst this alone does not substantiatethe theoretical treatment outlined in theprevious section, it does provide strong supportfor the type of mechanism invoked, and indicatesthat further development of the theory along.these lines should prove very fruitful.
56. Fig. 12 shows the erosion-corrosion lossof an orifice assembly specimen downstream ofthe orifice as a function of time, determinedfrom the activity loss of a surface activatedspot in the erosion-corrosion zone. It is .evident that under the particular conditionsused, there is a substantial initia;ion timebefore any erosion-corrosion loss is observed.Once initiated, the erosion-corrosion raterose rapidly to a high value, and then remainedconstant for most of the remainder of the test(the reduction in rate towards the end of the
16
test shown in Fig. 12 is -thought to be due tochanges in experimental conditions). This typc
of behaviour has been observed on a number ofoccasions, although the initiation time can vaiwidely with the experimental conditions, generzbeing much shorter under more aggressiveerosion-corrosion conditions. The cause of sucinitiation periods is not certain at present.In some cases this most likely represents thetime taken to remove a thin oxide film producedduring start-up of the rig, when specimens are
Sexposed to low flow for a few hours. In othercases it is thought that thin air formed oxidesproduced during welding of the test specimenswere responsible. However, in some cases, aninitial loss of a few microns has been observedafter which no loss has occurred for up to 200hours, before true erosion-corrosion attack hasbeen initiated with a continuing linear loss asa function of time. This would suggest thatinitiation is more complex than simply removinga pre-existing oxide film, and may indicatechanges occur in initially formed films undererosion-corrosion conditions.
57. The pH dependence of erosion-corrosion rahas also been investigated using orifice assemband Fig. 13 shows the results obtained at 1480CThe upper limit of, the data is essentiallyderived from the maximum linear rates observedusing surface activated specimens. The ratesderived from other specimens are average rates,which are in general lower as a result of asignificant but unknown initiation time. Theerosion-corrosion rates decrease by a factor ofabout 7 over the pH range 9.05 to 9.65, which iiequivalent to a variation withEH+1l. 4 . This isa somewhat higher dependence than that seen byApblett (ref.26) at 99'C, where the erosion-corrosion rate varies asi"H+i.-O.
SUZ52ARY
58. Corrosion resulting from salt concenntratjicaused by evaporati continues to be a ma7ajrcause of steam generator damage, particularlyin PWIRs and has been the subject of intenseinternational research. Erosion-corrosion damaghas occurred in a wide variety of nuclear steamgenerators, but unlike corrosion resulting fromsolute concentration, relatively little work onthe problem has been reported in the openliterature. The available experience, previousresearch a.d current understanding of thepzlinomcný_-- hav-7• been reviewed, acid CERL research-
_; ---e z- , "- *T.r:ectua riz -d . w
occur in .nlant By tz'si.n test snec•-cns v-W~rhare well characrerised hydrodynamically, it hasbeen possible to accurately correlate erosion-corrosion rates with the correspoonding mass-transfer rate. Under the particular conditionsuheo (L4iC, ph 9.05), it has been found thatorarse variae as the cube-on mI.eaa transf- r
uskafi,4i8:- phis 9 n.)ethas been i t-Le - -.*w 4;, 14 te•xpec.- c a
60. ,Since .mass-transfer coefficients can becalculated for a wide variety of hydrodynamicsituations, at least under single phase
T conditions, it should be possible to uselly correlations of this type to predict plant
behaviour over a wide range of conditions.:h
61. Increasing pH has-been shown to markedlyreduce erosion-corrosion rates over the range9.05 to 9.65, in agreement with other studies ofthe effect at lower temperatures. In many plantsituations, therefore, this option should proveeffective in controlling erosion-corrosiondamage. It is likely to be especially usefulwhen other options such as materials change or
i, oxygen addition are not feasible.
62. Details of the mechanism of erosion-corrosion damage have still to be established,but the use of surface activation in the presentwork has proved to be extremely valuable formonitoring losses in-situ. Using this techniqueit has been possible to establish the linearityof erosion-corrosion loss as a function of time,after some initiation period, and it will
tes undoubtedly be useful( in studying erosion-lies corrosion behaviour under transient conditions.
In conjunction with electrochemical techniques,therefore, it should prove very valuable inelucidating aspects of the corrosion mechanism.
ACKGN OZEDGEl-,NTS
63. We wish to thank J.H. Ashford, C.H. de Whalley,D. Lihaert and R. Sale for t-heir assistance with
s the experimental work described, and M.W.E. Coneyfor helpful discussions on ''OT- _Ss-t-r-nsferbehaviour in turbulent flow,
64. This paper is published with the permissionof the Central Electricity Generating Board.
REFERENCES
i. GAi~2~Y R. Boiler corrosion and the.reuirement for f•eed- and boiler-water, chemical
Control 4 nuclear steam generators. BNES:e Conference on Water Chemnist;r of Nuclear Reactor
Systems ,BNES, London, 1978, pp 1-10.2% G-A-SEY R. Nucl. Energy 18, 117; 1979.3. GARTNSEY R. Reducing the risk of water-steamcorrosion damage in U.K. Cas cooled reactorsteam generators. Paper presented to ADERPmeeting on Vater Qiemistry and Corrosion in theSteam-Water Loops of Nuclear Power Stations,
4-e ac, amrch C-80..- neraceurs de vapeur chaufes`ails l-a ceoatiales nuceiaires
~~.Z A"-P" 6-' M1.CEr __ 7
generate=d -ýacurt- nn -),zreotusanrnrapi5des. Pnrr'- resented t- ADERP -Ot.fl5 LeWater Chemistrv and Corrosion in the Stean-WaterLoops of Nuclear Power Stations, Seillac,M.arch 1980.6. CE.XDA14 j.F. G, EGil3uE j. and LACAILLE L.
s i• des phanomnes derosion-corrosion
17
ON tilý
"M

possibles. Paper presented to ADERP meetingon Water Chemistry and Corrosion in the Steam-Water Loops of Nuclear Power Stations, Seillac,March 1980.7. GULICH J.F. FLORJANCIC D. and MULLER E.L'erosion-corrosion dans les pompes d'alimentationet d'extraction. Recherches et choix desmateriaux. Paper presented to ADERP meeting onWater Chemistry and Corrosion in the Steam-WaterLoops of Nuclear Power Stations, Seillac, March1980.8. Japan Atomic Power Company Limited, Thirdtechnical collaboration report on S.R.U. tubeerosion and corrosion at the Tokai Nuclear PowerStation, J.A.P.C. Report,November 1969.9. Japan Atomic Power Company Limited, FourthTechnical Collaboration Meeting on S.R.U. repairwork at the Tokai Nuclear Power Station, J.A.P.C.Report, September 1970.10. GARAUD J. Revue Generale Nuclaire, No. 1,p. 29, 1978.11. BERGE Ph. and SAINT PAUL P., Electricitede France Report HC PV D 389 MAT/T.42.12. PASK D.A. and HALL R.W. Nuclear Energy,18, 237, 1979.'13. ENGELKE W. in 'Two Phase Steam Flow inTurbines and Separators', ed M.J. YORE andC-H. SIEVERDING, McGraw-Hill, p. 291-315, 1976.14. PERGOLA A.C. and PHILLIPS A. Heat Enzineer-ing, p. 72, September-October 1965.15. PHILLIPS H. Foster Wheeler Corporation(New Jersey), Report No. TR-36, 1966.16. KELP F. MITT V.G.B. 49, 424, 1969.17. DOR F. Revue Generale Thermique, 166,
705, 1975.18. WAGNER H.A. DECKER J.M. and MARSH J.C.Trans. ASE 69, 389, 1947.19. KELLER E. V...B., KraftwerkStechnik, 54,292 1974A
20. FLTLP HN. J. !nternationaleS D'Et,,desDes Centrales Flectrique, Paper A2, 1978,21. DECKER J.M. WAGNER H.A. and MARSH J.C.Trans. ASi'E 72, 19, 1950,22. WARZEE N. DARLODOT P.de and WATY J.EURATOM Report No. EUR 2688.F., 1966.23. NES-EYANOVA K.A. Atomnaya Energiya, 29,781, 1970.2f. BERGE P. ADERP Conference, E rmeenonvilie,1972.
0 T zMT IT- IJ T N T-I W
Paper to this Conference.26. APBLETT W.R. Proc. Am. Power Conf. 29,751, 1967.27. -DECKER J.M. and MARSH J.C. Trans. ASME72, 19, 1954..28. BRUSH E.G. and PEARL W.L. Proc. Am. PowerConf. 31, 699, (1969).29. BRUSH E.G. and PEARL W.L. Proc. Am. PowerConf. 32, 751, (1970).30. BRUSH E.G. and PEARL W.L.. Corrosion 28,
129, 1972.IT. VREELAND D 1 G.G. and PIEARL W.L.C.orrosion 17, '~-• lfl./
32. FREIr RýK . V.G.B. Feedwater Conference p8
Oct. 1970.
33. EFFERTZ P.H. FICHTE W. SZENKER B RESCH C.BURGMANN F. GRUINSCHLAGER E. and BEETZ E, VGBKraftwerkstechnik 58, 585, 1978.34. HOMIG H.E. Mitt V.G.B., 76, 12, 1962.35. BOHNSACK G. V.G.B. Feedwater Conference,
p.2, 197136. BORSIG F. Der Maschinenschaden, 41, 3, 1968.37. ASHFORD J.H. BIGNOLD G.J. DE WHALLEY C.H.FINNIGAN D.J. GARBETT K MANN G.M.W. MCFALL F.and WOOLSEY I.S. CEGB Report RD/L/N 126/79.38. CONLCO T.W. WEAR 29, 69, 1974.39. FINNIGAN D.F. GARBETT K and WOOLSEY I.S.to be reported.40. BERGER F.P. and HAU K. -F. F-L. Int J.Heat Mass Transfer, 20, 1185, 1977.41. TAGC D.J. PATRICK M.A. and WRAGG A.A.Trans. I. Chem.E. 57, 12, 1979.42. SWEETON F.H. and BAES C.F. J.Chem.Thermodynamics, 2, 479, 1970.43. CONEY M. Private Communication.
UIUI
NEC-JH_72
Paper 96. The influence of oxygen and hydrazine on the erosion-corrosion
behaviour and electrochemical potentials of carbon steel under boiler
feedwater conditions
A
I. S. WOOLSEY, BSc, PhD, G. J. BIGNOLD, BSc, PhD, C. H. DE WHALLEY, BSc, MIChemE,and K. GARBETT, BSc, PhD, CEGB. Central Electricity Research Laboratories. Leatherhead
In the temperature range 100 to 250 0 C, carbon steel is highly susceptible to erosion-corrosiondamage in deoxygenated boiler feedwatef whefin mass ansfer coefficients are sufficiently high. Theerosion-corrosion process can be completely inhibited by addition of low levels of oxygen to thefeedwater, but experiments have shown that the process continues essentially unaffected below acritical oxygen threshold. The oxygen level required to inhibit the process depends on the localoxygen mass transfer coefficient to the eroding surface, and the existing metal loss rate. Anupper limit for the threshold concentration can be derived from the rate of oxygen mass transfer tothe surface required to match the ongoing erosion-corrosion rate. Under these circumstances, thecathodic current normally supplied by the hydrogen evolution reaction can be substituted by anequivalent one due to oxygen reduction. When the critical rate of oxygen mass transfer to thesurface required to inhibit erosion corrosion is achieved, the surface electrochemical potential.shifts several hundred millivolts positive of that previously maintained. Oxygen has been shown toinhibit erosion-corrosion and control the electrochemical potential of carbon steel even in thepresence of large excesses of reducing agents such as N2 HA and H2, at temperatures up to 25 0 °C.However, removal of the oxygen by reaction with hydrazine allows the erosion-corrosion process tore-initiate rapidly. Hydrazine alone does not significantly influence the potential of actively
!• eroding surfaces, but does appear to reduce the erosion-corrosion rate as a result of the increasedhigh temperature pH.
I
INTRODUCTION1. In the temperature range 100 to 250 0 C,
-carbon steel is highly susceptible to erosion-corrosion damage in deoxygenated boiler feed-water if fluid velocities and hence masstransfer coefficients are high enough (ref. 1).However, oxygen in the feedwater has an inhibi-ting effect on the erosion-corrosion process(ref. 2 to 5), to the extent that when oxygenlevels are high enough, the attack is completelysuppressed. However, the exact amount ofoxygen required, in general, to inhibit theprocess under a given set of conditions has notbeen established.
2. Various feedwater chemistries have beendeveloped in recent years which utilise ox-ygendosing at some level which would be expected to'be successful in suppressing erosion-corrosiondamage under single phase flow conditions. TheNOLC, N'eutral Oxygen Low Conductivity (ref. 6)and Combined Oxygen-Armmonia (ref. 7) waterchemistry regimes employ relatively high levelsof oxygen in the feedwater, without or withammonia dosing respectively. Specificationsfor the NOLC regime require >50 pg kg- 1 oxygen(ref. 6), whilst the combined regime has beenoptimised with oxygen levels in the range 150.to 300 pg kg-1 and ammonia dosing to give apH 2 5 0C between 8.0 and 8.5 (ref. 7). However,a variation of the combined regime adopted forCEGB gas cooled reactor once-through boilersemploys much lower levels of oxygen dosing,15 Lug kg- 1 , with a pH25 0 C from ammonia >9.3. It
removed in the higher temperature sections ofthe boiler. This is to eliminate its possibleinfluence on corrosion in the 9CrlMo steelevaporator and austenitic superheater sections.
3. Both the high and low level oxygen waterchemistry regimes have been shown to be succes-.sful in preventing erosion-corrosion damage(ref. 2-5), but for the combined regime adoptedin the UK, which uses low oxygen levels, it isimportant to define the limits of its applica-bility, particularly since it involves dosingexcess hydrazine ultimately to remove theoxygen which provides protection. Work hastherefore been carried out at CERL to establishthe oxygen concentrations required to inhibiterosion-corrosion under a variety of experi-mental conditions and in particular as a func-tion of the metal loss rate and hydrodynamicconditions. In addition, it has sought toestablish the influence of hydrazine on theprocess and the ability or oxygen to inhibiterosion-corrosion in the presence of excessnydrazine, particularly as a function oftemperature.
4. The work has also made it possible toestablish the relationship between the high andlow oxygen dosing regimes, with respect toerosion-corrosion damage, and to explain whythe incidence of damage can be rather variablein plant operating uncier nominally deoxygenatedAVT water chemistry, where feedwater oxygen \levels are 1<0 ug kg 1 and !.ydrazine is dosedas a scavenger~for residual oxygen.
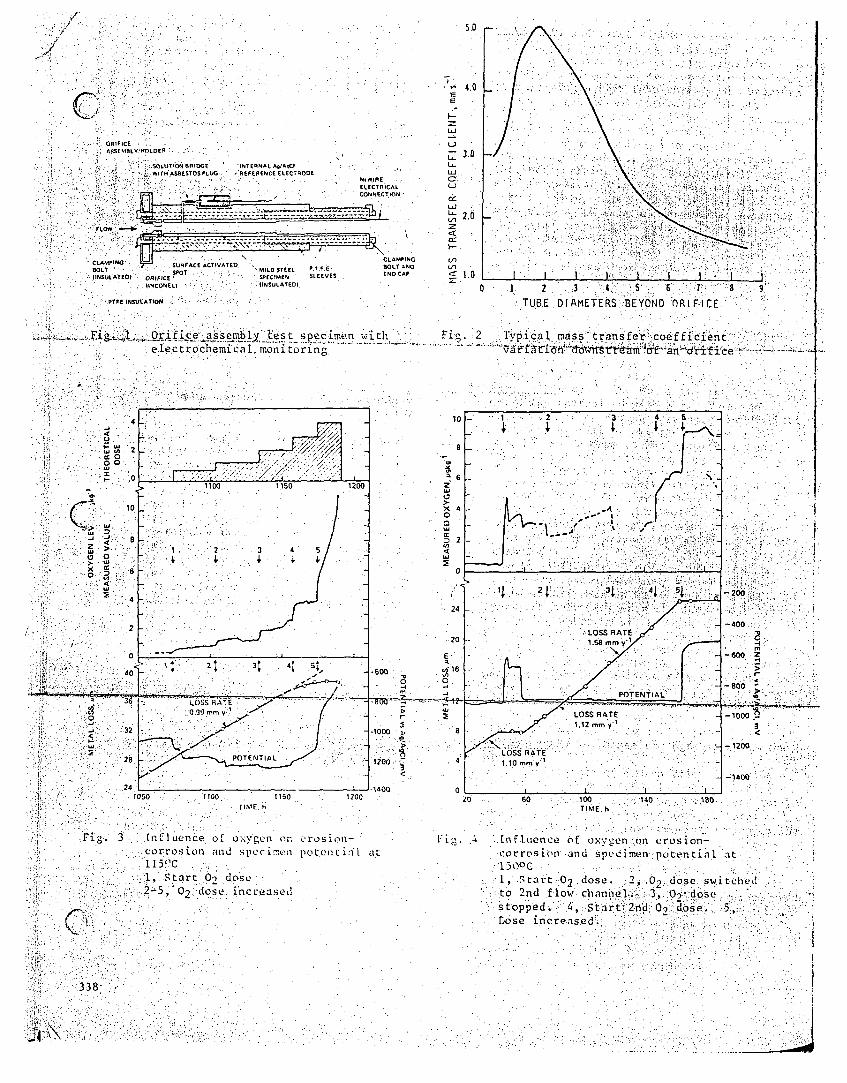
.1.5 D
*"4.0E
j! ASSENIBLY.'"OLDER'!
SSOLUTIION BRIDGE , INTERNAL Aq4CI . ..
IIIARSOPLUG. REFERENCE ELECTRODE NIR" ; " : " " " . . . .•. : ... . ' -C
ELECTRICAL ICONNECTION
-2.6
f LOW -..z.
CLAMPING SU"FACE ..... CLAMPING L/)
SURFACE ACTIVAT TEE ANDRo :? "" ,o" MILD STEEL P.T.F.E 501.1 N .
IINSULATED) 0 RIFICE" SPOT . . ECMEN SLEEVES END CAP
IINCONEL IINSULAFEDI '
I, I
0 1 2 .3 4 .5' 6. 7 ' 8~
FIFEPF INSULATION ~ .
~ Fg. 0rr1La~smb~~es spcimn with
ele~ct~rochemical. monitoring-
TUBE DIAMETERS. BEYOND ORIF.:ICE
Fig. :2 Tpicai.l mass transfer: coefficient
0
ig-.
..- :• : Fi". :
TIME. I)
.100TIME. h
3. -It I tuctce. of oxv gcn (,I- crosio~n-
...corros ion andý specimen potoijt ii
t ta t.0, dose.9 0,;dos e inreased
L a t
338
. nfluence of oxv;"en,:on erosion-
corrosion and specimen potential ait
1_ ,. lzar.t 02 dose. 2 ,02.dose switch1di
to 2nd flow channeL.; .3, 0 -dose
stopped. n 4, Stard r t2nd 0, dos s e. 5',
ýo s e increased.
:1

PAPER 96: WOOLSEY ET AL
EXPERIMENTAL STUDIES5. The erosion-corrosion studies described
here were carried out using the CERL highvelocity isothermal water loop. Full detailsof the test loop have been given elsewhere(ref. 1, 8). It incorporates four main speci-men flow channels, two in the main loop, andtwo in a secondary polishing loop. The rig islargely constructed from Type 316 stainlesssteel and designed to operate up to 3501C and21.78 MX m- 2 pressure. The experimentalprogramme has shown it to be capable ofoperating for long periods with very precisecontrol of both physical and chemical condi-tions. The control limits are indicated below:
Temperature, ±10 C
Flow to test specimens, ±1% up to 1031 kgh-I
pH of circulating water*, <±0.05 pH unitwith NH3 dosing
Conductivity of water after cationexchange, <0.2 pS cm-I
Dissolved active silica in recirculatingwater, <6 og kg-i
Dissolved Fe in circulating water*, <10l-gkg-i
*Value depends on specific conditions of
test, typically much lower values of dissolvedFe are obtained.
6. For the present studies, test specimens ofthe type shown in Fig. 1 were used. These arevery similar in principle to those usedpreviously in our experimental programme (ref.1, 2), but have been modified to allow electro-chemical monitoring of the specimen. The basicspecimen design employs an inlet orifice, madefrom erosion resistant material (Inconel 600),to produce highly turbulent conditions in themild steel tubing downstream, which in turngives rise to the erosion-corrosion damage.The variation of mass transfer coefficientdownstream of an orifice is well characterised(ref. 9, 10), as shown in Fig. 2, with themaximum value being defined by the relationship:
Sh 0.276 Re67 Sc 33 ... ()max N
where Shmax maximum Sherwood number observeddownstream of orifice
ReN = orifice Reynolds numberSc = Schmidt number
The mass transfer coefficient, K. is expressedin terms of the Sherwood number by the relation-ship Sh = KD/D, where D = duct diameter and D =
diffusion coefficient.7. The erosion-corrosion loss in the region of
the post orifice maximum was monitored in-situby observing the activity loss from specimenswhich had been surface activated with 5 6 Co asindicated in Fig. 1. Full details of thetechnique used have been given elsewhere (ref.11). The loss sensitivity in the presentstudies was better than ±0.15 pm, allowing veryaccurate determination of specimen response tochanges in the water chemistry and in particularto the oxygen dose level.
potentials with respect to an internal Ag/AgCl/0.01 M KCI reference electrode. As shown inFig. 1, the potential was measured in theregion of maximum mass transfer coefficient and,therefore, of maximum erosion-corrosion loss,by inserting a PTFE tube through the specimenwall to form the solution bridge to thespecimen. Measurements of the chloride concen-tration remaining in the reference electrodeafter experiments lasting up to 1200 hoursindicated substantial loss of electrolyte tothe recirculating water. Consequently, theelectrochemical potentials measured do notstrictly refer to a 0.01 N KCI reference, butmore closely to a saturated AgCl solution atthe appropriate temperature. This does notaffect the general analysis of specimenbehaviour, however, since it is based on largepotential shifts over relatively short periodsof time (a few hours), when the electrode wouldhave reached equilibrium with the environmentalconditions.
CONDITIONS AND MONITORING OF WATER CHEMISTRY9. The experiments described here were
carried out in deoxygenated AVT feedwater, towhich controlled levels of oxygen and hydrazinewere then added. The pH of the recirculatingwater was controlled with NH3 . This waseffected both by dosing make-up water with theappropriate level of NH 3 and by controlledremoval and release of NH3 by hydrogen andammonium ion form cation exchange resin beds inthe secondary water clean-up circuit.Experiments were conducted at various pHs inthe range 8.0 to 9.3, with the pH typicallycontrolled to better than ±0.05 pH units.However, during hydrazine dosing to the loopwater pH control proved less satisfactory (seebelow).10. The influence of oxygen and hydrazine on
erosion-corrosion behaviour was examined bydosing either aerated water or N2 spargedhydrazine solutions into the loop water approxi-mately 1 m upstream of the test specimens. Inthe case of hydrazine, the reagent rapidlyrecirculated around the loop and a stableconcentration was maintained at the test speci-mens by balancing the dose rate with hydrazinedecomposition and removal on the ion exchangecolumns. Unfortunately this displaced NH3 fromthe ammoniated resin making pH control moredifficult, particularly during periods when itwas necessary to change the N2 H4 level in thewater.
11. In the case of oxygen dosing into theloop, when it had previously been operatingunder deoxygenated (reducing) conditions forsome time, magnetite on the loop surfaces had asubstantial capacity for removing oxygen in therecirculating water. As a result of this 021gettering', it was usually necessary to run ata constant 02 dose level for some time beforesteady oxygen levels were established at theinlet to the test specimens. This also ensuredequilibration and negligible 02 loss in thesample lines, which were located approximately15 cm upstream of ihe specimens. Valves in the
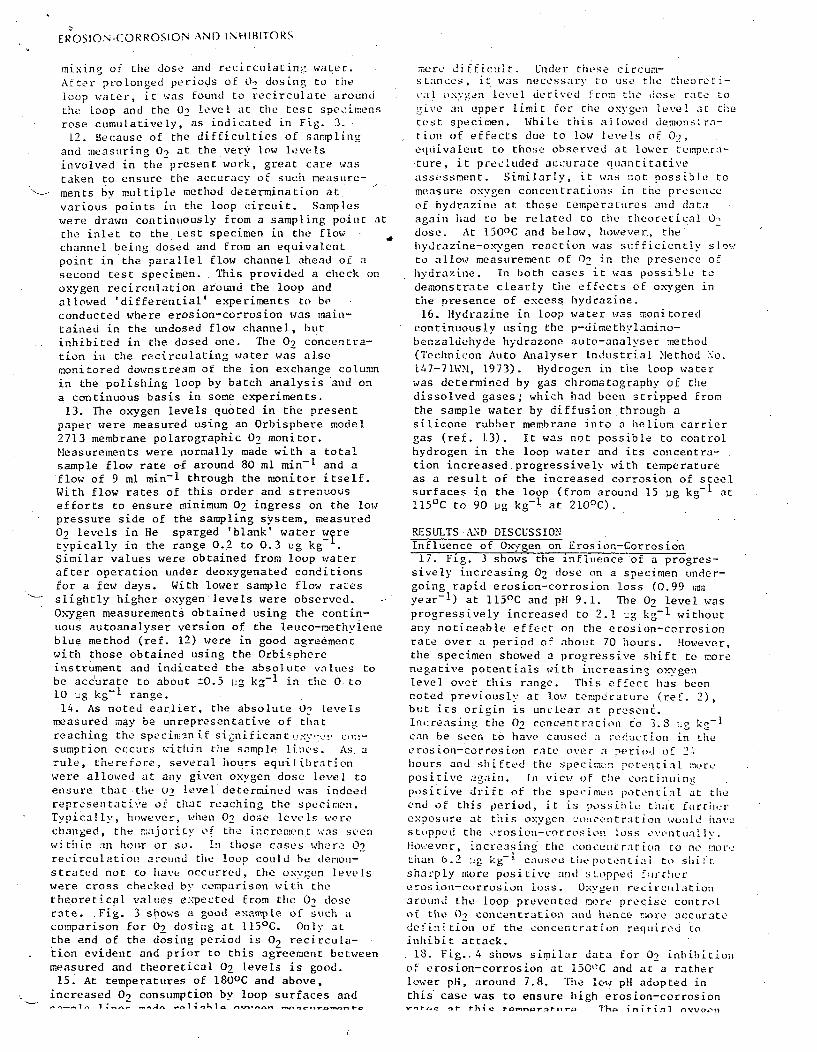
EROSION-CORROSION AND INHIBITORS
mixing of the dose and recirculating water.
After prolonged periods of 0-2 dosing to the
loop water, it was found to recirculate around
the loop and the 0) level at the test specimensrose cumulatively, as indicated in Fig. 3.
12. Because of the difficulties of sampling
and measuring 02 at the very low levelsinvolved in the present work, great care was
taken to ensure the accuracy of such measure-
ments by multiple method determination atvarious points in the loop circuit. Sampleswere drawn continuously from a sampling point atthe inlet to the test specimen in the flowchannel being dosed and from an equivalentpoint in the parallel flow channel ahead of asecond test specimen. This provided a check onoxygen recirculation arounad the loop andallowed 'differential' experiments to beconducted where erosion-corrosion was main-tained in the undosed flow channel, butinhibited in the dosed one. The 0, concentra-tion ia the recirculating water was alsomonitored downstream of the ion exchange columnin the polishing loop by batch analysis and ona continuous basis in some experiments.
13. The ox-ygen levels quoted in the presentpaper were measured using an Orbisphere model2713 membrane polarographic 02 monitor.Measurements were normally made with a totalsample flow rate of around 80 ml min" 1 and aflow of 9 ml min-I through the monitor itself.With flow rates of this order and strenuousefforts to ensure minimum 02 ingress on the lowpressure side of the sampling system, measured02 levels in He sparged 'blank' water wTretypically in the range 0.2 to 0.3 ug kg-Similar values were obtained from loop waterafter operation under deoxygenated conditionsfor a few days. With lower sample flow raLesslightly higher oxygen levels were observed.Oxygen measurements obtained using the contin-uous autoanalyser version of the leuco-methvleneblue method (ref. 12) were in good agreementwith those obtained using the Orbisohereinstrument and indicated the absolute values tobe accurate to about t0.5 i.g kg- 1 in the O. to10 gg kg-I range.,
14. As noted earlier, the absolute 02 levelsmeasured may be unrepresentative of thatreaching the specin:. nif significant,:-vL.,'.sumption occurs within tie sample lines. As. arule, therefore, several hours equilibrationwere allowed at any given oxygen dose level toensure that the uo level determined was indeedrepresentativ.'e of that reaching the specimen.Typica!ly, however, when 02 dose levels werechanged, the majority of the increment was seenwithin an hout or so. In those cases wheti? 09recirculation around the loop could be demon-strated not to have occurred, the oxygen levelswere cross checked by comparison with thetheoretical values expected from the 0- doserate. Fig. 3 shows a good example of such acomparison for 09 dosing at 115 0 C. Only atthe end of the dosing per~iod is 02 recircula-tion evident and prior to this agreement betweenmeasured and theoretical 02 levels is good.
15. At temperatures of 1800C and above,increased 02 consumption by loop surfaces and
more difficult. Lnder these circum-sLances, it was necessary to use the theoreti-cal oxygen level derived from the dost rate togyive an upper limit for the oxygen level at thietest specimen. While this allowed demonstra-rion of effects due to low levels of 02,equivalent to those observed at lower tempera-ture, it precluded accurate quantitativeassessment. Similarly, it was not possible tomeasure oxygen concentrations in the presenceof hydrazine at these temperatures and dataagain had to be related to the theoretical 0Odose. At 1500C and below, however, thehydrazine-ox.gen reaction was sufficiently slowto allow measurement of 02 in the presence ofhydrazine. In both cases it was possible todemonstrate clearly the effects of oxygen inthe presence of excess• hydrazine.
16. Hydrazine in loop water was monitoredcontinuously using the p-dimethylamino-benzaldehyde hydrazone auto-analyser method(Technicon Auto Analyser Industrial Method N:o.147-71WM, 1973). Hydrogen in tne loop waterwas determined by gas chromatography of thedissolved gases; which had been stripped fromthe sample water by diffusion through asilicone rubber membrane into a helium carriergas (ref. 13). It was not possible to controlhydrogen in the loop water and its concentra-tion increased.progressively with temperatureas a result of the increased corrosion of steelsurfaces in the loop (from around 15 pg kg- 1 at115 0 C to 90 Pg kg-! at 210 0 C).
.RESULTS .AND DISCUSSIONInfluence of Ox-egen on Erosion-Corrosion
17. Fig. 3 shows the influence of a progres-sively increasing 02 dose on a specimen under-going rapid erosion-corrosion loss (0.99 mmyear-1) at i150C and pH 9.1. The 02 level wasprogressively increased to 2.1 g kg-I withoutany noticeable effect on the erosion-corrosionrate over a period of about 70 hours. However,the specimen showed a progressive shift to morenegative potentials with increasing oxygenlevel over this range. This effect has beennoted previously at low tomperature (ref. 2),but its origin is unclear at present.Inreasing the 09 concentration to 3.8 g kg-I
can be seen to have causeda :reduction in theerosion-corroston rate over :a period of 2.hours and shifted the spec imcen potential morepositive a;gain. In view of the continuin'-positive drift of the specimen potential at theend of this period, it is possihie tiiat furth,.rexposure at this oxygcn •cocentraition wo-uld have'stopped the erosion-corrosion loss eventuallv.How-ever, increasing the concentration to no 1or.,than 6.2 :!g 'g-1 caused the.potentiai to shfi Lsharply more positive and slopped furthCererosion-corrosion loss. Oxygen recirt-clat ionaround the loop prevented more precise controlof the 0() concentration and hence more accuratedefi:n tion of the concentration required toinhibit attack.
18. Fig.. 4 shows similar data for 09 inhibitionof erosion-corrosion at 1500C and at a ratherlower pH, around 7.8. The low pH adopted inthis case was to ensure high erosion-corrosion
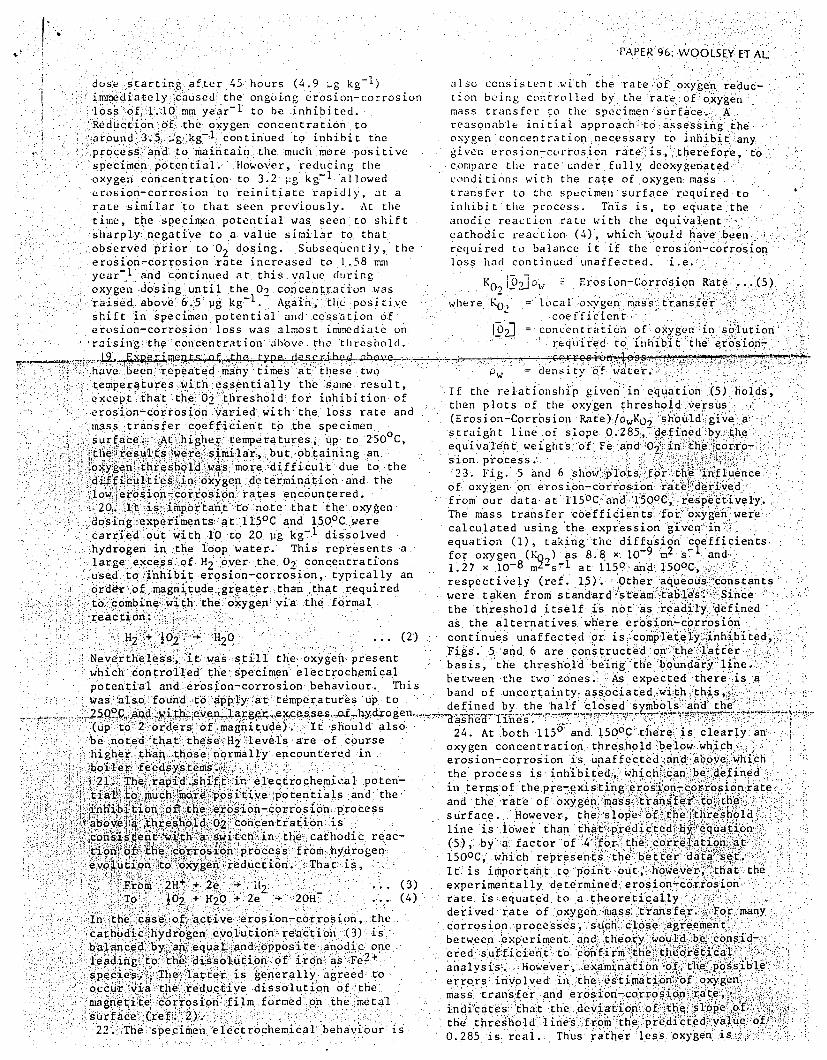
PAPER 96: WOOLSEY ET AL.
d dose starting- after 45 hours (4.9 .g kg- 1 ) also consistent with the rate 'of oxygen reduc-immediately ý:caused& the ongoing erosion-corrosion tion being controlled by the rate of oxygenloss of' 1.10 mm year- 1 to be inhibited. mass transfer to the specimen surface. AReduction of. the oxygen concentration to reasonable initial approach 'ýto assessing thearound 3.5 1g..kg-l continued to inhibit the oxygen concentration necessary to inhibit.anyprocess, and.to maintain the much more positive given erosion-corrosion rate is,!"therefore, tospecimen.potential. However, reducing the compare the rate under fully deoxygeratedoxygen concentration to 3.2 ;:g kg-I 'allowed conditions with the rate of oxygen masserosion-corrosion to reinitiate rapidly, at a transfer to the specimen surface required torate similar to that seen previously. At the inhibit the process. This is, to equate thetime, the specimen potential was seen to shift anodic reaction ratewith the equivalentrsharply:.negative to a. Value similar to that cathodic reaction (4), which would have been.observed prior to 02 dosing. Subsequently, the required to balance it if the crosion-corrosionerosion-corrosion rate increased to 1.58 rmm loss had continued unaffected. i.e.year-I and continued at this value during "oxygen -dosing.until. the 09....concentration was.. 2 2- . 'rs . Corrsio Rt " . . (5)raised above 6.5 pg kg' 1 . Again,.,h'c posi tive where KO• = local oxyvgen mis transfershift in specimen potential and cessation Of c coefficient ferosion-corrosion loss was almost immediate on . _102] concentratiun of oxygen in solutio
- raising the con~centration above the threshold. required, to ihibit.the ero'sion- :?-P .... I._ t-_ af trho rtvnpe. rc-zCri hr,. ... ..
- ;have. , been;repeated many' times at." these two '. ... " density of wter. .temperatures with. essentially thed saue resul t If the relationship given in equation (5) holds'
..... '.:,i : except :t~~~~~~~~~~i~,a1 'h'e :'"tireshoid for inhibto f I h e~t~si ie:ieiaih'()5ii;eep ta th0...df ii tthen plots of the oxygen threshold Yersuserosion-corrosion varied with the loss rate and (Erosion-Corrosion 'Rate)/owKO.should.give.amass :transfer coefficient to the specimen
o straight line of. slope 0.,285, defined/ by.the'.surface. .- At-higher temperatures.,ý up, to 250 C, equivalent weights of Fe and :02in,'.the corro- . Lthe.r'esults were similar,. ,but. ob'taining an. i r 'o. x:yge.n' threshold'yas -more- difficult due to 'the 23. Fig. 5 and 6 s .ow,`plots' ::f t•he i:,-inf luencedi-fficulties,•,,in. oxygen .,determination and the. of oxygen on erosion-corrosion- rate•deric.i•d . . Jlow, erosion-corrosoion. rates encountered,20 oIismpotant"o.note: .that the oxygen r an. es were
dosing experiments::at-'1l1OC and 150 0 C i-ere The mass transfer coefficients for-'oxcalculated using the expression givenin-.carr.iedoUt.with ,10 t20. g kg-. 1 dissolved • equation (1), taking' the diffusion oef:fin ts . ....hydrogen in -the loop water. This represents a. (K as - :-.. : large-excess of over the 02' for oxygen (K.)as.8.8 x. lO-9.m 2 .sl and:H.. .2 concentrat s I.27 x .10ý8 m -sýl at 1150.l .ah'd 150 0 C, , . :• - .. '. :/s~d t0.ihhbi eresion:-corrosion,..typically an .. . .' usad toi.nhibid~erosion-corrithn.ithtreqicaley an respectively (ref. 15) .. Other. aqueou•s c6ns tantsordd-r of imagnitude greater.:than ,that requiredweetknrosadr'seaabls SicWere taken "from s tand~ar d-.,s~te-am:.,•a'i6.:!,.! ~ .";. '. . .,-:. a.- .. to combine with the oxygenvia :the formal the threshold itself is not'.as.readily 'defined. reaction: -. .. , , . ' as the alternatives.: where erosion-corrosion
H-.. H . 2 ."20 -" - ' '. .. (2) continues unaffected :or. is,, com plel'y--ifnhibied.-' ~Figs. 5ad6 are. cons trucitedon thlater....- : : . .. Neverthe less-:, it was-still: the,-oxygenhpresent basigs, the trel bens tr edboundayine...
which contro'lled'.the% specimen electrochemical i A. • :. . ... .. :;.. .,.. . :. . , ,.. . - ' ,.,. between the two zonesý' :: As expected -there'.is..a-.". !potenrtial and.erosion-corrosion, behaviour. This .t zones . e there is a- " wasas found "t a lyt • up to . . band of uncertainty: associated[-wit:.t. his,,;I.-,." "" "; - .- defined by the half closed'symbols ::anhd' the
• - (up tO- 2 orders of' magnitude)'.' It should also: •- - :• Ot ' :" " ."' : :':i " : !: ,. ., . , ".•, ' ' ' " 24. At bDoth 1150:. and.: iD •,.n r : s- clearly.. an.. . .. .be noted- that these H2 levelsare of course . • 24. A an l5., t..,e is. c an -
higher. than those' normally encountered -in oxygen concentration, treshold below.which .. ,boiler ."erosion-corrosion is unaffected daoo~e- whi.chn... o..er .eedWys emsl
21'. eessesthe process is -:inhi'bited-,, which -can- e~ ýdefined"Therapidshift in e lectrochemical poten- in termsof.thepre-.xistii:geros•on corr.si.n.ate-'tialP to much ,or pstive pot~enti.als and,'the; adte.ae.foye ns.tase h
. .. .. th f: hco` s st r o n ý~ nf• e:.. r' to.h
S he 1osion- corrosion :pr ce~ss surface.. - However,. the-slope of the 'threshold,`:abv 1a treh l& 9.cil"Ocen~tra tion!:.i s:"~atheshpd 2cocetrtin sline is lower than that predicted~by:`equationconsi,"enth a switch in, the-,,cathodic reac- (5), by a factor of.4:for. correlation, att on df the.,dorrosionipods -'ro hyroe be-tter' 1.1fi500C.' whi~chhrepresents the bte data set.evolution to -oxygenreduction. Tha t: is, Iiimrn tpit t,.. .. ha hit. simportarft: to."oit o . howyr: htt
From 2H+ 2e .- 2 .- . ' .- .... (3) experimentally determined erosion-corrosion . -To 102 + "20 + 2e - -.20H : " (4) rate. is 'equated. to a theoreticaltyi"- e-o one c"derived rate of. xygen,:mass ,ýtransfer. .' For manyIn the' case of active erosion-corrosion,. the. corso pc. s.. h close ...... ,r.. n'. .• ., • :- .-. :". • ....v ..'-.- ..,. .. ,, .. •. ... : • . : corrosion.,procesSes,.:ý.sucn.,:Ciose:*,a,, re~emen :•.:: ':i..,:.:
ca.hudic. hydrogen evolutio. . ..- r.action .3 ietween 'experiment and,balanced by a' equalanda.opposite anodi'c one r e . .. d 'i.-,. woudi bcb.-,
S" - - - tleading .to he diSsolution of iron as Fe-, ered suff-icient .to .t-e- ,.nfir 'the .. tca": -:- . .. • • 'ULL '..,• -' • .•:, ::• :;: . . .": " ... L 'analysis ,6 :However-,:.e~xa~mi:nati.on :o i.ne. 1• .',":.•, species. The latter is general-ly agreed' to •haly.is .Hwvr 'e.amination of the'"pssibl:. , • ; -. .•'•-. • • :. " .' • .'_ • • .errors: inývo vedl..in,.:ne. -e s't ma t.1on' orf ox enoccur via the reductive dissoolutoion of thero i in ..e.t.ai. ofoye• :; ::-- " :;-: :::.kt ' :•::.- ' :; ;;. ;:: .: _.:: • : : • ..- "mass, trans,ifer..and eros~ronri- .c rtos~ion: rat imagnetite corrosion film fLormed on the metal mass transfer and erosion-corrosion rat. .-.-- surce - re..-. 2)'. .. _n ' .. indicates: that the •eviation.of thr slope ,of- ,
.- • ' - - 22. The" specimen electrochernica behaviouris the threshold lines from'the.predicted l o0.285 is real. Thus rather less. oxyge .is
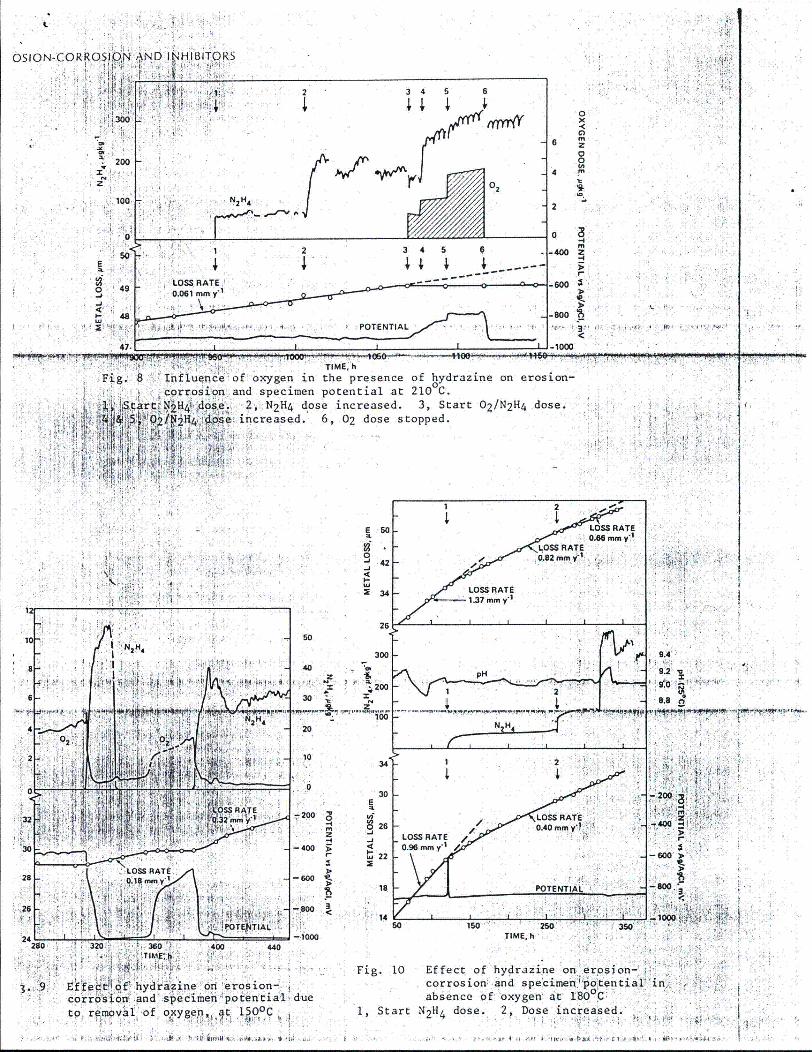
OSION-CORROSIQN AND INHIBITORS
: 300
200
100 N
"0
LOSS RATE.0 49 /
0.061 mmy'
48
V7.;
3 4 5 6
2H4
6
4
2
0X
mza0
lc,
2 3 4 5 6
POTENTAL...
o 3.4-40 Z
-Soor
-goo'A.. ' IL
11 ,
- ~'Y-> '',
TIME. hFig 8 ' Influence of oxygen in the presence of hydrazine on erosion-
- corrosion and specimen potential at 210 C.
"N'4:A •, 2, N2 H4 dose increased. 3, Start 0 2 /N2H4 dose.
,4 •I.€ increased. 6, 02 dose stopped.'i A• •!',•t •..
"250
LOSS RA'
42
1.37m .Y1
_,D-LOTS 'RATE'0.40 mmAy' 400
RATE >
n -I
16000>
150 250 350'TIME.- h
Effect of hydrazine on erosion-corrosion' ,and specirmen.i•potential in .absence of- oxygen' at' 1)80C C2H4 dose. 2, Dose increased.
" , :. .
320 *360~ 400 "40
ef hydrazned ri erosion-corro. si "on :and .sjcimeif ý'poten'tial- dueto, r moval of oxygen.,, at 1000C
Fig. 10
1, Start N
r~U~'~4# LL~'p,.,3 ,~*p - ~ *M ~ i-
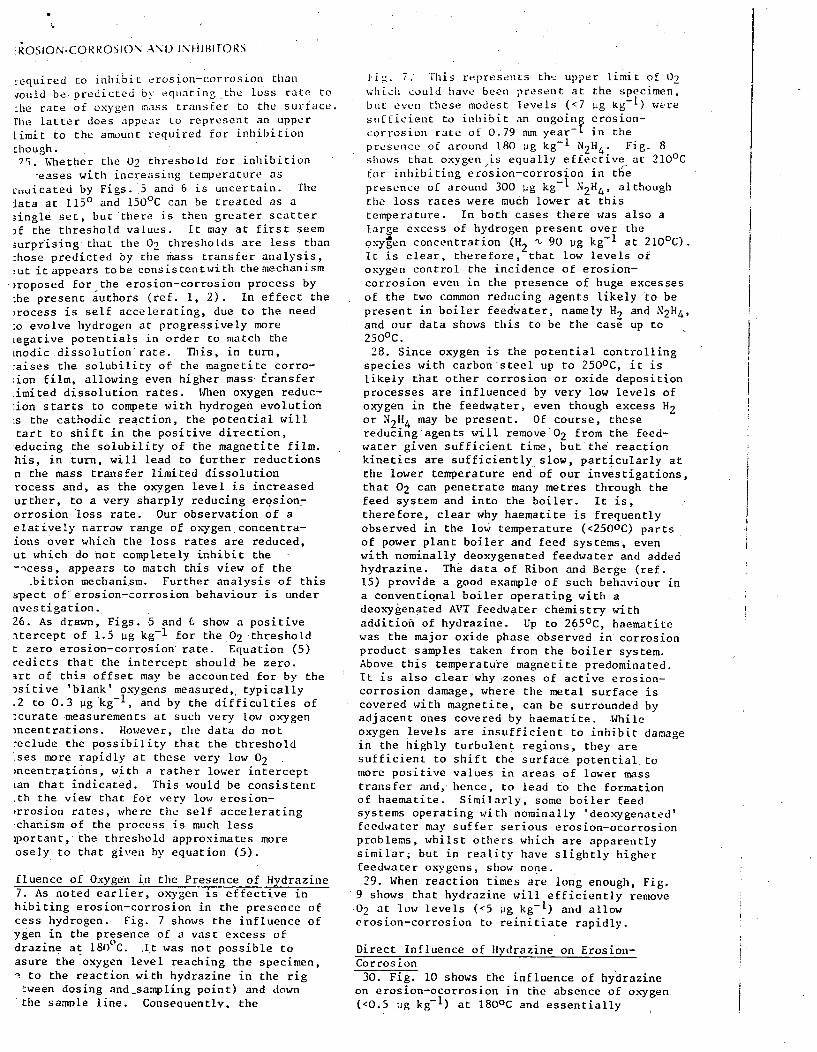
RkOSION.CORk'OSION AN) INHJHI1TORS
r-equired to inhibit erosion-corrosion than
gould be predicted by equating the loss rate to
-lhe rate of oxygen mass transfer to the surface.the latter does appear to represent an upper
Limit to the amount required for inhibition
though.?5. Whether the 02 threshold for inhibition
eases with increasing temperature as
L,.uicated by Figs. 5 and 6 is uncertain. The
lata at 1150 and 150 0 C can be treated as a
;ingle set, but there is then greater scatter
)f the threshold values. It may at first seem;urprising that the 02 thresholds are less than
:hose predicted by the mass transfer analysis,,ut it appears tobe consistentwith themechanism
)roposed for the erosion-corrosion process by
:he present authors (ref. 1, 2). In effect the
)rocess is self accelerating, due to the need:o evolve hydrogen at progressively moreLegative potentials in order to match the
Lnodic-dissolution rate. This, in turn,*aises the solubility of the magnetite corro-;ion film, allowing even higher mass eransferimited dissolution rates. When oxygen reduc-ion starts to compete with hydrogen evolution.s the cathodic reaction, the potential willtart to shift in the positive direction,educing the solubility of the magnetite film.'his, in turn, will lead to further reductionsn the mass transfer limited dissolutionrocess and, as the oxygen level is increasedurther, to a very sharply reducing erosion-orrosion loss rate. Our observation of aelatively narrow range of oxygen concentra-ions over which the loss rates are reduced,ut which do not completely inhibit the-ncess, appears to match this view of the
.bition mechanism. Further analysis of thisspect of-erosion-corrosion behaviour is underavestigation.26. As drawn, Figs. 5 and 6 show a positiveatercept of 1.5 Wg kg- 1 for the .02 thresholdt zero erosion-corrosion rate. Equation (5)redicts that the intercept should be zero.art of this offset may be accounted for by the•sitive 'blank' oxygens measured, typically.2 to 0.3 jig kg-I, and by the difficulties of:curate measurements at such very low oxygenrncentrations. However, the data do not-eclude the possibility that the threshold.ses more rapidly at these very low 02)ncentrations, with a rather lower intercepttan that indicated. This would be consistent.th the view that for very low erosion-)rrosion rates, where the self accelerating!chanism of the process is much lessiportant, the threshold approximates more.osely to that given by equation (5).
fluence of Oxygen in the Presence of Hydrazine7. As noted earlier, oxygen is effective inhibiting erosion-corrosion in the presence of.cess hydrogen. Fig. 7 shows the influence ofygen in the presence of a vast excess ofdrazine at 1800 C. .It was not possible toasure the oxygen level reaching the specimen,-. to the reaction with hydrazine in the rig
'ween dosing and-sampling point) and downthe sample line. Consequently. the
Fig. 7. This represents th 2 upper limit of 02which could have been present at the specimen,but even these modest levels (<7 ng kg- 1 ) weresufficient to inhibit an ongoint erosion-corrosion rate of 0.79 mm year in thepresence of around 180 ug kg- 1 N2 H4 . Fig. 8shows that oxygen is equally effective at 2100 C
for inhibiting erosion-corrosion in thepresence of around 300 ,ig kg-I N2 H4 , althoughthe loss rates were much lower at thistemperature. In both cases there was also alarge excess of hydrogen present over theoxygen concentration (H2 ' 90 og kg- 1 at 210 0 C).It is clear, therefore, that low levels ofoxygen control the incidence of erosion-corrosion even in the presence of huge excessesof the two common reducing agents likely to bepresent in boiler feedwater, namely H? and N2 H4 ,and our data shows this to be the case up to250 0 C.
28. Since oxygen is the potential controllingspecies with carbon steel up to 2500C, it islikely that other corrosion or oxide depositionprocesses are influenced by very low levels ofoxygen in the feedwater, even though excess H2or N2 H4 may be present. Of course, thesereducing agents will remove'0 2 from the feed-water given sufficient time, but the reactionkinetics are sufficiently slow, particularly atthe lower temperature end of our investigations,that 02 can penetrate many metres through thefeed system and into the boiler. It is,therefore, clear why haematite is frequentlyobserved in the low temperature (<2500C) partsof power plant boiler and feed systems, evenwith nominally deoxygenated feedwater and addedhydrazine. The data of Ribon and Berge (ref.15) provide a good example of such behaviour ina conventiqn-al boiler operating with adeoxygenated AVT feedwater chemistry withadditioft of hydrazine. Up to 265 0 C, haematitewas the major oxide phase observed in corrosionproduct samples taken from the boiler system.Above this temperature magnetite predominated.It is also clear'why zones of active erosion-corrosion damage, where the metal surface iscovered with magnetite, can be surrounded byadjacent ones covered by haematite. Whileoxygen levels are insufficient to inhibit damagein the highly turbulent regions, they aresufficient to shift the surface potential tomore positive values in areas of lower masstransfer and, hence, to lead to the formationof haematite. Similarly, some boiler feedsystems operating with nominally 'deoxygenated'feedwater may suffer serious erosion-ocorrosionproblems, whilst others which are apparentlysimilar; but in reality have slightly higherfeedwater ox-ygens, show none.
29. When reaction times are long enough, Fig.9 shows that hydrazine will efficiently remove.02 at low levels (<5 pg kg- 1 ) and allowerosion-corrosion to reinitiate rapidly.
Direct Influence of Hydrazine on Erosion-Corrosion
30. Fig. 10 shows the influence of hy'drazineon erosion-ocorrosion in the absence of oxygen(<0.5 .g kg-1 ) at 180 0 C and essentially
4ps~tsa boilers' fro iront iW>~ .'A44'
Proc,'Am. Power Conf. 32, 721,
* *t
*11 ;- '.Ib,.
I$ 44 hf'r ....*..L.rL.L.'.
* ii ;:PI 11
7 ':fl,' I 3..3
4 : ' 3 : ~8h 14 4' ~". AA 7'. 1 i'.' '.{;ii'ij14¾1 4 A'4 4~.' 2;.
ilAvAri ,,..44;...'.
ORS '.'...'.n:fr~..)'.';4
4'.'~'r4
:4'.'.'njj4k~'...........
Magnetite 16 CaPOtE J 14 an tURNER .. , 4."'
fl solution. pH control in Addt~'ives1970 NP 4109 PWR secondary water >A'EPRI for
Rcpor~4'..'. ~444'.. .4.
'.4. ~i;4.4.rq•.;A.7~ I'.:
4. ~ '.A'.~. A'j~ 4444r.4 rAt ~ 'd' '7.7.'.'.A. A A,
7.4...:'>.
AA4'AA"."A
7 '''1'.1.' .7.I, 1 1 A
I 3'.',
444 " LA 444'. AA '. '.47-4',,~'. 4~j 7.44 '.~ '' VILv:'.ttI..'.',+'.4'..' .4~4.
I~r .44'. 444.A.V*flA ~AA4AL "'r'A ... .
''~ 7I''~.1 747 A 47' 3'. 4.44, ~ 4; 'LA 4 4 A (44 47 .4'.ThI41'.34;t 47*4.'.:44i:
................................14.44,., 7
A A. AL 47 A 4'.
4) 43777:9 '7.71 4%. 7 pyrr~r 'A "''4.4
A ~Tf" tA4744b4741; ,. .7:
'A 44 .: *AA4 ~iA..fl.L'..l'.fr,'Aht .4 7".'.7w~".4~A;:
~: ,'.,~..., 41.: jI1'j~Q fl1'AN#~'tU{V.* , A ~'. 4.4'.
1''' 4 AA..LV:AAJI..,AL'...4
~
I.
A . . 'A ~t'd~ .'P¼A.4
J.. ~t. ~ ':2'.
4 4 '.i.i.,'44. '41 4.4 <4<~ ':' 3
'4 ~$ :3u1½''".". A'.<'' 7 J.A'A A '. A~ ~L~4'~~' #4 ~44
'. A A4
:J''''''''';A.''.'.V''''''' A .~'.Y:~~9i~; ~ 'A'.3'.~ ;iLLf4'.'.~4..Ad.A3.4LAA.4..... t3~'..A-471: .47''..7.4f.
I A4~A ~L N A'. A
A 4 A A A 474 444 4.AA4''''1
.'t'.. ''L'.4:.'.'. ~''
A I
A '.'.,4ALA(rAAL~AA..i24A43 r~'.. 4r'.i *r~47
1 7 ~7 r .1.7 . p A
AAA~AAAAA.'..A 7 7'., .4. 447
A '1........A'AA''41A.A ,' 4 4 . .4. 7
A 7 . ~4.74 .. 7,~I ,. .... 'Ar. 7A A AlA. . . . '..'.'..'.AA77'A' A'.
I 4 A 34; '. '77 1)~~I~4~ 'P7A7.1'~8Ii4I.A.'.3~AIIAL~4~lv3.4t 44'.". . 44 3,:t..'~A A
'.7 A A .~p............... 4,'.>
f~IhIL (443~y 44 444 ".4 44 A 447444.4 44447(3 444. 37A3'4134741344A47 flU'. IA .444 4,, ' .n 'A'.A.'.fl 4IL 47.44'. ~'. ~ ~ ~3t"A'fAh1~*3*I4(3 44'.'' A'.'.4'.A. 4*
4 A. 7 AA'.j' A'.'.
AL '. A A A '.7:' '''.4'. A 4.17.'.A...
44 4 ,r A .. '.Ai..A,.4A3 4 7
77[f'i.A''47.fI 'A4 7'.~AAA'.4 AAV'4r'.'.L'.AA4AL44rA44AAW4Ar
7 A 74A. ''. ' '4444 A 7' 4.444344
... '''. A 48 .~~1['t'.'2.'{~; '.~"A'A4A4' 44'4; 4 4 I
.>A 77~,47. ' ,5.§414711W.
>' >4 v1
A4.t4$14L 444',4 1 1 ~JfL{'&' "&LW".4442 4~#44A~'; .
<A. . . I A 'j'.4$A' .4 444'.
4 A A ' A A j .47 4 A . '. . I jA A * A
'A 'i~77 '7~'''~'A".' 7 4 'LA. '.11 '.1 7 A'7.A.'4AAALLA4 4'
4A~ ~ '.444.4'. 'A.''. , 434 444444.> A'AAA.'.A A'1A.AflI'.~ ~S-''. A '. A A. ULy A.A.AL A.AjsriI'.4i.1
94'4t'.t .4n344A~iA'i4J~ A,.Z~UiW.A2'.J)l
7 4..
4
.7'3'."&Ai't 4t434.:>7 ir 3>44; ;'.'..§cf3¾44 ~4~'>
L.A 'LA '',''.A.
447 ~j' VIA..,
4 444'. 4 '~ '"r'' IA~ ~'J~; <7kA 4
44 V A , .. ',.4A"'.4
"L'A4 '$4'.. ''4...' .. 'AA'.'.~.A,' A .'~'4''''.''''< 'A
A.... ''.'.., ..AAAALA..AA.'.L'.AA.rA.K:A4.4
AU'.''' A .''~'.'.4L~A'.A.' 'A 'A'.
77i¶':4;3'3~j: 4444'. t',~ 4444
4 14j 34
43.744444114441' P44L <''3 7473
77
.74
er' $j .4.. 7Mn;r '7';
47 g43'..-'.
* 44~ -
444 47
A ~4 #4
HI'.
Af 4'. 'A ~A
U "4. .47L 43. 4~'.4434'.344
NEC-RH_04
UNITED STATES OF AMERICANUCLEAR REGULATORY COMMISSION
ATOMIC SAFETY AND LICENSING BOARD
Before Administrative Judges:
Alex S. Karlin, ChairmanDr. Richard E. Wardwell
Dr. William H. Reed
In the Matter ofDocket No. 50-271-LR
ENTERGY NUCLEAR VERMONTYANKEE, LLC, and ASLBP No. 06-849-03-LRENTERGY NUCLEAR OPERATIONS, INC.
June 20, 2006(Vermont Yankee Nuclear Power Station)
PRE-FILED REBUTTAL TESTIMONY OF DR. RUDOLF HAUSLER
REGARDING NEC CONTENTION 4
Qi. Please state your name.
Al. My name is Rudolf Hausler.
Q2. Have you previously provided testimony in this proceeding?
A2. Yes, I provided direct testimony in support of New England Coalition, Inc.'s (NEC)
Initial Statement of Position, filed April 28, 2008.
Q3. Have you reviewed the initial statements of position, direct testimony and exhibitsfiled by Entergy and the NRC Staff concerning NEC's Contention 4? -
A3. Yes. I have reviewed the section of Entergy's Initial Statement of Position on New
England Coalition Contentions (May 13, 2008) that concerns NEC's Contention 4 and all
Exhibits thereto, and the Joint Declaration of Jeffrey S. Horowitz and James C. Fitzpatrick on
NEC Contention 4 - Flow-Accelerated Corrosion (May 12, 2008). I have also reviewed the
section of the NRC Staff Initial Statement of Position on NEC Contentions 2A, 2B, 3, and 4 that
concerns NEC's Contention 4 and all exhibits thereto, and the Affidavit of Kaihwa R. Hsu and
Jonathan G. Rowley Concerning NEC Contention 4 (Flow-Accelerated Corrosion) (May 13,
2008).
Q5. Did you prepare a report of your evaluation of the Entergy and NRC Staff InitialStatements of Position and direct testimony on NEC's-Contention 4?
A5. Yes, I did. This report is-filed with this rebuttal testimony as Exhibit NEC-RH-05.
Q6. Please briefly summarize your conclusions as stated in your report filed with this
testimony as Exhibit NEC-RH_05, and the bases for your conclusions.
A6. Entergy witness Dr. Horowitz has testified that it is not necessary to recalibrate or
"benchmark" the Checworks model with plant inspection data following a twenty percent power
uprate. Joint Declaration of Jeffrey S. Horowitz and James C. Fitzpatrick on NEC Contention 4
- Flow-Accelerated Corrosion at A33, 34. Rather, Dr. Horowitz contends that the only update to
the Checworks model that is necessary follo~ving a twenty percent power uprate is the input of
new values for flow rate and temperature into the model. Horowitz at A33, 34. Dr. Horowitz
bases these assertions on his view that "[flow-accelerated corrosion (FAC)] wear rates vary
roughly with velocity and do not increase with velocity in [a] non-linear (exponential) manner...
.", Horowitz at A49, and his belief that the Checworks model can accurately predict any
variations in FAC rates related to geometric features. Dr. Horowitz contends that the Checworks
model accounts for any localized variations in FAC associated with geometric features through
the use of " 'geometric factors' to relate the maximum degradation occurring in a component,
such as an elbow, to the degradation predicted to occur in a straight pipe." Horowitz at A47, 48.
As explained in detail in my report, Exhibit NEC-RI-05, I agree that the rate of FAC
generally varies almost linearly with fluid velocity; however, this linearrelationship transitions
2"
to an exponential one as the local turbulence becomes such that erosional features become
manifest. Whether such transition actually occurs when flow velocity increases following a
power uprate must be determined experimentally. I do not agree that the Checworks model, or
any model, can fully account for variations in the rate of FAC due to geometric features and
discontinuities. Some things cannot be specified. For example, the internal residual weld bead
from the root pass may be 1/8 inch high in one case, and ¼ inch high in another case. The
upstream and downstream turbulence surrounding the weld bead will be more severe in the latter
case, and a power uprate may disproportionately affect the flow over the larger bead.
Dr. Horowitz defines FAC as corrosion in proportion to the flow rate, and excludes from
the definition of FAC the more severe forms of localized corrosion - erosion-corrosion,
impingement and.cavitation. See, Horowitz at A46. This definition of FAC is entirely arbitrary.
Erosion-corrosion, impingement and cavitation are extensions of FAC as the local flow intensity
due to turbulence increases. The transition from one to the others is continuous and difficult to
identify. If Checworks is unable to predict these more severe forms of localized corrosion
related to high flow rates, which can particularly occur after a power uprate, then this is a serious
shortcoming of the model and its application.
The accuracy of Checworks has been said to be within +/- 50%. This statement is based
on an erroneous interpretation of the graphic representation of predicted vs. measured wear.
Actually, the accuracy is within ,a factor of 2 - the measured wear rates range from twice the
prediction to half the prediction. A factor-of-two difference between measured and predicted
corrosion [or corrosion rate] can be quite significant with respect to selecting a particular item
(line) for inspection during a refueling outage. Indeed, the "EPRI Checworks Wear Rate
3
Analysis Results for Cycle 22B," Exhibit E-4-29, shows that the time predicted to reach the
critical minimum wall thickness in a majority of cases is many years negative. This means that
the item should have failed a long time ago. The remaining time to failure might just as readily
be grossly overestimated. But one will never know unless the proper inspections are performed
and the model is recalibrated.
Q7. Does this conclude your rebuttal testimony regarding NEC's Contention 4 at this
time?
A7. Yes.
4

I declare under penalty of perjury that the foregoing is true and correct.
Rudolf Ha e, h
AtAý, ý, Texas, this • day of May, 2008 personally appeared Rudolf
ausle and having subscribed his name acknowledges his signature to be his free act
and deed.
Before me:
My Commission Expires ~ ~ ~ ~
,J~ENNIFER JULANA PEREZNote PublicMySTATE oFTEAS
My COmm. Exp. August 22, 2011

NEC-RH_05
CORRO-CONSULTARudolf H. Hausler8081 Diane Drive
Kaufman, TX 75142Tel: 972 962 8287 Mobile 972 824 5871 Fax.' 972 932 3947
Flow Assisted Corrosion (FAC) and Flow Induced Localized Corrosion:Comparison and Discussion
Summary
0 The'computer model Checworks, used to manage aging of hot high pressure waterand steam carbon steel lines was designed for Flow Assisted Corrosion (FAC)phenomena. Erosion Corrosion, Impingement and Cavitation are expresslyexcluded as unrelated to FAC. It is shown that the latter three corrosionphenomena are extensions of FAC as the local flow intensity due to turbulenceincreases. The transition from one to theothers is continuous and difficult toidentify. FAC therefore is only one manifestation of Flow Induced LocalizedCorrosion (FILC).
* The localized corrosion rate under the umbrella of FAC varies, per definition,almost linearly with fluid velocity; however, this linear relationship transitionsinto an exponential one as the local turbulence becomes such that erosionalfeatures become manifest. Whether such transition actually occurs following apower upgrade (PU) must be determined experimentally. It cannot be estimatedfrom within Checworks.
0 It has been stated that "the algorithms used to predict the FAC wear rate are basedon extensive laboratory and plant data. This assures that the FAC wear ratespredicted by Checworks are accurate." This accuracy is said to be within +/- 50%.However, this statement is based on an erroneous interpretation of the graphicrepresentation of predicted vs. measured wear. Actually, the accuracy is within afactor 2. The measured wear ranges from twice the predicted to half theprediction.
* Partial review of the result from the pipe inspections using Checworks in 2003and 2006 shows significant unexplained discrepancies.
I. Introduction
The direct testimony by Dr. Jeffrey S. Horowitz and Dr. James C. Fitzpatrick') withregards to NEC Contention 4 - Flow Accelerated Corrosion has raised a number ofquestions, which are being discus'sed below:
1) Joint Declaration of Jeffrey S. Horowitz and James C. Fitzpatrick on NEC Contention 4 -Flow-Accelerated Corrosion, May 12, 2008.
6/2/2008 I of 12 RHH Rebuttal
" Is the model called Checworks based on sufficiently broad scientificunderstanding of all pertinent corrosion phenomena?
* Is the model called Checworks broad enough to capture alJ flow-assistedcorrosion phenomena, or more broadly Flow Induced Localized Corrosion(FILC) in general?
" Is the model called Checworks suitable to manage aging of the hot water andsteam piping system at the Vermont Yankee Power Plant?
" Is the predictive power of the model called Checworks within a probabilityrange to prevent unforeseen catastrophic failure?
* Does the model called Cheeworks require extensive recalibration?
In order to tackle some of these questions I shall discuss some of the pertinentbackground and try to unravel the conundrum of language, which has, it seems to me,caused some misunderstandings if not outright confusion.
II. Background
1. The Chemical Nature of the Passive Steel Surface
It is well established that under certain conditions corrosion occurs in carbon steel hotwater pipes in nuclear (and fossil) power generation plants. The chemical nature ofthis phenomenon is straightforward: iron reacts with water to form iron ions andhydrogen. The reaction is thermodynamically favored.2 •
',However, the physicochemical nature of the processes occurring in conjunction withthe oxidation of iron, is infinitely more complex and, although investigated in greatdetail,3' generally not easily understood.
Ferrous (Fe+2) or ferric (Fe+3) ions are not stable by themselves at the prevailingtemperatures (-300 OF) at a neutral or slightly alkaline pH. Either ion will react withwater and form hydroxides, oxy-hydroxides, or oxides. The reaction occurs on thesurface of the metal where an oxide layer forms, which slows the corrosion reactionor prevents it from occurring altogether. The phenomenon is called passivation andmakes it possible for iron, steels, or stainless steels to be used as industrial materialsto begin with. At the temperatures in question the passive layer is a thin crystalline"coating" of magnetite on the surface of the steel, Fe 30 4, a mineral also found innature. Fe3 O4 is a combination compound formed from FeO and Fe 20 3, genericallycalled a Spinell. Because of the nature .of the Spinell-type oxide combining in essencea two-valent iron with a three-valent iron ion, magnetite is electrically conductive and
2)NEC-RH_03: R. H. Hausler, Discussion of the Empirical Modeling of Flow-Induced Localized
Corrosion of Steel under High Shear Stress, April 25, 2008, pg 3.
3) See ACS Symposium Series Vol. 89 (1982), Editors: G.R. Brubaker, and P.B. Phipps, Chapters byMaurice Cohen, Vlasta Brusic, and J.E. Draly.
6/2/2008 2 of 12 RHH Rebuttdi
forms a contiguous thin, non-porous albeit crystalline layer on the surface of themetal.
2. The Physical Nature of the Passive Magnetite Layer
.Steel in the passive state will not corrode or only at extremely slow rates (10O' to 10-2mpy). The question then is: What makes iron in the passive state corrode? Why dohot water or steam pipes in nuclear power generating units fail due to corrosion? Whyare the failures predominantly local while the rest of the structure remains intact andpassive for many years?
Any phenomenon that can destroy the protectiveness of the passive layer or assist inremoving the passive layer will cause the steel to corrode at rates 103 to 104 timesfaster, i.e. at corrosion rates observed in the power plants.
What are these phenomena? In order to better understand this one needs to understandthat magnetite is an electronic conductor. It can pass electrons from the metal side tothe water-side where they can be consumed by an electrochemnical reaction.Magnetite, however, cannot conduct ions. Neither iron ions nor oxide ions are mobilein magnetite. 4 ) The phenomena that destroy the protectiveness of the passive layerare essentially chemical in nature, but may, however, be assisted by physical effects.For instance, chlorides in the water will convert magnetite to iron-oxy-hydroxy-chlorides, (various modifications thereof), which are much more soluble thanmagnetite and also can conduct ions. The result is that the passivity has been lost. 5 )
This is the mechanism that prevails in the crevices of the steam generators of PWR'sand is the primary cause of denting.
Magnetite has a finite, albeit very small, solubility in hot water. The dissolution ofminerals in water is aided by agitation, i.e. forced convection. Salt (sodium chloride),e.g., will not dissolve in stagnant water, but will readily go into solution when thesolution is agitated. The dissolution process will stop when the solution is saturated,with the salt. This is in essence how the corrosion process of steel in hot water has tobe visualized. I have tried to sketch the physical reality as simplified as reasonablypermissible in Figure 1. 6) The water layer close to the magnetite surface is saturated*with iron oxide in equilibrium with the magnetite layer. The iron concentration in thebulk water phase is practically zero. Therefore a concentration gradient develops from
4) Because of the physical nature of magnetite iron, it is also called a valve-metal (in analogy to aluminum).However, the magnetite layer is distinctly different from such corrosion product layers as iron sulfide oriron carbonate. iron sulfide, for instance, is a p-type conductor based on iron ion vacancy mobility. Thislayer therefore can grow from the solution side, a process not possible with magnetite, because magnetitecannot conduct iron or oxide ions.
5) The phenomenon is well known in the nuclear industry since it is the primary cause of "denting"observed in stream generators of PWRs.
6) Note that this Figure and the mechanism derived therefrom essentially mirror Dr. Hopenfeld's
explanations: NECJH_36 at pg 3 and Fig. 1.
6/2/2008 3 of 12 6/2/208 3 f 12RHH Rebuttal
the magnetite surface across the stagnant boundary layer. The solubility of iron (frommagnetite) is very, very low. Hence, the mass transfer of iron ions across the stagnantwater layer near the magnetite surface, which occurs by diffusion and is controlled bythe concentration gradient, is very low as well. The thickness of the stagnant layer,which is infinite if there is no flow, is reduced as flow over the surface increases.Therefore,, as the flow [rate] over the surface increases, the stagnant layer (also calledthe laminar boundary layer or the diffusion layer) is reduced in thickness, thediffusion rate increases, and hence the dissolution rate of the passive layer. Thethickness of the passive layer (which is very small to begin with) becomes a steadystate value when its formation rate (the corrosion rate) equals the removal rate(dissolution and mass transfer rate). The latter is controlled by the flow rate.Therefore, this type of corrosion has been termed Flow 'Assisted Corrosion(FAC). However, as we will see below, the fact that the creators of Checworks havedecided that the main characteristic of FAC is its proportionality to the flow rate isentirely arbitrary.
3. The various forms of FAC
If the flow (laminar or turbulent 7)) is strictly uniform over the entire surface area ofinterest then the entire area will corrode uniformly and wall thickness loss is uniform.
However, at the prevailing flow rates (24 ft/sec in many cases) the flow pattern is notuniform because of the non-uniformity of the cross sections of the flow channels. Inparticular, where flow upsets are built into the system, such as orifice plates,flanges, etc., localized turbulences occur which are much more intensive than arenormally described by general flow equations. The engineering approach is tocharacterize the flow at such flow disturbances by means of differential pressure dropand an average shear stress occurring at the disturbance. However, the difficulty isthat the localized shear stress within the turbulence cannot be captured in this mannerand is in general orders of magnitude higher than the average numbers 8) wouldindicate.
The different paradigms can perhaps be explained by means of Figure 2 (below). Anygeometric feature in a flow channel (pipe for instance) that reduces or expands the[hydraulic]-diameter, or changes the direction of flow, creates a flow disturbance(including sensors inserted into the pipe for temperature, pressure or otherparameters). This means that the flow regime, which in the straight sections of thepipe may be fully developed laminar or turbulent flow changes to one, that alsoincorporates local turbulences (eddies). This leads to locally enhanced shear stressand hence enhanced mass transfer and therefore locally increased corrosion.
Just as flow in a pipe can be characterized by the pressure gradient, flow upsets, suchas are shown in Figure 1, can be characterized by an average pressure drop (and
7) For definition of turbulence in the general sense see Figure 2 Ref. 2.
8) c.f. for instance Figures 4 and 5 of Ref. 2
6/2/2008 4 of 12 RHH Rebuttal
hence an increased average shear stress. Engineering practice has done this for a largenumber of flow features (elbows, orifices, t's, etc.) of varying diameter for thepurpose of being able to calculate the pressure drop along complex piping systems.
Checworks now uses these flow features (56 of them) to record and classify observedand measured corrosion rates in a data base along with a host of environmentalparameters (pressure, temperature, water chemistry, etc), physical parameters (flowrates, metallurgical features, and many more), as well as boundary conditions such asminimum critical wall thickness etc. Once the database has been established,statistical routines, such as multiple linear correlation, can be applied in order toextract explicitly and quantitatively the dependence of corrosion rate within theparameter space. The resulting correlations can then be used to predict corrosion ratesfor individual situations, which can be characterized well enough to beaccommodated in the database (one of the 56 features). Certain theoretical conceptsare combined with the multiple correlation, in particular the notion that corrosionincreases proportionately with velocity. 9)
Therefore, there are two major principles imbedded in Checworks:
* Flow features have been standardized in traditional engineering fashion (anelbow is always an elbow, an orifice is always an orifice, etc.). However, forcertain features that could not be done: a weld is not always a weld, and aflange is )not always a flange (see discussion below).
* A linear (or near linear) relationship between flow rate and mass transfer, i.e.corrosion rate, has been built into Checworks. It is for this reason that Dr.Horowitz indicates that certain failures, which had been identified as beingcaused by erosion or impingement could not have been predicted byChecworks, but that this lack of prediction does not invalidate the predictivevalue of Checworks.
It has been shown theoretically that the shear stress governs the mass transfer.Accepting this one can readily understand that at locations of high shear stress themagnetite dissolution is high and therefore the corrosion rate is high as well. This hasled to the notion of flow induced localized corrosion (FILC). Clearly the phenomenonis "flow assisted" but it is localized. By that one does not mean pitting; rather, onerefers to areas of some extension, which corrode faster than the adjoining metal.Much has been made of the extent of the areas subject to FILC (or FAC) because therisk associated with the resulting failure will be governed by the extent ofcorrosion. 10)
9) See Ref. 1 Horowitz at A 49. n
10) Understandably, the damage from a half-inch to one-inch "pinhole" may be considerably limited versus
the damage from a pipe that splits open the length of several feet.
6/2/2008 5 of 12 RHH Rebuttal
If only a small area corrodes due to enhanced local turbulence a small pit andeventually a small hole may result with only minor consequences. If on the otherhand FILC (FAC) occurs over a larger area, the pipe may split open (as has indeedhappened) with potentially disastrous consequences.
One can now reasonably ask the question as to what happens if the flow intensityexceeds that which has been empirically correlated in Checworks. In other words, if acertain localized enhanced corrosion rate has been observed over a period of years inthe past and all of a sudden the flow rate (and hence the flow intensity) is increased,(EPU, power upgrade), will the local corrosion rates simply increase proportionatelyin accordance with the established laws relating average shear stress to mass transfer,or will the local corrosion rates increase exponentially as has been suggested earlier?In the first instance Checworks would predict the new corrosion rate, in the secondinstance Checworks would have to be recalibrated, or even fundamentally modified toaccommodate the new relationships. This is the fundamental question that must beanswered before Cheeworks can be accepted as the basic tool to manage aging ofthese pipes.
Indeed additional phenomena related to high flow rates, high shear stress, have beendocumented with failure rates in excess of those attributed to FAC. These phenomenaare described as erosion corrosion, "I) impingement corrosion, 12) and finallycavitation.13) All three phenomena result in a much more severe attack than what hasbroadly been called FAC, and which is at the basis of Checworks (see definitionsbelow).
It is important to highlight this since the phenomena covered by Checworks do notinclude the most severe corrosion, which can occur particularly after a powerupgrade. In fact Dr. Horowitz dismissed as irrelevant with respect to Checworksactual catastrophic failures attributed to erosion corrosion or impingement corrosionand therefore outside the scope of Checworks. This is a serious shortcoming of the
l ) This is actually a misnomer in this context since erosion corrosion generally involves solids carried in
the fluid stream. However, it is recognized that the terminology is not used consistently. Erosion corrosion,which I prefer to' characterize as FILC, starts at some unevenness on the surface (inclusion, scratch, etc.).The high flow rate causes local eddies, which leads to higher removal rate of corrosion product than overthe surrounding areas. As the area of enhanced corrosion grows, the flow disturbance grows in intensity.Consequently the rate of penetration is not constant with time.
12) Impingement is caused by liquid droplets carried in the gas to hit the surface. This can occur from any
angle depending on the direction of the flow vector. When a droplet approaches the surface the liquidbetween the droplet and the surface has to be displaced. It turns out that the velocity of the liquid parallel tothe surface increases exponentially as the droplet approaches values many times higher than the estimatedaverage velocity of the bulk liquid relative to the surface.
13) Cavitation occurs when the liquid flows relative to the surface (or the surface moves relative to the
liquid) with oscillations such that at one point in time a vacuum is generated and a bubble is created, whileright afterwards the pressure increases such that the bubble collapses. This causes enormously highoscillating fluid velocities parallel to the surface and tremendously increased mass transfer and very likelymechanical damage to the corrosion product layer (the passive layer) as well.(
6/2/2008 6 of 12 RHH Rebuttal
model and its application, because if the model forms the basis of aging managementof the steam and hot water pipes it must, absolutely must,'include the occurrence ofall corrosion phenomena including those that lead to the most severe corrosiondamage, not be restricted to just the average corrosion. But herein lies the rub asfollows:
Checworks fully recognizes the fact that the severity of flow induced corrosiondepends on geometric factors as described previously. Checworks, it appears,specifies in excess of 56 different geometric features. However there-are things thatcannot be specified. For example, the internal residual weld bead from the root passmay in one case be 1/8 inch high, in another % inch. The upstream and downstreamturbulence surrounding the weld bead are obviously much more severe in the lattercase, and a power upgrade may disproportionately affect the flow over the largerbead.
While an increase in flow rate will affect the mass transfer rate (and hence thecorrosion rate) proportionately under conditions of well defined (turbulent) flow, theflow intensity in local turbulences, such as eddies upstream and downstream ofmechanical (geometric) flow disturbances are increased exponentially (see earlier).And here exactly is the uncertaiinty highlighted by Dr. Hopenfeld and denied by Dr.Horowitz. As I have also documented, industry consensus is that the flow intensity inlocal turbulences is increased to a much larger extent due to a power upgrade than theflow intensity in well-developed turbulent flow.
There are however additional phenomena, which have to be taken into account.Protective corrosion product layers can be destroyed not only through dissolution butby mechanical forces with turbulent areas. The fracture strength of corrosion productlayers, such as iron sulfide and iron carbonate (highly protective formations), isextremely high (of the order of many hundreds of mega Pascals). Generally thecompressive forces within turbulences are not that high. 14 It has been observed,however, that isolated events occur within the turbulences that match the fracturestrength of the corrosion product scale. These events have led to the definition of acritical shear stress (or critical flow intensity) beyond which the protectiveness of thelayer is lost. I am not suggesting that this absolutely happens. I am however
'postulating that past experience as built into Checworks cannot account for suchoccurrences. Therefore, the aging management process has to be revised orChecworks calibrated accordingly.
III. Discussion of Specific Experiences Involving Checworks
1. The Reliability of the Predictions
It has been said that Checworks can predict the "wear" [cumulative corrosion] within+/- 50 percent. If this were the case the modeling program would indeed beoutstanding. However, the notion of predicted rates being with +/- 50% of the
14) This discussion relates to the "freak waves" alluded to earlier (see ref 2).
6/2/2008 7 of 12 RHH Rebuttal
measured ones is derived from a representation of the data as shown in Figure 3below. It is true that when the measured wear data are plotted against the predictedones most of the data points lie between two lines that are plotted +/- 50% off the 45degree equivalency lines. This interpretation is totally misleading and scientifidallydishonest.
First, one sees that there is no correlation between the predictions and the actualmeasurements. Second, one also sees that measurements which we are made tobelieve are within 50% of the predicted value are really twice as large or larger;similarly, on the other side one sees that measured values are half or less of thepredicted ones, again a factor of 2 different.
Conclusion: The accuracy of Checworks is such that the measured values arewithin a factor of +/- two [+/-.2] of the predicted values rather than +/- 50% asclaimed.
A factor-of-two difference between measured and predicted corrosion [or corrosionrate] can be quite significant with respect to selecting a particular item (line) forinspection during a given refueling outage. Indeed the report of the "EPRI ChecworksWear Rate Analysis Results for Cycle 22B"'15) shows that the time predicted to reachthe critical minimum wall thickness in a majority of cases is many years negative.This means that the item should have failed a long time ago. Similarly, the remainingtime to failure may be grossly overestimated. But one will never know unless theproper inspections are performed and the computer model recalibrated, a process Dr.Horowitz and Entergy seem to find irrelevant. 6)
Examination of the data from March 2003 (RFO 23) showed average and measuredcorrosion rates of the order of 28 and 21 mpy, respectively, for the outlet "P-1-1A" online 001-16-FDW-01. In May of 2006 these same rates have come down to 7.524 and5.712 mpy, respectively.17) It is hard to see how this could have happened. There is inthe program something called "Line Correction Factor." This factor has been definedby Dr. Horowitz as the relationship between predicted and measured corrosion rate(see belowl8 )). However in 2003 this factor was 0.649 and by 2006 it had become0.175. It is amazing to observe that fudge factors are built into the program which
15) Exhibit E-4-29.
'6) Joint Declaration of Jeffrey S. Horowitz and James C. Fitzpatrick on NEC Contention 4-Flow-
Accelerated Corrosion: A 34.
17) Exhibit E-4-30.
HOROWITZ'S TESTIMONY STATES THE FOLLOWING ABOUT THE ABOVE-MENTIONED"CORRECTION FACTOR" AT A28: "A Pass 2 Analysis compares the measured inspection results to thecalculated wear rates and adjusts the FAC rate calculations to account for the inspection results. Theprogram does this by comparing the predicted amount of degradation with the measured degradation foreach of the inspected components. Using statistical methods, a correction factor is determined which isapplied to all components in a given pipe line - whether or not they were inspected.",
6/2/2008 8 of 12 RHH Rebuttal
allow the operator to manipulate the data such that they meet certain criteria. (In theparticular case mentioned above apparently negative times to failure were quiteinconvenient).
Further examination of the data reveal that for the same line the corrosion rate on"Outlet P-l-1C" is exactly the same within 4 digits (+/- -0.01 percent). Under thecircumstances, it is very hard to gain confidence in Checworks and the manner inwhich it is apparently handled.
Finally it should be mentioned that with all the work that has been done, theoreticaland empirical, around the problem of Flow Induced Localized Corrosion the matter isstill not understood. In discussing the failure which occurred in April 2004 at theKewaunee plant, Dr. Horowitz states that the line in question is not FAC-susceptiblebecause apparently it is part of the "raw water system." Therefore it was not analyzedwith Checworks and is not covered by NSAC-202L.
This is obviously a very unfortunate approach to the problem of corrosion in itsentirety.
Whenever corrosion is dependent on transfer of corrosion products away from thesurface, or transfer of corrodents to the surface, the corrosion rates are mass transferdependent and hence flow dependent.
In the case of raw water, the oxygen content in the water is responsible for theobserved corrosion. The corrosion rate is dependent on the oxygen concentration aswell as on the flow rate. Flow rate dependence of corrosion is almost universally trueexcept in a very few cases which are not relevant in this context.
6/2/2008 9 of 12 RHH Rebuttal
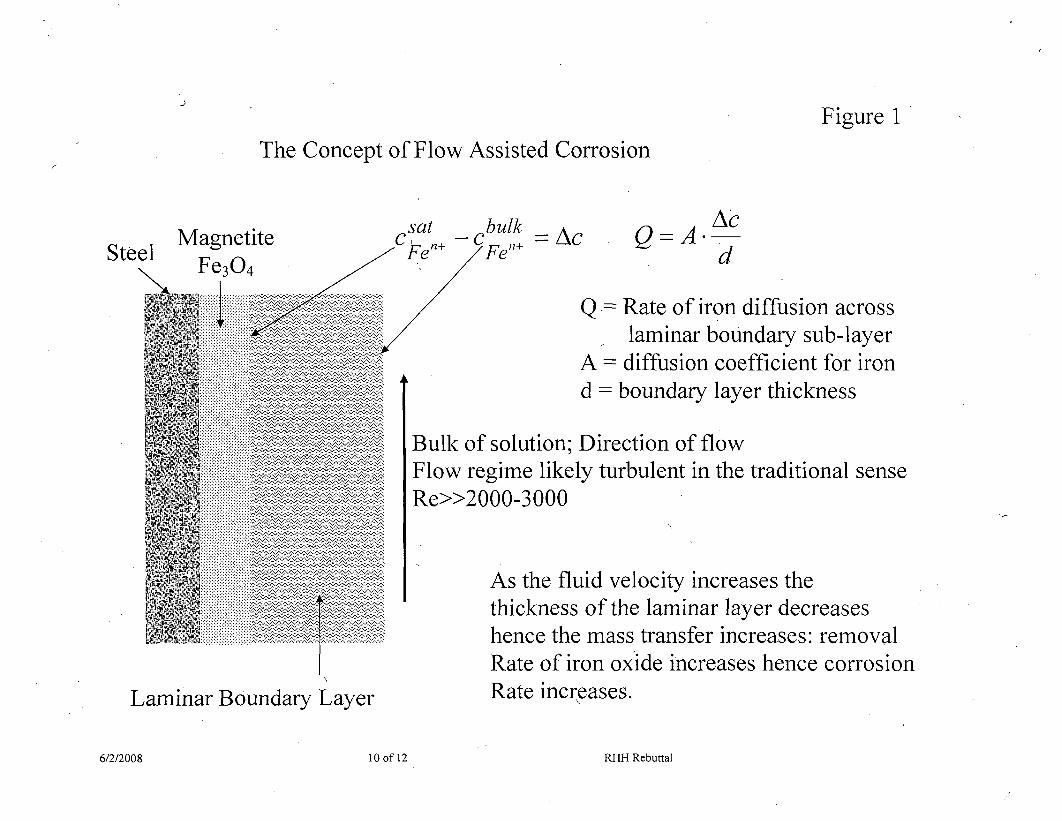
J
Figure 1The Concept of Flow Assisted Corrosion
Steel\11
MagnetiteFe 304
I
sat bulk7 Fen+ Fe n+
ACQ=A. d
d
Q Rate of iron diffusion acrosslaminar boundary sub-layer
A diffusion coefficient for irond = boundary layer thickness
k
Bulk of solution; Direction of flowFlow regime likely turbulent in the traditional senseRe>>2000-3000
As the fluid velocity increases thethickness of the laminar layer decreaseshence the mass transfer increases: removalRate of iron oxide increases hence corrosionRate increases.
rLaminar Boundary Layer
6/2/2008 10 of 12 RHH Rebuttal
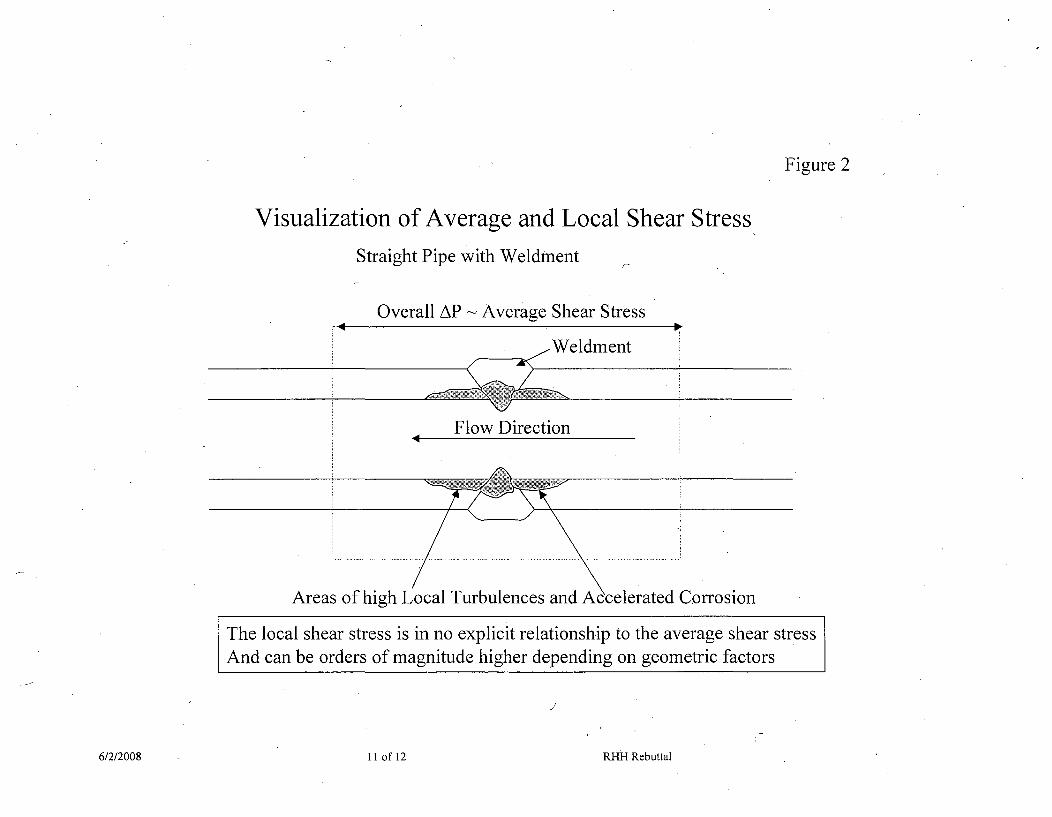
Figure 2
Visualization of Average and Local Shear StressStraight Pipe with Weldment
Overall AP -Average Shear Stress
Weidment
Flow Direction
Areas of high Local Turbulences and Accelerated Corrosion
The local shear stress is in no explicit relationship to the average shear stressAnd can be orders of magnitude higher depending on geometric factors
6/2/2008 I1I of 12 RHH Rebuttal
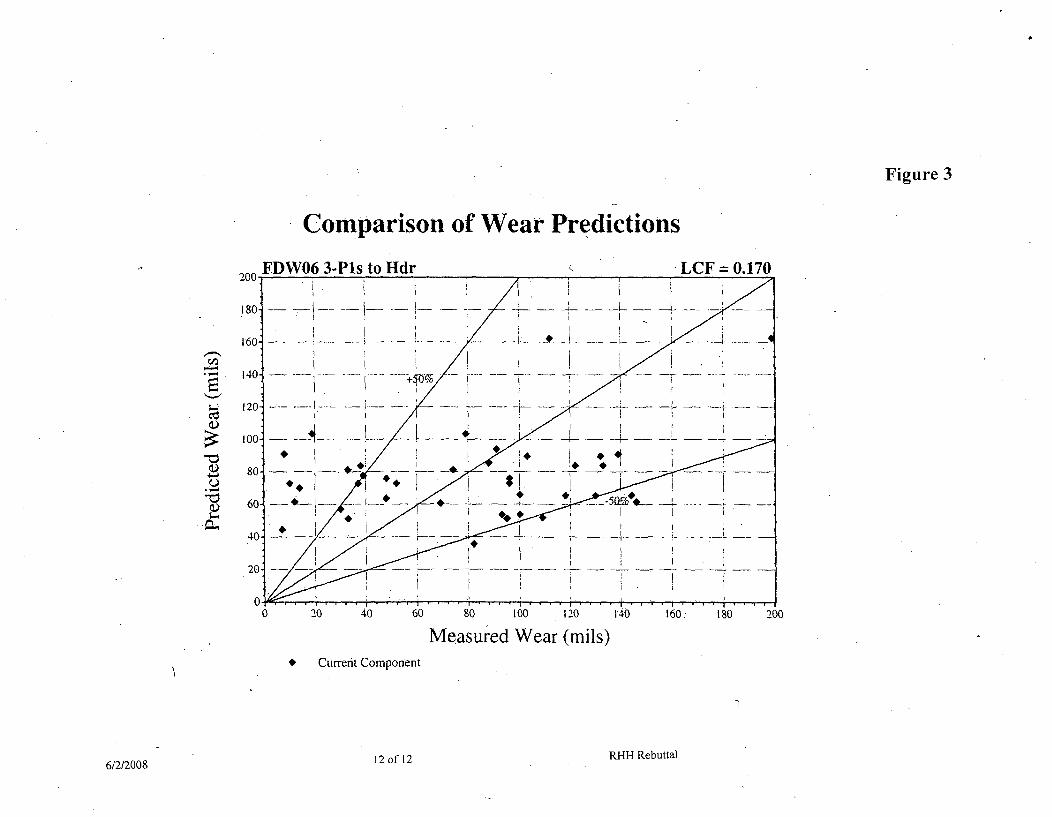
Figure 3
Comparison of Wear Predictions
0-e
80 100 120
Measured Wear (mils)* Current Component
12 of 12 RHH Rebuttal6/2/2008
UNITED STATES OF AMERICANUCLEAR REGULATORY COMMISSION
B/ t
Before the Atomic Safety and Licensing Board
In the Matter of
Entergy Nuclear Vermont Yankee, LLCand Entergy Nuclear Operations, Inc.
(Vermont Yankee Nuclear Power Station)
))))))
Docket No. 50-271 -LRASLBP No. 06-849-03-LR
CERTIFICATE OF SERVICE
I, Christina Nielsen, hereby certify that copies of NEW ENGLAND COALITION,INC.'S REBUTTAL STATEMENT OF POSITION, TESTIMONY AND EXHIBITS in theabove-captioned proceeding were served on the persons listed below, by U.S. Mail, first class, N
postage prepaid and, where indicated by an e-mail address below, by electronic mail, on June 2,2008.
Administrative JudgeAlex S. Karlin, Esq., ChairAtomic Safety and Licensing BoardMail Stop T-3 F23U.S. Nuclear Regulatory CommissionWashington, DC 20555-0001E-mail: [email protected]
Administrative JudgeWilliam H. Reed1819 Edgewood LaneCharlottesville, VA 22902E-mail: [email protected]
Office of Commission Appellate AdjudicationMail Stop: O-16C1U.S. Nuclear Regulatory CommissionWashington, DC 20555-0001E-mail: [email protected]
Administrative JudgeDr. Richard E. WardwellAtomic Safety and Licensing Board PanelMail Stop T-3 F23U.S. Nuclear Regulatory CommissionWashington, DC 20555-0001E-mail: [email protected]
Office of the SecretaryAttn: Rulemaking and Adjudications StaffMail Stop: O-16C1U.S. Nuclear Regulatory CommissionWashington, DC 20555-0001E-mail: [email protected]
Sarah .Hofmann, Esq.Director of Public AdvocacyDepartment of Public Service1 2 State Street, Drawer 20Montpelier, VT 05620-2601E-mail: [email protected]
Lloyd B. Subin, Esq.Mary C. Baty, Esq.Office of the General CounselMail Stop 0- 15 D21U.S. Nuclear Regulatory CommissionWashington, DC 20555-0001E-mail: [email protected]; [email protected]
Anthony Z. Roisman, Esq.National Legal Scholars Law Firm84 East Thetford RoadLyme, NH 03768E-mail: [email protected]
Marcia Carpentier, Esq.Lauren Bregman, Esq.Atomic. Safety and Licensing Board PanelMail Stop T-3 F23 ->U.S. Nuclear Regulatory CommissionWashington, DC 20555-0001E-mail [email protected]
David R. Lewis, Esq.Matias F,. Travieso-DiazPillsbury Winthrop Shaw Pittman LLPI"2300 N Street NWWashington, DC 20037-1128E-mail: [email protected]@pillsburvlaw.cofn
Diane CurranHarmon, Curran, Spielberg, & Eisenberg, L.L.P.1726 M Street N.W., Suite 600Washington, D.C. 20036dcurran('7iharmoncurran.com
Peter C. L. Roth, Esq.Office of the Attorney General33 Capitol StreetConcord, NH [email protected]
Jessica A. BieleckiU.S. Nuclear Regulatory CommissionOffice of the General CounselMail Stop: O-15-D21Washington, D.C. [email protected]
by:Christina Nielsen, Administrative AssistantSHEMS DUNKIEL KASSEL & SAUNDERS PLLC
SHEMS DUNKIEL KASSEL & SAUNDERS P L L C
RONALD A. SHEMS* GEOFFREY H. HAND
KAREN L. TYLER
BRIAN S. DUNKIEL** REBECCA E. BOUCHERJOHN ________ ASSOCIATE ATTORNEYS
JOHN B. KASSEL . EILEEN I. ELLIOTT
OF COUNSEL
MARK A. SAUNDERS
ANDREW N. RAUBVOGEL
June 2, 2008
Office of the SecretaryAttn:, Rulemaking and Adjudications StaffMail Stop O-16C1U.S. Nuclear Regulatory CommissionWashington, D.C. 20555-0001
Re: In the Matter of Entergy Nuclear Vermont yankee, LLC and EntergyNuclear Operations, Inc. (Vermont Yankee Nuclear Power Station),Docket No. 50-271 -LR, ASLBP No. 06-849-03-LRFilina Discussina A Proprietary Document
Dear Sir or Madam:
Please find enclosed for filing in the above-stated matter New England Coalition, Inc.'sRebuttal Statement of Position, Testimony and Exhibits. One document that Entergy has designatedproprietary is discussed in the rebuttal testimony of Dr. Joram Hopenfeld, Exhibit NEC-JH_63.
This document is: Letter to James Fitzpatrick from EPRI (February 28, 2000). It is a letter to anEntergy staff person at the Vermont Yankee (VY) plant, stating EPRI's evaluation of the VY FACprogram, and recommending certain changes to that program.
\
Pursuant to the Protective Order governing this proceeding, an unredacted version of this filingwill be served only on the Board, the NRC'S Office of the Secretary, Entergy's Counsel, and thefollowing persons who have signed the Protective Agreement: Sarah Hoffman and Anthony Roisman.A redacted version of this filling will be served on all other parties.
Thank you for your attention to' this matter.
Sincerely,
Karen Tyler,SHEMS DUNKIEL KASSEL & SAUNDERS PLLC
Cc' attached service list
9 1 COLLEGE STREET, BURLINGTON, VERMONT 05401
TEL 802 / 860 1 003 - FAX 802 / 860 1208 - www.sdkslaw .com
*Also admitted in the State o( Maine*Also admitted in the District of Columbia
UNITED STATESNUCLEAR REGULATORY COMMISSION
ATOMIC SAFETY AND LICENSING BOARD
Before Administrative Judges:
Alex S. Karlin, ChairmanDr. Richard E. Wardwell
Dr. William H. Reed
In the Matter of ))
ENTERGY NUCLEAR VERMONT YANKEE, LLC ) Docket No. 50-271-LRand ENTERGY NUCLEAR OPERATIONS, INC. ) ASLBP No. 06-849-03-LR
)(Vermont Yankee Nuclear Power Station) )
NEW ENGLAND COALITION, INC.REBUTTAL STATEMENT OF POSITION
In accordance with 10 C.F.R. § 2.1207(a)(2) and the Atomic Safety and Licensing
Board's ("Board") November 17, 2006 Order,' New England Coalition, Inc. ("NEC") hereby
submits its Rebuttal Statement of Position ("Statement") on NEC's Contentions 2A and 2B
(environmentally-assisted metal fatigue analysis), 3 (steam dryer), and 4 (flow-acceleratedN/
corrosion). In support of this Statement, NEC submits the attached rebuttal testimony of Dr.2 3
Joram Hopenfeld2 and Dr. Rudolf Hausler, and the Exhibits listed on the attached Rebuttal
Exhibit List.
I. NEC CONTENTIONS 2A AND 2B
Licensing Board Order (Initial Scheduling Order) (Nov. 17, 2006) at 10(D) (unpublished).
2 Exhibit NEC-JH_63.
3 Exhibit NEC-RH_04.
(Environmentally-Assisted Metal Fatigue Analysis)
The evidence contained in Entergy's and the NRC Staff s direct testimony and
exhibits fails to prove the validity of Entergy's CUFen Reanalyses. Indeed, NRC Staff
witness Dr. Chang has testified that the NRC Staff cannot determine the conservatism of
Entergy's analysi§, and must therefore rely on Entergy's proposed fatigue-monitoring
program to demonstrate its conservatism during the period of extended operation. See,
Chang Rebuttal Testimony at A 10. The Board should therefore d6cide Contentions 2A
and 2B in NEC's favor. The Board should find that Entergy has failed to satisfy,§
54.21(c)(1)(ii) by projecting its environmentally-assisted metal fatigue TLAA to the end
of the period of extended operation, and therefore must now rely, pursuant to §
54.21(c)(1)(iii), on an aging management program to provide reasonable assurance of
public health and safety. NEC should then be permitted to litigate its Contention 2, now
held in abeyance, which addresses the sufficiency of Entergy's aging management plan
for environmentally-assisted metal fatigue.
NEC's rebuttal evidence concerning Contentions 2A and 2B is contained in the
prefiled rebuttal testimony of Dr. Joram Hopenfeld, Exhibit NEC-JH_63 at 2-19 and
additional rebuttal Exhibits NEC-JH_64 - NEC-JH_67.
A. The NRC Staff Misconstrues. the Requirements of 10 CFR §54.21(c)(1).
The NRC Staff's ("the Staff") Initial Statement of Position misconstrues 10 CFR
§ 54.21 (c)(1). By the Staff's construction of this rule, Entergy could resolve any of
NEC's Contention 2A and 2B criticisms of the CUFen reanalyses through a commitment
to continued "refinement" of these analyses after the close of the ASLB proceeding. The
Staff s position is inconsistent with standard rules of statutory and regulatory
2
construction, as well as with this Board's treatment of NEC's Contention 2, 2A and 2B in
this proceeding to date. Most importantly, it would defeat the ability of any' license
renewal intervenor to litigate an applicant's Time Limited Aging Analysis ("TLAA")
methodology.
Section 54.21 (c)(l) allows a license renewal applicant three options to address an
aging-related health and safety issue that it has evaluated under its current license
through analysis that involves time-limited assumptions. It reads as follows:.
(c) An evaluation of time-limited aging analyses.
(1) A list of time-limited aging analyses, as defined in § 54.3, must be provided.
The applicant shall demonstrate that-( .
(i) The analyses remain valid for the period of extended operation;(ii) The analyses have been projected to the end, of the period of extendedoperation; or(iii) The effects of aging on the intended function(s) will be adequatelymanaged for the period of extended operation.
10 CFR' § 54.21(c). Under § 54.21(c)(1)(i), the applicant may demonstrate that the
analysis performed under its current license is valid for the period of extended operation.
ýIf the applicant is unable to satisfy § 54.21(c)(1)(i), it may project the analysis to the end
of the period of extended operation under § 54.21(c)(1)(ii). Finally, if the applicant is
unable to demonstrate reasonable assurance of public health and safety through a TLAA
analysis under § 54.2 1(c)(i) or § 54.21 (c)(ii), it must then develop an aging management
plan under § 54.21(c)(1)(iii).
Entergy's CUFen reanalyses'are properly subject to 10 CFR § 54.21(c)(1)(ii) -
Entergy has performed these reanalyses in an attempt to demonstrate that its CUFen
TLAA has been projected to the end of the period of extended operation. This was the
3
NRC Staff's view in August, 2007. Then, the Staff rejected Entergy's license renewal
commitment to complete its CUFen reanalyses prior to entering the period of extended
operation on grounds that "in order to meet the requirements of 10 CFR § 54.21 (c)(1), an
applicant for license renewal must demonstrate in the LRA that the evaluation of the
time-limited aging analyses (TLAA) has been completed." See, Exhibit NEC-JH_62 at
Enclosure 2.
Now, however, the NRC Staff takes the position that Entergy's CUFen
Reanalyses constitute a "corrective action" to "manage the effects of aging" that falls
under 10 CFR 54.21 (c)(1)(iii). The Staff has thus reversed its view of when Entergy
must complete its CUFen reanalyses. It is now the Staff's opinion that Entergy may
perform the CUFen Reanalysis as part of its aging management program after its license
renewal application is granted, possibly even during the period of extended operation.
The Staff explains:
If a licensee chooses to satisfy § 54.21 (c)(1)(i) or (ii), the 'demonstration'must be in the LRA, and a commitment to perform analyses projecting 60-
year CUFs prior to the period of extended operation is inconsistent withthe regulatory language. However, if the licensee chooses to satisfy §54.21(c)(1)(iii), the licensee must instead demonstrate that effects of agingwill be adequately managed and a commitment to perform refined CUFanalyses in the future as part of an aging management program isacceptable.
NRC Staff Initial Statement of Position at 11 -12 (emphasis 'in original).
The Staff's interpretation of § 54.21(c)(1) is inconsistent with its plain language,
and with standard rules of construction. Part 54.21(c)(1)(iii) is properly interpreted as a
requirement to manage aging in the event the TLAA cannot be projected to the end of the
license renewal period. In other words, an applicant may avoid the obligation to develop
an aging management plan under § 5'4.21(c)(1)(iii) if it satisfies § 54.21(c)(1)(i) or
4
(
54.21 (c)(1)(ii) by including a demonstration that the TLAA is either valid or can be
projected for the period of extended operation in the LRA. Under the NRC Staff's
construction, parts 54.21(c)(1)(i) and 54.21(c)(1)(ii) collapse into part 54.21(c)(1)(iii):
that is, the TLAA demonstration becomes a component of the aging management plan,
instead of a means to avoid the obligation to develop an aging management plan. The
Staff's construction is therefore invalid. Cf Dunn v. CFTC, 519 U.S. 465, 472, 473, 117
S.Ct. 913, 137 L.Ed.2d 93 (1997) (rejecting an interpretation of a statute that would have
left part of it "without any significant effect at all," because "legislative enactments
should not be construed to render their provisions mere surplusage.").
The Staff's interpretation is also inconsistent with the Board's interpretation of
NEC's Contentions 2, 2A and 2B in this proceeding to date, which treats Entergy's
CUFen reanalyses as distinct from its metal fatijue aging management plan, and as an
alternative to a management plan. The Board ruled that NEC's Contention 2 addresses
the sufficiency of the metal fatigue management program. It held Contention 2 in
abeyance, to be litigated only if NEC prevails on Contentions 2A and 2B, and Entergy
then reverts to reliance on fatigue management. The Board's Order of November 7, 2007
reads in relevant part as follows:
When this litigation began, Entergy's application showed certain CUFs tobe greater than unity, and Entergy indicated that it would manage suchmetal fatigue over the 20-year renewal period. NEC's original Contention2 challenged the adequacy of Entergy's demonstration of its metal fatiguemanagement program. Now Entergy says it has recalculated the CUFs toshow that they are all less than 1, thus eliminating the need to managemetal fatigue over the renewal period. NEC Contention 2A challengesEntergy's recalculation of the CUFs. If NEC Contention 2 is successfuland Entergy's revised CUF analyses are not shown to be sufficient, thenEntergy might return to relying on a fatigue management program as away of satisfying the Part 54 regulations.
5
Thus, we conclude that NEC Contention 2A will be litigated now,and NEC Contention 2 will be held in abeyance. The proviso is that theparties are not to litigate Contention 2 unless and until Entergy returns toreliance on a metal fatigue management program (as would likely happenif NEC prevails on NEC Contention 2A).
Memorandum and Order (Ruling on NEC Motions to File and Admit New Contention),.2
November 7, 2007 at 12.
Finally, the Staff s position that Entergy's environmentally-assisted metal fatigueN
TLAA analysis should be treated as a component of its metal fatigue aging management
.plan under § 54.21(c)(1)(iii) has significant consequences for the rights of NEC and other
license renewal intervenors to obtain information about and contest the validity of
TLAAs. Per the Staff's view, the applicant may comply with § 54.21 through a
commitment to perform the TLAA analysis after the application is granted, an approach
that will obviously frustrate public scrutiny of the TLAA methodology.
These consequences are already playing out in the ASLB proceeding concerning
Entergy's license renewal'application for the Indian Point plant, in which both the State
of New York and Riverkeeper, Inc. have petitioned for admission of a contention similar
to NEC's Contention 2. Entergy has taken the positions that it should not be required- to
provide a information about its CUFen analyses for the NUREG/CR-6260 locations
until after the close of the ASLB proceeding, and the Staff should accept a commitment
to perform CUFen analyses as part of the Fatigue Monitoring Program per 10 CFR §
54.21(c)(1)(iii). See, Exhibit NEC-JH-67 at Attachment 1, Enclosure 2, (see discussion
of D-RAI 4.3.1.8-1 and D-RAI 4.3.1.8-2). The.NRC Staff has apparently acquiesced int'
Entergy's effort to avoid public scrutiny of its CUFen methodology, and withdrew
requests for this information. Id.
6
The Board should reject the Staffs interpretation of 10 CFR § 54.21(c)(1). It should
find that Entergy's CUFen Reanalyses fall under § 54.21 (c)(1)(ii), and must be completed
as part of Entergy's License Renewal Application. The Board should further find that
Entergy cannot satisfy § 54.21 (c)(1) with a license renewal commitment to fix any
problems in its CUFen Reanalyses, demonstrate the conservatism of those analyses, or
finish those analyses after the close of the ASLB proceeding.
B. Enterpy's Evidence Does Not Include Information Necessary toValidate its CUFen Reanalyses; Entergy Therefore Fails to Satisfy itsBurden of Proof.
Dr. Hopenfeld testifies that Entergy has not provided to NEC or filed in the
evidentiary record before the Board the following information necessary to validate its
CUFen Reanalyses:
1. Drawings of the VY plant piping from which it would be possibleto validate Entergy's assumptions of uniform heat transfer distribution,including orientation angles, weld locations and internal diameters,Hopenfeld Rebuttal at A18, Exhibit NEC-JHr03 at 8;
2. A com'lete description of the methods or models used todetermine velocities and temperatures during transients, HopenfeldRebuttal at A19, Exhibit NEC-JH_03 at 9; and
3. Information regarding exactly how the number of plant transientcycles was determined for purposes of the 60-year CUF calculations, fromwhich it would be possible to evaluate the conservatism of the cycle count,Hopenfeld Rebuttal at A2 1.
Regarding the first two issues, Entergy represents that some information was
provided: 36 drawings, a copy of the Design Information Record, and some information
regarding the calculation of flow velocity in response to Counsel's inquiry. Entergy
Initial Statement of Position at 14. Dr. Hopenfeld testifies that the information Entergy
provided is insufficient. Hopenfeld Rebuttal at Al18 and Al19.
7

Entergy further faults NEC for failing to request any additional information it
considered necessary to a complete evaluation of the CUFen analyses in "discovery." Id.
This argument of course ignores the. fact that, to its tremendous disadvantage, NEC has
no right to formal discovery in this Subpart L proceeding. See, 10 CFR § 1.1203,
Hearing file; prohibition on discovery; In the Matter of Entergy Nuclear Vermont Yankee,
LLC, and Entergy Nuclear Operations, Inc. (Vermont Yankee Nuclear Power Station), 64
NRC 131, 202, ASLBP 06-849-03-LR, (September 22, 2006)("under the 'informal'
adjudicatory procedures of Subpart L, discovery is prohibited except for certain
mandatory disclosures.").
More importantly, Entergy's argument that NEC should have requested
information in fictitious "discovery" misses the point. Entergy has the burden of proof
regarding whether its CUFen reanalyses satisfy 10 CFR § 54.21 (c)(1)(ii), and provide
reasonable assurance of public health and safety. Entergy does not even attempt to
explain why its record evidence concernifig the VY pipe configuration and the methods
or models it used to determine velocities and temperatures during transients is sufficient
to validate its CUFen reanalyses. Entergy therefore fails to meet its burden.
With respect to the third issue above, the transient cycle count, Dr. Hopenfeld
testifies that the explanation stated in Entergy's direct testimony of its means of
determining the number of plant transients for purposes of its CUF calculations is
inconsistent with information Entergy provided in its LRA and in the reports of the
CUFen analyses produced to NEC. Hopenfeld Rebuttal at A2 1. Entergy's direct
testimony on this subject is vague, and does not indicate that an allowance was made for
the likely increase in plant transients resulting from the 20 percent power uprate or the
8
fact that the number of plant transients is likely to increase as a plant ages. Id. Dr.
Hopenfeld is unable to determine whether Entergy's transient cycle count is conservative.
Id.
The NRC Staff's Initial Statement of Position misrepresents the testimony of
NRC Staff witness Dr. Chang with respect to the transient cycle count. The Statement of
Position represents that the Staff "disagrees with NEC's assertion that Entergy's
assumptions about the number of transients in its analyses are not conservative," and
states that "[t]he Staff's position is that Entergy's assumptions are appropriate." NRC
Staff Initial Statement of Position at 18. In fact and to the contrary, Dr. Chang testifies/
that the staff, like Dr. Hopenfeld, "cannot determine the level of conservatism regarding
the number of transient cycles at this time," and therefore relies on Entergy's Fatigue
Monitoring Program to "ensure that the cycle projection is valid and that the fatilzue
analysis results are conservative." Chang Rebuttal at A1O (emphasis added).
Thus, per the testimony of NRC Staff witness Dr. Chang, Entergy has not
provided information to the NRC, or filed evidence before the Board, from which it is
possible to determine whether its CUFen analysis results ale conservative. Again,
Entergy has not satisfied its burden of proof, and the Board must decide Contentions 2A
and 2B in NEC's favor..
C. Calculation of the Fen Multiplier
1. The NRC Staff and Entergy are Incorrect that the ASME Code DoesNot Require the Fen Correction.
Both Entergy and the NRC Staff contend that the ASME Code does not require
any accounting for the effects of coolant environment on component fatigue life. This is
incorrect. The Code requires that the code user must account for conditions in which
9
the environment is more aggressive than air. Rebuttal Testimony of Joram Hopenfeld at
A5, citing, ASME Code, Appendix B at B-2131.
2. NRC Staff guidance that sanctions use of the equations and,,procedure described in NUREG/CR-6583 and NUREG/CR-5704 tocalculate Fen multipliers is not dispositive. The Staff must prove thevalidity of this guidance, but has not done so.
a
In response to Dr. Hopenfeld's argument that Entergy used outdated statistical
-equations published in NUREG/CR-6583 and NUREG/CR-5704 to calculate Fen values,
when it should have instead considered •data much more recently published in
NUREG/CR-6909 (February 2007), both the NRC Staff and.Entergy cite NRC guidance
stated in Section X.Ml of the GALL Report, NUREG-1801, Vol. 1, which sanctions use
of the NUREG/CR-6583 and NUREG/CR-5704 equations to calculate Fen multipliers.
Entergy and the Staff also note that Regulatory Guide 1.207 recommends reference to
NUREG/CR-6909 only for fatigue analyses in new reactors.
These guidance documents are by no means dispositive of NEC's criticisms of
Entergy's method of calculating Fen values. "Agency interpretations and policies are not
'carved in stone' but must rather be subject to re-evaluation of their wisdom on a
continuing basis." Kansas Gas and Electric Co. (Wolf Creek Generating Station, Unit 1),
49 NRC 441, 460 (1999), citing, Chevron USA, Inc. v. Natural Resources Defense
Council, Inc., 467 U.S. 837, 863-64 (1984)).
The GALL report and Regulatory Guide 1.207 do not contain legally binding
regulatory requirements. The Summary and Introduction to NUREG-l1801, Vol. 1
includes the following explanation of its legal status:
10
'Legally binding regulatory requirements are stated only in laws; NRCregulations; licenses, including technical specifications; or orders, not inNUREG series publications.
• * *
The GALL report is a technical basis document to the SRP-LR, whichprovides the Staff with Guidance in reviewing a license renewalapplication .... The Staff should also review information that is notaddressed in the GALL report or is otherwise different from that in theGALL report. ,
NUREG-1801, Vol. 1, Summary, Introduction, Application of the GALL Report
(emphasis added). Likewise, the face page to Regulatory Guide 1.207 states the
following: "Regulatory Guides are not substitutes for regulations, and compliance with
them is not required." Regulatory Guide 1.207; See also, In the Matter of International
Uranium (USA) Corporation, 51 NRC 9, 19 (2000) ("[NRC NUREGS,r Regulatory
Guides, and Guidance documents] are routine agency policy pronouncements that do not
carry the binding effect.of regulations....
NUREG-1 801, Vol. 1 and Regulatory Guide 1.207 do not preclude this Bdard
from considering the question at the heart of NEC's Contentions 2A and 2B: What is the
most appropriate method'of calculating the effects of the environment on fatigue?
[NUREGs] do not rise to the level of regulatory requirements. Neither dothey constitute the only means of meeting applicable regulatoryrequirements.... Generally speaking,.., such guidance is treatedsimply as evidence of legitimate means for complying with regulatoryrequirements, and the staff is required to demonstrate the validity of itsguidance if it is called into question during the course of litigation.
In the Matter of Carolina Power & Light Company and North Carolina Eastern
Municipal Power Agency (Shearon Harris Nuclear Power Plant), 23 NRC 294 (1986),
citing, Metropolitan Edison Co. (Three Mile Island Nuclear Station, Unit 1), 16 NRC
1290, 1298-99 (1982) (emphasis added); See also, In the Matter of Connecticut Yankee
11
Atomic Power Company (Haddam Neck Point), 54 NRC 177, 184 (2001), citing, Long
Island Lighting Co. (Shoreham Nuclear Power Station, Unit 1), 28 NRC 288, 290
(1988)("NUREGs and similar documents are akin to 'regulatory guides.' That is, they
provide guidance for the Staff's review, but set neither minimum nor maximum
regulatory requirements."); In the Matterof Private Fuel Storage, LLC, 57 NRC 69, 92
(2003)("[A]n intervenor, though not allowed to challenge duly promulgated Commission
regulations in the hearing process... is free to take issue with ... NRC Staff guidance
and thinking .....
The Staff is required in this proceeding to prove the current validity of its
guidance concerning the calculation of Fen multipliers, but has produced little if any
evidence of this. Entergy and the NRC Staff offer only one substantive reason 4 for use of\
the NUREG/CR-6583 and NUREG/CR-5704 equations over information contained in
NUREG/CR-6909: both contend that the NUREG/CR-6909 "procedure" is less
conservative and will generally produce lower Fen multipliers for operating reactors.
See, Fair Rebuttal at A5 and A6, Stevens Rebuttal at A50. Dr. Hopenfeld explains that
the overall NUREG/CR-6909 "procedure" could be considered less conservative because
NUREG/CR-6909 contains new air fatigue curves that are less conservative that the
current ASME Code fatigue curves. Hopenfeld Rebuttal at A6. He further testifies,
however, that he has never recommended use of these new air fatigue curves. Until the
current fatigue curves in the Code are officially modified, these curves must be
considered the "best representation of fatigue life in air." Id.
I -
4 The Staff also offers a nonsubstantive reason: i.e., that it would be inconvenient to change its guidancewhile a number of license renewal applications are pending or anticipated.
12
Dr. Hopenfeld explains that the alleged greater conservatism of the NUREG/CR-
6583 and NUREG/CR-5704 "procedure" is irrelevant to his main point about how
Entergy should have used information contained in NUREG/CR-6909 in its CUFen
analyses. Hopenfeld Rebuttal at A6, A7. As Dr. Hopenfeld has previously testified,
NUREG/CR-6909 describes many factors known to affect fatigue life that are not
accounted for in the ANL 1998 Equations contained in NUREG/CR-6583 and
NUREG/CR-5704. Dr. Hopenfeld's rebuttal testimony provides a summary of these
factors at A5, Table 1, and observes that Entergy's direct testimony addressesronly one of
them, surface finish. Hopenfeld Rebuttal at A5. This is the relevant information Entergy
should have taken from NUREG/CR-6909. Hopenfeld Rebuttal at A7. Entergy and
NRC staff witnesses fail to explain why this information contained in NUREG/CR-6909,
published after the GALL report, should be ignored in the license renewal process.
Dr. Hopenfeld testifies that, given the current state of the technology, it simply is
not possible to calculate Fen multipliers that are precision-adjusted to plant conditions, as
Entergy purports to have done. Hopenfeld Rebuttal at A7. Given the many uncertainties
in the calculation of Fen, he recommends use of bounding values contained in
NUREG/CR-6909 - 12 for austenitic stainless steel and 17 for carbon and low alloy steel.
Id.
3. NEC's Rebuttal Evidence Concerning Calculation of Fen Multipliers
NEC witness Dr. Joram Hopenfeld's rebuttal testimony addresses the following
additional technical issues regarding the calculation the Fen multipliers raised by Entergy
and the NRC Staff.
13
0 Dr. Hopenfeld disagrees with NRC witness Dr. Chang that Fen values of
12 for austenitic stainless 17 for carbon and low alloy steel represent a "worst case
scenario," or that application of these values is unreasonably conservative. Hopenfeld
Rebuttal at A9.
N ,Dr. Hopenfeld disagrees with Entergy witness Mr. Stevens that Fen= 17
applies only to high oxygen and temperature environments that do not exist at VYNPS.
Hopenfeld Rebuttal at A 10.
E Dr. Hopenfeld does not agree with Entergy and NRC Staff witnesses that
any lack of conservatism in Fen values calculated by the ANL 1998 Equations is
counterbalanced by excess conservatism in the ASME Code design fatigue curves. He
observes that there is no general agreement among researchers that the current Code is
conservative. Hopenfeld Rebuttal at A 12.
E Dr. Hopenfeld disagrees with Entergy witness Mr. Fitzpatrick that Entergy
properly accounted for surface roughness effects through use of ASME Code design
fatigue curves that include a "safety factor" to account for these effects. Hopenfeld
Rebuttal at A 13.
a Dr. Hopenfeld disagrees with Entergy witness Mr. Fitzpatrick that Entergy
has demonstrated its use of bounding values for oxygen as an input to the ANL equations
in all its CUFen analyses. Hopenfeld Rebuttal at A14. Mr. Fitzpatrick refers to steady
state values as determined by a computer Code called BWRVIA that Entergy has neither
described nor provided to NEC. Id. Mr. Fitzpatrick does not address the impact on Fen
of oxygen concentrations that occur during transients at higher levels than at steady state.
Id.
14
a Dr. Hopenfeld testifies that it was inappropriate for Entergy to exclude a
correction factor for cracking in the cladding and~base metal of the feedwater nozzles
based on results of its 2007 inspection of these nozzles for cracks in the base metal.f
Hopenfeld Rebuttal at Al15.
D. Calculation of 60-Year CUFs
NEC witness Dr. Joram Hopenfeld's rebuttal testimony addresses the following
issues, in addition to the above-discussed potential lack of conservatism in projecting
transient cycles, regarding the calculation the 60-year CUFs raised by Entergy and the
NRC Staff.
• Dr. Hopenfeld disagrees that Entergy's CUFen analyses properly applied a
heat transfer equation that applies only to a fully developed turbulent flow to the VYNPS
nozzles. Specifically, he disagrees with Entergy witness Mr. Stevens that flow in the
feedwater nozzle is fully developed because the upstream horizontal pipe is 48 inches/
long. Hopenfeld Rebuttal at A16. Dr. Hopenfeld further observes that Mr. Stevens did
not explain why, in transients where the flow stops and heat transfer occurs by natural
convection, a correction was not made for circumferential variation of the heat transfer
both during single phase flow and during condensation. Id.
0 Dr. Hopenfeld disagrees with Entergy witness Mr. Stevens that' it is
unnecessary to correct a heat transfer equation used in the CUFen Reanalyses by the ratio
of the viscosities evaluated at the bulk and wall temperatures during each transient
because there are minimal differences in temperature between the pipe wall and the bulk
of the fluid. Hopenfeld Rebuttal at A17. Mr. Stevens did not quantify actual temperature
15
differences, which could only be determined from data on wall and bulk fluid
temperature histories for sample transients. Id. Such information was not provided. Id.
0 Dr. Hopenfeld disagrees that Entergy's use of the simplified Green's
Function methodology in its Initial CUFen Reanalysis introduced only a small error.
Hopenfeld Rebuttal at A20. Entergy has neither explained nor investigated the physical
reasons for discrepancies between results obtained by the Green's Function methodology
and the more exact methodology, classic NB-3200 analysis. Id. Results obtained by the
Green's Function methodology therefore incorporate unquantified uncertainties. Id.
E. Error Analysis
NEC witness Dr. Joram Hopenfeld's rebuttal testimony addresses the following
issues regarding the need for error analysis raised by Entergy and the NRC Staff.
M Dr. Hopenfeld disagrees with Entergy's witness that it was not necessary
to perform an error analysis to validate its analytical techniques because the stress
analysis is based on bounding values. Hopenfeld rebuttal at A23.
M Dr. Hopenfeld disagrees with NRC witness Dr. Chang that an error
analysis was unnecessary because of conservatism built into the ASME Code and the
ANL 1998 Equations. Hopenfeld Rebuttal at A24.
III. NEC CONTENTION 3 (Steam Dryer)
NEC's rebuttal evidence concerning Contention 3 is contained in the prefiled
rebuttal testimony of Dr. Joram Hopenfeld, Exhibit NEC-JH_63 at 20-24, and additional
rebuttal Exhibits NEC-JH_68 and NEC-JH_69.
A. The Issue Before the Board is Whether a Steam Dryer AgingManagement Plan Uninformed by Knowledge of Stress Loads on the
16
Dryer for Comparison to Fatigue Limits is Adequate to ProvideReasonable Assurance of Public Safety.
The validityof the steam dryer stress load modeling Entergy conducted during
implementation of the VY power uprate as a basis for Entergy's steam dryer aging
management plan during the period of extended operations has not been litigated in this
proceeding or otherwise established. The Board has ruled that the assessment of this
modeling conducted during the EPU proceeding was not dispositive for purposes of life
extension:
Entergy's apparent assertion that the history of the steam dryer issue in the'separate EPU proceeding should resolve the issue in this proceeding is...without foundation. As demonstrated by Entergy's own pleadings, steamdryer issues were addressed in the EPU proceeding primarily in regard tothe power ascension toward EPU levels and the first few operating cyclesthereafter.
In the Matter of Entergy Nuclear Vermont Yankee, LLC, and Entergy Nuclear
Operations,. Inc. (Vermont Yankee Nuclear Power Station), 64 NRC 131, 189
(September 22, 2006).
Moreover, Entergy represented in its Motion for Summary Disposition of NEC's
Contention 3 that its steamfi dryer aging management program will consist exclusively of
periodic visual inspection and monitoring of plant parameters as described in General
Electric Service Information Letter 644 (GE-SIL-644), will not involve the use of any
analytical tool to estimate stress loads on the steam dryer, and will not rely on the finite
element modeling conducted prior to implementation of the extended power uprate
(EPU) in 2006 for knowledge of steam dryer stress. loads.
In partially granting Entergy's Motion for Summary Disposition, the Board
accepted Entergy's representation that its steam dryer aging management plan would not
17
rely on the pre-EPU steam dryer modeling. Memorandum and Order (Ruling on Motion
for Summary Disposition of NEC Contention 3), September 11, 2007 at 10 ("Entergy's
expert confirms that this program does, not require the use of the CFD and ACM
computer codes or the finite element modeling conducted during the EPU."). In doing
so, the Board rejected NEC's argument that it should be permitted to litigate the validity
of the EPU steam dryer modeling as the basis for aging management. NEC's pleading in
opposition to Entergy's Motion for Summary Disposition stated the following regarding
this issue:
As stated in the attached Third Declaration of Dr. Joram Hopenfeld,Entergy's claim that its steam dryer aging management program will notinvolve any means of estimating and predicting stress loads on the dryersimply is not credible. Exhibit 1, Third Declaration of Dr. Joram,Hopenfeld ("Hopenfeld Declaration 3") ¶ 6. A valid steam dryer agingmanagement program must include some means of estimating andpredicting stress loads on the steam dryer, and determining that peak loadswill fall below ASME fatigue limits. Hopenfeld Declaration ¶ 5.
Entergy represents that it did conduct this analysis as part of the VermontYankee EPU power ascension testing using the ACM and CFD models.Hoffman Declaration ¶¶ 11-13. Entergy now proposes sole reliance onvisual inspection and plant parameter monitoring during the renewedlicense period. Such reliance must be based on Entergy's previousACM/CFD-based predictions that stress loads on the dryer will not causefatigue failures. Hopenfeld Declaration ¶ 7. NEC's concerns regardingthe validity of the ACM and CFD models and the stress and fatigueanalysis Entergy conducted using these models therefore remain currentand relevant.
New England Coalition, Inc.'s Opposition to Entergy's Motion for, Summary Disposition
of NEC's Contention 3' (Steam Dryer) (May 9, 2007) at 4.
Both Entergy and the NRC Staff now contend that Entergy's steam dryer aging
management program does in fact rely on the steam dryer modeling conducted during EPU
implementation for knowledge of dryer stress loads. See, Entergy Initial Statement of
18
Position at 32 ("[T]he loadings on the dryer derive from plant geometries ... that have not
changed since the uprate was implemented, so there has been no change to the loadings on
the dryer and the resulting stresses. ' Therefore, there is no reason to provide continued
instrumentation to measure loadings or further analytical efforts."); NRC Staff Initial
Statement of Position at 19 (The Staff's position is that stress analysis as a means of
estimating and predicting stress loads during operations "is not necessary because the results
of the EPU power ascension program demonstrated that the pressure loads during the EPU
operations do not result in stress on the steam dryer that exceed ASME-fatigue stress
limits.").
In light of the above-discussed procedural history, and Entergy's prior
representations, the Board must disregard these current contentions that the modeling of the
dryer during the EPU power ascension program is a proper basis for aging management.
This issue has not been determined, and the Board took it off the table in its decision of
Entergy's Motion for Summary Disposition. The issue now properly before the Board is
whether an aging management plan that consists solely of plant parameter monitoring,'and
partial visual inspection, uninformed by knowledge of dryer loading, can provide reasonable
assurance of public safety.
B. Hopenfeld Rebuttal
Dr. Joram Hopenfeld provides the following rebuttal testimony regarding the
above-stated issue properly before the Board.
0 . Dr. Hopenfeld testifies that the ability to estimate the probability of
formation of loose parts requires knowledge of the cyclic loads on the dryer to ensure that
19
the dryer is not subjected to cyclic stress that would exceed the endurance limit.
Hopenfeld Rebuttal at A28.
0 Dr. Hopenfeld observes that Mr. Hoffman and Mr. Lukens do not provide
a single quantitative assessment in support of this position, discussed in A56-62 of their
testimony, that the inspection programs atVY ensure that the dryer will not fail. Id.
0 Dr. Hopenfeld disagrees with Entergy witness Mr. Lukens that "operating
experience after the EPU (exemplified by the data collected during the 2007 inspection
and the subsequent year of monitoring of plant operating parameters) demonstrates that
the stresses experienced by the dryer are insufficient to initiate and propagate fatigue
cracks." Hopenfeld Rebuttal at A29. r
E Dr. Hopenfeld provides a section of the Entergy Condition Report
previously filed as Exhibit NEC-JH_59 that includes General Electric's statement that
"continued [steam dryer crack] growth by fatigue cannot be ruled out." This section of
the Condition Report was previously inadvertently excluded due to a clerical error.
Hopenfeld Rebuttal at A29. Dr. Hopenfeld also disagrees with Entergy witness Mr.
Lukens that the~inspection photographs provided in Entergy's Condition Report, Exhibit
NEC-JH59 at 2'8, show that the cracks are inactive. Metallographic examinations would
be required to demonstrate this, not remote camera photos: Hopenfeld Rebuttal at A3 1.
0 Dr. Hopenfeld observes that IGSCC cracks that now exist in the VY steam
dryer can provide sites for corrosion attack which would in turn accelerate crack growth
under cycling loading. The rate of crack propagation would depend on load intensities
and duration. Id.
20
* Dr. Hopenfeld disagrees with Entergy witness Mr. Hoffman that design
basis loads ("DBA") cannot cause dryer failure. Hopenfeld Rebuttal at A32.
a Dr. Hopenfeld disagrees with Entergy witness Mr. Hoffman that it is not
necessary to estimate and predict dryer stresses because "[c]onfirmation that stresses on
the VY steam dryer remain within fatigue limits is provided daily by the fact that the
dryer has been able to withstand without damage the increased loads imparted on it
during power ascension and for the two years of operation since EPU was implemented."
Hopenfeld Rebuttal at A33. Vibration fatigue is a time-related phenomenon; the fact that
the dryer has not failed to date is not at all an indication that it will not fail in the future.
Id.
0 Dr. Hopenfeld testifies that Entergy has not provided a quantitativejI
estimate of the probability of crack detection, but should have done so, since the entire
dryer is not accessible to visual inspection. Hopenfeld Rebuttal at A35.
IV. NEC CONTENTION 4(Flow-Accelerated Corrosion)
NEC's rebuttal evidence concerning Contention 4 is contained in the prefiled•
rebuttal testimony of Dr. Joram Hopenfeld, Exhibit NEC-JH_63 at 24-41; additional
rebuttal Exhibits NEC-JH_70- NEC-JH_72; the prefiled rebuttal testimony of Dr. Rudolf
Hausler, Exhibit NEC-RH_04; and Dr. Hausler's report titled "Flow Assisted Corrosion
(FAC) and Flow Induced Localized Corrosion: Comparison and Discussion," Exhibit
NEC-RH_05.
Entergy witness Dr. Horowitz has testified that it is not necessary to recalibrate or
"benchmark" the CHECWORKS model with plant inspection data following a twenty
21
percent power uprate. Joint Declaration of Jeffrey S. Horowitz and James C. Fitzpatrick
on NEC Contention 4- Flow-Accelerated Corrosion at A33, 34. Rather, Dr. Horowitz
contends that the only update to the CHECWORKS model that is necessary following a
twenty percent power uprate is the input of new values for flow rate and temperature into
the model. Horowitz at A33, 34. Dr. Horowitz bases these assertions on his view that
"[flow-accelerated corrosion (FAC)] wear rates vary roughly with velocity and do not
increase with velocity in [a] non-linear (exponential) manner. . . .", Horowitz at A49, and
his beliefs that FAC is not fundamentally a local phenomena, and the CHECWORKS
model can accurately predict any variations in FAC rates related to geometric features.
Dr. Horowitz contends that the CHECWORKS model accounts for any localized
variations in FAC associated with geometric features through the use of '"geometric
factors' to relate the maximum degradation occurring in a component, such as an elbow,
to the degradation predicted to occur in a straight pipe." Horowitz at A47, A48.
Dr. Hopenfeld and Dr. Hausler disagree with Dr. Horowitz that recalibration of
the CHECWORKS model is unnecessary following substantial changes in flow velocity
and'changes in temperature, and respond regarding Dr. Horowitz's grounds for this
opinion as follows.
M Dr. Hausler testifies that the linear relationship between FAC rates and
fluid velocity transitions to an exponential one as the local turbulence becomes such that
erosional features become manifest. Whether such transition actually occurs when flow
velocity increases following a power uprate must be determined experimentally. Hausler
Rebuttal at A5, Exhibit NEC-RH 05.
22
* Dr. Hopenfeld stresses that "FAC is fundamentally a local phenomenon
due to variations of local turbulence in curved pipe, nozzles, tees, orifices, etc," and that
corrosion rates can be expected to "vary with location depending on the intensity of the
local turbulence." Hopenfeld Rebuttal at A42, A52, A53, A54 Healso disagrees with
Dr. Horowitz that the rate of FAC corresponds weakly with the velocity, and varies less
than linearly with time, and disputes the relevance of the data Dr. Horowitz cites in
support of his position. Hopenfeld Rebuttal at A41, A46, A53, A55.
0 Dr. Hausler does not agree that the CHECWORKS model, or any model,
can fully account for variations in the rate of FAC due to geometric features and
discontinuities. Hausler Rebuttal at A6; Exhibit NEC-RH_05. Some things cannot be
specified. For example, the internal residual weld bead from the root pass 'may be 1/8
inch high in one case, and ¼ inch high in another case. Id. The upstream and
downstream turbulence surrounding the weld bead will be more severe in the latter case,
and a power uprate may disproportionately affect the flow over the larger bead. Id.
0 Dr. Hopenfeld observes that, while Dr. Horowitz denies the need to
recalibrate CHECWORKS, he recognizes the need to increase the FAC inspection scope
by 50% to account for the power uprate. Hopenfeld Rebuttal at A48. Entergy does not
disclose what fraction of the total FAC susceptible area in the VY plant the proposed
increased monitoring would represent, and its significance is therefore entirely unclear.
Id.
Both Dr. Hopenfeld and Dr. Hausler take issue with Dr. Horowitz's definition of
FAG as corrosion in proportion to the flow rate, Horowitz at A46, and observe that this
definition excludes the more severe forms of localized corrosion - erosion-corrosion,
23
impingement and cavitation. Hausler Rebuttal at A6; Exhibit NEC-RH_05; Hopenfeld
Rebuttal at A45. Both Hopenfeld and Hausler observe that this definition of FAC is
entirely arbitrary. Erosion-corrosion, impingement and cavitation are extensions of FAC
as the local flow intensity due to turbulence increases. The transition from one to the
others is continuous and difficult to identify. Id. If CHECWORKS is unable to predict
these more severe forms of localized corrosion related to high flow rates, which can
particularly occur after a power uprate, then this is a serious shortcoming of the model
and its application. Id.
Dr. Hausler and Dr. Hopenfeld also address the following additional issues:
0 Dr. Hausler observes that the accuracy of CHECWORKS has been said to
be within +/- 50%, but this statement is based on an erroneous interpretation of the
graphic representation of predicted vs. measured wear. Hausler Rebuttal at A6; Exhibit
NEC-RH 05. Actually, the accuracy is within a factor of 2 - the measured wear rates
range from twice the prediction to half the prediction. Id! A factor of two difference
between measured and predicted 'corrosion [or corrosion rate] can be quite significant
with respect toselecting a particular item (line) for inspection during a refueling outage.
Id.
0 Dr. Hopenfeld disagrees with Dr. Horowitz's evaluation of industry FAC
experience, and his contention that this experience demonstrates the e}fficacy of
CHECWORKS. Hopenfeld Rebuttal at A39, A40, A49, A52, A53. Dr. Hopenfeld
specifically disagrees that, in assessing industry FAC experience, a distinction should be
drawn between pipe failures due to leaks and failures due to ruptures. Hopenfeld
Rebuttal at A44, A53.
24

* Dr. Hopenfeld faults Entergy for its failure to specify the total FAC-
susceptible area that is inspected during a typical outage. Hopenfeld Rebuttal at A43.
0 Dr. Hopenfeld disputes Dr. Horowitz's suggestion that the oxygen
concentration at VY did not change in 2003. Hopenfeld Rebuttal at A5 1.
V. CONCLUSIONS
Extended operation of VYNPS as Entergy hasproposed in its LRA will
jeopardize public health and safety. The LRA should be denied unless the important
issues addressed by NEC's Contentions 2A, 2B, 3 and 4 are resolved.
June 2, 2008 New England Coalition, Inc.
by:Andrew Raubvoge(Karen TylerSHEMS DUNKIEL KASSEL ý& SAUNDERS PLLCFor the firm
Attorneys for NEC
25