mixed foods are similarly categorized by 8-13 year old children
TRANSCRIPT

MIXED FOODS ARE SIMILARLY CATEGORIZED BY 8 – 13 YEAROLD CHILDREN
Alicia Beltran1, Karina Knight Sepulveda2, Kathy Watson3, Tom Baranowski4, JaniceBaranowski5, Noemi Islam6, and Mariam Missaghian7
1 Baylor College of Medicine, 1100 Bates Street, Room 2025H, Houston, Texas 77030-2600, U.S.A.,[email protected]
2 Baylor College of Medicine, 1100 Bates Street, Room 2025H, Houston, Texas 77030-2600, U.S.A.,[email protected]
3 Baylor College of Medicine, 1100 Bates Street, Room 2025H, Houston, Texas 77030-2600, U.S.A.,[email protected]
4 [Tom Baranowski, PhD] Professor of Pediatrics, Children’s Nutrition Research Center, Department ofPediatrics, Baylor College of Medicine, 1100 Bates Street, Room 2038, Houston, Texas 77030-2600, U.S.A.,[email protected] Not for Publication: Phone (713) 798-6762; Fax (713) 798-7098
5 Baylor College of Medicine, 1100 Bates Street, Room 2038, Houston, Texas 77030-2600, U.S.A.,[email protected]
6 Baylor College of Medicine, 1100 Bates Street, Room 2025H, Houston, Texas 77030-2600, U.S.A.,[email protected]
7 Baylor College of Medicine, 1100 Bates Street, Room 2025H, Houston, Texas 77030-2600, U.S.A.,[email protected]
AbstractFood search in a computerized 24 hour recall (24hdr) for children should be easiest when thecategories reflect children’s categorization of foods, in contrast to professional categories. This studyassessed how 8–13 year old children categorized and labeled mixed foods (e.g. fried rice, lasagna),and how these were influenced by child characteristics. A set of 48 cards with pictures and namesof mixed foods from 14 professionally defined food groups was sorted by each child into piles ofsimilar foods. Participants (n= 146), including 8 to13 year old 130 English speaking, and 16 Spanishspeaking children, attended data collection in the summer, 2006. One way ANOVA, pairwisecomparisons and Robinson matrices for identification of clusters were used. Children created anaverage of 10.5 (± 5.5) piles with 6.0 (±4.1) cards per pile. No substantial differences in Robinsonclustering were detected across subcategories for each of the demographic characteristics, body massindex, or 6-n-propylthiouracil sensitivity. For the majority of the piles, children provided“Taxonomic-Professional” (26.0%) labels, such as Vegetables, Sandwiches and Drinks, or “Specific-food item” (23.0%) labels, i.e. the name of the food. These categories may be used to facilitate mixedfood search in a computerized 24hdr for children in this age group.
Publisher's Disclaimer: This is a PDF file of an unedited manuscript that has been accepted for publication. As a service to our customerswe are providing this early version of the manuscript. The manuscript will undergo copyediting, typesetting, and review of the resultingproof before it is published in its final citable form. Please note that during the production process errors may be discovered which couldaffect the content, and all legal disclaimers that apply to the journal pertain.
NIH Public AccessAuthor ManuscriptAppetite. Author manuscript; available in PMC 2009 March 1.
Published in final edited form as:Appetite. 2008 ; 50(2-3): 316–324.
NIH
-PA Author Manuscript
NIH
-PA Author Manuscript
NIH
-PA Author Manuscript

KeywordsMixed foods; Food categorization; Children; Card sort; twenty four hour dietary recall; dietassessment
IntroductionPediatric nutrition research benefits from accurate diet assessment tools, which are brief, easilyadministered, inexpensive, accurate, and suitable for broad populations (Rockett, Berkey &Colditz, 2003). A 24 hour dietary recall (24hdr) is designed to record actual intake over aspecific time period, obtaining specific foods, beverages, seasonings, cooking procedures,amounts, locations, and times of food consumed (Frank, 1991). Many consider the 24hdr tobe the preferred method of diet assessment (McPherson, Hoelscher, Alexander, Scanlon &Serdula, 2000), but conducting a 24hdr, can be cost-prohibitive for large studies. To minimizethese costs, a prototype computerized 24hdr (called the Food Intake Recording SoftwareSystem or FIRSSt) for children was developed, but primarly assessed fruit and vegetable intake(Baranowski et al., 2002). A limitation of FIRSSt was how children could best find and reportmixed foods, e.g. lasagna, peanut butter & jelly sandwich, pizza, which include several foodingredients and often reflect ethnic cuisines.
The age at which children reach a level of cognitive maturity sufficient to accurately reportdietary intake is not clear (Michela & Contento, 1984). Some studies have obtained reasonable24 hdr from 8 year old girls (Cullen et al., 2004), while food frequencies have elicited datasimilar to that from adults only with children 13 years and older (Field et al., 1999). Girls maybe more reliable than boys (Prochaska, Sallis & Rupp, 2001); differences might be associatedwith ethnic groups (Reynolds et al., 1999); and underreporting has been associated with obesity(Briefel, Sempos, McDowell, Chien & Alaimo, 1997).
Knowing how children categorize and label mixed foods should identify how to group andname the food categories in a computerized 24hdr that facilitates their rapid and accuratesearch. Since the ability to taste propylthiouracil (PROP taster status) has been related to foodpreferences, food consumption and obesity (Keller & Tepper, 2004), it would be important toknow if the ability to perceive the bitter taste of some foods, especially vegetables, influencesthe way children categorize foods.
This exploratory study assessed how 8 to 13 year olds categorized and labeled mixed foods,and how these categories and labels were influenced by gender, age, BMI, ethnicity,socioeconomic status, PROP taster status, food preference and frequency of consumption ofthe food items.
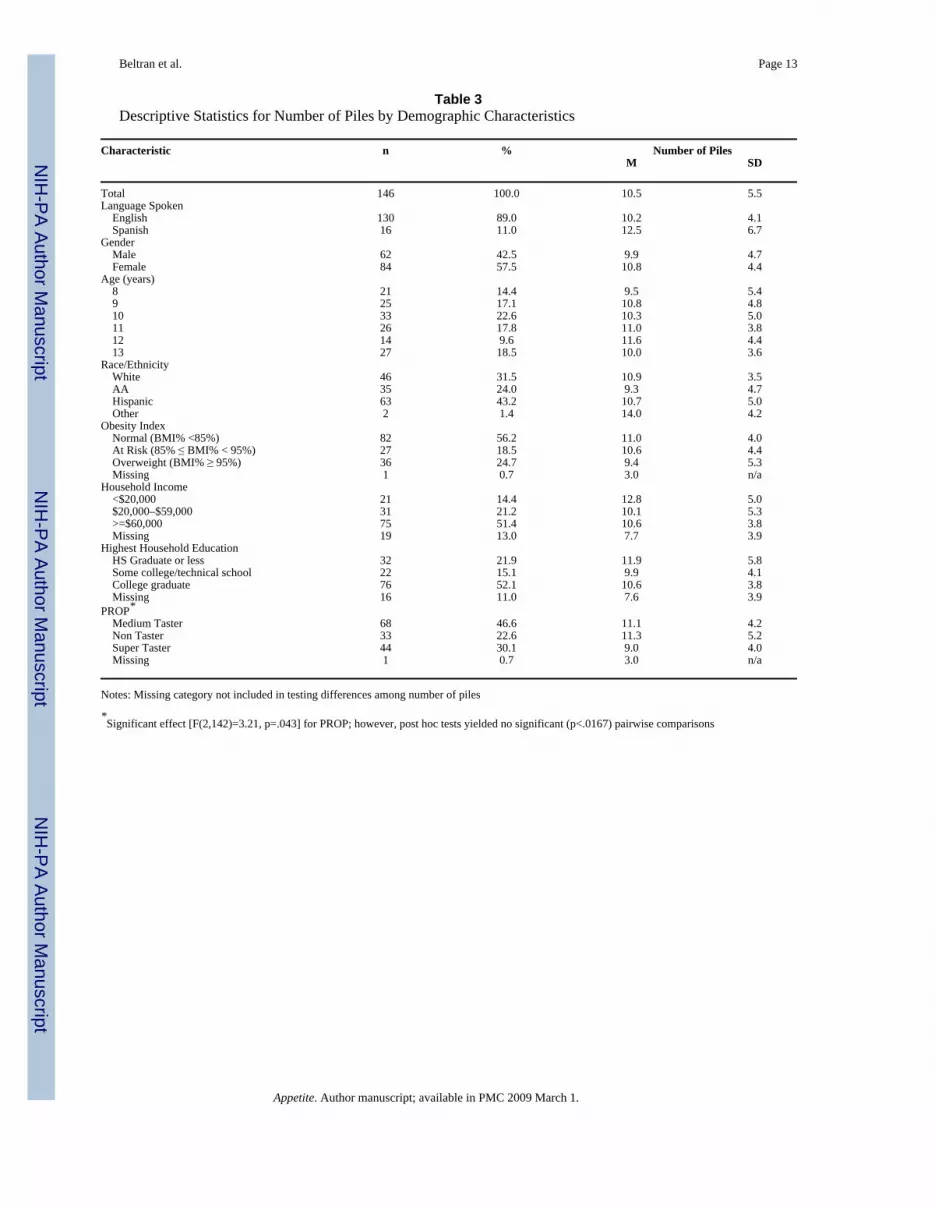
MethodsThis research was approved by the Baylor Institutional Review Board. The sample consistedof 146 8 to 13 year old children, recruited via telephone from the Children’s Nutrition ResearchCenter volunteer participant database, during the summer of 2006. Attempts were made torecruit a sample of 150 children with comparable numbers in each ethnic (White, Hispanic,and African-American) and age category. A special attempt was made to recruit a cohort ofprimarily Spanish speaking children in anticipation of a Spanish language version of FIRSSt.The study recruited a total of 152 children of whom 6 were excluded because of missing data.Of the remaining 146 children (see Table 3), 89% were predominantly English speaking; 57.5%were female; 43.2% Hispanic; 56% had normal BMI; 51.4% had above > $60,000/year familyincome; 52.1% had a college graduate or higher education in the home; 46.6% were PROP
Beltran et al. Page 2
Appetite. Author manuscript; available in PMC 2009 March 1.
NIH
-PA Author Manuscript
NIH
-PA Author Manuscript
NIH
-PA Author Manuscript

medium tasters; and were approximately similarly distributed across the ages of 8 to 13 yearsold. Written informed consent was previously mailed or brought in person when attending theresearch center.
Children were asked to do five different card sorts taking about 30 min. each. Card sort 1contained diverse single food items, card sort 2 was composed of mixed food items which wereanalyzed for this manuscript, card sort 3 included only fruits, card sort 4 had vegetables and,card sort 5 was composed of diverse grains and cereals. Children were scheduled to do the cardsort activities for two days, unless they had an early morning appointment and had time tofinish all the activities in one day. Participant’s demographic data (age, gender, ethnicity,parents’ highest educational attainment and family income) were obtained by parent report.On the first day, BMI was estimated by measuring height and weight. Height was measuredaccording to a standardized protocol using a stadiometer (PE-AIM-101 from PerspectiveEnterprises). Weight was measured using an electric scale (SECA Alpha 882 from SECACorporation) according to standardized protocol. CDC percentiles were obtained by calculatingbody mass index (BMI) as weight (kg)/height (m2) and referring to values on their website(Kuczmarski et al., 2000).
Sensitivity to PROP (6-n-propylthiouracil), a natural chemical substance found in brassicavegetables (e.g. broccoli, Brussels sprouts) giving them a bitter taste, was measured using theimpregnated tissue paper procedure (Zhao, Kirkmeyer & Tepper, 2003). Two paper disks weregiven to each child. The first one, which was labeled with an odd number, contained NaCl (1.0mol/l), and a second disk, labeled with an even number, contained PROP (0.280 ± 0.002 mg,with a coefficient of variation across disks of ± 2.2%). Each child was asked to rinse theirmouth with bottled water, place the paper disk on the tip of their tongue and count thirtyseconds. After the thirty seconds, they drew a line on a log scale, which ranged from 0 – 100,with labels as “barely taste it”, “weak”, “strong”, “very strong”, or “strongest imaginable”,demarcating the intensity of taste (Zhao, Kirkmeyer & Tepper, 2003). This cross line was latermeasured with a ruler and data recorded by project staff to classify the children as “non-tasters”,“medium tasters”, or “super tasters” following standardized protocol (Zhao, Kirkmeyer &Tepper, 2003). Both paper disks were administered in the same manner. All research staff weretrained on the protocols in all tasks.
Card SortingEach child conducted five unconstrained card sorts; and the sequence of card sort tasks wasrandomly assigned to minimize possible sequence and fatigue effects. The food items wereselected from 14 professionally identified food categories (see Table 1) that were intended tobe used with adults (Subar et al., in press). Items within categories (mostly mixed dishes) wereselected based upon those most commonly consumed by 8 to 13 year old children from differentethnic groups and reflected the consensus among a group of dietitians and behavioralresearchers.
Card sort 2, analyzed in this manuscript, was composed of a set of 48 4 ¼″ × 5 ½″ cards, eachcontaining a photograph and name of the selected food item. A small set of single food itemsthat were components or otherwise related to some of the mixed dishes were introduced toassess their clustering with the mixed foods. The child was asked to sort the cards into piles ofsimilar foods. Children were permitted to make as many or as few piles as they wanted. If therewas a food they didn’t know, a “Don’t Know” pile was allowed; and if they weren’t sure whereto place a food, a “Not Sure” pile was suggested. At the end of sorting, the research staff wentthrough the “don’t know” and “not sure” food items and asked the child to try to place the cardsin one of the existing piles. At the completion of sorting the child was asked to name each pileand then explain why he/she had selected that particular name. In response to pilot testing,participants were instructed not to separate foods as “healthy” or “unhealthy”, nor like or don’t
Beltran et al. Page 3
Appetite. Author manuscript; available in PMC 2009 March 1.
NIH
-PA Author Manuscript
NIH
-PA Author Manuscript
NIH
-PA Author Manuscript

like. The research staff recorded the name on a sticky note and attached it to the top of eachpile.
Between each card sort, the child completed a food preference questionnaire administered ona PDA which included the 48 foods depicted on the cards. The food preference responsecategories were: Never had it, Don’t like it, Like it a little, and Like it a lot (Domel et al.,1993). Additionally, they used the PDA to answer a food frequency questionnaire on how oftenthey consumed each of the 48 food items during the previous week (Cullen, Baranowski T.,Baranowski J., Hebert & Moore, 1999). The frequency of consumption response categorieswere: Never eaten this, Didn’t eat it in last 7 days, Ate it 1–2 times, Ate it 3–5 times, Ate it 6–7 times, Ate it more than 7 times (Cullen et al., 1999). Each child received monetarycompensation, a nutrition education brochure on healthier diet and physical activity practices,and had questions answered about healthier diet and physical activity practices at the end oftheir participation. Each food card contained a distinct bar code on the back. At the end of eachmorning’s data collection, the name given by the child (as recorded on the sticky note labelsby the research staff) for each pile was first typed into a computer data base, and food itemsincluded in the pile were scanned with a bar code reader (to minimize data entry errors).
Data Processing and AnalysesDescriptive statistics (means, standard deviations, frequencies, percentages) were used todepict the samples by their anthropometric and demographic characteristics. Children wereseparated by age into 8–10 year old and 11–13 year old categories. Participants were dividedinto normal (BMI <85th percentile) or at risk/overweight (BMI-for-age ≥ 85th percentile) basedon CDC growth charts (CDC BMI charts). Differences in the mean number of card sort pileswere tested across demographic and other variable categories using one way ANOVA andTukey’s pairwise comparisons.
The card sort naming process had two types of data coding: (1) adjustment of the first levelnames for consistency of names across children (second level codes); and (2) categorizationof the second level codes into type of category (third level codes). To introduce consistencyacross the children, while maintaining the basic integrity of the name given by the child,modification was made of the first level pile names. For example, pile names such as “thingswith meat”, “meat group”, “predominantly meat”, were uniformly labeled “meat” (second levelname); “breakfast”, “breakfast group”, “morning foods”, “breakfast meal”, “things you can eatin the morning” were uniformly labeled “breakfast”. In circumstances where a child generatedcategory had two names (e.g., “beans and rice”), the first name, “beans”, was always selected.In some cases (e.g., “foods you can grow”) collapsing across child generated categories wasnot possible. Two dietitians coded each child pile name, and decisions on disagreements werebased on group consensus (among all the authors). Previous studies have categorized foodgroups using categories reflecting cognitive organizing characteristics (Ross & Murphy,1999). Eleven third level categories were used for categorization of the second level food groupnames (see Table 2). These third level categories were further grouped into a sequence likelyreflecting cognitive development, ranging from simpler ego oriented categories (evaluative-preferences: like/don’t like), to categories requiring and imposing a cognitive frameworkreflecting knowledge of nutrition (see Table 2). Cross tabulation was used to assesscorrespondence of the third level categories with the original professional categories. Thesample was divided into sub groups based on demographic subcategories and a chi-squarestatistic was used to test differences in distributions by the third level categories.
Proximity matrices were created using a study-specific FORTRAN program to understand therelationships among items in the piles created by the children. The proximity matrix for the 48food items was a symmetric 48 × 48 matrix of co-occurrence inputs. For example, the valueof 124 in column (C) 1, row (R) 2 indicated that 124 of 146 total children put green beans (C1)
Beltran et al. Page 4
Appetite. Author manuscript; available in PMC 2009 March 1.
NIH
-PA Author Manuscript
NIH
-PA Author Manuscript
NIH
-PA Author Manuscript

and corn (R2) in the same pile. In contrast, the value of 1 in C1 and R13 indicated only one of146 children put green beans (C1) and spaghetti & meat sauce (R13) in the same pile, suggestingthat nearly all children perceived green beans and spaghetti & meat sauce as not similar. Tounderstand differences in the relationship of items and piles, proximity matrices stratified bydemographic characteristics were also created.
Robinson matrices (see Figure 1) provide a clustering procedure with general restrictions(Hubert, Arabie & Meulman, 2006). A similarity matrix is said to be in Robinson form, if thevalues decrease as they move away from the diagonal; a matrix is in anti-Robinson form if thevalues in a dissimilarity matrix increase as they move away from the diagonal (Hubert &Arabie, 1994). Particularly, the Robinson (similarity) matrix was converted to a dissimilarity(anti-Robinson) matrix by subtracting the number of paired food items from the total numberof children and then analyzed using Matlab7.0 m-files for anti-Robinson matrices (Hubert,Arabie & Meulman, 2006). The output matrix was converted back to a similarity file andsubsequently standardized. Cut points (Ross & Murphy, 1999; Hubert & Arabie, 1994) wereused to define the levels that were from most similar to the least similar: (a) the most similarfood items (values ≥3), square icon in figure 1; (b) high to moderately similar food items (2 ≤values < 3), circle icon; (c) moderately similar (1 ≥ values < 2), triangle icon; and (d) leastsimilar foods (values <1), blank cells. A more complete discussion of (anti) Robinson matricesmay be found elsewhere (Ross & Murphy, 1999; Hubert & Arabie, 1994). The most commonname that the children used to name the corresponding food piles were used for naming theclusters resulting from the Robinson matrix analyses. Mean preference and frequency ofconsumption for each food item were computed and sequenced in order of priority, andpreference and consumption were calculated within clusters and compared using ANOVAacross clusters.
ResultsCard sorting
Children created an average of 10.5 (± 5.5) piles with 6.0 (± 4.1) cards per pile. A main effectfor PROP taster status (Table 3) was significant, but pairwise comparisons showed nosignificant differences. No other significant differences were detected. The correlation fornumber of piles or categories used in this card sort 2 with the number of categories in card sort1 (foods from 18 professionally identified food categories) was 0.5 (Beltran et al.,submitted).
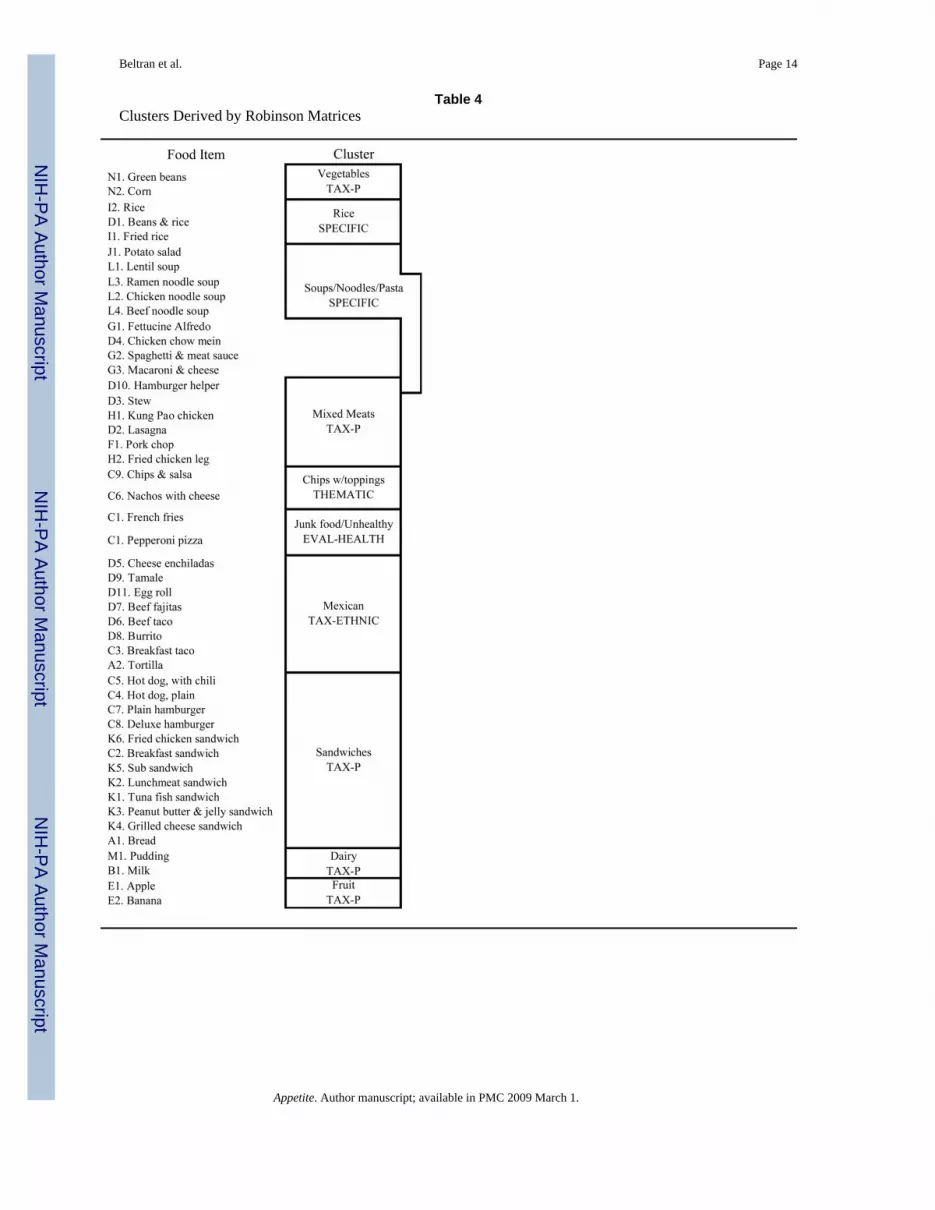
Robinson matrixThe Robinson matrix analysis for all children (Table 4) accounted for 92.9% of variance, andso no additional analyses of the residual matrices were performed. Nine clusters weresuccessively labeled vegetables, rice, soups/noodles/pasta, mixed meats, chips w/toppings,junk food/unhealthy, Mexican, sandwiches, dairy and fruit. No substantial differences inRobinson clustering were detected across subcategories for each of the demographiccharacteristics.
Preferences and consumptionThere were no obvious patterns in the sequence of food items by preference or frequency ofconsumption, and the range of preference and consumption values were narrow (data notshown).
Significant differences in the mean preferences of the food items within clusters were foundacross the Robison derived clusters (Table 6). “Chips w/toppings/thematic” was the mostpreferred, followed by “Junk food/unhealthy/evaluative”, “Dairy/taxonomic-professional”,
Beltran et al. Page 5
Appetite. Author manuscript; available in PMC 2009 March 1.
NIH
-PA Author Manuscript
NIH
-PA Author Manuscript
NIH
-PA Author Manuscript
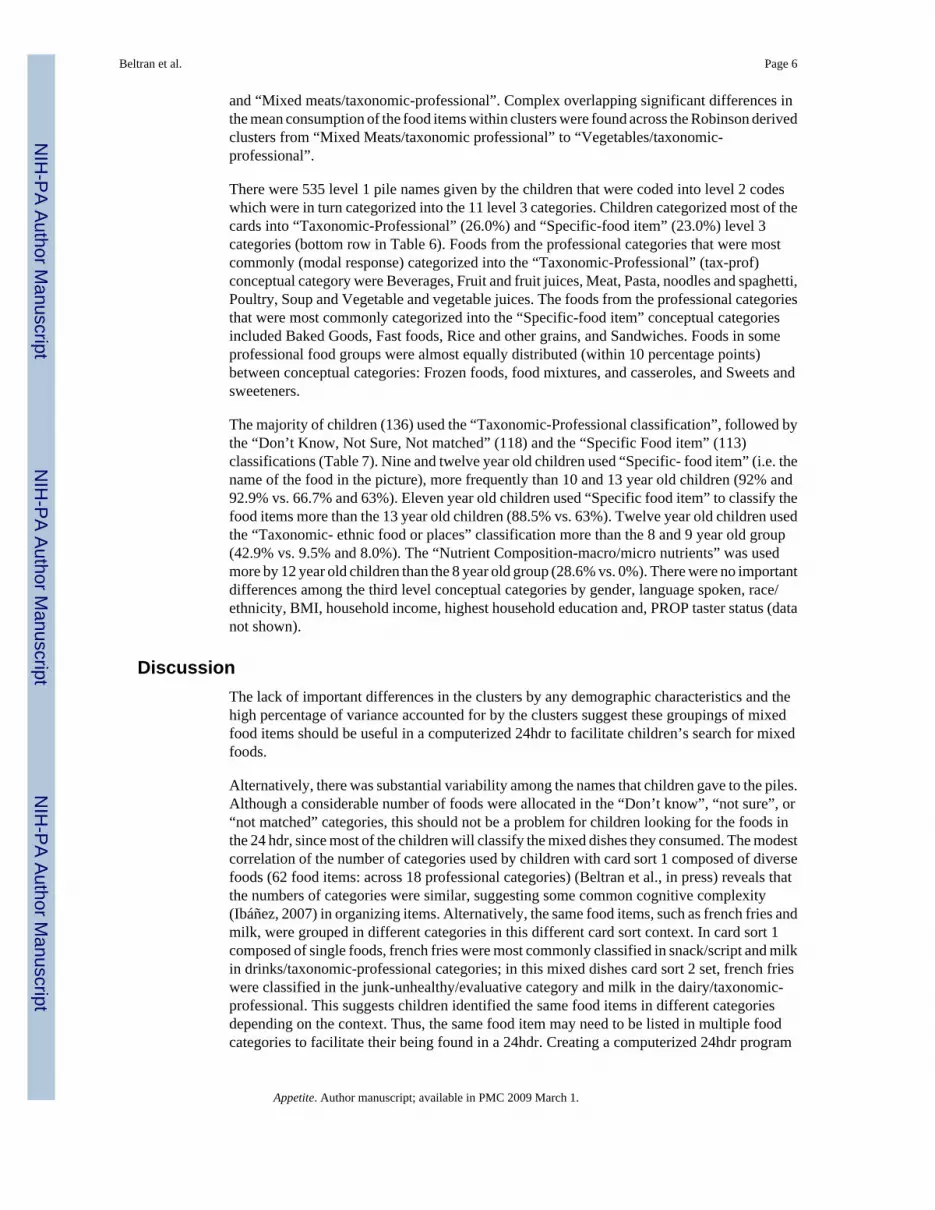
and “Mixed meats/taxonomic-professional”. Complex overlapping significant differences inthe mean consumption of the food items within clusters were found across the Robinson derivedclusters from “Mixed Meats/taxonomic professional” to “Vegetables/taxonomic-professional”.
There were 535 level 1 pile names given by the children that were coded into level 2 codeswhich were in turn categorized into the 11 level 3 categories. Children categorized most of thecards into “Taxonomic-Professional” (26.0%) and “Specific-food item” (23.0%) level 3categories (bottom row in Table 6). Foods from the professional categories that were mostcommonly (modal response) categorized into the “Taxonomic-Professional” (tax-prof)conceptual category were Beverages, Fruit and fruit juices, Meat, Pasta, noodles and spaghetti,Poultry, Soup and Vegetable and vegetable juices. The foods from the professional categoriesthat were most commonly categorized into the “Specific-food item” conceptual categoriesincluded Baked Goods, Fast foods, Rice and other grains, and Sandwiches. Foods in someprofessional food groups were almost equally distributed (within 10 percentage points)between conceptual categories: Frozen foods, food mixtures, and casseroles, and Sweets andsweeteners.
The majority of children (136) used the “Taxonomic-Professional classification”, followed bythe “Don’t Know, Not Sure, Not matched” (118) and the “Specific Food item” (113)classifications (Table 7). Nine and twelve year old children used “Specific- food item” (i.e. thename of the food in the picture), more frequently than 10 and 13 year old children (92% and92.9% vs. 66.7% and 63%). Eleven year old children used “Specific food item” to classify thefood items more than the 13 year old children (88.5% vs. 63%). Twelve year old children usedthe “Taxonomic- ethnic food or places” classification more than the 8 and 9 year old group(42.9% vs. 9.5% and 8.0%). The “Nutrient Composition-macro/micro nutrients” was usedmore by 12 year old children than the 8 year old group (28.6% vs. 0%). There were no importantdifferences among the third level conceptual categories by gender, language spoken, race/ethnicity, BMI, household income, highest household education and, PROP taster status (datanot shown).
DiscussionThe lack of important differences in the clusters by any demographic characteristics and thehigh percentage of variance accounted for by the clusters suggest these groupings of mixedfood items should be useful in a computerized 24hdr to facilitate children’s search for mixedfoods.
Alternatively, there was substantial variability among the names that children gave to the piles.Although a considerable number of foods were allocated in the “Don’t know”, “not sure”, or“not matched” categories, this should not be a problem for children looking for the foods inthe 24 hdr, since most of the children will classify the mixed dishes they consumed. The modestcorrelation of the number of categories used by children with card sort 1 composed of diversefoods (62 food items: across 18 professional categories) (Beltran et al., in press) reveals thatthe numbers of categories were similar, suggesting some common cognitive complexity(Ibáñez, 2007) in organizing items. Alternatively, the same food items, such as french fries andmilk, were grouped in different categories in this different card sort context. In card sort 1composed of single foods, french fries were most commonly classified in snack/script and milkin drinks/taxonomic-professional categories; in this mixed dishes card sort 2 set, french frieswere classified in the junk-unhealthy/evaluative category and milk in the dairy/taxonomic-professional. This suggests children identified the same food items in different categoriesdepending on the context. Thus, the same food item may need to be listed in multiple foodcategories to facilitate their being found in a 24hdr. Creating a computerized 24hdr program
Beltran et al. Page 6
Appetite. Author manuscript; available in PMC 2009 March 1.
NIH
-PA Author Manuscript
NIH
-PA Author Manuscript
NIH
-PA Author Manuscript

using child generated classifications should facilitate the gathering of this type of informationfor researchers and dietitians diminishing the limitations of these types of instrument likeinterviewer bias, memory bias, etc. In previous research (Nguyen & Murphy, 2003; Beltran etal., in press) children tended to group most foods into Taxonomic-Professional, Script-schemeor Specific- food categories, indicating that children used some knowledge of food groups,shared cultural knowledge, or simply named the name in the picture. In this study, however,children most commonly used taxonomic or specific food names, suggesting there is no culturalconsensus at what meals mixed foods are eaten.
Children did not classify these mixed food items in the same way as nutrition experts. Thechildren’s cluster names that corresponded to professionally defined categories were thevegetables/taxonomic-professional cluster and the fruit/taxonomic-professional categories.With the rice/specific-food item cluster, children identified the principal ingredient instead ofthe mixed dish. Child categories tended to combine professional categories, e.g. twoprofessional categories were included in the rice cluster: frozen foods, food mixtures andcasseroles, and rice and other grains; children’s soups-noodle-pasta/food specific category,merged two professional categories: pasta, noodles, spaghetti, and soups. Children createdsome distinctive categories that did not resemble the professional categories, such as theMexican food cluster. In other research (Michela & Contento, 1984) 5–11 year old childrengrouped a different set of food items and the cluster names were not similar to those found inthis research. More research is needed in the analysis of these types of data.
The lack of an age related linear trend in the third level categories suggests that age relatedknowledge or cognitive ability did not systematically affect the category labeling. Thesefindings are different from similar research, but with different food items, where categorylabeling from children from 5–11 years old was related to cognitive ability (Michela &Contento, 1984). Many of the children used the more complex cognitive classifications suchas Taxonomic-Professional category, using the principal ingredient of the mixed dish; howeverothers needed the simpler cognitive classification using the name of the dish (food specific).Greater consistency in use of the higher cognitive classification schemes might be attainedwith more nutrition education in the schools. This, however, remains to be investigated.
Nutrition education programs often provide dietary guidance based on professionalcategorization of foods (Marcoe, et.al, 2006). While substantial market research wasconducted, the messages might be better understood if the food categories were based on howtheir target audience categorized foods rather than upon the nutrient content of the foods.
In summary, Children from 8 to 13 years old categorized foods in consistent ways, mostly into“Taxonomic-Professional” and “Specific food item” categories. These categories should betested for use in a computerized 24hdr for children in this age group to assess if they facilitatemore accurate and prompt identification of the foods children remembered consuming.
A limitation of this exploratory study was the limited sample size for some of the subgroups,especially the ethnic/language groups. The sample was limited to 8–13 year old children; it isnot clear how this categorization of foods would differ among younger or older children.
Acknowledgements
This research was primarily funded by a grant from the National Institute of Diabetes & Digestive & Kidney Diseases(5 U44 DK66724-01). This work is also a publication of the United States Department of Agriculture (USDA/ARS)Children’s Nutrition Research Center, Department of Pediatrics, Baylor College of Medicine, Houston, Texas, andhas been funded in part with federal funds from the USDA/ARS under Cooperative Agreement No. 58-6250-6001.The contents of this publication do not necessarily reflect the views or policies of the USDA, nor does mention oftrade names, commercial products, or organizations imply endorsement from the U.S. government.
Beltran et al. Page 7
Appetite. Author manuscript; available in PMC 2009 March 1.
NIH
-PA Author Manuscript
NIH
-PA Author Manuscript
NIH
-PA Author Manuscript

ReferencesBaranowski T, Islam N, Baranowski J, Cullen K, Myres D, Marsh T, et al. The food intake recording
software system is valid among fourth-grade children. Journal of American Dietetic Association2002;102(3):380–385.
Beltran A, Knight Sepulveda K, Watson K, Baranowski T, Baranowski J, Islam N, et al. Diverse foodsare similarly categorized by 8 – 13 year old children. Journal of Nutrition Education and Behavior.(submitted)
Briefel RR, Sempos CT, McDowell MA, Chien S, Alaimo K. Dietary methods research in the ThirdNational Health and Nutrition Examination Survey: underreporting of energy intake. American Journalof Clinical Nutrition 1997;65 (4):1203–1209.
Centers for Disease Control and Prevention. BMI- Body Mass Index: About BMI for Children and Teens.The CDC page. Retrieved December 6, 2006, from:http://www.cdc.gov/nccdphp/dnpa/bmi/childrens_BMI/about_childrens_BMI.htm
Cullen KW, Baranowski T, Baranowski J, Hebert D, Moor C. Pilot Study of the Validity and reliabilityof brief fruit, juice and vegetable screeners among inner city African-American boys and 17–20 yearold adults. Journal of the American College of Nutrition 1999;18 (5):442–450. [PubMed: 10511326]
Cullen KW, Watson K, Himes JH, Baranowski T, Rochon J, Waclawiw M, et al. Evaluation of qualitycontrol procedures for 24-h dietary recalls: results from the Girls health Enrichment Multisite Studies.Preventive Medicine 2004;38 (1):14–23.
Domel SB, Baranowski T, Davis H, Leonard SB, Riley P, Baranowski J. Measuring fruit and vegetablepreferences among 4th and 5th grade students. Preventive Medicine 1993;22 (6):866–879. [PubMed:8115344]
Field AE, Peterson KE, Gortmaker SL, Cheung L, Rockett H, Fox MK, et al. Reproducibility and validityof a food frequency questionnaire among fourth to seventh grade inner-city school children:implications of age and day-today variation in dietary intake. Public Health Nutrition 1999;2 (3):293–300. [PubMed: 10512564]
Frank GC. Taking a bite out of eating behavior: food records and food recalls of children. Journal ofSchool Health 1991;61198(5)(3)
Hubert L, Arabie P. The analysis of proximity matrices through sums of matrices having (anti-) Robinsonforms. British Journal of Mathematical and Statistical Psychology 1994;47:1–40.
Hubert, L.; Arabie, P.; Meulman, J. The structural representation of proximity matrices with MATLAB.Philadelphia, PE and Alexandria, VA: ASA-SIAM Series on statistics and applied probability; 2006.
Ibáñez A. Complexitiy and cognition: a meta/theoretical analysis of the mind and brain as a topologicaldynamical system. Nonlinear Dynamics, Psychology, and Life Sciences 2007;11 (1):51–90.
Keller KL, Tepper BJ. Inherited Taste Sensitivity to 6-n-Propylthiouracil in Diet and Body Weight inChildren. Obesity Research 2004;12 (6):904–912. [PubMed: 15229328]
Kuczmarski RJ, Ogden CL, Guo SS, Grummer-Strawn LM, Flegal KM, Mei Z, et al. 2000 CDC growthcharts for the United States: Methods and development. National Center for Health Statistics. Vitalhealth Stat 11 2000;246:1 –190. [PubMed: 12043359]
Marcoe K, Wen Yen J, Sedigheh Y, Carlson A, Britten P. Development of food group composites andnutrient profiles for the MyPyramid food guidance system. Journal of Nutrition Education andBehavior 2006;38:S93–S107. [PubMed: 17116599]
McPherson RS, Hoelscher DM, Alexander M, Scanlon KS, Serdula MK. Dietary assessment methodsamong school-aged children: validity and reliability. Preventive Medicine 2000;31:S11–S33.
Michela J, Contento I. Spontaneous classification of foods by elementary school-aged children. HealthEducation Quarterly 1984;11(1):57–76. [PubMed: 6511432]
Ngyuyen S, Murphy G. An apple is more than just a fruit: cross-classification in children’s concepts.Child Development 2003;74 (6):1783–1806. [PubMed: 14669896]
Prochaska JJ, Sallis JF, Rupp J. Screening Measure for Assessing Dietary Fat Intake among Adolescents.Preventive Medicine 2001;33 (6):699–706. [PubMed: 11716669]
Reynolds KD, Baranowski T, Bishop DB, Farris RP, Hyg Binkley D, et al. Patterns in Child andAdolescent Consumption of Fruit and Vegetables: Effects of Gender and Ethnicity across Four Sites.Journal of the American College of Nutrition 1999;18(3):248–254. [PubMed: 10376781]
Beltran et al. Page 8
Appetite. Author manuscript; available in PMC 2009 March 1.
NIH
-PA Author Manuscript
NIH
-PA Author Manuscript
NIH
-PA Author Manuscript

Rockett HR, Berkey CS, Colditz GA. Evaluation of dietary assessment instruments in adolescents.Current Opinion Clinical Nutrition and Metabolic Care 2003;6 (5):557–562.
Ross B, Murphy G. Food for thought: cross-classification and category: cross-classification and categoryorganization in a complex real-world domain. Cognitive Psychology 1999;38:495–553. [PubMed:10334879]
Subar AF, Thompson FE, Potischman N, Forsyth BH, Buday R, Richards D, et al. Formative Researchof a Quick List for an Automated Self-Administered 24-Hour Dietary Recall. Journal of AmericanDietetic Association 2007;107(6):1002–1007.
Zhao L, Kirkmeyer SV, Tepper BJ. A paper screening test to assess genetic taste sensitivity to 6-n-propylthiouracil. Physiology and Behavior 2003;78(4–5):625–633. [PubMed: 12782217]
Beltran et al. Page 9
Appetite. Author manuscript; available in PMC 2009 March 1.
NIH
-PA Author Manuscript
NIH
-PA Author Manuscript
NIH
-PA Author Manuscript

NIH
-PA Author Manuscript
NIH
-PA Author Manuscript
NIH
-PA Author Manuscript
Beltran et al. Page 10
Table 1Professional Categories and Food Items
A. Baked Goods
A1 BreadA2 Tortilla
B. Beverages
B1 Milk
C. Fast Foods
C1 Pepperoni pizzaC2 Breakfast sandwichC3 Breakfast tacoC4 Hot dog, plainC5 Hot dog, with chiliC6 Nachos with cheeseC7 Plain hamburgerC8 Deluxe hamburgerC9 Chips & salsaC10 French fries
D. Frozen foods, food mixtures and casseroles
D1 Beans & riceD2 StewD3 Chicken chow meinD4 Cheese enchiladasD5 Beef tacoD6 Beef fajitasD7 BurritoD8 TamaleD9 Hamburger helperD10 Egg roll
E. Fruit and Fruit Juice
E1 AppleE2 Banana
F. Meat
F1 Pork ChopF2 Catsup/ketchup
G. Pasta, noodles and spaghetti
G1 LasagnaG2 Fettucine AlfredoG3 Spaghetti and meat sauceG4 Macaroni & cheese
H. Poultry
H1 Kung Pao chickenH2 Fried chicken leg/drumstick
I. Rice and other grains
I1 Fried riceI2 Rice
J. Salads
J1 Potato salad
K. Sandwiches
J1 Tuna fish sandwichJ2 Lunchmeat sandwichJ3 Peanut butter & jelly sanJ4 Grilled cheese sandwichJ5 Sub sandwichJ6 Fried chicken sandwich
L. Soups
Appetite. Author manuscript; available in PMC 2009 March 1.

NIH
-PA Author Manuscript
NIH
-PA Author Manuscript
NIH
-PA Author Manuscript
Beltran et al. Page 11
L1 Lentil soupL2 Chicken noodle soupL3 Ramen noodle soupL4 Beef noodle soup
M. Sweets and sweeteners
M1 Pudding
N. Vegetables and vegetable juice
N1 Green beansN2 Corn
Appetite. Author manuscript; available in PMC 2009 March 1.

NIH
-PA Author Manuscript
NIH
-PA Author Manuscript
NIH
-PA Author Manuscript
Beltran et al. Page 12
Table 2Types of food categories varying from simples to most complex
Conceptual Match Categories ExampleA. Characteristics of me 1. Evaluative–Preferences Like/don’t likeB. Concrete characterization of the food 2) Specific Category Name of the picture
3) Food characteristics Colors, texture, taste, shape (flat, round, etc)C. Requires some knowledge of a commonculture.
4) Script Scheme for a routine event: lunch, snack, birthday, dinner,etc.
5) Food preparation Baked, cooked, frozen, packaged6) Thematic Groups of objects that are associated or have a
complementary relationship: (e.g. cereal with milk; or anyingredient that is part of the food item or is associated withit (e.g. peanut butter and jelly).
7) Taxonomic–Ethnic/Places Ethnic food and places (e.g. Mexican, Chinese, restaurant,cafeteria, home foods, etc.)
D. A purpose for the food 8) Goal Foods have a function: extras, add onsE. Requires some knowledge or perception ofthe health effects of foods
9) Evaluative-Health Perception Good/bad, healthy/unhealthy/junk food
F. Requires knowledge of professionalgroupings
10) Taxonomic-Professional Based on common properties or similarities among thecategories (e.g. beverages, grains, dairy foods, plantrelated, farm group, etc.)
11) Nutrient Composition Macro and micro nutrients
Appetite. Author manuscript; available in PMC 2009 March 1.
NIH
-PA Author Manuscript
NIH
-PA Author Manuscript
NIH
-PA Author Manuscript
Beltran et al. Page 13
Table 3Descriptive Statistics for Number of Piles by Demographic Characteristics
Characteristic n % Number of PilesM SD
Total 146 100.0 10.5 5.5Language Spoken English 130 89.0 10.2 4.1 Spanish 16 11.0 12.5 6.7Gender Male 62 42.5 9.9 4.7 Female 84 57.5 10.8 4.4Age (years) 8 21 14.4 9.5 5.4 9 25 17.1 10.8 4.8 10 33 22.6 10.3 5.0 11 26 17.8 11.0 3.8 12 14 9.6 11.6 4.4 13 27 18.5 10.0 3.6Race/Ethnicity White 46 31.5 10.9 3.5 AA 35 24.0 9.3 4.7 Hispanic 63 43.2 10.7 5.0 Other 2 1.4 14.0 4.2Obesity Index Normal (BMI% <85%) 82 56.2 11.0 4.0 At Risk (85% ≤ BMI% < 95%) 27 18.5 10.6 4.4 Overweight (BMI% ≥ 95%) 36 24.7 9.4 5.3 Missing 1 0.7 3.0 n/aHousehold Income <$20,000 21 14.4 12.8 5.0 $20,000–$59,000 31 21.2 10.1 5.3 >=$60,000 75 51.4 10.6 3.8 Missing 19 13.0 7.7 3.9Highest Household Education HS Graduate or less 32 21.9 11.9 5.8 Some college/technical school 22 15.1 9.9 4.1 College graduate 76 52.1 10.6 3.8 Missing 16 11.0 7.6 3.9PROP* Medium Taster 68 46.6 11.1 4.2 Non Taster 33 22.6 11.3 5.2 Super Taster 44 30.1 9.0 4.0 Missing 1 0.7 3.0 n/a
Notes: Missing category not included in testing differences among number of piles
*Significant effect [F(2,142)=3.21, p=.043] for PROP; however, post hoc tests yielded no significant (p<.0167) pairwise comparisons
Appetite. Author manuscript; available in PMC 2009 March 1.
NIH
-PA Author Manuscript
NIH
-PA Author Manuscript
NIH
-PA Author Manuscript
Beltran et al. Page 14
Table 4Clusters Derived by Robinson Matrices
Appetite. Author manuscript; available in PMC 2009 March 1.

NIH
-PA Author Manuscript
NIH
-PA Author Manuscript
NIH
-PA Author Manuscript
Beltran et al. Page 15
Table 5Differences in Item Preference and Frequency of Consumption Among Robinson Matrix Defined Clusters
Preferences Consumption
M (SD) M (SD)
Chips w/toppings: Thematic 3.4 (0.7)c 2.6 (0.8)f
Junk food/Unhealthy: Evaluative-health 3.4 (0.6)c 2.6 (1.0)e,f
Dairy: Taxonomic-Professional 3.4 (0.7)c 2.5 (0.8)d,e
Mixed Meats: Taxonomic-Professional 3.4 (0.5)c 2.5 (0.8)d,e
Fruit: Taxonomic-Professional 3.2 (0.8)b 2.4 (0.7)d,e
Rice: Specific 3.2 (0.7)b 2.4 (0.7)c,d,e
Mexican: Taxonomic-Ethnic 3.2 (0.6)b 2.4 (0.8)b,c,d
Sandwiches: Taxonomic-Professional 3.2 (0.5)b 2.3 (0.7)b,cSoups/Noodles/Pasta: Specific 3.1 (0.5)b 2.3 (0.8),abVegetables: Taxonomic-Professional 2.9 (0.7)a 2.1 (0.7)a
Significant multivariate effects for preferences [F(9,133)=13.99, p<.001] and consumption [F(9,132)=15.45, p<.001]
Post hoc pairwise comparisons based on Tukey’s modified Range Test procedure accounting for correlation among the measures with overall alpha of0.01; homogeneous subsets are denoted by superscripted letters “a”, “b”, “c”, etc. where all category means within a subset are not significantly differentfrom each other.
aPreferences: 1-Don’t like it, 2-Never had it, 3-Like it a little, 4-Like it A Lot
bConsumption: 1- Never Eaten this, 2- Didn’t eat it in last 7 days, 3-Ate it 1–2 times 4-Ate it 3–5 times, 5-Ate it 6–7 times, 6 Ate it more than 7 times
Appetite. Author manuscript; available in PMC 2009 March 1.

NIH
-PA Author Manuscript
NIH
-PA Author Manuscript
NIH
-PA Author Manuscript
Beltran et al. Page 16Ta
ble
6Fr
eque
ncie
s and
Per
cent
ages
of P
rofe
ssio
nal C
ateg
orie
s by
Con
cept
ual M
atch
of T
hird
Lev
el C
ateg
orie
s
Prof
essi
onal
Gro
upin
gE
valu
ativ
e-L
ike/
Don
’tL
ike
Spec
ific-
Food
item
Food
Cha
r.-C
olor
,te
xtur
e,sh
ape
Scri
pt-
sche
me:
lunc
h,bi
rthd
ay
The
mat
ic-
com
plem
enta
ryre
latio
nshi
p:ce
real
+ m
ilk
Food
Prep
arat
ion-
Bak
ed,
cook
ed,
froz
en
Tax
onom
ic-
Eth
nic
food
or p
lace
s
Goa
l-ha
ve a
func
tion:
add-
ons,
extr
as,
etc.
Eva
luat
ive-
Hea
lthPe
rcep
tion:
good
/bad
,ju
nk, e
tc.
Tax
onom
ic-
Prof
essi
onal
: com
mon
prop
ertie
s/si
mila
ritie
s(g
rain
s,da
iry)
Nut
rien
tC
ompo
sitio
nm
acro
/mic
ronu
trie
nts -
Don
’tK
now
,N
ot S
ure,
Not
mat
ched
Bak
ed g
oods
7 (2
.4)
92 (3
1.3)
13 (4
.4)
31 (1
0.5)
74 (2
5.2)
4 (1
.4)
17 (5
.8)
0 (0
.0)
13 (4
.4)
12 (4
.1)
4 (1
.4)
27 (9
.2)
Bev
erag
es3
(2.1
)8
(5.5
)10
(6.8
)12
(8.2
)1
(0.7
)2
(1.4
)3
(2.1
)0
(0.0
)7
(4.8
)73
(50.
0)1
(0.7
)26
(17.
8)Fa
st fo
ods
41 (2
.8)
529
(36.
2)63
(4.3
)20
9 (1
4.3)
123
(8.4
)17
(1.2
)93
(6.4
)19
(1.3
)89
(6.1
)15
4 (1
0.5)
36 (2
.5)
90 (6
.2)
Froz
en fo
ods,
food
mix
ture
s, an
dca
sser
oles
34 (2
.3)
256
(17.
5)66
(4.5
)17
8 (1
2.2)
78 (5
.3)
10 (0
.7)
152
(10.
4)7
(0.5
)63
(4.3
)39
9 (2
7.3)
21 (1
.4)
196
(13.
4)
Frui
t and
frui
t jui
ces
8 (2
.7)
6 (2
.0)
10 (3
.4)
28 (9
.5)
0 (0
.0)
0 (0
.0)
4 (1
.4)
2 (0
.7)
20 (6
.8)
204
(69.
4)0
(0.0
)12
(4.1
)M
eat
4 (2
.8)
4 (2
.8)
2 (1
.4)
25 (1
7.2)
0 (0
.0)
7 (4
.8)
6 (4
.1)
0 (0
.0)
6 (4
.1)
54 (3
7.2)
2 (1
.4)
35 (2
4.1)
Past
a, n
oodl
es a
ndsp
aghe
tti14
(2.4
)1
(0.2
)26
(4.5
)68
(11.
8)43
(7.4
)0
(0.0
)34
(5.9
)5
(0.9
)26
(4.5
)27
0 (4
6.7)
11 (1
.9)
80 (1
3.8)
Poul
try7
(2.4
)46
(15.
8)17
(5.8
)36
(12.
3)1
(0.3
)12
(4.1
)14
(4.8
)0
(0.0
)13
(4.5
)91
(31.
2)5
(1.7
)50
(17.
1)R
ice
and
othe
r gra
ins
6 (2
.1)
138
(47.
6)18
(6.2
)20
(6.9
)13
(4.5
)1
(0.3
)16
(5.5
)4
(1.4
)11
(3.8
)37
(12.
8)4
(1.4
)22
(7.6
)Sa
lads
4 (2
.8)
24 (1
6.8)
15 (1
0.5)
11 (7
.7)
1 (0
.7)
0 (0
.0)
10 (7
.0)
11 (7
.7)
7 (4
.9)
19 (1
3.3)
2 (1
.4)
39 (2
7.3)
Sand
wic
hes
18 (2
.0)
469
(53.
2)22
(2.5
)10
2 (1
1.6)
85 (9
.6)
7 (0
.8)
40 (4
.5)
0 (0
.0)
40 (4
.5)
72 (8
.2)
11 (1
.2)
16 (1
.8)
Soup
12 (2
.1)
4 (0
.7)
22 (3
.8)
35 (6
.0)
133
(22.
8)0
(0.0
)16
(2.7
)0
(0.0
)23
(3.9
)28
3 (4
8.5)
7 (1
.2)
48 (8
.2)
Swee
ts a
nd sw
eete
ners
3 (2
.1)
12 (8
.2)
9 (6
.2)
46 (3
1.5)
2 (1
.4)
2 (1
.4)
3 (2
.1)
1 (0
.7)
9 (6
.2)
26 (1
7.8)
3 (2
.1)
30 (2
0.5)
Veg
etab
les a
ndve
geta
ble
juic
e7
(2.4
)21
(7.2
)17
(5.8
)21
(7.2
)1
(0.3
)0
(0.0
)14
(4.8
)17
(5.8
)15
(5.1
)13
0 (4
4.4)
2 (0
.7)
48 (1
6.4)
Tota
l16
8 (2
.4)
1610
(23.
0)31
0 (4
.4)
822
(11.
7)55
5 (7
.9)
62 (0
.9)
422
(6.0
)66
(0.9
)34
2 (4
.9)
1824
(26.
0)10
9 (1
.6)
719
(10.
3)
Appetite. Author manuscript; available in PMC 2009 March 1.

NIH
-PA Author Manuscript
NIH
-PA Author Manuscript
NIH
-PA Author Manuscript
Beltran et al. Page 17Ta
ble
7C
once
ptua
l mat
ch o
f thi
rd le
vel c
ateg
orie
s by
dem
ogra
phic
cha
ract
eris
tics
Prof
essi
onal
Gro
upin
gn
Eva
luat
ive-
Lik
e/D
on’t
Lik
e
Spec
ific-
Food
item
Food
Cha
r.-
Col
or,
text
ure,
shap
e
Scri
pt-
sche
me:
lunc
h,bi
rthd
ay
The
mat
ic-
com
plem
enta
ryre
latio
nshi
p:ce
real
+milk
Food
Prep
arat
ion-
Bak
ed,
cook
ed,
froz
en
Tax
onom
ic-
Eth
nic
food
or p
lace
s
Goa
l-ha
ve a
func
tion
: add
-on
s,ex
tras
,et
c.
Eva
luat
ive-
Hea
lthPe
rcep
tion:
good
/bad
,ju
nk, e
tc.
Tax
onom
ic-
Prof
essi
onal
:co
mm
onpr
oper
ties/
sim
ilari
ties
(gra
ins,
dair
y)
Nut
rien
tC
ompo
sitio
n-m
acro
/mic
ronu
trie
nts
Don
’tK
now
,N
otSu
re,
Not
mat
ched
Num
ber o
f chi
ldre
n14
65
113
4273
9816
3116
1913
612
118
Age
(yea
rs)
8
21 (1
4.4)
9.5
71.4
33.3
33.3
76.2
0.0
9.5b
0.0
14.3
81.0
0.0b
85.7
9
25 (1
7.1)
4.0
92.0
a28
.052
.068
.08.
08.
0b16
.016
.096
.08.
096
.0
1033
(22.
6)3.
066
.7b
30.3
45.5
57.6
21.2
18.2
9.1
9.1
90.9
6.1
81.8
11
26 (1
7.8)
3.8
88.5
c30
.853
.865
.419
.226
.911
.515
.496
.23.
876
.9
1227
14 (9
.6)
0.0
92.9
a26
.753
.373
.313
.342
.9a
7.1
7.1
100.
028
.6a
78.6
13
(18.
5)0.
063
.0b,
d25
.959
.366
.70.
029
.618
.514
.896
.311
.166
.7
* Not
incl
uded
in c
ompa
rison
of m
eani
ngfu
lly si
gnifi
cant
ly d
iffer
ence
s (%
diff
eren
ces >
25%
)
Num
ber o
f chi
ldre
n fo
r eac
h co
ncep
tual
cat
egor
y no
t mut
ual e
xclu
sive
Subs
crip
t not
atio
n: %
a m
eani
ngfu
lly si
gnifi
cant
ly h
ighe
r tha
n %
b; %
c m
eani
ngfu
lly si
gnifi
cant
ly h
ighe
r tha
n %
d
Appetite. Author manuscript; available in PMC 2009 March 1.