mior: an individual-based model for simulating the spatial patterns of soil organic matter microbial...
TRANSCRIPT
MIOR: an individual-based model for simulating the spatial patterns of soil
organic matter microbial decomposition
D. MASSEa,*, C. CAMBIERb, A. BRAUMANc, S. SALLc, K. ASSIGBETSEc & J-L. CHOTTEd
aIRD, UR179 SeqBio, BP182 01 Ouagadougou, Burkina Faso, bIRD / Laboratoire
Informatique Paris 6, UR Geodes, BP1386, Dakar, Senegal, cIRD, UR179 SeqBio, BP1386
Dakar, Senegal, and dIRD, UR179 SeqBio, BP 64501, 34394 Montpellier Cedex 5, France
Correspondence: D. MASSE. E-mail: [email protected], * current adress: IRD/LRI,
BP434 101 Antananarivo, Madagascar
Received 19 April 2005; revised version accepted
1

Summary
An individual-based model, called MIOR, was designed to assess hypotheses on the effect of
the spatial distribution of organic matter and microbial decomposers on soil carbon and
nitrogen dynamics. Two main types of object were defined to represent the decomposers and
the soil organic substrates. All these objects were positioned in a 3D space. The exchange of
carbon and nitrogen between these various entities was simulated. Two scenarios were tested
according to the degrees of clustering of organic matter and of microorganisms. The results of
simulations highlighted the effect of the ratio of accessible organic carbon to microbial carbon
on the dynamics of microbial biomass and CO2 release. This ratio was determined by the
number of contacts between one object representing the microbial decomposers and the
surrounding objects representing the organic substrates.
Résumé
MIOR: modèle individu-centré de simulation de la distribution spatiale des
processus microbiens de la décomposition des matières organiques dans les
sols.
Un modèle individu-centré, appelé MIOR, a été conçu pour tester les hypothèses concernant
les effets de la distribution spatiale des matières organiques et des micro-décomposeurs dans
les sols sur la dynamique du carbone et de l’azote minéral. Deux principaux types d’objets ont
été définis représentant les microorganismes décomposeurs et les substrats organiques. Ces
objets sont positionnés dans une espace à trois dimensions. Les échanges de carbone et
d’azote entre ces deux entités sont simulés. Deux scénarios sont testés selon des niveaux
d’agrégation des microorganismes et celui des matières organiques. Les résultats des
simulations mettent en avant l’importance de la quantité de carbone organique accessible par
2
unité de carbone microbien sur la dynamique de la biomasse microbienne et du CO2 dégagé.
Cette quantité est déterminée par le nombre de contacts entre un objet représentant des micro-
décomposeurs et des objets qui l’entourent représentant les substrats organiques.
3

Introduction
Soil is a complex system. Many biological processes take place in soil and determine
functions that provide various services within ecosystems: turn-over of organic matter,
symbiotic and non-symbiotic atmospheric nitrogen fixation, denitrification, aggregation, etc.
(Chenu & Stotzky, 2002; Young & Crawford, 2004). Soil is a medium with solids, liquids and
gases in which the mineral and organic particles form differently-sized aggregates that delimit
pores (Tisdall & Oades, 1982; Feller & Beare, 1997; Six et al., 2000; Six et al., 2004). This
organization creates micro-environments that are suited to microbial activity to varying
extents (Chotte et al., 1997). Some studies have investigated the spatial distribution of
microbes in soil. Nunan et al. (2001) described the spatial distribution of bacterial cells in an
undisturbed soil by means of large-scale imaging of thin sections. They confirmed the
patchiness of bacterial distribution as a result of cell growth mechanisms and of
environmental constraints. Grundmann & Debouzie (2000) observed the micro-scale
distribution of the NH4+ and NO2
- oxidizer community in a bulk soil at a micro-millimetre
scale. Recent studies have pointed out the importance of taking into consideration the
distribution within the soil matrix of microbial activity hot spots (Gaillard et al., 2003;
Vieublé-Gonod et al., 2003). Young & Crawford (2004) emphasized the importance of 3D
dynamic modeling to study the structural organization of soil and that has to be associated
with spatial representation of the biological activity in soil (Ettema & Wardle, 2002).
Soil, therefore, must be considered not as a uniform space but as a changing pattern of
"spots" characterized by microbial activity of variable intensity. The question of the extent to
which this heterogeneous space affects the microbial processes involved in the various
services provided by the soil to the ecosystems is fundamental.
Several studies have shown the effect of the size of the organic residue on the intensity of
mineralization. Among the various factors such as biochemical composition, the surface of
4
the contact area between this residue and the organo-mineral matrix of the soil is considered
as one of the main determinants (Angers & Recous, 1997; Bending & Turner, 1999).
Wachinger et al. (2000) highlighted the relation between CH4 release by methanogenic
microbes and micro-scale hot spots of organic substrate in soil cores. Although the patterns of
spatial distribution of the microorganisms in the soils were described, no experiment has
provided conclusive information about the effect of spatial distribution of microorganisms on
the processes of decomposition of organic substrates. This lack of information can be
explained partly by the difficulty, or even impossibility, of manipulating these
microorganisms and controlling their distribution in the soil matrix.
Mathematical models are useful methodological tools for designing and simulating
complex processes such as SOM decomposition (Peck, 2004). In most models used to
simulate soil organic matter decomposition i) soil is considered as a homogenous medium, ii)
organic resources are represented as a series of discrete pools related to each other by first
order kinetic functions, and iii) microbial decomposers are represented as a single pool,
homogeneously distributed in the soil (McGill, 1996). Although these models have been
widely used, several authors have pointed out their limits (Christensen, 1996). Garnier et al.
(2003) improved the prediction of C and N mineralization of added straw residues by adding
a function for the colonization by decomposers of the substrate to the original model
CANTIS. Several models enhanced the representation of the microbial activity. Blagodatsky
& Richter (1998) proposed a model to simulate nitrogen turnover where the microbial
community is described according to its physiological state e.g., active versus dormant. The
CANTIS model distinguishes autochthonous and zymogenous biomasses (Garnier et al.,
2003). The SOMKO model was based on the trophic relationships between microorganisms
and organic substrates (Gignoux et al., 2001).
5

Individual-based models or multi-agent systems have been used in many social and life
science fields and more recently for environmental applications (Bousquet & Le Page, 2004).
This approach offers substantial advantages for ecological modeling such as the recognition
of the distinct behavior of individuals in a spatially fluctuating environment (Ginot et al.,
2002). Individual-based models (IBM) and multi-agents systems (MAS) allow levels of
heterogeneity, i.e., microorganisms and organic substrates, and their distribution in a spatial
environment, to be taken into consideration. So far as we are aware, only one IBM has been
proposed in microbiology. This simulated the growth of bacteria cultured in a liquid medium
(Kreft et al., 1998).
This article proposes an individual-based modeling approach (the MIOR model) to study
microbial process of soil organic matter mineralization. For this first attempt, the soil was
reduced to a virtual assemblage of aggregates of microorganisms and organic substrates. For
this study, we assumed that exchanges of carbon and nitrogen between these two entities, e.g.
the micro-decomposers and the organic resources, are effective only when they are in contact.
This article describes the model and looks at whether the spatial distribution of
microorganisms and/or organic resources has an impact on simulated values. Two scenarios
are compared (i.e. the degree of clustering of microorganisms and of the organic resources).
The results and limits of the model are then discussed.
Materials and methods
The MIOR model
Model description
An individual-based model, or a multi-agent system, comprises (i) an environment that is
usually a space, (ii) a set of objects situated in this environment, (iii) a set of agents, which are
specific objects that represent the active entities in the system, (iv) a set of relations that link
6

objects (and therefore agents) together and (v) a set of operations that make it possible for the
agents to perceive, produce, transform and manipulate objects (Bousquet & Le Page, 2004).
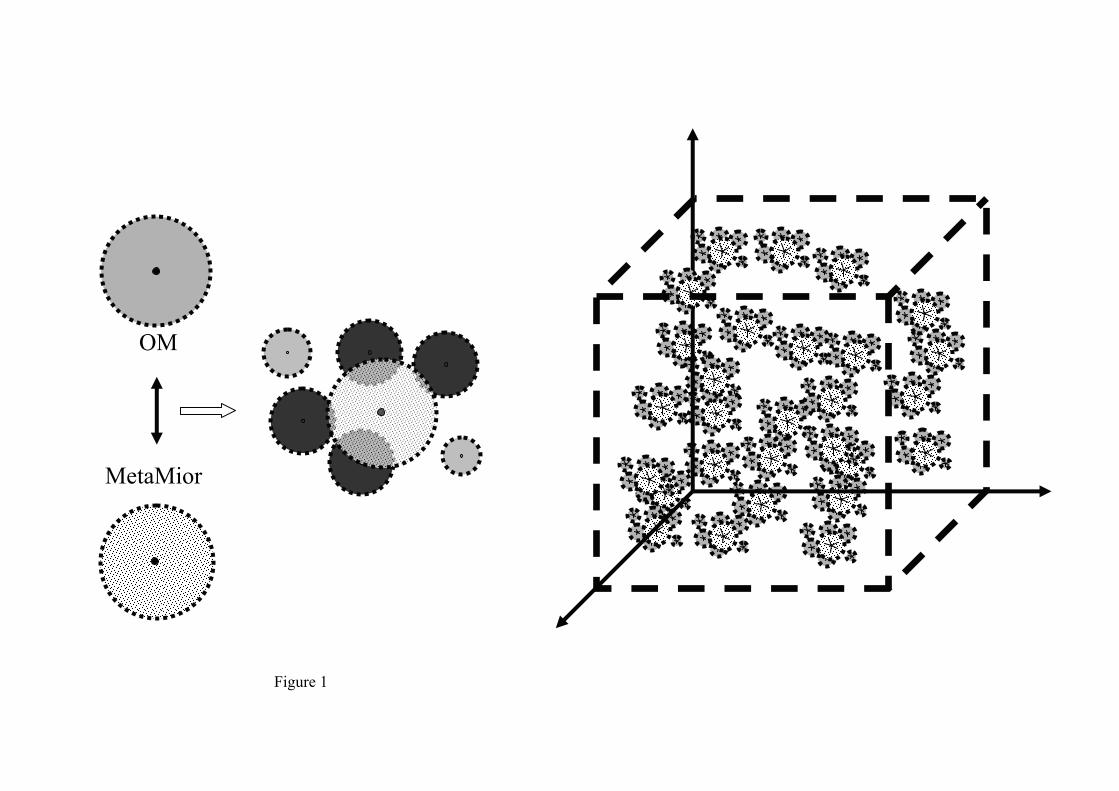
In this study, the bulk soil was considered as a volume with two sets of objects (Figure 1):
1) Microorganisms, referred to as MetaMior (MM),
2) Organic substrates, referred to as OMsphere (OM).
The MetaMior object
Since (i) the density of the soil microorganisms is too large (between 106 to 109 cells g-1 of
soil) (Paul & Clark, 1996) to allow a computer representation of each cell, and (ii) a microbial
cell is unlikely to be found as a single cell in soils, a MetaMior (MM) corresponds to an
aggregate of microorganisms. A MetaMior is characterized by its carbon content, MM-
Ccontent, and its nitrogen content (MM-Ncontent) which is determined by the C-to-N ratio of
microorganisms (CN). Two physiological states are considered:
1) A dormant state, where no substrate is consumed, with cells in a resting state,
2) An active state, where microbial cells consume energy and nutrients to fulfil their
basal metabolism and thereafter allow their growth.
Cell metabolism converts substrate into microbial biomass and metabolites (CO2,
inorganic N) via the equation described in the SOMKO model (Gignoux et al., 2001). A
dormant MetaMior becomes active when its maintenance needs are fulfilled by the presence
of organic C as a source of energy. Maintenance energy encompasses all energy expenditure
not directly contributing to growth. It corresponds to the respiration rate, RR (time-1) which is
considered to be constant with time. It also determines the CO2 production. When the source
of energy (organic C from the OMspere) is not sufficient to support microbial growth, a
fraction of the biomass, equal to the carbon deficit, becomes dormant. On the other hand,
when the maintenance needs are satisfied, the active part of a MetaMior is able to grow. The
7
MetaMior growth is limited by a potential growth rate, GR (time-1) and depends on the
balance of carbon and nitrogen availability.
At each time step of the simulation, the MetaMior’s needs for carbon (MM-Cneeds) and
nitrogen (MM-Nneeds) are evaluated with the following equations:
MM-Cneeds = RR × MM-Ccontent + GR × MM-Ccontent (1),
MM-Nneeds = CN × GR × MM-Ncontent (2).
The OMsphere object
An OMsphere object (OM) that represent the organic substrate is split into several organic
pools. Each pool, I, is characterized by a C-to-N ratio (CNOMi) and a decomposition rate (i.e.,
ki). Available carbon and nitrogen for the MetaMior is calculated at each time step with the
following equations:
OM-Cavailable = ∑ ki Ci (3),
OM-Navailable = ∑ ki Ci CNOMi (4),
where Ci, ki and CNOMi are respectively the C content, the decomposition rate and the C-to-
N ratio of the pool, I, of an organic substrate entity.
The environment
MetaMiors (MMs) and OMspheres (OMs) are spheres randomly distributed in a continuous
3D space (Figure 1). One important attribute of a MetaMior agent is its neighbouring
collections of OMs which determine the amount of C and N available for it. Two objects are
neighbors if the distance between their centres is no more than the sum of the radii of their
respective spheres. The radius of the sphere representing one object is calculated from its
volume which is defined as the total volume occupied in the whole environment by the whole
collection of these objects divided by the number of these objects.
Running the model
8

Initialization of the parameters of each object
Each OM object was divided into four different pools very similar to those proposed in the
literature (Ågren & Bosatta, 1996; Gignoux et al., 2001): i.e., cellulose, hemicellulose, lignin
and simple molecules (e.g., carbohydrates or amino acids). For each pool, the decomposition
rate and the C-to-N ratio were those given by Minderman (1968) and Trinsoutrot et al. (2000)
(Table 1).
Neither the number of MetaMior or OM objects nor their distribution within the whole
volume of their environment is precisely documented. Nevertheless, Grundmann et al. (2001)
showed that nitrifier soil microbial communities occurred in patches that occupy at least 5.5%
of the volume of the soil matrix. The relative volumes (RV) to the whole volume for both OM
and MM entities were fixed at 10%. The maximum number of objects that could be simulated
in a reasonable time-scale was 500 OM and 500 MM objects. The sum of the carbon content
of the each MetaMior (MM-Ccontent) represented 1% of the sum of the OM carbon content. It is
referred to as the total Microbial Biomass C content (MB-C).
Distribution of the different objects
The sets of objects (e.g. MM, OM) were randomly distributed in a 3D environment (Figure 1).
Their respective coordinate and the collections of neighboring objects were defined for each
object.
The process
The simulation starts by initializing every object and the whole environment. The exchange of
carbon and nitrogen between objects is then calculated using the MetaMior list. For each
MetaMior, the active part is considered before the dormant part. Into this process, the growth
of a MetaMior agent is first limited by carbon availability and then by nitrogen availability
(Gignoux et al., 2001). The rates of growth and CO2 respiration depend on the equilibrium
9
between the amount of accessible C and N (OM-Caccessible, OM-Naccessible), the amount of
available C and N (OM-Cavailable, OM-Navailable) from OMs in contact with each MetaMior and
the individual needs of each MetaMior for C and N (MM-Cneeds, MM-Cneeds). In this first
version of MIOR, only one contact with an OM is sufficient for a MetaMior to be able to use
the total available carbon and nitrogen resources of this OM. Moreover, according to the
sequential properties of the computer program, the processes of carbon and nitrogen exchange
are sequentially applied to each MetaMior. However, the order of each object in the list of
MetaMior, as of OM, is randomly modified at each time-step.
Computer programming
The program was written in ‘Smalltalk’, an object-oriented language, using ‘Squeak’ freeware
(www.squeak.com).
Experimental simulations: effect of MM or OM clustering
This paper compares the impact of MetaMior clustering or OMsphere clustering on simulated
values of the carbon content of the MetaMior objects (MM-Ccontent), and of the C-CO2
respiration magnitude over time (500 time steps). Two different scenarios, i.e. the degree of
clustering of the MetaMior objects (scenario 1) and the degree of clustering of OM objects
(scenario 2) were tested. Two cases were considered for each scenario: a small degree of
clustering (denoted as S-MM and S-OM respectively for each scenario), a large degree of
clustering (denoted as L-MM and L-OM respectively for each scenario). Figure 2 illustrates
the different levels of clustering. The control case (no clustering) simulated 500 OM and 500
MM objects (Table 1).
The total carbon and the relative amount of space occupied by the OMsphere and the
MetaMior sets was the same for each scenario. Reducing the number of objects (OM and
MM) increased their volume (and their radius) (Figure 2).
10
Results of the simulations analysis
The distribution in space of the sets of objects was initialized randomly. Each simulation was,
therefore, unique even if the same set of parameters was used. Each scenario was simulated
five times and the standard errors of the output variables were calculated.
Results
Initial state
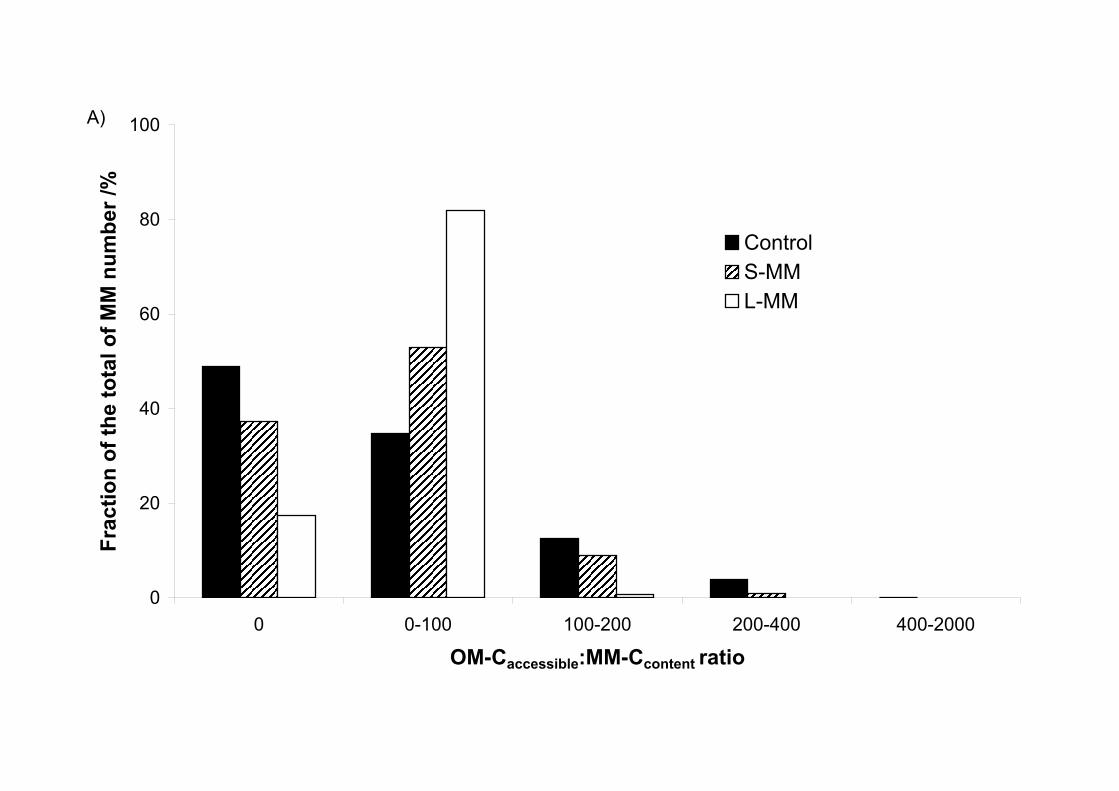
When the model is initialized, the quantity of carbon accessible for each MetaMior is
represented by the ratio: OM-Caccessible/MM-Ccontent (Figure 3). The simulation gives discrete
values from 0 to 2000 for this ratio. Zero indicates that no organic resources are accessible to
a MetaMior due to the absence of contact between this MetaMior and any adjacent
OMspheres. The number of MetaMior (as a percentage of the total number) for each of these
values can be counted. The histograms in Figure 3 show the differences between the scenarios
tested. For scenario 1 (Figure 3A), the increase in the degree of clustering of the microbial
consumers (Control, S-MM, L-MM) results in
1) a decrease in the number of MetaMior without resources (Figure 3A) from 49%
for the control to 17% of the total number of MetaMior for the large degree of
clustering (L-MM).
2) an increase in the number of MetaMior with access to small amounts of C (OM-
Caccessible:MM-Ccontent <100).
Contrary to scenario 1 (degree of clustering of MetaMior), the increase in the degree of
clustering of the organic resource (Control, S-OM, L-OM) in scenario 2 causes an increase in
the number of microbial consumers without resources (Figure 3B) and a greater proportion of
microbial consumers with access to very large organic resources (OM-Caccessible:MM-Ccontent
>400).
11

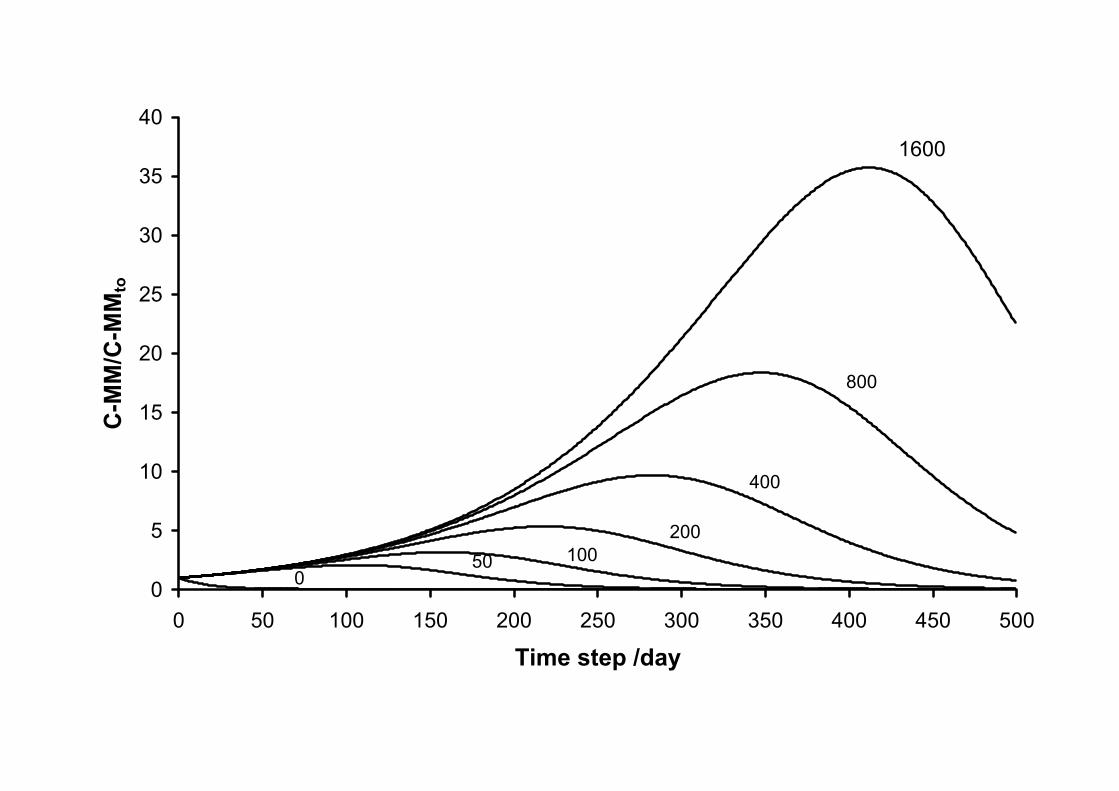
In the model, the ratio OM-Caccessible:MM-Ccontent determines the dynamics of each
microbial consumer (MM). Figure 4 shows the simulation of the change in a MetaMior in
relation to the amount of C that is accessible to it. The lack of organic resources (OM-
Caccessible:MM-Ccontent=0) naturally decreases MM-Ccontent by mortality after the first simulation
time step. The increase in accessible resources produces an increase in MM-Ccontent which can
reach values up to 35 times the initial value (OM-Caccessible:MM-Ccontent =1600). The overall
dynamics of the total microbial biomass (MB-C) depends on the distribution frequency of the
various MetaMior across the various categories.
Output variables
For each time step, the model calculates the amount of carbon in the MB-C as well as the
amount of CO2-C respired. Figures 5 and 6 show how these values change over 500 time
steps. The variation in output for the different random realizations of the simulations is
illustrated. The greatest standard errors are noticed for the greatest degree of clustering of OM
(scenario 2).
There are three successive phases in the total biomass change for each scenario:
1) a period of decrease,
2) a period of increase,
3) another period of decrease.
The cases and scenarios differ mainly in the duration of these phases. For scenario 1,
which compares the different degrees of clustering of the MetaMior, the first two phases
(increase followed by decrease) are shorter when there is an increase in the degree of
clustering (Figure 5A). This is particularly clear for a large degree of clustering (L-MM)
where there is no initial decrease phase. The increase in the degree of clustering of MetaMior
also reduces the maximum total biomass attained with respect to that measured in the control.
12

For scenario 2, the greater the degree of clustering of the organic resources, the longer the
first two phases compared with the control processing (Figure 5B). The lengthening of these
periods implies greater variation in the total biomass value of the MetaMior. The maximum
value is attained for the greatest degree of clustering of the OMsphere object (L-OM).
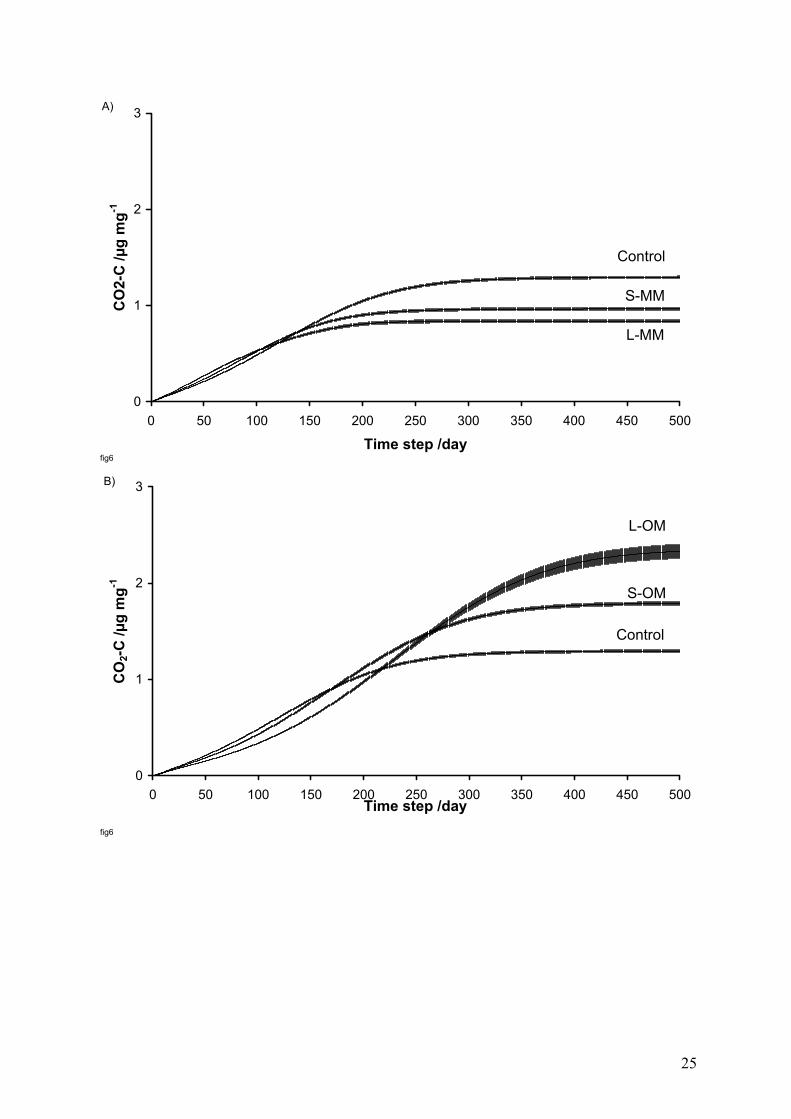
For CO2-C production, the curves indicate less mineralization at the end of the number of
steps simulated in scenario 1 for S-MM and L-MM processing than for the control (Figure
6A). On the contrary, there is greater mineralization for S-OM and L-OM processing in
scenario 2. However, for both scenarios, for up to a third of the simulation time the effects of
the degree of clustering on the amounts of CO2 respired appear to be inverted. For example,
where the degree of clustering of OM objects is increased, the amount of CO2 respired during
this initial period is greater for the control than for the other cases (Figure 6B).
Discussion
Our theoretical work shows that the organic matter mineralization is modified when the
spatial distribution of organic matter or microorganisms changes. The MIOR model used to
simulate exchanges of carbon and nitrogen between entities that represent microorganisms
and organic substrates indicates that the change in size and number of these objects disrupts
the dynamics of the microbial biomass and the amount of CO2 respired.
The overall dynamics of the simulated system (OMsphere + MetaMior) are the sum of
each entity. The individual dynamics of the aggregated microorganisms (MetaMior) in the
model depend on the number of contacts with the organic matter entities (OMsphere). This
number determines the amount of carbon available to maintain their basic metabolism and
then their growth needs. According to the simulation results, the dynamics of the total
microbial biomass, MB-C, and mineralization of the OMs depend on the number of MetaMior
without any carbon resources. In the MIOR model, as these microorganisms do not have
access to energy resources, they show negative growth. When organic matter is added, the
13
smaller the proportion of organisms with access to this resource, the more the total microbial
community will be dominated by the negative growth of the microorganisms without
resources.
In laboratory or field experiments that add organic matter to a soil, it is quite conceivable
that only a part of the microbial community has access to the organic substrates added. One
single application cannot fill all the soil pores whether it is soluble or solid, whole or ground,
applied to the surface or dug in. Equally, the microbial community in the soil may remain
inactive either owing to local conditions that inhibit its development (anoxia, acidity, water
stress, etc.) or because it is located in very stable micro-structures protected from the external
environment. Several studies have demonstrated that micro-structures, such as 2-50 µm
micro-aggregates, protect soil microorganisms from desiccation or chemical stress such as
mercury spiking (Vargas & Hattori, 1986; Ranjard et al., 2000). Under such conditions, soil
microorganisms are unaffected by organic inputs, or decline. However, several addition of
organic matter or any disruption of the soil may, just by chance or by changing environmental
conditions, increase the probability of that microorganisms will encounter organic resources,
as described by the dynamic aggregate conceptual model used by Six et al. (2000). The
MIOR model should, therefore, be modified to give a less static representation of the
relationship between microbial and organic entities.
The analysis of scenario 1 (degree of clustering of MetaMior) indicates that, with the
same resource distribution, a concentration of microbial activity in limited areas limits the
mineralization of the organic resources in the long term. Although this concentration of
microbial activity allows each microorganism hot spot to access carbon and nitrogen, it
implies also a reduction in the ratio between the microbial biomass and the organic resources,
thus limiting the growth of the microorganisms. However, over the short simulation times that
we used, the differences in mineralization appear to be insignificant when the microbes are
14

more and more concentrated into hot spots. These simulation results indicate that carbon
mineralization would also depend on the size of the hot spots of microbial activity. In a study
that described these hot spots in a Scottish arable field soil, Nunan et al. (2002) showed that
the surface horizon (Ap) is characterized by smaller hot spots than those in the zones of
activity observed in the adjacent horizon (Bt). It would be interesting to confirm the
hypothesis raised by the results from our simulations, by comparing the mineralization
processes after the addition of organic matter to undisturbed samples taken from these two
horizons.
The analysis of scenario 2 (degree of clustering of OMsphere) indicates that for the same
distribution of microorganisms, the increase in size and density of the organic substrates
accentuates the extreme values of microbial biomass as well as 1) the mineralization of the
organic matter and 2) the variability between repeated scenarios. In the MIOR model, the
reduction in the number of OMsphere objects together with the increase in their size implies a
reduction in the number of MetaMior with access to a resource, which explains an initial
decrease in MB-C. However, the limited number of MetaMior which have access to these
resources have a larger amount of carbon available which allows better growth, which in turn
leads to a faster mineralization during the second phase. Moreover, in this scenario 2, the
number of MetaMior without access to an OM resource and the ratio of organic carbon
resources by microbial carbon are more variable between repeated simulations than in the
case of scenario 1 (degree of clustering of MetaMior, data not shown), that explain the
greatest standard errors of output values particularly for the scenario with the high degree of
OM clustering scenario. From an experimental study, Bending & Turner (1999) showed that
the size of particles of vegetal residues incorporated into the soil affects microbial activity
(CO2 release and microbial biomass) in interaction with the biochemical quality of this
organic residue. The experimental values obtained by these authors are in line with the
15

simulations produced by the MIOR model: the amount of CO2 released and the microbial
biomass are greater in the presence of large organic residues (0.2 to 4 cm²). Angers & Recous
(1997) incubated wheat straw with soils for 100 days and reached the opposite conclusion:
small residues (0.06 cm long) showed much greater mineralization than residues more than
0.5 cm long. These authors consider the determining factor to be the potential contact surface
of these residues with the soil, as smaller vegetal residues appear to have a larger contact
surface. During the first hundred time-steps of the simulation with MIOR, results also showed
greater mineralization for the smallest OMsphere objects (Control). It would be of interest to
extend the incubation times to see whether the mineralization of relatively larger residues
increased in the long term, as would appear to be confirmed by the work of Angers & Recous
(1997).
Conclusion
The results obtained using the MIOR model show that the number of contacts between
microbial communities and their substrate determine the dynamics of the decomposers and
the dynamics of the substrate decomposition products. This parameter will naturally be a
function of the specific surface of a residue and the size of the microbial activity spots as well
as their relative distribution in space. The model highlights the effect of the number of
microorganisms that do not have access to any organic resource on the microbial activity in a
soil.
The model can incorporate other parameters such as the distribution in the simulated
space of an exogenous source of mineral nitrogen. It is envisaged being able to simulate levels
of organization such as soil structure. Research is currently being carried out on these points.
Acknowledgements
16
This work received the financial support from the PNSE-2002 French program. Special
thanks to Alioun Badara and Mahamadou Belem from the University of Bobo Dioulasso for
the computer program conception, and, to the anonymous reviewers who helped us to
improve this work.
17

References
Ågren, G.I. & Bosatta, E. 1996. Quality: a bridge between theory and experiment in soil
organic matter studies. OIKOS, 76, 522-528.
Angers, D.A. & Recous, S. 1997. Decomposition of wheat straw and rye residues as affected
by particle size. Plant and Soil, 189, 197-203.
Bending, G.D. & Turner, M.K. 1999. Interaction of biochemical quality and particle size of
crop residues and its effect on the microbial biomass and nitrogen dynamics following
incorporation into soil. Biology and Fertility of Soils, 29, 319-327.
Blagodatsky, S.A. & Richter, O. 1998. Microbial growth in soil and nitrogen turnover: a
theoretical model considering the activity state of microorganisms. Soil Biology and
Biochemistry, 30, 1743-1755.
Bousquet, F. & Le Page, C. 2004. Multi-agent simulations and ecosystem management: a
review. Ecological Modelling, 176, 313-332.
Chenu, C. & Stotzky, G. 2002. Interactions between microorganisms and soil particles: an
overview. In: Interactions between Soil Particles and Microorganisms (eds P.M. Huang,
J.-M. Bollag & N. Senesi), pp. 3-40. Wiley, New York.
Chotte, J.L., Ladd, J.N. & Amato, M. 1997. Sites of microbial assimilation, and turnover of
soluble and particulate 14C-labelled substrates decomposing in a clay soil. Soil Biology
and Biochemistry, 30, 205-218.
Christensen, B.T. 1996. Matching measurable soil organic matter fractions with coneptual
pools in simulation models of carbon turnover: Revision of model structure. In: Evaluation
of soil organic matter models (eds D.S. Powlson, P. Smith & J.U. Smith), pp. 143-160.
Springer Verlag, Berlin Heidelberg.
Ettema, C.H. & Wardle, D.A. 2002. Spatial soil ecology. Trends in Ecology & Evolution, 17,
177-183.
18

Feller, C. & Beare, M.H. 1997. Physical control of soil organic matter dynamics in the
tropics. Geoderma, 79, 69-116.
Gaillard, V., Chenu, C. & Recous, S. 2003. Carbon mineralisation in soil adjacent to plant
residues of contrasting biochemical quality. Soil Biology and Biochemistry, 35, 93-99.
Garnier, P., Néel, C., Aitac, C., Recous, S., Lafolie, F. & Mary, B. 2003. Modelling carbon
and nitrogen dynamics in a bare soil with and without straw incorporation. European
Journal of Soil Science, 54, 555-568.
Gignoux, J., House, J., Hall, D., Masse, D., Nacro, H.B. & Abbadie, L. 2001. Design and test
of a generic cohort model of soil organic matter decomposition: the SOMKO model.
Global Ecology & Biogeography, 10, 639-660.
Ginot, V., Le Page, C. & Souissi, S. 2002. A multi-agents architecture to enhance end-user
individual-based modelling. Ecological Modelling, 157, 23-41.
Grundmann, G.L. & Debouzie, D. 2000. Geostatistical analysis of the distribution of NH4+
and NO2--oxidizing bacteria and serotypes at the millimeter scale along a soil transect.
FEMS Microbiology Ecology, 34, 57-62.
Grundmann, G.L., Dechesne, A., Bartoli, F., Flandrois, J.P., Chasse, J.L. & Kizungu, R. 2001.
Spatial modeling of nitrifier microhabitats in soil. Soil Science Society of America Journal,
65, 1709-1716.
Kreft, J.-U., Booth, G. & Wimpenny, J.W.T. 1998. BacSim, a simulator for individual-based
modelling of bacterial colony growth. Microbiology-UK, 144, 3275-3287.
McGill, W.B. 1996. Review and classification of ten soil organic matter (SOM) models. In:
Evaluation of soil organic matter models (eds D.S. Powlson, P. Smith & J.U. Smith), pp.
111-132. Springer-Verlag, Berlin Heidelberg.
Minderman, G. 1968. Addition, decomposition and accumulation of organic matter in forests.
Journal of Ecology, 56, 355-362.
19

Nunan, N., Ritz, K., Crabb, D., Harris, K., Wu, K., Crawford, J.W. & Young, I.M. 2001.
Quantification of the in situ distribution of soil bacteria by large-scale imaging of thin
sections of undisturbed soil. FEMS Microbiology Ecology, 37, 67-77.
Nunan, N., Wu, K., Young, I.M., Crawford, J.W. & Ritz, K. 2002. In situ spatial patterns of
soil bacterial populations, mapped at multiple scales, in an arable soil. Microbial Ecology.
Paul, E.A. & Clark, F.E. 1996. Soil Microbiology and Biochemistry. Academic Press, San
Diego, USA.
Peck, S.L. 2004. Simulation as experiment: a philosophical reassessment for biological
modeling. Trends in Ecology & Evolution, 19, 530-534.
Ranjard, L., Brothier, E. & Nazaret, S. 2000. Sequencing bands os ribosomal intergenic
spacer analysis fingerprints for characterization and microscale distribution of soil
bacterium populations responding to mercury spiking. Applied and Environmental
Microbiology, 66, 5334-5339.
Six, J., Bossuyt, H., Degryze, S. & Denef, K. 2004. A history of research on the link between
(micro)aggregates, soil biota, and soil organic matter dynamics. Soil and Tillage Research,
79, 7-31.
Six, J., Elliott, E.T. & Paustian, K. 2000. Soil macroaggregate turnover and microaggregate
formation: a mechanism for C sequestration under no-tillage agriculture. Soil Biology and
Biochemistry, 32, 2099-2103.
Tisdall, J.M. & Oades, J.M. 1982. Organic matter and water-stable aggregates in soils.
Journal of Soil Science, 33, 141-163.
Trinsoutrot, I., Recous, S., Bentz, B., Lineres, M., Cheneby, D. & Nicolardot, B. 2000.
Biochemical quality of crop residues and carbon and nitrogen mineralization kinetics under
nonlimiting nitrogen conditions. Soil Science Society of America Journal, 64, 918-926.
20
Vargas, R. & Hattori, T. 1986. Protozoan predation of bacterial cells in soil aggregates. FEMS
Microbial Ecology, 38, 233-242.
Vieublé-Gonod, L., Chenu, C. & Soulas, G. 2003. Spatial variability of 2,4-
dichlorophenoxyacetic acid (2,4-D) mineralisation potential at a millimetre scale in soil.
Soil Biology and Biochemistry, 35, 373-382.
Wachinger, G., Fiedler, S., Zepp, K., Gattinger, A., Sommer, M. & Roth, K. 2000. Variability
of soil methane production on the micro-scale: spatial association with hot spots of organic
material and Archaeal populations. Soil Biology and Biochemistry, 32, 1121-1130.
Young, I.M. & Crawford, J.W. 2004. Interactions and self-organization in the soil-microbe
complex. Science, 304, 1634-1637.
21
FIGURE CAPTIONS
Figure 1 MIOR individual-based model. Random distribution in space of objects assumed to
be spheres and which represent the microorganisms MetaMior (light grey) and the organic
matter OM (mid-grey). The distance between the centres of two spheres compared with the
sum of the radii of these spheres is used to determine the accessibility of a MetaMior to
organic matter.
Figure 2 Theoretical representation of the scenarios simulated. Based on a random
distribution (control) of two sets of objects, the MetaMior (white) and the organic matter
(black), the objects are regrouped in heaps at two degrees of clustering: S- small and L- large.
Scenario 1 clusters the MetaMior (on the left, S-MM and L-MM) and scenario 2 clusters the
OM (on the right, S-OM and L-OM).
Figure 3 Number of MetaMior (as a proportion of the total number of MetaMior) classified
by the ratio OM-Caccessible:MM-Ccontent for A) scenario 1 (MetaMior degree of clustering, S-
MM, L-MM), for B) scenario 2 (OM degree of clustering, S-OM, L-OM) compared in each
case with the distribution without clustering (control).
Figure 4 Change in the microbial biomass of a MetaMior (MM-Ccontent) expressed with
respect to the initial quantity (MM-Cto) as a function of time for the values in ratio OM-
Caccessible:MM-Ccontent from 0 to 1600.
Figure 5 Change in the microbial biomass MB-C (expressed with respect to the total initial
MB-C:MB-Cto) over time for scenarios 1 (A) and 2 (B) and the different degrees of clustering
of MetaMior (S-MM and L-MM) and OMs (S-OM and L-OM) compared with the distribution
without clustering (control). The bars represent the standard error (n=5).
Figure 6 Change in CO2-C release over time for scenarios 1 (A) clustering of MetaMior and
2 (B) clustering of OM, and the different degrees of clustering of MetaMior (S-MM and L-
MM) and OM (S-OM and L-OM) compared with the distribution without clustering (control).
22

TABLES
Table 1 Initial parameters used to simulate two degrees (small and large) of clustering
scenarios of the microorganisms (MetaMior) and the organic matter (OM) in soil.
MetaMior degree of clustering
OM degree of clustering Parameters Control
Small S-MM
Large L-MM
Small S-OM
Large L-MM
Number of OM objects OM-Ccontent /µg
500 0.02
500 0.02
500 0.02
250 0.04
100 0.1
Organic substrate pools P1: C/N
k /day-1
% of OM-CcontentP2: C/N
k /day-1
% of OM-CcontentP3: C/N
k /day-1
% of OM-CcontentP4: C/N
k /day-1
% of OM-Ccontent
106
0.0192 11.1 50
0.024 22 100 0.1 19.6 20
0.6384 47.3
Total OM occupation /% total volume 10 Number of MM objects MM-Ccontent /µg
500 0.0002
250 0.0004
100 0.001
500 0.0002
500 0.0002
Mortality rate MR /day-1
Maximum potential growth rate GR /day-1
Respiration rate RR /day-1
C/N ratio
0.05
1 0.05 12
Microbial composition /% P1 P2 P3 P4
20 20 30 30
Total MM occupation /% total volume 10
23
MetaMior
OM
Figure 1

Degree of clustering of MetaMior
Degree of clustering of OM
Randomly distribution of MetaMior and OM (Control)
Small degree of clustering (S-MM)
Large degree of clustering (L-MM)
Small degree of clustering (S-OM)
Large degree of clustering (L-OM)
Figure 2
0
20
40
60
80
100
0 0-100 100-200 200-400 400-2000
OM-Caccessible:MM-Ccontent ratio
Frac
tion
of th
e to
tal o
f MM
num
ber /
%
ControlS-MML-MM
A)

0
20
40
60
80
100
0 0-100 100-200 200-400 400-2000
OM-Caccessible:MM-Ccontent ratio
Frac
tion
of th
e to
tal o
f MM
num
ber /
%
ControlS-OML-OM
B)
0
5
10
15
20
25
30
35
40
0 50 100 150 200 250 300 350 400 450 500
Time step /day
C-M
M/C
-MM
to
1600
800
400
20010050
0

0
0.5
1
1.5
2
0 50 100 150 200 250 300 350 400 450 500
Time step /day
MB
-C/M
B-C
to
ControlS-MM
L-MM
A)
fig5
0
0.5
1
1.5
2
0 50 100 150 200 250 300 350 400 450 500
Time step /day
MB
-C/M
B-C
to
Control
S-OM
L-OM
B)
fig 5
24
0
1
2
3
0 50 100 150 200 250 300 350 400 450 500
Time step /day
CO
2-C
/µg
mg-1
Control
S-MM
L-MM
A)
fig6
0
1
2
3
0 50 100 150 200 250 300 350 400 450 500Time step /day
CO
2-C
/µg
mg-1
Control
S-OM
L-OM
B)
fig6
25