microwave remote sensing of moon
TRANSCRIPT
MICROWAVE REMOTE SNSOING OF MOON
Shiv Mohan
PLANEX
Physical Research Laboratory
Ahmedabad
[email protected], [email protected]
Introduction:
Remote sensing is a term used to describe many different types of observations carried out at a
distance. Aerial photos, satellite images of the Earth and planets, and telescope views of our solar
system are all forms of remote sensing used to understand geology, climate, hazards, and
changes over time. Not all remote observations use the wavelengths of light visible to humans;
there is a wealth of information contained in how a surface reflects or emits radiation across the
spectrum from radio waves to gamma radiation. In the microwave region, remote sensing
technique offers new challenges in the development of techniques for deriving useful
information about lunar surface. The microwave portion of the electromagnetic spectrum covers
the range from approximately 1meter to 1mm in wavelength or equivalently, with frequencies
between 300 MHz (0.3 GHz) and 300 GHz. They appear between radio waves and infrared on
the electromagnetic spectrum. Because of their longer wavelengths, compared to the visible and
infrared, microwave radiation can penetrate the lunar surface. Thus, unique information about
subsurface feature can be derived from this data set. Further, microwave sensors can operate at
any time of day/night conditions. This property allows us to study lunar dark region, which do
not receive the sunlight. Because of the longer wavelengths, the roughness level is different from
optical region. Therefore, many of features which are smooth or rough could be analyzed using
microwave data. For example: crater ejecta properties, radar bright craters, terrain roughness at
cm to meter level, lunar surface morphology etc. This tutorial covers the description of
microwave sensors for lunar surface studies, target interaction and image description and some
of the demonstrated applications using microwave data for lunar science.
Microwave Remote Sensing Techniques:
Remote sensing techniques in the microwave region of electromagnetic spectrum can be
classified into two categories namely: active microwave remote sensing systems provide their
own illumination, whereas passive systems measure the electromagnetic energy of thermal origin
emitted from materials.
The sensors used in microwave remote sensing are of the following types:
Active Sensors
A. Imaging Sensors: Most imaging radars used for remote sensing are side looking airborne
radars. They are divided into two categories namely: Side Looking Airborne Real Aperture
Radar (SLAR) and Synthetic Aperture Radar (SAR). In the real aperture system, resolution is
determined by the actual beam width, which is determined by the antenna size. Synthetic
aperture system utilizes signal processing techniques to achieve narrow beam width in the along
track direction which provides better resolution.

B. Non Imaging Sensors: Non imaging remote sensing radars are scatterometers, altimeters
or surface penetrating radar. Any calibrated radar that measures the scattering properties of a
surface is called scatterometer. Thus a scatterometer may be radar specifically designed for
backscatter measurements. A radar altimeter is designed for measuring surface height. A radar
altimeter sends out pulses of microwave signals and record the signal scattered back from the
earth surface. The height of the surface can be measured from the time delay of the return
signals. A ground penetrating radar measures properties of material below the surface, which
works on same principle as altimeter but at very low frequency.
Passive sensors:
Passive microwave sensing is similar in concept to thermal remote sensing. All objects emit
microwave energy of some magnitude, but the amounts are generally very small. A passive
microwave sensor called microwave radiometer detects the naturally emitted microwave energy
within its field of view. This emitted energy is related to the temperature and dielectric properties
of the emitting object or surface, with modulation by intervening atmosphere. Passive microwave
sensors are typically radiometers or scanners, where an antenna is used to detect and record the
microwave energy. Passive microwave sensors do not contain transmitting device thus passive
sensors typically require less power to operate. To reduce the noise level of the measurements
they typically operate over a broader frequency range (band) than do radar sensors, which tend to
be narrow band. Further resolution is coarser than active sensors. Thus, global properties are
being deduced from these sensors.
Target Interaction and radar Image Appearance
The intensity of an object in radar image is dependent on the portion of the transmitted energy
that is returned back to the radar from targets on the surface. The magnitude or intensity of this
backscattered energy is dependent on how the radar energy interacts with the surface, which is a
function of several variables or parameters. The radar parameters for interaction are frequency,
polarization, viewing geometry, etc. whereas surface properties like surface roughness or
dielectric properties also influence the intensity. Because many of these characteristics are
interrelated, it is difficult to separate out each of their individual contributions to the appearance
of features in a radar image. The major component of controlling factors influencing radar
intensity is:
• Surface roughness of the target
• Radar viewing and surface geometry relationship
• electrical properties of the target
The surface roughness of a feature controls how the microwave energy interacts with that surface
or target and is generally the dominant factor in determining the tones seen on a radar image.
Surface roughness refers to the average height variations in the surface cover from a plane
surface, and is measured on the order of centimeters. Whether a surface appears rough or smooth
to radar depends on the wavelength and incidence angle. There are four type of scattering
mechanism:
1. Smooth surface
2. Rough surface

3. Double-bounce
4. Volumetric scattering
Smooth surface:
The smooth surface has tendency to return minimum signal towards radar. This is because of the
region that most of the scatter from a smooth surface is in the forward direction, away from the
radar.
Fig 1: Smooth surface
Thus, backscatter from a smooth surface will tend to be very low (say less than-20dB) and will
appear dark in the radar image.
.
Rough Surface
The scattering from rough surface is in all direction and some of the energy is reflected back
towards the radar. In general, the rougher the surface is, the higher the backscatter. Backscatter
from a rough surface will tend to be greater than -20dB and will appear gray to bright in the
radar image.
Fig 2: Rough surface scattering
Surfaces may be rough at different scale lengths. Comparing the scale length with the radar
wavelength we can get an idea whether the surface will appear rough to the radar and thus
whether it will give high or low backscatter. Roughness is a relative concept depending upon
wavelength and incidence angle. A surface is considered "rough" if its surface structure has
dimensions that are comparable to the incident wavelength.

According to the Rayleigh criterion, a surface is considered smooth if:
and considered rough if:
Double-bounce
The third type of scatter is from two surfaces, one flat on the ground (horizontal), the other
upright (vertical). The reflected signal hits both surfaces one after the other.Double-bounce
backscatter will tend to be fairly high (HH, VV greater than-10dB) and will appear light gray to
bright in radar image.
Fig 3: Double bounce
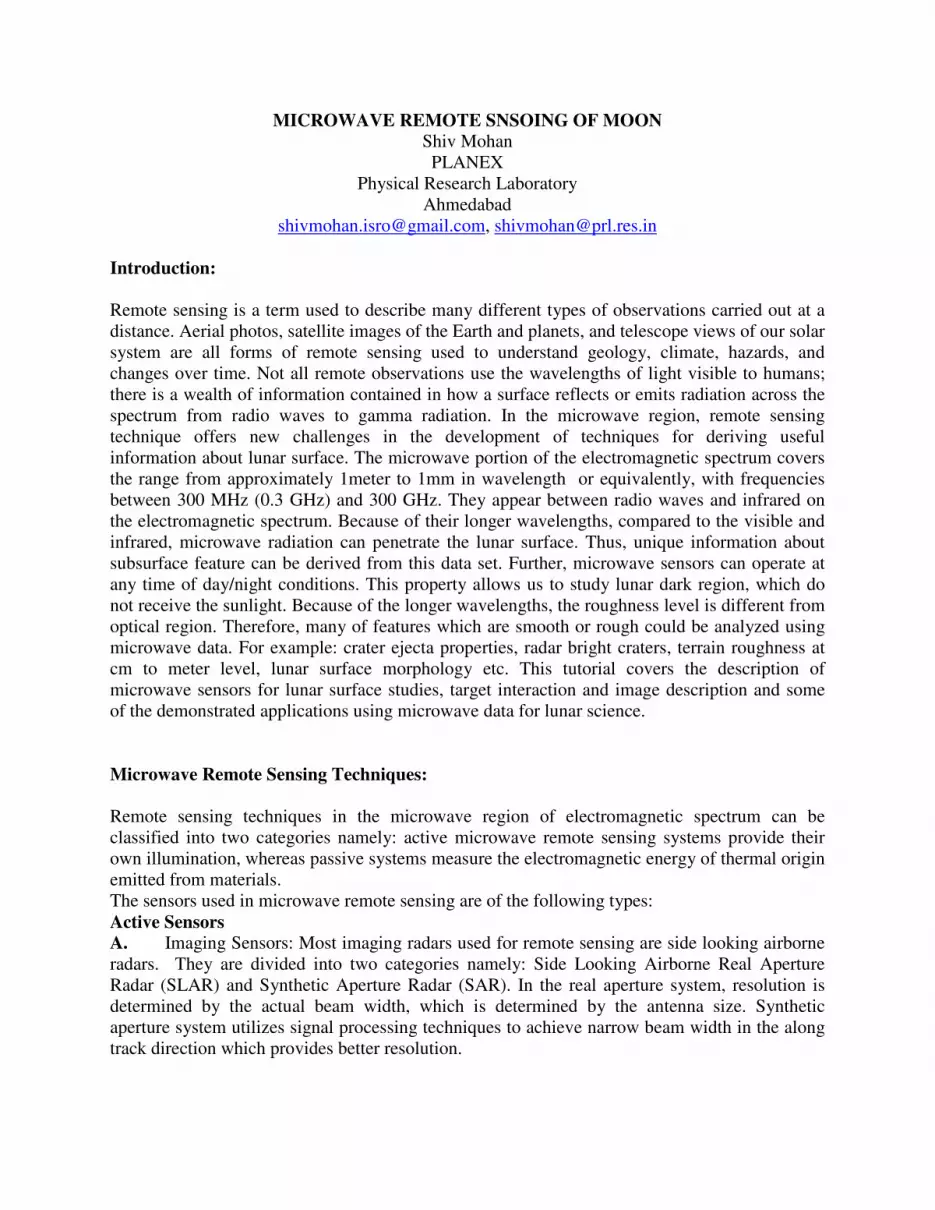
Volumetric scattering
The fourth type of scatter is from a layer of randomly oriented scatterers, which is common in
lunar surface with subsurface scattering centers as boulders or small blocks. The radar signal
penetrates the regolith, then is scattered after hitting one of the randomly oriented boulders in
the underlying surface. Signal is depolarized randomly in volumetric scattering.
.
Fig 4: Volume scattering
Radar penetration Properties:
The penetration depth of microwave signal is the depth below the surface at which 1/e (nearly
37%) of the surface power density of a perpendicular incident wave remains in a half space of
the material at given frequency. The formula for penetration depth is given by:
Depth of penetration= (LEMDA* SQRT (E’))/ (2*Pi*E’’)
Where lemda is the wavelength of the wave, E’is the real part of dielectric constant whereas E’’
is the imaginary part of dielectric constant of material.
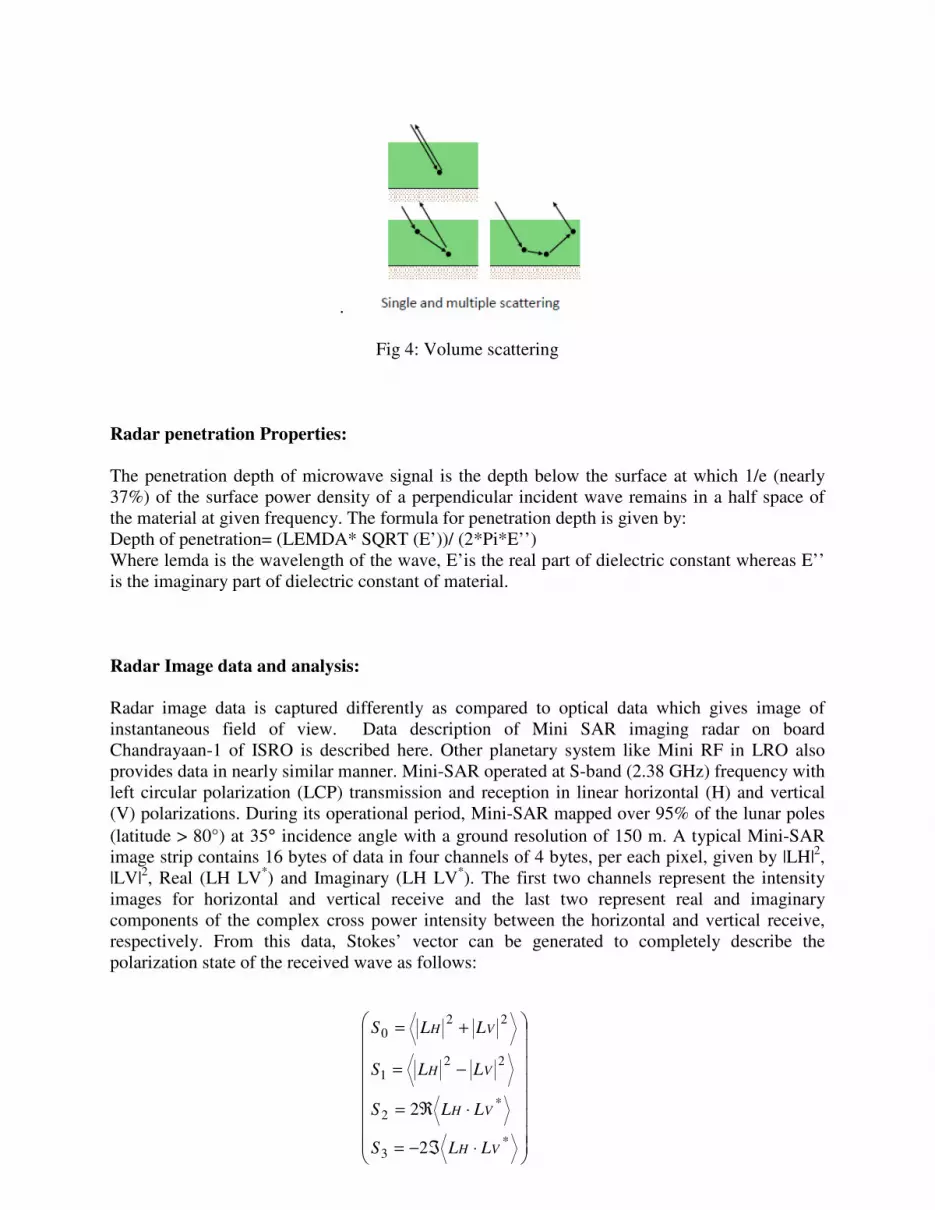
Radar Image data and analysis:
Radar image data is captured differently as compared to optical data which gives image of
instantaneous field of view. Data description of Mini SAR imaging radar on board
Chandrayaan-1 of ISRO is described here. Other planetary system like Mini RF in LRO also
provides data in nearly similar manner. Mini-SAR operated at S-band (2.38 GHz) frequency with
left circular polarization (LCP) transmission and reception in linear horizontal (H) and vertical
(V) polarizations. During its operational period, Mini-SAR mapped over 95% of the lunar poles
(latitude > 80°) at 35° incidence angle with a ground resolution of 150 m. A typical Mini-SAR
image strip contains 16 bytes of data in four channels of 4 bytes, per each pixel, given by |LH|2,
|LV|2, Real (LH LV
*) and Imaginary (LH LV
*). The first two channels represent the intensity
images for horizontal and vertical receive and the last two represent real and imaginary
components of the complex cross power intensity between the horizontal and vertical receive,
respectively. From this data, Stokes’ vector can be generated to completely describe the
polarization state of the received wave as follows:
⋅ℑ−=
⋅ℜ=
−=
+=
*3
*2
221
220
2
2
VH
VH
VH
VH
LLS
LLS
LLS
LLS

The first stokes’ parameter (S0) represents the total intensity image. The Stokes’ parameters and
derived daughter products such as the Circular polarization ratio, degree of linear polarization
and relative phase to describe the backscattered field, distinguish volume scattering from other
scattering mechanisms. These parameters form the basis of deriving information about the
surface.
Typically S0 is used for the investigation of visual product. Lunar surface is marked by
numerous impact craters of different magnitude as it has been bombarded by meteorites
throughout its’ geological evolution. The craters may be categorized as simple craters or
complex craters depending on their size and morphology. Simple craters are bowl-shaped
depressions constituting impact melt and breccias and are surrounded by a rim of impact ejecta
composed of solidified and fragmented rocks and with diameters typically less than 15
kilometers. Complex craters on the other hand, are larger in size and have more complex forms,
including shallow, relatively flat floors, central uplifts, and slump blocks and terraces on the
inner wall of the crater rim. The complex craters may have a number of simple craters on their
floors, called secondary craters
• Degree of polarization: (indicator of polarized and diffused scattering; fundamentally
related to entropy)
0
2
3
2
2
2
1S)SSS(m ++=
• Degree of linear polarisation: (indicator of volume vs subsurface scattering)
0
2
2
2
1S)SS(m
L+=
• Degree of circular polarisation:
03SSm
C=
• Circular polarisation ratio: (indicator of scattering associated with planetary ice
deposits and fresh ejecta)
( ) ( )3030
SSSSC
+−=µ
• Linear polarisation ratio:
( ) ( )2020
SSSSL
+−=µ
• Relative RH – RV phase: (sensitive indicator of ‘double bounce’ scattering)
( )S/Sarctan=δ

Very High Backscatter
due to low local incidence angle of the
crater wall
Low Backscatter
due to diffuse
scattering
Relatively high
Backscatter due to
roughness of ejecta
matter
(1) (2) (3)
Impact melt and Impact melt and
brecciabrecciaFractured Fractured
bedrockbedrock
Impact ejectaImpact ejectaImpact melt and Impact melt and
brecciabrecciaFractured Fractured
bedrockbedrock
Impact ejectaImpact ejecta
Radar look direction
Simple crater
Very High Backscatter
due to low local incidence angle of the
crater wall
Low Backscatter
due to diffuse
scattering
Relatively high
Backscatter due to
roughness of ejecta
matter
(1) (2) (3)
Impact melt and Impact melt and
brecciabrecciaFractured Fractured
bedrockbedrock
Impact ejectaImpact ejectaImpact melt and Impact melt and
brecciabrecciaFractured Fractured
bedrockbedrock
Impact ejectaImpact ejecta
Radar look direction
Simple crater
Fig 5: Schematic diagram of a simple impact crater showing relative magnitude of radar
backscatter from different zones with respect to Mini-SAR imaging geometry
Fig 6: Variability of Rh and Rv backscatter
Due to dependence of radar backscatter on surface roughness and dielectric properties of the
surface, data can provide a wealth of additional information about physical and electrical
properties of the lunar surface. The roughness parameter helps in identifying morphological
features more prominently. The electrical properties help in identifying surface material property
to some extent. Young, fresh craters are distinctive in radar images obtained with the Mini SAR
because of the surface roughness associated with their ejecta deposits. Variations in radar
backscatter can also serve as an indication of topographic variability. This is related to the
orientation of slopes with respect to the look direction of the radar instrument. This aspect of
Rh and Rv Backscatter along a Transect
-30
-25
-20
-15
-10
-5
0
1 501 1001 1501 2001 2501
Pixels along the Transect
Ba
ck
sc
att
er
(dB
)
Sigma_Rh
Sigma_Rv

radar data is particularly advantageous for examining the morphology of interior and exterior
deposits associated with complex craters.
Polarimetric parameters and Planetary Ice detection algorithm:
Stokes parameters as described earlier, are very useful tools to study the scattering properties of
various features on lunar surface. The magnitude and sense of polarization of reflected signal
associated with various lunar morphological features as well as water ice inside the craters was
examined using mini SAR data. Traditionally, the key parameter used to determine if ice is
present is the CPR. This quantity is equal to the magnitude of the same sense (i.e. the left or right
sense of the transmitted circular polarization) divided by the opposite sense polarization signals
that are received. CPR was used in the present study to find the evidence of subsurface scattering
due to dielectric in homogeneity like water ice. Volumetric water-ice reflections are known to
have CPR greater than unity, while surface scattering from dry regolith has CPR less than unity
The decomposition of m-δ feature space is a novel way to derive information about ‘surface’,
‘diffused’ and ‘double-bounce’ scattering contributions corresponding to a target or a radar
resolution cell. The m-δ decomposition is achieved through the elements of stokes vectors only.
The expressions used to decompose the m-δ feature space into surface, double-bounce and
volume scatterers are given in following equation:
( )
( )
−×=
+××=
−××=
−
)1(
)sin(1
)sin(1
0
0
0
mSf
mSf
mSf
volume
bouncedouble
surface
δ
δ
where S0, the first element of the Stokes vector, which is the total received power.New
decomposition methods like m-chi have been shown to improved decomposition, where delta is
replaced by chi-value. .Other algorithm is m-chi decomposition which works better.
The problem with CPR alone for water ice detection is that higher values can be obtained from
very rough surfaces, such as a rough, blocky lava flow, which has angles that form many small
corner reflectors. In this case, radar signal could hit a rock face (changing LCP into RCP) and
then bounce over to another rock face (changing the RCP back into LCP) and hence to the
receiver. This “double-bounce” effect also creates high CPR in that “same sense” reflections
could mimic the enhanced CPR one gets from ice targets. Hence, the CPR values estimated from
mini-SAR are analyzed along with m and δ values for indicating presence of water ice.
Following Fig shows typical craters with water ice in South Pole region:

Fig 7: Polar craters with water ice (green) and fresh craters (Red)
Radar sounder data and application:
Subsurface structure of the Moon, at a depth from a few meters to hundreds of meters, not only
provides important information concerning significant questions about the geologic and thermal
history of the Moon, but also is critical for quantifying potential resources for future lunar
exploration and engineering constrains for human outposts. Direct probing of planetary
subsurface to about kilometer depths is made possible by the use of low frequency sounding
radar. This method was used for the first time to characterize the structure of the lunar subsurface
during the Apollo 17 mission in 1972 (ALSE experiment. Data acquired during two equatorial
orbits revealed a clear layering of lava fills in two lunar Marias: Mare Imbrium and Mare
Serenitatis. Recently, with a renewed interest in radar sounding of lunar surface, JAXA’s orbital
mission SELENE has used lunar radar sounder ( LRS) for sounding the subsurface structures of
moon using frequency of 5 MHz The low frequency radar method makes it possible to realize
the mapping of the subsurface structure within a depth of several km with a range resolution of
less than 100 m for a region with a horizontal scale of several tens of km. Kaguya LRS is a
Frequency Modulated Continuous Wave (FMCW) radar of HF band. The observation frequency
is linearly swept from 4 MHz to 6 MHz in a 200 microsecond period. Pulse repetition frequency
is 20 Hz. The transmission power is 800 W. The nominal observation altitude was 100 km.

Fig 8: Schematic view of radar sounder
Types of reflections expected from sub-surface are (a) Strong reflect ion - Caused by flat surface
structures like atmosphere and surface (b) Weak reflect ion: caused by small objects on the
ground mostly boulders on lunar surface is hyperbolic in nature and (c) Weak reflection: sub
surface flat structure, which are Horizontal and linear as shown in the following figures.
Fig 9: Type of reflections
The reason for the distinct nature of the hyperbolic reflected signal is explained in the figure
given below.

Fig 10: Parabolic shape of received signal
When signal is reflected from a surface, the object which is ahead of radar takes more time for
reaching the receiver. When the antenna passes over the target, travel time for the echo gets
reduced and it becomes more once it crosses the target. Thus, objects from such targets take the
shape of hyperbole as shown in the data. For a long reflector in the subsurface region, a
continuous discontinuity is observed due to dielectric discontinuities. Travel time is converted to
depth by knowing the dielectric value of the medium.
Fig 11: Typical radargram obtained from LRS . Vertical distance denotes the depth whereas
horizontal distance denotes the travel direction in Km
Passive microwave data and applications:
Passive microwave radiometry measures the natural thermally emitted radiation from an object
above absolute zero degree Kelvin. A passive microwave instrument called radiometer receives
the emitted radiation from the surface measured in terms of brightness temperature. The
brightness temperature of a target depends on its physical temperature, surface geometry, and
dielectric and extinction properties. Retrieval of a geophysical quantity from space borne
radiometer data is possible if the effects of other parameters to the brightness temperature can be
eliminated. The instruments used for the measurement of brightness temperature are called
radiometers.
Due to dependence of emissive properties on temperature and depth of lunar regolith, it becomes
possible to estimate surface and subsurface temperature as well as depth of regolith using passive
microwave radiometer. The first microwave radiometer for lunar surface study was from China’s
lunar probe Chang’E-1 carrying a passive multi-frequency microwave radiometer, which was
launched on 24th
Oct 2007. The four channel sensor was operated at 3.0 GHZ, 7.8 GHz, 19.35

GHz and 37 GHz with lower frequencies having typically more depth of penetration. After this,
Chang’E-2 probe was launched on 1st Oct 2010. Data is analyzed by Chinese team for surface
temperature, sub surface temperature measurements. In addition, regolith depth measurements
are also done. It was converted to He3 concentration estimation using models. A typical
simulation of brightness temperature is shown in following Fig:
Fig 12: Typical expected brightness temperature from Lunar surface
Lunar orbital microwave sensors:
Microwaves have been exploited for optimum remote sensing applications of various planetary
body since early days of microwave application development. Various sensors like SAR,
scatterometer, altimeter, ground penetrating radar and radiometer have been used for the study of
various planetary bodies. Radar systems for planetary remote sensing had been used since early
1972 with the first altimeter in Venera-8 for the measurements. In the lunar remote sensing
studies, Japanese obiter, SELENE was the first sensor carried surface penetration radar sensor
for studying the subsurface structures below the surface of moon in the year 2007. Knowledge of
the subsurface structure is crucial to better understanding, not only of the geologic history of the
moon, but also of the moon’s regional and global thermal history of the moon and of the origin
of the Earth-Moon system. A number of structures were found in the lunar region and mapped.
Among the passive sensors, Chinese Chang’E-1/2 satellite with a four channel microwave
radiometer was the first instrument. Its primary goal was to detect the thickness of lunar regolith
and to assess the content of helium 3.

SAR imaging of lunar surface was done first time by Channdrayaan-1 Mini SAR. The main
purpose of instrument was to detect water ice signature in lunar polar region. Chandrayaan-1 was
the first lunar orbital satellite carrying a SAR payload. The Mini-SAR was flown on
Chandrayaan-1 mission on 22nd October 2008 with an objective to gather data on the scattering
properties of terrain in the polar regions of the Moon. Additionally, the SAR was designed to
collect information about the scattering properties of the permanently dark areas near the lunar
poles at optimum viewing geometry, which are invisible to normal imaging sensors and thereby
detect the presence of water ice in the permanently shadowed regions on the lunar poles up to a
depth of a few meters. The Mini SAR sensor was operated at S-band (2.38 GHz frequency) with
transmission in left circular polarization (LCP) and reception in linear horizontal (H) and vertical
(V) polarizations. The instrument illuminated the surface of moon at 35-degree incidence angle
with a ground range resolution of 150 meter and 18 km range swath. Typical image strip
consisted of approximately 300 km by 18 km size. Lunar reconnaissance Obiter (LRO) in 2009
also carried Mini-RF instrument is dual-polarized synthetic aperture radar, which transmits in
circular polarization (left-hand polarization for both instruments) and receives two coherent
orthogonal linear Polarizations (H and V). LRO mission reconfirmed the availability of water ice
in polar region of lunar surface.
With enormous useful data from previous lunar orbital mission has provided much useful
information about lunar surface. Specific among them are lunar water ice in polar region,
regolith depth, surface temperature, and so on. Within such newly available information, there
are already plans for further strengthening the information derived from these missions.
Important missions in near immediate future are: Lunar dual frequency SAR from ISRO’2
Chandrayaan-2, dual frequency sunder in ESMO (European student moon orbiter).

SUGGESTED READINGS
Bell, J.F., B.A. Campbell, and M.S. Robinson,
Planetary geology, Manual of remote sensing, Vol. III, 509-564, (1999)
F.T Ulaby
Microwave remote sensing; active and passive, Adison Wesley Publications (2000).
Roger Sullivan
Microwave radar imaging and advanced concepts, Artech House (2000)
Bruce A. Campbell
Radar Remote Sensing of Planetary Surfaces, Cambridge University Press, (2002)
Woodhouse, Iain H.
Introduction to Microwave Remote sensing, CC Press (2005)
Neil Skou
Microwave radiometer systems; design and analysis, Artech house, Boston (2006)
C. Matzler
Thermal microwave radiation; applications for remote sensing, IET (2006)
Harold Mott
Remote sensing with polarimetric radar, CRC Press (2007).
Jong -sen Lee
Polarimetric radar imaging: from basic to applications, CRC Press (2009)
Shiv Mohan and Anup Das, Chandrayaan-1 Mini SAR data investigation, LAP Lambert
Academic Publishing (2012)