microscopic evaluation of binderless granulation in a pressure swing granulation fluidized bed
TRANSCRIPT

Chemical Engineering Science 98 (2013) 51–58
Contents lists available at SciVerse ScienceDirect
Chemical Engineering Science
0009-25http://d
n CorrE-m
noor_fit
journal homepage: www.elsevier.com/locate/ces
Microscopic evaluation of binderless granulation in a pressure swinggranulation fluidized bed
Noor Fitrah Abu Bakar a,n, Ryohei Anzai b, Masayuki Horio b
a Faculty of Chemical Engineering, Universiti Teknologi MARA, 40450 Shah Alam, Selangor, Malaysiab BASE, Tokyo University of Agriculture & Technology, 2-24-16 Nakacho, Koganei, Tokyo 184-8588, Japan
H I G H L I G H T S
� Plastic deformation of binderless granules using MPIA.
� Realistic values for DEM spring constant and coefficient of restitution using MPIA.� DEM simulation of granules to estimate collision force and collision frequency.� Densification phenomena in PSG fluidized bed.a r t i c l e i n f o
Article history:Received 28 December 2012Received in revised form16 April 2013Accepted 26 April 2013Available online 9 May 2013
Keywords:AgglomerationFluidizationDEMCollision frequencyPressure Swing Granulation (PSG)Densification
09/$ - see front matter & 2013 Elsevier Ltd. Ax.doi.org/10.1016/j.ces.2013.04.048
esponding author. Tel.: +603 55436264; fax: +ail addresses: [email protected],[email protected] (N.F. Abu Bakar).
a b s t r a c t
To develop a microscopic understanding of the role of cyclic fluidization and compaction in makingspherical and dense granules by Pressure Swing Granulation, numerical simulation was conducted withour private code (SAFIRE21) using realistic parameter values determined by a micro-particle interactionanalyzer. The values of the spring constant and coefficient restitution obtained from this experimentalmeasurement were 300–790 N/m and 0.9 respectively. The results obtained by the discrete elementmethod simulation showed that collision frequency and collision force in a fluidized bed wereinsufficient to cause deformation of the granules but were significant in shaping the granules spherically.
& 2013 Elsevier Ltd. All rights reserved.
1. Introduction
To prevent the ncontrolled agglomeration and adhesion of finepowders while maintaining reactivity and other advantages ofparticle size reduction, Nishii et al. (1993) invented Pressure SwingGranulation (PSG), in which they applied several hours of cyclicfluidization and compaction to fine cohesive powders (i.e. inor-ganic powders less than ∼6 μm and/or organic powders less than∼8 μm, in diameter) (Nishii and Horio, 2007) in an apparatusequipped with a bag filter to recycle entrained fines back to thebed. As summarized by Horio (2003), agglomerates produced byPSG are more spherical, denser and narrower in size distributionthan those found in ordinary dry agglomerating fluidized beds.The main feature of PSG agglomerates is that they can hold their
ll rights reserved.
603 55436300.
shape during processing but can be shaped, when necessary, intotablets or anything without much energy.
Accordingly, PSG has a strong advantage in material processessuch as hard metal cutting tool manufacturing and pharmaceuticalprocesses. The mechanism behind the differences between PSGand ordinary dry agglomerating fluidization could be (1) collisionof agglomerates in the bed, (2) compaction during the reverse flowperiod and (3) the force acting on the powder on the bag filter.
To explain the mechanism of dry agglomeration and to predictthe agglomerate size, Iwadate and Horio (1998) derived a math-ematical model (the I–H model) assuming that the equilibriumagglomerates size is determined by the balance between the bedexpansion force right above the bubble nose and the cohesiveforce between adjacent agglomerates. The I–H model has beenfound to predict agglomerate size better than previous modelsderived by Chaouki et al. (1985) and Morooka et al. (1988) as longas observed data are available for agglomerate density and tensilestrength, although the model is still too macroscopic to deal withthe distributed flow and stress fields in a bed. Since then, no

Table 1Granulation conditions.
Powder batch mass 120 gPowder density 1530 kg/m3
Air temperature AmbientAir velocity 0.345 m/sDuration of fluidization 15 sDuration of compaction 1 sCompaction pressure 0.03 MPaGGranulation time 120 min
Table 2Specification of MPIA.
Force transducer xyz stage Piezo actuator
Maximum loading force: 5 mN Distance: 76.5 mm Distance: 25 μmResolution: 0.1 μm Resolution: 2 μm Resolution: 0.1 nmSensivity: 0.5 mN/V Speed: 7.7 μm/s Speed: 50 nm/s
Supp
ort
8
12
4 3
9
N.F. Abu Bakar et al. / Chemical Engineering Science 98 (2013) 51–5852
successful achievements have been made in developing simplecorrelations for granule density and strength of dry agglomerationalthough investigations into the details of agglomeration, densifi-cation and breakage have made rapid progress (Antonyuk et al.,2005, 2006; Subero and Ghadiri, 2001; Samimi et al., 2005).However, coming back to PSG, there has been no substantialinvestigation into the special features that distinguish PSG fromordinary dry agglomeration. Thus, the question of why PSGagglomerates have such high sphericity and density is still freshwaiting an answer.
The objective of the present work is to investigate the densi-fication process during particle-to-particle contact and to investi-gate where in the system such densification takes place bychecking the effect of collisions by the discrete element method(DEM) with an extended 3D version of SAFIRE (Mikami et al., 1998)
To obtain useful information in DEM simulation, the size andother properties of particles should be as close as possible to thosein fluidized beds, which cannot be realized with atomic forcemicroscope (AFM) for particles much smaller than those inordinary fluidized beds even when colloid probes of 1–50 μm areapplied. Moreover, AFM has limitations in its technical aspectssuch as cantilever stiffness, piezo movement range and photo-diode detector range as summarized in Tykhoniuk et al. (2007). Tocope with such limitations, a new experimental device called as amicro-particle interaction analyzer (MPIA) has been developed tohandle a variety of measurements of particle-to-particle andparticle-to-wall interactions for particle sizes between 500 μmand 5 mm, validated by elastic deformation for spherical particlecontacts and applied for PSG granules to obtain plastic deforma-tion characteristics as well as parameters for the DEM simulation.
5
6
1. Force transducer2. Glasstube3 P
6. xyz stage7. xyz stage controller83. Particles
4. Stainless steel plate5. Automated piezostage
8. Data logger and programmed controller
9. Microscope
7
Fig. 2. Micro‐particle interaction analyzer.
2. Experimental
2.1. Preparation of test granules by Pressure Swing Granulation(PSG)
Fig. 1 shows a schematic of the PSG apparatus and pressureswing, that is, fluidization and compaction cycle conditions. Thefluidized bed column was made of stainless steel. The internaldiameter of the column was 0.108 m in its lower part and 0.151 min its upper part, where a bag-filter 0.07 m in diameter and0.157 m long was hung from the top flange.
Binderless lactose granules having particles with median dia-meter of 1.58 μmwere prepared. The powder was charged into thePSG column through a sieve to adjust the initial agglomerate sizesby disintegrating large agglomerates. The granulation process wasconducted under the conditions shown in Table 1 and 2. Granules
Fig. 1. Schematic diagram of the PSG equipment. (a) apparatus and (b) condition.
were sieved and granules 850 μm in diameter were classified.These granules were used for experimental work using the MPIA.
2.2. Plastic deformation using the micro-particle interactionanalyzer (MPIA)
As illustrated in Fig. 2, the MPIA consists of a force transducersystem mounted on a vertical support and placed at theupper section with the output glass tube pointing downwardand an automated piezo stage mounted on an x,y,z movable stagetogether with a manual controller to adjust the initial positions ofsamples. Their specifications are listed in Table 2. For the forcedeformation measurement, a programmed controller was installedfor the piezo stage in a computer, directing its upward anddownward movement automatically. These devices were comple-tely housed in a box which was placed on an anti-vibration plate.A microscope was used as a visual aid to ensure the orientation ofparticles before contact was normal.
When the piezo stage was raised and contact was detected, thevoltage outputs of the force transducer were increased from aconstant value to a specified value of loading force. When thespecified loading force was achieved during loading, unloading

N.F. Abu Bakar et al. / Chemical Engineering Science 98 (2013) 51–58 53
responded automatically and piezo stage started to move down-ward to its initial position. The voltage outputs of the forcetransducer and piezo displacement were multiplied by the cali-brated coefficients to obtain a force displacement curve.
The force–displacement measurement was conducted by thefollowing steps:
1.
A granule is attached to the glass tube of the force transducer(upper granule) and another on the piezo stage (lower granule)using the same glue, cyanoacrylate adhesive (Aron alpha) inboth cases.2.
The piezo stage is adjusted by using the movable stagecontroller to locate the two granules perpendicular to oneanother.3.
The distance between the two particles and the orientation ofthe particles are checked with the aid of an optical microscope.4.
The maximum loading force is specified in the programmedcontroller.5.
The measurement is conducted automatically to obtain a dataset for loading force Fn versus total displacement δtotal.Since the total deformation δtotal for a case granule-to-granulecontact is the sum of deformations δ1, δ and δ2 defined in Fig. 3(a),and since the total deformation for a single granule case δ total(single)
is the sum of deformations δ1 and δ2 as illustrated in Fig. 3(b), theplastic deformation, δ for the granule-to-granule contact area canbe calculated by subtracting δ total(single) from δtotal. Thus we write
δ¼ δtotal−ðδtotalðsingleÞÞ ð1Þ
This method can be allowed when deformations are limitedlocally around each contact point. Since granules are not purelyelastic, a thin layer of glue was partially coated on the granulessurface to create an elastic layer before attaching the granules ontothe glass tube and the base of the stainless steel plate. In thismeasurement, a maximum of successive loading force of 0.5 mNwas applied on the same pair of granules for more than 10 times.
To demonstrate reliability of the MPIA as a contact measure-ment unit, elastic deformation and liquid bridge interactionmeasurement were performed in a previous work (Abu Bakaret al., 2009). Elastic deformation measurements were conductedfor two elastic particles, namely polypropylene and lead. Thespecified maximum loading forces were varied between 0.1, 0.2,
Force transducer
pd
Glass tube
Glue
Stainless steel plate
δ total = δ1 + plastic deformation, δ + δ2
Movement of piezo
δ1
δ
Fig. 3. Determination of plastic deformation for (a) total deformatio
0.5, and 1 mN, whereby the experimental results from MPIA aswell as the force–displacement curves obtained from the Hertzequation i.e. Eq. (2) showed good agreement for both particles(Hertz, 1882).
Fn ¼ αδ1:5 ð2Þ
α¼ E3
ffiffiffiffiffidp
pð1−ν2Þ : coefficient of elasticity
!
The MPIA was also tested in measuring liquid bridge interactionbetween two glass beads and different viscosities of silicone oil. Itwas found that the experimental data of dimensionless criticaldistance of silicone oils, Hc are in very close agreement with thetheoretical model as in Eq. (3).
Hc ¼hcR
¼ ð0:5θ þ 1ÞffiffiffiffiV3
pð3Þ
3. Numerical simulation
To investigate the effect of collisions between particles in thePSG fluidized bed, DEM simulation was conducted using ourprivate code SAFIRE21 for 3D simulation, which was developedby Tagami et al. (2009) from the established SAFIRE code for 2Dsimulation (Mikami et al., 1998). The collision frequency (numberof collisions undergone by a single particle per second) and thecollision force between particles were calculated in this study.
The coefficient of restitution in DEM simulation was chosen as0.9. The Hookean spring constant k was determined from theexperimental force–displacement curve using MPIA when theparticles contacts were shifted to the elastic region after 15successive loadings. The deformation treated using Eq. (1) withthe respective loading force was calculated and the obtained valuewas varied between approximately 300 and 790 N/m.
Computation conditions in DEM are shown in Table 3. Thedensity and diameter of the particles are the same as the granulesproperties obtained using PSG. In this case, the particle size used is500 μm because the granules size distributions obtained are verynarrow and less than 500 μm (cf. Fig. 5). The gas velocity adoptedis also the same value as in the experiments. The spring constant kis varied between 400, 700, and 1500 N/m. Thus, the time step
lasticeformation,δ
2
δ total(single) = δ1+δ2
δ1
δ2
n for two granules and (b) total deformation of single granule.
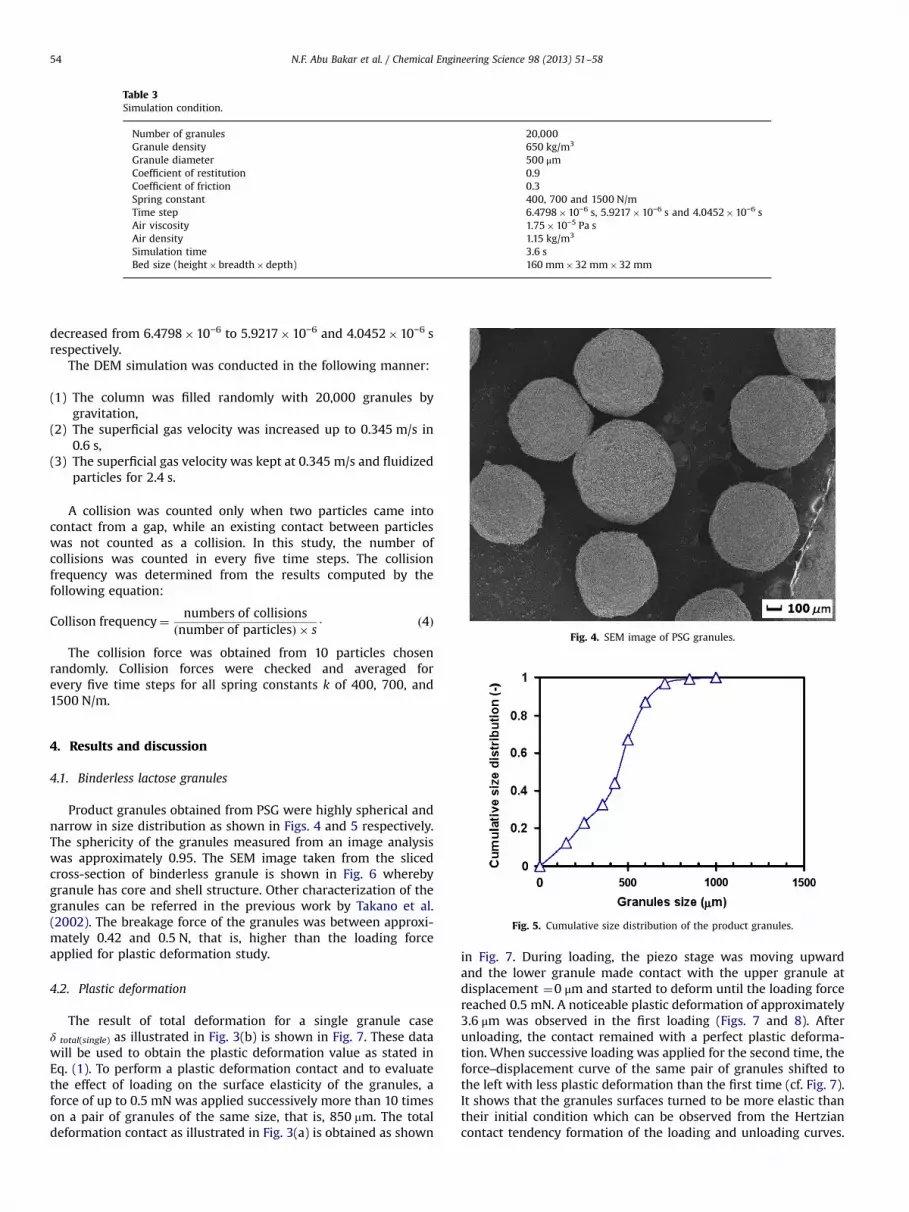
Table 3Simulation condition.
Number of granules 20,000Granule density 650 kg/m3
Granule diameter 500 μmCoefficient of restitution 0.9Coefficient of friction 0.3Spring constant 400, 700 and 1500 N/mTime step 6.4798�10−6 s, 5.9217�10−6 s and 4.0452�10−6 sAir viscosity 1.75�10−5 Pa sAir density 1.15 kg/m3
Simulation time 3.6 sBed size (height�breadth�depth) 160 mm�32 mm�32 mm
N.F. Abu Bakar et al. / Chemical Engineering Science 98 (2013) 51–5854
decreased from 6.4798�10−6 to 5.9217�10−6 and 4.0452�10−6 srespectively.
The DEM simulation was conducted in the following manner:
(1)
The column was filled randomly with 20,000 granules bygravitation,(2)
The superficial gas velocity was increased up to 0.345 m/s in0.6 s,(3)
The superficial gas velocity was kept at 0.345 m/s and fluidizedparticles for 2.4 s.Fig. 4. SEM image of PSG granules.
A collision was counted only when two particles came intocontact from a gap, while an existing contact between particleswas not counted as a collision. In this study, the number ofcollisions was counted in every five time steps. The collisionfrequency was determined from the results computed by thefollowing equation:
Collison frequency¼ numbers of collisionsðnumber of particlesÞ � s
⋅ ð4Þ
The collision force was obtained from 10 particles chosenrandomly. Collision forces were checked and averaged forevery five time steps for all spring constants k of 400, 700, and1500 N/m.
Fig. 5. Cumulative size distribution of the product granules.
4. Results and discussion
4.1. Binderless lactose granules
Product granules obtained from PSG were highly spherical andnarrow in size distribution as shown in Figs. 4 and 5 respectively.The sphericity of the granules measured from an image analysiswas approximately 0.95. The SEM image taken from the slicedcross-section of binderless granule is shown in Fig. 6 wherebygranule has core and shell structure. Other characterization of thegranules can be referred in the previous work by Takano et al.(2002). The breakage force of the granules was between approxi-mately 0.42 and 0.5 N, that is, higher than the loading forceapplied for plastic deformation study.
4.2. Plastic deformation
The result of total deformation for a single granule caseδ total(single) as illustrated in Fig. 3(b) is shown in Fig. 7. These datawill be used to obtain the plastic deformation value as stated inEq. (1). To perform a plastic deformation contact and to evaluatethe effect of loading on the surface elasticity of the granules, aforce of up to 0.5 mN was applied successively more than 10 timeson a pair of granules of the same size, that is, 850 mm. The totaldeformation contact as illustrated in Fig. 3(a) is obtained as shown
in Fig. 7. During loading, the piezo stage was moving upwardand the lower granule made contact with the upper granule atdisplacement ¼0 μm and started to deform until the loading forcereached 0.5 mN. A noticeable plastic deformation of approximately3.6 μm was observed in the first loading (Figs. 7 and 8). Afterunloading, the contact remained with a perfect plastic deforma-tion. When successive loading was applied for the second time, theforce–displacement curve of the same pair of granules shifted tothe left with less plastic deformation than the first time (cf. Fig. 7).It shows that the granules surfaces turned to be more elastic thantheir initial condition which can be observed from the Hertziancontact tendency formation of the loading and unloading curves.

Dense shell
Core
Fig. 6. SEM image of binderless granule cross‐section.
0.5
0.6123
4-15Deformation ofsingle granule(cf.Fig.3(b))
0.3
0.4 Deformation ofgranule-granule(cf.Fig.3(a))
0.2Forc
e [m
N]
Loading
0
0.1
Unloading
0 1 2 3 4 5 6 7Displacement [μμm]
Fig. 7. Deformation of two PSG granules in contact with successive loading–unloading.
4
4.5Displacement #1
25
3
3.5Displacement #2Displacement #3Displacement #4
1.5
2
Coefficient ofrestitution
0.5
1Dis
plac
emen
t [μμm
]C
oeffi
cien
t of r
estit
utio
n [-]
00 5 10 15
Successive loading no. [-]
Fig. 8. Deformation of two PSG granules in contact and coefficient of restitutionagainst number of successive loading–unloading.
N.F. Abu Bakar et al. / Chemical Engineering Science 98 (2013) 51–58 55
Due to the plastic deformation during the first impacts, therelative curvature of the contact pair changes and results in alarger contact radius. The plastic deformation tends to decrease asthe successive loading applied on the granules which finally forminto an elastic surface. Accordingly, the amount of energy absorbedby plastic deformation decreases, and therefore more energy istransformed into wave propagation or viscoelastic phenomena(Seifried et al., 2005).
Fig. 8 also shows and confirms that the tendencies of plasticdeformations for other pairs of granules measured using MPIA aresimilar. The plastic deformations of the granules may indicaterearrangement of particles on the granules surfaces since therange of deformations is between 2.7 and 4.2 mm, that is, aboutthe size of a single particle. The reduction of the plastic deforma-tion showed a stiffening effect during loading–unloading cycles.Due to the soft and porous binderless granules structures, plasticdeformation is obtained in the later loadings and finally changes tostiffening in the contact region after 9–10 times of successiveloadings. Since the applied force, that is, 5 mN is less than thegranules breakage force, that is between approximately 0.42 and0.5 N, plastic deformation measured using MPIA implied a flatten-ing effect of the granules.
From the plastic deformation data of the two granules, thecoefficient of restitution e can be estimated from Eq. (5) (Vu-Quocet al., 2001). The coefficient of restitution representing energydissipation during a collision is originally defined as the ratio of
outgoing velocity to the incoming velocity when a particle collides.Since the amount of energy was assumed to be dissipated bydeformation only, the coefficient of restitution can be obtained bytaking the square root of the ratio of the energy released duringunloading to the compression energy during loading from the areaunder the loading–unloading curve that was obtained experimen-tally. However, in this study the deformation velocity during theimpact was limited to a minimum and constant speed of 50 nm/s.
e¼ffiffiffiffiffiffiffiffiffiffiffiffiffiffiffiffiffiffiffiffiffiffiffiffiffiffiffiffiffiffiffiffiffiffiffiffiffiffiffiffiffiffiffiffiffiffiffiffiffiffiffiffiffiffiffiffiffiffiffiffiffiffiffiffiffiffiffiffiffiarea under the unloading curvearea under the loading curve
sð5Þ
The coefficient of restitution e in Fig. 8 increases with thenumber of successive loadings. The coefficient of restitution fromthe first loading–unloading curve was approximately 0.5, and thengradually increased and remained approximately 0.98 after theseventh loading–unloading. This indicated that the granules sur-faces were densified and gradually stiffened to form an elasticsurface. The same tendencies of increasing coefficient of restitu-tion and stiffening effect were also observed by Seifried et al.(2005) in their experimental and numerical investigations. Thus,the value of 0.9 for the coefficient of restitution, which repre-sented the elastic condition of the granule, was used in the DEMsimulation. On the other hand, the spring constant was calculatedfrom the force–displacement curve using the Hookean equationand the obtained value was varied between 300 and 790 N/m. Byreferring to these values, the spring constant in the DEM simula-tion is varied between 400 and 1500 N/m.
4.3. Numerical simulation
Using the realistic value of coefficient of restitution and springconstant from the measurement using the MPIA, the collision ofparticles in the fluidized bed was simulated. To determine theminimum fluidization velocity Umf, the bed pressure drop wasplotted against the superficial gas velocity in Fig. 9. Umf wasobtained as about 0.06 m/s, which agreed well with the value of0.052 m/s obtained empirically by the Wen–Yu correlation (Wenand Yu, 1966). Fig. 10 shows the collision frequency (number ofcollisions undergone by a single particle per second) for 10selected particles having different value of spring constantsobtained from 3D DEM simulation for 3 s when the superficialgas velocity U0 was increased from 0 to 0.345 m/s and kept therefor 2.4 s. The collision frequency was high at around 80,000 to120,000 collisions/particles when the bed was expanding in apacked bed condition below minimum fluidization. This is mainlydue to frequent particle collision in the dense bed, whereby the

N.F. Abu Bakar et al. / Chemical Engineering Science 98 (2013) 51–5856
distance between particles was very close. The collision frequencydecreased suddenly when the gas velocity reached Umf Once thebed was fluidized, the collision frequency fluctuated between 250and 1500 collisions/particles for a spring constant of 400 N/m (cf.Fig. 10(a)). During fluidization, the particle bed was fully aeratedthat cause less collision as compared to before fluidizing state. Thefluctuation ranges increased and widened between 500 and 2500collisions/particles for a spring constant of 700 N/m, and between250 and 3000 collisions/particles for a spring constant of 1500 N/m (cf. Fig. 10(b) and (c)). Another DEM simulation of fluidized bedspray granulators also found a broad fluctuation of the particlescollision frequency between 200 and 1800 collisions/particles(Fries et al., 2013).
Fig. 11 shows the collision force acting on 10 selected particlesin the fluidized bed. The fluctuation range of particle–particlecollision force increases with increases in the spring constant. Thiscan be seen clearly from Fig. 12, showing the cumulative particle–
600
400
500 Increasing velocity
Decreasing velocity
200
300
0
100
0.00 0.10 0.20 0.30 0.40
Pres
sure
dro
p [P
a/m
]
Umf = 0.06m/s
Superficial gas velocity [m/s]
Fig. 9. Computed pressure drop vs. superficial gas velocity.
80000100000120000
0.400.450.50
k
3500
200004000060000
0.250.300.35
k = 400 N/m
500100015002000250030003500
0.050.100.150.20
Col
lisio
n fr
eque
ncy
[col
lison
s/pa
rtic
le.s
]
0.0 0.5 1.0 1.5 2.0 2.5 3.00 0.00
Time [s]
80000100000120000
k =
3500
200004000060000
0500
10001500200025003000
Time [s]
Supe
rfic
ial g
as v
eloc
ity [m
/s]
Col
lisio
n fr
eque
ncy
[col
lison
s/pa
rtic
le.s
]
0.0 0.5 1.0 1.5 2.0
Fig. 10. Computed collision frequency by DEM for spring c
particle collision force. The median particle–particle collisionforces increase with increasing spring constant. From Fig. 12, themedian collision force increased from 6�10−7–4�10−6 mN to9�10−7–7�10−6 mN and 4�10−6–3�10−5 mN for spring con-stants of 400, 700 and 1500 N/m respectively. However, comparedto the loading force of 0.5 mN that created significant plasticdeformation of the order of 3.5 μm using MPIA (cf. Figs. 7 and 8),these collision forces were more than 800 times smaller thanthose needed to cause permanent plastic deformation for therespective granule size and density. Nevertheless, in realitycollisions should be important in making the granules intoa more spherical shape through attrition and microscopicdeformation.
If the granules experience repeated collisions during eitherfluidization or compaction in the PSG fluidized bed, plasticdeformation that changes to stiffening in the contact regionmay lead to densification of the outer layer of the granuleswhereby the harder structure of the granule shell relative to itscore can be observed as shown in Fig. 6 as well as in theprevious works (Nishii, 1994; Horio et al., 2001). Previousstudies conducted by Antonyuk et al. (2005), Subero andGhadiri, (2001) and Horio et al., (2001) indicated that a highimpact force was required to cause breakage of other types ofgranules. Although the impact forces acting on spheres and/orgranules at high and low impact velocities were compared, thetendencies of granules breakage were similar in both cases(Antonyuk et al., 2005, 2006). These impact forces were foundto be insufficient to penetrate into the granules cores asdiscussed in the experimental (Antonyuk et al., 2005, 2006)and numerical (Antonyuk et al., 2006) studies, which may bedue to the hard shell structure. Other studies of DEM simula-tions also found that the dense agglomerates show distinctfracture patterns compared to loose agglomeration under iden-tical testing conditions (Mishra and Thornton, 2001). The denseagglomerates tend to fragment while loose agglomerates tendto experience total disintegration. Although the crack behavior
80000100000120000
0.400.450.50
k
3500
200004000060000
0.200.250.300.35
k = 700 N/m
0500
10001500200025003000
0.000.050.100.15
0
Time [s]
0.400.450.50
1500 N/m
0.250.300.35
0.050.100.15
Supe
rfic
ial g
as v
eloc
ity [m
/s]
Supe
rfic
ial g
as v
eloc
ity [m
/s]
Col
lisio
n fr
eque
ncy
[col
lison
s/pa
rtic
le.s
]
0.20
0.002.5 3.0
0.0 0.5 1.0 1.5 2.0 2.5 3.0
onstant k (a) 400 N/m, (b) 700 N/m and (c) 1500 N/m.
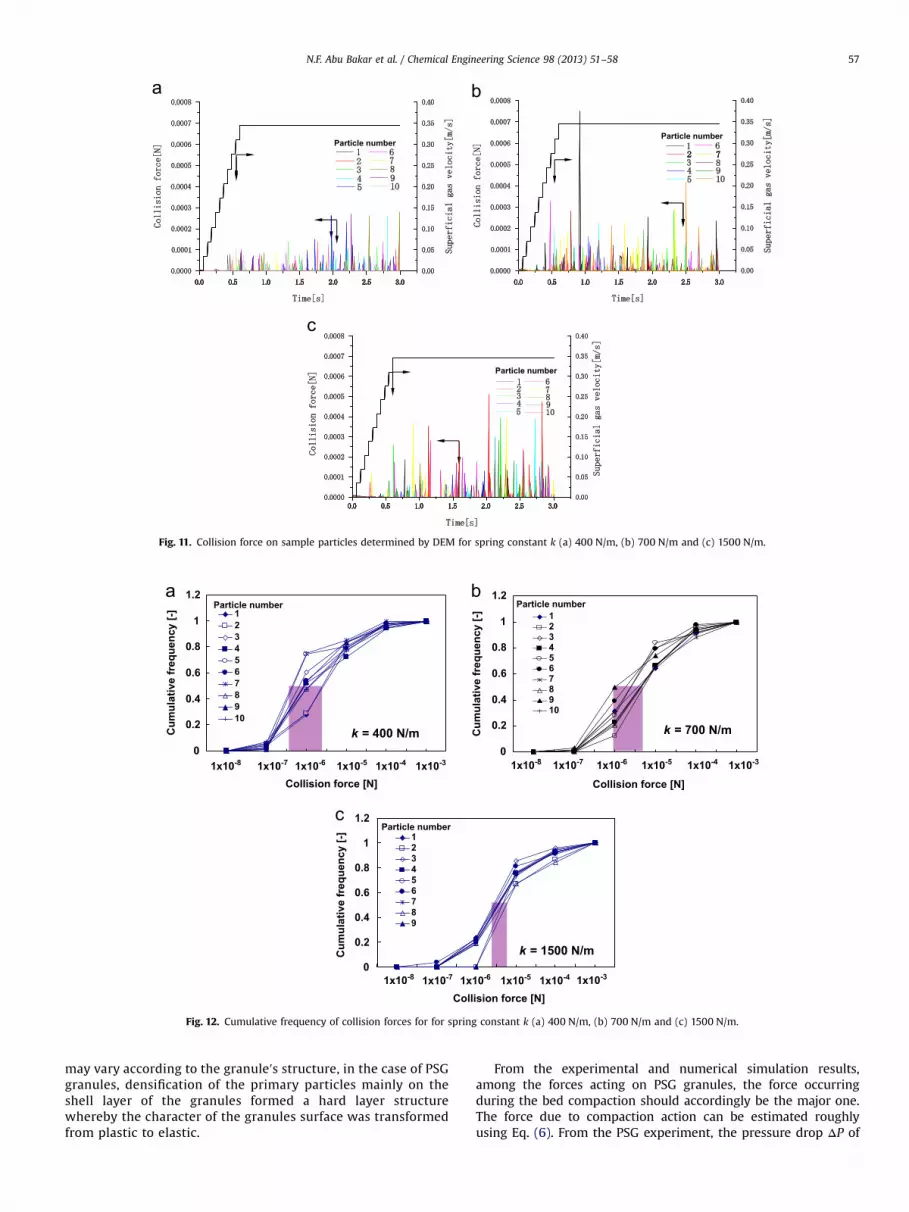
Fig. 11. Collision force on sample particles determined by DEM for spring constant k (a) 400 N/m, (b) 700 N/m and (c) 1500 N/m.
0
0.2
0.4
0.6
0.8
1
1.2
Collision force [N]
12345678910
1x10⁻⁸ 1x10⁻⁷ 1x10⁻⁶ 1x10⁻⁵ 1x10⁻⁴ 1x10⁻³ 1x10⁻⁸ 1x10⁻⁷ 1x10⁻⁶ 1x10⁻⁵ 1x10⁻⁴ 1x10⁻³
Particle number
0
0.2
0.4
0.6
0.8
1
1.2
Collision force [N]
123456789
Particle number
1x10⁻⁸ 1x10⁻⁷ 1x10⁻⁶ 1x10⁻⁵ 1x10⁻⁴ 1x10⁻³
k = 1500 N/m
k = 400 N/m0
0.2
0.4
0.6
0.8
1
1.2
Collision force [N]
12345678910
Particle number
k = 700 N/mCum
ulat
ive
freq
uenc
y [-]
Cum
ulat
ive
freq
uenc
y [-]
Cum
ulat
ive
freq
uenc
y [-]
Fig. 12. Cumulative frequency of collision forces for for spring constant k (a) 400 N/m, (b) 700 N/m and (c) 1500 N/m.
N.F. Abu Bakar et al. / Chemical Engineering Science 98 (2013) 51–58 57
may vary according to the granule′s structure, in the case of PSGgranules, densification of the primary particles mainly on theshell layer of the granules formed a hard layer structurewhereby the character of the granules surface was transformedfrom plastic to elastic.
From the experimental and numerical simulation results,among the forces acting on PSG granules, the force occurringduring the bed compaction should accordingly be the major one.The force due to compaction action can be estimated roughlyusing Eq. (6). From the PSG experiment, the pressure drop ΔP of

N.F. Abu Bakar et al. / Chemical Engineering Science 98 (2013) 51–5858
the bed weight of 120 g was 1�104 Pa during the 1 s reverse flowperiod, which should be the maximum compression pressureacting on the bed right above the distributor. Extending Rumpf'sequation (Rumpf, 1958) to the case of the packed bed we canobtain the average normal compressing force F acting on eachcontact point np¼π/ε in the bed as a function of pressure drop as
F ¼ πdp2ΔP
ð1−εÞnpð6Þ
Substituting the present conditions for granules size between 500and 850 μmwith assumption of the bed voidage ε¼0.5, we obtain themaximum compression force due to the air reverse flow, F¼2.5 and7mN which is sufficiently large to densify the granules by plasticdeformation (cf. Figs. 7 and 8). Since the bed experienced at least 450cycles during 2 h of granulation, densification of the granules surfacecreated a dense shell layer on granules at the end of the granulationprocess. Accordingly, the adjustment of the compression condition inPSG could be the key factor that should be investigated in much moredetail in the future.
5. Conclusions
The effect of external force on plastic deformation and densifica-tion of PSG granules and the effect of collisions on binderless granuleformation were successfully investigated by using a newly developedmicro-particle interaction analyzer (MPIA) and the discrete elementmethod (DEM) simulation code SAFIRE21. The high collision fre-quency and very low collision force evaluated by the DEM simulationand experiment suggested that reverse flow in PSG, that causedcompaction could be the most significant force that causes granulesdensification even though granule mixing during fluidization shouldalso be significant in making the granules spherical.
Nomenclature
dp¼Granule diameter [m]E¼Young's modulus [Pa]e¼Coefficient of restitution [–]k¼Spring constant [N/m]F¼Compressive force [N]Fn¼Normal force [N]hc¼Liquid bridge rupture distance [m]Hc¼Dimensionless rupture distance [–]np¼Coordination number [–]R¼Radius of particle [–]ΔP¼Pressure drop [Pa]u0¼Superficial velocity [m/s]umf¼Minimum fluidization velocity [m/s]V¼Dimensionless volume [–]α¼Coefficient of elasticity [–]δ¼Deformation [m]ε¼Voidage [–]ν¼Poisson's ratio [–]θ¼Contact angle [–]
Acknowledgments
The authors would like to thank Dr. Amit Suri for his help in thepost-processing of the DEM results.
References
Abu Bakar, N.F., Anzai, R., Horio, M., 2009. Direct measurement of particle–particleinteraction using micro-particle interaction analyzer (MPIA). Adv. PowderTechnol. 20, 455–463.
Antonyuk, S., Tomas, J., Heinrich, S., Morl, H., 2005. Breakage behaviour of sphericalgranulates by compression. Chem. Eng. Sci. 60, 4031–4044.
Antonyuk, S., Khanal, M., Tomas, J., Heinrich, S., Morl, H., 2006. Impact breakage ofspherical granules: experimental study and DEM simulation. Chem. Eng.Process. 45, 838–856.
Chaouki, J., Chavarie, C., Klvana, D., Pajonk, G., 1985. Effect of interparticle forces onthe hydrodynamic behaviour of fluidized aerogels. Powder Technol. 43, 117.
Fries, L., Antonyuk, S., Heinrich, S., Dopfer, D., Palzer, S., 2013. Collision dynamics influidised bed granulators: a DEM–CFD study. Chem. Eng. Sci. 86, 108–123.
Hertz, H., 1882. Uber die bruhrung fester elastischer korper. J. Reine Angew. Math.92, 156–171.
Horio, M., 2003. Binderless granulation—its potential, achievements and futureissues. Powder Technol. 130, 1–7.
Horio, M., Mukouyama, A., Maruyama, N., Takano, K., Nishii, K., 2001. The mechanism offluidized bed dry granulation of fine powders. FluidizationX, 485–491.
Iwadate, Y., Horio, M., 1998. Prediction of agglomerate sizes in bubbling fluidizedbeds of group C powders. Powder Technol. 100, 223–236.
Mikami, T., Kamiya, H., Horio, M., 1998. Numerical simulation of cohesive powderbehavior in a fluidized bed. Chem. Eng. Sci. 53, 1927–1940.
Mishra, B.K., Thornton, C., 2001. Impact breakage of particle agglomerates. Int. J.Miner. Process. 61, 225–239.
Morooka, S., Kusakabe, K., Kobata, A., Kato, Y., 1988. Fluidization state of ultrafinepowders. J. Chem. Eng. Jpn. 21, 4.
Nishii, K., Itoh, Y., Kawakami, N., Horio, M., 1993. Pressure swing granulation,a novel binderless granulation by cyclic fluidization and gas flow compaction.Powder Technol. 74, 1–6.
Nishii, K., 1994. Pressure swing fluidization of cohesive fine powders, Ph.D. thesis,Tokyo University of Agriculture and Technology.
Nishii, K., Horio, M., 2007. Handbook of powder technology. Granulation, 11.Elsevier, The Netherlands, pp. 289–322.
Rumpf, H., 1958. Grundlagen und methoden des Granulierens. Chem. lng. Tech. 30,144.
Samimi, A., Hassanpour, A., Ghadiri., M., 2005. Single and bulk compressions of softgranules: experimental study and DEM evaluation. Chem. Eng. Sci. 60,3993–4004.
Seifried, R., Schiehlen, W., Eberhard, P., 2005. Numerical and experimental evalua-tion of the coefficient of restitution for repeated impacts. Int. J. Impact Eng. 32,508–524.
Subero, J., Ghadiri, M., 2001. Breakage patterns of agglomerates. Powder Technol.120, 232–243.
Tagami, N., Mujumdar, A., Horio, M., 2009. DEM simulation of polydisperse systemsof particles in a fluidized bed. Particuology 7, 9–18.
Takano, K., Nishii, K., Mukoyama, A., Iwadate, H., Horio, M., 2002. Binderlessgranulation of pharmaceutical lactose powder. Powder Technol. 122, 212–221.
Tykhoniuk, R., Tomas, J., Luding, S., Kappl, M., Heim, L., Butt, H., 2007. Ultrafinecohesive powders: from interparticle contacts to continuum behaviour. Chem.Eng. Sci. 62, 2843–2864.
Vu-Quoc, L., Zhang, X., Lesburg, L., 2001. Normal and tangential force–displacementrelations for frictional elasto plastic contact of speheres. Int. J. Solids Struct. 38,6455–6489.
Wen, C.Y., Yu, Y.H., 1966. A generalized method for predicting the minimumfluidization velocity. AIChE J. 12, 610–612.