microdomains bounded by endoplasmic reticulum segregate cell cycle calcium transients in syncytial ...
TRANSCRIPT
TH
EJ
OU
RN
AL
OF
CE
LL
BIO
LO
GY
©
The Rockefeller University Press $8.00The Journal of Cell Biology, Vol. 171, No. 1, October 10, 2005 47–59http://www.jcb.org/cgi/doi/10.1083/jcb.200503139
JCB: ARTICLE
JCB 47
Microdomains bounded by endoplasmic reticulum segregate cell cycle calcium transients in syncytial
Drosophila
embryos
Huw Parry, Alex McDougall, and Michael Whitaker
Institute for Cell and Molecular Biosciences, University of Newcastle upon Tyne Medical School, Newcastle upon Tyne NE2 4HH, England, UK
ell cycle calcium signals are generated by theinositol trisphosphate (InsP
3
)–mediated release ofcalcium from internal stores (Ciapa, B., D. Pe-
sando, M. Wilding, and M. Whitaker. 1994.
Nature
.368:875–878; Groigno, L., and M. Whitaker. 1998.
Cell
. 92:193–204). The major internal calcium store isthe endoplasmic reticulum (ER); thus, the spatial organi-zation of the ER during mitosis may be important in shap-ing and defining calcium signals. In early
Drosophilamelanogaster
embryos, ER surrounds the nucleus andmitotic spindle during mitosis, offering an opportunity todetermine whether perinuclear localization of ER condi-
C
tions calcium signaling during mitosis. We establish thatthe nuclear divisions in syncytial
Drosophila
embryos areaccompanied by both cortical and nuclear localized cal-cium transients. Constructs that chelate InsP
3
also preventnuclear division. An analysis of nuclear calcium concen-trations demonstrates that they are differentially regu-lated. These observations demonstrate that mitotic calciumsignals in
Drosophila
embryos are confined to mitoticmicrodomains and offer an explanation for the apparentabsence of detectable global calcium signals during mitosisin some cell types.
Introduction
Calcium signals have been shown to play an important regula-tory role in controlling the cell division cycle of early sea urchin(Ciapa et al., 1994; Wilding et al., 1996; Groigno and Whitaker,1998), frog (Miller et al., 1993; Snow and Nuccitelli, 1993; Mutoet al., 1996), and mammalian embryos (Tombes et al., 1992;Nixon et al., 2002). Cell cycle calcium signals activate calmodu-lin (Lu and Means, 1993; Takuwa et al., 1995; Török et al.,1998), and calmodulin kinase II is required for mitosis in bothsea urchin embryos (Baitinger et al., 1990) and somatic cells(Patel et al., 1999). Nonetheless, despite clear evidence thatblocking calcium signals prevents mitosis, in many cases, puta-tive mitotic calcium signals are small or undetectable (Tombesand Borisy, 1989; Kao et al., 1990; Tombes et al., 1992; Wildinget al., 1996; Whitaker and Larman, 2001). The absence of cal-cium signals during mitosis in some higher eukaryotic cell typesunder some conditions implies that calcium regulation of mitosisis not a universal signaling mechanism in higher eukaryotes.
The source of calcium for signals during mitosis is theER (Ross et al., 1989; Ciapa et al., 1994). The ER gathersaround the nucleus as mitosis approaches and is closely associ-ated with the mitotic spindle (Harel et al., 1989). The ER–spindlecomplex can be isolated and shown to sequester calcium (Sil-ver et al., 1980). ER membranes pervade the mitotic spindle(Harris, 1975), so is possible that calcium released very lo-cally to calcium-binding sites over micron length scales mayprovide signals at the chromosomes and spindle poles. Verylocal signals of this kind are probably not detectable with currentimaging technologies.
During the early syncytial nuclear divisions of
Drosoph-ila melanogaster
embryos, ER becomes highly concentratedaround the nucleus at prophase and is very closely associatedwith the spindle poles; however, the ER does not invade thespindle itself (Bobinnec et al., 2003). This circumstance offersthe opportunity to image calcium concentrations within thenucleus and mitotic spindle without the complication of colo-calized ER. It also offers the opportunity to test whether theinteraction between ER and mitotic spindle creates a calcium-signaling environment that is distinct from bulk cytoplasm.
The amenable genetics of
Drosophila
has allowed theidentification of a plethora of gene products that are directly
Correspondence to Michael Whitaker: [email protected] used in this paper: CaGr, calcium green dextran; [Ca
i
], intra-cellular free calcium concentration; DiIC
18
, 1,1
�
-dioctadecyl-3,3,3
�
,3
�
-tetra-methylindocarbocyanine perchlorate; InsP
3
, inositol trisphosphate; NEB, nuclearenvelope breakdown; TMR, tetramethylrhodamine.
on July 22, 2014jcb.rupress.org
Dow
nloaded from
Published October 10, 2005
JCB • VOLUME 171 • NUMBER 1 • 200548
involved in regulating the cell division cycle (Gonzalez et al.,1994; Sullivan and Theurkauf, 1995). Many are homologues ofregulators that are important in controlling mammalian cellcycles. A number of cell cycle regulatory genes were firstidentified through their effects on the cell cycles of variousearly embryos (Evans et al., 1983; Gautier et al., 1988; Sunkeland Glover, 1988; Glover et al., 1991, 1995; Edgar and Lehner,1996). Calcium gradients may help determine the dorso–ventralaxis in
Drosophila
(Creton et al., 2000), but nothing is knownabout calcium signaling in the fly’s early embryonic cell cycles.In this study, we demonstrate that calcium regulates nucleardivision during early embryonic cell cycles and go on to showthat the ER surrounding the nuclear compartment encloses acalcium-signaling microenvironment that controls mitosis.
Results
Early
Drosophila
development is marked by 13 rapid nucleardivisions that occur in the same cytoplasm without cytokinesis(Foe and Alberts, 1983; Foe et al., 1993). Dividing nuclei arefirst located deep within the embryo; they migrate to the embryocortex during cycles 8 and 9, and nuclei divide just beneath thesurface of the embryo during cycles 10–13. During cycles 10–13,superficial nuclei undergo mitosis asynchronously, giving ap-pearance to mitotic waves that originate simultaneously atboth anterior and posterior embryonic poles. At 25
�
C, thewaves move from pole to equator in
�
30 s, as determined infast-frozen embryos (Foe and Alberts, 1983). At 18
�
C, wefind that the mitotic waves are substantially slower, whereas
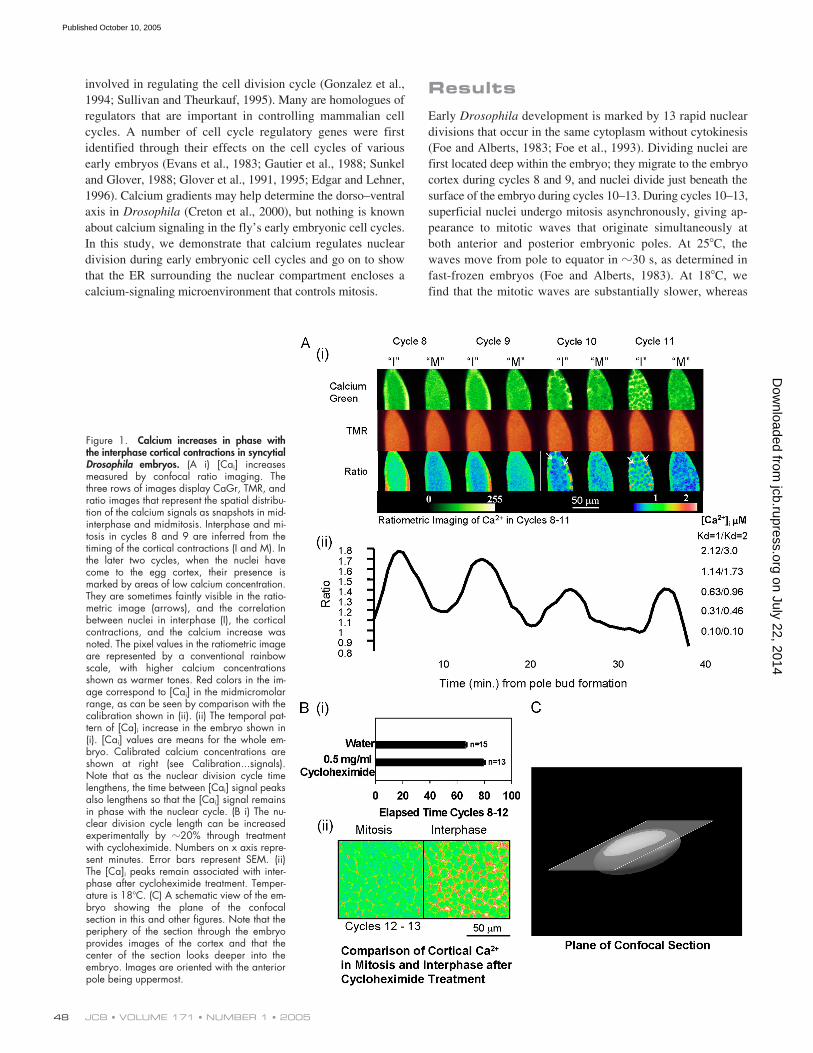
Figure 1. Calcium increases in phase withthe interphase cortical contractions in syncytialDrosophila embryos. (A i) [Cai] increasesmeasured by confocal ratio imaging. Thethree rows of images display CaGr, TMR, andratio images that represent the spatial distribu-tion of the calcium signals as snapshots in mid-interphase and midmitosis. Interphase and mi-tosis in cycles 8 and 9 are inferred from thetiming of the cortical contractions (I and M). Inthe later two cycles, when the nuclei havecome to the egg cortex, their presence ismarked by areas of low calcium concentration.They are sometimes faintly visible in the ratio-metric image (arrows), and the correlationbetween nuclei in interphase (I), the corticalcontractions, and the calcium increase wasnoted. The pixel values in the ratiometric imageare represented by a conventional rainbowscale, with higher calcium concentrationsshown as warmer tones. Red colors in the im-age correspond to [Cai] in the midmicromolarrange, as can be seen by comparison with thecalibration shown in (ii). (ii) The temporal pat-tern of [Ca]i increase in the embryo shown in(i). [Cai] values are means for the whole em-bryo. Calibrated calcium concentrations areshown at right (see Calibration...signals).Note that as the nuclear division cycle timelengthens, the time between [Cai] signal peaksalso lengthens so that the [Cai] signal remainsin phase with the nuclear cycle. (B i) The nu-clear division cycle length can be increasedexperimentally by �20% through treatmentwith cycloheximide. Numbers on x axis repre-sent minutes. Error bars represent SEM. (ii)The [Ca]i peaks remain associated with inter-phase after cycloheximide treatment. Temper-ature is 18�C. (C) A schematic view of the em-bryo showing the plane of the confocalsection in this and other figures. Note that theperiphery of the section through the embryoprovides images of the cortex and that thecenter of the section looks deeper into theembryo. Images are oriented with the anteriorpole being uppermost.
on July 22, 2014jcb.rupress.org
Dow
nloaded from
Published October 10, 2005
CALCIUM WAVES IN SYNCYTIAL
DROSOPHILA
EMBRYOS • PARRY ET AL.
49
cycle times are only slightly lengthened, allowing the wavesto be imaged much more readily with confocal microscopy.
Calcium changes occur in syncytial
Drosophila
embryos in fixed phase relation with the nuclear division cycle
Fig. 1 A shows fluorescence signals in a
Drosophila
embryo as itpasses through cell cycles 8–11. Increased intracellular free cal-cium concentration ([Ca
i
]) is detected by quantitative ratiometricimaging in each cell cycle as nuclei enter interphase. The ratio ofcalcium green dextran (CaGr) and rhodamine dextran fluores-cence quantitatively reflects the intracellular calcium concentra-
Table I.
Mean peak and trough [Ca
i
] in cortical confocal sections in cycles 8–13
Cycle 8 Cycle 9 Cycle 10 Cycle 11 Cycle 12 Cycle 13
TroughRatio[Ca
i
] (
�
M)1.03
�
0.0190.13
�
0.0181.02
�
0.0140.12
�
0.0131.02
�
0.0250.12
�
0.0231.00
�
0.0130.10
�
0.0121.00
�
0.0150.10
�
0.0131.00
�
0.0090.10
�
0.008Peak
Ratio[Ca
i
] (
�
M)1.56
�
0.1001.01
�
0.3051.57
�
0.1121.04
�
0.3541.34
�
0.0250.52
�
0.0421.38
�
0.0420.59
�
0.0781.36
�
0.0580.55
�
0.1031.23
�
0.0330.35
�
0.044
n
4 6 10 10 8 3
Assumes
K
d
of 1
�
M for CaGr.
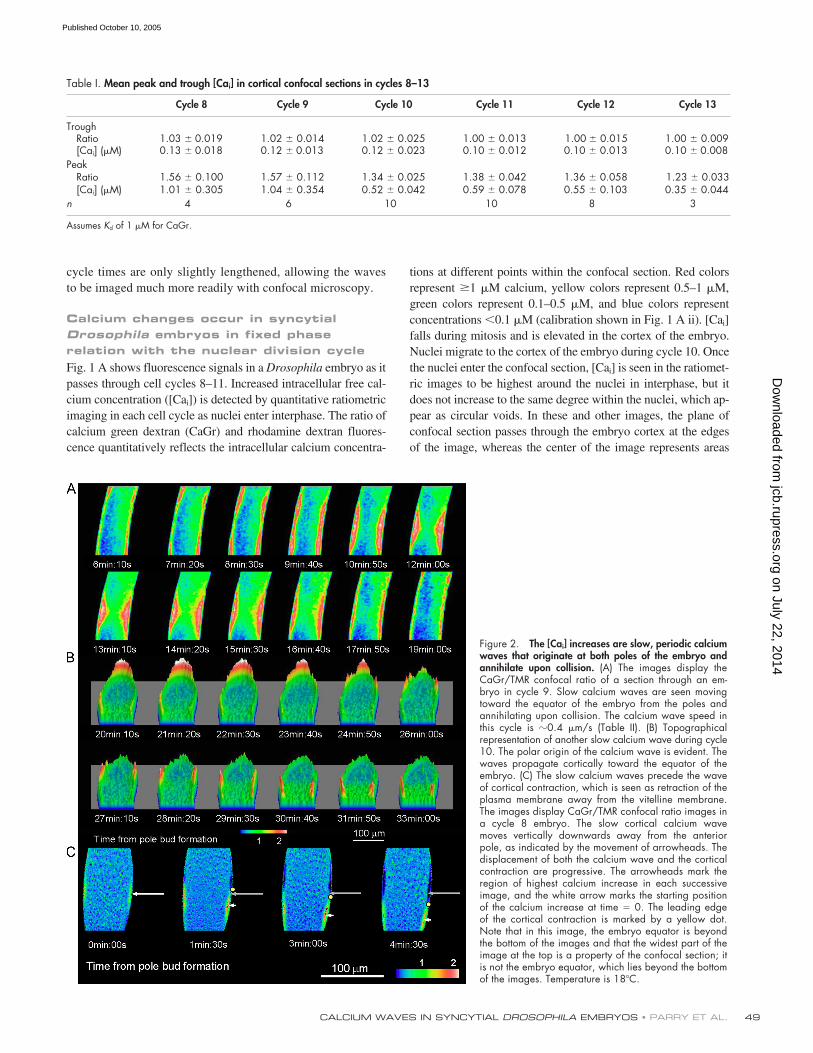
Figure 2. The [Cai] increases are slow, periodic calciumwaves that originate at both poles of the embryo andannihilate upon collision. (A) The images display theCaGr/TMR confocal ratio of a section through an em-bryo in cycle 9. Slow calcium waves are seen movingtoward the equator of the embryo from the poles andannihilating upon collision. The calcium wave speed inthis cycle is �0.4 �m/s (Table II). (B) Topographicalrepresentation of another slow calcium wave during cycle10. The polar origin of the calcium wave is evident. Thewaves propagate cortically toward the equator of theembryo. (C) The slow calcium waves precede the waveof cortical contraction, which is seen as retraction of theplasma membrane away from the vitelline membrane.The images display CaGr/TMR confocal ratio images ina cycle 8 embryo. The slow cortical calcium wavemoves vertically downwards away from the anteriorpole, as indicated by the movement of arrowheads. Thedisplacement of both the calcium wave and the corticalcontraction are progressive. The arrowheads mark theregion of highest calcium increase in each successiveimage, and the white arrow marks the starting positionof the calcium increase at time � 0. The leading edgeof the cortical contraction is marked by a yellow dot.Note that in this image, the embryo equator is beyondthe bottom of the images and that the widest part of theimage at the top is a property of the confocal section; itis not the embryo equator, which lies beyond the bottomof the images. Temperature is 18�C.
tions at different points within the confocal section. Red colorsrepresent
�
1
�
M calcium, yellow colors represent 0.5–1
�
M,green colors represent 0.1–0.5
�
M, and blue colors representconcentrations
�
0.1
�
M (calibration shown in Fig. 1 A ii). [Ca
i
]falls during mitosis and is elevated in the cortex of the embryo.Nuclei migrate to the cortex of the embryo during cycle 10. Oncethe nuclei enter the confocal section, [Ca
i
] is seen in the ratiomet-ric images to be highest around the nuclei in interphase, but itdoes not increase to the same degree within the nuclei, which ap-pear as circular voids. In these and other images, the plane ofconfocal section passes through the embryo cortex at the edgesof the image, whereas the center of the image represents areas
on July 22, 2014jcb.rupress.org
Dow
nloaded from
Published October 10, 2005
JCB • VOLUME 171 • NUMBER 1 • 200550
several microns deeper in the embryo (Fig. 1 C). The confocalimages are a window into small areas of the embryo cortex.
This pattern of calcium oscillation, with maximum ratioincreases in interphase, was seen in all 29 examined embryos.The oscillation remains in phase during the four nuclear cyclesas cycle time lengthens with each nuclear division (Fig. 1 A).The increases were analyzed quantitatively in 17 embryos atvarious cell cycle stages. The data are shown in Table I. Mean[Ca
i
] in the trough during mitosis ranged from 0.10
�
0.008 to0.13
�
0.018
�
m across five nuclear cycles (Table I), andmean peak [Ca
i
] was 1.01
�
0.305
�
m in cycle 8, falling grad-ually to 0.35
�
0.044
�
m in cycle 13. Also note from the im-ages of Fig. 1 that local [Ca
i
] continues to reach micromolarlevels during each interphase in areas of the cortex surroundingthe nuclei, even in later nuclear cycles. These observations in-dicate that calcium oscillations occur in fixed phase relationwith the nuclear cycle in syncytial embryos and that [Ca
i
] ishighest in interphase at the time of maximum cortical contrac-tion (Foe et al., 1993).
Nuclear division cycles in syncytial embryos are sensi-tive to protein synthesis inhibitors (Boring et al., 1989); at lim-iting concentrations of cycloheximide, the division cycles areslowed but not blocked (Fig. 1 B). We injected cycloheximide(0.5
�
g/ml at final concentration) to increase the duration ofcycles 8–12 from 65.9
�
1.2 to 79.1
�
1.4 min (mean andSEM). Fig. 1 B shows that calcium oscillations continue inphase with the nuclear division cycle in cycloheximide-treatedembryos, demonstrating a close mutual entrainment of calciumoscillations and the nuclear division cycle.
Calcium changes take the form of slow calcium waves that travel from pole to equator during each nuclear division cycle and precede the cortical contraction
When displayed at higher temporal resolution, the [Ca
i
]changes have a spatial substructure. Fig. 2 A shows two exam-ples of the spatial pattern of [Ca
i
] increase. In the top panel,two [Ca
i
] waves are arriving from poles at the equator of theembryo and are annihilating there. In Fig. 2 B, the initiation ofa calcium wave at the anterior pole is followed by progression
of the wave toward the equator and out of the frame. Thus, thecalcium signal shows the same behavior as mitotic waves,originating at both embryonic poles and moving toward theequator. Table II gives the mean wave velocity during syncy-tial division cycles from cycles 9–12. The wave speed slowswith each cycle, decreasing from 0.45 to 0.29
�
m/s. As the nu-clear division cycle time slows, the wave becomes progressivelyslower; the product of wave speed and cycle time remains con-stant, which is a further indication of the entrainment of cal-cium wave and nuclear cycle. Fig. 2 C shows a single [Ca
i
]wave in a cycle 8 embryo before the nuclei have reached thecortex. As the wave progresses toward the equator, it is fol-lowed by a cortical constriction that represents a cortical con-traction travelling at the same velocity. The constriction can beseen in the confocal section, as the movement of the plasmamembrane away from the vitelline membrane creates a dye-free perivitelline space that appears black beneath the autofluo-rescent vitelline membrane. The time that elapsed between theleading edge of the calcium wave and the leading edge of theconstriction is
�
90 s. We observed the association betweenwave and constriction in three of three embryos, suggestingthat the [Ca
i
] increase causes the cortical contraction.
InsP
3
-induced calcium release is required for mitotic progression
Cell cycle calcium signals in other early embryos are triggeredby inositol trisphosphate (InsP
3
; Ciapa et al., 1994; Muto et al.,1996; Groigno and Whitaker, 1998).
Drosophila
possesses asingle insect-specific InsP
3 receptor isoform (Hasan and Ros-bash, 1992; Yoshikawa et al., 1992). Deletion of the InsP3 re-ceptor arrests larval development at second instar, and embryosshow defects in cell division and endoreplication (Acharya etal., 1997). Embryonic development to second instar also re-quires the InsP3 receptor because no viable eggs or embryoswere generated from germ line clones lacking the receptor(Acharya et al., 1997). Fig. 3 A shows that InsP3 receptors arefunctional in early embryos; the microinjection of InsP3 leadsto calcium release. [Cai] was measured using CaGr, and local-ization of the injected InsP3 was determined by coinjection ofrhodamine dextran with InsP3. Although InsP3 was injectedinto the body of the embryo, [Cai] rose at the cortex predomi-nantly, and there is also a cortical contraction response. Thisexperiment shows that InsP3-induced calcium release causescortical contraction.
It was important to establish that InsP3-triggered calciumsignals are required for nuclear division in syncytial embryos.One way of specifically interfering with InsP3 signaling is touse a dominant-negative approach and introduce InsP3-bindingproteins or binding domains into the cytoplasm (Takeuchi etal., 2000; Walker et al., 2002). We microinjected an InsP3
sponge polypeptide consisting of the InsP3-binding domain oftype 1 InsP3 receptor (Walker et al., 2002) into embryos at thestart of cycle 11 and compared its effects with a control spongein which two point substitutions had been made in the InsP3-binding region to produce a polypeptide with no detectableInsP3-binding affinity (Walker et al., 2002). Fig. 3 B (i) showsthat 80% of embryos injected with the wild-type sponge arrested
Table II. Wave speeds during cycles 9–12
Cycle 9 Cycle 10 Cycle 11 Cycle 12
Embryo 1 0.47 0.37 0.36 0.29Embryo 2 0.42 0.29 0.32 0.29Embryo 3 0.46 0.46 0.42 0.25Embryo 4 0.47 0.36 0.36 0.31Embryo 5 0.43 0.43 0.40 0.31Mean speed
(v) 0.45 � 0.02 0.38 � 0.09 0.37 � 0.05 0.29 � 0.06Cycle time
(t; min)Product
(v � t)
9.3
4.15
11.0
4.18
11.3
4.18
14.4
4.18
Wave speeds in micrometers/second were calculated by measuring the timetaken for the center of the wave to cover a fixed distance of 170 �m at either theanterior or posterior end (embryo 4 only) of an embryo. All measurements weremade on embryos maintained at 18�C.
on July 22, 2014jcb.rupress.org
Dow
nloaded from
Published October 10, 2005
CALCIUM WAVES IN SYNCYTIAL DROSOPHILA EMBRYOS • PARRY ET AL. 51
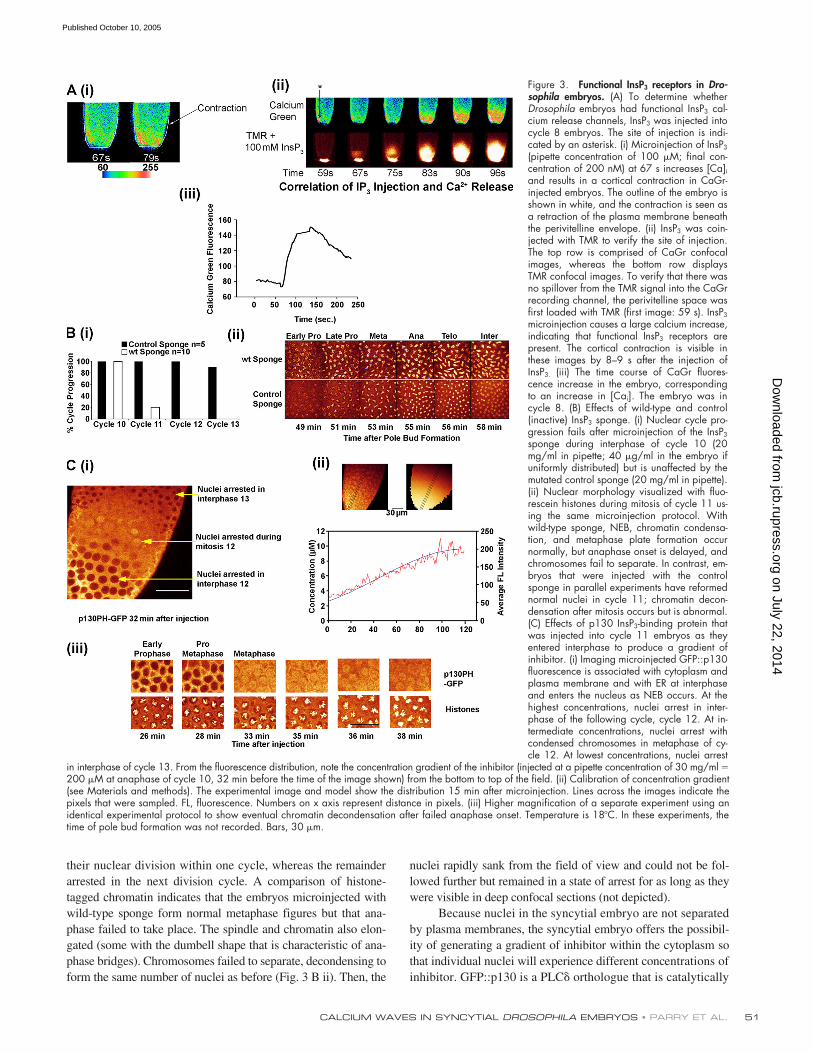
their nuclear division within one cycle, whereas the remainderarrested in the next division cycle. A comparison of histone-tagged chromatin indicates that the embryos microinjected withwild-type sponge form normal metaphase figures but that ana-phase failed to take place. The spindle and chromatin also elon-gated (some with the dumbell shape that is characteristic of ana-phase bridges). Chromosomes failed to separate, decondensing toform the same number of nuclei as before (Fig. 3 B ii). Then, the
nuclei rapidly sank from the field of view and could not be fol-lowed further but remained in a state of arrest for as long as theywere visible in deep confocal sections (not depicted).
Because nuclei in the syncytial embryo are not separatedby plasma membranes, the syncytial embryo offers the possibil-ity of generating a gradient of inhibitor within the cytoplasm sothat individual nuclei will experience different concentrations ofinhibitor. GFP::p130 is a PLC orthologue that is catalytically
Figure 3. Functional InsP3 receptors in Dro-sophila embryos. (A) To determine whetherDrosophila embryos had functional InsP3 cal-cium release channels, InsP3 was injected intocycle 8 embryos. The site of injection is indi-cated by an asterisk. (i) Microinjection of InsP3
(pipette concentration of 100 �M; final con-centration of 200 nM) at 67 s increases [Ca]iand results in a cortical contraction in CaGr-injected embryos. The outline of the embryo isshown in white, and the contraction is seen asa retraction of the plasma membrane beneaththe perivitelline envelope. (ii) InsP3 was coin-jected with TMR to verify the site of injection.The top row is comprised of CaGr confocalimages, whereas the bottom row displaysTMR confocal images. To verify that there wasno spillover from the TMR signal into the CaGrrecording channel, the perivitelline space wasfirst loaded with TMR (first image: 59 s). InsP3
microinjection causes a large calcium increase,indicating that functional InsP3 receptors arepresent. The cortical contraction is visible inthese images by 8–9 s after the injection ofInsP3. (iii) The time course of CaGr fluores-cence increase in the embryo, correspondingto an increase in [Cai]. The embryo was incycle 8. (B) Effects of wild-type and control(inactive) InsP3 sponge. (i) Nuclear cycle pro-gression fails after microinjection of the InsP3
sponge during interphase of cycle 10 (20mg/ml in pipette; 40 �g/ml in the embryo ifuniformly distributed) but is unaffected by themutated control sponge (20 mg/ml in pipette).(ii) Nuclear morphology visualized with fluo-rescein histones during mitosis of cycle 11 us-ing the same microinjection protocol. Withwild-type sponge, NEB, chromatin condensa-tion, and metaphase plate formation occurnormally, but anaphase onset is delayed, andchromosomes fail to separate. In contrast, em-bryos that were injected with the controlsponge in parallel experiments have reformednormal nuclei in cycle 11; chromatin decon-densation after mitosis occurs but is abnormal.(C) Effects of p130 InsP3-binding protein thatwas injected into cycle 11 embryos as theyentered interphase to produce a gradient ofinhibitor. (i) Imaging microinjected GFP::p130fluorescence is associated with cytoplasm andplasma membrane and with ER at interphaseand enters the nucleus as NEB occurs. At thehighest concentrations, nuclei arrest in inter-phase of the following cycle, cycle 12. At in-termediate concentrations, nuclei arrest withcondensed chromosomes in metaphase of cy-cle 12. At lowest concentrations, nuclei arrest
in interphase of cycle 13. From the fluorescence distribution, note the concentration gradient of the inhibitor (injected at a pipette concentration of 30 mg/ml �200 �M at anaphase of cycle 10, 32 min before the time of the image shown) from the bottom to top of the field. (ii) Calibration of concentration gradient(see Materials and methods). The experimental image and model show the distribution 15 min after microinjection. Lines across the images indicate thepixels that were sampled. FL, fluorescence. Numbers on x axis represent distance in pixels. (iii) Higher magnification of a separate experiment using anidentical experimental protocol to show eventual chromatin decondensation after failed anaphase onset. Temperature is 18�C. In these experiments, thetime of pole bud formation was not recorded. Bars, 30 �m.
on July 22, 2014jcb.rupress.org
Dow
nloaded from
Published October 10, 2005
JCB • VOLUME 171 • NUMBER 1 • 200552
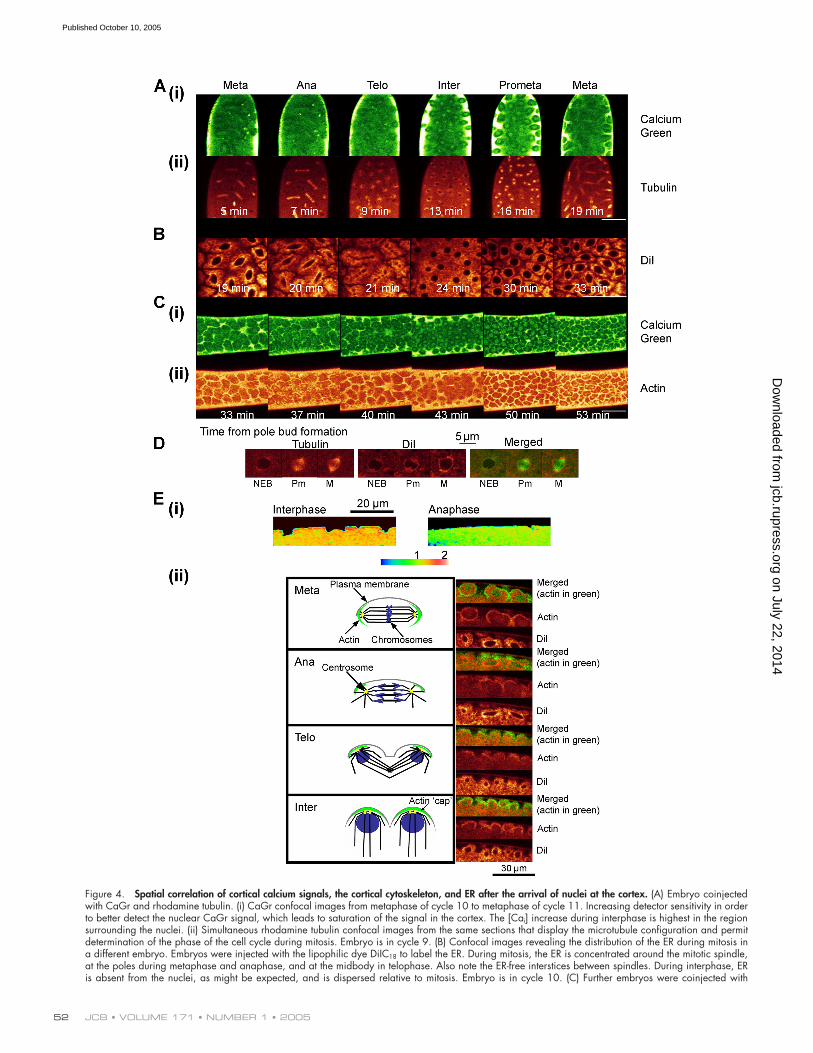
Figure 4. Spatial correlation of cortical calcium signals, the cortical cytoskeleton, and ER after the arrival of nuclei at the cortex. (A) Embryo coinjectedwith CaGr and rhodamine tubulin. (i) CaGr confocal images from metaphase of cycle 10 to metaphase of cycle 11. Increasing detector sensitivity in orderto better detect the nuclear CaGr signal, which leads to saturation of the signal in the cortex. The [Cai] increase during interphase is highest in the regionsurrounding the nuclei. (ii) Simultaneous rhodamine tubulin confocal images from the same sections that display the microtubule configuration and permitdetermination of the phase of the cell cycle during mitosis. Embryo is in cycle 9. (B) Confocal images revealing the distribution of the ER during mitosis ina different embryo. Embryos were injected with the lipophilic dye DiIC18 to label the ER. During mitosis, the ER is concentrated around the mitotic spindle,at the poles during metaphase and anaphase, and at the midbody in telophase. Also note the ER-free interstices between spindles. During interphase, ERis absent from the nuclei, as might be expected, and is dispersed relative to mitosis. Embryo is in cycle 10. (C) Further embryos were coinjected with
on July 22, 2014jcb.rupress.org
Dow
nloaded from
Published October 10, 2005
CALCIUM WAVES IN SYNCYTIAL DROSOPHILA EMBRYOS • PARRY ET AL. 53
inactive, binds InsP3 with high affinity by virtue of its pleck-strin homology domain, and inhibits calcium signaling whenoverexpressed in cells or when added to permeabilized cells(Takeuchi et al., 2000). The GFP::p130 chimera was localizedto plasma membrane and apparently to ER in interphase, en-tered the nucleus at prophase, and associated with the mitoticspindle (Fig. 3 C i). By microinjecting GFP::p130 at one poleof the embryo during early anaphase of cycle 11, we were ableto generate a gradient of GFP::p130 of 2–10 �M, which wasconfirmed by the distribution of fluorescence (Fig. 3 C ii) thatpersisted for the course of the experiment. The outcome wasstriking. Nuclei that were exposed to 10 �M GFP::p130 ar-rested before nuclear envelope breakdown (NEB) in cycle 12.Nuclei that were exposed to intermediate concentrations con-tinued through NEB of cycle 12 but arrested after mitosis en-try and were unable to complete mitosis, whereas nuclei thatwere exposed to 2 �M progressed through mitosis of cycle 12and arrested before mitosis in cycle 13. Simultaneous imagingof histone and GFP signals demonstrated that nuclei enteredmetaphase but failed to enter anaphase rapidly, just as we hadfound with the InsP3 sponge (Fig. 3 C iii). Chromatin decon-densation occurred in the arrested nuclei after a delay (Fig. 3C iii) and elongated, and dumbell-shaped nuclei were alsoseen (not depicted), although this occurred a few minutes laterthan we had observed after the microinjection of InsP3 spongeconstructs. These observations demonstrate that InsP3 signal-ing plays a role in mitosis entry at NEB as well as in mitosisexit in Drosophila embryos. In GFP::p130-injected embryos,the mitotic wave (the wave of NEB and anaphase onset) trav-elled in the opposite direction to that observed in controls (thatis, from the farther embryonic pole), indicating that InsP3 isinvolved in the initiation and propagation of the wave.
Heparin and Xestospongin C are agents that inhibit theinteraction of InsP3 with the InsP3 receptor (Ghosh et al., 1988;Gafni et al., 1997). Embryos that were microinjected with ei-ther the inhibitor of InsP3-induced calcium release, heparin (80�g/ml gave half maximum inhibition; n � 4; Groigno and Whit-aker, 1998), or Xestospongin C (10 mM of pipette concentra-tion; n � 6; Hu et al., 1999) also showed a block in mitosis thatwas similar to what we observed with both the InsP3 spongeand GFP::p130 (unpublished data). As far as is known, theInsP3 receptor is the sole signaling target of InsP3 in cells (forreview see Fukuda and Mikoshiba, 1997; Mikoshiba, 1997).
These experiments demonstrate that InsP3-triggered cal-cium release is a signal that is necessary for both entry into mi-tosis and for anaphase onset in syncytial Drosophila embryos,as it is in sea urchin embryos (Twigg et al., 1988a; Ciapa et al.,1994; Groigno and Whitaker, 1998).
Microdomains of elevated calcium that are separated by ER-rich low calcium domains are observed in cortical budsOnce nuclei reach the surface, it is possible to stage the nuclearcycle precisely. Fig. 4 shows the spatial distribution of the inter-phase [Cai] increase from metaphase through interphase tometaphase of the next cycle, as seen in glancing tangential con-focal sections (Fig. 1 C); this is compared with the disposition ofmitotic spindles, ER, and actin. CaGr fluorescence (Fig. 4 A, iand ii) indicates that the major [Cai] increase occurs in inter-phase in a cortical region surrounding the nuclei but is separatedfrom interphase nuclei by a region of low calcium concentra-tion. As nuclei enter mitosis, the cortical [Cai] levels fall overall,and the signal becomes confined to narrower regions surround-ing the mitotic spindle. [Cai] in the nucleus and mitotic spindleappears higher than in the circumnuclear region but much lowerthan in the cortical region. These images cannot be compared di-rectly to those of Fig. 1, as ratiometric methods cannot be usedwhen simultaneously measuring rhodamine-tagged cytoskeletalcomponents. Moreover, the increased detection sensitivity thatis required to visualize CaGr fluorescence in the nucleus andspindle leads to saturation of the cortical CaGr signal because ofthe limited dynamic range of the confocal microscope.
Fig. 4 B shows, in a separate experiment, changes in ERdistribution during the nuclear division cycle, which was visu-alized using DiI, a lipophilic carbocyanine dye that labels ERand other elements of the ER/Golgi/endosome system (Terasakiand Jaffe, 1991). The pattern of DiI fluorescence is identical tothat reported for an ER-localized GFP-tagged protein in earlyDrosophila embryos (Bobinnec et al., 2003). The ER extendsdiffusely into the space between nuclei during interphase and ismarkedly concentrated immediately around the mitotic spindleduring mitosis (Fig. 4 D). It is excluded from the spindle untillate telophase, when ER invades the spindle in the region of themidbody. The pattern of distribution of cortical ER (Fig. 4 B) islinked to the pattern of [Cai] increase, with [Cai] being highestin the interstices between ER accumulation around the nuclei
rhodamine-labeled actin and CaGr to determine the spatial relation between actin and [Ca]i. (i) Confocal images that display the pattern of calcium increasefrom mitosis to mitosis. (ii) The distribution of actin in the same confocal sections. The pattern of [Ca]i increase follows the pattern of actin distribution closelythroughout the nuclear cycle. Embryo is in cycle 11. Bars, 50 �m. (D) Simultaneous imaging of ER (DiI fluorescence) and the mitotic spindle (fluoresceintubulin fluorescence). The images show that the ER surrounds the spindle as the nucleus enters mitosis. NEB, nuclear envelope breakdown; Pm,prometaphase; M, metaphase. (E) To determine the spatial relationships between the ER, actin, and [Cai], embryos were coinjected with fluorescein-labeledactin and DiIC18 and were compared with other embryos that were injected with CaGr/TMR ratios in confocal z-sections. (i) Confocal ratiometric imagesnormal to the surface of the embryo compare the cortical [Cai] levels during interphase, when the actin caps are present in cortical buds, with those at ana-phase. The [Ca]i increase occurs through this thickness of cortex in interphase but is very prominent just beneath the plasmalemma within the cortical bud.During anaphase, cortical buds are absent and [Cai] levels are both lower and more uniform beneath the cortex. (ii) Cartoons displaying the distributionof actin, microtubules, and chromosomes during metaphase, anaphase, telophase, and interphase accompanied by images of actin and ER in corticalbuds in sections normal to the cortex (z sections) as mitosis progresses. Embryos were coinjected with fluorescein-actin and DiIC16 to visualize the corticalactin and ER during mitosis. Confocal merged images reveal that the actin (green) and ER (red) are in close apposition but do not overlap significantly. ERwas found below the actin cap. A comparison with (i) indicates that [Cai] is highest in the region of the actin cap. ER wraps around the nucleus and mitoticspindle. Results shown are representative of data from at least three embryos in separate experiments. Temperature is 18�C.
on July 22, 2014jcb.rupress.org
Dow
nloaded from
Published October 10, 2005
JCB • VOLUME 171 • NUMBER 1 • 200554
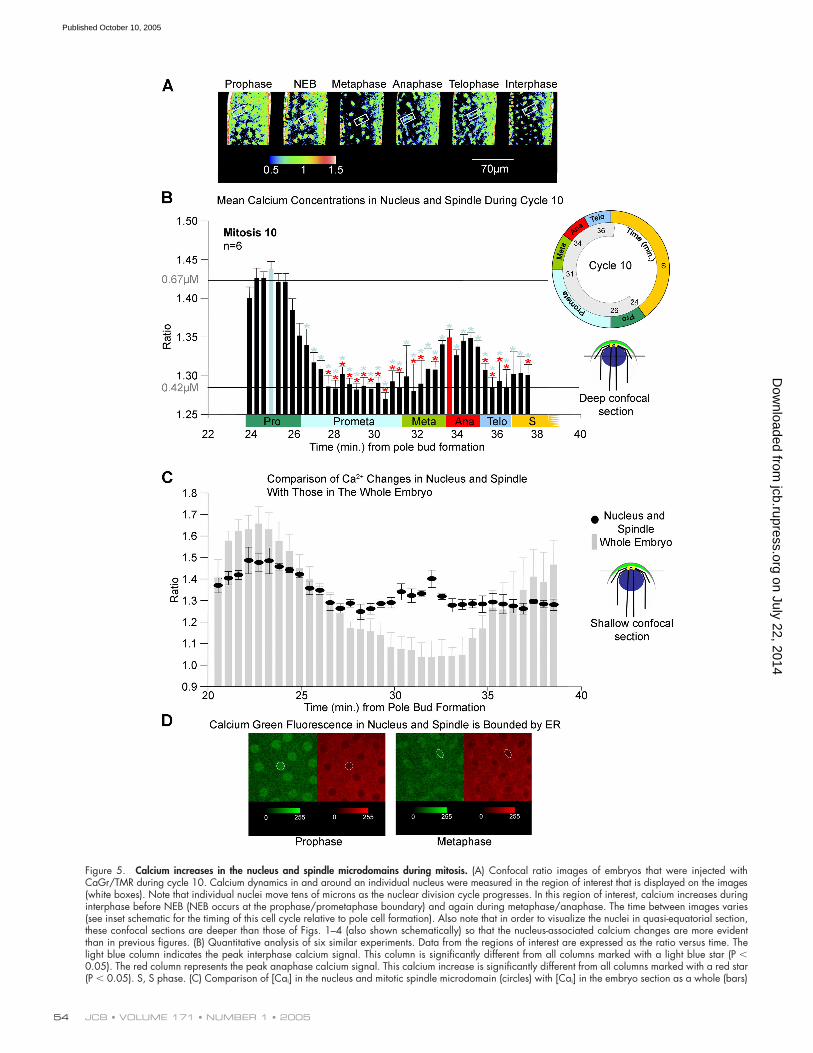
Figure 5. Calcium increases in the nucleus and spindle microdomains during mitosis. (A) Confocal ratio images of embryos that were injected withCaGr/TMR during cycle 10. Calcium dynamics in and around an individual nucleus were measured in the region of interest that is displayed on the images(white boxes). Note that individual nuclei move tens of microns as the nuclear division cycle progresses. In this region of interest, calcium increases duringinterphase before NEB (NEB occurs at the prophase/prometaphase boundary) and again during metaphase/anaphase. The time between images varies(see inset schematic for the timing of this cell cycle relative to pole cell formation). Also note that in order to visualize the nuclei in quasi-equatorial section,these confocal sections are deeper than those of Figs. 1–4 (also shown schematically) so that the nucleus-associated calcium changes are more evidentthan in previous figures. (B) Quantitative analysis of six similar experiments. Data from the regions of interest are expressed as the ratio versus time. Thelight blue column indicates the peak interphase calcium signal. This column is significantly different from all columns marked with a light blue star (P �0.05). The red column represents the peak anaphase calcium signal. This calcium increase is significantly different from all columns marked with a red star(P � 0.05). S, S phase. (C) Comparison of [Cai] in the nucleus and mitotic spindle microdomain (circles) with [Cai] in the embryo section as a whole (bars)
on July 22, 2014jcb.rupress.org
Dow
nloaded from
Published October 10, 2005
CALCIUM WAVES IN SYNCYTIAL DROSOPHILA EMBRYOS • PARRY ET AL. 55
and spindles (Fig. 4, A i and C i). Fig. 4 C (ii) shows the patternof distribution of cortical actin during the nuclear division cycle,which was visualized using rhodamine-actin simultaneouslywith CaGr (Fig. 3 C i). There is a close correspondence betweenthe distribution of actin and regions of highest [Cai] increase.During mitosis, actin is localized to the interstices between ERthat were noted above. The ER appears to isolate the nucleusand mitotic spindle from these regions of highest [Cai] as nucleienter and progress through mitosis (Fig. 4 D).
The interphase [Cai] increase occurs at the very peripheryof cortical buds that surround the interphase nuclei (Fig. 4 E i).Cortical mitotic spindles are anchored by actin caps that sur-round each nucleus in interphase (Fig. 4 E ii, cartoon; Sullivanand Theurkauf, 1995; Foe et al., 2000). The actin caps arepushed further apart as the spindles extend at anaphase. In latetelophase, the actin wraps around the reforming interphase nu-cleus to give twice as many actin caps as were present beforenuclear division (Fig. 4 E ii). Nuclei, therefore, occupy agreater area of the cortex in mitosis compared with interphase,which gives rise to substantial oscillatory translation of nucleiin the plane of the cortex as the mitotic wave progresses alongthe embryo (Zalokar and Erk, 1976). When localization of theinterphase [Cai] increase, actin, and ER distribution are com-pared in confocal sections normal to the surface (Fig. 4 E, i andii), it is evident that the [Cai] increase occurs throughout thecortex in each cap but is markedly higher in the regions ofhighest actin concentration.
As predicted, the halo of ER that surrounds the nucleusand mitotic spindle appears to separate two distinct calciummicrodomains: a region of high calcium in the subcortex,which is associated with actin and contraction in interphase,and a region of lower nuclear calcium. Calcium concentrationsare lowest where the ER is most dense.
[Cai] increases occur in the nucleus and mitotic spindle microdomains at both prophase and anaphaseTo confirm that calcium increases occurred at prophase andanaphase, as would be predicted from observations in sea ur-chin embryos (Ciapa et al., 1994; Wilding et al., 1996; Groignoand Whitaker, 1998), we used ratiometric calcium imaging ofsingle nuclei. We screened for [Cai] increases by tracking the[Cai] changes in and around individual nuclei during a nuclearcycle in cycle 10 in six different embryos (Fig. 5, A and B).Note that individual nuclei travel quite large distances alongthe cortex of the embryo as nuclear divisions progress (Zalo-kar and Erk, 1976). We chose a level of confocal section thatwas deeper in the buds than that shown in Fig. 4 (level 2; Fig.5 D) in order to image nuclear calcium; at this level of con-focal section, the cortical increase in [Cai] can be seen only
at the very periphery of the deep section through the embryo(Fig. 5 A). Fig. 5 demonstrates that an increase in nuclear [Cai]occurs at a time that coincides with the aforementioned largerglobal cortical interphase [Cai] increase, and it falls as nucleienter prometaphase. Peak [Cai] was less than that observed inthe whole embryo (Fig. 5 B). In addition, we detected a second[Cai] increase in the mitotic spindle at around the time ofanaphase onset (Fig. 5 B). When we tracked nuclei using ratio-metric imaging with the 70-kD form of CaGr, which is ex-cluded from the nucleus during interphase, we observed a lo-cal [Cai] increase in the spindle at anaphase. However, theNEB-associated signal was absent (unpublished data), con-firming that the local [Cai] increase at prophase occurredwithin the nucleus.
To make a direct comparison between cortical and nuclearcalcium concentrations in individual cortical buds, we used ratio-metric imaging with confocal sections at the shallower level usedin Fig. 4 to enable us to visualize both cortical and nuclear cal-cium simultaneously (level 1; Fig. 5 D). We found the calciumconcentration in the nuclear microdomain to be significantlylower than cortical calcium at prophase and significantly higherthan cortical calcium levels at anaphase onset (Fig. 5 C). Theseexperiments also confirmed that the peak of nuclear calcium atprophase coincided with the peak of cortical calcium concentra-tion. Simultaneous imaging of [Cai] and ER at metaphase justbefore anaphase onset showed that [Cai] in the spindle wasconfined to the space enclosed by ER (Fig. 5 E).
These data demonstrate the existence of nuclear micro-domains of calcium concentration that act as triggers for mitosisentry and exit.
DiscussionThe interphase [Cai] signal is linked to contraction, the actin cytoskeleton, and the cortical ERThe interphase [Cai] increase occurs very close to the surfaceof the embryo in the space between the nucleus and its cap thatcontains both actin and ER. High [Cai] correlates with thephase of cortical contraction that is associated with interphasenuclei. Alternating bands of contraction/relaxation pass alongthe embryo as the calcium signal progresses, giving rise tolarge oscillations in nuclear position that were observed in thecortex, which are referred to as yolk contractions (Foe et al.,1993) and are inhibited by cytochalasins (Hatanaka and Odada,1991). Progressive, slow calcium waves have been observed inthe cleavage furrows of early fish embryos (Webb and Nucci-telli, 1985; Fluck et al., 1991; Chang and Meng, 1995; Webb etal., 1997; Lee et al., 2003; Webb and Miller, 2003), and [Cai]increases have also been recorded in frog embryos (Steinhardt
during cycle 11 in five embryos at level 1, which is shown in D. The interphase peak of nuclear [Cai] coincides with the cortical interphase [Cai] peak butis of lower magnitude. Note the shallow confocal section that is illustrated schematically and is similar to that in Figs. 1–4. Temperature is 18�C. Error barsrepresent SEM. (D) Simultaneous imaging of [Cai] using CaGr and of ER using DiIC18. Two pairs of images from an image series are shown, illustratingprophase and metaphase just before anaphase onset in cycle 10. Green, CaGr; red, DiIC18. White encircled areas are of equal size and position. Theseimages show the spatial relationship between CaGr fluorescence and ER but are only indicative of [Cai], as they are nonratiometric. Temperature is 18�C.
on July 22, 2014jcb.rupress.org
Dow
nloaded from
Published October 10, 2005
JCB • VOLUME 171 • NUMBER 1 • 200556
et al., 1974; Miller et al., 1993; Snow and Nuccitelli, 1993;Muto and Mikoshiba, 1998). A calcium signal at cytokinesishas also been shown to be essential for the insertion of newmembrane into the cleavage furrow in the sea urchin embryo(Shuster and Burgess, 2002). During pseudocleavage in syncy-tial Drosophila embryos, membrane addition from endosomesis essential for actin recruitment and furrow elongation (Riggset al., 2003). Calcium signals have been found to be associatedwith cortical contraction in ascidian and fish embryos (Roegierset al., 1995; Leung et al., 1998).
InsP3 and the InsP3 receptor are essential for nuclear divisionWe determined that InsP3 receptors were functional in early em-bryos by eliciting calcium release in response to InsP3 injection.A genetic approach to determine the importance of InsP3 signal-ing during rapid syncytial nuclear divisions of the Drosophilaembryo does not easily present itself. In fact, despite the ubiq-uity and importance of calcium signaling (Berridge et al., 2000),very few genetic disorders that are caused by defects in calcium-signaling components have been identified; the strong as-sumption is that an overwhelming majority of genetic calciumsignaling defects are embryonic lethals (Rizzuto and Pozzan,2003). Instead, we microinjected constructs that have beenshown to chelate InsP3. We used a GFP-tagged InsP3-bindingprotein to determine the cytoplasmic concentration of injectedproteins. We determined the inhibitory concentration that blocksboth NEB and anaphase onset to be 2–10 �M, which are con-centrations comparable with those previously observed to blockInsP3-mediated events (Takeuchi et al., 2000) and are similar tothose observed with an InsP3 sponge (Uchiyama et al., 2002).Thus, InsP3 signaling leading to calcium transients is essentialfor NEB and anaphase onset, as it is in early sea urchin embryos(Poenie et al., 1985; Steinhardt and Alderton, 1988; Twigg etal., 1988b; Ciapa et al., 1994; Wilding et al., 1996; Groignoand Whitaker, 1998). As observed in the sea urchin embryo(Groigno and Whitaker, 1998), the block to anaphase onset wascharacterized by absence of chromatin disjunction, but spindleelongation and chromatin decondensation did occur, often witha delay. The ER isolates the nucleus during mitosis and gener-ates local nuclear calcium signals via InsP3.
Cell cycle calcium signals that govern mitosis are notprominent in syncytial Drosophila embryos. We show that thisis because the ER generates calcium-signaling microdomainswithin the cortical bud: one beneath the plasma membrane ofthe cortical buds and the other within the nucleus and mitoticspindle. There is a real possibility that the very different molec-ular environments are, in part, responsible for the differentfluorescence signals that we measured in these different micro-domains. However, at metaphase, the calcium concentrationsthat are reported by fluorescence reporters are uncorrelated,implying that calcium rises in only the spindle microdomain.
Although it has been clear for some time that ER associ-ates with the nucleus and spindle (Terasaki and Jaffe, 1991),this has been interpreted as a mechanism to ensure proportionateinheritance of ER when cells divide (Barr, 2002). In this study,we demonstrate an additional, essential, and novel function—
that of maintaining distinct calcium microdomains during celldivision. Nuclear calcium has also been shown in some celltypes to be regulated differentially to cytoplasmic calcium(Badminton et al., 1998; MacDonald, 1998), but this is thoughtto be a result of the properties of the nuclear envelope ratherthan of an accumulation of ER around the nucleus. Although itwas originally proposed that a nuclear envelope persistedthroughout mitosis as a spindle envelope during syncytial nu-clear divisions (Harel et al., 1989), it is now clear that the nu-cleus becomes permeable to high molecular weight moleculesearly in prophase (that is, at the same time as in other cells) butthat nuclear lamins persist until metaphase, disappearing beforeanaphase onset (Paddy et al., 1996). Thus, the nuclear envelopedoes not exist during mitosis to provide a diffusion barrier thatwould allow the mechanisms regulating calcium in intact nu-clei to operate. On the other hand, the persistence of nuclearlamins may explain why the ER remains outside the spindleuntil late anaphase in syncytial embryos.
We show that it is possible to apply cell physiology meth-ods to early Drosophila embryos to study calcium signaling. Ourdata clearly demonstrate for the first time in a protostome em-bryo that maneuvers designed to prevent calcium signals arrestthe nuclear division cycle and that calcium signals are responsi-ble for the waves of mitosis observed in syncytial Drosophilaembryos. We also show for the first time that the nucleus andspindle exist within a calcium-signaling microdomain and thatcalcium increases that are necessary for progress through mitosisare small and localized. This has been possible because ER is ex-cluded from the Drosophila spindle during mitosis. In other em-bryos and in mammalian somatic cells, ER is an intimate spindlecomponent. Signals that are local to the spindle are less readilydetected, perhaps explaining why calcium signals are not alwaysobserved during mitosis in some cell types.
Materials and methodsPreparation of embryos for microinjectionDrosophila embryos (strained with Oregon R) were used for all presentedexperiments. Flies were kept at RT in plastic bottles containing a solid foodbase (Elgin and Miller, 1980) with breathable stoppers. Optimum egg lay-ing occurred 21 d after egg deposition. The adult flies were transferred to afresh glass bottle containing a 5 � 10-cm strip of chromatography paper (3MM; Whatman) to provide a place for the flies to rest and to decrease hu-midity. The bottle was capped with a 2.5% agar plate (small petri dishes fitthe bottle necks) that was inverted and left for 30 min. The first collectionwas discarded, and subsequent collections were used experimentally. Ad-hesive tape (magic 3M; Scotch) was affixed to one side of a 22 � 64-mmcoverslip by double-sided tape. Glue was prepared by dissolving the adhe-sive of Scotch tape in heptane, and the glue–heptane solution was pipettedonto the center of the coverslip and allowed to dry. Embryos were placedon the adhesive-coated coverslip. The coverslip supporting the embryos wastransferred to a large petri dish containing silica gel crystals. The embryoswere desiccated for 10 min (causing the loss of �5% cell volume) and cov-ered with mineral oil during injection and imaging (halocarbon oil; 50% ha-locarbon 27 and 50% halocarbon 700; Sigma-Aldrich) to prevent furtherdesiccation. Any embryos that developed wrinkles during desiccation werediscarded. The embryos were injected immediately after desiccation.
Chemicals5,5�dibromoBAPTA (tetrapotassium salt) and fluorescent dyes were pur-chased from Invitrogen. Cycloheximide and Xestospongin C were purchasedfrom Calbiochem. The majority of all other chemicals were purchased fromSigma-Aldrich.
on July 22, 2014jcb.rupress.org
Dow
nloaded from
Published October 10, 2005
CALCIUM WAVES IN SYNCYTIAL DROSOPHILA EMBRYOS • PARRY ET AL. 57
MicroinjectionDrawn borosilicate glass micropipettes (GC150F-10; Clarke Electromedi-cal) were loaded with injection solution and advanced toward immobi-lized Drosophila embryos by using an Eppendorf microinjection system.All fluorescent probes for microinjection were dissolved in injection solu-tion (Ashburner et al., 2005) except Xestospongin C (Gafni et al., 1997),which was dissolved in DMSO for microinjection. The embryos were in-jected using gas pressure (pneumatic picopump; World Precision Instru-ments, Inc.). Cytoplasmic concentrations were calibrated by first measur-ing the size of droplets that were injected into the oil before injection intothe embryo. Embryos are �470 � 160 �m but can vary in length and di-ameter considerably. The approximate volume of an embryo is 6.5 nl,which was calculated by considering the volume of an ellipsoid of theabove dimensions. The volume of liquids that were injected into the em-bryo was estimated by measuring the diameter of a droplet injected undermineral oil. This was 28 �m, giving an injected volume of 12 pl (i.e.,�1:500 embryo vol). The concentration gradient of injected fluorescentprotein was calibrated by diffusion modeling (http://www.nrcam.uchc.edu/)to calculate the intraembryonic gradient of protein 15 min after microin-jection of a 12-pl vol of 200 �M GFP::p130. The fitted diffusion constantwas 3 �m/s1. The gradient remained stable from 10 min after microin-jection and for the rest of the time course of the experiment.
Fluorescence measurementsAn inverted confocal microscope (model DMIRBE; Leica) and either 20� PLFluotar NA 0.5 or 40� PL Apo NA 1.25 objectives (Leica) were used forall described experiments. The light source was an argon–krypton laserwith two excitation beams, which are available at 488 and 568 nm. Cal-cium measurements were performed using two fluorescent dyes: one wascalcium sensitive (10 kD CaGr) and the other was calcium insensitive(10 kD tetramethylrhodamine dextran [TMR]). CaGr was excited at 488nm, and TMR was excited at 568 nm with a dichroic mirror at 580 nm.Emission filters were a 530 � 30 nm FITC bandpass and a 590 nm long-pass. Images were acquired by using Scanware 5.1 software (Leica). Ratioimages were performed for each image pair after background subtraction.All image processing was performed on a silicon graphics computer usingIDL software (Research Systems International, Ltd.), and background-sub-tracted pixel values were displayed in pseudocolor using monochrome orrainbow look-up tables. Images were merged by using either Adobe Photo-shop or Metamorph software. All experiments were performed at 18�C.
The ER was labeled with 1,1�-dioctadecyl-3,3,3�,3�-tetramethylin-docarbocyanine perchlorate (DiIC18) to determine its distribution (molecu-lar mass of 933.8 D; Invitrogen). This dye was also used to visualize thelocation of the ER throughout early development of the Drosophila em-bryo. DiI was made up to a saturated concentration in soybean oil andwas microinjected into cells in an oil droplet. The dye diffused along thecontinuous ER. DiI was excited by the 568-nm line of the argon–krypton la-ser. The maximum emission wavelength of DiI is 575 nm. Excitation andemission wavelengths were separated by a DD488/568-nm beamsplitter.The emission light was passed back through the beamsplitter and througha barrier filter before entering the photomultiplier tube.
To monitor microtubule dynamics, 10 mg/ml rhodamine-labeled tu-bulin (Cytoskeleton, Inc.) was microinjected into the embryos (dye/proteinheterodimer stochiometry of 1.0). Identical settings that were used to recordTMR fluorescence were used to measure rhodamine tubulin fluorescence.
5 mg/ml rhodamine-labeled histone H1 was prepared (Harlow andLane, 1999) and injected into embryos to monitor the chromatin configu-ration to permit precise scoring of the stages of mitosis (dye protein stochi-ometry of 1.0). Identical settings that were used to record TMR fluores-cence was used to measure histone H1 fluorescence.
To measure actin dynamics, we used rhodamine or fluorescein-con-jugated rabbit nonmuscle actin (10 mg/ml dye/actin; labeling stochiome-try of 1:1; Cytoskeleton, Inc.).
Calibration of ratiometric calcium signalsThe fluorescence intensity of CaGr1 (made up in injection buffer) was de-termined in the absence of Ca2� and in the presence of saturating Ca2�.The fluorescence enhancement � (fluorescence in saturating Ca2�/fluores-cence in the absence of Ca2�) was found to be 2.55. Single wavelengthcalcium dyes cannot readily be calibrated absolutely in Drosophila em-bryos, so calcium concentrations were estimated by using the followingapproach (Isenberg et al., 1996):
Ca2+i[ ]
KD F α Ca2+[ ]r KD 1+⁄( ) Fr 1 Ca2+[ ]r+ KD⁄( )–[ ]
αFr 1 Ca2+[ ]r+ KD⁄( ) F α Ca2+[ ]r KD 1+⁄( )–-----------------------------------------------------------------------------------------------------------------------=
where Fr is the fluorescence at “resting” calcium ([Ca2�]r), which we havetaken to be 100 nM during mitosis of cycle 10. Gillot and Whitaker(1994) calculated the KD for CaGr1 (when coupled to a 10-kD dextran) tobe 2 �M in the sea urchin egg. The KD for CaGr1 in the Drosophila em-bryo is likely to be lower as a result of the ionic strength of the Drosophilaembryo’s cytoplasm, which is intermediate between that of marine andvertebrate embryos (Van der Meer and Jaffe, 1983). Accordingly, the cal-cium concentration in Fig. 1 has been calibrated by using two values forthe KD of 1 and 2 �M, respectively.
Protein expressionThe GFP::p130 domain construct (Takeuchi et al., 2000) was obtainedfrom M. Katan (Imperial College, London, UK) and was cloned into theexpression vector pGEX-6-p1 (GE Healthcare) as follows: GFP::p130 wascut with HindIII, and the 1.3-kb fragment was cloned into pBC SK (�) di-gested with HindIII. The 1.3-kb EcoRI-SalI fragment was then cloned inframe into pGEX-6-p1 that was cut with the same enzymes. Protein ex-pression and purification were performed in accordance with the sup-plied manual (GE Healthcare). InsP3 sponge constructs (wild-type andcontrol sponge) were subcloned from the supplied pGEM-T vector(Howard Baylis, University of Cambridge, Cambridge, UK; Walker et al.,2002) into the expression vector pCal-n (Stratagene). The NcoI-SalI frag-ment was subcloned in frame into pCal-n that was digested with the sameenzymes. Expression and purification was performed in accordance withthe supplied manual.
We thank Pierre Leopold for his early interest in this project, Maureen Sinclairand Trevor Jowett for help with Drosophila, Howard Baylis and Matilda Katanfor InsP3-binding protein constructs, and Michael Aitchison for help with prep-aration of the figures.
We also thank the Biotechnology and Biological Sciences ResearchCouncil and Wellcome Trust for financial support.
Submitted: 24 March 2005Accepted: 1 September 2005
ReferencesAcharya, J.K., K. Jalink, R.W. Hardy, V. Hartstein, and C.S. Zucker. 1997. InsP3
receptor is essential for growth and differentiation but not for vision inDrosophila. Neuron. 18:881–887.
Ashburner, M., G.G. Kent, and R.S. Hawley. 2005. Drosophila: A LaboratoryHandbook. Cold Spring Harbor Laboratory Press, Cold Spring Harbor,NY. 1409 pp.
Badminton, M.N., J.M. Kendall, C.M. Rembold, and A.K. Campbell. 1998.Current evidence suggests independent regulation of nuclear calcium.Cell Calcium. 23:79–86.
Baitinger, C., J. Alderton, M. Poenie, H. Schulman, and R.A. Steinhardt. 1990.Multifunctional Ca2�/calmodulin-dependent protein kinase is necessaryfor nuclear envelope breakdown. J. Cell Biol. 111:1763–1773.
Barr, F.A. 2002. Inheritance of the endoplasmic reticulum and Golgi apparatus.Curr. Opin. Cell Biol. 14:496–499.
Berridge, M.J., P. Lipp, and M.D. Bootman. 2000. The versatility and universalityof calcium signalling. Nat. Rev. Mol. Cell Biol. 1:11–21.
Bobinnec, Y., C. Marcaillou, X. Morin, and A. Debec. 2003. Dynamics of theendoplasmic reticulum during early development of Drosophila melano-gaster. Cell Motil. Cytoskeleton. 54:217–225.
Boring, L.F., B. Sinervo, and G. Schubiger. 1989. Experimental phenocopy ofa minute maternal effect mutation alters blastoderm determination inembryos of Drosophila melanogaster. Dev. Biol. 132:343–354.
Chang, D.C., and C.L. Meng. 1995. A localized elevation of cytosolic-free cal-cium is associated with cytokinesis in the zebrafish embryo. J. Cell Biol.131:1539–1545.
Ciapa, B., D. Pesando, M. Wilding, and M. Whitaker. 1994. Cell-cycle calciumtransients driven by cyclic changes in inositol trisphosphate levels. Nature.368:875–878.
Creton, R., J.A. Kreiling, and L.F. Jaffe. 2000. Presence and roles of calciumgradients along the dorsal-ventral axis in Drosophila embryos. Dev. Biol.217:375–385.
Edgar, B.A., and C.F. Lehner. 1996. Developmental control of cell cycle regula-tors: A fly’s perspective. Science. 274:1646–1652.
Elgin, S., and M.M. Miller. 1980. Mass rearing of flies and mass production andharvesting of embryos. In The Genetics and Biology of Drosophila. M.Ashburner and T.R.F. Wright, editors. Academic Press, NY. 112–121.
Evans, T., E.T. Rosenthal, J. Youngblom, D. Distel, and T. Hunt. 1983. Cyclin:
on July 22, 2014jcb.rupress.org
Dow
nloaded from
Published October 10, 2005
JCB • VOLUME 171 • NUMBER 1 • 200558
a protein specified by maternal mRNA in sea urchin eggs that is de-stroyed at each cleavage division. Cell. 33:389–396.
Fluck, R.A., A.L. Miller, and L.F. Jaffe. 1991. Slow calcium waves accompanycytokinesis in Medaka fish eggs. J. Cell Biol. 115:1259–1265.
Foe, V.E., and B.M. Alberts. 1983. Studies of nuclear and cytoplasmic behav-iour during the five mitotic cycles that precede gastrulation in Dro-sophila embryogenesis. J. Cell Sci. 61:31–70.
Foe, V.E., G.M. Odell, and B.A. Edgar. 1993. Mitosis and morphogenesis in theDrosophila embryo: point and counterpoint. In The Development ofDrosophila melanogaster. A. Martinez Arias, editor. Cold Spring HarborLaboratory Press, Cold Spring Harbor, NY. 149–300.
Foe, V.E., C.M. Field, and G.M. Odell. 2000. Microtubules and mitotic cyclephase modulate spatiotemporal distributions of F-actin and myosin II inDrosophila syncytial embryos. Development. 127:1767–1787.
Fukuda, M., and K. Mikoshiba. 1997. The function of inositol high polyphos-phate binding proteins. BioEssays. 19:593–603.
Gafni, J., J.A. Munsch, T.H. Lam, M.C. Catlin, L.G. Costa, T.F. Molinski, andI.N. Pessah. 1997. Xestospongins: potent membrane permeable blockersof the inositol 1,4,5-trisphosphate receptor. Neuron. 19:723–733.
Gautier, J., C. Norbury, M. Lohka, P. Nurse, and J. Maller. 1988. Purified matu-ration-promoting factor contains the product of a Xenopus homolog ofthe fission yeast cell cycle control gene cdc2�. Cell. 54:433–439.
Ghosh, T.K., P.S. Eis, J.M. Mullaney, C.L. Ebert, and D.L. Gill. 1988. Compet-itive, reversible, and potent antagonism of inositol 1,4,5-trisphosphate-activated calcium release by heparin. J. Biol. Chem. 263:11075–11079.
Gillot, I., and M. Whitaker. 1994. Calcium signals in and around the nucleus insea urchin eggs. Cell Calcium. 16:269–278.
Glover, D.M., S. Llamazares, C. Girdham, G. Maldanado Codina, A. Moreira, A.Tavares, C.E. Sunkel, and C. Gonzalez. 1991. Cyclical changes in the sub-cellular distribution of proteins essential for mitosis during embryogenesisin Drosophila. Cold Spring Harb. Symp. Quant. Biol. 56:709–717.
Glover, D.M., M. Leibowitz, D.A. McLean, and H. Parry. 1995. Mutations inaurora prevent centrosome separation leading to the formation ofmonopolar spindles. Cell. 81:95–105.
Gonzalez, C., L. Alphey, and D. Glover. 1994. Cell cycle genes of Drosophila.Adv. Genet. 31:79–138.
Groigno, L., and M. Whitaker. 1998. An anaphase calcium signal controls chro-mosome disjunction in early sea urchin embryos. Cell. 92:193–204.
Harel, A., E. Zlotkin, E.S. Nainudel, N. Feinstein, P.A. Fisher, and Y. Gruen-baum. 1989. Persistence of major nuclear envelope antigens in an enve-lope-like structure during mitosis in Drosophila melanogaster embryos.J. Cell Sci. 94:463–470.
Harlow, E., and D. Lane. 1999. Using Antibodies: A Laboratory Manual. ColdSpring Harbor Laboratory Press, Cold Spring Harbor, NY. 495 pp.
Harris, P. 1975. The role of membranes in the organization of the mitotic appa-ratus. Exp. Cell Res. 94:409–425.
Hasan, G., and M. Rosbash. 1992. Drosophila homologues of two mammalianintracellular Ca2�-release channels: identification and expression pat-terns of the inositol 1,4,5-trisphosphate and ryanodine receptor genes.Development. 116:967–975.
Hatanaka, K., and M. Odada. 1991. Retarded nuclear migration in Drosophilaembryos with aberrant F-actin reorganization caused by maternal muta-tions and by cytochalasin treatment. Development. 111:909–920.
Hu, Q., S. Deshpande, K. Irani, and R.C. Ziegelstein. 1999. [Ca(2�)](i) oscilla-tion frequency regulates agonist-stimulated NF-kappaB transcriptionalactivity. J. Biol. Chem. 274:33995–33998.
Isenberg, G., E.F. Etter, M.F. Wendt-Gallitelli, A. Schiefer, W.A. Carrington,R.A. Tuft, and F.S. Fay. 1996. Intrasarcomere [Ca2�] gradients in ven-tricular myocytes revealed by high speed digital imaging microscopy.Proc. Natl. Acad. Sci. USA. 93:5413–5418.
Kao, J.P., J. Alderton, R.Y. Tsien, and R.A. Steinhardt. 1990. Active involve-ment of Ca2� in mitotic progression of Swiss 3T3 fibroblasts. J. CellBiol. 111:183–196.
Lee, K.W., S.E. Webb, and A.L. Miller. 2003. Ca2� released via InsP3 receptors isrequired for furrow deepening during cytokinesis in zebrafish embryos.Int. J. Dev. Biol. 47:411–421.
Leung, C.F., S.E. Webb, and A.L. Miller. 1998. Calcium transients accom-pany ooplasmic segregation in zebrafish embryos. Dev. Growth Differ.40:313–326.
Lu, K.P., and A.R. Means. 1993. Regulation of the cell cycle by calcium andcalmodulin. Endocr. Rev. 14:40–48.
MacDonald, J.R. 1998. Nuclear calcium: transfer to and from the cytosol. Biol.Signals Recept. 7:137–147.
Mikoshiba, K. 1997. The InsP3 receptor and intracellular Ca2� signaling. Curr.Opin. Neurobiol. 7:339–345.
Miller, A.L., R.A. Fluck, J.A. McLaughin, and L.F. Jaffe. 1993. Calcium buffer
injections inhibit cytokinesis in Xenopus eggs. J. Cell Sci. 106:523–534.
Muto, A., and K. Mikoshiba. 1998. Activation of inositol 1,4,5-trisphosphate re-ceptors induces transient changes in cell shape of fertilized Xenopuseggs. Cell Motil. Cytoskeleton. 39:201–208.
Muto, A., S. Kume, T. Inoue, H. Okano, and K. Mikoshiba. 1996. Calciumwaves along the cleavage furrows in cleavage-stage Xenopus embryosand its inhibition by heparin. J. Cell Biol. 135:181–190.
Nixon, V.L., M. Levasseur, A. McDougall, and K.T. Jones. 2002. Ca2� oscilla-tions promote APC/C-dependent cyclin B1 degradation during metaphasearrest and completion of meiosis in fertilizing mouse eggs. Curr. Biol.12:746–750.
Paddy, M.R., H. Saumweber, D.A. Agard, and J.W. Sedat. 1996. Time-resolved,in vivo studies of mitotic spindle formation and nuclear lamina break-down in Drosophila early embryos. J. Cell Sci. 109:591–607.
Patel, R., M. Holt, R. Philipova, S. Moss, H. Schulman, H. Hidaka, and M. Whit-aker. 1999. Calcium/calmodulin-dependent phosphorylation and activa-tion of human Cdc25-C at the G2/M phase transition in HeLa cells. J.Biol. Chem. 274:7958–7968.
Poenie, M., J. Alderton, R.Y. Tsien, and R.A. Steinhardt. 1985. Changes of freecalcium levels with stages of the cell division cycle. Nature. 315:147–149.
Riggs, B., W. Rothwell, S. Mische, G.R.X. Hickson, J. Matheson, T.S. Hays,G.W. Gould, and W. Sullivan. 2003. Actin cytoskeleton remodellingduring early Drosophila furrow formation requires recycling endosomalcomponents Nuclear-fallout and Rab11. J. Cell Biol. 163:143–154.
Rizzuto, R., and T. Pozzan. 2003. When calcium goes wrong: genetic alterationsof a ubiquitous signaling route. Nat. Genet. 34:135–141.
Roegiers, F., A. McDougall, and C. Sardet. 1995. The sperm entry point definesthe orientation of the calcium-induced contraction wave that directs thefirst phase of cytoplasmic reorganization in the ascidian egg. Development.121:3457–3466.
Ross, C.A., J. Meldolesi, T.A. Milner, T. Satoh, S. Supattapone, and S.H. Sny-der. 1989. Inositol 1,4,5-trisphosphate receptor localized to endoplasmicreticulum in cerebellar Purkinje neurons. Nature. 339:468–470.
Shuster, C.B., and D.R. Burgess. 2002. Targeted new membrane addition in thecleavage furrow is a late, separate event in cytokinesis. Proc. Natl. Acad.Sci. USA. 99:3633–3638.
Silver, R.B., R.D. Cole, and W.Z. Cande. 1980. Isolation of mitotic apparatus con-taining vesicles with calcium sequestration activity. Cell. 19:505–516.
Snow, P., and R. Nuccitelli. 1993. Calcium buffer injections delay cleavage inXenopus laevis blastomeres by dissipating Ca2� gradients. J. Cell Biol.122:387–394.
Steinhardt, R.A., and J. Alderton. 1988. Intracellular free calcium rise triggers nu-clear envelope breakdown in the sea urchin embryo. Nature. 332:364–366.
Steinhardt, R.A., D. Epel, E.J. Carroll, and R. Yanagimachi. 1974. Is calciumionophore a universal activator for unfertilised eggs? Nature. 252:41–43.
Sullivan, W., and W. Theurkauf. 1995. The cytoskeleton and morphogenesis ofthe early Drosophila embryo. Curr. Opin. Cell Biol. 7:18–22.
Sunkel, C.E., and D.M. Glover. 1988. Polo, a mitotic mutant of Drosophila dis-playing abnormal spindle poles. J. Cell Sci. 89:25–38.
Takeuchi, H., M. Oike, H.F. Paterson, V. Allen, T. Kanematsu, Y. Ito, C. Er-neux, M. Katan, and M. Hirata. 2000. Inhibition of Ca2� signalling byp130, a phospholipase-C-related catalytically inactive protein: criticalrole of the p130 pleckstrin homology domain. Biochem. J. 349:357–368.
Takuwa, N., W. Zhou, and Y. Takuwa. 1995. Calcium, calmodulin and cell cy-cle progression. Cell. Signal. 7:93–104.
Terasaki, M., and L.A. Jaffe. 1991. Organization of the sea urchin egg endo-plasmic reticulum and its reorganization at fertilization. J. Cell Biol.114:929–940.
Tombes, R.M., and G.G. Borisy. 1989. Intracellular free calcium and mitosis inmammalian cells: anaphase onset is calcium modulated, but is not trig-gered by a brief transient. J. Cell Biol. 109:627–636.
Tombes, R.M., C. Simerly, G.G. Borisy, and G. Schatten. 1992. Meiosis, eggactivation and nuclear envelope breakdown are differentially reliant onCa2�, whereas germinal vesicle breakdown is Ca2� independent in themouse oocyte. J. Cell Biol. 117:799–811.
Török, K., M. Wilding, L. Groigno, R. Patel, and M. Whitaker. 1998. Imagingthe spatial dynamics of calmodulin activation during mitosis. Curr. Biol.8:692–699.
Twigg, J., R. Patel, and M. Whitaker. 1988a. Translational control of InsP3-induced chromatin condensation during the early cell cycles of sea ur-chin embryos. Nature. 332:366–369.
Twigg, J., R. Patel, and M. Whitaker. 1988b. Translational control of InsP3-induced chromatin condensation during the early cell cycles of sea ur-chin embryos. Nature. 332:366–369.
Uchiyama, T., F. Yoshikawa, A. Hishida, T. Furuichi, and K. Mikoshiba. 2002.A novel recombinant hyperaffinity inositol 1,4,5-trisphosphate (IP(3))
on July 22, 2014jcb.rupress.org
Dow
nloaded from
Published October 10, 2005
CALCIUM WAVES IN SYNCYTIAL DROSOPHILA EMBRYOS • PARRY ET AL. 59
absorbent traps IP(3), resulting in specific inhibition of IP(3)-mediatedcalcium signaling. J. Biol. Chem. 277:8106–8113.
Van der Meer, J.M., and L.F. Jaffe. 1983. Elemental composition of the perivi-telline fluid in early Drosophila embryos. Dev. Biol. 95:249–252.
Walker, D.S., N.J.D. Gower, S. Ly, G.L. Bradley, and H.A. Baylis. 2002. Regu-lated disruption of inositol 1,4,5-trisphosphate signalling in Caenorhab-ditis elegans reveals new functions in feeding and embryogenesis. Mol.Biol. Cell. 13:1329–1337.
Webb, D.J., and R. Nuccitelli. 1985. Fertilization potential and electricalproperties of the Xenopus laevis egg. Dev. Biol. 107:395–406.
Webb, S.E., and A.L. Miller. 2003. Calcium signalling during embryonic devel-opment. Nat. Rev. Mol. Cell Biol. 4:539–551.
Webb, S.E., K.W. Lee, E. Karplus, and A.L. Miller. 1997. Localized calcium tran-sients accompany furrow positioning, propagation, and deepening duringthe early cleavage period of zebrafish embryos. Dev. Biol. 192:78–92.
Whitaker, M., and M.G. Larman. 2001. Calcium and mitosis. Semin. Cell Dev.Biol. 12:53–58.
Wilding, M., E.M. Wright, R. Patel, G. Ellis-Davies, and M. Whitaker. 1996.Local perinuclear signals associated with mitosis-entry in early sea ur-chin embryos. J. Cell Biol. 135:191–199.
Yoshikawa, S., T. Tanimura, A. Miyawaki, M. Nakamura, M. Yuzaki, T. Furui-chi, and K. Mikoshiba. 1992. Molecular cloning and characterization ofthe inositol 1,4,5-trisphosphate receptor in Drosophila melanogaster.J. Biol. Chem. 267:16613–16619.
Zalokar, M., and I. Erk. 1976. Division and migration of nuclei during early em-bryogenesis of Drosophila melanogaster. J. Microsc. Biol. Cell. 25:97–106.
on July 22, 2014jcb.rupress.org
Dow
nloaded from
Published October 10, 2005