microbiology research - academic journals
TRANSCRIPT

African Journal of
Microbiology Research
Volume 9 Number 28, 15 July, 2015
ISSN 1996-0808

ABOUT AJMR
The African Journal of Microbiology Research (AJMR) (ISSN 1996-0808) is published Weekly (one volume per year) by Academic Journals.
African Journal of Microbiology Research (AJMR) provides rapid publication (weekly) of articles in all areas of Microbiology such as: Environmental Microbiology, Clinical Microbiology, Immunology, Virology, Bacteriology, Phycology, Mycology and Parasitology, Protozoology, Microbial Ecology, Probiotics and Prebiotics, Molecular Microbiology, Biotechnology, Food Microbiology, Industrial Microbiology, Cell Physiology, Environmental Biotechnology, Genetics, Enzymology, Molecular and Cellular Biology, Plant Pathology, Entomology, Biomedical Sciences, Botany and Plant Sciences, Soil and Environmental Sciences, Zoology, Endocrinology, Toxicology. The Journal welcomes the submission of manuscripts that meet the general criteria of significance and scientific excellence. Papers will be published shortly after acceptance. All articles are peer-reviewed.
Submission of Manuscript
Please read the Instructions for Authors before submitting your manuscript. The manuscript files should be given the last name of the first author Click here to Submit manuscripts online If you have any difficulty using the online submission system, kindly submit via this email [email protected]. With questions or concerns, please contact the Editorial Office at [email protected].

Editors Prof. Dr. Stefan Schmidt, Applied and Environmental Microbiology School of Biochemistry, Genetics and Microbiology University of KwaZulu-Natal Private Bag X01 Scottsville, Pietermaritzburg 3209 South Africa. Prof. Fukai Bao Department of Microbiology and Immunology Kunming Medical University Kunming 650031, China Dr. Jianfeng Wu Dept. of Environmental Health Sciences, School of Public Health, University of Michigan USA Dr. Ahmet Yilmaz Coban OMU Medical School, Department of Medical Microbiology, Samsun, Turkey Dr. Seyed Davar Siadat Pasteur Institute of Iran, Pasteur Square, Pasteur Avenue, Tehran, Iran. Dr. J. Stefan Rokem The Hebrew University of Jerusalem Department of Microbiology and Molecular Genetics, P.O.B. 12272, IL-91120 Jerusalem, Israel Prof. Long-Liu Lin National Chiayi University 300 Syuefu Road, Chiayi, Taiwan N. John Tonukari, Ph.D Department of Biochemistry Delta State University PMB 1 Abraka, Nigeria
Dr. Thaddeus Ezeji Assistant Professor Fermentation and Biotechnology Unit Department of Animal Sciences The Ohio State University 1680 Madison Avenue USA.
Associate Editors Dr. Mamadou Gueye MIRCEN/ Laboratoire commun de microbiologie IRD-ISRA-UCAD, BP 1386, DAKAR, Senegal. Dr. Caroline Mary Knox Department of Biochemistry, Microbiology and Biotechnology Rhodes University Grahamstown 6140 South Africa. Dr. Hesham Elsayed Mostafa Genetic Engineering and Biotechnology Research Institute (GEBRI) Mubarak City For Scientific Research, Research Area, New Borg El-Arab City, Post Code 21934, Alexandria, Egypt. Dr. Wael Abbas El-Naggar Head of Microbiology Department, Faculty of Pharmacy, Mansoura University, Mansoura 35516, Egypt. Dr. Abdel Nasser A. El-Moghazy Microbiology, Molecular Biology, Genetics Engineering and Biotechnology Dept of Microbiology and Immunology Faculty of Pharmacy Al-Azhar University Nasr city, Cairo, Egypt

Dr. Barakat S.M. Mahmoud Food Safety/Microbiology Experimental Seafood Processing Laboratory Costal Research and Extension Center Mississippi State University 3411 Frederic Street Pascagoula, MS 39567 USA Prof. Mohamed Mahrous Amer Poultry Disease (Viral Diseases of poultry) Faculty of Veterinary Medicine, Department of Poultry Diseases Cairo university Giza, Egypt Dr. Xiaohui Zhou Molecular Microbiology, Industrial Microbiology, Environmental Microbiology, Pathogenesis, Antibiotic resistance, Microbial Ecology Washington State University Bustad Hall 402 Department of Veterinary Microbiology and Pathology, Pullman, USA Dr. R. Balaji Raja Department of Biotechnology, School of Bioengineering, SRM University, Chennai India Dr. Aly E Abo-Amer Division of Microbiology, Botany Department, Faculty of Science, Sohag University. Egypt.
Editorial Board
Dr. Haoyu Mao Department of Molecular Genetics and Microbiology College of Medicine University of Florida Florida, Gainesville USA. Dr. Rachna Chandra Environmental Impact Assessment Division Environmental Sciences Sálim Ali Center for Ornithology and Natural History (SACON), Anaikatty (PO), Coimbatore-641108, India Dr. Yongxu Sun Department of Medicinal Chemistry and Biomacromolecules Qiqihar Medical University, Qiqihar 161006 Heilongjiang Province P.R. China Dr. Ramesh Chand Kasana Institute of Himalayan Bioresource Technology Palampur, Distt. Kangra (HP), India Dr. S. Meena Kumari Department of Biosciences Faculty of Science University of Mauritius Reduit Dr. T. Ramesh Assistant Professor Marine Microbiology CAS in Marine Biology Faculty of Marine Sciences Annamalai University Parangipettai - 608 502 Cuddalore Dist. Tamilnadu, India Dr. Pagano Marcela Claudia Post doctoral fellowship at Department of Biology, Federal University of Ceará - UFC, Brazil.

Dr. EL-Sayed E. Habib Associate Professor, Dept. of Microbiology, Faculty of Pharmacy, Mansoura University, Egypt. Dr. Pongsak Rattanachaikunsopon Department of Biological Science, Faculty of Science, Ubon Ratchathani University, Warin Chamrap, Ubon Ratchathani 34190, Thailand Dr. Gokul Shankar Sabesan Microbiology Unit, Faculty of Medicine, AIMST University Jalan Bedong, Semeling 08100, Kedah, Malaysia Dr. Kwang Young Song Department of Biological Engineering, School of Biological and Chemical Engineering, Yanbian Universityof Science and Technology, Yanji, China. Dr. Kamel Belhamel Faculty of Technology, University of Bejaia Algeria Dr. Sladjana Jevremovic Institute for Biological Research Sinisa Stankovic, Belgrade, Serbia Dr. Tamer Edirne Dept. of Family Medicine, Univ. of Pamukkale Turkey Dr. R. Balaji Raja M.Tech (Ph.D) Assistant Professor, Department of Biotechnology, School of Bioengineering, SRM University, Chennai. India Dr. Minglei Wang University of Illinois at Urbana-Champaign,USA
Dr. Mohd Fuat ABD Razak Institute for Medical Research Malaysia Dr. Davide Pacifico Istituto di Virologia Vegetale – CNR Italy Prof. Dr. Akrum Hamdy Faculty of Agriculture, Minia University, Egypt Egypt Dr. Ntobeko A. B. Ntusi Cardiac Clinic, Department of Medicine, University of Cape Town and Department of Cardiovascular Medicine, University of Oxford South Africa and United Kingdom Prof. N. S. Alzoreky Food Science & Nutrition Department, College of Agricultural Sciences & Food, King Faisal University, Saudi Arabia Dr. Chen Ding College of Material Science and Engineering, Hunan University, China Dr Svetlana Nikolić Faculty of Technology and Metallurgy, University of Belgrade, Serbia Dr. Sivakumar Swaminathan Department of Agronomy, College of Agriculture and Life Sciences, Iowa State University, Ames, Iowa 50011 USA Dr. Alfredo J. Anceno School of Environment, Resources and Development (SERD), Asian Institute of Technology, Thailand Dr. Iqbal Ahmad Aligarh Muslim University, Aligrah India

Dr. Josephine Nketsia-Tabiri Ghana Atomic Energy Commission Ghana Dr. Juliane Elisa Welke UFRGS – Universidade Federal do Rio Grande do Sul Brazil Dr. Mohammad Nazrul Islam NIMR; IPH-Bangalore & NIUM Bangladesh Dr. Okonko, Iheanyi Omezuruike Department of Virology, Faculty of Basic Medical Sciences, College of Medicine, University of Ibadan, University College Hospital, Ibadan, Nigeria Dr. Giuliana Noratto Texas A&M University USA Dr. Phanikanth Venkata Turlapati Washington State University USA Dr. Khaleel I. Z. Jawasreh National Centre for Agricultural Research and Extension, NCARE Jordan Dr. Babak Mostafazadeh, MD Shaheed Beheshty University of Medical Sciences Iran Dr. S. Meena Kumari Department of Biosciences Faculty of Science University of Mauritius Reduit Mauritius Dr. S. Anju Department of Biotechnology, SRM University, Chennai-603203 India Dr. Mustafa Maroufpor Iran
Prof. Dong Zhichun Professor, Department of Animal Sciences and Veterinary Medicine, Yunnan Agriculture University, China Dr. Mehdi Azami Parasitology & Mycology Dept, Baghaeei Lab., Shams Abadi St. Isfahan Iran Dr. Anderson de Souza Sant’Ana University of São Paulo. Brazil. Dr. Juliane Elisa Welke UFRGS – Universidade Federal do Rio Grande do Sul Brazil Dr. Paul Shapshak USF Health, Depts. Medicine (Div. Infect. Disease & Internat Med) and Psychiatry & Beh Med. USA Dr. Jorge Reinheimer Universidad Nacional del Litoral (Santa Fe) Argentina Dr. Qin Liu East China University of Science and Technology China Dr. Xiao-Qing Hu State Key Lab of Food Science and Technology Jiangnan University P. R. China Prof. Branislava Kocic Specaialist of Microbiology and Parasitology University of Nis, School of Medicine Institute for Public Health Nis, Bul. Z. Djindjica 50, 18000 Nis Serbia Dr. Rafel Socias CITA de Aragón, Spain

Prof. Kamal I. Mohamed State University of New York at Oswego USA Dr. Adriano Cruz Faculty of Food Engineering-FEA University of Campinas (UNICAMP) Brazil Dr. Mike Agenbag (Michael Hermanus Albertus) Manager Municipal Health Services, Joe Gqabi District Municipality South Africa Dr. D. V. L. Sarada Department of Biotechnology, SRM University, Chennai-603203 India. Dr. Samuel K Ameyaw Civista Medical Center United States of America Prof. Huaizhi Wang Institute of Hepatopancreatobiliary Surgery of PLA Southwest Hospital, Third Military Medical University Chongqing400038 P. R. China Prof. Bakhiet AO College of Veterinary Medicine, Sudan University of Science and Technology Sudan Dr. Saba F. Hussain Community, Orthodontics and Peadiatric Dentistry Department Faculty of Dentistry Universiti Teknologi MARA 40450 Shah Alam, Selangor Malaysia Prof. Dr. Zohair I.F.Rahemo State Key Lab of Food Science and Technology Jiangnan University P. R. China Dr. Afework Kassu University of Gondar Ethiopia
Prof. Isidro A. T. Savillo ISCOF Philippines Dr. How-Yee Lai Taylor’s University College Malaysia Dr. Nidheesh Dadheech MS. University of Baroda, Vadodara, Gujarat, India. India Dr. Omitoyin Siyanbola Bowen University, Iwo Nigeria Dr. Franco Mutinelli Istituto Zooprofilattico Sperimentale delle Venezie Italy Dr. Chanpen Chanchao Department of Biology, Faculty of Science, Chulalongkorn University Thailand Dr. Tsuyoshi Kasama Division of Rheumatology, Showa University Japan Dr. Kuender D. Yang, MD. Chang Gung Memorial Hospital Taiwan Dr. Liane Raluca Stan University Politehnica of Bucharest, Department of Organic Chemistry “C.Nenitzescu” Romania Dr. Muhamed Osman Senior Lecturer of Pathology & Consultant Immunopathologist Department of Pathology, Faculty of Medicine, Universiti Teknologi MARA, 40450 Shah Alam, Selangor Malaysia Dr. Mohammad Feizabadi Tehran University of medical Sciences Iran

Prof. Ahmed H Mitwalli State Key Lab of Food Science and Technology Jiangnan University P. R. China Dr. Mazyar Yazdani Department of Biology, University of Oslo, Blindern, Oslo, Norway Dr. Ms. Jemimah Gesare Onsare Ministry of Higher, Education Science and Technology Kenya Dr. Babak Khalili Hadad Department of Biological Sciences, Roudehen Branch, Islamic Azad University, Roudehen Iran Dr. Ehsan Sari Department of Plan Pathology, Iranian Research Institute of Plant Protection, Tehran, Iran. Dr. Snjezana Zidovec Lepej University Hospital for Infectious Diseases Zagreb, Croatia Dr. Dilshad Ahmad King Saud University Saudi Arabia Dr. Adriano Gomes da Cruz University of Campinas (UNICAMP) Brazil Dr. Hsin-Mei Ku Agronomy Dept. NCHU 250 Kuo Kuang Rd, Taichung, Taiwan Dr. Fereshteh Naderi Physical chemist, Islamic Azad University, Shahre Ghods Branch Iran
Dr. Adibe Maxwell Ogochukwu Department of Clinical Pharmacy and Pharmacy Management, University of Nigeria, Nsukka. Nigeria Dr. William M. Shafer Emory University School of Medicine USA Dr. Michelle Bull CSIRO Food and Nutritional Sciences Australia Prof. Dr. Márcio Garcia Ribeiro (DVM, PhD) School of Veterinary Medicine and Animal Science- UNESP, Dept. Veterinary Hygiene and Public Health, State of Sao Paulo Brazil Prof. Dr. Sheila Nathan National University of Malaysia (UKM) Malaysia Prof. Ebiamadon Andi Brisibe University of Calabar, Calabar, Nigeria Dr. Julie Wang Burnet Institute Australia Dr. Jean-Marc Chobert INRA- BIA, FIPL France Dr. Zhilong Yang, PhD Laboratory of Viral Diseases National Institute of Allergy and Infectious Diseases, National Institutes of Health Dr. Dele Raheem University of Helsinki Finland Dr. Li Sun PLA Centre for the treatment of infectious diseases, Tangdu Hospital, Fourth Military Medical University China

Dr. Biljana Miljkovic-Selimovic School of Medicine, University in Nis, Serbia; Referent laboratory for Campylobacter and Helicobacter, Center for Microbiology, Institute for Public Health, Nis Serbia Dr. Xinan Jiao Yangzhou University China Dr. Endang Sri Lestari, MD. Department of Clinical Microbiology, Medical Faculty, Diponegoro University/Dr. Kariadi Teaching Hospital, Semarang Indonesia Dr. Hojin Shin Pusan National University Hospital South Korea Dr. Yi Wang Center for Vector Biology, 180 Jones Avenue Rutgers University, New Brunswick, NJ 08901-8536 USA Dr. Heping Zhang The Key Laboratory of Dairy Biotechnology and Engineering, Ministry of Education, Inner Mongolia Agricultural University. China Prof. Natasha Potgieter University of Venda South Africa Dr. Alemzadeh Sharif University Iran Dr. Sonia Arriaga Instituto Potosino de Investigación Científicay Tecnológica/División de Ciencias Ambientales Mexico Dr. Armando Gonzalez-Sanchez Universidad Autonoma Metropolitana Cuajimalpa Mexico
Dr. Pradeep Parihar Lovely Professional University, Phagwara, Punjab. India Dr. William H Roldán Department of Medical Microbiology, Faculty of Medicine, Peru Dr. Kanzaki, L I B Laboratory of Bioprospection. University of Brasilia Brazil Prof. Philippe Dorchies Laboratory of Bioprospection. University of Brasilia Brazil Dr. C. Ganesh Kumar Indian Institute of Chemical Technology, Hyderabad India Dr. Farid Che Ghazali Universiti Sains Malaysia (USM) Malaysia Dr. Samira Bouhdid Abdelmalek Essaadi University, Tetouan, Morocco Dr. Zainab Z. Ismail Department of Environmental Engineering, University of Baghdad. Iraq Dr. Ary Fernandes Junior Universidade Estadual Paulista (UNESP) Brasil Dr. Papaevangelou Vassiliki Athens University Medical School Greece Dr. Fangyou Yu The first Affiliated Hospital of Wenzhou Medical College China Dr. Galba Maria de Campos Takaki Catholic University of Pernambuco Brazil

Dr. Kwabena Ofori-Kwakye Department of Pharmaceutics, Kwame Nkrumah University of Science & Technology, KUMASI Ghana Prof. Dr. Liesel Brenda Gende Arthropods Laboratory, School of Natural and Exact Sciences, National University of Mar del Plata Buenos Aires, Argentina. Dr. Adeshina Gbonjubola Ahmadu Bello University, Zaria. Nigeria Prof. Dr. Stylianos Chatzipanagiotou University of Athens – Medical School Greec Dr. Dongqing BAI Department of Fishery Science, Tianjin Agricultural College, Tianjin 300384 P. R. China Dr. Dingqiang Lu Nanjing University of Technology P.R. China Dr. L. B. Sukla Scientist –G & Head, Biominerals Department, IMMT, Bhubaneswar India Dr. Hakan Parlakpinar MD. Inonu University, Medical Faculty, Department of Pharmacology, Malatya Turkey Dr Pak-Lam Yu Massey University New Zealand Dr Percy Chimwamurombe University of Namibia Namibia Dr. Euclésio Simionatto State University of Mato Grosso do Sul-UEMS Brazil
Dr. Hans-Jürg Monstein Clinical Microbiology, Molecular Biology Laboratory, University Hospital, Faculty of Health Sciences, S-581 85 Linköping Sweden Dr. Ajith, T. A Associate Professor Biochemistry, Amala Institute of Medical Sciences, Amala Nagar, Thrissur, Kerala-680 555 India Dr. Feng-Chia Hsieh Biopesticides Division, Taiwan Agricultural Chemicals and Toxic Substances Research Institute, Council of Agriculture Taiwan Prof. Dra. Suzan Pantaroto de Vasconcellos Universidade Federal de São Paulo Rua Prof. Artur Riedel, 275 Jd. Eldorado, Diadema, SP CEP 09972-270 Brasil Dr. Maria Leonor Ribeiro Casimiro Lopes Assad Universidade Federal de São Carlos - Centro de Ciências Agrárias - CCA/UFSCar Departamento de Recursos Naturais e Proteção Ambiental Rodovia Anhanguera, km 174 - SP-330 Araras - São Paulo Brasil Dr. Pierangeli G. Vital Institute of Biology, College of Science, University of the Philippines Philippines Prof. Roland Ndip University of Fort Hare, Alice South Africa Dr. Shawn Carraher University of Fort Hare, Alice South Africa Dr. José Eduardo Marques Pessanha Observatório de Saúde Urbana de Belo Horizonte/Faculdade de Medicina da Universidade Federal de Minas Gerais Brasil

Dr. Yuanshu Qian Department of Pharmacology, Shantou University Medical College China Dr. Helen Treichel URI-Campus de Erechim Brazil Dr. Xiao-Qing Hu State Key Lab of Food Science and Technology Jiangnan University P. R. China Dr. Olli H. Tuovinen Ohio State University, Columbus, Ohio USA Prof. Stoyan Groudev University of Mining and Geology “Saint Ivan Rilski” Sofia Bulgaria Dr. G. Thirumurugan Research lab, GIET School of Pharmacy, NH-5, Chaitanya nagar, Rajahmundry-533294. India Dr. Charu Gomber Thapar University India Dr. Jan Kuever Bremen Institute for Materials Testing, Department of Microbiology, Paul-Feller-Str. 1, 28199 Bremen Germany Dr. Nicola S. Flanagan Universidad Javeriana, Cali Colombia Dr. André Luiz C. M. de A. Santiago Universidade Federal Rural de Pernambuco Brazil Dr. Dhruva Kumar Jha Microbial Ecology Laboratory, Department of Botany, Gauhati University, Guwahati 781 014, Assam India
Dr. N Saleem Basha M. Pharm (Pharmaceutical Biotechnology) Eritrea (North East Africa) Prof. Dr. João Lúcio de Azevedo Dept. Genetics-University of São Paulo-Faculty of Agriculture- Piracicaba, 13400-970 Brasil Dr. Julia Inés Fariña PROIMI-CONICET Argentina Dr. Yutaka Ito Kyoto University Japan Dr. Cheruiyot K. Ronald Biomedical Laboratory Technologist Kenya Prof. Dr. Ata Akcil S. D. University Turkey Dr. Adhar Manna The University of South Dakota USA Dr. Cícero Flávio Soares Aragão Federal University of Rio Grande do Norte Brazil Dr. Gunnar Dahlen Institute of odontology, Sahlgrenska Academy at University of Gothenburg Sweden Dr. Pankaj Kumar Mishra Vivekananda Institute of Hill Agriculture, (I.C.A.R.), ALMORA-263601, Uttarakhand India Dr. Benjamas W. Thanomsub Srinakharinwirot University Thailand Dr. Maria José Borrego National Institute of Health – Department of Infectious Diseases Portugal

Dr. Catherine Carrillo Health Canada, Bureau of Microbial Hazards Canada Dr. Marcotty Tanguy Institute of Tropical Medicine Belgium Dr. Han-Bo Zhang Laboratory of Conservation and Utilization for Bio-resources Key Laboratory for Microbial Resources of the Ministry of Education, Yunnan University, Kunming 650091. School of Life Science, Yunnan University, Kunming, Yunnan Province 650091. China Dr. Ali Mohammed Somily King Saud University Saudi Arabia Dr. Nicole Wolter National Institute for Communicable Diseases and University of the Witwatersrand, Johannesburg South Africa Dr. Marco Antonio Nogueira Universidade Estadual de Londrina CCB/Depto. De microbiologia Laboratório de Microbiologia Ambiental Caixa Postal 6001 86051-980 Londrina. Brazil Dr. Bruno Pavoni Department of Environmental Sciences University of Venice Italy Dr. Shih-Chieh Lee Da-Yeh University Taiwan Dr. Satoru Shimizu Horonobe Research Institute for the Subsurface Environment, Northern Advancement Center for Science & Technology Japan
Dr. Tang Ming College of Forestry, Northwest A&F University, Yangling China Dr. Olga Gortzi Department of Food Technology, T.E.I. of Larissa Greece Dr. Mark Tarnopolsky Mcmaster University Canada Dr. Sami A. Zabin Al Baha University Saudi Arabia Dr. Julia W. Pridgeon Aquatic Animal Health Research Unit, USDA, ARS USA Dr. Lim Yau Yan Monash University Sunway Campus Malaysia Prof. Rosemeire C. L. R. Pietro Faculdade de Ciências Farmacêuticas de Araraquara, Univ Estadual Paulista, UNESP Brazil Dr. Nazime Mercan Dogan PAU Faculty of Arts and Science, Denizli Turkey Dr Ian Edwin Cock Biomolecular and Physical Sciences Griffith University Australia Prof. N K Dubey Banaras Hindu University India Dr. S. Hemalatha Department of Pharmaceutics, Institute of Technology, Banaras Hindu University, Varanasi. 221005 India Dr. J. Santos Garcia A. Universidad A. de Nuevo Leon Mexico India

Dr. Somboon Tanasupawat Department of Biochemistry and Microbiology, Faculty of Pharmaceutical Sciences, Chulalongkorn University, Bangkok 10330 Thailand Dr. Vivekananda Mandal Post Graduate Department of Botany, Darjeeling Government College, Darjeeling – 734101. India Dr. Shihua Wang College of Life Sciences, Fujian Agriculture and Forestry University China Dr. Victor Manuel Fernandes Galhano CITAB-Centre for Research and Technology of Agro-Environment and Biological Sciences, Integrative Biology and Quality Research Group, University of Trás-os-Montes and Alto Douro, Apartado 1013, 5001-801 Vila Real Portugal Dr. Maria Cristina Maldonado Instituto de Biotecnologia. Universidad Nacional de Tucuman Argentina Dr. Alex Soltermann Institute for Surgical Pathology, University Hospital Zürich Switzerland Dr. Dagmara Sirova Department of Ecosystem Biology, Faculty Of Science, University of South Bohemia, Branisovska 37, Ceske Budejovice, 37001 Czech Republic Dr. E. O Igbinosa Department of Microbiology, Ambrose Alli University, Ekpoma, Edo State, Nigeria. Dr. Hodaka Suzuki National Institute of Health Sciences Japan
Dr. Mick Bosilevac US Meat Animal Research Center USA Dr. Nora Lía Padola Imunoquímica y Biotecnología- Fac Cs Vet-UNCPBA Argentina Dr. Maria Madalena Vieira-Pinto Universidade de Trás-os-Montes e Alto Douro Portugal Dr. Stefano Morandi CNR-Istituto di Scienze delle Produzioni Alimentari (ISPA), Sez. Milano Italy Dr Line Thorsen Copenhagen University, Faculty of Life Sciences Denmark Dr. Ana Lucia Falavigna-Guilherme Universidade Estadual de Maringá Brazil Dr. Baoqiang Liao Dept. of Chem. Eng., Lakehead University, 955 Oliver Road, Thunder Bay, Ontario Canada Dr. Ouyang Jinping Patho-Physiology department, Faculty of Medicine of Wuhan University China Dr. John Sorensen University of Manitoba Canada Dr. Andrew Williams University of Oxford United Kingdom Dr. Chi-Chiang Yang Chung Shan Medical University Taiwan, R.O.C. Dr. Quanming Zou Department of Clinical Microbiology and Immunology, College of Medical Laboratory, Third Military Medical University China

Prof. Ashok Kumar School of Biotechnology, Banaras Hindu University, Varanasi India Dr. Chung-Ming Chen Department of Pediatrics, Taipei Medical University Hospital, Taipei Taiwan Dr. Jennifer Furin Harvard Medical School USA Dr. Julia W. Pridgeon Aquatic Animal Health Research Unit, USDA, ARS USA Dr Alireza Seidavi Islamic Azad University, Rasht Branch Iran Dr. Thore Rohwerder Helmholtz Centre for Environmental Research UFZ Germany Dr. Daniela Billi University of Rome Tor Vergat Italy Dr. Ivana Karabegovic Faculty of Technology, Leskovac, University of Nis Serbia Dr. Flaviana Andrade Faria IBILCE/UNESP Brazil Prof. Margareth Linde Athayde Federal University of Santa Maria Brazil Dr. Guadalupe Virginia Nevarez Moorillon Universidad Autonoma de Chihuahua Mexico Dr. Tatiana de Sousa Fiuza Federal University of Goias Brazil Dr. Indrani B. Das Sarma Jhulelal Institute of Technology, Nagpur India
Dr. Guanghua Wang Northeast Institute of Geography and Agroecology, Chinese Academy of Sciences China Dr. Renata Vadkertiova Institute of Chemistry, Slovak Academy of Science Slovakia Dr. Charles Hocart The Australian National University Australia Dr. Guoqiang Zhu University of Yangzhou College of Veterinary Medicine China Dr. Guilherme Augusto Marietto Gonçalves São Paulo State University Brazil Dr. Mohammad Ali Faramarzi Tehran University of Medical Sciences Iran Dr. Suppasil Maneerat Department of Industrial Biotechnology, Faculty of Agro-Industry, Prince of Songkla University, Hat Yai 90112 Thailand Dr. Francisco Javier Las heras Vazquez Almeria University Spain Dr. Cheng-Hsun Chiu Chang Gung memorial Hospital, Chang Gung University Taiwan Dr. Ajay Singh DDU Gorakhpur University, Gorakhpur-273009 (U.P.) India Dr. Karabo Shale Central University of Technology, Free State South Africa Dr. Lourdes Zélia Zanoni Department of Pediatrics, School of Medicine, Federal University of Mato Grosso do Sul, Campo Grande, Mato Grosso do Sul Brazil

Dr. Tulin Askun Balikesir University Turkey Dr. Marija Stankovic Institute of Molecular Genetics and Genetic Engineering Republic of Serbia Dr. Scott Weese University of Guelph Dept of Pathobiology, Ontario Veterinary College, University of Guelph, Guelph, Ontario, N1G2W1, Canada Dr. Sabiha Essack School of Health Sciences South African Committee of Health Sciences University of KwaZulu-Natal Private Bag X54001 Durban 4000 South Africa Dr. Hare Krishna Central Institute for Arid Horticulture, Beechwal, Bikaner-334 006, Rajasthan, India Dr. Anna Mensuali Dept. of Life Science, Scuola Superiore Sant’Anna Dr. Ghada Sameh Hafez Hassan Pharmaceutical Chemistry Department, Faculty of Pharmacy, Mansoura University, Egypt Dr. Kátia Flávia Fernandes Biochemistry and Molecular Biology Universidade Federal de Goiás Brasil Dr. Abdel-Hady El-Gilany Public Health & Community Medicine Faculty of Medicine, Mansoura University Egypt
Dr. Hongxiong Guo STD and HIV/AIDS Control and Prevention, Jiangsu provincial CDC, China Dr. Konstantina Tsaousi Life and Health Sciences, School of Biomedical Sciences, University of Ulster Dr. Bhavnaben Gowan Gordhan DST/NRF Centre of Excellence for Biomedical TB Research University of the Witwatersrand and National Health Laboratory Service P.O. Box 1038, Johannesburg 2000, South Africa Dr. Ernest Kuchar Pediatric Infectious Diseases, Wroclaw Medical University, Wroclaw Teaching Hospital, Poland Dr. Hongxiong Guo STD and HIV/AIDS Control and Prevention, Jiangsu provincial CDC, China Dr. Mar Rodriguez Jovita Food Hygiene and Safety, Faculty of Veterinary Science. University of Extremadura, Spain Dr. Jes Gitz Holler Hospital Pharmacy, Aalesund. Central Norway Pharmaceutical Trust Professor Brochs gt. 6. 7030 Trondheim, Norway Prof. Chengxiang FANG College of Life Sciences, Wuhan University Wuhan 430072, P.R.China Dr. Anchalee Tungtrongchitr Siriraj Dust Mite Center for Services and Research Department of Parasitology, Faculty of Medicine Siriraj Hospital, Mahidol University 2 Prannok Road, Bangkok Noi, Bangkok, 10700, Thailand

Instructions for Author
Electronic submission of manuscripts is strongly encouraged, provided that the text, tables, and figures are included in a single Microsoft Word file (preferably in Arial font).
The cover letter should include the corresponding author's full address and telephone/fax numbers and should be in an e-mail message sent to the Editor, with the file, whose name should begin with the first author's surname, as an attachment.
Article Types Three types of manuscripts may be submitted:
Regular articles: These should describe new and carefully confirmed findings, and experimental procedures should be given in sufficient detail for others to verify the work. The length of a full paper should be the minimum required to describe and interpret the work clearly. Short Communications: A Short Communication is suitable for recording the results of complete small investigations or giving details of new models or hypotheses, innovative methods, techniques or apparatus. The style of main sections need not conform to that of full-length papers. Short communications are 2 to 4 printed pages (about 6 to 12 manuscript pages) in length.
Reviews: Submissions of reviews and perspectives covering topics of current interest are welcome and encouraged. Reviews should be concise and no longer than 4-6 printed pages (about 12 to 18 manuscript pages). Reviews are also peer-reviewed.
Review Process
All manuscripts are reviewed by an editor and members of the Editorial Board or qualified outside reviewers. Authors cannot nominate reviewers. Only reviewers randomly selected from our database with specialization in the subject area will be contacted to evaluate the manuscripts. The process will be blind review. Decisions will be made as rapidly as possible, and the Journal strives to return reviewers’ comments to authors as fast as possible. The editorial board will re-review manuscripts that are accepted pending revision. It is the goal of the AJMR to publish manuscripts within weeks after submission.
Regular articles
All portions of the manuscript must be typed double- spaced and all pages numbered starting from the title page.
The Title should be a brief phrase describing the contents of the paper. The Title Page should include the authors' full names and affiliations, the name of the corresponding author along with phone, fax and E-mail information. Present addresses of authors should appear as a footnote.
The Abstract should be informative and completely self- explanatory, briefly present the topic, state the scope of the experiments, indicate significant data, and point out major findings and conclusions. The Abstract should be 100 to 200 words in length.. Complete sentences, active verbs, and the third person should be used, and the abstract should be written in the past tense. Standard nomenclature should be used and abbreviations should be avoided. No literature should be cited. Following the abstract, about 3 to 10 key words that will provide indexing references should be listed.
A list of non-standard Abbreviations should be added. In general, non-standard abbreviations should be used only when the full term is very long and used often. Each abbreviation should be spelled out and introduced in parentheses the first time it is used in the text. Only recommended SI units should be used. Authors should use the solidus presentation (mg/ml). Standard abbreviations (such as ATP and DNA) need not be defined.
The Introduction should provide a clear statement of the problem, the relevant literature on the subject, and the proposed approach or solution. It should be understandable to colleagues from a broad range of scientific disciplines.
Materials and methods should be complete enough to
allow experiments to be reproduced. However, only truly new procedures should be described in detail; previously published procedures should be cited, and important modifications of published procedures should be mentioned briefly. Capitalize trade names and include the manufacturer's name and address. Subheadings should be used. Methods in general use need not be described in detail.

Results should be presented with clarity and precision. The results should be written in the past tense when describing findings in the authors' experiments. Previously published findings should be written in the present tense. Results should be explained, but largely without referring to the literature. Discussion, speculation and detailed interpretation of data should not be included in the Results but should be put into the Discussion section.
The Discussion should interpret the findings in view of the results obtained in this and in past studies on this topic. State the conclusions in a few sentences at the end of the paper. The Results and Discussion sections can include subheadings, and when appropriate, both sections can be combined.
The Acknowledgments of people, grants, funds, etc should be brief.
Tables should be kept to a minimum and be designed to be as simple as possible. Tables are to be typed double- spaced throughout, including headings and footnotes. Each table should be on a separate page, numbered consecutively in Arabic numerals and supplied with a heading and a legend. Tables should be self-explanatory without reference to the text. The details of the methods used in the experiments should preferably be described in the legend instead of in the text. The same data should not be presented in both table and graph form or repeated in the text.
Figure legends should be typed in numerical order on a separate sheet. Graphics should be prepared using applications capable of generating high resolution GIF, TIFF, JPEG or Powerpoint before pasting in the Microsoft Word manuscript file. Tables should be prepared in Microsoft Word. Use Arabic numerals to designate figures and upper case letters for their parts (Figure 1). Begin each legend with a title and include sufficient description so that the figure is understandable without reading the text of the manuscript. Information given in legends should not be repeated in the text.
References: In the text, a reference identified by means of an author‘s name should be followed by the date of the reference in parentheses. When there are more than two authors, only the first author‘s name should be mentioned, followed by ’et al‘. In the event that an author cited has had two or more works published during the same year, the reference, both in the text and in the reference list, should be identified by a lower case letter like ’a‘ and ’b‘ after the date to distinguish the works.
Examples:
Abayomi (2000), Agindotan et al. (2003), (Kelebeni, 1983), (Usman and Smith, 1992), (Chege, 1998;
1987a,b; Tijani, 1993,1995), (Kumasi et al., 2001) References should be listed at the end of the paper in alphabetical order. Articles in preparation or articles submitted for publication, unpublished observations, personal communications, etc. should not be included in the reference list but should only be mentioned in the article text (e.g., A. Kingori, University of Nairobi, Kenya, personal communication). Journal names are abbreviated according to Chemical Abstracts. Authors are fully responsible for the accuracy of the references.
Examples:
Chikere CB, Omoni VT and Chikere BO (2008). Distribution of potential nosocomial pathogens in a hospital environment. Afr. J. Biotechnol. 7: 3535-3539.
Moran GJ, Amii RN, Abrahamian FM, Talan DA (2005). Methicillinresistant Staphylococcus aureus in community-acquired skin infections. Emerg. Infect. Dis. 11: 928-930.
Pitout JDD, Church DL, Gregson DB, Chow BL, McCracken M, Mulvey M, Laupland KB (2007). Molecular epidemiology of CTXM-producing Escherichia coli in the Calgary Health Region: emergence of CTX-M-15-producing isolates. Antimicrob. Agents Chemother. 51: 1281-1286.
Pelczar JR, Harley JP, Klein DA (1993). Microbiology: Concepts and Applications. McGraw-Hill Inc., New York, pp. 591-603.
Short Communications
Short Communications are limited to a maximum of two figures and one table. They should present a complete study that is more limited in scope than is found in full-length papers. The items of manuscript preparation listed above apply to Short Communications with the following differences: (1) Abstracts are limited to 100 words; (2) instead of a separate Materials and Methods section, experimental procedures may be incorporated into Figure Legends and Table footnotes; (3) Results and Discussion should be combined into a single section. Proofs and Reprints: Electronic proofs will be sent (e- mail attachment) to the corresponding author as a PDF file. Page proofs are considered to be the final version of the manuscript. With the exception of typographical or minor clerical errors, no changes will be made in the manuscript at the proof stage.

Fees and Charges: Authors are required to pay a $550 handling fee. Publication of an article in the African Journal of Microbiology Research is not contingent upon the author's ability to pay the charges. Neither is acceptance to pay the handling fee a guarantee that the paper will be accepted for publication. Authors may still request (in advance) that the editorial office waive some of the handling fee under special circumstances
Copyright: © 2015, Academic Journals. All rights Reserved. In accessing this journal, you agree that you will access the contents for your own personal use but not for any commercial use. Any use and or copies of this Journal in whole or in part must include the customary bibliographic citation, including author attribution, date and article title.
Submission of a manuscript implies: that the work described has not been published before (except in the form of an abstract or as part of a published lecture, or thesis) that it is not under consideration for publication elsewhere; that if and when the manuscript is accepted for publication, the authors agree to automatic transfer of the copyright to the publisher.
Disclaimer of Warranties
In no event shall Academic Journals be liable for any special, incidental, indirect, or consequential damages of any kind arising out of or in connection with the use of the articles or other material derived from the AJMR, whether or not advised of the possibility of damage, and on any theory of liability. This publication is provided "as is" without warranty of any kind, either expressed or implied, including, but not limited to, the implied warranties of merchantability, fitness for a particular purpose, or non-infringement. Descriptions of, or references to, products or publications does not imply endorsement of that product or publication. While every effort is made by Academic Journals to see that no inaccurate or misleading data, opinion or statements appear in this publication, they wish to make it clear that the data and opinions appearing in the articles and advertisements herein are the responsibility of the contributor or advertiser concerned. Academic Journals makes no warranty of any kind, either express or implied, regarding the quality, accuracy, availability, or validity of the data or information in this publication or of any other publication to which it may be linked.

International Journal of Medicine and Medical Sciences
African Journal of Microbiology Research
Table of Content: Volume 9 Number 28, 15 July, 2015
ARTICLES
Phytochemical screening and biological activities of Garcinia kola (bark, leaves and seeds) collected in Benin Durand Dah-Nouvlessounon, Farid Baba-Moussa, Adolphe Adjanohoun, Haziz Sina, Pacôme A. Noumavo, Hubert Adoukonou-Sagbadja, Nafan Diarrassouba, Christine N’tcha, François S. Anago and Lamine Baba-Moussa Evaluation of bacteriological quality and essential elements in commercially bottled/packaged water produced and marketed in Southeastern Nigeria Onoja Uwakwe Simon, Nweze, Innocent Emeka, Agbo Matthias Onyebuchi, Nnamani Petra Obioma, Eke Felicia Nkechi, Ivoke Njoku, Eyo Joseph Ekpenyong, Attama Chinedu Ifeanyi and Ejere Vincent Chikwendu Optimization of bioprocess for enhanced production of alkaline protease by a Bacillus subtilis SHmIIIa through Plackett-Burman design S. Jeevan Chandra, P. Pallavi, B. S. Anuradha and S. Ram Reddy Virulence factors expressed by Mycobacterium ulcerans strains: Results of a descriptive study AKA N’guetta, KAKOU-NGAZOA E. Solange, COULIBALY N. D., VAKOU Sabine, KOUADIO Kouamé, AOUSSI Serge, KADIO M. Constance, KOUAKOU Hélène, AKE Julien, N’GUESSAN Raymond and DOSSO Mireille Prevalence of Brucella antibodies in marketed cow milk in Benue State, Nigeria Daniel Douglas Ior, Cornelius Chijioke Chukwu

Vol. 9(28), pp. 1716-1727, 15 July, 2015
DOI: 10.5897/AJMR2015.7611
Article Number: 8B94D2F54434
ISSN 1996-0808
Copyright © 2015
Author(s) retain the copyright of this article http://www.academicjournals.org/AJMR
African Journal of Microbiology Research
Full Length Research Paper
Phytochemical screening and biological activities of Garcinia kola (bark, leaves and seeds) collected in
Benin
Durand Dah-Nouvlessounon1, Farid Baba-Moussa2, Adolphe Adjanohoun3, Haziz Sina1, Pacôme A. Noumavo1, Hubert Adoukonou-Sagbadja4, Nafan Diarrassouba5, Christine N’tcha1,
François S. Anago4 and Lamine Baba-Moussa1*
1Laboratoire de Biologie et de Typage Moléculaire en Microbiologie, FAST, Université d’Abomey Calavi 05 BP: 1604
Cotonou, Bénin. 2Laboratoire de Microbiologie et de Technologie Alimentaire, FAST, Université d’Abomey-Calavi, 01 BP: 526 ISBA-
Champ de foire, Cotonou Bénin. 3Centre de Recherches Agricoles Sud, Institut National des Recherches Agricoles du Bénin, Attogon BP: 884 Cotonou,
Bénin. 4Laboratoire des Ressources Génétiques et d’Amélioration des Espèces, Département de Génétique et des
Biotechnologies, FAST, Université d’Abomey Calavi, BP: 526 Cotonou, Bénin. 5Université Péléforo Gon Coulibaly de Korhogo UFR des Sciences Biologiques BP: 1328 Côte d’Ivoire.
Received 6 June, 2015; Accepted 10 July, 2015
Garcinia kola is a tropical plant which grows in moist forest. It seeds are edible and are consumed for their multiple property. This study aimed at making phytochemical screening and evaluating some biological activities of G. kola organs (bark, leaves and seeds) extracts. The selected organs powdered were used for phytochemical screening and extractions. The antibacterial activity was tested on 10 references strains and 28 meat isolated Staphylococcus strains by agar perforation method. The antifungal activity of three fungal strains was determined on the potato-dextrose agar medium mixed with the tested extract. The antioxidant activity was determined by both DPPH and ABTS methods. The results reveal that 40% of studied secondary metabolites were present in the seeds against 28.57% in the leaves as the bark. The reference and meat isolated strains inhibitory diameter ranged from 28 ± 2.3 mm (S. haemolyticcus) to 7.5 ± 0.70 mm (E. coli). All extracts had a minimum inhibitory concentration (MIC) lower than 20 mg/ml, while the minimum bactericidal concentration (MBC) was ≥ 20 mg/ml for some tested extracts. The lowest MIC and MBC was 0.039 mg/ml with C. albicans. The fungal strains
susceptibility varied (p 0.001) depending on extracts. The seeds ethyl acetate extract displays the better antioxidant activity with DPPH (25.03 ± 3.64 μg/μl) and ABTS (22.99 ± 1.34 µmol EqAA/g) methods. The LD50 of the extracts was greater than 0.1 mg/ml and not exhibiting toxicity. The leaves extract had the best bactericidal effects while the seeds extract presented better antifungal and antioxidant activity. Key words: Antifungal, Staphylococcus, food strains, antioxidant, cytotoxicity, Benin.
INTRODUCTION The Benin forest agro-ecosystems shelter over 162 forest plant species, with social, religious and/or cultural
meaning, used for many purposes such as domestic food and commercial (Codjia et al., 2009). Apart from feeding

and commercial uses, many of these species are currently used in traditional medicine all over the country. Among the plants uses in traditional medicines, we can cite Garcinia kola (Clusisaceae), a large tree with fattening base (Akoegninou et al., 2006). This species is present in tropical Africa, from Sierra Leone to the DR Congo (Adesuyi et al., 2012).
Nowadays, infectious diseases are responsible for a high morbidity and mortality rate and are consider as a public health problem because of their frequency and their severity (Bourgeois, 1999). For the treatment of these diseases, people often use synthetic drugs such as beta-1actamines. But, bacteria developed a resistance mechanism to fight against most of the synthetic family of antibiotics. There are four main mechanisms used by bacteria to resist beta-1actamines molecules: i) enzymatic inactivation, ii) the modification of the cellular target of the antibacterial agent, iii) the cellular efflux and, iv) the decrease or absence of penetration of the antibiotic in the bacteria. The combination of these mechanisms in a bacterium makes its multi-resistant to many antibiotics (Gangoue-Piéboji et al., 2004). Similarly, several cases of fungi resistant to conventional antifungal agents have been reported. Moreover, the production of free radicals in living organisms is a vital phenomenon for the cell regulated through various biochemical or enzymatic detoxification process (Salem, 2009). The free radicals are reported to be involved in many serious illnesses and constitute even aggressive form factors to DNA (Boumaza, 2009).
To face all these health problems, the formalization of endogenous knowledge would be a reliable asset in the control of not only resistant microbial strains but also diseases caused by free radicals. It is known that several medicinal plant synthesize a wide variety of phytoche-micals which include alkaloids, tannins, flavonoids, steroids, saponins, and phenols, which have antimicrobial proprieties. Moreover, potential sources of antioxidant compounds have been searched in several types of plant materials such as vegetables fruits, leaves, barks, roots and crude plant drugs. Antioxidants are vital substances which protect the body from damage caused by free radical inducing oxidative stress (Ozsoy et al., 2008). Therefore, many plants were used as a source of traditional medicine to treat various diseases and conditions (Razali et al., 2008). G. kola belongs to the plant used in traditional pharmacopeia in Benin. This plant various parts extracts are reported to be used in the treatment of cough, sore heart, liver problems (Kanmegne and Ndoumou Omokolo, 2007), diarrhea (Braide, 1991) inflammatory diseases (Iwu and Igboko, 1982). G. kola, one of the preferred seed in West Africa is deemed to have an antidote power (Kabangu et al., 1987),
Dah-Nouvlessounon et al. 1717 anti-hepatotoxic properties (Akintowa and Essien, 1990), antinephrotoxic, antimicrobial (Adefule-Ositelu et al., 2004), hypoglycemic (Odeigah et al., 1999) and aphrodisiac effects (Ajibola and Satake, 1992). Other scientific studies of G. kola by other authors (Farshori et al., 2013; Okunji et al., 2002; Pietta, 2000) showed the importance of the plant. In Benin, there is few scientific work on this plant species. So, the aims of this study were to investigate the phytochemical on one hand and on the other hand evaluate some biological activities of G. kola collected in Benin. MATERIALS AND METHODS Collection of plant material
The bark, seed and leaves were collected in the village of Anagbo (commune of Adjarra: 6°29’35”N, 2°40’28”E) department of Oueme, southern Benin. The plants materials were air dried at 25 to 30°C
for two weeks, ground and sieved into a bark powder. The smooth powder was stored in airtight glassware and kept in darkness at -20°C until use. Phytochemical profiling
The phytochemical profiling of bark, seed and leaves powders of G. kola to determine the major constituents (nitrogenous, polyphenolic, terpenic compound and glycosides) was done according to the method describe by Houghton and Raman (1998). Preparation of aqueous
The aqueous extract was obtained according to the method describe by Dah-Nouvlessounon et al. (2015). Briefly, the powder
(50 g) of G. kola appropriate organ (bark, leaf or seed) obtained above was macerated into 500 ml of distilled water under magnetic agitator for 72 h at room temperature. The homogenate was then filtered two times on absorbent cotton and once on Whatman N°1 paper (125 mm ø, Cat No 1001 125). For the aqueous extract, the filtrate was dried in the oven at 40°C; the obtained powder is considered as the total extract ready to use for the biological activities. All extracts were stored in labeled sterile bottles and kept
at -20°C until further use. Preparation of ethanol and ethyl acetate extracts
These extracts were made using an adapted methods described by Sanogo et al. (2006) and N’Guessan et al. (2007). We macerated 50 g of G. kola powders (bark, leaf or seed) in 500 ml of 96% ethanol for 72 h. The obtained extract was filtered thrice using
Whatman N°1 filter paper (125 mm ø, Cat No 1001 125). Half of the filtrate was directly dried at 40°C to obtain the ethanolic extract of G. kola. To the second half of the filtrate, 200 ml of H2O and 100 ml of ethyl acetate were added. The solution was gently mixed and left settled until we obtain two phases (about 45 min). The lower phase was collected and dried as described above to obtain the ethyl
*Corresponding author. E-mail: [email protected]. Tel: +22997123468. Author(s) agree that this article remains permanently open access under the terms of the Creative Commons Attribution License 4.0 International License

1718 Afr. J. Microbiol. Res. acetate extract. The alcoholic and ethyl acetatic extracts were stored in labeled sterile bottles and kept at -20°C until further use.
Microorganism’s cultures
The tested microorganisms include ten references, twenty height Staphylococcus meat isolated strains and three fungal strains (Penicillium citrinum, Aspergillus tamarii and Fusarium
verticilloides). The three fugal strains were part of the microorganisms isolated in a Beninese traditional cheese wagashi by Sessou et al. (2012). The reference strains were Escherichia coli ATCC 25922, Staphylococcus aureus ATCC 29213, Staphylococcus epidermidis T22695, Pseudomonas aeruginosa ATCC 27853, Proteus mirabilus A24974, Micrococcus luteus ATCC 10240, Proteus vulgaris A25015, Streptococcus oralis, Enterococcus foecalis ATCC 29212 and Candida albicans MHMR. The Staphylococcus strains used in this study were those isolated from three different meat products in Ivory Coast by Attien et al. (2013) and stored in the Laboratory of Biology and Molecular Typing in Microbiology (University of Abomey-Calavi, Benin).
Antimicrobial activity
Sensitivity test
The agar perforation method inspired of those described by Bauer et al. (1966) was used to screen the antimicrobial activity. For this method, four to five perforations were performed under aseptic conditions, on Mueller Hinton agar Petri dish previously flooded by the appropriate bacterial culture (adjusted to 0.5 McFarland
standard). Twenty five microliter of extract solution (20 mg/ml) were aseptically lodged in the hole. These dishes were kept for 15-30 min at room temperature before incubation at 37°C for 24 and 48 h.
After the incubation period, the dishes were examined for inhibitory zones. Each sample was used in triplicate for the determination of antibacterial and antifungal activity.
Determination of minimum inhibitory concentrations (MIC)
The minimum inhibitory concentrations (MIC) of the plant crude extract was performed by macrodilution method (Saha and Rahman, 2008). First, the extracts were diluted in sterilized distilled water to the highest concentration of 20 000 μg/ml and then nine dilution were performed to obtain successively the concentrations of 10 000, 5 000, 2 500, 1 250, 625, 312.5, 156.25, 78.12 and 39.06 μg/ml in screw tube. To 1 ml of the above concentrations was added 1 ml of the bacteria inoculum (10
6 UFC/ml) to obtain 2 ml as
a final volume. Culture medium without samples and others without micro-organisms were used in the tests as controls. Tubes were incubated at 37°C for 18-24 h and growth was indicated by turbidity. The MIC is the lowest concentration of the compound at which the microorganism tested does not demonstrate visible growth.
Determination of Minimum bactericidal concentration (MBC)
The minimum bactericidal concentration (MBC) of the tested microorganisms was determined by sub culturing the test dilutions onto a fresh solid medium and incubated further for 18-24 h. The highest dilution that yielded no bacterial growth on solid medium was taken as MBC (Farshori et al., 2013).
Evaluation of the cytotoxicity activity of G. kola extracts
The cytotoxic effect of the extracts was evaluated according to an adaptation of the method described by Kawsar et al. (2008). The
tests were carried out twice on 72 h larvae of Artemia salina (ARTEMIO JBL GmbH D-67141 Neuhofem). Briley, a test was constituted of 16 A. salina larvae in a 2 ml solution containing 1 ml of the extract tested concentration and 1 ml of sea water. The number of surviving larvae is counted after incubation (24 h) and the LD50 was calculated using the regression line obtained from the surviving larvae according the extracts concentration representation.
Antifungal activity
The in vitro antifungal activity of the extracts was evaluated according to the method previously described by Dohou et al. (2004). The assay was performed on the Potato-Dextrose Agar medium. Briefly, the extracts use for the antifungal activity was dissolved with sterilize distillated water or if necessary with a water-ethanol mixture (60:40). One (1) ml of the dissolved extract (20 mg/ml) was thoroughly mixed with 10 ml of the sterilized potato-dextrose agar medium before it was transferred to sterile Petri dishes for solidification. After the medium solidification, a sterile 6 mm disc pretreated with fungal strain was placed in each Petri plate. Plates were incubated at 25 ± 1°C for five days. Each
treatment was replicated twice. Fungal radial growth was measured by averaging the two diameters taken from each colony. Percentage growth inhibition of the fungal colonies was calculated using the formula:
(1)
Antioxidant activity determinations
The antioxidant activity was measured using both 2,2-diphenyl-1-picrylhydrazyl (DPPH) and [2,2’-azinobis-(3-ethylbenzothiazoline-6-sulfonic acid)] (ABTS) methods.
The ABTS assay was conducted according to the method described by Re et al. (1999). The working solution of ABTS
+ (10
mg of ABTS, 2.6 ml of deionized water and 1.72 mg of potassium
persulphate) was left to stand at room temperature for 12 h in the dark before use. This solution was diluted with ethanol until obtaining an absorbance of 0.70 ± 0.02 at 734 nm. Twenty µl of each extract sample (1 mg/ml) was diluted with a fresh prepared ABTS solution to a total volume of 1 ml. All the assays were performed in triplicates, the absorbance was read after 15 min in dark at 734 nm and the reference molecule was ascorbic acid. The concentration of compounds with a capability to reduce ABTS
+
radical cation is expressed as µmol equivalent Ascorbic Acid (µmol
EqAA) per gram of dry extract using the following formula used by Guenne et al. (2011).
The DPPH method was conducted using an adapted method of Scherer and Godoy (2009). Practically, equal volumes (100 µl) of DPPH (50 μM) and plant extracts (200 μg/ml) were mixed in a 96 well microplate and allowed to stand in darkness for 20-30 min at room temperature. Then, the absorbance was read at 517 nm and the blank was a mixture of methanol and DPPH (v:v). The inhibitory
percentage of DPPH radical indicating the antioxidant activity of extracts and BHA, gallic acid was obtain using the formula establish by Schmeda-Hirschmann et al. (2003).
The concentration providing 50% inhibition (IC50) was determined graphically using a calibration curve in the linear range by plotting the extract concentration and the corresponding scavenging effect. Antioxidant Activity Index (AAI) was calculated according to the formula used by Scherer and Godoy (2009).
Statistical analysis
All experiment was done in triplicate and data thus obtained

Dah-Nouvlessounon et al. 1719
Table 1. Phytochemical constituents of G. kola powdered organs samples.
Group of compounds Class Organ
Bark Leaves Seeds
Nitrogenous compound Alkaloids ⁻ ⁻ ⁺
Poly-phenolics compound
Tanins ⁺ ⁺ ⁺
Tanins catéchiques ⁻ ⁺ ⁻
Tanins galliques ⁺ ⁺ ⁺
Flavonoids ⁻ ⁻ ⁺flavone
Anthocyans ⁻ ⁻ ⁻
Leuco-anthocyanes ⁻ ⁻ ⁻
Coumarin ⁺ ⁻ ⁺
Quinonics derivate ⁻ ⁻ ⁻
Terpeniques compound
Triterpenoids ⁻ ⁺ ⁺
Steroids ⁺ ⁻ ⁻
Cardenolids ⁻ ⁻ ⁻
Heterosides
Cyanogenics derivate ⁻ ⁻ ⁻
Saponosids (IM) ⁺ (500) ⁺ (111) ⁺ (200)
Reducing compounds ⁻ ⁺ ⁺
Free anthracénics ⁻ ⁻ ⁻
O-heterosides ⁻ ⁻ ⁻
O- heterosides at GR ⁻ ⁻ ⁻
C-heterosides ⁻ ⁻ ⁻
Mucilags ⁺ ⁻ ⁺
(+), Presence of secondary metabolite; (-), Absence of secondary metabolite; (IM), Index
mouss. reported as a mean ± standard deviation (SD). The logit model of stata v.12 software is used to qualitative analysis. The data were also analyzed using Graph Pad Prism 5 software for quantitative analysis. Differences of p < 0.05 were considered significant.
RESULTS Phytochemical screening The phytochemical analysis performed on three organs of G. kola revealed the presence of several secondary metabolites (Table 1). It was noted an uneven distribution of these metabolites from one organ to another. Indeed, 40% of the studied secondary metabolites were present in the seed against 28.57% in the leaves as in the bark.
Antimicrobial activity of G. kola extracts Sensitivity test The ability to inhibit microbial growth of the extracts evaluated on reference strains revealed that the results of extract deferred from an extract to another depending on
the organs. Indeed, all bark extracts had no inhibitory effect on the reference strains. It is the same for the aqueous extract of the two others organs of the plant. In contrary, the ethanol extract of the leaves and seeds, as well as ethyl acetate extract of the seeds are active. Thus, the ethanol extract of the leaves and ethyl acetate seeds extract inhibits the growth of 90% (9/10) of the strains while the ethanol extract of the seeds inhibits the totality (100%) of the strains. Qualitative analysis of the inhibitory capacity of G. kola extracts The results of the qualitative analysis of data relating to the evolution of the diameter in time (24h and 48h) according to organ, type of extract and the type of microorganism, showed that the inhibition zones diameters of the sensitive strains vary from one species to another. The Husman test conducted for this purpose showed that the logit model premium on the probit model. With a predictive power of 86.11% sensitivity and specificity of 61.11% showing its reliability, the logit model shows in organs level that the probability that the

1720 Afr. J. Microbiol. Res. diameter increases from the leaves to the seed decreased of 0.13. Regarding the type of extract, logit model marginal effects show that the probability that the diameter increases from the ethanol extract with ethyle acetate extract increases of 0.30. Considering the type of microorganism, from Gram + and Gram- bacteria to yeast, the probability that the diameter increases with the time decreases of 0.08. Similarly passing reference strains for food strain this probability decreases by 0.003.
Quantitative analysis of the inhibitory capacity of G. kola extracts
Concerning the reference strains, the inhibition zones diameters of sensitive strains do not differ (p > 0.05) in the time (24 and 48 h) with the ethanol extract of the leaves (Figure 1a) and seeds ethyl acetate extract (Figure 1c). On the contrary with the seeds ethanol
extract, a change (p 0.05) of diameter is observed between 24 and 48 h for E. foecalis (Figure 2b). With the leaves, the largest diameter of inhibition (15 ± 0.00 mm) of the ethanol extract was obtained on E. foecalis, while the lowest (7.5 ± 0.70 mm) was recorded with E. coli after 48 h of incubation (Figure 1a). With the seeds, the larger diameter (25 ± 0.00 mm) and the lowest (5 ± 0.00 mm) were recorded with the ethanol extract respectively on S. epidermidis and E. coli (Figure 1b). The compared action with the same type of extract (ethanol) leaves and seeds
showed a difference (p 0.0001) of susceptibility according to the strains. During this, the ethanol extract of the seeds generally exhibits inhibition diameters greater than the same extract of the leaves (Figure 1a). The comparative effect of seeds’ ethanol extract and
ethyl acetate also shows a variation (p 0.0001) of diameters depending on the strains and the type of extract.
On food strains, it is noted with the leaves ethanol extract a remanence effect for the strains S. equorum, S.
saprophyticus (p < 0.01) and S. haemolyticcus (p 0.001) after 48 h of incubation (Figure 1d). Similarly for the seeds the same phenomenon was observed for S. simulans (p < 0.01) strain and S. lentus, S. haemolyticcus
(p 0.0001) after 48 h of incubation with both the ethanol extract (Figure 1e), and ethyl acetate extract. Note that the ethyl acetate extract of the seeds was more active (p
0.0001) with time with S. lentus (Figure 1f). The compared effect of ethanol extract of leaves and seeds show that the leaves has a broad spectrum of action by inhibition of 100% food strains while the seeds ethanol extract is active on 44.44% of the strains. Nevertheless the greatest inhibition diameter obtained with the leaves ethanol extract is 22 ± 0.3 mm (S. lentus), whereas that obtained with the seeds’ ethanol extract was 28 ± 2.3 mm (S. haemolyticcus). Passing leaves to seed, the action of this ethanol extract is not different (p > 0.05) for S. lentus strains, S. simulans, and S. sciuri. The comparative
action of seeds’ ethanol and ethyl acetate extracts shows that the ethyl acetate extract is active on 90% of food strains with a greater inhibition diameter of 24 ± 1.3 mm obtained with S. lentus. Also we observed for both type of extract a difference of action (p < 0.01) using S. xylosus
strain and (p 0.0001) S. equorum and S. saprophyticus. Minimum inhibitory (MIC) and bactericide (MBC) concentrations of G. kola extracts Our results show that all extracts have a minimum inhibitory concentration below the starting concentration (20 mg/ml), while for the MBC, some extracts have a concentration ≥ 20 mg/ml (Table 2).
Considering the reference strains, the MICs obtained vary depending on the type of extract and organs. With seeds, a greater sensitivity of the strain C. albicans (0.039 mg/ml) is observed to the ethyl acetate extract and E. foecalis strain (0.078 mg/ml) to the ethanol extract. With the leaves, the smallest minimum inhibitory concentration (0.156 mg/ml) of the ethanol extract was obtained with P. aeruginosa strain. MBC are generally higher than the MIC, but in some cases is equal to the MIC, it is the case of the seeds ethyl acetate extract with C. albicans strain which has the greatest sensitivity (MBC = 0.039 mg/ml). Otherwise, to the tested dose, the leaves ethanol and seeds ethyl acetate extracts had no bactericidal effect (MBC > 20 mg/ml) on the S. epidermidis strain.
Like with the reference strains, the MIC of meat isolated strains vary depending on the type of extract (Table 2). A greater sensitivity of S. equorum to the seeds ethyl acetate extract with an MIC of 0.078 mg/ml was observed. On the contrary, the smallest MIC obtained with the leaves ethanol extract was 0.625 mg/ml (S. saprophyticcus) while it was 2.5 mg/ml (S. sciuri and S. haemolyticcus) with the seeds ethanol extract. In addition, the MBC vary from 0.078 mg/ml to a concentration greater than 20 mg/ml. Indeed, the smallest MBC (0.078 mg/ml) was obtained with the seeds ethyl acetate extract on the S. equorum. With the ethanol extract, the lower MBC leaves (1.25 mg / ml) was obtained with the S. saprophyticcus, while seeds’ (10 mg/ml) was recorded with S. lentus, S. . simulans and S. haemolyticcus. The leaves ethanol extract had no bactericidal effect on S. simulans and S. sciuri at 20 mg/ml. Evaluation of bactericidal and bacteriostatic effects of G. kola extracts The ratio MBC/MIC shows the kind of effect exerted by the extracts on the tested strains. The results of this ratio show that both extracts have bactericidal and bacteriostatic effects on reference strains and on meat

Dah-Nouvlessounon et al. 1721
Figure 1. Medium inhibitory diameter zone of G. kola extracts on reference and meat isolated Staphylococcus strains after 24 and 48 h. For reference strains S. aur,
Staphylococcus aureus; M. lut, Miccrococcus luteus; S. epi, Staphylococcus epidermidis; S. ora, Streptococcus oralis; P. aer, Pseudomanas aeruginosa; E.foe , Enterococcus foecalis; P. vul, Proteus vulgaris; E. coli, Escherichia coli; C. alb, Candida albicans; P. mir, Proteus mirabilis ; For meat isolated strains , S. sci, S. sciuri; S. aur, S. aureus; S. sim,
S. simulans; S. xyl, S. xylosus; S. coh, S. cohnii; S. equ, S. equorum; S. sap, S. saprophyticus; S. hae, S. haemolyticus and S. len, S. lentus. *, p < 0.05 ; **, p < 0.01; ***, p <
0.001; ****, p 0.0001.

1722 Afr. J. Microbiol. Res.
Table 2. Minimum Inhibitory (MIC) and Bactericidal (MBC) Concentrations of G. kola extracts on reference strains and meat isolated Staphylococcus strains.
Strain MIC (mg/ml) MBC (mg/ml)
EtOHleaves EtOHseeds EACseeds EtOHleaves EtOHseeds EACgr
Reference strains
S.aur 0.312 0.312 0.152 0.625 1.25 2.5
S.epi 0.625 0.312 0.078 20 1.25 20
S.ora 2.5 5 2.5 5 10 10
E.coli 5 5 2.5 5 10 10
E.foe 0.625 0.078 - 1.25 2.5 -
M.lut 1.25 0.156 0.078 2.5 0.156 0.156
P.mir 0.625 0.312 0.625 20 10 2.5
P.vul - 0.625 0.625 - 5 1.25
P.aer 0.156 2.5 0.312 10 20 5
C.alb 5 0.156 0.039 5 0.156 0.039
Meat isolated Staphylococcus strains
S.xyl 2.5 - 0.625 2.5 - 10
S.len 1.25 5 2.5 2.5 10 20
S.sim 2.5 5 5 >20 10 20
S.sci 2.5 2.5 2.5 >20 20 5
S.coh 1.25 - - 20 - -
S.equ 1.25 - 0.078 10 - 0.078
S.sap 0.625 - 0.625 1.25 - 10
S.hae 1.25 2.5 0.625 5 10 10
S.aur 2.5 - - 10 - -
EtOH, ethanol extract; EAC, ethyl acetate extract. For reference strains , S. aur, Staphylococcus aureus; M. lut, Miccrococcus luteus; S. epi, Staphylococcus epidermidis; S. ora, Streptococcus oralis; P. aer, Pseudomanas aeruginosa; E.foe , Enterococcus foecalis;
P. vul, Proteus vulgaris; E. coli, Escherichia coli; C. alb, Candida albicans; P. mir, Proteus mirabilis ; For meat isolated strains , S. sci, S. sciuri; S. aur, S. aureus; S. sim, S. simulans; S. xyl, S. xylosus; S. coh, S. cohnii; S. equ, S. equorum; S. sap, S.
saprophyticus; S. hae, S. haemolyticus and S. len, S. lentus.
isolated Staphylococcus (Table 3). With reference strains, the bactericidal effect of extracts decreases as follows: leaves ethanol > seeds ethanol > seeds ethyl acetate. M. luteus and C. albicans strains were very sensitive to all the tested extracts. With the meat isolated Staphylococcus, leaves ethanol extract displays a bactericidal effect on three strains (S. xylosus, S. lentus and S. saprophyticcus). It can be noted that from these results, the antibacterial activity is more interesting with the leaves. Antifungal activity of G. kola extracts The antifungal activity of our extracts was evaluated at mycelial development stage of the three fungal strains. The extracts show an antagonism effect to the growth of the three tested fungal strains. Figure 2 shows the appearance of the plates on F. verticillioides after five days of incubation.
Extracts inhibition rate varies depending on the strain
and shows that the interaction between the fungal strains
and the extracts has a highly significant difference (p 0.0001). The percentage inhibition of the various extracts varies between 38.3 to 78.1% (Figure 3). Considering the susceptibility of the strains toward tested extracts, only
the seeds ethanol extract has a difference in action (p 0.001) between F. verticillioides and A. tamari; the same difference was observed between the strains F.
verticillioides and P. citrinium on the one hand (p 0.01
for leaves ethanol extract and p 0.05 for the seeds ethanol extract) and between A. tamarii and P. citrinium on the other hand.
Antioxidant activity of G. kola extracts
The antioxidant activity profiles using the DPPH radical and ABTS
+ cation obtained reveal that the extracts
possess antioxidant dose-dependent activity (Table 4). By DPPH method, the results show that seeds’ ethyl
acetate extract has the lowest concentration (25.03 ±
Dah-Nouvlessounon et al. 1723
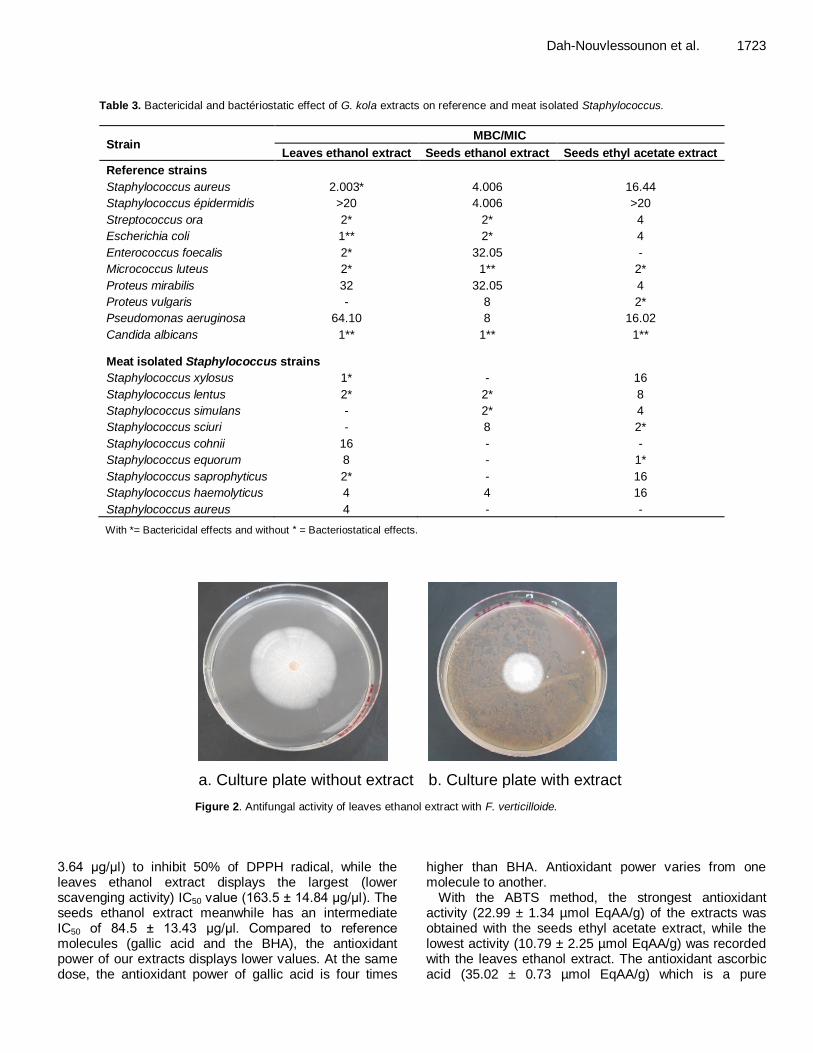
Table 3. Bactericidal and bactériostatic effect of G. kola extracts on reference and meat isolated Staphylococcus.
Strain MBC/MIC
Leaves ethanol extract Seeds ethanol extract Seeds ethyl acetate extract
Reference strains
Staphylococcus aureus 2.003* 4.006 16.44
Staphylococcus épidermidis >20 4.006 >20
Streptococcus ora 2* 2* 4
Escherichia coli 1** 2* 4
Enterococcus foecalis 2* 32.05 -
Micrococcus luteus 2* 1** 2*
Proteus mirabilis 32 32.05 4
Proteus vulgaris - 8 2*
Pseudomonas aeruginosa 64.10 8 16.02
Candida albicans 1** 1** 1**
Meat isolated Staphylococcus strains
Staphylococcus xylosus 1* - 16
Staphylococcus lentus 2* 2* 8
Staphylococcus simulans - 2* 4
Staphylococcus sciuri - 8 2*
Staphylococcus cohnii 16 - -
Staphylococcus equorum 8 - 1*
Staphylococcus saprophyticus 2* - 16
Staphylococcus haemolyticus 4 4 16
Staphylococcus aureus 4 - -
With *= Bactericidal effects and without * = Bacteriostatical effects.
a. Culture plate without extract b. Culture plate with extract
Figure 2. Antifungal activity of leaves ethanol extract with F. verticilloide.
3.64 μg/μl) to inhibit 50% of DPPH radical, while the leaves ethanol extract displays the largest (lower scavenging activity) IC50 value (163.5 ± 14.84 μg/μl). The seeds ethanol extract meanwhile has an intermediate IC50 of 84.5 ± 13.43 μg/μl. Compared to reference molecules (gallic acid and the BHA), the antioxidant power of our extracts displays lower values. At the same dose, the antioxidant power of gallic acid is four times
higher than BHA. Antioxidant power varies from one molecule to another.
With the ABTS method, the strongest antioxidant activity (22.99 ± 1.34 µmol EqAA/g) of the extracts was obtained with the seeds ethyl acetate extract, while the lowest activity (10.79 ± 2.25 µmol EqAA/g) was recorded with the leaves ethanol extract. The antioxidant ascorbic acid (35.02 ± 0.73 µmol EqAA/g) which is a pure

1724 Afr. J. Microbiol. Res.
F . v e rtic illo ide A . ta m a rii P . c itr in u m
0
2 0
4 0
6 0
8 0
1 0 0
F u n g a l s t r a in s
Inh
ibit
ory
ra
te (
%)
L e a v e s e th a n o l e x tra c t
S e e d s e th a n o l e x tra c t
S e e d s e th y le a c e ta te
e x tra c t
Figure 3. G. kola extracts inhibition rate of mycelia development.
Table 4. Free radical scavenging activity results by DPPH radical and ABTS+ cation methods.
Extracts and reference molecules DPPH ABTS
IC50 (µg/µl) IAA C (µmol EqAA/g)
Seeds ethanol extract 84.5 ± 13.43 0.59 ± 0.09 11.66 ± 0.38
Seeds ethyl acetate extract 25.03 ± 3.64 1.85 ± 0.10 22.99 ± 1.34
Leaves ethanol extract 163.5 ± 14.84 0.30 ± 0.02 10.79 ± 2.25
BHA 4.31 ± 1.10 12.07 ± 2.87 nd
Gallic acid 0.8 ± 0.07 62.74 ± 5.54 nd
Ascorbic acid nd nd 35.02 ± 0.73
nd, Not determined.
compound used in this case as a reference molecule is greater than that of our extracts.
However we should note that the antioxidant activity of the extracts follows the same order of effectiveness using the two methods of study and this activity is less high than that observed with the reference molecules.
Artemia salina larvae cytotoxicity test of G. kola extracts The behavior of the larvae introduced in various concentrations of the tested extracts show that the survival of larvae respects a dose-response relation. The dose that induces the death of 50% (LD50) of the larvae was determined from the regression line of each curve. Thus seeds ethyl acetate extract has the lowest LD50 of 8.83 mg/ml with a correlation coefficient R
2 = 0.873. This
extract is followed by the seeds ethanol extract (LD50 = 10.38 mg/ml, R
2 = 0.758). The leaves ethanol extract has
the highest concentration (LD50 = 10.60 mg/ml, R2 =
0.655).
DISCUSSION The phytochemical screening was performed on the powder of three organs (bark, leaves and seeds) in order to highlight the presence of 20 secondary metabolites belonging to four chemical groups. The results reveal, in the nitrogen compounds group, the presence of alkaloids in seeds. This observation is similar to those made in Cameroon by Lacmata et al. (2012). Concerning the phenolic compounds group, our study reveals the presence of tannins with a predominance of gallic tannins (found in the three organs). These results corroborate those of Adesuyi et al. (2012) in Nigeria from the seed of the same species. However, the seeds of G. kola were reported, in Nigeria, not to contain tannins (Ghamba et al., 2012). This difference could be explained by the maturity stage of the used fruit before their harvest. Indeed, during a study performed in Congo Brazzaville, Morabandza et al. (2013) demonstrated that the concen-tration of certain secondary metabolites in the mesocarp of G. kola fruit increases with the evolution of maturity. It should be noted that in the three organs, the tannins were

more present in leaves than in seeds and bark. We also note the absence of alkaloids and flavonoids in the leaves. In contrary to those found, Eleazu et al. (2012) showed the presence in a small proportion of alkaloids and flavonoids in the leaves of G. kola. This variation can be explained by the difference of those compounds detection method. Beyond tannins, we notice the presence of flavonoid (flovone) and coumarins respectively in the seeds and bark of this plant species. These results corroborate those of Cotterih et al. (1978) when they isolated G. kola seeds’; the bioflavonoids called GB1, GB2 and GB1a. Likewise, Okunji et al. (2002) reported that phytochemical compounds so far isolated from G. kola seeds are biflavonoids such as kolaflavone and 2-hydroxybi-flavonols. The cyanogenic derivatives absence is very important because they are the main causes of toxicity due to the production of cyanide ions and manifested by the subsequent mass poisoning from the ingestion of cyanogenic derivatives, acceleration and amplification of breathing, respiratory depression, dizziness, headache, disturbance of consciousness, coma (Bruneton, 1993). From these observations, and from the properties of the flavonoids according to Ortuno et al. (2006), the seeds of G. kola could therefore be more advantageously than other organs (bark and leaves) of the plant to be used in the case of inflammations, infections, superficial wound or burn and may allow a reduction in the cholesterol in the body.
Regarding the antimicrobial capacity of the three organs of G. kola, the bark extracts (aqueous, ethanol, ethyl acetate), and the aqueous extract of the seeds and leaves had no action on the tested reference microorganisms strains. Our observations are not the same as those made by Indabawa and Arzai (2011) when they showed in their study that the seeds aqueous extract of G. kola had antibacterial activity against S. aureus at 2000 µg/ml. In the same way, Ghamba et al. (2012) reported that the seeds aqueous extract of G. kola had an antimicrobial activity against clinical isolates of S. aureus, P. aeruginosa and E. coli at 50 mg / ml with a mean inhibition diameter of 3.66 ± 0.28 mm. This difference can be explained by the antimicrobial active ingredient concentration in the aqueous extracts of our seeds; these antimicrobial agents in the seeds are not concentrated enough in the aqueous extract, and this may also be due to the origin of the strains. Moreover Burger (1990) reported that no active substance showed its maximum activity in laboratory experiments and the activity can be recorded when a great concentration is used. The organic extracts (ethanol and ethyl acetate) of G. kola leaves and seeds have inhibited many microorganisms at 20 mg/ml. The same report has been done on other plants by other authors as Sharmila and Gomathi (2011) in India on Crossandra infundibuliformis. Also Bouzid et al. (2011) in Algeria on Crataegus monogyna noted that organic extracts (ethanol, methanol
Dah-Nouvlessounon et al. 1725 dichloromethane and others) were active while the aqueous extract was inactive. These observations can be explained by the solubilization capacity of phyto-molecules in solvents. The activity ratio (CMB/CMI) according to Berche et al. (1991) showed that the ethanol extract of the leaves and seeds has a higher bactericidal activity than the seeds ethyl acetate extract. This difference can be due to the affinity of antimicrobial molecules toward ethanol and ethyl acetate. Indeed during the liquid/liquid extraction, phyomolecules are distributed in the solvents according to their polarity (Cowan, 1999). We can then deduce that ethanol (protic and polar solvent) better dissolves active ingredients contained in the seeds of G. kola than ethyl acetate (aprotic and polar solvent).
Through the various extracts, the studied organ of G. kola exhibit varied antifungal activity depending on the strains. The comparative effect of the ethanol extract of the two organs (leaves and seeds) showed that the seeds ethanol extract has an inhibition percentage of mycelial growth higher than the leaves one on the three tested fungal strains. The hypothesis that can explains this difference would be the high percentage (50%) of polyphenolic compounds reported, during phytochemical screening, in the seeds in comparison to the leaves (10%). The evaluation of antifungal activity of the same organ extracts shows that the seeds ethyl acetate extract has better anti-fungal activity than the ethanol extract of the same organ on the strains F. verticilloide and A. tamarii. The large number of polyphenolic compounds extracted with ethyl acetate (Rohman et al., 2010) as well as glycosides (Cowan, 1999) would be a reliable explanation for these observations. Similarly Zareen (2006) showed that the ethyl acetate fraction of Terminalia glaucescens rich in polyphenol was more active than other fractions. All these observations come to confirm the previous assumption. Compared to the antifungal specificity, the results testify a difference between the responses of the three fungal strains opposite the extracts studied independently to the extraction organs. Nevertheless, there is a preferential antifungal activity of the extracts according to the strains and plant organs. No conclusions could be drawn from this observation since the difference may be related to the variation of fungi growth.
In this study, the various tested extracts from leaves and seeds showed varying antioxidant activities. The antioxidant activity of G. kola seeds has also been proven by Okoko (2009). Likewise Farshori et al. (2013) and Olatunde et al. (2004) report that G. kola contains natural antioxidants. Considering the Antioxidant Activity index according to Scherer and Godoy (2009), the results obtained with the extracts showed that any extract possesses a very strong antioxidant activity. Nevertheless of the two organs, the seeds exhibit a more interesting antioxidant activity than leaves. Compared to reference molecules, BHA and gallic acid which showed

1726 Afr. J. Microbiol. Res. potent antioxidant activity (with the respective IC50 and AAI of 12.07 ± 2.87 μg/μl and 62.74 ± 5.54 μg/μl); the activity of the extracts is less than that of the reference molecules. It must be remembered that the reference molecules are pure compounds set from the specific active ingredient concentration. In addition, the use of synthetic antioxdants like butylated hydroxy anisole (BHA) and butylated hydroxyl toluene (BHT) has been limited due to their toxicity and side effects. Therefore search for the novel sources of natural oxidants will be important for performing such research (Pourmorad et al., 2006). Thus, through its seeds, G. kola can be used in the treatment of diseases caused by oxidative stress.
Concerning the extracts cytotoxic test, by referring to the toxicity scale established by Mousseux (1995), extracts LD50 is greater than 0.1 mg/ml, value above which the extract is considered exhibiting no toxicity. It appears that all the extracts of the two organs of G. kola are not toxic to humans, because there is a correlation between cytotoxicity of shrimp larvae and cytotoxicity in human cells; notably lung cells on one hand and the cells colon on the other hand (José et al., 2002).
Conclusion
The aim of our study was to identify some chemical groups of secondary metabolites present in three organs of G. kola and evaluate some of their biological activities including antibacterial, antifungal, antioxidant and cytotoxic activity of the extracts. At the end of this study, it appears that the three organs contain important chemical constituents (flavonoids, tannins, saponins coumarins) and have many biological activities. The different extracts of leaves and seeds presented a broad antibacterial activity on the tested reference strains and some food strains. The ethanol extract of the leaves had the best bactericidal effects while the ethyl acetate extract of the seeds present better antifungal and antioxidant activity. Through their antioxidant property, these organs and particularly seeds may be useful to strengthen the body in oxidative stress situations and prevent various diseases that occur following a radical attack. LD50 obtained through the cytotoxic activity allow us to say that the extracts are not toxic.
Conflict of interests
The authors did not declare any conflict of interest.
ACKNOWLEDGMENT
The authors thank UEMOA for the financial support through the project LBTMM-PAES- UEMOA-2012. REFERENCES
Adefule-Ositelu AO, Adefule AK, Oosa BO, Onyenefa PC (2004).
Antifungal activity of Garcinia kola nut extract as an ocular bacterial
isolates in Lagos. Nig. Q. J. Hosp. Med. 14:112-114. Adesuyi AO, Elumm IK, Adaramola FB, Nwokocha AGM (2012).
Nutritional and phytochemical Screening of Garcinia kola. Adv. J.
Food. Sci. Technol. 4:9-14. Ajibola AO, Satake M (1992). Contributions to the phytochemistry of
medicinal plants growing in Nigeria as reported in the 1979-1990 literature - A preview. Afr. J. Pharm. Pharm. Sci. 22:172-201.
Akintowa A, Essien A (1990). Protective effects of Garcinia kola seed
extracts against paracetamol induced hepatotoxicity in rats. J. Ethnopharmacol. 29:207-211.
Akoegninou A, van der Burg WJ, van der Maesen LJG (2006). Flore
analytique du Bénin, edited by V. Adjakidj`e, J. P. Essou B. Sinsin, H. Yédomonhan, Wagening University Papers 06.2, Backhus Publishers, pp. 474-475.
Attien P, Sina H, Moussaouie W, Dadié T, Chabi Sika K, Djéni T, Bankole HS, Kotchoni SO, Edoh V, Prévost G, Djè M, Baba-Moussa L (2013). Prevalence and antibiotic resistance of Staphylococcus
strains isolated from meat products sold in Abidjan streets (Ivory Coast). Afr. J. Microbiol. Res. 7(26):3285-3293.
Bauer AW, Kirby WMM, Sherris TC, Truck M (1966). Antibiotic
susceptibility testing by a standardized single disc method. Am. J. Clin. Pathol. 45:493-496.
Berche P, Gaillard JL, Simonet M (1991). Bactériologie : Les bactéries
des infections humaines, Paris: Flammarion : Médecine & Sciences (ed).
Boumaza A (2009). Effet de l’extrait méthanolique de Zygophyllum
cornutum coss contre le stress oxydant associé au diabète sucré et les organes en relation [thèse de Magister], Université Mentouri-Constantine, p. 105.
Bourgeois A (1999). Les MST/SIDA au Cameroun. Diagnostique et traitement. In Biodiagnostic and therapy knowledge for health, Magasine bilingue de santé publique du Cameroun. 4:1-38.
Bouzid W, Yahia M, Abdeddaim M, Aberkane MC, Ayachi A (2011). Evaluation de l’activite antioxydante et antimicrobienne des extraits de l’Aubepine monogyne. Leban. Sci. J. 12(1):59-69.
Braide VB (1991). Pharmacological effect of chronic ingestion of Garcinia kola seeds in rats. Phytother. Res. 4:39-41.
Bruneton J(1993). Pharmacognosie, Lavoisier, Paris, Plantes
médicinales, 2nd
edition. pp. 369-404. Burger A (1990). The role of natural compounds in Medicinal Chemistry,
John Wiley and Sons, 3rd
Edition.
Codjia JTC, Assogbadjo AE, Ekué MRM (2009). Diversité et valorisation au niveau local des ressources forestières alimentaires du Bénin. Cahiers Agriculture 32:1-12.
Cotterih P, Scheinmenn F, Stenhuise I (1978). Composition of Garcinia kola seeds. J. Chem. Soc. Perkin Trans. 1:532-533.
Cowan MM (1999). Plant products as antimicrobial agents. Clin. Microbiol. Rev. 12(4):564-582.
Dah-Nouvlessounon D, Adoukonou-Sagbadja H, Diarrassouba N, Sina H, Adjonohoun A, Inoussa M, Akakpo D, Gbenou JD, Kotchoni SO, Dicko MH, Baba-Moussa L (2015). Phytochemical analysis and biological activities of Cola nitida bark. Biochem. Res. Int. 2015:1-12.
Dohou N, Yamni K, Badoc A, Douira A (2004). Activité antifongique d’extraits de Thymelaealythroidessur Trois champignons pathogènes
du riz. Bull. Soc. Pharm. Bordeaux. 143:31-38. Eleazu CO, Eleazu KC, Awa E, Chukwuma SC (2012). Comparative
study of the phytochemical composition of the leaves of five Nigerian
medicinal plants. E3 J. Biotechnol. Pharm. Res. 3(2):42-46. Farshori NN, Al-Oqail MM, Al-Sheddi ES, Siddiqui MA, Rauf A (2013).
Antimicrobial potentiality of Polyalthia longifolia seed oil against multi
drug resistant (MDR) strains of bacteria and fungus of clinical origin. Afr. J. Microbiol. Res. 19:1977-1982.
Gangoue-Piéboji J, Baurin S, GaIleni M, Ngassam P, Azebaze A,
Waktuen P, Pegnyemb DE, Ngameni B, Goffin C, Frere JM (2004). Activité inhibitrice de quelques plantes médicinales camerounaises sur les β-lactamases. Pharm. Méd. Trad. Afr. 13:67-80. Ghamba PE, Agbo EB, Umar AF, Bukbuk DN, Goje LJ (2012). In vitro antibacterial activity of crude ethanol, acetone and aqueous Garcinia kola seed extracts on selected clinical isolates. Afr. J.
Biotechnol. 11:478-1483. Guenne S, Ouattara N, Hilou A, Millogo JF, Nacoulma OG (2011).

Antioxidant, enzyme inhibition activities and polyphenol contents of three Asteraceae species used in Burkina Faso traditionnally medicine. Int. J. Pharm. Pharm. Sci. 3(5):524-528.
Houghton PJ, Raman A (1998). Laboratory Hand Book for the Fractionation of Natural Extracts. Chapman and Hall, London, UK.
Indabawa II, Arzai AH (2011). Antibacterial activity of Garcinia kola and
Cola nitida seed extracts. Bayero J. Pure Appl. Sci. Bajopas. 4(1):52-
55. Iwu MM, Igboko O (1982). Flavonoids of Garcinia kola seeds. J. Nat.
Prod. 45:650-651. José LC, Zaira L, Hernandez I, Pilar P, Maria D, Garcia G (2002). A
comparison between two brine shrimp assays to detect in vitro
cytotoxicity in marine natural products. BMC Biotechnol. 2:17-35. Kanmegne G, Ndoumou Omokolo D (2007). Effects of hormones
applications on the germination of six populations of Garcinia kola
Heckel (Guttiferae) seeds. Int. J. Biol. Chem. Sci. 1(3):255-261. Kawsar SMA, Huq E, Nahar N (2008). Cytotoxicity assessment of the
aerial part of Macrotyloma uniflorum Lim. Int. J. Pharm. 4(4):297-300.
Lacmata ST, Kuete V, Dzoyem JP, Tankeo SB, Teke GN, Kuiate JR, Pages JM (2012). Antibacterial Activities of Selected Cameroonian Plants and Their Synergistic Effects with Antibiotics against Bacteria
Expressing MDR Phenotypes. Evid. Based Complement. Altern Med. 2012:1-11.
Morabandza CJ, Ongoka RP, Matini L, Epa C, Nkounkou LC, Abena AA (2013). Chemical Composition of the Mesocarp of Garcinia kola
Heckel (Clusiaceae) Fruit. Res. J. Recent Sci. 2(1):53-58. Mousseux M (1995). Test de toxicité sur larves de Artemia salina
entretien d’un élevage de balanes, [M. DEUST], Université française de Pacifique. Centre universitaire de Nouvelle Calédonie, http://www.documentation.ird.fr/hor/fdi:43863.
N’Guessan JD, Bidie AP, Lenta BN, Weniger B, Andre P, Guede Guina F (2007). In vitro assays for bioactivity-guided isolation of
antisalmonella and antioxidant compounds in Thonningia sanginea
flowers. Afr. J. Biotechnol. 6:1685-1689. Odeigah PG, Taiwo IA, Akomolafe EO, Durojaiye OO (1999).
Hypoglycemic action of medicinal plants with tolbutamide in the
albino rats. Diabetes Int. 9:71-73. Okoko T (2009). Chromatographic characterisation, in vitro antioxidant
and free radical scavenging activities of Garcinia kola seeds. Afr. J.
Biotechnol. 8:7133-7137. Okunji CO, Tantalia AW, Hicks RP, Iwu MM, Skanchy DJ (2002).
Capillary electrophoresis determination of biflavonones from Garcinia
kola in three traditional African medicinal formulations. Plant. Med.
68:440-444. Olatunde FE, Hansen M, Rain-Haren P, Dragsted LO (2004).
Commonly Consumed and Naturally Occuring Dietary Substances affect Bio Makers of Oxidative Stress and DNAdamage in Healthy Rats. Food Chem. Toxicol. 42:1315-1322.
Ortuno A, Baidez A, Gomez P, Acras MC, Porras I, Garcia-Lidon A, Del
Rio JA (2006). Citrus paradisi and Citrus sinensis flavonoids. Their influence in the defence mechanism against Penicillium digitatum.
Food Chem. 98(2):351-358.
Dah-Nouvlessounon et al. 1727 Ozsoy N, Can A, Yanardag R, Akev N (2008). Antioxidant activity of
Smilax excelsa L. leaf extracts. Food Chem. 110:571-583. Pietta PG (2000). Flavonoids and antioxidants. J. Nat. Prod. 63:1035-
1042. Pourmorad F, Hosseinimehr SJ, Shahabimajd N (2006). Antioxidant
activity, phenol and flavonoid contents of some selected Iranian
medicinal plants. Afr. J. Biotechnol. 5:1142-1145. Razali N, Razab R, Mat Junit S, Abdul Aziz A (2008). Radical
scavenging and reducing properties of extracts of cashew shoots
(Anacardium occidentale). Food Chem. 111:38-44. Re R, Pellegrini N, Proteggent A, Pannala A, Yang M, Rice-Evans C
(1999). Antioxidant activity applying an improved ABTS radical cation
decolorization assay. Free Rad. Biol. Med. 26(10):1231-1237. Rohman A, Riyanto S, Yuniarti N, Saputra WR, Utami R, Mulatsih W
(2010). Antioxidant activity, total phenolic, and total flavonoid of
extracts and fractions of red fruit (Pandanus conoideus Lam). Int. Food. Res. J. 17:97-106.
Saha A, Rahman MS (2008). Antimicrobial Activity of Crude Extract from Calycopteris floribunsa. Bangladesh J. Microbiol. 25(2):137-139.
Salem HJ (2009). Extraction, identification, caractérisation des activités biologiques des flavonoïdes de Nitraria retusa et synthèse des
dérivés acyles de ces molécules par voie enzymatique, [Ph.D, thesis], Institut National Polytechnique de Lorraine, Université de Nancy. pp. 198.
Sanogo R, Diallo D, Diarra S, Ekoumou C, Bougoudogo D (2006). Activité antibactérienne et antalgique de deux recettes traditionnelles utilisées dans le traitement des infections urinaires et la cystite au
Mali. Mali Méd. 21:18-24. Scherer R, Godoy HT (2009). Antioxidant activity index (IAA) by the 2,
2-diphenyl-1- picrylhydrazyl method. Food Chem. 112:654-658.
Schmeda-Hirschmann G, Rodriguez JA, Theoduloz C, Astudillo L, Feresin GE, Tapia A (2003). Free radical scavengers and antioxidants from Peumusboldus Mol. (“Boldo”). Free Radic. Res .
37:447-452. Sessou P, Farougou S, Azokpota P, Youssao I, Fanou B, Kaneho S,
Agniwo B, Yèhouenou B, Ahounou GS, Chabi-Egba M, Sohounhloue D (2012). In vitro antifungal activity of essential oil of Pimenta racemosa against fungal isolates from wagashi, a traditional cheese
produced in Benin. Int. J. Nat. Appl. Sci. 8(1):25-34.
Sharmila N, Gomathi G (2011). Antibacterial, Antioxidant activity and Phytochemical studies of Crossandra infundibuliformis leaf extracts.
Int. J. Phytomed. 3:151-156.
Zareen S (2006). Phytochemical studies on Terminalia glaucescens, pteleopsis hylodendron and related medicinal plants, [PhD thesis], H.E.J. Research Institute of Chemistry, University of Karachi, p. 204.

Vol. 9(28), pp. 1728-1737, 15 July, 2015
DOI: 10.5897/AJMR2014.7201
Article Number: C1C468554441
ISSN 1996-0808
Copyright © 2015
Author(s) retain the copyright of this article http://www.academicjournals.org/AJMR
African Journal of Microbiology Research
Full Length Research Paper
Evaluation of bacteriological quality and essential elements in commercially bottled/packaged water produced and marketed in Southeastern Nigeria
Onoja Uwakwe Simon1*, Nweze, Innocent Emeka2, Agbo Matthias Onyebuchi3, Nnamani Petra Obioma4, Eke Felicia Nkechi5, Ivoke Njoku5, Eyo Joseph Ekpenyong5, Attama Chinedu
Ifeanyi5 and Ejere Vincent Chikwendu5
1Department of Human Nutrition and Dietetics, University of Nigeria, Nsukka, Nigeria.
2Department. of Microbiology, University of Nigeria, Nsukka, Nigeria.
3Department of Pharmaceutical Chemistry, University of Nigeria, Nsukka, Nigeria.
4Department of Pharmaceutics, University of Nigeria, Nsukka, Nigeria.
5Department. of Zoology and Environmental Biology, University of Nigeria, Nsukka, Nigeria.
Received 16 October, 2014; Accepted 10 July, 2015
The bacteriological quality and levels of essential mineral elements and organic acids were evaluated in 33 randomly selected bottled/packaged water samples produced and marketed in Southeastern Nigeria. The microbiological assay, essential mineral elements and organic acids were determined using American Public Health Association (APHA) standard methods. The distinguishing characteristics of the
microorganisms identified were their psychotropic growth capabilities, motility at 37C, growth in air, negative phenylalanine, deaminase, positive urease, catalase, oxidase and coagulase activities. Data obtained were compared with the accepted standards for safe drinking water as recommended by WHO/UNICEF. Some of the bacteria species recovered from the water samples included Escherichia coli, Bacillus subtilis and Staphylococcus aureus. The results show that only 9% of the samples investigated met the WHO/UNICEF standard of zero microbial load, 73% of the samples fell within 10
3 -
104 colony forming units (CFU)/100 ml, while 18% had the poorest with 10
6 CFU/100 ml. Major essential
minerals found were calcium, sulphate, chloride, nitrate, bicarbonate and phosphate. Furthermore, the levels of these essential minerals were within the acceptable range in 76% of the samples while in others (24%) they were below the standard range recommended by WHO/UNICEF/APHA. There is need to maintain the approved standard level of chlorination in bottled /packaged water produced and sold in Southeastern Nigeria. Moreover, routine bacteriological quality assay by companies producing bottled/packaged drinking water should be enforced in Nigeria in particular and other developing countries in view of the findings in our study. Key words: Microorganisms, packaged water, psychotropic growth, bacteriological quality, essential minerals, organic acids.
INTRODUCTION Commercially bottled/packaged water is mainly produced for human consumption. In Nigeria, it comes in two forms:
they are either sealed in plastic containers or in small nylon sachets. The sachet forms are generally called

‘pure water’ by many Nigerians. ‘Pure water’ enjoys much better patronage from those in the low socioeconomic class (over half of the population of Nigeria) because they are much cheaper than those in sealed plastic containers. Except for safe fluorides, no other ingredients are added in commercially produced drinking water.
Adherence to quality control standards and international best practices by those who produce packaged water in Nigeria are doubtful for so many reasons. First, most of the producers lack appropriate technology to meet with the acceptable international standards. Second, Oyedeji and co-workers (2010) reported that some producers source their raw water from well water which is not a good source of portable drinking water. Third, findings from local regulatory authorities indicated that some producers of packaged water indulge in very dubious practices by producing under very unhygienic conditions, packaging of untreated water, use of unapproved premises to produce unregistered water, use of non-grade waterproof sachets and marketing of packaged water without production and expiry dates among other sharp practices (Edema and Atayese, 2010). Unfortunately, the lack of safe municipal and portable water in Nigeria has recently increased the demand for these commercially bottled/sachet water. According to Gardner (2004) this is because of the impression that bottled/sachet water is safer and healthier. Sahota (2005) opined that lack of proper sanitation and unhygienic practices account for the major sources of microbial contamination of any portable water. Nigeria is a country with a population of over 160 million persons. The country is also a market destination for many West Africans and a lot of foreign visitors come to Nigeria for one reason or the other. Therefore, the indiscriminate sale and consumption of sealed water in plastic containers/sachets in Nigeria is of public health significance and this is the major motivation for our study. To the best of our knowledge, there is no study that has comprehensively evaluated the quality of commercially marketed drinking water in all of the Southeast States of Nigeria, an important business hub in West Africa. Southeast Nigeria is made up of five states: Enugu, Anambra, Imo, Abia and Ebonyi states (Figure 1). Furthermore, water-related diseases continue to be a major issue in many developing countries. The high incidence of dysentery, cholera, typhoid and diarrhea has been linked to the consumption of unsafe and non-hygienic drinking water and their production processes (Mead et al., 1999).
Some published studies have reported the detection of heterotrophic and coli form bacteria counts in bottled water (Hobbs, 1962; Craun, 1997; Bhareth et al., 2003). Adelegan (2004) also reported that the increase in the cases
Onoja et al. 1729 of Salmonellosis and typhoid fever in Nigeria is as a result of increased consumption of low quality sachet water. The refusal of some producers of water in plastic containers/sachets to mark production and expiry dates on their products means that the product can also deteriorate before it reaches the consumer (Da Silva et al., 2007).
Examination of water samples for pathogens are usually carried out because many workers have found positive correlation between high density viable counts, total and fecal coli forms and the presence of pathogens such as Salmonella, E. coli, S. aureus in drinking water (Hood et al., 1983; LeChevallier, 1990; Payment et al., 1993). Moreover, there have been reported cases of food and waterborne disease outbreaks in both children and adults in Southeastern Nigeria (Blum et al., 1987; Ogan, 1988). For example, it is most probable that the organisms causing these diseases must have been transmitted directly or indirectly to food and water through fecal contamination or by the urine of the carrier animal or man. The study was therefore, conducted to ascertain the quality of commercially marketed drinking water sold in Southeast Nigeria. The levels of microbial conta-mination and that of essential organic and inorganic ions in the randomly selected water samples were evaluated to determine their conformity with the acceptable reference standards approved by (WHO, 1998; APHA, 1998; UNICEF (2008).
MATERIALS AND METHODS Sampling
Thirty three (33) water samples collected from thirty three companies producing commercially bottled and/or sachet water in Southeastern Nigeria were analyzed. Samples were collected from fresh stocks supplied to the sellers by the different producers. They were stored in a chilled thermo flask containing ice blocks to regulate the temperature. They were later transported back to the laboratory and processed immediately. The states that make up the Southeastern Nigeria are: Abia, Anambra, Ebonyi, Enugu and Imo. The companies chosen were randomly selected from different
locations in the region. Based on the population of companies producing water in plastic containers and sachets in these states, samples were collected as follows: Anambra (8), Abia (7), Enugu/Imo/Ebonyi (6 each). The map of the area covered in the sample collection is shown in Figure 1.
The methods for detection, isolation and enumeration of bacteria in the water samples were determined according to the procedures described by American Public Health Association APHA (1998), Chigbu and Sobolev (2007) and Douterelo et al. (2014)
Presumptive total coli forms, fecal coli forms and E. coli detection and enumeration in the water samples
In this method, serial dilutions of the water samples were made and
*Corresponding author. E-mail: [email protected]. Tel: +2348035379341. Author(s) agree that this article remains permanently open access under the terms of the Creative Commons Attribution License 4.0 International License

1730 Afr. J. Microbiol. Res.
Figure 1. Map of Southeast Nigeria where samples were collected
inoculated into Laury Tryptose broth (LTB) growth media along with fermentation tubes with inverted vials for gas production. Samples
were then incubated for 24h at 35C and for an additional 24 h where there was no growth at the end of the first 24 h. Growth (turbidity), gas bubbles or acid in the tube was due to the fermentation of lactose and indicated the presence of coli form bacteria. A 10- tube most probable number (MPN) method (Multiple Tube technique) was used for the analysis of the water samples.
Confirmation test for the coli form bacteria
The brilliant green lactose bile broth (BGLBB) was used for the confirmation test for the coli form. After preparation, 10 ml of the medium was added into the fermentation tubes such that the media level covered the inverted tubes in the fermentation tubes. The final pH of the broth was 7.2 ± 0.1 after sterilization. All tubes showing
growth, gas bubbles or acid reaction in the LTB test were transferred to the BGLBB tubes and incubated for 24-48 h at 35- 37
± 2C. Growth or gas production in the tubes showed confirmatory test for the coli form bacteria. The MPN of bacteria present in the sample was calculated using the number of positive BGLBB tubes and the MPN index table (Chigbu and Sobolev, 2007).
Confirmation test for E. coli in coli form positive samples
A mixture of the water samples and 4- methylumbelliferyl- b-D- glucoronide (MUG) was added to EC growth medium at a concen-
tration of 50 ml/l. The test is based on the cleavage of MUG to free methylumbelliferyl moiety, which fluoresces in blue color when irradiated with the ultra violet (UV) radiation. EC medium was sterilized before use and the pH after sterilization was 6.9 ± 0.2. The EC medium was tested for fluorescence before use. The EC tube from positive BGLBB tubes were incubated in a water bath at
44.5 ± 2C for 22-26 h. The inverted Durham tubes were omitted. A positive reaction for E. coli was indicated by the presence of blue
fluorescence. A tube inoculated with a known positive culture and a negative culture were included for each batch to be tested to serve as a reference in order to eliminate false positives (Chigbu and Sobolev, 2007; Mossel and Vega, 1973).
Mineral and organic acids determination
The essential elements and organic acids in the samples were estimated in the water samples using wet digestion with nitric and perchloric acid to produce complete digestion. The acidified sample was evaporated to the lowest possible volume before precipitation. Nitric acid addition continued until a clear solution was obtained. The values were then read in atomic absorption spectrophotometer and gas chromatography, respectively. The principles of the two methods are based on the formation of colored compounds with appropriate and specific reagents. During the process, the radiant energy of a very narrow wavelength (visible or UV region) is selected from a source, and passed through the sample solution,

Onoja et al. 1731 Table 1. Range of bacterial contamination of the water samples.
Bacteria/samples Total viable counts (TVC)
(CFU/100 ml) Total coliform counts (TC)
(CFU/100 ml) Fecal coliform counts
(FC)(CFU/100 ml)
MW1 1.2 - 1.3 x 10⁶ 1.4 - 1.6 x 10
5 1.1 - 1.2 x 10
1
MW2 1.6 - 1.7 x 10⁴ 1.8 - 2.0 x 10
3 1.8 - 2.2 x 10
1
MW3 2.2 - 2.5 x 10⁴ 2.3 - 2.4 x 10
2 2.2 - 2.3 x 10
2
MW4 1.5 - 1.6 x 10⁴ 1.3 - 1.4 x 10
3 2.1 - 2.2 x 10
1
MW5 1.6 - 1.7 x 10⁵ 1.8 - 2.0 x 10
3 1.8 - 2.2 x 10
2
MW6 1.4 - 1.6 x 10⁶ 1.6 - 2.2 x 10
4 1.7 - 1.9 x 10
2
MW7 2.1 - 2.2 x 10³ 2.2 - 2.3 x 10
2 1.9 - 2.0 x 10
1
MW8 2.2 - 2.4 x 10⁴ 2.2 - 2.4 x 10
2 1.8 - 2.0 x 10
2
MW9 1.8 - 2.0 x 10⁵ 1.6 - 1.8 x 10
3 1.6 - 1.70 x 10
2
MW10 1.6 - 1.8 x 10⁴ 1.86 - 2.2 x 10
2 1.2 - 1.4 x 10
2
MW11 1.8 - 2.0 x 10⁴ 2.2 - 2.6 x 10
2 2.4 - 2.6 x 10
2
MW12 1.8 - 2.0 x 10⁶ 2.2 - 2.6 x 10
4 2.4 - 2.6 x 10
2
MW13 1.8 - 2.0 x 10³ 2.2 - 2.6 x 10
2 2.4 - 2.6 x 10
1
MW14 1.8 - 2.0 x 10⁵ 2.2 - 2.6 x 10
3 2.4 - 2.6 x 10
2
MW15 1.8 - 2.0 x 10⁴ 2.2 - 2.6 x 10
3 2.4 - 2.6 x 10
1
MW16 ND ND ND
MW17 1.8 - 2.0 x 10⁶ 2.2 - 2.6 x 10
4 2.4 - 2.6 x 10
2
MW18 1.8 - 2.0 x 10⁴ 2.2 - 2.6 x 10
2 2.4 - 2.6 x 10
2
MW19 1.8 - 2.0 x 10⁴ 2.2 - 2.6 x 10
2 2.4 - 2.6 x 10
2
MW20 1.8 - 2.0 x 10⁴ 2.2 - 2.6 x 10² 2.4 - 2.6 x 10²
MW21 1.8 - 2.0 x 10⁵ 2.2 - 2.6 x 10³ 2.4 - 2.6 x 10²
MW22 1.8 - 2.0 x 10⁶ 2.2 - 2.6 x 10⁴ 2.4 - 2.6 x 10²
MW23 1.8 - 2.0 x 10⁴ 2.2 - 2.6 x 10³ 2.4 - 2.6 x 101
MW24 ND ND ND
MW25 1.8 - 2.0 x 10⁶ 2.2 - 2.6 x 10⁵ 2.4 - 2.6 x 101
MW26 1.8 - 2.0 x 10³ 2.2 - 2.6 x 10² 2.4 - 2.6 x 101
MW27 1.8 - 2.0 x 10⁴ 2.2 - 2.6 x 10³ 2.4 - 2.6 x 101
MW28 ND ND ND
MW29 1.8 - 2.0 x 10³ 2.2 - 2.6 x 10² 2.4 - 2.6 x 101
MW30 1.8 - 2.0 x 10⁴ 2.2 - 2.6 x 10³ 2.4 - 2.6 x 101
MW31 1.8 - 2.0 x 10³ 2.2 - 2.6 x 10² 2.4 - 2.6 x 101
MW32 1.8 - 2.0 x 10⁴ 2.2 - 2.6 x 10³ 2.4 - 2.6 x 101
MW33 1.8 - 2.0 x 10³ 2.2 - 2.6 x 10² 2.4 - 2.6 x 101
*Means ± (SD) of 3 determinations. Samples on appropriate media incubated at 35°C - 44.5 2°C as determined by MPN method. MW 1 - MW19
= water from different locations in the region. ND = Not detected.
which is contained in the quartz cell. The amount of radiation absorbed at a certain wavelength is proportional to the light absorbing chemical in the sample (Peldszus et al., 1996; Kuo, 1998; Jorge et al., 2007; Nachiyunde et al., 2013).
Statistical analysis
The analysis of variance (ANOVA) and Duncan’s New Multiple Range Tests (DNMRT) were used to test the significance of the difference among means. (Steel and Torrie, 1980).
RESULTS
Bacteriological quality of the water samples
Table 1 presents the results obtained for the total viable
counts, total coli forms and fecal coli forms. On the basis of total viable counts, it is evident that samples MW16, MW24 and MW28 had the highest microbiological quality with no significant detectable bacteria counts (p>0.05) compared with the rest of the samples. On the basis of total coli forms and fecal coli forms, MW1, MW6, MW12, MW17, MW22 and MW25 had the poorest sanitary quality with the average counts of 10
6 CFU/100 ml. The values
for the other samples ranged from 103
to 104CFU/100 ml.
The overall ranking of the microbiological quality for the entire water samples studied is thus: MW16, MW24, MW28>MW2, MW3, MW4, MW5, MW7, MW8, MW9 MW10, MW11, MW13, MW14, MW15, MW18 , MW19, MW20, MW21, MW23, MW26, MW27, MW29, MW30, MW31, MW32, MW33

1732 Afr. J. Microbiol. Res. Table 2. Population of individual pathogenic organisms in the water samples (CFU/100 ml).
Samples/bacteria MW1 MW2 MW3 MW4 MW5 MW6 MW7 MW8 MW9 MW10 MW11
Escherichia coli - - - - - - - - 5.4x10³ 2.1x10
4 -
S. aureus - - - - - - - 3.5x10³ - 4.1x10
3 -
B. subtilis - - - - 4.0x10³ 3.0x10
3 9.4x10
5 4.1x10
3 - 1.4x10
4
Acinetobacter sp. 4.7x10³ - - - - - - - -
Salmonella sp. - - - - - - - - - -
Alcaligenes sp. - - - 1.3x10⁴ - - - - - -
Pseudomonas sp. - - - - 4.0x10³ - - - - -
Klebsiella sp. - - 1.0x10³ - - - - - - -
Aerobacter sp. - - - - - - - - - 1.2x10³ 1.3x10
4
Lactobacillus sp. - - 1.0x10³ - - - - - - 1.3x10
3 -
Leuconostoc sp. - - - 1.0x10³ - - - - 1.0x10
3 -
Clostridumperfrigenes - - - - - - - - - - -
*Means ± (SD) of 3 determinations. Samples on appropriate media incubated at 35°C - 44.5 ± 2°C as determined by MPN method. MW 20 - MW33 = water from different locations in the region; ND = Not detected.
Table 2. Contd.
Samples/bacteria MW12 MW13 MW14 MW15 MW16 MW17 MW18 MW19 MW20 MW21 MW22
Escherichia coli - - - - NS - - - 5.4x10³ 2.1x10⁴ -
S.aureus 4.7x10³ - - - NS - - 3.5x10³ - -
B. subtilis - - - - NS 3.0x10³ 9.4x10⁵ 4.1x10³ - 1.4x10⁴
Acinetobacter 4.7x10³ - - - NS - - - -
Salmonella sp. - - - - NS - - - - -
Alcaligenes sp. - - - 1.3x10⁴ NS - - - - -
Pseudomonas sp. - 1.0x10³ - - NS - - - - -
Klebsiella sp. - - 1.0x10³ - NS - - - - -
Aerobacter sp. - - - - NS - - - - 1.2x10³ 1.3x10⁴
Lactobacillus sp. - - 1.0x10³ - NS- - - - - 1.3x10³ -
Leuconostoc sp. - - - 1.0x10³ NS- - - - 1.0x10³ -
Clostridumperfrigenes - - - NS- - - - - - -
*Means ± (SD) of 3 determinations. Samples on appropriate media incubated at 35oC - 44.5 ± 2C as determined by MPN
method MW12 - MW22 = water from different locations in the region. ND = Not detected.
>MW1 , MW6, MW12, MW17, MW22 and MW25. The results were further subjected to Duncan’s new multiple range test. On the basis of the total viable counts, all the samples were found to be significantly (p<0.05) different from each other. Similarly, on the basis of total coli forms and fecal coli forms, the samples were found to be statistically different at 5% level of significance. Furthermore, the results obtained on the basis of individual microorganisms (Table 2), indicated that some samples had pathogenic organisms notably, E. coli, B. subtilis and S. aureus with the average contamination of 10
3CFU/100 ml.
Table 3 presents the essential elements and pH of the water samples. The calcium ion contents of the samples varied. The values ranged from 6.00 mg/ml in MW7 to 24.00 mg/ml in MW33 and the difference was significant (p<0.05). Sample MW10 had the highest sulphate
concentration of 0.039 mg/ml compared with MW1 with the least value (0.010 mg/ml). There were significant (p<0.05) differences in the chloride concentrations among the samples (Table 3). However, MW14 and MW28 had similar values (17.54 mg/ml). The nitrate ion levels of the samples ranged from 0.100 to 2.34 mg/ml with MW4 having the highest value and MW1 the least. Samples MW2 and MW6 had similar value (1.34 mg/ml). The bicarbonate ion concentrations of the samples varied. Sample MW22 had the highest value (20.24 mg/ml) while MW4 had the least (7.45 mg/ml). The phosphate ion levels ranged from 5.56 mg/ml in MW21 to 20.26 mg/ml in MW33. The logarithm of hydrogen ion concentration (pH) of the entire samples were comparable.
Table 4 presents the organic acid concentrations of the water samples. The oxalic acid ion (HOOCCOO
-)
contents of the samples were of the order of 0.98 to 4.66

Onoja et al. 1733 Table 2. Contd.
Samples/bacteria MW23 MW24 MW25 MW26 MW27 MW28 MW29 MW30 MW31 MW32 MW33
Escherichia coli - NS - - - NS - - 5.4x10³ 2.1x10
4 -
S.aureus 4.7x10³ NS - - - NS - 3.5x10
3 - -
B. subtilis - NS - - 4.0x10³ NS 9.4x10
5 4.1x10
3 - 1.4x10
4
Acinetobacter sp. 4.7x10³ NS - - - NS - - -
Salmonella sp. - NS - - - NS - - - -
Alcaligenes sp. - NS - 1.3x10⁴ - NS - - - -
Pseudomonas sp. - NS - - 4.0x10³ NS - - - -
Klebsiella sp. - NS 1.0x10³ - - NS - - - -
Aerobacter sp. - NS - - - NS - - - 1.2x10³ 1.3x10
4
Lactobacillus sp. - NS 1.0x10³ - - NS - - - 1.3x10
3 -
Leuconostoc sp. - NS - 1.0x10³ - NS- - - 1.0x10
3 -
Clostridumperfrigenes - - - - - NS - - - - -
*Means ± (SD) of 3 determinations. Samples on appropriate media incubated at 35°C - 44.5 ± 2C as determined by MPN method. MW 23 - MW1 = water from different locations in the region; ND = Not detected.
Table 3. Essential mineral elements and pH of the water samples.
Parameters/samples MW1 MW2 MW3 MW4 MW5 MW6 MW7
Calcium (mg/l) 11.10a±1.0 16.0c±1.0 15.0c±1.2 11.0a±1.30 22.0d±1.00 11.0±1a.20 6.00e±1.30
Sulphate (mg/ml) 0.010d±0.001 0.013d±0.001 0.037c±0.002 0.010d±0.001 0.110d±0.001 0.015d±0.002 0.07e±0.001
Chloride (mg/l) 14.27a±1.2 11.38b±1.3 2.84c±1.00 14.20a±1.20 11.36b±1.30 19.88d±2.00 17.04e±1.20
Nitrate (mg/ml) 0.100a±0.001 1.34b±0.002 0.105a±0.001 2.34c±0.010 0.31d±0.002 1.34b±0.001 0.664e±0.020
Biocarbonate (mg/l) 19.00a±2.00 7.77b±1.20 20.00a±2.00 7.45b±1.20 17.00c±1.20 16.00c±1.20 15.90c±1.50
Phosphate (mg/l) 11.00a±1.20 13.60c±1.50 14.00c±1.00 10.00a±2.0 20.20d±2.00 12.50b±1.00 6.00e±0.20
pH 6.20b 6.10b 6.10b 6.20b 6.10b 6.00b 6.00b
*Means ± (SD) of 3 determinations. Values on the same row with different superscripts are significantly different (p<0.05). MW1 - MW7 = municipal water from different locations in the region. WHO/UNICEF recommended values: pH (6.5-8.5), Phosphate (<20 mg/l), Bicarbonate (<20 mg/l), Nitrate (0.02mg/l, Chloride (250 mg/l), Sulphate (100 mg/l), Ca
2+ (< 20 mg/l).
Table 3. Contd.
Parameters/samples MW8 MW9 MW10 MW11 MW12 MW13 MW14
Calcium (mg/l) 11.10a±1.0 15.0c±1.0 14.0c±1.2 10.0a±1.30 23d±1.00 11±1a.20 7.0e±1.30
Sulphate (mg/ml) 0.012d±0.001 0.013d±0.001 0.039c±0.002 0.011d±0.001 0.110d±0.001 0.014d±0.002 0.007e±0.001
Chloride (mg/l) 14.26a±1.2 11.38b±1.3 2.84c±1.00 14.22a±1.20 11.36a±1.30 19.87d±2.00 17.54e±1.20
Nitrate (mg/ml) 0.100a±0.001 1.32b±0.002 0.106a±0.001 2.43c±0.010 0.33d±0.002 1.34b±0.001 0.664e±0.020
Biocarbonate (mg/l) 18.66a±2.00 8.22b±1.20 20.00a±2.00 8.20b±1.20 17.00c±1.20 15.00c±1.20 16.10c±1.50
Phosphate (mg/l) 10.00a±1.20 11.50b±1.50 14.20c±1.00 10.00a±2.0 20.10d±2.00 12.20b±1.00 6.22e±0.20
pH 6.10b 6.11b 6.10b 6.10b 6.11b 6.01b 6.00b
*Means ± (SD) of 3 determinations Values on the same row with different superscripts are significantly different (p<0.05). MW8 - MW14 = municipal water from different locations in the region. WHO/UNICEF recommended values: pH (6.5-8.5), Phosphate (<20 mg/l), Bicarbonate (<20 mg/l), Nitrate (0.02 mg/l, Chloride (250 mg/l), Sulphate (100 mg/l), Ca
2+ (< 20 mg/l).
mg/ml. MW33 had the highest value (4.66 mg/ml), while MW23 had the least (0.98mg/ml). There were significant(p<0.05) differences amongst the samples. The formic acid ion (HCOO
-) levels of the various samples
varied. The values ranged from 1.12 mg/ml in MW13 to 4.24mg/ml in MW33 and the differences were significant (p<0.05). The acetic acid ion (CH3COO
-) values ranged
from 0.687 to 6.682 mg/ml. The acetic acid contents of
MW8, MW9, MW20 and MW30 samples were similar (6.682 mg/ml) (p>0.05). Similarly, samples MW13 and MW24 had the same value (0.687 mg/ml). DISCUSSION Bacteriological analyses of the water samples revealed

1734 Afr. J. Microbiol. Res.
Table 3. Contd.
Parameters/samples MW15 MW16 MW17 MW18 MW19 MW20 MW21
Calcium (mg/l) 10.10a±1.0 16.20c±1.0 16.10c±1.2 11.0a±1.30 21.60d±1.00 12.22±1a.20 6.10e±1.30
Sulphate (mg/ml) 0.011d±0.001 0.014d±0.001 0.036c±0.002 0.011d±0.001 0.110d±0.001 0.014d±0.002 0.007e±0.01
Chloride (mg/l) 14.24a±1.2 11.34b±1.3 2.86c±1.00 14.22a±1.20 11.32b±1.30 19.78d±2.00 17.24e±1.20
Nitrate (mg/ml) 0.101a±0.001 1.32b±0.002 0.103a±0.001 2.23c±0.010 0.34d±0.002 1.35b±0.001 0.662e±0.020
Biocarbonate (mg/l) 20.22a±2.00 8.32b±1.20 20.00a±2.00 8.10b±1.20 16.00c±1.20 16.20c±1.20 16.24c±1.50
Phosphate (mg/l) 9.50a±1.20 12.06b±1.50 14.00c±1.00 10.00a±2.0 20.00d±2.00 12.00b±1.00 5.56e±0.20
pH 6.00b 6.10b 6.10b 6.00b 6.10b 6.00b 6.00b
*Means ± (SD) of 3 determinations.Values on the same row with different superscripts are significantly different (p<0.05). MW 15 -
MW21 = municipal water from different locations in the region. WHO/UNICEF recommended values: pH (6.5-8.5), Phosphate (<20 mg/l), Bicarbonate (<20 mg/l), Nitrate (0.02 mg/l, Chloride (250 mg/l), Sulphate (100 mg/l), Ca
2+ (< 20 mg/l).
Table 3. Contd.
Parameters/samples MW22 MW23 MW24 MW25 MW26 MW27 MW28
Calcium (mg/l) 12.10a±1.0 15.20c±1.0 16.0c±1.2 11.50a±1.30 21.50d±1.00 10.10±1a.20 5.10e±1.30
Sulphate (mg/ml) 0.011d±0.001 0.012d±0.001 0.038c±0.002 0.010d±0.001 0.111d±0.001 0.015d±0.002 0.066e±0.001
Chloride (mg/l) 14.24a±1.2 11.33b±1.3 2.82c±1.00 14.20a±1.20 11.36b±1.30 19.86d±2.00 17.54e±1.20
Nitrate (mg/ml) 0.100a±0.001 1.32b±0.002 0.106a±0.001 2.31c±0.010 0.32d±0.002 1.32b±0.001 0.664e±0.020
Biocarbonate (mg/l) 20.24a±2.00 8.00b±1.20 20.24a±2.00 8.00b±1.20 19.47a±2.00 15.50c±1.20 16.20c±1.50
Phosphate (mg/l) 10.11a±1.20 12.40b±1.50 14.23c±1.00 10.10a±2.0 20.20d±2.00 12.24b±1.00 6.10e±0.20
pH 6.10b 6.10b 6.10b 6.20b 6.00b 6.00b 6.00b
*Means ± (SD) of 3 determinations. Values on the same row with different superscripts are significantly different (p<0.05). MW22 - MW28 = municipal water from different locations in the region WHO/UNICEF recommended values: pH (6.5-8.5), Phosphate (<20 mg/l), Bicarbonate (<20 mg/l), Nitrate (0.02 mg/l, Chloride (250 mg/l), Sulphate (100 mg/l), Ca
2+ (< 20
mg/l).
Table 3. cont’d.
Parameters/Samples MW29 MW30 MW31 MW32 MW33
Calcium (mg/l) 11.12a±1.0 15.20
c±1.0 14.20
c±1.2 11.10
a±1.30 24.00
d±1.00
Sulphate (mg/ml) 0.011d±0.001 0.013
d±0.001 0.032
c±0.002 0.011
d±0.001 0.110
e±0.001
Chloride (mg/l) 14.24a±1.2 11.31
b±1.3 2.84
c±1.00 13.82
a±1.20 11.34
b±1.30
Nitrate (mg/ml) 0.101a±0.001 1.23
b±0.002 0.106
a±0.001 2.32
c±0.010 0.35
d±0.002
Biocarbonate (mg/l) 20.23a±2.00 7.55
b±1.20 7.82
b±1.20 8.20
b±1.20 7.92
b±1.20
Phosphate (mg/l) 10.01a±1.20 12.22
b±1.50 14.20
c±1.00 10.22
a±2.0 20.26
d±2.00
pH 6.20b 6.10
b 6.20
b 6.20
b 6.10
b
*Means ± (SD) of 3 determinations. Values on the same row with different superscripts are significantly different (p<0.05). MW29 - MW33 = municipal water from different locations in the region. WHO/UNICEF recommended values: pH (6.5-8.5), Phosphate (<20 mg/l), Bicarbonate (<20 mg/l), Nitrate (0.02 mg/l, Chloride (250 mg/l),
Sulphate (100 mg/l), Ca2+
(< 20 mg/l).
the presence of pathogens and this is in agreement with the reports of LeChevallier (1990); Michiels and Moyson (2000); Chigbu and Sobolev (2007) that implicated these organisms in different waterborne disease outbreaks across the world. The public health significance of these organisms cannot be over-emphasized. A higher load over MID had been implicated in foodborne enteritis (Chigbu and Sobolov, 2007; Onoja et al., 2011), traveller’s diarrhea (Gorbach et al., 1975) and water
borne diseases (Mackenzie et al., 1994; APHA, 1998; Hunter and Fewtrell, 2001; Feng et al., 2002; Onoja et al., 2011). E. coli is a heat sensitive organism that cannot withstand the processing temperature hence, it is evident that its mode of entry must have been through handling and post process re-contamination and cross - contamination (LeChevallier, 1990). Furthermore, E. coli is solely an organism of intestinal origin, hence its presence in the water samples is an indication of

Onoja et al. 1735
Table 4. Essential organic acids content of the water samples*
Samples/organic acids Oxalic acid (mg/l) Formic acid (mg/l) Acetic acid (mg/l)
MW1 1.50a ± 0.020 1.22
a ± 0.001 2.097
a ± 0.020
MW2 2.10a ± 0.10 1.22
a ± 0.002 0.776
b ± 0.020
MW3 2.54b ± 0.20 2.20
b ± 0.100 1.043
c ± 0.020
MW4 1.55a ± 0.10 1.42
a ± 0.010 1.045
c ± 0.010
MW5 3.64c ± 0.20 2.21
b ± 0.020 1.314
c ± 0.010
MW6 3.04d ± 0.30 1.23
a ± 0.010 1.084
c ± 0.020
MW7 2.44b ± 0.20 2.20
b ± 0.010 2.623
d ± 0.020
MW8 3.22d ± 0.40 3.20
c ± 0.002 6.824
e ± 0.400
MW9 2.44b ± 0.20 2.44
b ± 0.001 6.824
e ± 0.500
MW10 2.42b ± 0.10 1.66
a ± 0.002 3.159
f ± 0.100
MW11 4.64e ±0.20 4.22 ± 0.002 3.675
f ± 0.020
MW12 1.55a ± 0.020 1.20
a ± 0.001 2.094
a ± 0.020
MW13 1.96a ± 0.10 1.12
a ± 0.002 0.687
b ± 0.020
MW14 2.52b ± 0.20 1.77
b ± 0.100 1.045
c ± 0.020
MW15 1.64a ± 0.10 1.43
a ± 0.010 1.039
c ± 0.010
MW16 3.62c ± 0.20 2.22
b ± 0.020 1.313
c ± 0.010
MW17 3.22d ± 0.30 1.23
a ± 0.010 1.084
c ± 0.020
MW18 2.42b ± 0.20 2.11
b ± 0.010 2.524
d ± 0.020
MW19 2.66b ± 0.40 3.23
c ± 0.002 5.823
e ± 0.400
MW20 2.40b ± 0.20 2.44
b ± 0.001 6.820
e ± 0.500
MW21 2.46b ± 0.10 1.64
a ± 0.002 3.145
f ± 0.100
MW22 4.64b ±0.20 4.22
d ± 0.002 3.574
f ± 0.020
MW23 0.98a ± 0.020 1.22
a ± 0.001 2.092
a ± 0.020
MW24 1.66a ± 0.10 1.22
a ± 0.002 0.687
b ± 0.020
MW25 2.56b ± 0.20 2.44
b ± 0.100 1.045
c ± 0.020
MW26 1.66a ± 0.10 1.44
a ± 0.010 1.048
c ± 0.010
MW27 3.66c ± 0.20 2.24
b ± 0.020 1.314
c ± 0.010
MW28 2.64d ± 0.30 1.24
a ± 0.010 1.073
c ± 0.020
MW29 2.44b ± 0.20 2.34
b ± 0.010 2.524
d ± 0.020
MW30 3.44d ± 0.40 3.22
c ± 0.002 6.682
e ± 0.400
MW31 2.44b ± 0.20 2.46
b ± 0.001 6.622
e ± 0.500
MW32 2.44b ± 0.10 1.66
a ± 0.002 3.146
f ± 0.100
MW33 4.66b ±0.20 4.24
d ± 0.002 3.664
f ± 0.020
*Means ± (SD) of 3 determinations. Values on the same column with different superscripts are significantly different (p<0.05). MW1 - MW11 = water from different locations in the region. WHO/UNICEF recommended values: oxalic acid (<5 mg/l), formic acid (<4 mg/l), acetic acid (<6 mg/l).
contamination by fecal matter of human and animal origin. Also there is copious evidence that poor handling and sanitation would result in the increased proliferation of microorganisms and this will exacerbate the bacterial populations including pathogens. For example, it has been reported that water used for drinking and domestic uses in Nigeria have been found to be heavily contami-nated with fecal matter (Blum et al., 1987; Ogan, 1988).
The possible explanation for the absence of micro-organisms including pathogens in some samples could be that proper hygienic processing and handling con-ditions were maintained thereby, preventing post process
re-contamination and cross-contamination. This observa-tion is in agreement with the report of ICMSF (1980), Jay (1986) reported that proper handling after processing could prevent bacteria re- entry into the processed products. The potential health risks associated with these pathogens is that of healthy carriers, especially individuals with nasal carriers and boils. When such persons are involved in handling food items including water, both before and after processing, such individuals would constitute transmission vectors. The above observations are in agreement with the reports of WHO (2011); Hunter and Fewtrell (2001). Hence, people hand-

1736 Afr. J. Microbiol. Res. ling foods including drinking water should be made to pass microbiological tests in order to detect such healthy carriers.
Although Salmonella species was not detected in the samples, it could have been due to possible limitations in the analytical procedures since other associated organisms such as E. coli, S. aureus, Alcaligenes, Acinetobacter, B. subtilis and Pseudomonas were present. Moreover, the frequent case of reported typhoid fever in the region is a proof of the above assertion (Blum et al., 1987; Ogan, 1988). The presence of S. aureus in some samples could be due to re- contamination.
The low level or absence of S. aureus in some samples is because S. aureus is not usually of fecal origin and that its presence in the samples could have been associated with post processing contamination due to bottle/sachet leakage. The public health significance of these microorganisms can hardly be over-emphasized. They have been shown to cause cholera, typhoid fever, hepatitis, diarrhea, gastroenteritis and some emerging strains of E. coli have been reported to cause septicemia and urinary tract infections especially, in immuno-compromized individuals (Todar, 2002; Bik et al., 2010). Table 3 presents the inorganic ions and pH values of the samples. It is evident that their values were within the acceptable levels. The robust Ca: P ratio in the samples is of nutritional importance as low Ca: P ratio has been shown to cause osteoporosis in animals (Orish et al., 2006; Jorge et al., 2007; Nachiyunde et al., 2013).
Although, the in-organic ion concentrations were within the standard limits, the low level or absence of some ions in some samples could be that some must have been used by the organisms to obtain necessary growth nutrients for their proliferation (Barrell et al., 2000).
Table 4 gives the essential organic acids in the water samples. Although organic acids are not regulated in drinking water, short-chain organic acids are formed as by-products during ozonation from natural organic matter present in the water (Chigbu and Sobolev, 2007). Ozonation has been used effectively as drinking water treatment technique for disinfection, destruction of taste and odor compounds and color removal amongst others (WHO, 1993; 1998, WHO/UNISEF, 1996; White, 1999). However, ozonation process should be followed by biological filtration to remove biodegradable organic compound such as organic acids so as to provide biological stable water and prevent bacterial re-growth and water borne disease outbreaks (LeChevallier, 1990; Stenstrom, 1994). The pH values of the water samples show that the levels are within the permissible acceptable standards by NAFDAC, the local regulator of food, water and drug marketed in Nigeria.
Conclusion and recommendations
The results show that although the levels of organisms in most of the water samples were within the acceptable
limits, it should however, be a source of concern considering the limitations in the identification, type of organisms identified, and risk of post- treatment contamination and cross - contamination. The essential elements present in the samples were within the acceptable limits. Calcium ion was present in the highest concentration compared to other ions and the Ca/P ratio was good. Based on the findings it is, therefore, recommended that the mandatory standard level of chlorination should be adhered to, and the need for public enlightenment on the frequent routine microbiological checks due to cross- contamination and re-contamination through bottles/sachets leakage be encouraged. Moreover, further studies that should provide insights into the new emerging pathogens such as E.Coli 015:H7, Helicobacter sp, and Caliciviruses should employ the use of molecular methods coupled with throughput parallel processing, bio-informatics and Cryptosporidium oocysts tests in the analysis of drinking water. Finally, there is need to correlate bottled/packaged water micro flora with the source flora.
Conflict of interests
The authors did not declare any conflict of interest.
REFERENCES
Adelegan JA (2004). The history of environmental policy and pollution of water sources in Nigeria (1960-2004). The way forward.
American Public Health Association (APHA) (1998). Standard Methods for the Examination of Water and Wastewater, 20
th ed., APHA,
Washington, DC.
Barrell RAE, Hunter PR, Nichols G (2000). Microbiological standards for water and their relationship to health risk. Commun. Dis. Public Health 3 (1): 8-13.
Bhareth J, Mosodeen M, Motilal S, Sandy S, Sharma S, Tessaro T, Thomas K, Umamahaswaram, M, Simeon D. and Adesiyan AA (2003). Microbiological quality of domestic and imported brands of bottled water in Trinidad. Int. J. Food Microbiol. 81:53-62
Bik EM, Clara DL, Gary C, Armitage PL, Joanne Emerson EF, Mongodin KE, Nelson SR, Gill GM, Fraser-Ligget, David AR (2010).
Bacterial diversity in the oral cavity of 10 individuals. ISMEJ 4: 962-974.
Blum D, Huttly SRA, Okoro JI, Akujobi C, Kirkwood BR, Feachem RG
(1987). The bacteriological quality of traditional water sources in north - eastern Imo State, Nigeria. Epidemiol. Infect. 99: 429-437.
Chigbu P, Sobolev D (2007). Bacteriological Analysis of Water. In : LML
Nollet (Ed.), Handbook of Water Analysis. CRC Press, Taylor & Francis Group, Boca Raton, London. New York. pp. 98-127.
Craun GF, Berger PS, Calderon RL (1997). Coli form bacteria and
waterborne disease outbreaks. J. Am. Water Works Assoc. 89:96-104.
Da Silva MF, Vaz-Moreira, L, Gonzalez-Pajuelo M, Nunnes OC, Manaia CM (2007). Antimicrobial Resistance Patterns in Enterobacteriaceae
Isolated from an Urban Wastewater Treatment Plant. FEMS Microbiol. Ecol. 60:166-176.
Douterelo I, Boxall JB, Deines P, Sekar R, Fish KE, Biggs CA (2014). Methodological Approaches for studying the microbial ecology of drinking water distribution systems. Water Res. 65:134-156.
Edema MO, Atayese AO (2010). Pure water syndrome: bacteriological quality of sachet- packed drinking water sold in Nigeria. J. Appl. Microbiol. 37:334-339
Feng P, Weagan SD, Grant MA, Burkhardt W (2002). Enumeration of
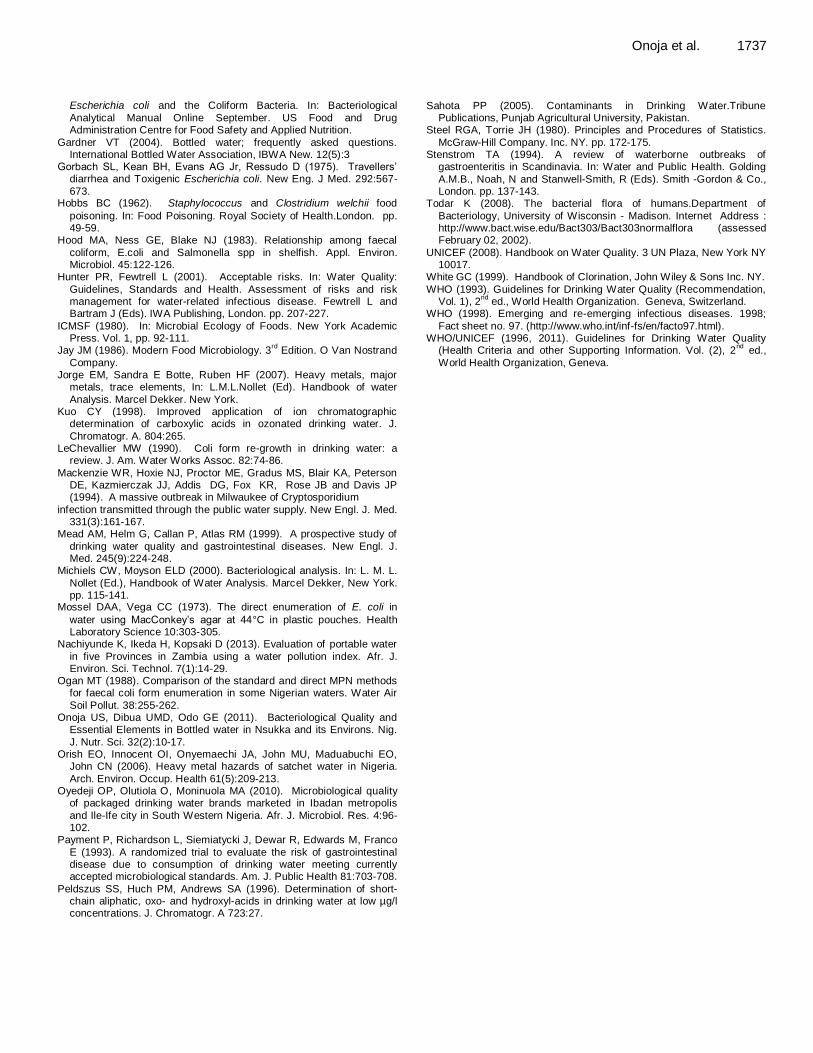
Escherichia coli and the Coliform Bacteria. In: Bacteriological
Analytical Manual Online September. US Food and Drug Administration Centre for Food Safety and Applied Nutrition.
Gardner VT (2004). Bottled water; frequently asked questions. International Bottled Water Association, IBWA New. 12(5):3
Gorbach SL, Kean BH, Evans AG Jr, Ressudo D (1975). Travellers’ diarrhea and Toxigenic Escherichia coli. New Eng. J Med. 292:567-
673. Hobbs BC (1962). Staphylococcus and Clostridium welchii food
poisoning. In: Food Poisoning. Royal Society of Health.London. pp. 49-59.
Hood MA, Ness GE, Blake NJ (1983). Relationship among faecal
coliform, E.coli and Salmonella spp in shelfish. Appl. Environ. Microbiol. 45:122-126.
Hunter PR, Fewtrell L (2001). Acceptable risks. In: Water Quality:
Guidelines, Standards and Health. Assessment of risks and risk management for water-related infectious disease. Fewtrell L and Bartram J (Eds). IWA Publishing, London. pp. 207-227.
ICMSF (1980). In: Microbial Ecology of Foods. New York Academic Press. Vol. 1, pp. 92-111.
Jay JM (1986). Modern Food Microbiology. 3rd
Edition. O Van Nostrand
Company. Jorge EM, Sandra E Botte, Ruben HF (2007). Heavy metals, major
metals, trace elements, In: L.M.L.Nollet (Ed). Handbook of water
Analysis. Marcel Dekker. New York. Kuo CY (1998). Improved application of ion chromatographic
determination of carboxylic acids in ozonated drinking water. J.
Chromatogr. A. 804:265. LeChevallier MW (1990). Coli form re-growth in drinking water: a
review. J. Am. Water Works Assoc. 82:74-86.
Mackenzie WR, Hoxie NJ, Proctor ME, Gradus MS, Blair KA, Peterson DE, Kazmierczak JJ, Addis DG, Fox KR, Rose JB and Davis JP (1994). A massive outbreak in Milwaukee of Cryptosporidium
infection transmitted through the public water supply. New Engl. J. Med. 331(3):161-167.
Mead AM, Helm G, Callan P, Atlas RM (1999). A prospective study of
drinking water quality and gastrointestinal diseases. New Engl. J. Med. 245(9):224-248.
Michiels CW, Moyson ELD (2000). Bacteriological analysis. In: L. M. L.
Nollet (Ed.), Handbook of Water Analysis. Marcel Dekker, New York. pp. 115-141.
Mossel DAA, Vega CC (1973). The direct enumeration of E. coli in
water using MacConkey’s agar at 44°C in plastic pouches. Health Laboratory Science 10:303-305.
Nachiyunde K, Ikeda H, Kopsaki D (2013). Evaluation of portable water
in five Provinces in Zambia using a water pollution index. Afr. J. Environ. Sci. Technol. 7(1):14-29.
Ogan MT (1988). Comparison of the standard and direct MPN methods for faecal coli form enumeration in some Nigerian waters. Water Air
Soil Pollut. 38:255-262. Onoja US, Dibua UMD, Odo GE (2011). Bacteriological Quality and
Essential Elements in Bottled water in Nsukka and its Environs. Nig.
J. Nutr. Sci. 32(2):10-17. Orish EO, Innocent OI, Onyemaechi JA, John MU, Maduabuchi EO,
John CN (2006). Heavy metal hazards of satchet water in Nigeria.
Arch. Environ. Occup. Health 61(5):209-213. Oyedeji OP, Olutiola O, Moninuola MA (2010). Microbiological quality
of packaged drinking water brands marketed in Ibadan metropolis
and Ile-Ife city in South Western Nigeria. Afr. J. Microbiol. Res. 4:96-102.
Payment P, Richardson L, Siemiatycki J, Dewar R, Edwards M, Franco
E (1993). A randomized trial to evaluate the risk of gastrointestinal disease due to consumption of drinking water meeting currently accepted microbiological standards. Am. J. Public Health 81:703-708.
Peldszus SS, Huch PM, Andrews SA (1996). Determination of short-chain aliphatic, oxo- and hydroxyl-acids in drinking water at low µg/l concentrations. J. Chromatogr. A 723:27.
Onoja et al. 1737 Sahota PP (2005). Contaminants in Drinking Water.Tribune
Publications, Punjab Agricultural University, Pakistan. Steel RGA, Torrie JH (1980). Principles and Procedures of Statistics.
McGraw-Hill Company. Inc. NY. pp. 172-175. Stenstrom TA (1994). A review of waterborne outbreaks of
gastroenteritis in Scandinavia. In: Water and Public Health. Golding
A.M.B., Noah, N and Stanwell-Smith, R (Eds). Smith -Gordon & Co., London. pp. 137-143.
Todar K (2008). The bacterial flora of humans.Department of
Bacteriology, University of Wisconsin - Madison. Internet Address : http://www.bact.wise.edu/Bact303/Bact303normalflora (assessed February 02, 2002).
UNICEF (2008). Handbook on Water Quality. 3 UN Plaza, New York NY 10017.
White GC (1999). Handbook of Clorination, John Wiley & Sons Inc. NY.
WHO (1993). Guidelines for Drinking Water Quality (Recommendation, Vol. 1), 2
nd ed., World Health Organization. Geneva, Switzerland.
WHO (1998). Emerging and re-emerging infectious diseases. 1998;
Fact sheet no. 97. (http://www.who.int/inf-fs/en/facto97.html). WHO/UNICEF (1996, 2011). Guidelines for Drinking Water Quality
(Health Criteria and other Supporting Information. Vol. (2), 2nd
ed.,
World Health Organization, Geneva.

Vol. 9(28), pp. 1738-1744, 15 July, 2015
DOI: 10.5897/AJMR2014.7287
Article Number: 560C12854446
ISSN 1996-0808
Copyright © 2015
Author(s) retain the copyright of this article http://www.academicjournals.org/AJMR
African Journal of Microbiology Research
Full Length Research Paper
Optimization of bioprocess for enhanced production of alkaline protease by a Bacillus subtilis SHmIIIa through
Plackett-Burman design
S. Jeevan Chandra2*, P. Pallavi3, B. S. Anuradha4 and S. Ram Reddy1
1Department of Microbiology, Kakatiya University, Warangal- 506009, T. S, India.
2Department of Microbiology, Kakatiya Government College, Warangal-506001, T. S, India.
3Department of Microbiology, Government Degree College for Women, Nalgonda-508001, T. S, India.
4Department of Microbiology, Chaitanya P. G. College, Warangal-506001, T. S, India.
Received 19 November, 2014; Accepted 10 July, 2015
Optimal conditions for the maximum production of alkaline protease by Bacillus subtilis SHmIIIa were evaluated by Plackett-Burman design. Nine process parameters namely, pH, temperature, agitation, inoculum, glucose, peptone, KH2PO4, FeSO4 and tween 20 at two levels were selected for the design. Out of nine selected parameters, six parameters (pH 9.75, agitation 225 rpm, inoculum 3.5%, glucose 5.5 g/L, peptone 3.5 g/L and KH2PO4 1.5%, have shown significant influence on alkaline protease production. Optimization has resulted in spectacular enhancement in alkaline protease yield from 966 to 36000 EU/mg/ml with 37.26 fold increase. Key words: B. subtilisSHmIIIa, alkaline protease, optimization, design of experiments, Plackett-Burman Design.
INTRODUCTION Proteases (EC: 3.4. 21-24, 99) are one of the important groups of industrial enzymes with a share of more than 60% of the total global enzyme production (Beg et al., 2003). Alkaline proteases have several applications in a variety of industries such as detergents, foods, textile, pharmaceuticals, leather and in diagnostic reagents, recovery of silver from used x-ray films, wastewater treatment and clinical and medical applications (Kaur and Satyanarayana, 2005). International share market is expected to reach US $4.4 billion by 2015 (Oskouie et al., 2008). In view of the market potential, throughout the
globe, the search for a potent alkaline protease producing bacteria which cater the needs of the current industrial sector is being taken up (Sen and Satyanarayana, 1993). Studies conducted so far suggest that microbial extracellular protease production is significantly influenced by media components including carbon, nitrogen sources and other environmental factors. A balance between the various medium components in production media is necessary for the enhanced protease production. The goal of any industrial process professional is to identify the factors that show a
*Corresponding author: E-mail: [email protected]. Author(s) agree that this article remains permanently open access under the terms of the Creative Commons Attribution License 4.0 International License

significant influence on the production. In any industrial setup, development of the cost effective fermentation process is necessary and also a challenging job. Optimization helps by minimizing the amount unutilized components. Statistical approaches have been made to identify the key factors to enhance the yield and reduce the cost of production to approximately 30-40% making the industrial process economically sustainable (Kaur and Satyanarayana, 2005). One-factor-at-a-time design approach has been quite popular with the researchers, mainly due to its simplicity of use. However the drawbacks are: it is time-consuming, requires more experimental runs and also cannot examine the interaction between factors. In this regard, the Plackett-Burman Design (PBD) is an efficient mathematical approach widely applied (Plackett and Burman et al., 1946). These experimental designs very clearly analyze the effects of variables on the response and pick up the essential factors). In light of the ever increasing demand for proteases, in the present study an attempt was made to maximize the alkaline protease production by Bacillus subtilis SHmIIIa mutantstrain using PBD in submerged and shake culture conditions. MATERIALS AND METHODS
Microorganism
The bacterium used in the present studies was isolated from the slaughter house waste contaminated soils of Warangal (latitude 17° 58' N, longitude 79° 40' E and altitude 302 m (990 feet) located in Telangana state, India. The organism was isolated and tested for prospective alkaline protease production on alkaline skimmed milk agar (ASMA; Poly peptone 5 g/l; yeast extract 5 g/l; glucose 10 g/l;
KH2PO4 1.0 g/l; MgSO4 0.02 g/l; skimmed milk 2 g/l; agar 18 g/l; Na2CO3 10 g/l) at pH 11.0, Protease production was readily observed by the formation of zone of clearance around the colony (Hegde et al., 2002).The culture of the mutant strain was maintained on Horikoshi basal medium (HBM) at pH 11 (Horikoshi, 1971).
Molecular identification
The efficient strain was tentatively identified as Bacillus sp based on morphological and biochemical characteristics and based on16S rRNA sequence homology and distance matrix, the organism was further identified as Bacillus subtilis sub sp. Subtilis strain DSM 10.
Mutagenesis with HNO2 NaNO2 with 0.1-0.3 M solution was prepared in carbonate buffer (0.02M pH 9.5). To one milliliter of the bacterial suspension 5 ml of the NaNO2 was added. The solution was shaken thoroughly (Carlton and Brown, 1981). The one milliliter solution was withdrawn and diluted with 5 fold phosphate buffer (0.2 M, ph 7.1) to stop the reaction. A control was maintained by replacing NaNO2 in acetate buffer with sterilized saline water. After fixed time interval,
the tubes were spun at 6000 g for 15 min. The supernatant was discarded to remove nitrous acid from the pellet and ten milliliter of sterilized
Chandra et al. 1739 phosphate buffer was added to make the bacterial suspension. The tubes were respun for the three times to remove traces of nitrous acid. After washing the pellet was suspended in the same buffer. One milliliter of the bacterial suspension was plated on the ASMA medium and incubated at 30
oC for 48 h.
Enzyme production and assay A single colony obtained on modified HBM with 1% skimmed milk was activated twice before the starter culture was prepared for seed inoculation. The starter culture was prepared by raising a cell suspension in a 500 ml baffled flask containing 100 ml of HBM
medium (pH to 11.5±0.5) and incubated for 24 h on a shaker at 200 rpm. The starter absorbance was adjusted to 0.3 at 600 nm with modified Horikoshi medium. About 100 ml of ASMA medium with varying concentrations of the carbon, nitrogen and inducer sources was taken in flasks. Incubation was carried out for 24 h under the defined conditions. The cell-free supernatant recovered by centrifugation (10000 g, 10 min) was used as enzyme source. Extracellular alkaline protease activity was determined by the modified method of Kunitz (1947) and Yang et al. (1994).
About 0.1 ml of enzyme source was mixed with 0.9 ml of glycine-NaOH buffer (0.1M, pH 9) that contained 5 mg Hammerstein casein. Reaction mixture was incubated alater 2 ml of 5% trichloroacetic acid (TCA) was added to terminate the reaction. The contents were passed through No.2 filter paper (Whatman) to remove denatured proteins, filtrate was centrifuged at 10000 g for 10 min. The supernatant fraction was read at 275 nm. One unit of protease activity was defined as the amount of enzyme required to produce an increase 0.001 in the absorbency at 275 nm
per min under the assay conditions. Specific activity was expressed as enzyme units per mg protein. Simultaneously, a blank without enzyme was used for comparison purpose. Evaluation of cultural parameters for growth
The optimal growth conditions that is, pH, temperature, incubation
time and inoculum levels for wild strain B. subtilis SH2 were evaluated by using MHBM broth. Evaluation of nutritional parameters using OVAT method
The influence of various nutrients such as carbon and nitrogen sources was studied by one-variable-at-a-time method (OVAT method). Carbon sources (glucose, fructose, sucrose, maltose, lactose and starch) at the concentration of 1% (w/v) were evaluated while other components were maintained constant in the HBM composition. Similarly different nitrogen sources (tryptone, soy peptone, peptone, skim milk, yeast extract, beef extract) were analyzed at 0.5% levels while keeping other constituents at constant level. Simulation of the Plackett-Burman Design
In order to identify the important variables affecting the enzyme production, PBD design with a set of two-level fractional factorial design with 12 experiments was employed. In this design, no main variables were mixed with any other variable, therefore, it efficiently achieves the goal and reduces the number of experiments required (Zhi and Feng et al., 2001; Zhng et al. 2013). PBD model was checked by F - test and goodness of fit by multiple regression
analysis (De Coninck et al., 2000).The Design of experiments (DoE) methodology was utilized by employing the statistical analysis system (SAS) software version 9.0 (U.S.A).

1740 Afr. J. Microbiol. Res.
Table 1. Optimized bioprocess parameters by OVAT method for Bacillus subtilis SHmIIIa.
Process variable
Mutant SHmIIIa
Formulated medium 1
Optimized level EU/mg/ml
pH
9.56
3656
Incubation
66±6 h
Temperature
43
Inoculum
3%
Rpm
200
C
Glucose 5%
N
Peptone 3%
P&K
KH2PO4 1%
Metal ion
FeSO40.2 mM
Surfactants
Tween20 0.4%
Validation of the experimental model
A random set of experiments were simulated to study the production of alkaline protease under the defined experimental conditions. The model was statistically validated with respect to all responses within the design space (Sasikumar and Viruthagiri, 2008). The conditions optimized from the model were further confirmed for accuracy by using the first order polynomial equation
Y= β0 + Σ βi Xi (i = 1, …. k) Where, Y is the estimated target function, β0 is a constant, β1 is the regression coefficient, X is independent variable and k is the number of variables.
RESULTS
Microorganism
Based on the morphological, physiological and biochemical characteristics the bacterial isolate was tentatively identified as Bacillus sp. Further authentication was made by the 16S rDNA gene sequence analysis. The isolate SH2 showed 99% sequence homology with B. subtilis sub sp. subtilis strain DSM 10. Subsequently the isolate was mutated with HNO2.
Evaluation of bioprocess parameters by OVAT methodology
In order to identify the essential process parameters and influence of various environmental, physiological and nutritional parameters on alkaline protease production OVAT methodology was adopted and the results are presented in Table 1. Our preliminary investigation revealed that FMI was found superior to HBM. Hence, the FM1 was considered as ideal for improved protease yield under the defined experimental conditions for the mutant strain.
Plackett-Burman design
Optimization of the fermentation conditions to maximize
enzyme production was performed by the Plackett-Burman Design. A total of nine parameters were selected based on the OVAT method. The PBD simulation consisted 12 experiments at a resolution of 3. Each independent variable was investigated at a high (+1) and a low (-1) level which represent two different nutrient concentrations as shown in Table 2. The yield of the alkaline protease production by the present strain in defined fermentation conditions was studied and the results are précised in the Figure 1. Theyield of the enzyme was determined based on the t- values of the significant ingredients (Devendra and Pravin, 2010). Determination of significance of each variable The p-value serves as a tool for identification of significance of each variable and measures the probability magnitude coefficient of the process variability. The components were screened at the confidence level of 95% on the basis of their effects. Table 3 represents the results with respect to t-value, p-value and confidence level of each component. The present PBD model suggests that the componentsX1 pH; X3 agitation; X4 inoculum; X5 glucose; X6 peptone and X7 KH2PO4are significant or effective in alkaline protease production (Figure 1). Validation of the model terms The model was assessed using multiple regression equation (Myers and Montgomery, 2002) (Table 4). The model has shown 99.90 of the correlation between the model terms and the alkaline protease production. Hence, the model terms and alkaline protease production were strongly correlated (Palvannan and SathishKumar, 2010).
DISCUSSION
In general, the requirements of different bacterial strains for fermentation process differ. This usually depends upon the adaptive nature of the organism (Moorthy and Baskar et al, 2013; Pathak and Deshmukh, 2012). The regulatory mechanism behind the enhanced enzyme production is not yet understood. However, the contribution of the every physical and nutritional factor for optimal response should be known by performing OVAT method (Jeevan Chandra, 2013).Therefore, the role of individual factor has been taken into consideration for building a model process for optimized response (Moon and Parulekar, 1991; Periasamy et al., 2013). Through statistical analysis of the above model it is evident that out of nine parameters tested only six viz., pH; agitation; inoculum; glucose; peptone and KH2PO4 have shown a significant influence on enzyme production. The

Chandra et al. 1741
Table 2. Placket Burman Design details of variables for production of alkaline protease by Bacillus subtilis SHmIIIa
Run pH Temp Agitation Inoculam Glucose Peptone KH2PO4 FeSO4 Twntwnty Protease
1 10 43 250 3 5 3 2 0.4 0.4 25734
2 10 45 200 4 5 3 1 0.4 0.4 1673
3 9.5 45 250 3 6 3 1 0.2 0.4 1243
4 10 43 250 4 5 4 1 0.2 0.2 26371
5 10 45 200 4 6 3 2 0.2 0.2 1435
6 10 45 250 3 6 4 1 0.4 0.2 21826
7 9.5 45 250 4 5 4 2 0.2 0.4 16363
8 9.5 43 250 4 6 3 2 0.4 0.2 1503
9 9.5 43 200 4 6 4 1 0.4 0.4 1232
10 10 43 200 3 6 4 2 0.2 0.4 21935
11 9.5 45 200 3 5 4 2 0.4 0.2 20435
12 9.5 43 200 3 5 3 1 0.2 0.2 1373
Figure 1. Pareto chart showing the important effects on alkaline protease production by Plackett-Burman Design forBacillus
subtilis SHmIIIa.
probability P value for lack of fit (0.022395) indicated that the experimental data obtained with the model is very good. In addition, the parameters have shown a direct influence on enhanced production by native strain in shake cultures (Cazetta et al., 2007).
Physiological adaptation of the strain shows a direct influence on the cellular activity of enzyme secretion. pH has strong influence in many enzymatic processes and transport of several molecules across the cell membrane. Difference in media pH alters acid-base equilibria and

1742 Afr. J. Microbiol. Res.
Table 3. ANOVA of the Plackett-Burman Design for alkaline protease production by Bacillus subtilis SHmIIIa.
Master model Predictive model
Source DF SS MS F Pr > F DF SS MS F Pr > F
PH 1 3.634563 3.634563 324.5909 0.003067 1 3.634563 3.634563 240.5611 0.0001
Temp 1 0.025445 0.025445 2.272418 0.270698
Agitation 1 2.535926 2.535926 226.4753 0.004386 1 2.535926 2.535926 167.8456 0.0001
Inoculum 1 2.440452 2.440452 217.9488 0.004557 1 2.440452 2.440452 161.5264 0.0001
Glucose 1 2.801387 2.801387 250.1827 0.003973 1 2.801387 2.801387 185.4156 0.0001
Peptone 1 9.011211 9.011211 804.7618 0.00124 1 9.011211 9.011211 596.4257 0.0001
KH2PO4 1 2.344055 2.344055 209.3399 0.004743 1 2.344055 2.344055 155.1462 0.0001
FESO4 1 0.015253 0.015253 1.362167 0.36349
Twntwnty 1 0.012451 0.012451 1.111953 0.40224
Model 9 22.82074 2.535638 226.4496 0.004404 6 22.7676 3.794599 251.1534 0.0001
Error 2 0.022395 0.011197 5 0.075543 0.015109
Total 11 22.84314 11 22.84314
Table 4. Validation of the PBD model for alkaline protease production by Bacillus subtilis SHmIIIa
Analysis of coeffient of variance Master model Predictive model
RMSE 0.105818 0.122917
R-square 99.90% 99.67%
Adjusted R-square 99.46% 99.27%
Coefficient of Variation 1.227784 1.42619
fluxes of various nutrients in cell interior. The common optimum pH range for protease production among alkaliphilic and halo alkaliphilic organisms lies between 9 to 10 (Patel et al., 2006). The present investigations suggest that the test organism grows profusely at pH 9.75, which markedly specifies the alkaliphilic nature of the strain. Present observations are in agreement with the earlier studies carried out by Bhaskar et al. (2007).Krulwich (1995) has studied the facultative alkaliphile Bacillus firmusOF4 and pointedthat Na1/H1 anti-porter enables cells to adapt to shift in pH and to maintain the external pH in the most alkaline range of pH for growth.
The agitation rate has indirect relation with the dissolved oxygen level in the fermentation broth. Different dissolved oxygen profiles can be obtained by means of variations in the aeration rate and agitation speed (Chu et al., 1992). The variation in the agitation speed influences the extent of mixing in the shake flasks and distribution of the substrates evenly in the medium makes them available for the growth and protease production (Moon and Parulekar, 1991).Hence, considerable improvement in the production of the alkaline protease can be achieved with the proper maintenance of the agitation. In the present investigation, 225 rpm of the speed agitation was found to be ideal for the enhanced protease
production. These results concur with the earlier studies made by Sudhir and Ashis (2010).
A high inoculum size improves biomass production, while low inoculum size is generally unsupportive for the growth as well as enzyme secretion. A moderate inoculum size was suggested to the increased protease production, which may be due to the higher surface area to volume ratio resulting in increased protease production (Michalik et al., 1995).In the present investigations, the alkaline protease production steadily increased with increase in inoculum size and reached maximum at 3.5% level of inoculum production. Similar observations were made by Reddy et al. (2008).
Nutritional factors are the key contributors with a great extent of capacity for enhanced production of alkaline protease. The alkaline protease comprises 15.6% nitrogen and thus its production is dependent on the availability of both carbon and nitrogen sources in the medium (Kole et al., 1988). In the preset study, peptone and glucose have shown a significant influence on protease production and are considered as the prime factors of the entire process in the master model. For alkaline protease production, the complex nitrogen sources are usually preferred over the simple inorganic. This is just because of the feedback inhibition imposed by simple nitrogen sources. The same situation was

Chandra et al. 1743
Table 5. Factors optimized through PBD for enhanced alkaline protease production by Bacillus subtilis SHmIIIa.
Factor Setting EU/mg/ml
pH 9.75
36000
Temperature 44°C
Agitation 225 rpm
Inoculum 3.5%
Glucose 5.5 g/l
Peptone 3.5 g/l
KH2PO4 1.5 g/l
FeSO4 0.3 mM
Tween20 0.3%
Figure 2. Response surface plot for production of alkaline protease by
Bacillus subtilis SHmIIIa.
encountered with carbohydrates. Low levels of alkaline protease production were reported in the production medium (Chandrasekaran and Dhar, 1983). Present observations are similar to those of the studies made by Chaphalkar and Dey (1994) and Sen and Satyanarayana (1993).
Validation of the predicted model for enhanced alkaline protease production
The t-values of the process variables are 18.01641, 15.0491, 28.36832, 14.46858 and 1.167119 for pH, agitation, peptone, K2HPO4 and FeSO4 respectively, showing a significant improvement. These findings indicate that these variables are very important for
optimization of alkaline protease production. The R2 and
adjusted R2 are 99.90 and 99.46% respectively which
indicate a high correlation between the observed values of master model and the values of predicted model. This specifies that regression model provides an excellent correlation between the independent variables (factors) and the response (alkaline protease production) (Table 5).
The wild strain (SH2) at primary screening level has shown only 966 EU of alkaline protease production, however on mutagenesis it has increased to 3688 EU of enzyme production with 3.8 fold increase. The same bacterial strain in the final phase of optimization through PBD has shown a dramatic enhancement to 36000 EU with 37.26 fold increase (Figure 2).

1744 Afr. J. Microbiol. Res. Conclusions The present investigations were primarily aimed at identifying the important factors which contribute to the enhanced protease production. The PBD has allowed the evaluation of main variables of the enzyme bioprocess. The PBD model adopted in the present investigations explained the effect of pH, agitation, inoculum, glucose, peptone and KH2PO4 on alkaline protease production by B. subtilis SHmIIIa. Further, investigations on characterization and stability of the alkaline protease under harsh industrial conditions are under progress. Conflict of interests The authors did not declare any conflict of interest. ACKNOWLEDGEMENTS We wish to express our sincere thanks to Head, Department of Microbiology, Kakatiya University for encouragement and facilities. The financial assistance received by SJC from UGC, New Delhi in the form of Research Fellowship for Meritorious Students under UGC-BSR Scheme is gratefully acknowledged. REFERENCES
Beg KB, Sahai V, Gupta R (2003). Statistical media optimization and alkaline protease production from Bacillus mojavensis in a bioreactor.
Process Biochem. 39: 203-209.
Bhaskar N, Sudeepa ES, Rashmi HN, Selvi AT (2007). Partial purification and characterization of protease of Bacillus proteolyticus CFR3001 isolated from fish processing waste and its antibacterial
activities. Bioresour. Technol. 98: 2758–2764. Carlton BC, Brown BJ (1981). Gene Mutation. In: Gerhard, P.
(ed).Manual of Methods for General Bacteriology. ASM Press.
Washington. D.C:222-242. Cazetta ML, Celligoi MAPC, Buzato JB, Scarmino IS (2007).
Fermentation of molasses by Zymomonasmobilis: Effects of
temperature and sugar concentration on ethanol production. Bioresour. Technol. 98: 2824-2828.
Chandrasekaran S, Dhar SC (1983). A low cost method for the
production of extracellular alkaline proteinase using tapioca starch. J. Ferment. Technol. 61: 511-514.
Chaphalkar S, Dey S (1994) Some aspects of production of extracellular protease from Streptomycesdiastaticus. J. Microbiol.
Biotechnol. 9:85-100. De Coninck J, Bouquelet S, Dumortier V, Duyme F, Verdier-Denantes I
(2000). Industrial media and fermentation processes for improved growth and protease production by Tetrahymenathermophila BIII. J.
Ind. Microbiol. Biotechnol. 24 (4):285-290.
Devendra VD, Pravin RP (2010). Application of plackett-burman design to evaluatemedia components affecting antibacterial activity of alkaliphilic cyanobacteria isolated from lonar lake. Turk. J. Biochem.
35 (2):114-120. Horikoshi K (1971). Production of alkaline enzymes by alkalophilic
microorganisms. Part I. Alkaline protease produced by Bacillus no.
221. Agric. Biol. Chem. 35: 1407–1414. Jeevan Chandra S (2014). Studies on industrially important
microorganisms with special reference to protease producing
alkaliphilic bacteria. Kakatiya University Ph.D. Thesis.
Kaur P, Satyanarayana T (2005). Production of cellboundphytase by
Pichia anomala in an economical cane molasses medium:
optimization using statistical tools. Process Biochem. 40(9):3095-102.
Kole MM, Draper I, Gerson DF (1988). Production of protease by Bacillussubtilis using simultaneous control of glucose and ammonium
concentrations. J. Chem. Technol. Biotechnol. 41:197-206
Krulwich TA (1995). Alkaliphiles: ‘basic’ molecular problems of pH tolerance and bioenergetics. Mol. Microbiol. 15: 403-410.
Kunitz M (1947). Crystallinsoyabean trypsin inhibitor II General
Properties. J. Gen. Physiol. 30 (4):291-310. Michalik I, Szabova E, Polakova A (1995). The selection of
Bacilluslicheniformis strains for protease production: characterization
of bacterial alkaline protease. Biologica 50:249-252. Moon SH, Parulekar SJ (1991). A parametric study otprotease
production in batch and fed-batch cultures of Bacillusfirmus.
Biotechnol. Bioeng. 37:467-483. Moorthy IMG, Baskar R (2013). Statistical modeling and optimization of
alkaline protease production from a newly isolated alkalophilic Bacillus species BGS using response surface methodology and
genetic algorithm. Prep. Biochem. Biotechnol. 43(3): 293-314 Myers RH, Montgomery DC (2002). In: Myers, R.H., Montgomery, D.C.
(eds.), Response Surface Methodology: Process and Product in Optimization Using Designed Experiments, Second ed., John Wiley & Sons, Inc., New York, USA.
Oskouie SFG, Tabandeh F, Yakhchalli B, Eftekhar F (2008). Response surface optimization of medium composition for alkaline protease production by Bacillus clausii. Biochem. Eng. 3:37-42.
Palvannan T, Sathish Kumar P (2010). Production of laccase from Pleurotusflorida NCIM 1243 using Plackett–Burman Design and
Response Surface Methodology. Basic Microbiol. J. 50: 325–335.
Patel RK, Dodia MS, Joshi RH, Singh SP (2006). Production of extracellular halo-alkaline protease from a newly isolated haloalkaliphilicBacillus sp. isolated from seawater in Western India.
World J. Microbiol. Biotechnol. 22:375-382. Pathak AP, Deshmukh KB (2012). Alkaline protease production,
extraction and characterization from akaliphilicBacilluIslicheniformis
KBDL4: a lonar soda lake isolate. Ind. J. Exp. Biol. 50:569-576. Periasamy A, Gurusamy A, Byung KH(2013). Production of alkaline
protease from a newly isolated Exiguobacteriumprofundum BK-P23
evaluated using the response surface methodology. Biologia 68(2):186-193.
Plackett RL, Burman JP (1946). The design of optimum multifactorial
experiments. Biometrika 33(4):305-325. Reddy LVA, Wee YJ, Yun JS, Ryu HW (2008). Optimization of alkaline
protease production by batch culture of Bacillus sp. RKY3 through
Plackett-Burman and response surface methodological approaches. Bioresour. Technol. 99: 2242-2249.
Sasikumar E, Viruthagiri T (2008). Optimization of process conditions using response surface methodology (RSM) for ethanol production
from pretreated sugarcane bagasse: kinetics and modeling. Bioenergy Res. 1:239-247.
Sen S, Satyanarayana T (1993). Optimization of alkaline protease production by thermophilic Bacilluslicheniformis S-40. Ind. J.
Microbiol. 33:43-47. Sudhir KR, Ashis KM (2010). Statistical optimization of production,
purification and industrial application of a laundry detergent and organic solvent-stable subtilisin like serine protease (Alzwiprase) from Bacillus subtilis DM-04. Biochem. Eng. J. 48:173-180.
Yang SS, Huang CI (1994). Proteases production by Amylolytic fungi in solid state fermentation. J. Chin. Agric. Chem. Soc. 32: 589-601.
Zhi-You W, Feng CH (2001). Application of statistically-based
experimental designs for the optimization of eicosapentaenoic acid production by the diatom Nitzschialaevis. Biotechnol. Bioeng.
75(2):159-169.

Vol. 9(28), pp. 1745-1751, 15 July, 2015
DOI: 10.5897/AJMR2015.7393
Article Number: 388532F54449
ISSN 1996-0808
Copyright © 2015
Author(s) retain the copyright of this article http://www.academicjournals.org/AJMR
African Journal of Microbiology Research
Full Length Research Paper
Virulence factors expressed by Mycobacterium ulcerans strains: Results of a descriptive study
AKA N’guetta1*, KAKOU-NGAZOA E. Solange2, COULIBALY N. D.2, VAKOU Sabine1, KOUADIO Kouamé3, AOUSSI Serge2, KADIO M. Constance4, KOUAKOU Hélène2, AKE Julien5,
N’GUESSAN Raymond1 and DOSSO Mireille1
1Unit of Mycobacteria, Institut Pasteur, Côte d’Ivoire.
2Platform of Molecular Biology, Institut Pasteur, Côte d’Ivoire.
3Department of Environment and Health, Institut Pasteur, Côte d’Ivoire.
4ONG AFRISOL-Côte d’Ivoire, Institut Pasteur, Côte d’Ivoire.
5MAP International, Institut Pasteur, Côte d’Ivoire.
Received 22 January, 2015; Accepted 6 July, 2015
Mycobacterium ulcerans is a slow-growing mycobacterium responsible for Buruli ulcer. The pathogenic virulence of MU is being linked to the expression of toxin called Mycolactone, whose form varies according to the origin of the productive strains. Forms A and B are secreted by African and Malaysian strains, C by Australian strains and D by Asian strains. Forms E and F of mycolactone are secreted by animal mycolactone producing mycobacteria strains. The genes for the biosynthesis of Mycolactone are located on a plasmid called pMUM001. We investigated the circulation of Mycolactone in body fluids coupled to the detection of virulence factors in MU strains. Suspicious BU patients and healthy subjects (negative controls) were selected in three Ivorian endemic areas. Exudates, fine needle aspiration (FNA) and blood samples were collected. Microscopy by Ziehl-Neelsen-staining, culture and PCR diagnostics using IS2404 and KR were performed in patient samples. The Mycolactone detection by HLPC coupled to MS was performed in patient and control samples. PCR using IS2404, IS2606, KR and ER were also performed in MU strains. Ziehl-Neelsen-microscopy detected acid-fast bacilli in 19% of samples while PCR were positive in 76.2% for IS2404 and 52.4% for KR. Mycolactone A/B was detected in 31% of exudates and in 42.8% of sera. No Mycolactone was detected in control subjects. 17 strains isolated from exudates possessed both IS2404 and IS2606. 70.6% of those strains were positive for KR and ER gene. The study shows that Mycolactone A/B was actually present in most of BU patients selected in three Ivorian endemic areas. With the methods used we detected very low concentrations in patient fluids. Plasmid and ER gene were found in the majority of MU strains. But they were not found in about 30% of strains. Mycolactone was detected only in patients infected by strains in which plasmid was found. Key words: Buruli ulcer, Mycobacterium ulcerans, insertion sequence, virulence factor, Mycolactone.
INTRODUCTION Mycobacterium ulcerans (MU) is a slow-growing mycobacterium responsible for Buruli ulcer (BU). The cutaneous mycobacteriosis is mostly seen in tropical and subtropical countries (Anne-Caroline et al., 2013;
Emmanuelle et al., 2007; Hong et al., 2005; Laurence et al., 2009; Mac et al., 1948). The pathogenicity of MU is known to be linked to the secretion of a toxin named mycolactone (Caroline et al., 2009; Emmanuelle et al.,

1746 Afr. J. Microbiol. Res. 2007; Kathleen et al., 1999; Sarojini et al., 2005; Yoshito, 2011). The forms of Mycolactone are classified according to the origin of the productive strains. Forms A and B are secreted by African and Malaysian strains; C by Australian strains and D by Asian strains (Kathleen et al., 1999; Sacha et al., 2005). Forms E and F have been found in mycobacteria strains isolated from animals (Armand et al., 2005; Brian et al., 2006; Hong et al., 2008; Sylvain et al., 2008). Mycolactone is responsible for the tissue necrosis and the diverse immune reactions of the host (Armand et al., 2003; Emmanuelle et al., 2007; Kathleen et al., 1999; Hurtado et al., 2009; Phillips et al., 2006; Sarojini et al., 2005; Travis et al., 2001). The biosynthesis of Mycolactone is linked to some genes located on a giant circular 174 Kb plasmid named pMUM001 (Mac et al., 1948; Timothy et al., 2004; Timothy et al., 2005; Timothy et al., 2005). More than half of the plasmid is devoted to six genes among which three encode the synthesis of four types of polyketide synthetases (PKS). The molecular diagnosis of BU is performed by PCR targeting insertion sequences of MU (IS2404, IS2606). This search can be coupled by detection of the plasmid which carries the genes encoding the synthesis of Mycolactone (Elise, 2011). Sarfo et al. (2011) showed in 2011 that Mycolactone circulates actually in BU patients at various stages of antibiotic therapy as recommended by WHO. However, in other infected people of that cohort, Mycolactone was found, neither in the exudates nor in the serum (Sarfo et al., 2011). In this study we sought to understand why Mycolactone was not detected in all BU patients. The first objective was to characterize Mycolactone in body fluids of patients who had got no antibiotics treatment by rifampicin and streptomycin. The second objective aimed at detecting the virulence factors in clinical samples and in MU isolated strains. MATERIALS AND METHODS
Patient cohorts
Buruli ulcer suspected cases and healthy subjects (negative controls) were selected in three endemic areas of Côte d’Ivoire. Some patients were recruited in the last quarter of 2011 by local health workers in two endemic areas (Tiassalé and Djékanou), where there is a high prevalence of BU. The others were recruited in January 2012 by a mobile medical team actively screening the district of Abidjan, a hypo-endemic area. Patients were recruited if they met the WHO clinical case definition of Buruli ulcer disease (nodule, plaque, edema or ulcer). The control subjects were
selected according to the following criteria: to have no suspicious lesion, to have never been infected, to have no apparent progressive pathology and to be from the same area as the patients. All subjects provided written informed consent (thumb print of parent or legal tutor in the case of children). The study protocol was approved by the National Ethic Committee.
Sampling procedure Samples were collected on each lesion (nodule, plaque, edema and ulcer). Four swabs were performed on each ulcer after cleaning with normal saline. Two swabs were discharged into a tube containing 2 ml of Middlebrook 7H9 medium supplemented by Cetylpiridium chloride (0.5%) to achieve the isolation of MU. The other two were discharged into a tube containing 1 ml of pure ethanol for the extraction of lipids. A fine needle aspiration (FNA) was collected from pre-ulcerative lesions after application of a topical antiseptic. Each FNA was discharged into two tubes: one containing 2 ml of Middlebrook 7H9 medium and the other one 1 ml of pure ethanol. 10 ml of venous blood were also collected from
each patient and control subject.
Diagnosis of Buruli ulcer disease in patients
Exudates and FNA samples were centrifuged at 3000 rpm for 20 min. The pellet was re-suspended in 2 ml of saline buffer to test three diagnostic methods. Four tubes of Löwenstein-Jensen medium were inoculated with 100 µl of each homogenate and
incubated at 32°C. A daily supervision was instituted till the appearance of colonies. Microscopic examination to detect Acid-fast bacilli was performed by using dried smears made with 10 µl of homogenate and staining by the Ziehl-Neelsen technique (Adalbert et al., 2000). 1 ml of homogenate was washed twice by adding 1 ml of sterile DNA-free water. The mixture was centrifuged at 14000 rpm for 3 min, and the pellet was suspended in 400 µl of lysis buffer containing 20 mM Tris, 2 mM EDTA, 150 mM NaCl, 50 mM NaOH,
1% SDS and 20 µg/ml Proteinase K. The mixture was incubated at 37°C for 24 h. The phenol/chloroform method was used to extract and purify DNA. DNA was eluted in 50 µl sterile DNA-free water and stored at -20°C for molecular diagnosis. PCR was performed using the GoTaq Flexi DNA polymerase reagents Kit (Promega, Germany). The previous protocol was used to detect the IS2404 and KR in samples (Table 1). The reaction (25 µl) contains 5 µl of DNA, 0.3 µM of each primer, 0.25 µM of labeled probe (for real time PCR), and PCR-Mix. PCR consisted of 35 cycles of melting at 95°C
for 5 s, aling and extension at 60°C for 1 min. The 7300 real-time PCR machine (Applied Biosystems, USA) was used and the fluorescence of FAM was measured to determine the amplification threshold cycle (Ct). Classical PCR were performed in 9700 PCR system Thermocycler (Applied Biosystems, USA) to confirm MU in isolated strains with the following targets: IS2404, IS2606 and ER. Negative controls were performed with 5 µl of nuclease free-water. Positive controls DNA were tested in duplicate.
Mycolactone extraction and analysis by HPLC
Lipids were extracted from serum or from exudates by the method previously described by Sarfo et al. (2011). Briefly the samples were dipped in 1 ml of ethanol immediately after the sampling and stored in polypropylene tubes at -20°C, protected from light. The samples were concentrated by drying, using a Speed Vacuum and
were suspended in 500 µl of ethanol. The lipids were extracted by sequential addition of 4/1 MeOH (v/v), 1/1 CHCl3 (v/v), and 3/1 H20 (v/v). The aqueous phase was eliminated and the organic phase was transferred into a new tube containing 3 ml of methanol. A double centrifugation was performed and the soluble organic phase was transferred each time into a new tube. It was dried and
*Corresponding author. E-mail: [email protected]. Author(s) agree that this article remains permanently open access under the terms of the Creative Commons Attribution License 4.0 International License

Aka et al. 1747
Table 1. Primers used in this study.
Target Sequence (5’-3’) References
IS2404 Mu5 GAT CAA GCG TTC ACG AGT GA
Stinear and coll., 1999 Mu6 GGC AGT TAC TTC ACT GCA CA
IS2606 Mu7 CCGTCACAGACCAGGAAGAAG
Stinear and coll., 1999 Mu8 TGCTGACGGAGTTGAAAAACC
Enoyl- reductase ER-R GAG ATC GGT CCC GAC GTC TAC
Mve-Obiang and coll., 2005 ER-F GGC TTG ACT CAT GTC ACG TAA G
Keto-reductase KR-F TCACGGCCTGCGATATCA
Fyfe and coll., 2007 KR-R TTGTGTGGGCACTGAATTGAC
Table 2. Results of methods applied to samples of patients and controls. Microscopy, culture and PCR methods were applied to exudates and FNA samples. HPLC was applied to samples of patients (exudates, FNA, sera) and controls (sera).
Clinical samples ZN
Microscopy IS2404
Detection KR
Detection
Culture
of MU
HPLC
(Mycolactone)
Batch A (N=42) FNA (10) 2 10 5 7 5
Exudates (32) 6 22 17 10 8
Batch B
(N=42) Sera (42) - - - - 18
Batch C (N=8) Sera (8) - - - - 0
Total 92 8 32 22 17 31
Percentage (%) - 19 76.2 52.4 40.5 36.9
suspended in 500 µl of ethanol to achieve a Shimadzu HPLC. Fractions of interest were collected in glass tubes and analyzed on a QSTAR XL, AB-MDS-SCIEX mass spectrometer. The data were collected and processed through the Analyst QS 1.1 software from AB-MDS-Sciex.
RESULTS Microbiological and molecular tests of clinical samples 42 patients and eight control subjects were selected in three Ivorian endemic areas. 25% of these patients had pre-ulcerative lesions (10/42) and 75% had ulcers of various size (32/42). From all subjects 32 exudates, 10 samples of FNA and 50 sera were collected for the study. The microbiology tests were cell culture and microscopy of the clinical samples.
Acid-fast bacilli were found in 19% of exudates and FNA samples. 76% of those samples were positive for genomic target IS2404 and 52% for plasmid located KR target. MU was isolated in 40% and Mycolactone was detected in 36% of patient samples. No Mycolactone was detected in control subjects (Table 2).
Mycolactone detection in clinical samples Total lipids of 92 samples were extracted and analyzed
using HPLC method. The analysis by HPLC detected some peaks corresponding to mycolactone in 31% of exudates (13/42) and in 42.8% (18/42) of the sera of patients. The detection of the mycolactone was more consistent when the sample was from a recent lesion (non-ulcerative form or early ulcer). At this stage, the toxin has been detected in 50% of exudates and in 60% of the sera of patients. Conversely, no mycolactone was found in the control serums (0/8). The concentrations of mycolactone A/B in samples were relatively weak compared to those of positive controls (Figure 1A).
The fractions of interest analyzed by Mass spectro-scopic (MS) showed in each case the characterizing spectrum of the ion 765, in harmony with the presence of intact structure of the mycolactone A/B in the samples (Figure 2). In the serum of controls, this specific ion and the isotope mass were negative, while the spectrum obtained with a serum of patient from an active Buruli ulcer showed specific ion with a molar mass of 765.4 g.mol
-1, with generated ions at 359.2, 429.3, 565.4 and
659.3 g.mol-1 respectively (Figure 2B).
Molecular identification of isolated strains To identify isolated strains, a PCR was performed tar-geting Insertion Sequences (IS2404, IS2606), and plasmid (KR, ER). All MU strains were 100% positive for targets IS2404 and IS2606, whereas only 70% were

1748 Afr. J. Microbiol. Res.
Figure 1. Chromatographic profiles of purified mycolactone (Figure 1A) and mycolactone in clinical samples (Figure 1B). A. Corresponds to the spectrum of 5 dilutions of the purified Mycolactone A/B. B. Shows signals obtained from clinical
samples (exudates/sera). From bottom to top, the first three signals correspond to three concentrations of purified Mycolactone (50 ng; 100 ng; 250 ng). The curves 4 to 8 designate the signals given by the samples. Their mycolactone concentrations were respectively 20, 15.5, 26, 48 and 15 ng per ml. It is shown by weak amplitudes, compared to those of the dilutions of the purified Mycolactone.
positive for targets ER and KR (Table 3). DISCUSSION This study follows a previous one carried out on samples from Ivorian and Ghanaian patients. We had pointed out that mycolactone was present in body fluids at various stages of MU infection. Those results were obtained by 2
chemical approaches using extracts of total lipids (TLC-Fluo and HPLC/MS). The weak performance of the TLC-Fluo had been accounted by a link between the mycolactone and some biomolecules that could prevent the access to organic solvent during the chemical extraction of Mycolactone. The HPLC coupled by mass spectroscopic permitted to bring out some Mycolactone A/B at all the stages of the infection with MU (before, during
and after the treatment by antibiotics) (Sarfo et al., 2011;
Figure 1. Chromatographic profil es of purified mycolactone ( Figure 1A) and mycolactone in clinical samples ( Figure 1B). A.
Corresponds to the spectrum of 5 dilutions of the purified Mycolactone A/B. B. Shows signals obtained from clinical samples
(exudates/sera). From bottom to top, the first three signals correspond to three concentrations of purified Mycolactone (50
ng; 100 ng; 250 ng). The curves 4 to 8 designate the sign als given by the samples. Their mycolactone concentrations were
respectively 20 ng; 15.5 ng; 26.2ng; 48 ng and 15 ng per ml. It is shown by weak amplitudes, compared to those of the
0.0 5.0 10.0 15.0 20.0 25.0 30.0 35.0 40.0 45.0 50.0 55.0 60.0 65.0 min
0
500
1000
1500
2000
2500
3000
3500
4000
uV
1A
1B

Aka et al. 1749
Figure 2. Mass spectrometry (MS) analysis of Acetone soluble lipids from fractions collected in the elution interval with HPLC in negative control (A) and in clinical sample for Buruli ulcer patient (B). The hydrolysis products of mycolactone and intact mycolactone can been identified at m/z 765.4.
2A
2B
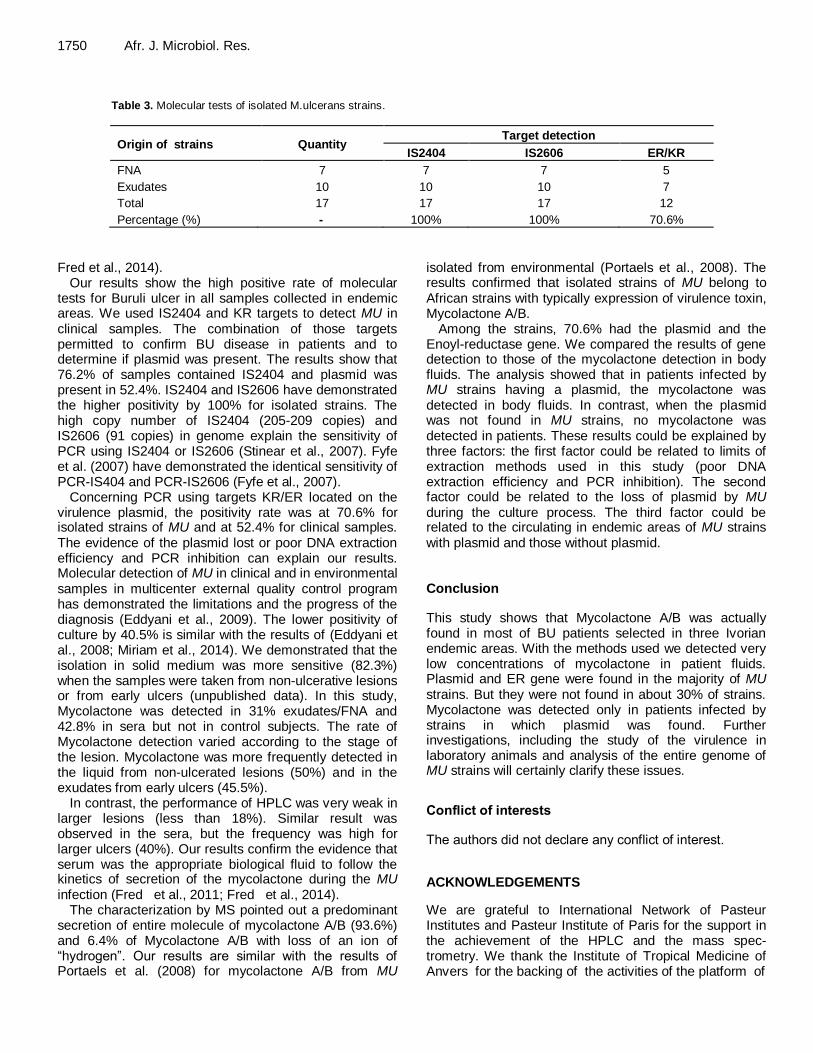
1750 Afr. J. Microbiol. Res.
Table 3. Molecular tests of isolated M.ulcerans strains.
Origin of strains Quantity Target detection
IS2404 IS2606 ER/KR
FNA 7 7 7 5
Exudates 10 10 10 7
Total 17 17 17 12
Percentage (%) - 100% 100% 70.6%
Fred et al., 2014). Our results show the high positive rate of molecular
tests for Buruli ulcer in all samples collected in endemic areas. We used IS2404 and KR targets to detect MU in clinical samples. The combination of those targets permitted to confirm BU disease in patients and to determine if plasmid was present. The results show that 76.2% of samples contained IS2404 and plasmid was present in 52.4%. IS2404 and IS2606 have demonstrated the higher positivity by 100% for isolated strains. The high copy number of IS2404 (205-209 copies) and IS2606 (91 copies) in genome explain the sensitivity of PCR using IS2404 or IS2606 (Stinear et al., 2007). Fyfe et al. (2007) have demonstrated the identical sensitivity of PCR-IS404 and PCR-IS2606 (Fyfe et al., 2007).
Concerning PCR using targets KR/ER located on the virulence plasmid, the positivity rate was at 70.6% for isolated strains of MU and at 52.4% for clinical samples. The evidence of the plasmid lost or poor DNA extraction efficiency and PCR inhibition can explain our results. Molecular detection of MU in clinical and in environmental samples in multicenter external quality control program has demonstrated the limitations and the progress of the diagnosis (Eddyani et al., 2009). The lower positivity of culture by 40.5% is similar with the results of (Eddyani et al., 2008; Miriam et al., 2014). We demonstrated that the isolation in solid medium was more sensitive (82.3%) when the samples were taken from non-ulcerative lesions or from early ulcers (unpublished data). In this study, Mycolactone was detected in 31% exudates/FNA and 42.8% in sera but not in control subjects. The rate of Mycolactone detection varied according to the stage of the lesion. Mycolactone was more frequently detected in the liquid from non-ulcerated lesions (50%) and in the exudates from early ulcers (45.5%).
In contrast, the performance of HPLC was very weak in larger lesions (less than 18%). Similar result was observed in the sera, but the frequency was high for larger ulcers (40%). Our results confirm the evidence that serum was the appropriate biological fluid to follow the kinetics of secretion of the mycolactone during the MU infection (Fred et al., 2011; Fred et al., 2014).
The characterization by MS pointed out a predominant secretion of entire molecule of mycolactone A/B (93.6%) and 6.4% of Mycolactone A/B with loss of an ion of “hydrogen”. Our results are similar with the results of Portaels et al. (2008) for mycolactone A/B from MU
isolated from environmental (Portaels et al., 2008). The results confirmed that isolated strains of MU belong to African strains with typically expression of virulence toxin, Mycolactone A/B.
Among the strains, 70.6% had the plasmid and the Enoyl-reductase gene. We compared the results of gene detection to those of the mycolactone detection in body fluids. The analysis showed that in patients infected by MU strains having a plasmid, the mycolactone was detected in body fluids. In contrast, when the plasmid was not found in MU strains, no mycolactone was detected in patients. These results could be explained by three factors: the first factor could be related to limits of extraction methods used in this study (poor DNA extraction efficiency and PCR inhibition). The second factor could be related to the loss of plasmid by MU during the culture process. The third factor could be related to the circulating in endemic areas of MU strains with plasmid and those without plasmid. Conclusion
This study shows that Mycolactone A/B was actually found in most of BU patients selected in three Ivorian endemic areas. With the methods used we detected very low concentrations of mycolactone in patient fluids. Plasmid and ER gene were found in the majority of MU strains. But they were not found in about 30% of strains. Mycolactone was detected only in patients infected by strains in which plasmid was found. Further investigations, including the study of the virulence in laboratory animals and analysis of the entire genome of MU strains will certainly clarify these issues.
Conflict of interests
The authors did not declare any conflict of interest.
ACKNOWLEDGEMENTS
We are grateful to International Network of Pasteur Institutes and Pasteur Institute of Paris for the support in the achievement of the HPLC and the mass spec-trometry. We thank the Institute of Tropical Medicine of Anvers for the backing of the activities of the platform of

molecular Biology of the Pasteur Institute of Côte d’Ivoire through the external evaluation tests of quality and the gift of reference DNA of M. ulcerans used in this study. We also thank the National Program against Buruli ulcer and the NGO AFRISOL for having eased the access to patients. The Institut Pasteur of Côte d’Ivoire and MAP International contributed to achieve the isolation of M. ulcerans strains and molecular tests. REFERENCES Adalbert L, Mohammed A, Gisela B, Fadila B, David D, Lanfranco F,
Knut F, Thomas F(2000). (Union) : Diagnostic de la tuberculose par examen microscopique direct des expectorations dans les pays à faibles revenus Guide technique; Cinquième édition 2000, 60 pages.
Anne-Caroline C, Tresse C, Casarottoa V, Nicolas B (2013). History, biology and chemistry of Mycobacterium ulcerans infections (Buruli
ulcer disease). Nat. Prod. Rep. 30:1527-1567.
Armand MO, Richard E, Edward St, Kristin A, Timothy C, John M, Brian S, Robert G, Engu A, Small P (2005). A Newly Discovered Mycobacterial Pathogen Isolated from Laboratory Colonies of
Xenopus Species with Lethal Infections Produces a Novel Form of Mycolactone, the Mycobacterium ulcerans Macrolide Toxin. Infect.
Immun. 73(6):3307-3312.
Armand MO, Richard E, Portaels F, Small PL (2003). Heterogeneity of Mycolactones Produced by Clinical Isolates of Mycobacterium ulcerans: Implications for Virulence. Infect. Immun. 71(2):774-783.
Brian SR, Engy AM, Lydia M, Sarojini A, Richard EL, Angelo C, Martha R, Small PL (2006). Globally Distributed Mycobacterial Fish Pathogens Produce a Novel Plasmid-Encoded Toxic Macrolide,
Mycolactone F. Infection and Immunity. 74(11):6037-6045. Caroline D, Timothy S, Stewart TC (2009). Buruli ulcer: reductive
evolution enhances pathogenicity of M. ulcerans. Nat. Rev. Microbiol.
7:50-60. Eddyani M, Fraga AG, Schmitt F, Uwizeye C, Fissette K, Johnson C,
Aguiar J, Sopoh G, Barogui Y, Meyers WM, Pedrosa J, Portaels F
(2009). Fine-needle aspiration, an efficient sampling technique for bacteriological diagnosis of non-ulcerative Buruli ulcer. J. Clin. Microbiol. 47(6):1700-1704.
Elise SN, Euloge E, Nguetta A, David CN, Bakary C, Mireille D (2011). Evaluation of real-time PCR for Mycobacterium ulcerans in endemic
region in Côte d’Ivoire. Afr. J. Microbiol. Res. 5(16):2211-2216.
Emmanuelle C, Jérémie D, Angelo M, Aurélie B, Nathalie W, Stewart TC, Matthew LA, Caroline D (2007). Selective suppression of dendritic cell functions by Mycobacterium ulcerans toxin mycolactone
J. Exp. Med. 204(6): 1395-1403. Fred S Sarfo, Richard O Phillips, Jihui Zhang, Mohammed K Abass,
Justice Abotsi, Yaw A Amoako, Yaw Adu-Sarkodie, Clive Robinson,
Mark H Wansbrough-Jones (2014): Kinetics of mycolactone in human subcutaneous tissue during antibiotic therapy for Mycobacterium ulcerans disease. BMC Infect. Dis. 14:202.
Fred SS, Fabien LC, N'Guetta A, Richard OP, Yaw A, Ivo GB, Pascal L, Mireille D, Mark WJ, Romain VC, Laure GM, Caroline D (2011). Mycolactone Diffuses into the Peripheral Blood of Buruli Ulcer
Patients - Implications for Diagnosis and Disease Monitoring. PLoS Negl. Trop. Dis. 5(7):e1237.
Fyfe JA, Lavender CJ, Johnson PD, Globan M, Sievers A, Azuolas J,
Stinear TP (2007). Development and application of two multiplex real-time PCR assays for the detection of Mycobacterium ulcerans in
clinical and environmental samples. Appl. Environ. Microbiol.
73(15):4733-4740. Hong H, Demangel C, Pidot SJ, Leadlay PF, Stinear T (2008).
Mycolactones: immunosuppressive and cytotoxic polyketides
produced by aquatic mycobacteria. Nat Prod Rep. 25:447-454. Hong H, Stinear T, Skelton P, Spencer JB, Leadlay PF (2005) Structure
elucidation of a novel family of mycolactone toxins from the frog pathogen Mycobacterium sp. MU128FXT by mass spectrometry.
Chem. Commun. 14:4306-4308.
Aka et al. 1751 Hurtado RO, Aguilar L, Orozco HE, Martin A, Luna JH, Flores LR,
Portaels F, Hernandez RP (2009). Differences in virulence and immune response induced in a murine model by isolates of Mycobacterium ulcerans from different geographic areas. Clin. Exp.
Immunol. 157(2):271-281. Kathleen M, Delphi C, Geewananda G, Diane W, Hayman J, Richard L,
Small PL (1999). Mycolactone: A polyketide toxin from Mycobacterium ulcerans required for virulence. Science
283(5403):854-857.
Laurence A, Aka N, Euloge E, Samir B, Raymond N, Mireille D (2009). Risk factors for Buruli ulcer in Côte d’Ivoire: Results of a case-control study. Afr. J. Biotechnol. 8 (4):536-546.
Mac C, Toh JC, Buckle G, Sis-Sons HA (1948). A new bacterial infection in man: clinical aspects. J. Pathol. Bacteriol. 60:93-101.
Miriam E, Caroline L, Willem BR, Pieter B, Janet F, Bouke J, Portaels F
(2014). Multicenter external quality assessment program for PCR detection of Mycobacterium ulcerans in clinical and environmental
specimens. PLoS ONE 9(2): e89407.
doi:10.1371/journal.pone.0089407. Phillips R, Horsfield C, Kuijper S, Sarfo SF, Obeng-Baah J, Etuaful S,
Nyamekye B, Awuah P, Nyarko KM, Osei-Sarpong F, Lucas S, Kolk
AH, Wansbrough JM (2006). Cytokine response to antigen stimulation of whole blood from patients with Mycobacterium ulcerans
disease compared to that from patients with tuberculosis. Clin.
Vaccine Immunol. 13(2):253-257. Portaels F, Meyers WM, Ablordey A, Castro AG, Chemlal K, De Rijk P,
Elsen P, Fissette K, Fraga AG, Lee R, Mahrous E, Small PL, Stragier
P, Torrado E, Van Aerde A, Silva MT, Pedrosa J (2008). First Cultivation and Characterization of Mycobacterium ulcerans from the
Environment. PLoS Negl. Trop. Dis. 2(3):e178.
Sacha JP, Hui H, Torsten S, Jessica LP, Marcus JY, Artem M, Matthew J, Peter W, John KD, Peter FL, Stinear TP (2005). Deciphering the genetic basis for polyketide variation among mycobacteria producing
mycolactones. J. Bacteriol. 187(5):1668-1676. Sarojini A, Armand MO, Tim S, Meyers W, Hayman J, Small PL (2005).
Mycobacterium ulcerans toxic macrolide, mycolactone modulates the
host immune response and cellular location of Mycobacterium ulcerans in vitro and in vivo. Cell. Microbiol. 7(9):1295-1304.
Stinear TP, Ross BC, Davies JK, Marino L, Robins-Browne RM,
Oppedisano F, Sievers A, Johnson PD (1999). Identification and characterization of IS2404 and IS2606: two distinct repeated sequences for detection of Mycobacterium ulcerans by PCR. J. Clin.
Microbiol. 37:1018-23. Stinear TP, Seemann T, Pidot S, Frigui W, Reysset G, Garnier T,
Meurice G, Simon D, Bouchier C, Laurence M, Tichit M, Porter JL,
Ryan J, Johnson PD, Davies JK, Jenkin GA, Small PL, Jones LM, Tekaia, Laval F, Daffé M, Parkhill J, Cole ST (2007). Reductive evolution and niche adaptation inferred from the genome of Mycobacterium ulcerans, the causative agent of Buruli ulcer. Gen.
Res. 17: 192-200. Sylvain A, Richard EL, Engy AM, Small PL, Dia B, Yoshito K (2008).
Synthesis and structure of Mycolactone E isolated from Frog. Org.
let. 12(23): 5385-5388. Timothy PS, Hui H, Wafa F, Melinda JP, Roland B, Thierry G, Peter FL,
Stewart TC (2005). Common Evolutionary origin for the unstable
virulence plasmid pMUM found in geographically diverse strains of Mycobacterium ulcerans. J. Bacteriol. 187(5): 1668-1676.
Timothy PS, Melinda JP, Jessica LP, Stewart TC (2005). Functional
analysis and annotation of the virulence plasmid pMUM001 from Mycobacterium ulcerans. Microbiology 151: 683-692.
Timothy S, Armand MO, Small PL, Wafa F, Melinda JP, Roland B,
Grant AJ, Paul DR, John KD, Richard EL, Sarojini A, Thierry G, Stephen FH, Peter F, Leadlay, Stewart TC (2004). Giant plasmid-encoded polyketide synthases produce the macrolide toxin of Mycobacterium ulcerans. PNAS 101(5):1345-1349.
Travis M. Gooding, Paul D. R. Johnson, Dianne E. Campbell, John A. Hayman, Elizabeth L. Hartland, Andrew S. Kemp, Roy M. Robins-Browne (2001): Immune response to infection with Mycobacterium ulcerans. Infect. Immun. 69(3) :1704-1707.
Yoshito K (2011) Chemistry of Mycolactones, the causative toxins of
Buruli ulcer. PNAS 108(17):6703-6708.

Vol. 9(28), pp. 1752-1757, 15 July, 2015
DOI: 10.5897/AJMR2015.7444
Article Number: 1A71C0554458
ISSN 1996-0808
Copyright © 2015
Author(s) retain the copyright of this article http://www.academicjournals.org/AJMR
African Journal of Microbiology Research
Full Length Research Paper
Prevalence of Brucella antibodies in marketed cow milk in Benue State, Nigeria
Daniel Douglas Ior1,2* and Cornelius Chijioke Chukwu1
1Department of Veterinary Medicine, University of Nigeria, Nsukka, Enugu State, Nigeria.
2Department of Animal Health and Production, Akperan Orshi College of Agriculture Yandev, PMB 181 Gboko, Benue
State, Nigeria.
Received 22 February, 2015; Accepted 10 July, 2015
Brucellosis is an endemic disease in the animal population in Nigeria and of great public health importance, particularly among livestock owners and workers who are ignorant of the risk of Brucella infection. A total of 102 milk samples comprising 62 from cattle herds and 40 from milk vendors in Benue State, Nigeria were screened for Brucella antibodies by the milk ring test (MRT). The herds for the study were randomly selected within randomly selected local governent areas from the three geopolitical zones of the state. All herds sampled had no history of vaccination and cows with mastitis were excluded. 17.7% of milk samples from herds and 12.5% samples from milk vendors were positive for Brucella antibodies. The overall prevalence was 15.7%. The result shows significantly (P<0.05) higher prevalence in herds where fresh bulk herd milk was collected than those from milk vendors who sold fermented milk. However, prevalence within the geopolitical zones was not significantly different (P>0.05). These findings are of public health significance as about 90% of the milk sold to the public within the study area is neither pasteurized nor boiled. Local milk producers and milk vendors should be educated on the importance of pasteurization or boiling of milk. Adequate pasteurization or boiling of milk before sale and consumption must be enforced. These regulations should be mandatory for milk intended for human consumption. Key words: Prevalence, Brucella antibodies, unpasteurized milk, milk ring test, Benue State Nigeria.
INTRODUCTION Brucellosis is a zoonosis caused by Brucella species. The disease in animals causes abortion, infertility, neonatal mortality and hygroma, and is spread by materials contaminated by body fluids including milk. In humans, brucellosis presents as a febrile flu-like illness and is common among pastoralists in Africa (Nicoletti, 1984; Chukwu, 1987a). It is therefore a disease of great
economic importance and public health significance. Humans usually acquire brucellosis by consumption of
raw milk and milk products such as cheese. Brucellosis is also recognized as an occupational hazard for livestock farmers, veterinarians, and workers in the meat industry within areas with enzootic B. abortus. Farmers and workers in the meat industry may contract brucellosis
*Corresponding author. E-mail: [email protected]. Tel: +2348060613704. Author(s) agree that this article remains permanently open access under the terms of the Creative Commons Attribution License 4.0 International License

percutaneous, conjunctiva,or by nasal mucous mem-brane infection. Veterinarians may become infected when handling aborted foetuses or apparently healthy calves born to infected cows and by performing gynaecological and obstetric manipulations, or rectal examination of infected cattle (Schnurrenberger et al., 1975; Alausa, 1980). The most important means of humans acquiring brucellosis is through the consumption of raw milk. The prevention of brucellosis infection in humans is a major reason for the advocacy of milk pasteurization worldwide. The risk of infection by milk borne brucellosis is the reason for public health regulations which discourages the informal milk markets that sell unpasteurized milk. This is because of the risk it poses to human health. However, these regulations are not implemented in many developing countries including Nigeria. Over 90% of milk sales in Nigeria is in the hands of pastoral farmers who do not believe that milk could be a potential source of infection to humans and are not prepared to subject their milk to any form of treatment (Bertu et al., 2010). Despite the existence of regulations that require milk pasteurization, over 75% of the milk marketed in many developing countries is sold raw through local informal pathways (Staal et al., 2000). This is the scenario in Benue State, Nigeria as most of those involved in milk marketing are the Fulani milk maids and the milk is consumed raw or fermented as fura and nono. These informal milk markets thrive because they are immediate source of money and are of financial benefit to these pastoralists and milk agents.
Previously, only the Milk Ring Test (MRT), with a sensitivity of about 80% (Hunter and Allen, 1972) was available for detection of Brucella antibodies in fresh milk. A more accurate indirect Enzyme Linked Immunosorbent Assay (ELISA) with sensitivity = 95% and specificity = 99% for testing Brucella antibodies in milk has since been improved and validated (Kerkhofs et al., 1990; Nielsen et al., 1996). The milk ELISA is more sensitive than Rose Bengal test (RBT), MRT, and Complement Fixation Test (CFT) (Sutherland et al., 1986; Kerkhofs et al., 1990; Nielsen et al., 1996; Kerby et al., 1997) and reportedly able to detect antibodies in dilutions of up to 1:100. However, the MRT with a sensitivity of 87.5% and specificity of 98.6% (Bertu et al., 2010) was used in this study to determine the prevalence of Brucella antibodies in milk samples as the indirect milk ELISA kits were not readily available.
The MRT is cheap, easy, simple and quick to perform. It detects lacteal anti-Brucella immunoglobulin M (IgM) and IgA bound to milk fat globules. However, it tests false positive when milk that contains colostrums, milk at the end of the lactation period, milk from cows with mastitis are tested (Alton et al., 1988).
The risk to human health from these informal marketing of milk is the main objective of this study. This paper presents results of a study on the occurrence of Brucella antibodies in informally marketed milk in Benue State,
Ior and Chukwu 1753 Nigeria and examines the health risks from consumption of raw or untreated milk.
MATERIALS AND METHODS
The study area Benue State is one of the 36 States of the Federal Republic of Nigeria and it is referred to as the Food Basket of the Nation. It was created on February 3, 1976 with Makurdi as the capital city. The State has 23 Local Government Areas (LGAs) with a population of 4,219,244 (Daily Trust Newspaper, Wednesday, 10
th January
2007). The state occupies a landmass of 30,955 square kilometres. The major ethnic groups in the state include Tiv, Idoma and Igede in that order (Benue State Diary, 2007). Benue State is located between latitudes 6
o30’N and 8°10’N and between longitudes
7°30’E and 9°50’E. It is located in the middle belt of Nigeria and derives its name from River Benue which is the second largest river in Nigeria. The state lies in the transition belt between the tropical rain forest of Southern Nigeria and the open grassland savannah vegetation of Northern Nigeria. It is divided into three geopolitical
zones A, B and C (Benue State Diary, 2007). Benue State experiences a typical tropical climate with two distinct seasons, the rainy season and the dry season. The rainy season lasts from April to October with annual rainfall in the range of 150-180 mm. The dry season begins in November and ends in March while mean monthly temperatures fluctuate between 23 and 30°C in the year.
Benue State is endowed with abundant agricultural resources. About 80% of the population depends on agriculture for their
sustenance and livelihood. The state has favourable climatic conditions and fertile soils conducive for the rearing of animals and cultivation of virtually all crops grown in Nigeria. Most prominent among the animals reared are pigs, goats, poultry and cattle. Major crops cultivated include: yam, cassava, rice, soya beans, sesame, maize, citrus, mangoes, vegetables and sugarcane. The State has high migrant populations of nomadic Fulani pastoralists whose main occupation is raising cattle. Sample collection
About 10 ml of bulk herd milk was collected immediately after milking from 62 randomly selected herds in nine randomly selected Local Government Areas in the three geopolitical zones of Benue State, Nigeria (3 LGAs from each geopolitical zone). None of the herds had record of vaccination against brucellosis. Also another 10 ml of milk from each milk seller (40 in total) at marketing points in the Local Government areas were collected (Table 1). Before samples were collected, the herdsmen and milk vendors were asked whether they were aware of the need to boil or pasteurize fresh milk before marketing. The samples were collected into labelled 10 ml sterile plastic tubes with screw caps. The samples were then taken to the laboratory where they were held under refrigeration for 48-72 h and tested thereafter. The duration of sample collection was 12 months (April 2010 to March 2011).
Laboratory testing
The MRT works on the principles that lacteal antibodies essentially agglutinins to Brucella attach themselves to fat globules which rise to the surface of the milk and cluster at the cream layer. When haematoxylin stained Brucella antigen is added to the milk (Hunter and Allen, 1972), Brucella antibodies in the milk if present, form a
complex. The complex attaches to the fat globules in the milk forming a blue ring at the cream layer leaving the normal white

1754 Afr. J. Microbiol. Res.
Table 1. Summary of milk samples collected from herds and milk vendors for milk ring test.
Zone LGA No. of
herds No. of milk vendors
A K/Ala 9 6
Ukum 6 4
V-ikya 4 3
Subtotal 19 13
B Gboko 11 6
Gwer East 5 4
Makurdi 10 6
Subtotal 26 16
C Ogbadibo 6 3
Oju 3 2
Otukpo 8 6
Subtotal 17 11
Grand Total 62 40
skimmed milk below, indicating a positive result. If Brucella antibodies are absent, the whole mixture remains homogenously bluish-white, indicating a negative result.
Prior to testing of milk samples by the milk ring test, the pH for each sample was determined using a pH meter (Hanna Instruments USA, www.clarksonlab.com). The test was done using Brucella
abortus/melitensis/suis Milk Ring Test (MRT) antigen form the Veterinary Laboratories Agency (VLA) – Weybridge, Surrey, UK as described by Alton et al. (1988). The test was carried out by pipetting 1 ml of milk sample to be tested (thoroughly mixed to disperse the cream evenly) into a 5 ml sterile glass tube. One drop (0.03 ml) of the ring test antigen was added and while closing the top of the tube with the index finger of gloved hands, mixed gently
by shaking and inverting the tube several times. The index finger was rinsed and dried between samples. The mixture was allowed to stand for about a minute and examined to make sure that the antigen is thoroughly mixed with the milk. The mixture was then incubated at 37°C for 1 h. The test result was the read using uniform light source. If the intensity of the blue colour in the cream layer is deeper than the skim portion (forming a blue ring), the test was considered positive. If the intensity of the blue colour in the cream layer was less than in the skim portion, the test was
considered negative. Statistical analysis
Data were analyzed using SPSS version 19. Statistical analysis to test for associations between variables was done using the chi-square test and the test level of statistical significance was set at 5% (95% level of confidence, P < 0.05).
RESULTS Of the 62 fresh bulk milk samples collected from herds and tested using MRT, 11 (17.74%) were positive for Brucella antibodies while 5(12.50%) of the 40 samples from milk vendors were positive to the MRT. This gives an overall prevalence of 15.69% (16/102) (Table 2).
There was significant difference (χ
2 = 0.51; P< 0.05) in
prevalence of Brucella antibodies in fresh bulk herd milk and milk from vendors. However, prevalence of Brucella antibodies in milk was not significantly different between the geopolitical zones of the state (χ
2 = 0.38; P> 0.05).
The pH of fresh bulk herd milk samples ranged from 6.5 to 6.8 while that of sour (fermented) milk sold by vendors ranged from 4.5 to 4.8. Of the total 102 herdsmen and vendors interviewed, 72 (70.59%) agreed that they were aware of the need to boil or pasteurize milk before sale and consumption but emphasized that they do not do so to avoid additional costs and time. Only 30 (29.41%) respondents agreed that they usually boil fresh milk collected before sale, but revealed that boiling of a consignment of milk do not usually prevent them from adding fresh milk to it. DISCUSSION Of the 62 fresh milk samples from herds tested, 17.74% were positive for Brucella antibodies while 12.5% of the 40 milk samples collected from milk sellers (hawkers) tested positive to Brucella antibodies. This gave an overall prevalence of 15.69%. Since the herds sampled in the study were not vaccinated, the result is indicative of response to Brucella infection and not due to vaccination. Although the serological diagnosis of brucellosis requires the use of more than one test, other tests such as RBPT, SAT and CFT are used only for testing serum samples. The indirect milk ELISA (Kerkhofs et al., 1990; Nielsen et al., 1996) recommended by OIE (2011), could not be carried out due to non-availability of the test kits.
The result showed a significantly higher prevalence of Brucella antibodies in fresh milk samples (17.74%) than in milk from vendors (12.5%), which are mainly fermented milk. The overall prevalence of 15.69% agrees with 13.5% reported by Bertu et al. (2010) for Jos and environs and 18.61% reported by Cadmus et al. (2008) for trade cows at Bodija abattoir, Ibadan, South-western Nigeria. However, the result obtained was lower than the 25.5% milk seropositivity reported by Junaidu et al. (2011) from individual lactating cows in Sokoto State, Nigeria. Alton et al. (1988) stated that ring tests carried out on undiluted milk samples from individual cows may give false-positive results shortly after parturition, near the end of lactation, and when mastitis is present.
All the samples collected were from bulk herd milk from various herds and milk sellers each representing a herd. The prevalence obtained is therefore herd prevalence rather than individual animal prevalence. The infected animals serve as sources of infection to healthy animals within the herds as well as other neighbouring herds. This is because grazing of animals is unrestricted and contact between different herds is usual. The herdsmen and their families are also at risk of infection as they handle and milk these animals on daily basis. They can easily get

Ior and Chukwu 1755 Table 2. Milk ring test results for Brucella antibodies in cattle in different areas of Benue State, Nigeria.
Zone Area No. of herds
tested MRT positive
(%) No. of vendor milk
tested MRT positive
(%) Zone Total MRT
positive (%)
A
K-Ala 9 2(22.22) 6 1(16.67)
Ukum 6 0(00.00) 4 0(00.00)
V-ikya 4 1(33.33) 3 0(00.00)
Subtotal 19 3 13 1 4(12.5)
B
Gboko 11 2(18.18) 6 1(16.67)
Gwer East 5 1(20.00) 4 0(00.00)
Makurdi 10 2(20.00) 6 1(16.67)
Subtotal 26 5 16 2 7(16.7)
C
Ogbadibo 6 1(16.67) 3 1(33.33)
Oju 3 0(00.00) 2 0(00.00)
Otukpo 8 2(25.00) 6 1(16.67)
Subtotal 17 3 11 2 5(17.9)
Grand Total
62 11(17.74) 40 5(12.5) 16(15.7)
Type of milk. χ2=0.51; P<0.05 Geopolitical zones (A, B and C). χ
2=0.38; P>0.05.
infected because of close contact with the animals (Chukwu, 1987b). Megersa et al. (2011) stated that brucellosis in traditional livestock husbandry practices certainly poses a zoonotic risk to the public, in consequence of raw milk consumption, close contact with animals and provision of assistance during parturition. Adherence to traditional farming practices, preference for fresh dairy products and contact with animals have been reported to be risk factors for human exposure (Kassahun et al., 2006; Meky et al., 2007). Adesokan et al. (2013) in a survey for knowledge and practices related to bovine brucellosis transmission among livestock workers in South-western Nigeria revealed that consumption of unpasteurized milk, uncooked meat and its products, co-habitation with animals, and poor hygiene were significant risk practices in the transfer of Brucella infection from animals to humans among these workers. Previous reports indicated that about 90% of milk consumed in sub-Saharan Africa is raw or soured (Walshe et al., 1991; Mfinanga et al., 2003). The consumption of unpasteurized dairy products has been identified as a brucellosis risk factor for humans (Kang’ethe et al., 2000; Cadmus et al., 2008). Regassa et al. (2009) reported that 85.7% of cases of human brucellosis in Ethiopia resulted from the consumption of raw milk emphasizing the gravity of the problem.
Most of the milk sold to the public in major settlement areas of Benue State does not undergo any form of treatment such as pasteurization or boiling. The Fulani believe that milk is wholesome and could even be taken directly from the cow. Milk being sold by Fulani milk maids is either fresh or soured (fermented). This means that milk being consumed by the public in the study area is mostly not boiled and therefore a potential health risk
to the consumers. It is a point of public health concern that this work uncovered the unusual practice of adding fresh milk to one already boiled. This practice nullifies the importance and usefulness of boiling milk in the first instance and all efforts must be put in place through education to stop this practice.
Concern about human health risks from these market pathways needs to be addressed in the context of consumer practices such as boiling to reduce or eliminate potential infection by milk-borne pathogens without discouraging the markets through which the smallholders sell their milk (Kang′ethe et al., 2000). Boiling of raw milk achieves higher temperatures and duration than those attained through pasteurization (Kang′ethe et al., 2000). This means that if these milk sellers ensure regular boiling of milk before it is sold to the public, such milk could be said to be safe, as most infectious agents in the milk might have been destroyed during boiling.
In this work, the pH of fresh bulk herd milk ranged from 6.5 to 6.8 while that of fermented milk ranged from 4.5 to 4.8. There is the belief that traditionally fermented milk known as nono is safe since it has undergone fermentation. Fermentation (souring) only lowers the pH of milk from about 6.8 to about 4.5. Under this acidic pH, Brucella organisms are only mildly affected (Farrell, 1996). Minja (1999) found that the low pH level in sour milk only destroyed Mycobacterium bovis after 66 hours. This implies that homemade fermented milk could be a possible source of infection with brucellosis to humans. Although the herdsmen, milk sellers and consumers do not believe that they could get infected by drinking raw milk or non boiled fermented milk, it is a major source of infection with brucellosis.
Despite the existence of pasteurization, most of the

1756 Afr. J. Microbiol. Res. milk marketed by traditional milk maids is raw and sold through informal channels. Boiling is not also considered a beneficial means of treating milk to make it safe for human consumption. Milk is a nutritious food for animals and humans and must be free of pathogenic organisms. The risk of infection by milk borne brucellosis is the reason for public health regulations. Adequate pas-teurization or boiling of milk before consumption must be enforced. This is the only means by which milk can be made safe for human consumption. A prevalence of 25% in lactating cows was earlier reported in Nigeria by Junaidu et al. (2011) and 80.7% in Pakistan by Soomro (2006). This is of public health importance particularly for those Fulani observed to be drinking raw milk directly from the udder of the cow, since B. abortus has been isolated from raw and sour milk of Fulani cattle in Nigeria (Bale and Kumi-Diaka, 1981 and Eze, 1978). Brucellosis remains one of the most common zoonotic diseases worldwide with more than 500,000 human cases reported annually (Seleem et al., 2010). In this area, milk is usually preserved by souring, which does not destroy brucellae as they are preserved in milk fat (Eze, 1978). Unfortunately, many farmers do not take measures to protect them against brucellosis and are quite willing to drink unpasteurized milk. Infected farmers with symptoms of undulating fever and joint pains rarely seek medical help and when they do, the fever is usually ascribed to malaria or typhoid, therefore human brucellosis is likely to be greatly under diagnosed (Njoku, 1995; Mai et al., 2012). Although human brucellosis is essentially an occu-pational hazard, many people can become infected through the consumption of raw milk or milk products. Milk producers and the general public need to be educated on the danger of drinking raw milk. Adequate pasteurization or boiling of milk before sale and consumption must be enforced. Further work on the isolation and characterization of Brucella from marketed milk is suggested. Conflict of interests The authors did not declare any conflict of interest. ACKNOWLEDGEMENTS The authors acknowledge the assistance of the Veterinary Laboratories Agency (VLA) – Weybridge, Surrey UK in supplying the MRT antigen used in this work. REFERENCES
Adesokan HK, Alabi PI, Stack JA, Cadmus SI (2013). Knowledge and
Practice related to bovine brucellosis transmission amongst livestock
workers in Yewa, South-western Nigeria. J. South Afr. Vet. Assoc. 84(1):E1-5.
Alausa KO (1980). Incidence and seasonal prevalence among
occupationally-exposed population to brucellosis. Trop. Geogr. Med. 32:12-17.
Alton GG, Jones LM, Angus RD, Verger JM (1988). Techniques for the brucellosis Laboratory, Institut National de la Recherché Agronomique, Paris, France. 190pp.
Bale JO, Kumi-Diaka J (1981). Serological and bacteriological study of bovine brucellae from livestock investigation and breeding centres in Nigeria. Br. Vet. J. 137:256-261.
Benue State Diary (2007). Benue State of Nigeria Diary, produced by the Ministry of Information and Culture, Makurdi.
Bertu WJ, Dapar M, Gusi AM, Ngulukun SS, Leo S, Jwander LD (2010).
Prevalence of brucella antibodies in marketed milk in Jos and environs. Afr. J. Food Sci. 4(2):062-064.
Cadmus SIB, Adesokan HK, Stack J (2008). The use of the milk ring
test and Rose Bengal test in brucellosis control and eradication in Nigeria. J. Afr. Vet. Med. Assoc. 79(3):113-115.
Chukwu CC (1987a). Brucellosis in Africa. Part 2. The importance. Bull.
Anim. Health Prod. Afr. 35:92-98. Chukwu CC (1987b). Studies on sero-prevalence of bovine brucellosis
in Enugu and Nsukka. Zariya Vet. 2: 383-387.
Daily Trust Newspaper, Wednesday 10th January (2007). Printed and
Published by Media Trust Limited, Abuja, Nigeria. Eze EN (1978). Isolation of brucellae from the Nigerian livestock and
the typing of such isolates. Bull. Anim. Health Prod. Afr. 26: 29-36. Farrell ID (1996). Brucella. In Mackey and Carter, Practical Medical
Microbiology, 14th edition, Eds.; Coller JG, Fraser AG, Marimion BP,
Simmons A. Churchill Livingstone Publishers. pp. 473-478. Hunter D, Allen J (1972). An evaluation of milk and blood tests used to
diagnose brucellosis. Vet. Rec. 91: 310.
Junaidu AU, Oboegbulem SI, Salihu MD (2011). Serological survey of Brucella antibodies in breeding herds. J. Microbiol. Biotechnol. Res. 1(1): 60-65.
Kang’ethe EK, Arimi SM, Omore AO, McDermott JJ, Nduhiu JG, Macharia JK, Githua A (2000). The prevalence of antibodies to Brucella abortus in marketed milk in Kenya and its public health
implications. Paper prepared for oral presentation at the 3rd
All African Conference on Animal Agriculture. 6-9 November, 2000. Nairobi, Kenya.
Kassahun J, Yimer E, Geyid A, Abebe P, Newayeselassie B, Zewdie B, Beyene M, Bekele A (2006). Sero-prevalence of brucellosis in occupationally exposed people in Addis Ababa, Ethiopia. Ethiop.
Med. J. 44: 245-252. Kerby PJ, Quiroga JL, McGrane JJ, Stagg DD (1997). Field evaluation
of an indirect ELISA for detection of brucellosis in lowland Bolivia.
Trop. Anim. Health Prod. 29: 65-72. Kerkhofs P, Botton Y, Thiange P, Dekeyser P, Limet JN (1990).
Diagnosis of bovine brucellosis by enzyme immunoassay of milk. Vet. Microbiol. 24(1):73-80.
Mai H, Irons P, Kabir J, Thompson P (2012). A large seroprevalence survey of brucellosis in cattle herds under diverse production systems in Northern Nigeria. BMC Vet. Res. 8:144.
Megersa B, Biffa D, Niguse F, Rufael T, Asmare K, Skjerve E (2011). Cattle brucellosis in Southern and Eastern Ethiopia and its zoonotic implication. Acta Vet. Scand. 53:24-27.
Meky EA, Hassan FA, Abd-Elhafez AM, Aboul-Fetou AM, El-Gazali SMS (2007). Epidemiology and risk factors of brucellosis in Alexandria governorate. East. Mediterr. Health J. 13:677-685.
Mfinanga SG, Mørkve O, Kazwala RR, Cleaveland S, Sharp JM, Shirima G, Nilsen R (2003). Tribal differences in perception of tuberculosis control in Arusha, Tanzania. Int. J. Tuberc. Lung Dis.
7(10):933-941. Minja N (1999). Occurrence and survival of Mycobacterium species in
fermented milk from Traditional cattle herds: A case study of Usangu
Plains, Southern Highlands, Tanzania. M.Sc Thesis, University of Agriculture, Sokoine. 91pp.
Nicoletti P (1984). The control of brucellosis in tropical Africa and
subtropical regions. Prev. Vet. Med. 2:193-196. Nielsen K, Smith P, Gall D, Perez B, Cosma C, Muller P, Trottier J, Cote
G, Boag L, Bosse J (1996). Development and validation of an indirect enzyme immunoassay for detection of antibody to Brucella abortus in
milk. Vet. Microbiol. 52:165-173.

Njoku AJ (1995). Brucellosis or Malaria. Nig. J. Parasitol. 16:73-78. OIE (2011). Manual of Diagnostic Tests and Vaccines for Terrestrial
Animals. Paris, France.World Health for Animal Health. 2011.
http://www.oie.int/fileadmin/Home/eng/Health_standards/tahm/2.04.03 BOVINE_BRUCELL.pdf.
Regassa G, Mekonnen D, Yamuah L, Tilahun H, Guta T,
Gebreyohannes A, et al. (2009). Human brucellosis in traditional pastoral communities in Ethiopia. Int. J. Trop. Med. 4:59-64.
Schnurrenberger PR, Walker JF, Martin RL (1975). Brucella infection in
Illinois Veterinarians. J. Am. Vet. Med. Assoc. 167:1084-1089. Seleem NM, Boyle SM, Sriranganathan N (2010). Brucellosis: A re-
emerging zoonosis. Vet. Microbiol. 140:392-398.
Soomro AH (2006). Study on seroprevalence of brucellosis in cattle and buffaloes.http://agris.fao.org/agrissearch/search/display.do?f=2009/PK/PK0901.xml;PK2009000058.
Ior and Chukwu 1757 Staal SJ, Delgado C, Baltenweck I, Krusha R (2000). Spatial aspects of
producer milk Price formation in Kenya: A joint household-GIS approach. A contributed paper at the International at the International
Association of Agricultural Economists meeting, Berlin, Germany. August 2000. Smallholder Dairy (Research and Development) Project Research Report.
Sutherland SS, Evans RJ, Bathgate J (1986). Application of an enzyme linked immunosorbent assay in the final stages of a bovine brucellosis eradication program. Aust. Vet. J. 63(12):412-415.
Walshe MJ, Grindle J, Nell A, Bachmann M (1991). Dairy development in sub-Saharan Africa. World Bank Technical Paper 135, Africa Technical Department Series, World Bank, Washington DC.

African Journal of
Microbiology Research
Related Journals Published by Academic Journals African Journal of Biotechnology African Journal of Biochemistry Research Journal of Bacteriology Research Journal of Evolutionary Biology Research Journal of Yeast and Fungal Research Journal of Brewing and Distilling