methods to specify random vibration acceleration
TRANSCRIPT

Methods to Specify Random Vibration Acceleration Environments
That Comply with Force Limit Specifications
Kristin Fitzpatrick [email protected]
The Boeing Company 13100 Space Center Blvd.
Houston, TX 77059 281-226-5695
281-226-4637 (fax)
Scot McNeill [email protected]
The Boeing Company 13100 Space Center Blvd.
Houston, TX 77059 281-226-4300
281-226-4637 (fax)
ABSTRACT Vibration testing is used by several industries to validate mechanical components for their intended use. An issue that continues to arise during such tests is the overtesting of the component, which can cause damage to its parts and result in costs of obtaining new test articles and retesting. This paper presents two methods for deriving an appropriate acceleration environment to avoid overtesting. Both methods use the acceleration recovered at a components interface points to create the acceleration test environments. The first method uses traditional enveloping with a notching technique at major structural resonances. The notches are chosen to comply with a force limiting specification, and require modal effective mass results, from the finite element analysis of the component. The second method uses the Vibration Response spectrum of the interface acceleration to develop a vibration acceleration environment. The results of these methods are compared and are shown to comply with a Force Limit that is created using the semi-empirical method.
Keywords: Random Vibration, Semi-Empirical Method, Vibration Response Spectrum, Force Limiting, TDFS method

1. Introduction Random vibration environments are typically specified as Acceleration Power Spectral Density (APSD) levels. Component levels are typically derived from simulation of an integrated structure with known random vibration input levels. The interface acceleration APSD is recovered at the component’s interface. Overtesting results from the way that the interface APSD is simplified to develop the random vibration test specification. The interface APSD will exhibit peaks at the coupled system resonances and valleys at the component’s resonances due to the vibration absorber effect [8]. Traditionally, the simplified acceleration environment is derived by drawing a few straight lines enveloping the peaks in the actual interface APSD. In so doing, the valleys are ignored. The result of this is that the component will exhibit a response that is many times larger than it should be at resonant frequencies. Random vibration testing, though a requirement for many mechanical products, frequently suffers from overtesting. The overtesting of mechanical devices has inspired researchers for decades, as early as Blake in 1956 [1]. In the last decade, due to technological advancements in testing equipment [5], researchers have seen the implementation of that research in physical applications. One research effort conducted in the 1990s by the NASA Jet Propulsion Laboratory (JPL) developed a well documented monograph of force limiting techniques, [8]. One of the techniques discussed in that paper was the semi-empirical method, influenced by Salter’s 1964 paper [7]. The material from that monograph influenced more in-depth investigations into the semi-empirical method, [10]. Conventionally, force limiting is a technique of monitoring the force input and the components acceleration response during vibration test and altering the input when the force nears a pre-set ‘force-limit’ specification. Though this technique is a scrupulous way to prevent overtesting, there are some set backs to its implementation. Force limiting uses a ‘dual control’ method during a test, which includes both force gages and accelerometers. Force gages need to be used in series with the test component and shaker, which may require specialized fasteners [6]. Two prevailing force limiting methods are the semi-empirical method and two degree of freedom system method. Though these methods are very effective, some elements needed for either one’s implementation require engineering judgment made by the user. This requirement, depending on the complexity of the system and experience of the user, can be a hindrance in the search for an appropriate test environment for the test component. In addition, some facilities may not be set up to implement the required dual control. This paper introduces two methods for deriving vibration environments that do not require the use of force gages and hence remove the need for ‘dual control’ during a vibration test. Both methods use the acceleration recovered at a components interface points to create acceleration test environments. The first method uses traditional enveloping with a notching technique. The notches are chosen to comply with a force limiting specification, and require modal effective mass results from the finite element analysis of the component. The second method uses the Vibration Response Spectrum (VRS) of the interface acceleration to develop a vibration acceleration environment. A further advantage of the VRS is that it eliminates the need for empirical factors guided by engineering judgment. The results of these methods are compared and are shown to comply with a Force Limit that is created using the semi-empirical method. The advantage of creating an acceleration environment, which complies with a force limit, is that once the acceleration environment is created only accelerometers would be necessary during the actual testing.

2. Force Limiting Though the basic concepts behind force limiting have been in literature for several years the technology to implement those ideas had been lacking. The research done by JPL in the 1990’s, along with the necessary funding, allowed for the development and testing necessary to establish force limited vibration testing as a standard procedure for random vibration testing. The documentation of that research presented the fundamentals behind the creation of force limits in the form of the Two Degrees of Freedom System (TDFS) method and the Semi-Empirical Method (SEM), which are discussed in detail in the next section. In addition to the input acceleration control of traditional vibration testing, the force limited vibration testing approach measures and limits the reaction forces between the test component and the shaker. The control system monitors the interface force and reduces the input acceleration when the force approaches the force limit specification curve. The result is that the input acceleration has notches at the test component’s major resonances. This mimics the vibration absorber affect that the component will experience when implemented. Traditionally, the force limit specification curve would supplement the APSD curve to make up the random vibration test specification. This specification would be implemented with a dual force / acceleration control system. For the purpose of this paper force limiting was used as a tool for validating the results of the two random vibration acceleration environment techniques that were developed. This type of application removes the ‘dual control’ necessary for using a force limit during testing. Elements of the force limit specification are also used in the notching technique, discussed in the next section, which creates an acceleration environment that simulates the vibration absorber effect.
3. Semi-Empirical and TDFS Methods The Semi-Empirical Method (SEM) and Two Degree of System (TDFS) method were developed to create force limits for vibration testing [2]. Elements of the SEM/TDFS techniques are also used in the notching technique, discussed in the next section, which creates an acceleration environment that simulates the vibration absorber effect. The fundamental equations behind the semi-empirical method are listed in (1) and (2). These equations generate the Force Power Spectral Density (FPSD) force limit by multiplying the square of the component’s mass by the input Acceleration Power Spectral Density (APSD) and a constant squared. After the frequency goes beyond the first significant mode of component, the factor (f/f0) is introduced to account for the decrease in the components apparent mass with frequency. This roll off exponential factor is used to adjust this term to better fit experimental measurements, [6].
( ) ( )fSMCfS aa20
2ff = (1) 0ff ≤
( ) ( ) ( )n0aa
20
2ff fffSMCfS = (2) 0ff >
M0 - component mass C2 - empirical factor, ~1≤C2≤5 n - roll off ratio, ~0.5≤n≤3 Saa - enveloped interface acceleration power spectral density Sff - force power spectral density (force limit specification) f - frequency f0 - frequency of first significant mode of component

The empirical constant, C2, is largely dependent on the component and test setup. The primary factor is the mass ratio between the component and the mounting structure. Other major factors are the number and position of the attachment points and the direction of excitation, [11]. An estimate of C2 can be achieved using equations (3) and (4), from the force limit simple TDFS calculation method. The TDFS method was developed to estimate the force limit FPSD using a simple two degree of freedom system consisting of a source mass and spring/damper in series with a load mass and spring/damper. The source spring/damper is constrained. It is assumed that the two oscillators have the same component resonance frequency (f0), since this produces the highest interface force. An estimate of this is not required since the ratio f/f0 is what is solved for in (3) and used in (4). The lower root in (3) is used in (4) to solve for Sff, since it results in the highest value of Sff. The component to source mass ratio (m2/m1) is conventionally defined by their modal masses. The residual mass can be substituted in defining the ratio of load to source mass. This technique, however, may overestimate the C2 hence the interface force [9]. The estimated C2 achieved by using residual mass can be lowered by tweaking the constant to create a force limit curve to better fit experimental or analytical data, when available. When used directly to develop a force limit FPSD, the equations are evaluated at each significant mode using different m2/m1 from residual mass calculations. However, as mentioned above, the TDFS method was only used to get an estimate of C2 in this paper. As a result, the component mass was used as the value for m2 and the source mass (mounting structure mass) was used for m2, and only one calculation was performed.
2
1
2
1
2
1
2
2
0m
m41
mm
mm
211
ff
⎟⎠⎞⎜
⎝⎛+±⎟
⎠⎞⎜
⎝⎛+=⎟⎟
⎠
⎞⎜⎜⎝
⎛ (3)
2
02
22
0
2
02
22aa
ff2
ff
Q1
ff1
ff
Q11
mSSC
⎟⎟⎠
⎞⎜⎜⎝
⎛+⎟
⎟
⎠
⎞
⎜⎜
⎝
⎛⎟⎟⎠
⎞⎜⎜⎝
⎛−
⎟⎟⎠
⎞⎜⎜⎝
⎛+
=≅ (4)
f - coupled system resonant frequency f0 - resonance frequency of uncoupled oscillators Q - dynamic amplification factor, 1/(2ξ)
⎟⎠⎞⎜
⎝⎛
1
2m
m - ratio of component to source mass
4. Notching Method The first random vibration acceleration environment method investigated for reducing the risk of overtesting is a notching technique that uses elements from the SEM and TDFS methods. A positive feature of this particular method is that the environment is based on the component’s acceleration alone, removing the need to recover forces during the test. An adverse feature shared with the force limit SEM/TDFS is the use of an empirical factor that requires engineering judgment in the creation of the environment. The method requires an enveloped representation of the component’s interface APSD over each interface Degree Of Freedom (DOF). If this is not known, it can be obtained from frequency
response analysis of the integrated structure involving the component, mounting structure and other structure up to the point where the random vibration environment is known. Notches are introduced into the envelope APSD, which simulates the vibration absorber effect of a mounting structure. The frequency locations of the notches are placed at natural frequencies of structural modes that are significant for interface loads. These modes may be selected based on modal effective mass results from a finite element analysis of the test component or from low level vibration testing. The depth of the notches is based on characteristics of the test component and its mounting structure. The slope and width of notches should be kept within reasonable limits to account for tolerances of vibration testing equipment. The number of notches, within a particular frequency range, should also be kept within a certain limit as to not remove excessive amounts of energy from the test environment. The Modal Effective Mass (MEM), found from the Finite Element Method (FEM) analysis of the test component, constrained at its interface points, reveals the contribution of each mode to the rigid body mass. The modes that contribute a high percentage to the rigid body mass are most likely the significant resonant frequencies and are good candidates for notch locations in the acceleration envelope. The choice of how low of a percentage should be included depends on the test component and is determined using engineering judgment, making sure to keep testing requirements fulfilled. In the absence of a component model, significant natural frequencies may be determined from low level swept sine or random vibration testing. This may also be useful for refining natural frequency estimates from FEM analysis. The depth of the notches, from the envelope of the APSD of the component’s interface points, is (C2/Q2) [2]. The dynamic amplification factor, Q, is that of the test component alone. This can be deduced from low level sine sweep or random testing of the component. The empirical factor C2, the same constant used in the force limit SEM, which if unknown can be estimated using equations (3) and (4) and tweaked with experimental or analytical integrated FEM results, if available. A drawback to this method, notching the APSD may result in undertesting if care is not taken to ensure the overall Grms value is not too greatly diminished. An advantage of this method is that analytical models are not required if the components enveloped interface APSD environment is known from methods other than frequency response analysis of the integrated structure.
5. Vibration Response Spectrum Method The second method investigated to develop a random vibration acceleration environment involves the use of a Vibration Response Spectrum (VRS). This method uses the VRS of the FEM acceleration response at the interface points of the integrated model to create an appropriate APSD input to the component model alone. Like the notching method, this method is creates an acceleration environment for testing, which removes the need of force gages. The goal of the investigation was to verify that this method complied with the force limits created by the SEM and TDFS techniques. A vibration response spectrum is the Root-Mean-Square (RMS) absolute acceleration response of a set of Single Degree of Freedom (SDOF) oscillators to an APSD base input. The VRS is analogous to the Shock Response Spectrum (SRS) which is calculated from a component’s base acceleration time history instead of its APSD [4]. The VRS is a measure of an APSD environment’s severity in terms of its potential to induce a large response in a set of SDOF oscillators. By comparing the VRS of two APSD environments, the severity of the two environments can be compared. The VRS can be estimated by solving the typical absolute acceleration response to a SDOF system, [3]. The first VRS computation technique involves computing the frequency response of each oscillator of frequency fn and damping ξ to the base acceleration APSD by multiplying the base
APSD by the SDOF Frequency Response Function (FRF). Then the RMS response is computed by numerical integration of the frequency SDOF response. The resulting equation is presented in (5). This equation is computed for each oscillator natural frequency of interest. The RMS absolute acceleration response is usually plotted vs. the oscillator natural frequency (similar to the SRS).
( ) ( )[ ] [ ]
( ) ,∆ffYρ 2ξρ1
ρ 2ξ1ξ,fx iiAPSD
N
1i2
i
22i
2i
nRMS ∑= +−
+=&& ffρ ii = (5)
fn - natural frequency ξ - damping ratio
)(fY iAPSD - base input acceleration power spectral density A closed form approximation for the VRS is obtained using the Miles Equation (6), where the base APSD amplitude is taken at the natural frequency. The Miles Equation uses the assumption that the base APSD amplitude is constant across the whole frequency range (0 - ∞). This was not chosen for use as the VRS computation method of this paper because it does not account for the base APSD shape.
)(fY2ξf
2πξ),(fx nAPSD
nnRMS ⎟⎟
⎠
⎞⎜⎜⎝
⎛⎟⎠⎞
⎜⎝⎛=&& (6)
The acceleration root mean square (GRMS), assuming the mean is zero, is the same as the standard deviation, 1σ. The probability that the time history response will lie within ±1σ is around 68.3%. By multiplying equation (5) or (6) by three, achieving 3σ, will increase the probability to approximately 99.7%. The 3σ response is often taken to be the peak response in Gaussian random vibration. The 3σ version of equation (5), which approximates the peak response, was chosen for use in the VRS method for deriving a random vibration environment, though it does not mater when comparing two or more VRS’s. The VRS can be used to develop a simplified test APSD specification from the interface APSD’s as follows. The VRS of the interface APSD is created and stored. A simplified outline of the interface acceleration is made in a piecewise linear fashion (on log-log scale). The outline of the interface APSD should follow the trend of the APSD while cutting across peaks and shallower valleys. The VRS of the outline is computed and compared to the VRS of the interface APSD. If the VRS of the APSD outline is not above the VRS of the measured APSD at every frequency then modification to the APSD outline must be made. (Too much of a peak was cut off.) Similarly, if the VRS of the APSD outline is too far above the VRS of the interface APSD, modification to the outline should be made because the force limit may be violated. (Not enough cutoff of peaks.) The more straight lines used in the outline, the closer the VRS’s can become. However if too much detail is used in the APSD outline, the resulting outline may be impractical for random vibration testing. Once the VRS of the APSD outline encompasses the VRS of the interface APSD with appropriate conservatism, the APSD outline can be used as the random vibration acceleration specification to test component alone. Some engineering judgment is required to determine how much the outline VRS is allowed to exceed the interface VRS to comply with force limits.
6. Example: Linear Drive Unit The Linear Drive Unit (LDU) is an Orbital Replacement Unit (ORU) of the International Space Station (ISS) program. During the flight of the LDU to the ISS it is connected to a Space Shuttle Orbiter by an adaptor plate and locking system. The LDU is connected to the adaptor plate by four points, which will be known as interface points. The configuration of the LDU, flight support

equipment (FSE) adapter plate and active flight release attachment mechanism (FRAM) together forms the integrated model. The integrated model is attached to the Orbiter at seven points, which have various constraint directions. The mathematical models of the LDU alone, Fig. 1-Fig. 2, and integrated system, Fig. 3-Fig. 4, both have a dynamic amplification factor Q=10. Both models also have center of gravities (cg) off-set from the center of their connection points. The center of the connection points is where the point of excitation is established and what all the connection points are constrained to during random vibration analyses. For the integrated model the center of the four connection points was used as the excitation point, Fig. 4. With the integrated model lacking symmetry in every axis direction and having cg off-sets, the response from random vibration analysis runs varies with each excitation direction and each interface point. These issues make the use of this model a good choice to demonstrate the use of the random vibration acceleration environment methods because it is not a simplified model.
Fig. 1 LDU Model
t.
Fig. 2 LDU Model Beneath
Fig. 3 In order to begin random vibrationenvironment wasacceleration andThe response towere needed forVRS methods.
Input Pt.
Interface PointsIntegrated Model Fig. 4 Integra
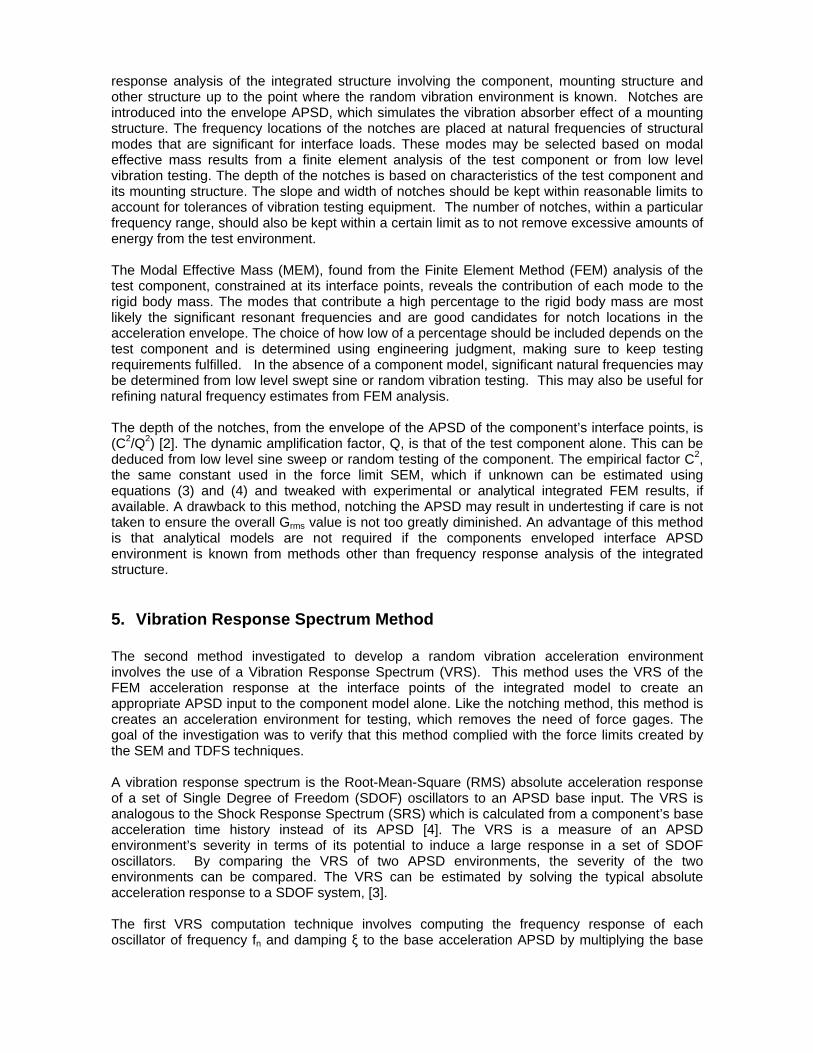
the construction of an APSD test environment specifica test of the integrated mathematical model with th performed using NASTRANTM in the X, Y and Z direc force PSD at each interface point between the LDU a the Z excitation direction is shown in Fig. 5. Both the the development of a force limit that was used for va
Input P
ted Model Beneath
tion for the LDU, alone, a e nominal STS vibration tions independently. The nd FSE were recovered.
accelerations and forces lidating the notching and
102
103
10-4
10-3
10-2
10-1
100
Freq (Hz)
AC
C P
SD
(g2 /H
z)
Z - Launch Input, Interface Acc
Launch Environment InputInterface Acc(s)
Fig. 5 Input to Integrated Model and APSD of Interface Points - Z
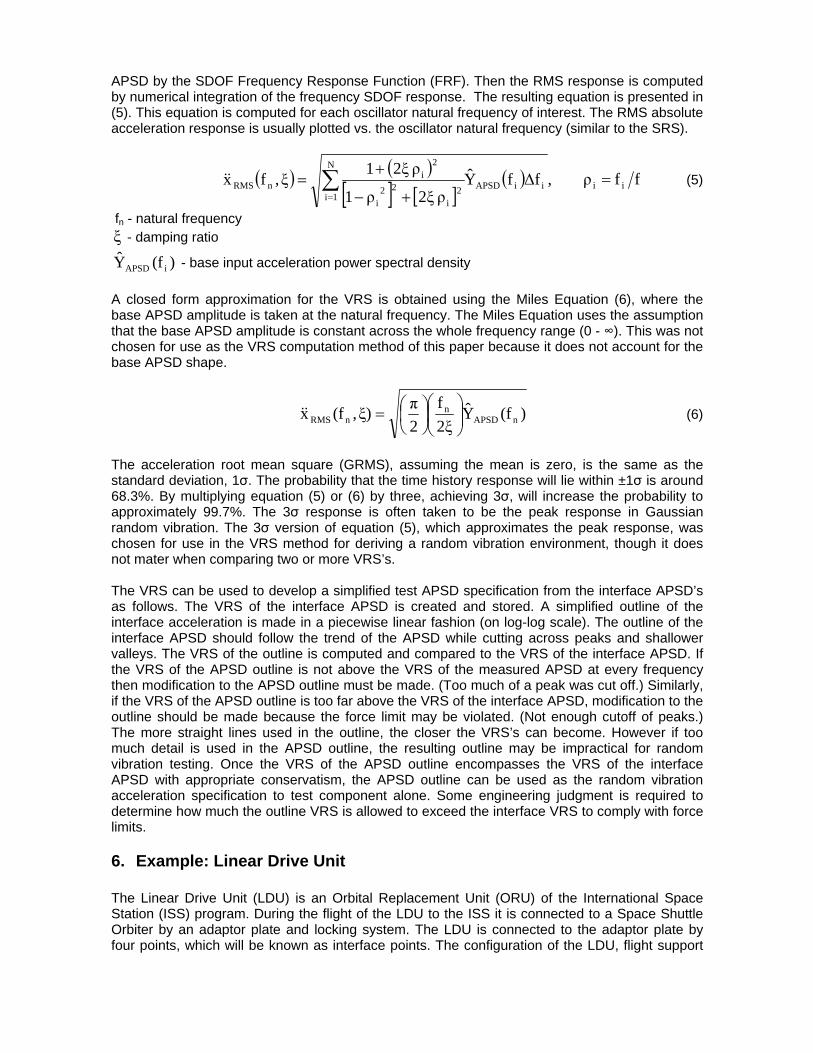
The SEM was used to create force limits for each excitation direction, which were used to verify the ability of the notching and VRS methods to comply with the force limit. For the development of a force limit for each excitation direction an APSD curve was created that enveloped all the APSDs of the interface DOF response to that particular direction of excitation, the Z direction is shown in Fig. 6. This envelope curve was then used in the SEM equations (1) and (2) as the term Saa(f). The first significant mode term, f0, of the SEM equations was determined from the FEM analysis of the LDU alone model, Table 1. More effort was required to determine the values of the C2 and n terms.
Table 1 Largest Modal Effective Mass (Determines f0) As was previously mentioned, each of the four LDU interface DOF’s response, due to asymmetries, differs. To make sure the developed force limit encompasses the sum of all interface forces a single interface force response, that best represented the interface force response, was scaled by a factor that would make the single curve have the same total energy as all of the interface forces. (Alternatively, a force sum can be used.) The term C2 was derived from the TDFS equations (3) and (4) and was adjusted based on the scaled Force Power Spectral Density (FPSD) response. The terms of the mass ratio, (m2/m1), in equation (3) are the LDU mass m1=251lbs and the remaining FSE and FRAM parts make up m2=413lbs. The term n was set to the value of 2, as is the nominal value, and if necessary was adjusted in accordance to the scaled FPSD response. Table 2 presents the values of C2 and n for the TDFS method and the adjusted values when analytical force results of each excitation direction were taken into account. With all the terms of the SEM method created, the force limit curves were finalized, the Z direction force limit is presented in Fig. 7, along with interface forces and the scaled interface force used to evaluate this direction’s C2 and n values. It is possible that better estimates of C2 could have been obtained by using residual mass ratios for the first significant mode of the LDU and mounting structure, but this was not attempted since interface force data was available.
Table 2 Values of C2 and n, from TDFS Eqns and Analytical Data
102
103
10-4
10-3
10-2
10-1
100
Freq (Hz)
AC
C P
SD
(g2 /H
z)
Z - Input, Envelope
Envelope InputInterface Acc(s)
Fig. 6 Envelope of Acceleration Recovered
at Interface Points - Z
102 103
10-4
10-2
100
102
104
Freq (Hz)
Forc
e P
SD
F
Creation of Force Limit - Z Direction
Force Limit, Fo=59.02Scaled Interface Point ForceInterface Points Forces
Fig. 7 Force Limit Created From SEM and
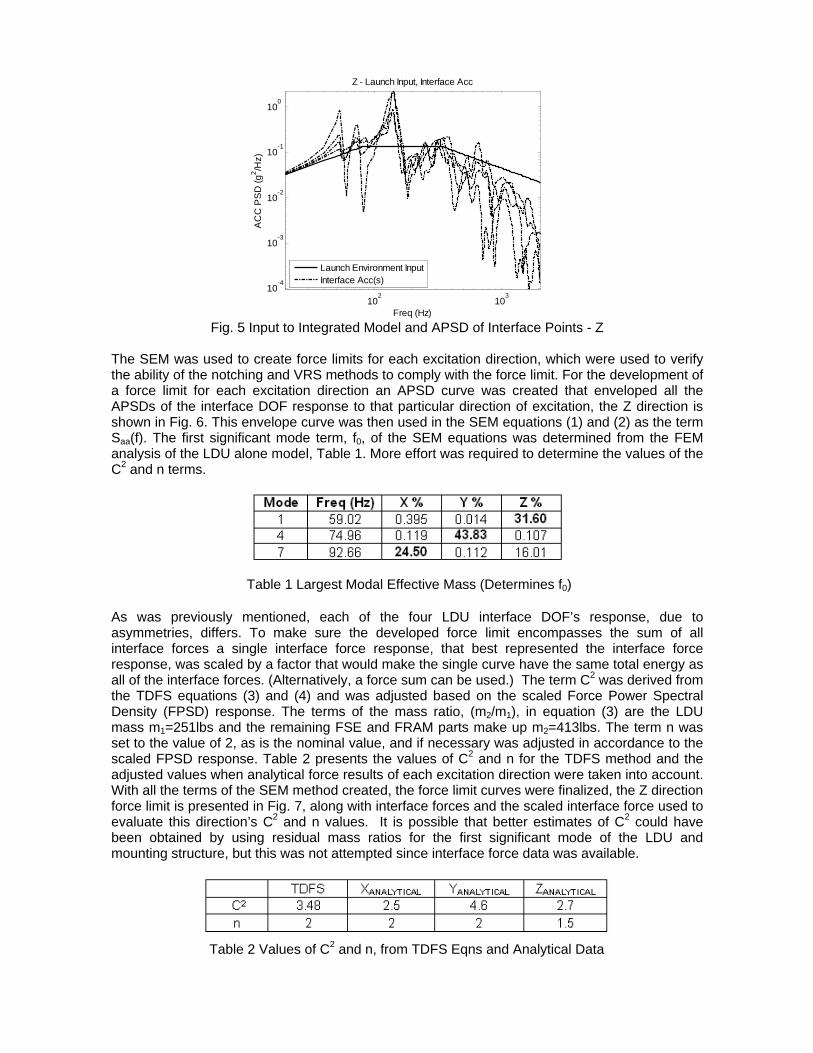
Interface Points’ Forces - Z As mentioned before, the APSD envelope curve of the interface APSD responses may cause overtesting near the resonances of the test component. This phenomena is due to enveloping of dips in the interface responses at the resonance frequencies, which are due to the vibration absorber effect. The Z direction FPSD response of the LDU using the envelope APSD as excitation in the Z direction is shown in Fig. 8. As was expected, the force response of the LDU exceeds that of the force limit at several frequencies.
102
103
100
102
104
FOR
CE
PS
D
Freq (Hz)
Z - Force Response to Envelope Input
Force ResponseForce Limit
Fig. 8 Force PSD Response of LDU to
Envelope APSD Input - Z Both the notching and the VRS method for developing a random vibration acceleration environment were used to create inputs for a random vibration simulated test of the LDU alone. These inputs were used in random vibration analysis runs in NASTRANTM, which included excitations in the X, Y and Z axis directions. The results of these runs are discussed in more detail in the next sections.

6.1 Notching Method Results The notching method, detailed previously, was implemented to create a random vibration acceleration environment, appropriate for an analysis of the LDU alone. The environment created by this method was then introduced into a random vibration analysis run using NASTRANTM 2004. The implementation of the notching method and the results of the NASTRANTM run are considered in this section. The same APSD envelope of the interface DOF APSD’s used in the creation of the force limit was used as a starting point for the notching method. The frequencies of the modes that had a modal effective mass, generated from a FEM analysis of the LDU alone model, near or above five percent were used as locations for notches in the envelope APSD. The depth of each notch is C2/Q2, which differs with each direction of excitation. The notched envelope and interface APSDs for the Z direction excitation are shown in Fig. 9. The notched APSD has a lower magnitude at resonant frequencies of the LDU, similar to the APSDs of the interface points. The slopes of the notches were chosen as 65db/Oct for all excitation directions. The widths of notches were 0.2 Octaves, except in the case where two or more frequencies, chosen as notching locations, were similar enough to be encompassed in a single and slightly wider notch. Each notched APSD was used as an excitation for a random vibration analysis NASTRANTM run of the LDU. The FPSD response of the LDU to the Z direction notched APSD excitation is shown in Fig. 10. The Z direction results clearly satisfy the force limit requirement; similar results were obtained for the X and Y direction excitations.
102
103
10-4
10-3
10-2
10-1
100
Freq (Hz)
AC
C P
SD
(g2 /H
z)
Z - Input, Notched
Notched InputInterface Acc(s)
Fig. 9 Notched APSD Created for Input to
LDU Alone Model - Z
102
103
100
102
104
Z - Force Response to Notched Input
Freq (Hz)
FOR
CE
PS
D
Force ResponseForce Limit
Fig. 10 LDU Force PSD Response to
Notched Input - Z
6.2 Vibration Response Spectrum Method Results The VRS method was also used to create a random vibration acceleration environment for the LDU. NASTRANTM was used as a platform for which to test the created random vibration environment on the LDU. The creation of the excitation using the VRS method and the results of the random vibration analysis using that excitation are detailed in this section. The VRS method does not require the use of constants or empirical factors that need to be estimated and tweaked by engineering judgment, which makes it a sound method for developing random vibration environments. From the two VRS computation techniques discussed, the first VRS technique , equation (5), was chosen. Recall that this technique accounts for base APSD shape. This technique uses characteristics of the test component that are easily acquired,
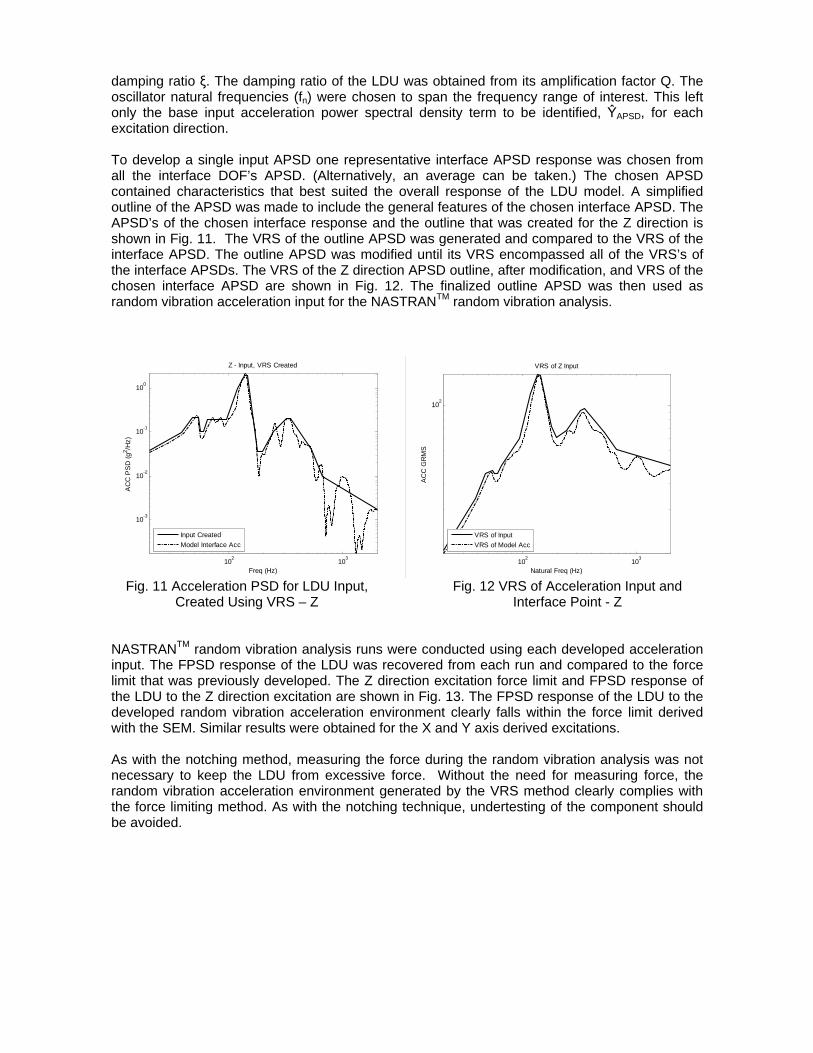
damping ratio ξ. The damping ratio of the LDU was obtained from its amplification factor Q. The oscillator natural frequencies (fn) were chosen to span the frequency range of interest. This left only the base input acceleration power spectral density term to be identified, ŶAPSD, for each excitation direction. To develop a single input APSD one representative interface APSD response was chosen from all the interface DOF’s APSD. (Alternatively, an average can be taken.) The chosen APSD contained characteristics that best suited the overall response of the LDU model. A simplified outline of the APSD was made to include the general features of the chosen interface APSD. The APSD’s of the chosen interface response and the outline that was created for the Z direction is shown in Fig. 11. The VRS of the outline APSD was generated and compared to the VRS of the interface APSD. The outline APSD was modified until its VRS encompassed all of the VRS’s of the interface APSDs. The VRS of the Z direction APSD outline, after modification, and VRS of the chosen interface APSD are shown in Fig. 12. The finalized outline APSD was then used as random vibration acceleration input for the NASTRANTM random vibration analysis.
102 103
10-3
10-2
10-1
100
Freq (Hz)
AC
C P
SD
(g2 /H
z)
Z - Input, VRS Created
Input CreatedModel Interface Acc
102 103
102
Natural Freq (Hz)
AC
C G
RM
S
VRS of Z Input
VRS of InputVRS of Model Acc
Fig. 11 Acceleration PSD for LDU Input,
Created Using VRS – Z Fig. 12 VRS of Acceleration Input and
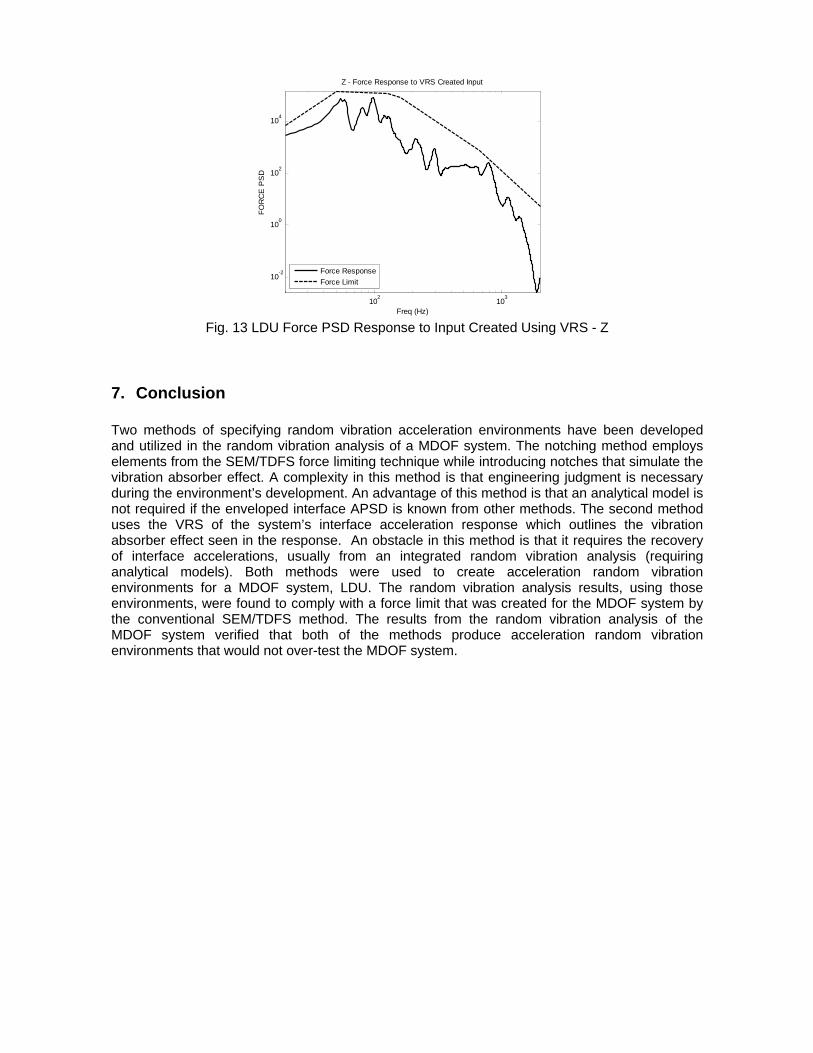
Interface Point - Z NASTRANTM random vibration analysis runs were conducted using each developed acceleration input. The FPSD response of the LDU was recovered from each run and compared to the force limit that was previously developed. The Z direction excitation force limit and FPSD response of the LDU to the Z direction excitation are shown in Fig. 13. The FPSD response of the LDU to the developed random vibration acceleration environment clearly falls within the force limit derived with the SEM. Similar results were obtained for the X and Y axis derived excitations. As with the notching method, measuring the force during the random vibration analysis was not necessary to keep the LDU from excessive force. Without the need for measuring force, the random vibration acceleration environment generated by the VRS method clearly complies with the force limiting method. As with the notching technique, undertesting of the component should be avoided.
102
103
10-2
100
102
104
Freq (Hz)
FOR
CE
PS
D
Z - Force Response to VRS Created Input
Force ResponseForce Limit
Fig. 13 LDU Force PSD Response to Input Created Using VRS - Z
7. Conclusion Two methods of specifying random vibration acceleration environments have been developed and utilized in the random vibration analysis of a MDOF system. The notching method employs elements from the SEM/TDFS force limiting technique while introducing notches that simulate the vibration absorber effect. A complexity in this method is that engineering judgment is necessary during the environment’s development. An advantage of this method is that an analytical model is not required if the enveloped interface APSD is known from other methods. The second method uses the VRS of the system’s interface acceleration response which outlines the vibration absorber effect seen in the response. An obstacle in this method is that it requires the recovery of interface accelerations, usually from an integrated random vibration analysis (requiring analytical models). Both methods were used to create acceleration random vibration environments for a MDOF system, LDU. The random vibration analysis results, using those environments, were found to comply with a force limit that was created for the MDOF system by the conventional SEM/TDFS method. The results from the random vibration analysis of the MDOF system verified that both of the methods produce acceleration random vibration environments that would not over-test the MDOF system.
References [1] Blake, R.E., “The Need to Control the Output Impedance of Vibration and Shock Machines”, Shock and Vibration Bulletin, No. 23, June 1956, pp. 59-64. [2] Chang, K.Y., “Force Limit Specifications vs. Design Limit Loads in Vibration Testing”, Proceedings of the European Conference on Spacecraft Structures, Materials and Mechanical Testing, Noordwijk, The Netherlands, November-December 2000, pp. 295-300. [3] Irvine, T., “An Introduction to the Vibration Response Spectrum Rev C”, Vibrationdata Tutorials, http://www.vibrationdata.com/tutorials2/vrs.pdf, June 14, 2000. [4] Irvine, T., “An Introduction to the Shock Response Spectrum Rev P”, Vibrationdata Tutorials, http://www.vibrationdata.com/tutorials2/srs_intr.pdf, May 24, 2002. [5] Martini, K., “Multicomponent Dynamometers Using Quartz Crystals as Sensing Elements”, ISA Transactions, Vol. 22, No. 1, 1983. [6] NASA, “Force Limited Vibration Testing”, NASA Technical Handbook, NASA-HDBK-70004B, January 31, 2003. [7] Salter, J.P., “Taming the General-Purpose Vibration Test”, Shock and Vibration Bulletin, No. 33, Pt. 3, March 1964, pp. 211-217. [8] Scharton, T.D., “Force Limited Vibration Testing Monograph”, NASA Reference Publication RP-1403, Jet Propulsion Laboratory, Pasadena, CA, May 1997. [9] Scharton, T.D., “Vibration-Test Force Limits Derived from Frequency-Shift Method”, Journal of Spacecraft and Rockets, Vol. 32, No. 2, March-April 1995, pp. 312-316. [10] Soucy, Y., Dharanipathi, V.R. and Sedaghati, R. “Comparison of Methods for Force Limited Vibration Testing”, Proceedings of the IMAC XXIII Conference and Exposition on Structural Dynamics, Society of Experimental Mechanics, Bethel, CT, 2005. [11] Soucy, Y., Dharanipahti, V.R. and Sedaghati, R. “On the Semi-Empirical Method for Force Limited Vibration”. Spacecraft and Launch Vehicle Dynamic Environments Workshop, El Segundo, CA, June 2004, http://www.aero.org/conferences/sclv/pdfs/soucy_forcelimited_04.pdf