on the significance of body mass and vibration magnitude for acceleration transmission of vibration...
TRANSCRIPT

ARTICLE IN PRESS
JOURNAL OFSOUND ANDVIBRATION
0022-460X/$ - s
doi:10.1016/j.js
�CorrespondE-mail addr
Journal of Sound and Vibration 298 (2006) 627–637
www.elsevier.com/locate/jsvi
On the significance of body mass and vibration magnitudefor acceleration transmission of vibration through seats
with horizontal suspensions
Ralph Bluthner�, Barbara Hinz, Gerhard Menzel, Marianne Schust, Helmut Seidel
Vibration and Electromagnetic Fields, Federal Institute for Occupational Safety and Health, Noldnerstr. 40-42, D-10317 Berlin, Germany
Received 2 May 2006; received in revised form 10 May 2006; accepted 8 June 2006
Available online 15 August 2006
Abstract
Seats with horizontal suspensions can help to reduce detrimental effects of whole-body vibration (WBV) on health,
comfort and performance. Two seats were used to examine the effect of body mass and WBV-magnitude on the
transmission of WBV from the seat base to the cushion. Both seats have suspension in the x-direction while Seat 2 has
suspension also in the y-direction. Twelve subjects with a body mass ranging from 59.0 to 97.3 kg volunteered for the
study. A set of anthropometric characteristics was acquired. Three magnitudes of WBV were used with a truck-like signal
(Seat 1, 0.3–0.59m s�2 wd-weighted rms values at the seat base, x-direction) and a tractor-like signal (Seat 2,
0.55–1.09m s�2 wd-weighted rms values at the seat base, x-direction, 0.52–1.07m s�2 wd-weighted rms values, y-direction).
The magnitude of WBV had a significant effect on the transmissibility characterized by SEAT-values. A significant
influence of the body mass on SEAT-values was found for the y-direction only. Other anthropometric characteristics
proved to be more important for the prediction of SEAT values by multiple regressions. There was no significant
correlation of SEAT-values, x-direction, with the body mass. Other anthropometric characteristics enabled a satisfactory
prediction of SEAT values also for x-direction in several cases. Tests with only two subjects of extreme body mass are not
suited to obtain comparable and representative results required for a comparison of different seats with a suspension in the
x-direction. The effect of the WBV-magnitude on the WBV-transmissibility should be considered with the design, testing
and application of suspended seats.
r 2006 Elsevier Ltd. All rights reserved.
1. Introduction
Whole-body vibration (WBV) in x- and y-axis, fore and aft and lateral, respectively, is supposed tocontribute to the development of WBV-injuries of the lumbar spine [1,2]. The assumed strong effect could berelated to the relatively low shear strength of the lumbar spinal segments [3]. The weighting-factor 1.4 forthe evaluation of horizontal WBV with respect to health [1] reflects the assumed stronger effect compared tothe factor 1 in the case of vertical WBV. Driver seats with horizontal suspensions are an important measure toprotect the health of drivers.
ee front matter r 2006 Elsevier Ltd. All rights reserved.
v.2006.06.014
ing author. Tel.: +4930 515484432.
ess: [email protected] (R. Bluthner).

ARTICLE IN PRESSR. Bluthner et al. / Journal of Sound and Vibration 298 (2006) 627–637628
Current recommendations for testing suspension seats (e.g., Refs. [4,5]), just as a draft version for testingseats in horizontal directions elaborated within the European research project VIBSEAT [6], suggest twosubjects as test persons with a low and high body mass. The question remains open, if the results obtained withtwo test subjects can be considered as representative for persons with body masses between the extremestested. Hinz et al. [7] have shown that this assumption is doubtful, because the results of their experimentalstudy with 37 subjects could not corroborate the significance of the total body mass as the specific parameterfor the selection of test persons for testing seats in the z-direction. They recommended the consideration ofmore anthropometric parameters. Generally, the effect of the anthropometric characteristics of the testpersons on the mechanical behaviour of the complex system seat/man has been hardly ever systematicallyexamined. For this reason, other selected anthropometric parameters (cf. Ref. [7]) were additionallyconsidered in this study.
Up to now, test codes (e.g. Ref. [5]) do not require the examination of different magnitudes for one specificinput-spectral class derived for a group of machines. Because an effect of the vibration magnitude on theperformance of suspended seats was reported [8], three different vibration magnitudes with identical PSDs andtime series structures were investigated. Within the European Research Project VIBSEAT, this study aimed atexamining the significance of body mass and WBV-magnitude on the transmission of WBV with suspensionseats isolating in the x- and y-directions. An evaluation and comparison of different seats were not intended.The objectives of the European Research Project VIBSEAT are to develop a test method to evaluate theperformance of suspension seats in axes other than the vertical, to improve the understanding of the dynamicbehaviour of suspension seat in response to translational and rotational motions, and to develop theoreticaland physical suspension systems capable of improved seat performance in these axes.
2. Method
2.1. Operator seats
Two different prototypes of seats were used with suspensions not fully optimized yet. A truck seat (Seat 1)was equipped with a suspension in the x-axis while Seat 2 with suspensions in both, the x- and y-axis wasdesigned for a tractor. The suspensions of the seats in the z-axis were locked by an additional mechanicalfixture. The angle between the seat cushion and the seat base was about 101. The angle between the seatcushion and the backrest was 951 for Seat 1 and 1001 for Seat 2. The angles of legs and feet [5] were realizedwith an adjustable footrest. The subjects sat in an upright relaxed posture using the backrest and the handsresting on an adjustable horizontal support (aluminium bar) during the exposure. By means of an anatomicalgoniometer, the angles of the elbow joint (1251) and between the upper arm and upper trunk (351) wereadjusted by varying the positions of the hand support. The subjects were instructed to keep the postureconstant and to use the backrest during the vibration. Roll belts were used to guard the subject. Seat 1 had anintegrated lap and diagonal seatbelt, a lap belt was used for Seat 2. The suspension of Seat 2 was locked for thenon-excited direction.
2.2. Exposure
WBV-exposures were produced by the six DOF electro-hydraulic hexapod with a control system (FCSControl Systems B.V., The Netherlands). The guidelines for human experiments with WBV [9] were observed.Simplified typical PSD-patterns of acceleration were created by using FCS-software with frequency contentsand magnitudes similar to field measurements recorded at the cabin floor of the vehicles by partners within theEU Research Project VIBSEAT [6]. Based on these artificial PSDs, time series of acceleration with thefrequency content of the created PSDs were used as desired signals with the lowest magnitude (M1). For Seat1, a signal similar to that of a truck in x-direction was used and for Seat 2, the signals resembling those of atractor in x- and y-directions were applied. To test the specific seats with different magnitudes the signalscreated with the magnitude 1 (M1) were increased by 3 and 6 dB for M2 and M3, respectively, by multiplyingthe desired accelerations in the time domain. This procedure was used in order to minimize a possibleinteraction effect of the magnitude and time series structure. Control files for the Hexapod-simulator to realize
ARTICLE IN PRESS
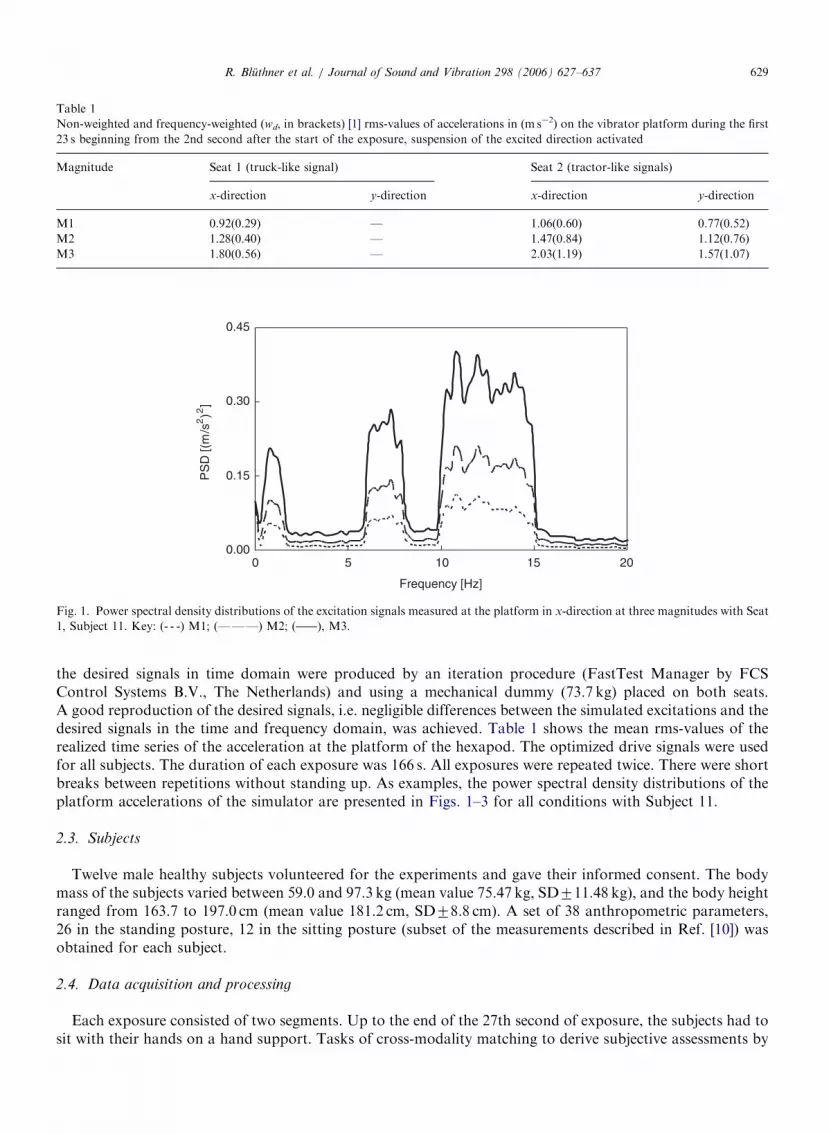
Table 1
Non-weighted and frequency-weighted (wd, in brackets) [1] rms-values of accelerations in (m s�2) on the vibrator platform during the first
23 s beginning from the 2nd second after the start of the exposure, suspension of the excited direction activated
Magnitude Seat 1 (truck-like signal) Seat 2 (tractor-like signals)
x-direction y-direction x-direction y-direction
M1 0.92(0.29) — 1.06(0.60) 0.77(0.52)
M2 1.28(0.40) — 1.47(0.84) 1.12(0.76)
M3 1.80(0.56) — 2.03(1.19) 1.57(1.07)
0.00
0.15
0.30
0.45
0 5 10 15 20
Frequency [Hz]
PS
D [(
m/s
2)2
]
Fig. 1. Power spectral density distributions of the excitation signals measured at the platform in x-direction at three magnitudes with Seat
1, Subject 11. Key: (- - -) M1; (———) M2; ( ), M3.
R. Bluthner et al. / Journal of Sound and Vibration 298 (2006) 627–637 629
the desired signals in time domain were produced by an iteration procedure (FastTest Manager by FCSControl Systems B.V., The Netherlands) and using a mechanical dummy (73.7 kg) placed on both seats.A good reproduction of the desired signals, i.e. negligible differences between the simulated excitations and thedesired signals in the time and frequency domain, was achieved. Table 1 shows the mean rms-values of therealized time series of the acceleration at the platform of the hexapod. The optimized drive signals were usedfor all subjects. The duration of each exposure was 166 s. All exposures were repeated twice. There were shortbreaks between repetitions without standing up. As examples, the power spectral density distributions of theplatform accelerations of the simulator are presented in Figs. 1–3 for all conditions with Subject 11.
2.3. Subjects
Twelve male healthy subjects volunteered for the experiments and gave their informed consent. The bodymass of the subjects varied between 59.0 and 97.3 kg (mean value 75.47 kg, SD711.48 kg), and the body heightranged from 163.7 to 197.0 cm (mean value 181.2 cm, SD78.8 cm). A set of 38 anthropometric parameters,26 in the standing posture, 12 in the sitting posture (subset of the measurements described in Ref. [10]) wasobtained for each subject.
2.4. Data acquisition and processing
Each exposure consisted of two segments. Up to the end of the 27th second of exposure, the subjects had tosit with their hands on a hand support. Tasks of cross-modality matching to derive subjective assessments by

ARTICLE IN PRESS
0.000.00 5.00 10.00 15.00 20.00
0.20
0.40
0.60
0.80
Frequency [Hz]
PS
D [(
m /s
2 )2 ]
Fig. 2. Power spectral density distributions of the excitation signals measured at the platform in x-direction at three magnitudes with
Seat 2, Subject 11. Key: (- - -) M1; (———) M2; and ( ) M3.
0.000.00
0.20
0.40
0.60
5.00 10.00 15.00 20.00Frequency [Hz]
PS
D [(
m/s
2 )2 ]
Fig. 3. Power spectral density distributions of the excitation signals measured at the platform in y-direction at three magnitudes with
Seat 2, Subject 11. Key: (- - -) M1; (———) M2; ( ) M3.
R. Bluthner et al. / Journal of Sound and Vibration 298 (2006) 627–637630
a mouse-controlled scale and measurements of reaction times by using pedals as performance tests wereperformed between the 28th and 166th seconds [11]. The move of the right hand and the right foot duringthese tasks could have an influence on the acceleration at the seat and backrest.
According to the recommendations of the draft test code [6], it was desirable to measure cross-axisaccelerations at the present state.
The accelerations in x-, y-, and z-directions were measured at the platform, at the seat frame, on the seatcushion and the backrest. A metal block Endevco 7290 (Endevco, USA) with three accelerometers Endevco7290A-10 was fixed on the platform under the midpoint of the seat. A block with three accelerometers of thesame type was mounted on the seat frame located above the suspension. The accelerations on the seat cushionand the backrest were measured with accelerometers Endevco 65-100 in seat pads Endevco 2560.
A Wavebook (IOtech, USA) with a module WBK16 for sensors 7290A-10 and a module WBK 14 for theICP-sensors Endevco 65-100 in the seat pads was used for conditioning and digitizing the acceleration signals.The sampling frequency was 1000Hz. The hardware filters for antialiasing were set to 225Hz for WBK 16 and250Hz for WBK 14. All data were stored on a notebook. Programmes written in Matlab were used for dataprocessing and calculation of the SEAT-values [6,12]. The SEAT-values were calculated as ratio of thefrequency weighted r.m.s. acceleration at the seat cushion divided by the frequency weighted rms accelerationat the seat base according to
SEATðxÞ ¼ ðPxsðf ÞS2ðf Þdf Þ1=2=ðPxbðf ÞS
2ðf Þdf Þ1=2 (1)

ARTICLE IN PRESSR. Bluthner et al. / Journal of Sound and Vibration 298 (2006) 627–637 631
for the x-direction where Pxs(f) is the power spectral density of the acceleration measured at the seat cushionand Pxb(f) is the power spectral density of the acceleration measured at the platform in x-direction and
SEATðyÞ ¼ ðPysðf ÞS2ðf Þdf Þ1=2=ðPybðf ÞS
2ðf Þdf Þ1=2 (2)
for the y-direction where Pys(f) is the power spectral density of the acceleration measured at the seat cushionand Pyb(f) is the power spectral density of the acceleration measured at the platform in y-direction. Theweightings S(f) specified in ISO 2631-1 [1] were used. Analogues SEAT values were calculated for thetransmission from the seat base on the platform to the seat frame.
These parameters were calculated for two periods: (a) for 23 s beginning from the 2nd second after the startof the excitation designated as ‘‘short’’, i.e. during the period of motionless hands and feet and (b) for 162 sbeginning from the 2nd second after the start of the excitation, i.e. for nearly the whole exposure duration,designated as ‘‘long’’.
SPSS (version 11.5.1) was used for statistics (General linear model repeated measures, univariate analysis ofvariance for testing the effects of factors magnitude and repetition, Bonferroni adjustment for the post hoctests comparisons of mean values, significance level po0.05, multiple linear regression analysis method withstepwise variable entry and removal for the prediction of SEAT-values.)
3. Results
3.1. Effects of repetition and duration of time series
The factor repetition had no significant effect on the SEAT values with one exception. The SEAT values(cushion) of the second repetition of the ‘‘short’’ time series of Seat 1 with the highest intensity M3 inx-direction were about 0.4 percent significantly smaller than those of the first repetition. Systematic differencesbetween SEAT values (cushion and frame) calculated from ‘‘long’’ and ‘‘short’’ time series were not observedfor both seats in the x-axis. In the y-axis, SEAT values determined from ‘‘long’’ time series with Seat 2 wereuniformly larger than SEAT values determined from ‘‘short’’ time series. Under this condition, the mean rms-values of weighted accelerations at the platform were identical for the ‘‘short’’ and ‘‘long’’ time series, themaximum mean differences amounted to 0.0020, 0.0035 and 0.0036m s�2 for M1, M2 and M3, respectively.The rms-values of weighted accelerations in the y-axis at the frame and cushion, however, were larger with‘‘long’’ time series, thus explaining the higher SEAT values and indicating an effect of the human activitiesduring cross-modality matching and performance tests. Therefore, the SEAT values derived from ‘‘short’’ timeseries were used mainly in order to exclude an influence of voluntary, performance test-related movements onthe results.
3.2. Effect of the vibration magnitude
The factor magnitude had a significant effect on all but one SEAT-value calculated for the frame andcushion, ‘‘short’’ duration. The SEAT-values (frame) of Seat 2 in x-direction did not exhibit a significantinfluence of the vibration magnitude. Significant differences between the means of SEAT-values are given inthe legends to Figs. 4 and 5.
Fig. 4 shows the mean values and standard deviations of the SEAT values obtained at three magnitudes forSeat 1, x-direction, ‘‘short’’ duration. The ranges of values were smaller for the frame (Fig. 4a) than for thecushion (Fig. 4b). For both measurement points, the mean SEAT values decreased significantly with anincreasing vibration magnitude except the non-significant decrease from M1 to M2 at the cushion.
The SEAT values of Seat 2 were considerably higher than 1 for both, the seat frame (Fig. 5a) and the seatcushion (Fig. 5b). Larger ranges of values were observed for the cushion as with Seat 1. The weightedaccelerations measured at the cushion were higher than those at the frame.
The ranges of SEAT values in the y-axis, Seat 2, were of the same order of magnitude for the frame (Fig. 6a)and cushion (Fig. 6b). The SEAT-values for the cushion were higher than the SEAT-values for the frame. Thefactor magnitude had a significant effect on the SEAT values for the frame and cushion. At both points, theSEAT values decreased with the increasing magnitude.

ARTICLE IN PRESS
N = 24M1
24M2
24M3
SE
AT
x f/
p S
eat 1
0.98
0.96
(a)
1.00
1.02
1.04
N = 24M1
24M2
24M3
SE
AT
x c
/p S
eat 1
0.98
0.96
1.00
1.02
1.04
(b)
Fig. 4. Mean values71 standard deviation of SEAT values (12 subjects, two runs) calculated for the frame/platform (f/p, a) and cushion/
platform (c/p, b) of Seat 1, x-direction, ‘‘short’’ duration. Significant differences (P ¼ 0.05): a—M1/M2, M1/M3, M2/M3; b—M1/M3,
M2/M3.
N = 24M1
24M2
24M3
SE
AT
x f/
p S
eat 2
(a)
1.24
1.26
1.28
1.30
1.32
1.34
1.36
1.38
N = 24M1
24M2
24M3
SE
AT
x c
/p S
eat 2
1.24
1.26
1.28
1.30
1.32
1.34
1.36
1.38
(b)
Fig. 5. Mean values71 standard deviation of SEAT values (12 subjects, two runs) calculated for the frame/platform (f/p, a) and cushion/
platform (c/p, b) of Seat 2, x-direction, ‘‘short’’ duration. Significant differences (P ¼ 0.05): a—no; b—M1/M2, M1/M3.
N = 24M1
24M2
24M3
SE
AT
y f/
p S
eat 2
(a)N = 24
M124M2
24M3
SE
AT
y c
/p S
eat 2
0.82
0.84
0.86
0.88
0.90
0.92
0.94
0.96
0.98
0.82
0.84
0.86
0.88
0.90
0.92
0.94
0.96
0.98
(b)
Fig. 6. Mean values71 standard deviation of SEAT values (12 subjects, two runs) calculated for the frame/platform (f/p, a) and cushion/
platform (c/p, b) of Seat 2, y-direction, ‘‘short’’ duration. Significant differences (P ¼ 0.05): a—M1/M3, M2/M3; b—M1/M2, M1/M3,
M2/M3.
R. Bluthner et al. / Journal of Sound and Vibration 298 (2006) 627–637632

ARTICLE IN PRESSR. Bluthner et al. / Journal of Sound and Vibration 298 (2006) 627–637 633
3.3. Relationship between SEAT values, body mass and other anthropometric parameters
The relation between the SEAT values and body masses are demonstrated in Fig. 7 for all magnitudes of theexcitation in x-direction, a for Seat 1 and b for Seat 2. As the results of the linear regressions with aninsignificant share of the explained variance demonstrated, a systematic relationship between SEAT valuesand body mass has not been observed. The highest SEAT values were observed for the subjects with a mediumbody mass. Significant linear relationships between body masses and the SEAT values were found for theexcitations in y-direction for Seat 2 (Fig. 8). The highest SEAT values were obtained for the lightest subjects.
Other anthropometric characteristics revealed relationships to SEAT values and enabled their prediction(Table 2), except from those of Seat 1 at the lowest and highest magnitudes. Height measures were importantfor the prediction of SEAT values of Seat 1 at the medium magnitude. A combination of anthropometricheight, depth and breadth measures was included for the prediction of SEAT values, x-direction, Seat 2.Mainly breadth measures were selected by the regression analysis for the prediction of SEAT-values,y-direction, Seat 2.
SE
AT
x c
/p S
eat 1
(a) Body mass [kg]
50 60 70 80 90 100
Body mass [kg]
50 60 70 80 90 100
SE
AT
x c
/p S
eat 2
1.20
1.30
1.40
1.50
1.00
0.94
0.96
0.98
1.02
1.04
1.06
1.08
(b)
Fig. 7. Scatterplot of SEAT values, x-direction, ‘‘short’’ duration, calculated for the cushion/platform (c/p) and body mass of test persons
(abscissa), Seat 1 (a) and Seat 2 (b). Coefficients of determination (linear regression) Seat 1, Magnitude (M) 1—0.0029, M2—0.1191,
M3—0.0283; Seat 2, M1—0.0006, M2—0.0095, M3—0.0232. Key: (.) Magnitude 1; (J) Magnitude 2; and (m) Magnitude 3.
50 60 70 80 90 100
Body mass [kg]
0.84
SE
AT
y c
/p S
eat 2
0.86
0.88
0.90
0.92
0.94
0.96
0.98
1.00
1.02
Fig. 8. Scatterplot of SEAT values and regression lines, y-direction, ‘‘short’’ duration, calculated for the cushion/platform (c/p) and body
mass of test persons (abscissa), Seat 2. Key: (.) and (– – –), Magnitude 1; (J) and ( ) Magnitude 2; (m) and ( ) Magnitude 3.
Coefficients of determination (linear regression) Magnitude M1—0.8629, M2—0.8460, and M3—0.8189.

ARTICLE IN PRESS
Table 2
Results of the multiple linear regression analysis for the prediction of the SEAT-values calculated for the cushion, ‘‘short’’ duration
(c/p short), by anthropometric measurements [10] of 12 subjects
Direction,
magnitude
Seat Predictors Adjusted
R2
x, M1 1 —
x, M2 1 L4 height (+), shoulder height (�), seated height (+), chest breadth (+), bi-
deltoidal shoulder width (�), body height (�), shoulder breadth (�)
0.964
x, M3 1 Greatest sagittal diameter of the abdomen sit (�) 0.149
x, M1 2 Elbow breadth (+), greatest sagittal diameter of the abdomen sit (�), chest
depth (+), buttocks–knee-length (�)
0.799
x, M2 2 Greatest sagittal diameter of the abdomen sit (�), elbow breadth (+), inferior
height of the scapula sit (�), wrist width (+), height of the ankle (�)
0.857
x, M3 2 Greatest sagittal diameter of the abdomen sit (�), elbow breadth (+), inferior
height of the scapula sit (�), spinal breadth (+)
0.803
y, M1 2 Body mass (�), knee breadth (�), chest breadth (+), wrist width (�), bi-
deltoidal shoulder width (+), ankle breadth (+)
0.981
y, M2 2 Body mass (�), wrist width (�) 0.900
y, M3 2 Hip breadth (�), shoulder breadth (�), buttocks–knee-length (+), elbow
breadth (�), circumferenc of the shank (+), chest circumference (�)
0.960
Predictors are listed according to their order in the stepwise procedure of linear multiple regressions with the sign of the regression
coefficient given in brackets. All lengths, breadths, depths, and circumferences in cm, body mass in kg. x–x-direction, y–y-direction,
M—magnitude.
R. Bluthner et al. / Journal of Sound and Vibration 298 (2006) 627–637634
4. Discussion
Since the systematic effect of the repetition was either missing or extremely small, the combination of bothrepetitions is justified. Considering the identical tendencies of SEAT values calculated from ‘‘long’’ and‘‘short’’ time series, the results of the ‘‘short’’ time series can be considered as representative. The resultsobtained with short signals enabled the detection of seemingly small effects and were not, therefore,considered as a shortcoming of the study.
Moderate changes of the posture and small voluntary movements joined with the performance tests hadprobably a certain, but not an essential effect. One may assume that the alternation of the left and right footpedals for brake and acceleration (cf. Ref. [11]) had a greater effect on the ‘‘long’’ time series of the cushionacceleration in y-axis than in x-axis. Hence, the minor variation of these factors cannot explain the differencesof results when different laboratories test the same seat with subjects of a nearly identical body mass.
SEAT values depend also on the frequency content of excitation [8]. Since the factors ‘‘frequency ofexcitation’’ and ‘‘seat’’ were inseparably mixed in our study, the different effects of the magnitude on theSEAT-values of both seats in the x-direction cannot be referred to one of these factors without additionalinformation. The inspection of the transfer and coherence functions of the acceleration in the x-direction fromthe seat base to the seat cushion calculated by the cross-spectral density method using MATLAB-routinesshowed clear differences between seats exemplified with Fig. 9. The transfer functions of Seat 1 (Fig. 9a)demonstrate a marked effect of the magnitude in a sense of a distinct improvement of the attenuation ofvibration across the whole frequency range. Those of Seat 2 reveal a moderate effect of the magnitude with adeterioration of the isolation between about 6 and 15Hz (Fig. 9c). There are several factors that can help toexplain these findings. Above about 4Hz, the moduli of the transfer functions between the seat base and theseat cushion with the x-suspensions locked (Fig. 10) suggest a somewhat greater mechanical stability of Seat 1than of Seat 2 when the magnitude increases.
With the locked suspension, the peak magnitudes of the transfer functions of both seats show a minor shifttowards lower frequencies that may be caused by the nonlinearity of the apparent mass function [13] via aninteraction between the subject and the seat.
The obvious missing isolating effect of the x-suspension of Seat 1 with the low magnitude could have beenproduced by the Coulomb friction that stops the suspension working when the input vibration is at a low level [8].

ARTICLE IN PRESSM
odul
us
(a)
0 5 10 15 20
Frequency [Hz]0 5 10 15 20
Coh
eren
ce0
1
0.2
0.4
0.6
0.8
Coh
eren
ce
0
1
0.2
0.4
0.6
0.8
0.60.8
0.0
2.0
0.20.4
1.0
1.41.2
1.61.8
Mod
ulus
(c) Frequency [Hz] Frequency [Hz]
0 5 10 15 20
0.60.8
0.0
2.0
0.20.4
1.0
1.41.2
1.61.8
(d)
0 5 10 15 20Frequency [Hz](b)
Fig. 9. Moduli of the transfer functions (a, c) and coherence functions (b, d) between the accelerations at the seat base and the
accelerations at the cushion in x-direction, Subject 1, exposures with magnitudes M1, M2 and M3 (cf. Table 1), Seat 1 (a, b) and
Seat 2 (c, d), x-suspensions activated. Key: (- - -) M1; (———) M2; and ( ) M3.
R. Bluthner et al. / Journal of Sound and Vibration 298 (2006) 627–637 635
The x-suspension of both seats leads at the high input level to shifts of the peak magnitudes of the transferfunctions towards lower frequencies, accompanied by either a diminution or amplification of the vibrationinput to Seats 1 or 2, respectively. Due to the frequency weighting [1], the more effective diminution of higherfrequencies by Seat 2 cannot compensate the unfavourable effect at lower frequencies. As the transferfunctions illustrate (Figs. 9 and 10), the complex ‘seat-human’ is not a simple mechanical system.
Although the differences between mean values of SEAT values obtained under different conditions for thesame seat may seem to be small, the interpretation with respect to the practical significance of the resultsshould consider: (i) the larger between-subject differences which gain importance, if only two subjects wouldbe tested as recommended in current test codes; (ii) the significance of apparently small differences for theselection of the best suited seat for a certain type of machinery by the ultimate buyer; and (iii) the statisticalsignificance of differences.
One striking similarity of both seats is obvious with the x-direction—the missing systematic effect of bodymass on the SEAT-values. The absent correlation contradicts usual expectations and assumptions [4–6,8,14].The missing effect of the body mass with the low magnitude and Seat 1 is intelligible because of the missingeffect of the suspension (Figs. 9 and 10a). The large difference between the explained variances at the twohigher magnitudes (Table 2, Seat 1, M2 and M3) cannot be explained with the existing data. One mightspeculate that the transition from a pronounced correlation of anthropometric characteristics with thevibration transmission to a nearly missing correlation was caused by an increased involuntary effort tocounteract the vibration, e.g., by a higher muscle tension. The frequent inclusion of the greatest sagittaldiameter of the abdomen measured in the sitting posture could be interpreted as a hint to the importance ofmass distribution within the human body for the SEAT-value instead of the total body mass.
The total body mass was the dominating predictor for the SEAT-value in the y-direction at magnitudes M1and M2. With the highest magnitude M3, the hip breadth became the most important predictor, although thebody mass correlated with the SEAT-value, too (cf. Fig. 8). The significance of the length of lever arms forstabilizing the body in the frontal plane is a conceivable explanation for the importance of the hip breadth.

ARTICLE IN PRESS
0.00.20.4
0.60.81.0
0.0
0.2
0.4
0.6
0.8
1.0
1.21.4
1.61.8
2.0
0 5 10 15 20
Frequency [Hz]
Mod
ulus
0.00.20.4
0.60.81.0
1.21.4
1.61.8
2.0
Mod
ulus
(a)
0 5 10 15 20
Frequency [Hz]
Frequency [Hz]Frequency [Hz]
Coh
eren
ce
0.0
0.2
0.4
0.6
0.8
1.0
Coh
eren
ce
(b)
0 5 10 15 20
(c) (d)
0 5 10 15 20
Fig. 10. Moduli of the transfer functions (a, c) and coherence functions (b, d) between the accelerations at the seat base and the
accelerations at the cushion in x-direction, Subject 1, exposures with magnitudes M1, M2 and M3 (cf. Table 1), Seat 1 (a, c) and Seat 2 (b,
d), x-suspensions locked. Key: (- - -) M1; (———) M2; ( ) M3.
R. Bluthner et al. / Journal of Sound and Vibration 298 (2006) 627–637636
The decreasing range of SEAT-values (cushion) with a rising magnitude (cf. Fig. 6b) might be linked withthe transition to a simpler biodynamic behaviour of the human body. Based on experimental data obtainedwith a rigid seat, Holmlund and Lundstrom [15] assumed the body to act as a two-mass system during lowvibration magnitudes and as a one mass system at higher ones [15]. Recent findings [13] confirmed thishypothesis.
5. Conclusions
Although the following conclusions were derived from experiments with only two driver seats, they rely on asufficient number of subjects and can be considered as a good starting point for further research anddevelopment. Possible direction-dependent relationships between the body mass and the WBV-transmissionby suspended seats should be taken into account with the development of future standardized test procedures.Tests with only two subjects of extreme body weight may be not suited to obtain comparable andrepresentative results that enable a comparison of different seats with a suspension for the x-direction. Otheranthropometric characteristics can correlate closer with the transmission of vibration by seats with horizontalsuspensions. These characteristics could be considered as criteria for the choice of test subjects in future testcodes. They may also be of importance for the development of mathematical models that can be used duringthe design process. The effects of the vibration magnitude on the vibration transmission suggest theconsideration of the former when the range of application of such seats is known and shall be taken intoaccount.
ARTICLE IN PRESSR. Bluthner et al. / Journal of Sound and Vibration 298 (2006) 627–637 637
Acknowledgements
This work was supported by the European Commission ‘VIBSEAT’ project, contract no. G3RD-CT-2002-00827. The authors acknowledge the help and assistance by Dr. J. Keitel and Dipl.-Ing. L. Gericke.
References
[1] International Organization for Standardization ISO 2631-1, Mechanical vibration and shock—evaluation of human exposure to
whole-body vibration—part 1: general requirements, second ed., 1997.
[2] H. Seidel, On the relationship between whole-body vibration exposure and spinal health risk, Industrial Health 43 (2005) 361–377.
[3] H. Seidel, R. Bluthner, B. Hinz, M. Schust, Stresses in the lumbar spine due to whole-body vibration containing shocks (Final report),
Wirtschaftsverlag NW (Schriftenreihe der Bundesanstalt fur Arbeitsschutz und Arbeitsmedizin: Forschung FB 777), Bremerhaven,
1997.
[4] International Organization for Standardization ISO 10326, Mechanical vibration—laboratory method for evaluating vehicle seat
vibration—part 1: basic requirements, 1992.
[5] International Organization for Standardization ISO 7096, Earth moving machinery, laboratory evaluation of operator seat vibration,
2000.
[6] T. Gunston, P. Clement, Laboratory test protocol for evaluating vehicle seat vibration, Draft version no. 7 dated January 2005,
Technical Report for the Competitive and Sustainable Growth Programme VIBSEAT G3RD-CT-2002-00827, 2005, pp. 1–43.
[7] B. Hinz, G. Menzel, R. Bluthner, H. Seidel, Laboratory testing of operator seat vibration with 37 subjects—critical comment on
ISO/DIS 7096, Journal of Sound and Vibration 215 (1998) 977–988.
[8] R.M. Stayner, A.J. Scarlett, Whole-body vibration of farm workers—performance of suspended seats in the field, VDI-Berichte,
No. 1821, Humanschwingungen,, VDI Verlag GmbH, Dusseldorf, 2004, pp. 407–421.
[9] International Organization for Standardization ISO 13090-1, Mechanical vibration and shock—guidance on safety aspects of tests
and experiments with people—part 1: exposure to whole-body mechanical vibration and repeated shock, 1998.
[10] H.-J. Wilke, P. Neef, B. Hinz, H. Seidel, L. Claes, Intradiscal pressure together with anthropometric data—a data set for the
validation of models, Clinical Biomechanics 16 (2001) S111–S126.
[11] M. Schust, R. Bluthner, H. Seidel, Examination of perceptions (intensity, seat comfort, effort) and reaction times (brake and
accelerator) during low-frequency vibration in x- or y-direction and biaxial (xy-) vibration of driver seats with activated and
deactivated suspension. Journal of Sound and Vibration, in press, doi:10.1016/j.jsv.2006.06.029.
[12] M. J. Griffin, Evaluation of vibration with respect to human response, SAE Technical Paper Series 86047, 1986, pp. 11–34.
[13] B. Hinz, R. Bluthner, G. Menzel, S. Rutzel, H.-P. Wolfel, Apparent mass of seated men—determination with single-axis and multi-
axes excitations at different magnitudes, Paper Presented at the Third International Conference on Whole-Body Vibration Injuries,
Nancy, 7–9 June, 2005.
[14] P. Donati, A procedure for developing a vibration test method for specific categories of industrial trucks, Journal of Sound and
Vibration 215 (1998) 947–957.
[15] P. Holmlund, R. Lundstrom, Mechanical impedance of the human body in horizontal direction, Journal of Sound and Vibration 215
(1998) 801–812.