method for the determination of asbestos in
TRANSCRIPT
&EPA
..
·--·-··--···- ..... ----~
ironmental Protection Oevelcpment July 1993 f.ed States Office of Research a nd EP AJ6(J01l·H :IJ/'1 16
•ncr Washington, oc_ 20460 . . I 'I -Test Method iO~i111rooM"ii~Mo
2000748
ADMINISTRATIVE RECORD Method for the Determination of Asbestos in Bulk Building Materials
TEST :METHOD
EPA16001R-931116 JuJyl993
METHOD FOR THE DETEAAfiNA TION OF ASBESTOS IN BULK BUILDING MA TERIA.LS
by
R. L. Perkins and B. W. Harvey
EPA Project Officer Michael E. Beard
Atmospheric Research and Exposure Assessment Laboratory U.S. Environmental Protection Agency
Research Triangle Park, NC 27709
EPA Contracts Nos. 68024550 and 68010009 RTI Project No. 91 U-5960-181
June l993
@ Pnrued on Recycled Paper
DISCLAIMER
The information in this document has been funded wholly or in part by che United States
Environmental Protection Agency under Contracts 68-02-4550 and 680 10009 to the Methods
Research and Development Division, Atmospheric Research and Exposure Assessment
Laboratory, Research Triangle Parle, North Carolina. It has been subjected to the Agency's
peer and administrative review, and it has been approved for publication as an EPA
document. Mention of trade names or commercial products does not constitute endorsement
or recommendation for use. ~
. ....... ··· · · -------_.....~
SECTION
1.0 INTRODUCTION 1.1 References
TABLE OF CONTENTS
I
3
2.0 1'-IETHODS . . . . . . . . . . . . . . . . . . . . . . . . . . . . . . . . . . . . . . . . . . . . . . . . . . . . . . . . 3 2.1 Sten!Omicroscopic Examin:ltion . . . . . . . . . . . . . . . . . . . . . . . . . . . . . . . . . . . . . . . . . 3
2.1. 1 Applicability . . . . . . . . . . . . . . . . . . . . . . . . . . . . . . . . . . . . . . . . . . . . . . . . . 4
'2.1.2 Range . ... .. . : . . . . . . . . . . . . . . . . . . . . . . . . . . . . . . . . . . . . . . . . . . . . . 4 2.1 .3 ln terferenc~ . . . . . . . . . . . . . . . . . . . . . . . . . . . . . . . . . . . . . . . . . . . . . . . . . ~
1.1.4 Precision anu Accuracy . . . . . . . . . . . . . . . . . . . . . . . . . . . . . . . . . . . . . . ~
2. I~ Proc~ures . . ... .. ... . .. . .... . . ..... .. . . . ..... . .... . ... ·. . . . . . 5 2. 1.5 . I Sample Preparation . . . . . . . . . . . . . . . . . . . . . . . . . . . . . . . . . . . . . . . . 5 2.1.5 .2 Analysis . . .. . . . . . ..... . .. . .. . . . .. . .... . .. . ... . .. . ... .. 6
2. 1.6 Calibration Materials . . . . . . . . . . . . . . . . . . . . . . . . . . . . . . . . . . . . . . . . . . . . 3 2. l . 7 Rcfcrcncc:s ... .. . ... . . . .... . ... . . .. .. . . . ... .... ........ . . . ... . 8
2.2 Pol:1rized Light ~ficroscopy . . . . . . . . . . . . . . . . . . . . . . . . . . . . . . . . . . . . . . . . . . 9 2.2.1 Principle and Applicability . . . . . . . . . . . . . . . . . . . . . . . . . . . . . . . . . . . . . . . . 9 2.2.2 Range . . . . . . . . . . . . . . . . . . . . . . . . . . . . . . . . . . . . . . . . . . . . . . . . . . . . 10 2.2.3 Interferences . . . . . . . . . . . . . . . . . . . . . . . . . . . . . . . . . . . . . . . . . . . . . . . . 10 2 .2.4 Precision and Accuracy . . . . . . . . . . . . . . . . . . . . . . . . . . . . . . . . . . . . . . . . . 10 2.2.5 Proc¢dures . . . . . . . . . . . . . . . . . . . . . . . . . . . . . . . . . . . . . . . . . . . . . . . . . I I
2.2. 5. l Sample Preparation . . . . . . . . . . . . . . . . . . . . . . . . . . . . . . . . . . . . . . . II 2.2.5. 1. 1 Qualitative Analysis Pn:paracion . . . . . . . . . . . . . . . . . . . . . . . . 1 I 2. 2.5 . I. 2 Quantitative Analysis Preparation . . . . . . . . . . . . . . . . . . . . . . . 12
2.2.5 .2 Analysis . . . . . . . . . . . . . . . . . . . . . . . . . . . . . . . . . . . . . . . . . . . . IJ 2.2.5 .2.1 Identification . . . . . . . . . . . . . . . . . . . . . . . . . . . . . . . . . . . . IJ 2.2.5.2.2 Quantitation of Asb.:stos Content . . . . . . . . . . . . . . . . . . . . . . . 16
2. 2.5.2.3 Microscope Alignment . . . . . . . . . . . . . . . . . . . . . . . . . . . . . . 22 2.2.6 References . . . . . . . . . . . . . . . . . . . . . . . . . . . . . . . . . . . . . . . . . . . . . . . . . .,.,
2.3 Gravimetry . . . . . . . . . . . . . . . . . . . . . . . . . . . . . . . . . . . . . . . . . . . . . . . . . . . . 23 2.3.1 Principle and Applicability . . . . . . . . . . . . . . . . . . . . . . . . . . . . . . . . . . . . . . . 23 2 . 3. 2 lnterferencc:s . . . . . . . . . . . . . . . . . . . . . . . . . . . . . . . . . . . . . . . . . . . . . . . . 24 2.3 .3 Quantitation . . . . . . . . . . . . . . . . . . . . . . . . . . . . . . . . . . . . . . . . . . 25 2.3.4 Preliminary E~amination and Evaluation .. . ........... ..... . . .. .. . .. ~ . . 2.5 2.3.5 Sample Preparation . . . . . . . . . . . . . . . . . . . . . . . . . . . . . . . . . . . . . . . . . . . 26
2.3 .5.1 Drying . . . . . . . . . . . . . . . . . . . . . . . . . . . . . . . . . . . . . . . . . . . . . . 26 2. 3. 5. 2 . Homo~cnization/G rain Siu Rc:duction . . . . . . . . . . . . . . . . . . . . . . . . . . . 26
2.3.6 Proc¢dure for Ashing . . . . . . . . . . . . . . . . . . . . . . . . . . . . . . . . . . . . . . . . . . 27 2.3.7 USc: of Solvents for Removal of Organics . . . . . . . . . . . . . . . . . . . . . . . . . . . . . . 28 2.3. 8 Procedure for Acid Dissolution . . . . . . . . . . . . . . . . . . . . . . . . . . . . . . . . . . . . 29 2.3.9 Determination of Optimal Precision and Accuracy . . . . . . . . . . . . . . . . . . . . . . . . 3 I 2.3 . 10 References . . . . . . . . . . . . . . . . . . . . . . . . . . . . . . . . . . . . . . . . . . . . . . . . 31
2.4 X-Ray Powder Diffraction . . . . . . . . . . . . . . . . . . . . . . . . . . . . . . . . . . . . . . . . . . J2 2.4. 1 Principle and Applicability . . . . . . . . . . . . . . . . . . . . . . . . . . . . . . . . . . . . . . . J2 2.4.2 Range and Sensitivity . . . . . . . . . . . . . . . . . . . . . . . . . . . . . . . . . . . . . . . . . . 35 2.4. 3 Lirrutations . . . . . . . . . . . . . . . . . . . . . . . . . . . . . . . . . . . . . . . . . . . . . . . . 35
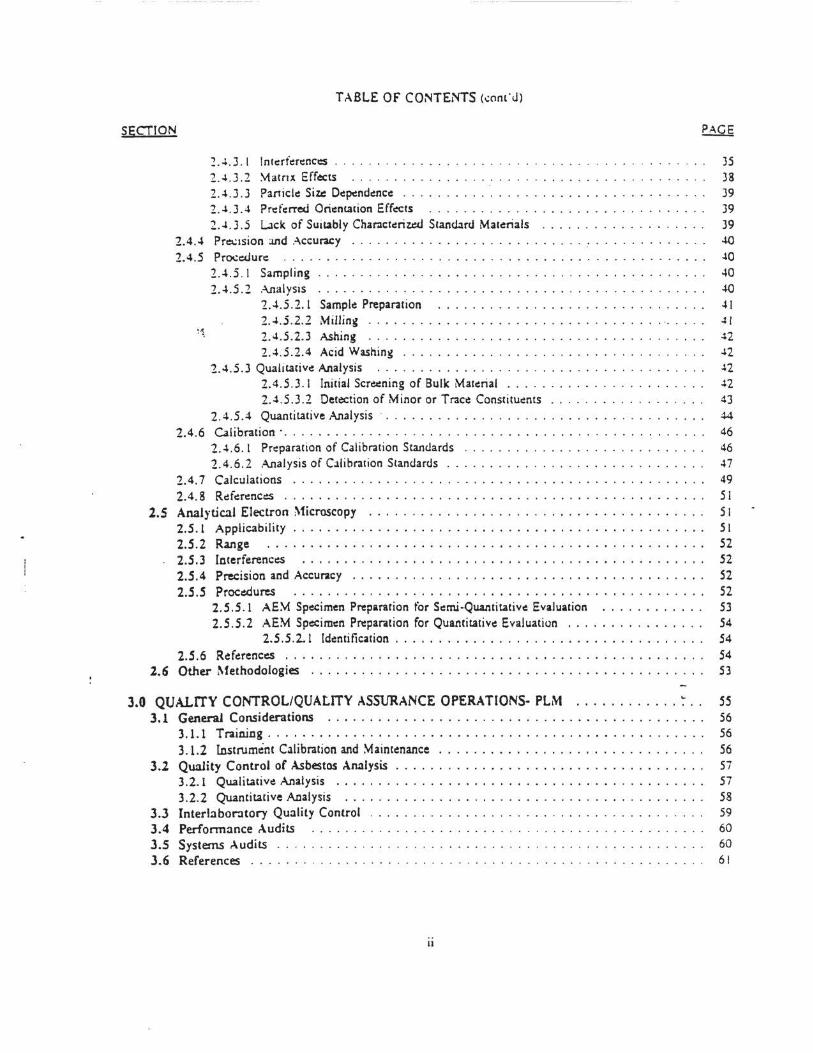
TABLE Of CONTENTS (.:ont 'u)
SECf!ON
2 .... 3.1 lntc:rfc:rc::nccs ... . ..... . . . .. . . . . . . ... . . . . . ... .. . .. . ... .. . 2 . .. . J . 2 ~alnx Eff~ts . . . . . . . . . . . . . . . . . . . . . . . . . . . . . . . . . . . . . .. . . 2A.J.J Particle Siz..: Oe~nd.mce ..... . .. . . · ...... ..... ....... .. .. . . . 2 ... . 3A Prd'c:rred Oric:ntation Effects .... . .... . . .. ... . .. . . . ... . .. ... . 2 ... . J .5 Lack of Suitably Charactc:riw.l Stand.lnJ Matc:rials .... . . ....... .. ... .
2.4.4 Pro;tsion :111d Accuracy . ......... .. . . . . . ...... ... . : . .. . . .... . . . . 2.4.5 Procc:.Uure . . . ..... .. . ... . ... .... . . .. ...... . .. . .... ..... ... .
2.~ . 5 . 1 Sampling .. . .. . . ...... ... .. . . ..... . ...... ... . .. .. . ... . 2 . ~.5.2 .~alysis ..... .. . .. . . .. ... .. . ..... .. ... . . . .. ..... .. . . .
2A.5.2.1 Sample: Preparation .... . .. ... . . ... . . .. ... . . . . . . .. . 2 . ~.5 . 2 . 2 Milling . ... . . .... . ...... . . .. ... .. . ....... .. . . . . 2.4 .5.1.3 Ashing .... . .... .. ... . ... ... ...... .. .. . . . .. . . . 2A.5.2.4 Acid Washin~ .. ..... . . .... . . .. . . . .... . .... . ... . .
2.4.5 .3 Qualitative: Analysis ... ... . ............ . . . .. .... . .. . .. ... . 2.4. 5 . 3. 1 Initial Screc:ning of Bulle Material .... . . . . .. . . .. . . . . . ... . 2A.5.3 .2 Detection of Minor or Trace: Constituc:nts ...... .. . . . . .... . .
2.4 .5.4 Quantitative Analysis · . . .. ........ .. .... . . . ... . .... . .. . . .. . 2.4.6 Calibration · . . .. .. .... . .......... . . . .. . ... . . ... . . ......... . . .
35 38 39 39 39 ~
40 40 ~
41 ~I
~2
..2 42 n 43 44
46 2.4.6. 1 Prc:paration of Calibration Standards . . . . . . . . . . . . . . . . . . . . . . . . . . . . 46 2.4.6.2 .'\nalysis of Cllibration Stanclarcls . . . . . . . . . . . . . . . . . . . . . . . . . . . . . . 47
2.4. 7 Calculations . . . . . . . . . . . . . . . . . . . . . . . . . . . . . . . . . . . . . . . . . . . . . . . . 49 2.4.8 Rc:fc:renccs . . . . . . . . . . . . . . . . . . . . . . . . . . . . . . . . . . . . . . . . . . . . . . . . . 51
2.5 Analytical Electron Microscopy . . . . . . . . . . . . . . . . . . . . . . . . . . . . . . . . . . . . . . . 51 2.5 . 1 Applicability . . . . . . . . . . . . . . . . . . . . . . . . . . . . . . . . . . . . . . . . . . . . . . . . 51 2.5.2 Range . . . . . . . . . . . . . . . . . . . . . . . . . . . . . . . . . . . . . . . . . . . . . . . . . . . 52 2.5.3 Interferenc~ . . . . . . . . . . . . . . . . . . . . . . . . . . . . . . . . . . . . . . . . . . . . . . . 51 2.5.4 Precision and Accuracy . . . . . . . . . . . . . . . . . . . . . . . . . . . . . . . . . . . . . . . . . 51 2.5 .5 Proc~ures . . . . . . . . . . . . . . . . . . . . . . . . . . . . . . . . . . . . . . . . . . . . . . . . 51
2.5.5 .1 AE~ Specimen Preparation tor Sc:mi-Quantitativc: Evaluation . . . . . . . . . . . . 53 1.5.5.1 AEM Specimc:n Preparation for Quantitative: Evaluation . . . . . . . . . . . . . . . . 54
2.5 .5.2.1 Idc:ntification . . . . . . . . . . . . . . . . . . . . . . . . . . . . . . . . . . . . 54 2.5.6 Rc:fc:renc~ . . . . . . . . . . . . . . . . . . . . . . . . . . . . . . . . . . . . . . . . . . . . . . . . . 54
2.6 Other Methodologies . . . . . . . . . . . . . . . . . . . . . . . . . . . . . . . . . . . . . . . . . . . . . . 53
3.0 QUALITY CONTROL/QUALITY ASSURANCE OPERATIONS· PLM ... .. . ... . . . ~ . . SS 3.1 Genera! Considerations . . . . . . . . . . . . . . . . . . . . . . . . . . . . . . . . . . . . . . . . . . . . 56
3.1.1 Training . . . . . . . . . . . . . . . . . . . . . . . . . . . . . . . . . . . . . . . . . . . . . . . . . . . 56 3. 1.2 Instrument Calibration and Maintenance . . . . . . . . . . . . . . . . . . . . . . . . . . . . . . . 56
3.2 Quality Control of Asbestos Arullysis . . . . . . . . . . . . . . . . . . . . . . . . . . . . . . . . . . . . 57 3.2.1 Qualitative: Analysis . . . . . . . . . . . . . . . . . . . . . . . . . . . . . . . . . . . . . . . . . . . 57 3.2.2 Quantitative Analysis . . . . . . . . . . . . . . . . . . . . . . . . . . . . . . . . . . . . . . . . . . 58
3.3 Interlaboratory Quality Control . . . . . . . . . . . . . . . . . . . . . . . . . . . . . . . . . . . . . . . 59 3.4 Perfonnance Audits . . . . . . . . . . . . . . . . . . . . . . . . . . . . . . . . . . . . . . . . . . . . . . 60 3.5 Systems Audits . . . . . . . . . . . . . . . . . . . . . . . . . . . . . . . . . . . . . . . . . . . . . . . . . . 60 3.6 References . . . . . . . . . . . . . . . . . . . . . . . . . . . . . . . . . . . . . . . . . . . . . . . . . . . . . 61
II
,._ I· I ;; i ' ·
TABLE OF CONTENTS (cont'u)
APPENDIX A: GLOSSARY OF TERMS
APPENDIX 8: APPARATUS FOR SAMPLE PREPARATION AND ANALYSIS
APPENDIX C: PREPARATION AND USE OF CAUBRATlON STANDARDS FOR BULK ASBESTOS
APPENDIX D: SPECIAL-CASE BUILDING MATERIALS
Ill
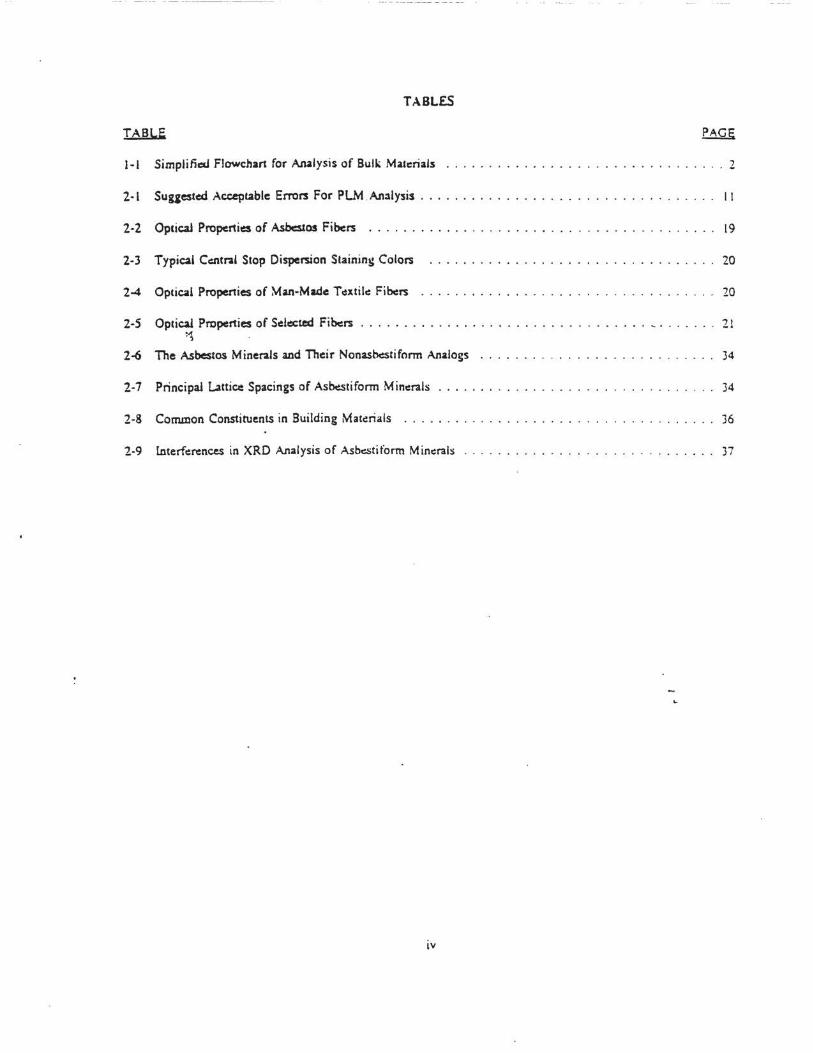
TABLES
TABLE
Simplified Flowchart for Analysis of BulL; Maacrials ..... . 2
2·1 Sugested Acceptable Error3 For PLM An:llysis ... .. . . ... . . .... . . . ........ .... l t
2·2 Optica.l Properties of Asbestos Fibcl'3 . . . . . . . . . . . . . . . . . . . . . . . . . . . . . . . . . . . . . . . . 19
2·3 Typical C.:ntral Stop Dispersion Stainin~ Colors .. . ..... . . ... 20
2-4 Optical Properties of Man-Made: T~xtilc Fibers 20
2·5 Optica.l Properties of Selected Fibers . .. .............................. ~ . . . . . . . 21 ~
2-6 The Asbestos Minerals and Thc:ir Nonas~tiform Analogs . . . . . . . . . . . . . . . . . . . . . . . . . . . 34
2-7 Principal Lattice: Spacings of Asbcstiform Minerals ................ . ........ . . . . .. . 34
2·8 Common Constituents in Building Matc:rials . . . . . . . . . . . . . . . . . . . . . . . . . . . . . . . . . . . . 36
2-9 lnterfc:rences in XRD Analysis of Asbestiform Minerals .............. . .. . ........... 37
IV
-·-·····---··-··- --- - -
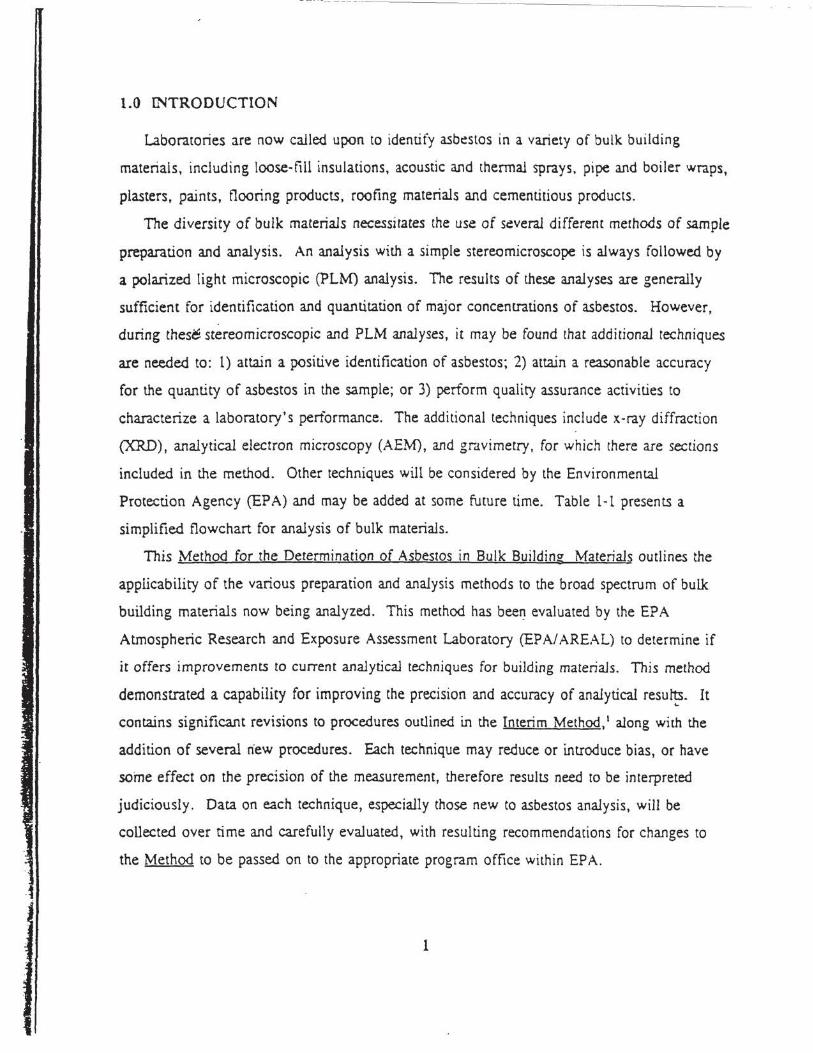
1.0 INTRODUCTION
Laboratories are now called upon to identify asbestos in a variety of bulk building
materials, including loose-fill insulations, acoustic and thennal sprays, pipe and boiler wraps,
plasters, paints, flooring products, roofing materials and cementitious products.
The diversity of bulk materials necessitates the use of several different methods of sample
preparation and analysis. An analysis with a simple stereomicroscope is always followed by
a polarized light microscopic (PLM) analysis. The results of these analyses are generally
sufficient for identification and quantitation of major concentrations of asbestos. However,
during these! scereomicroscopic and PLM analyses, it may be found that additional techniques
are needed to: 1) attain a positive identification of asbestos; 2) attain a reasonable accuracy
for the quantity of asbestos in the sample; or 3) perform quality assurance activities to
characterize a laboratory's performance. The additional techniques include x-ray diffraction
(XRD), analytical electron microscopy (AEM), and gro.vimetry, for which there are sections
included in the method. Other techniques will be considered by the Environmental
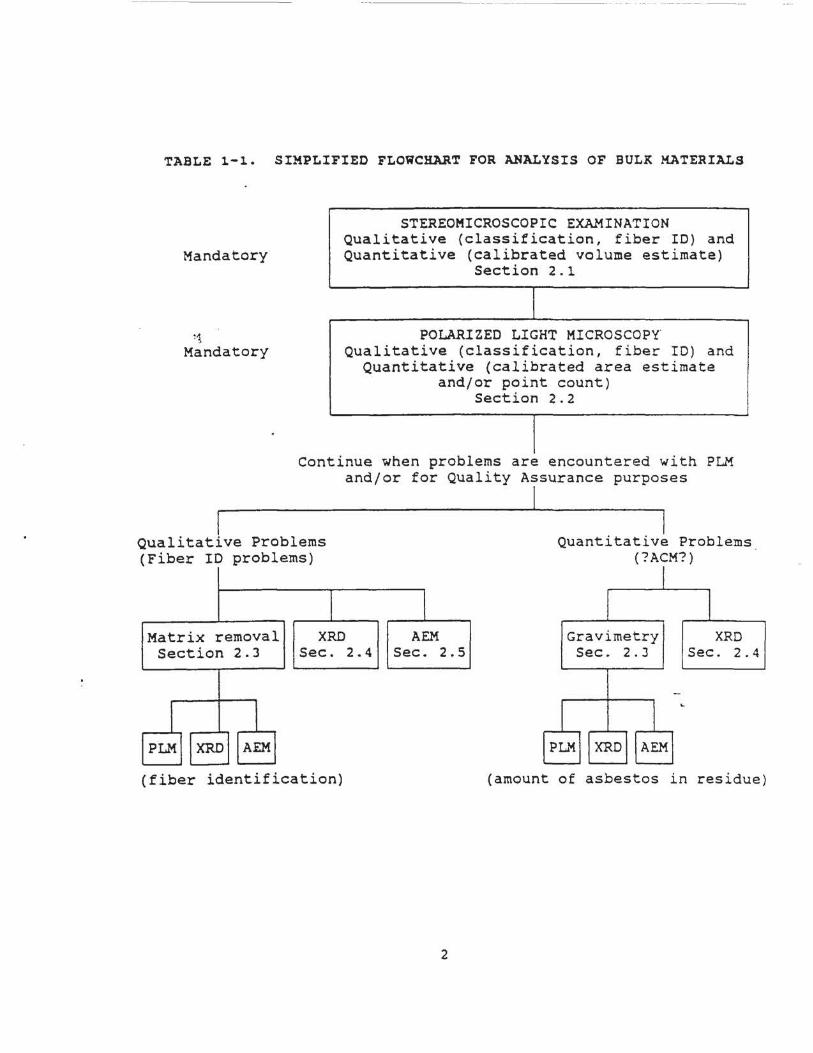
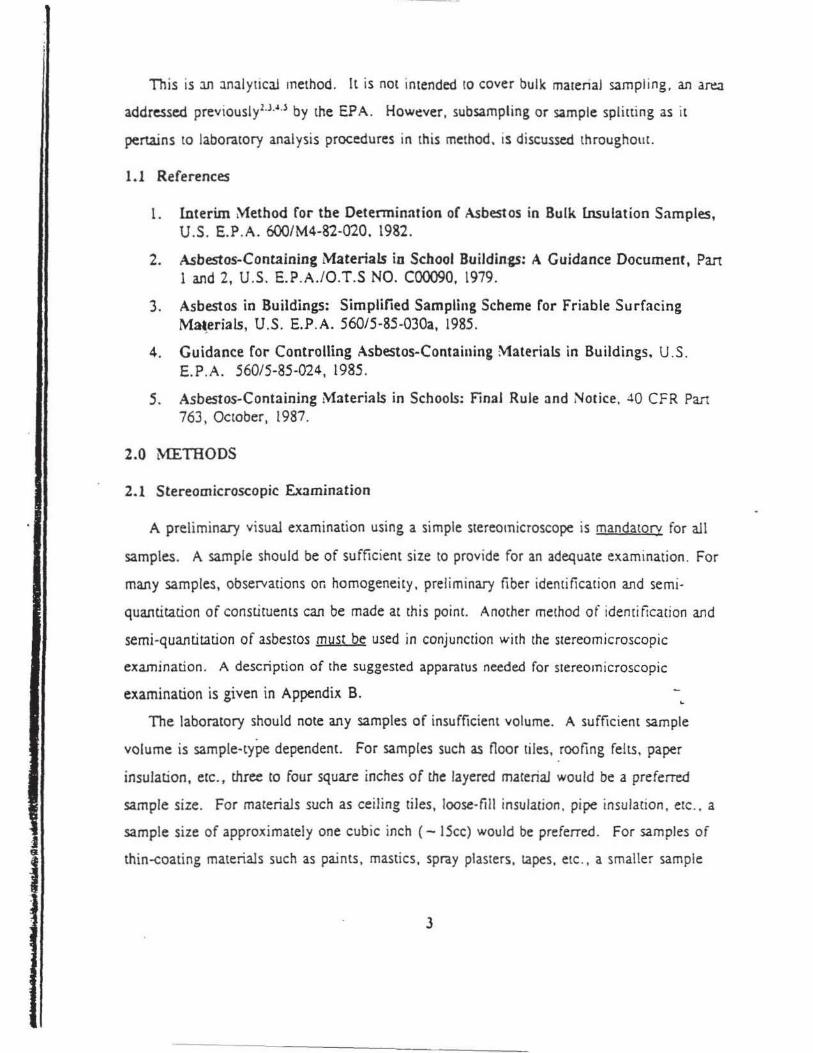
Protection Agency (EPA) and may be added at some future time. Table 1-l presents a
simplified flowchart for analysis of bulk materials.
This Method for the Determination of Asbestos in Bulk Building Materials outlines the
applicability of the various preparation and analysis methods to the broad spectrum of bulk
building materials now being analyzed. This method has beery evaluated by the EPA
Atmospheric Research and Exposure Assessment Laboratory (EPA/ AREAL) to determine if
it offers improvements to current analytical techniques for building materials. This method
demonstrated a capability for improving the precision and accuracy of analytical resuf!s. It
contains significant revisions to procedures outlined in the Interim Method, 1 along with the
addition of several n·ew procedures. Each technique may reduce or introduce bias, or have
some effect on the precision of the measurement, therefore results need to be interpreted
judiciously. Data on each technique, especially those new to asbestos analysis, will be
collected over time and carefully evaluated, with resulting recommendations for changes to
the Method to be passed on to the appropriate program office within EPA.
1
-----· ' .. ····· ···--··--··---·-
TABLE 1-1. SIMPLIFIED FLOWCHART FOR ANALYSIS OF BULK MATERIALS
Mandatory
~1
Mandatory
STEREOMICROSCOPIC EXAMINATION Qualitative (classification, fiber ID) and Quantitative (calibrated volume estimate)
Section 2 . 1
POLARIZED LIGHT MICROSCOPY Qualitative (classification, fiber ID) and
Quantitative (calibrated area estimate and/or point count )
Section 2.2
Continue when problems are encountered with PLM and/or for Quality Assurance purposes
Qualitative Problems (Fiber ID problems)
Matrix removal XRD AEM Section 2.3 Sec . 2.4 Sec. 2 . 5
(fiber identification)
2
Quantitative Problems (?ACM?)
Gravimetry Sec. 2. J
XRD Sec. 2. 4
(amount of asbestos in residue )
j
This is m analytical method. It is not intended to cover bulk material sampling. an area
addressed previously2•3·u by the EPA. However, subsampling or sample splitting as it
pertains to laboratory analysis procedures in this method. is discussed throughout.
1.1 References
l. Interim Method for the Determination of Asbestos in Bulk lnsulation Samples, U.S. E.P.A. 600/M4-82-020. 1982.
2. Asbestos-Containing Materials in School Buildings: A Guidance Document, Part 1 and 2, U.S. E.P.A./O.T.S NO. C00090. 1979.
3. Asbestos in Buildings: Simplified Sampling Scheme for Friable Surfacing Mat.erials, U.S. E.P.A. 560/5-85-030a, 1985.
4. Guidance for Controlling Asbestos-Containing Materials in Buildings. U.S. E.P.A. 560/5-85-024, 1985.
5. Asbestos-Containing Materials in Schools: Final Rule and Notice, :10 CFR Part 763, October, 1987.
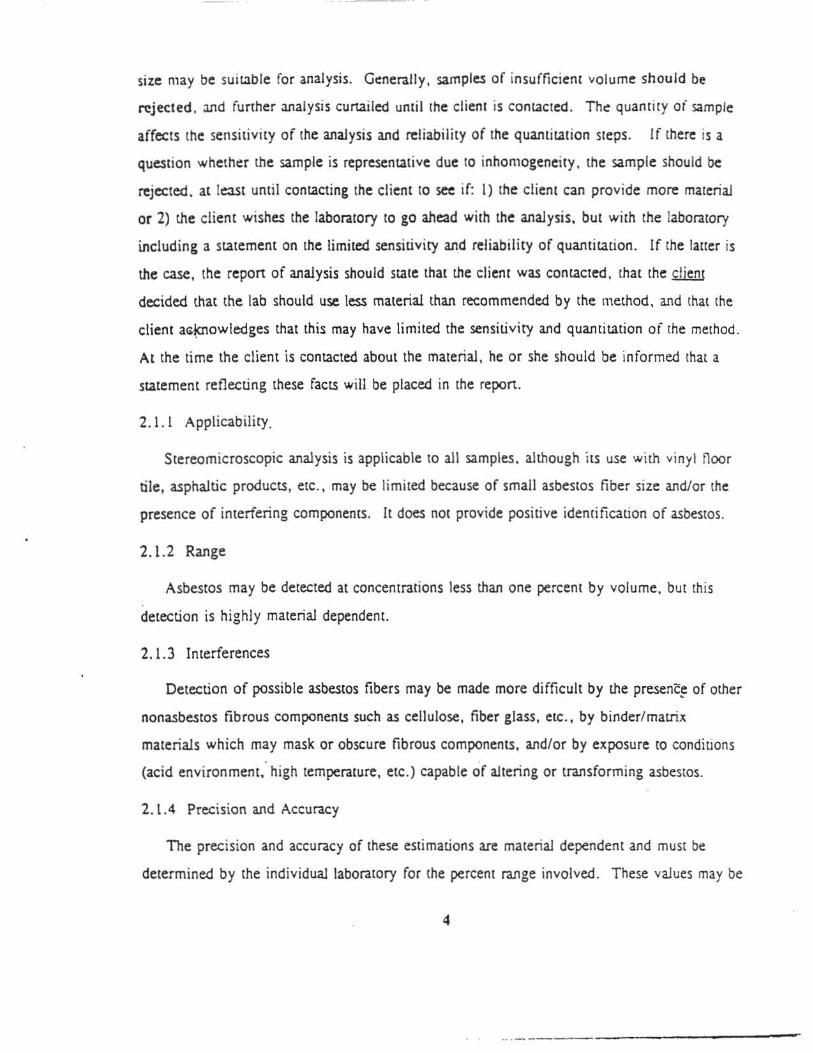
2.0 METHODS
2.1 Stereomicroscopic Examination
A preliminary visual examination using a simple stereomicroscope is mandatorv for all
samples. A sample should be of sufficient size to provide for an adequate examination . For
many samples, observations on homogeneity. preliminary fiber identification and semi
quantitation of constituents can be made at chis poinc. Another method of idenci fica cion and
semi-quantitation of asbestos must be used in conjunction with the stereomicroscopic
examination. A description of the suggested apparatus needed for stereomicroscopic
examination is given in Appendix B.
The laboratory should note any samples of insufficient volume. A sufficient sample
volume is sampte~type dependent. For samples such as floor tiles, rooting felts, paper
insulation, etc., three to four square inches of the layered material would be a preferred
sample size. For materials such as ceiling tiles, loose-fill insulation. pipe insulation , etc .. a
sample size of approximately one cubic inch (- 15cc) would be preferred. For samples of
thin-<:oating materials such as paints, mastics, spray plasters. tapes. etc., a smaller sample
3
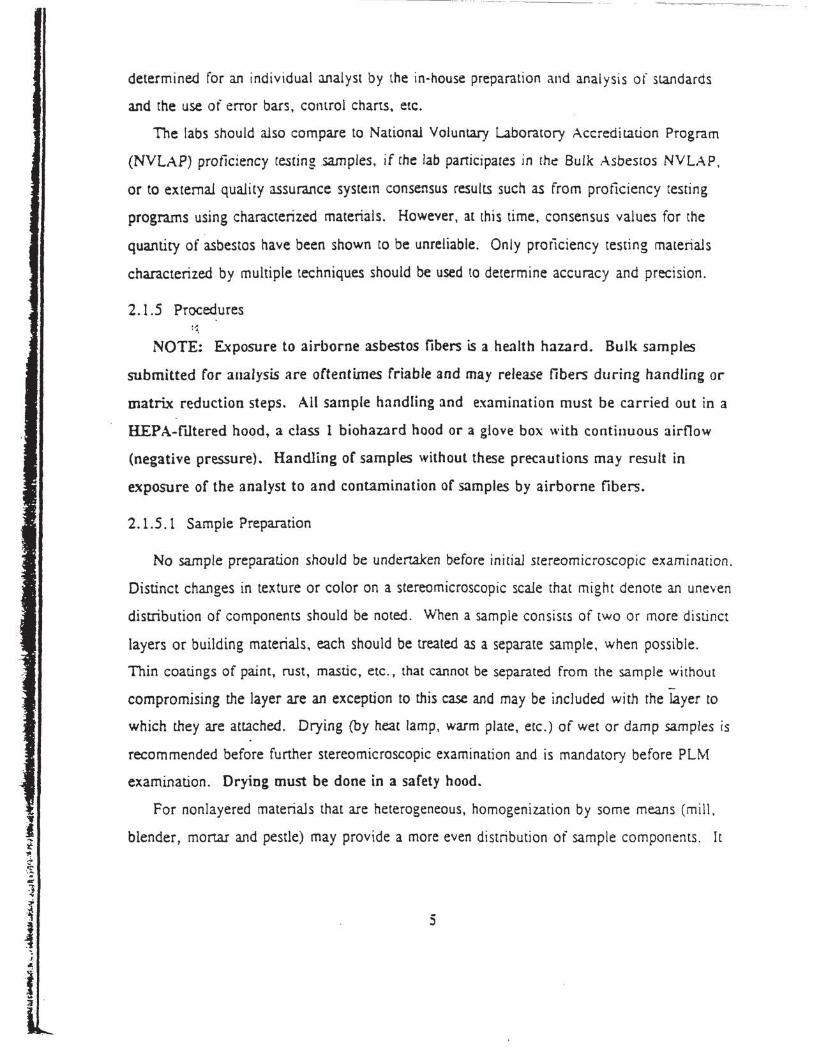
size may be suitable for analysis. Generally, samples of insufficient volume should be
rejected. and further analysis curtailed until the client is contacted. The: quantity of sample
affects the sensitivity of the analysis and reliability of the quantit.ation steps. If there is a
question whether the sample is representative due to inhomogeneity. the sample should be
rejected. at least until cont.acting the client to see if: I) the client can provide more material
or 2) the client wishes the laboratory to go ahead with the analysis. but with the laboratory
including a statement on the limited sensitivity and reliability of quantit.ation. If the latter is
the case, the report of analysis should st.ate that the client was contacted. that the client
decided that the lab should use less material than recommended by the method, and that the
client a~owledges that this may have limited the sensitivity and quantitation of the method.
At the time the client is contacted about the material, he or she should be informed that a
statement reflecting these facts will be placed in the report.
2.1.1 Applicability.
Stereomicroscopic analysis is applicable to all samples. although its use with vinyl floor
tile, asphaltic products, etc., may be limited because of small asbestos fiber size and/or the
presence of interfering components. It does not provide positive identification of asbestos.
2.1.2 Range
Asbestos may be detected at concentrations less than one percent by volume, but this
detection is highly material dependent.
2.1.3 Interferences
Detection of possible asbestos fibers may be made more difficult by the presenc~ of other
nonasbestos fibrous components su~h as cellulose, fiber glass, etc., by binder/matrix
materials which may mask or obscure fibrous components, and/or by exposure to conditions . .
(acid environment, high temperature, etc.) capable of altering or transforming asbestos.
2. 1.4 Precision and Accuracy
The precision and accuracy of these estimations are material dependent and must be
determined by the individual laboratory for the percent range involved. These values may be
4
.. ·----- -------------
determined for an individual analyst by the in-house preparation and analysis of standards
and the use of error bars, control charts, etc.
The labs should also compare to National Voluntary Laboratory Accreditation Program
(NVLAP) proficiency testing samples. if the lab participates in ch~ Bulk Asbestos NVLAP,
or to external quality assurance system consensus results such as from proficiency testing
programs using characterized materials. However, at this time, consensus values for the
quantity of asbestos have been shown to be unreliable. Only proriciency testing materials
characterized by multiple techniques should be used to determine accuracy and precision.
2.1.5 Procedures
NOTE; Exposure to airborne asbestos fibers is a h~1lth hazard. Bulk samples
submitted for analysis are oftentimes friable and may release fibers during handling or
matrix reduction steps. All sample handling and examination must be carried out in a
HEPA-flltered hood, a class 1 biohazard hood or a glove box with continuous airflow
(negative pressure}. Handling of samples without these precautions may result in
exposure of the analyst to and contamination of samples by airborne fibers.
2. 1.5. 1 Sample Preparation
No sample preparation should be undertaken before initial stereomicroscopic examination.
Distinct changes in texture or color on a stereomicroscopic scale that might denote an uneven
distribution of components should be noted. When a sample consists of two or more distinct
layers or building materials, each should be treated as a separate sample, when possible.
Thin coatings of paint, rust, mastic, etc. , that cannot be separated from the sample without
compromising the layer are an exception to this case and may be included with the layer to
which they are attached. Drying {by heat lamp, warm plate, etc.) of wet or damp samples is
recommended before further stereomicroscopic examination and is mandatory before PLM
examination. Drying must be done in a safety hood.
For nonlayered materials that are heterogeneous, homogenization by some means (mill.
blender, mortar and pestle) may provide a more even distribution of sample components. It
5
--··- - ·· . - ---- -----
may also facilitate disaggregation of clumps :lnd removal or" binder from fi bers ( rar~ly
however. it may mask fibers that were originally discemab l~).
For materials such as ceme~titious products and floor tiles, breaking, pulverizing, or
grinding may improve the likelihood of exposing fibrous components.
It may be appropriate to treat some materials by dissolution with hydrochloric acid to
remove binder/matrix materials. Components such as calcite, gypsum . magnesite, etc .. may
be removed by this method. For materials found to possess a high organic content
(cellulose, organic binders), ashing by means of a muffle furnace or plasma asher (for small,
cellulosic samples), or dissolution by solvents may be used to remove interfering material.
In either case, it is recommended that matrix removal be tracked gravimetrically.
Additional information concerning homogenization, ashing and acid dissolution may be
found in Sections 2.2.5.1 and 2.3.
2.1.5.2 Analysis .
Samples should be examined with a simple stereomicroscope by viewing multiple fie lds
of view over the entire sample. The whole sample should be observed after placement in a
suitable container (watchglass, weigh boat, etc.) substrate. Samples that are very large
should be subsampled. The sample should be probed, by turning pieces over and breaking
open large clumps. The purpose of the stereomicroscopic analysis is to determine
homogeneity, texture, friability, color, and the extent of tibrous components of the sample.
This information should then be used as a guide to the selection of further. more derinitive
qualitative and quantitative asbestos analysis methods. Homogeneity refers to whether each
subsample made for other analytical techniques (e.g. the "pinch" mount used for_the PLM
analysis), is likely to be similar or dissimilar. Color can be used to help determine
homogeneity, whether the sample has become wet (rust color), and to help identify or clarify
sample labelling confusion between the building material sampler and the laboratory.
Texture refers to size, shape and arrangement of sample components. Friability may be
indicated by the ease with which the sample is disaggregated (see definitions in Appendix A)
as received by the analyst. This does not necessarily represent the friabil ity of the material
as determined by the assessor at the collection site. The relative proportion of fibrous
6
components to binder/matrix material may be determined by comparison to similar materials
of known fibrous content. For materials composed of distinct layers or two or more distinct
building materials, each layer or distinct building material should be treated as a discrete
sample. The relative proportion of each in the sample should be recorded. The layers or
materials should then be separated and analyzed individually. Analysis results for ~ch layer
or distinct building material should be reported. If monitoring requirements call for one
reported value, the results for the individual layers or materials should always be reported
along with the combined value. Each layer or material should be checked for homogeneity
during the stereomicroscopic analysis to determine the extent of sample preparation and '1
homogeniZation necessary for successful PLM or other analysis. Fibers and other
components should be removed for further qualitative PLM e~amination .
Using the information from the stereomicroscopic examination , selection of additional
preparation and analytical procedures should be made. Stereomicroscopic examination
should typically be performed again after any change or major preparation (ashing, acid
dissolution, milling, etc.) to the sample. Stereomicroscopic examination for estimation of
asbestos content may also be performed again after the qualitative techniques have clarified
the identities of the various fibrous components to assist in resolving differences between the
initial quantitative estimates m~de during the stereomicroscopic analysis and those of
subsequent techniques. Calibration of analysts by use of materials of known asbestos content
is essential.
The stereomicroscopic examination is often an iterative process. Initial examination and
estimates of asbestos concentration should be made. The sample should then be analyzed by
PLM and possibly other techniques. These results should be compared to the initial ..
stereomicroscopic results. Where necessary. disagreements between results of the techniques
should be resolved by reanalyzing the sample stereomicroscopically.
7
2.1. 6 Calibration Materials
Calibration materials fall into several categories. including internal laboratory standards
and other materials that have known asbestos weight percent content. These calibration
materials could include:
• Actual bulk samples: asbestos-containing materials that have been characterized by other analytical methods such as XRO, AEM and/or gravimetry. (e.g. NVLAP test samples).
• Generated samples: in-house standards that can be prepared by mixing known quantities of asbestos and known quantities of asbestos-free matrix materials (by ~eight), and mixing (using blender, mill, etc.) thoroughly to achieve homogeneity;
'1. matrix materials such as vermiculite, perlite, sand, fiberglass. calcium carbonate. etc. may be used. A range of asbestos concentrations should be prepared (e.g. I, 3. 5, 10, 20%, etc.). The relationship between specific gravities of the components used in standards should be considered so that weight/volume relationships may be determined.
• Photographs, drawings: photomicrographs of standards, computer-generated drawings, etc.
Suggested techniques for the preparation and use of in-house calibration standards are
presented in Appendix C, and at greater length by Harvey et al. 1 The use of synthesized
standards for analyst calibration and internal laboratory quality control is not new however,
having been outlined by Webber et al. 2 in 1982.
2.1. 7 References
1. Harvey, B. W., R. L. Perkins, J. G. Nickerson, A. J. Newland and M. E. Beard, "Formulating Bulk Asbestos Standards". Asbestos Issues, April 199[. pp. 22-29.
2. Webber, J. S., A. Pupons and J. M. Fleser, "Quality-Control Testing for Asbestos Analysis with Synthetic Bulk Materials". American Industrial Hygiene Associations Journaf, 43, 1982, pp. 427-431.
8
... .. --------------
2.2 Polarized Light Microscopy
2.2.1 Principle and Applicability
Samples of bulk building materials takc:n tor asbestos identification should rirst be
examined with the simple stereomicrosco~ to determine homogeneity and preliminary tiber
identification. Subsamples should then be examined using PLM to determine optical
properties of constituents and to provide positive identification of suspect fibers.
The principles of optical mineralogy are well-escablished. u.H A light microscope
equipped with cwo polarizing filters is used to observe specific optical characteristics of a
sample. 'The use of plane polarized light allows for the determination of refractive indices
relative to specific crystallographic orientations. Morphology and color are also observed
while viewing under plane polarized light. Observation of particles or tibers while oriented
between polarizing filters whose privileged vibration directions are perpendicular (crossed
polars) allows for determination of isotropism/anisotropism, extinction characteristics of
anisotropic particles, and calculation of birdringence. A retardation plate may be placed in
the polarized light path for verification of the sign of elongation. If subsamples are prepared
in such a way as to represent all sample components and not just suspect tibers. semi
quantitative analysis may also be performed. Semi-quantitative analysis involves the use of
calibrated visual area estimation and/or point counting. Visual area estimation is a semi
quantitative method that muse relate back co calibration marerials. Point counting, also semi
quantitative, is a standard technique used in petrography (or dl!termining the relative areas
occupied by separate minerals in thin sections of rock. Background information on the use
of point counting3 and the interpretacion of point count daca5 is available.
Although PLM analysis is the primary technique used for asbestos determination, it can
show significant bi·as leading co false negatives and false positives for certain types of
materials. PLM is limited by the visibility of the asbestos fibers. In some samples the fi bers
may be reduced to a diameter so small or masked by coatings to such an extent that they
cannot be reliably observed or identified using PLM.
9
'
2.2.2 Range
The detection limit for visual estimation is a function of the quantity of sample analyzed.
the nature of matrix interference, sample preparation, and riber size and distribution.
Asbestos may be detected in concentrations of less than one percent by area if sufficient
material is analyzed. Since floor tiles may contain fibers too small to be resolved by PLM
( < 0.25 ,u.m in diameter), detection of those fibers by this method may not be possible.
When point counting is used, lhe detection limit is directly proportional to the amount of
sample analyzed, but is also limited by tiber visibility. Quantitation by area estimation. both
visual ,~d by point counting, should yield similar results if based on calibration standards.
2.2.3 Interferences
Fibrous and nonfibrous, organic and inorganic constituents of bulk samples may interfere
with the identification and quantitation of the asbescos mineral content. Binder/matrix
materials may coat fibers, affect color, or obscure optical charact~ristics to the extent of
masking fiber identity. Many organic mastics are soluble in refractive index liquids and,
unless removed prior to PLM examination, may affect the refractive index measurement of
constituent materials. Fine particles of other materials may also adhere to fibers to an extent
sufficient to cause confusion in identification. Gravimetric procedures for lhe removal of
interfering materials are presented in Section 2. 3.
2.2.4 Precision and Accuracy
Data obtained for samples containing a single asbestos type in a sample matrix have been
reported previously by Brantley et al . 6 Data for establishing the accuracy and precision of
the method for samples with various matrices have recently become available. Perkins,1
Webber et al.' ·and Harvey et al.9 have each documented the tendency for visual escimates
to be high when compared to point-count data. Precision and accuracy must be determined
by the individual laboratory for the percent range involved. If point counting and/or visual
estimates are used, a table of reasonably expanded errors, such as those shown in Table 2- 1.
should be generated for different concentrations of asbestos.
10
.·• ·:=:
·~ .. ·~
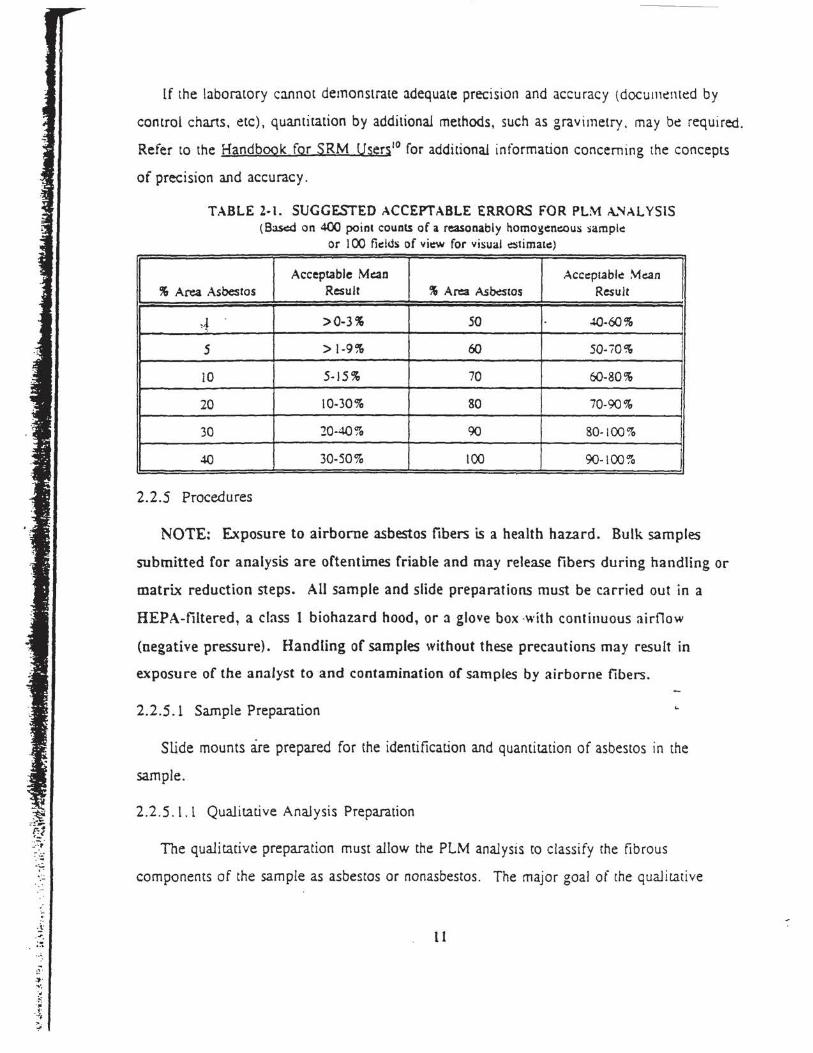
lf the laboratory cannot demonstrate adequate precision and accuracy (documt!nted by
control charts, etc) , quantitation by additional methods, such as gravimetry. may be required.
Refer to the Handbook for SRM Users10 for additional information concerning the concepts
of precision and accuracy.
TABLE 2-l. SUGGESTED ACCEPTABLE ERRORS FOR PLM A.'lALYSlS (Ba.sc:d on 400 point counts of a reasonably homo~encous sample:
or I 00 fields of vit:W for visual otimatc:)
Acceptable Mean Accc:ptablc: ~c:an % Area Asbesros Result % An=a Asbc:sros Result
~ >0-3% 50 ~-60%
5 > 1-9% 60 50-70%
10 5-I.S% 70 60-80%
20 10-30% 80 70-90%
30 20-40% 90 80-100%
40 30-50% 100 90-100%
2.2.5 Procedures
NOTE: Exposure to airborne asbestos fibers is a health hazard. Bulk samples
submitted for analysis are oftentimes friable and may release fibers during handling or
matrix reduction steps. All sample and slide preparations must be carried out in a
HEPA-tiltered, a class 1 biohazard hood, or a glove box ·with continuous airflow
(negative pressure). Handling of samples without these precautions may result in
exposure of the analyst to and contamination of samples by airborne fibers.
2.2.5 .1 Sample Preparation
Slide mounts are prepared for the identification and quantitation of asbestos in the
sample.
2.2.5.1.1 Qualitative Analysis Preparation
The qualitative preparation must allow the PLM analysis to classify che fibrous
components of the sample as asbestos or nonasbestos. The major goal of the qualitative
11
preparation is to mount 1!.1Sily visible fibers in appropriate refractive index liquids for
complete optical characterization. Often this can be accomplished by making immersion
grain mounts of random subsamples of the homogeneous material. Immersion liquids with
refractive indices close to the suspected (see stereomicroscopic analysis) asbestos mineral
should be used for the qualitative analysis so that n0 can be determined. Problem samples
include those with inhomogeneities, coatings, small fibers. and interfering compounds.
Additional qualitative preparations are often necessary for these types of samples. All
samples, but especially those lacking homogeneity, may require picking of tibers from
specific sample areas during the stereomicroscopic examination. Coatings on the fibers often
need ta be removed by mechanical or chemical means. Teasing the partides apart or use of :1
a mortar and pestle or similar mechanical method often is sufficient to free fibers from
coatings. Chemical means of removing some coatings and interfering compounds are
discussed in Section 2.3, Gravimetry .
2.2.5 .1.2 Quantitative Analysis Preparation
The major purpose of the quantitative preparation is to provide the analyst with a
representative grain mount of the sample in which the asbestos can be observed and
distinguished from the nonasbestos matrix. This is typically performed by using randomly
selected subsamples from a homogeneous sample (see stereomicroscopic analysis). Particles
should be mounted in a refractive index (Rl) liquid that allows the asbestos to be visible and
distinguished from nonasbestos components. Care should be taken to ensure proper loading
and even distribution of particles. Both the qualitative and quantitative sample preparations
are often iterative processes. Initial samples are prepared and analyzed. The ~LM analysis
may disclose problems or raise questions that can only be resolved by further p~eparations
(e.g. through the use of different RI immersion liquids, elimination of interfering
compounds, sample homogenization, etc.)
For layered materials, subsamples should be taken from each individual or discrete layer.
Each of these subsamples should be tre3ted as a discrete sample. but as stated in Section
2.1.5.2, the results for the individual layers or materials may be combined if called for by
monitoring requirements.
12
• = a .a'tJ'WQ!
··-··--·-·--------------------
Homogenization involves the use of any of a variety of devices. such as a mortar and
pestle, mill, or blender to pulverize. disaggr~gate and mix heterogeneous, friable bulk
materials. Selection of the appropriate device is dependent upon personal preference and th~
nature of the materials encountered. A blend~r or mortar and pestle may be adequate for
homogenizing materials that lack appreciable amounts of tacky matrix/binder. and for
separating interfering components from the fibers. For materials which are unusually sticky
or tAcky, or contain unusually long asbestos tibers. milling (especially freezer milling) may
be more efficient. However, milling should be discontinued as soon as the material being
milled appears homogeneous, in order to reduce the potential for mechanically reducing fiber
size below the resolving power of the polarizing microscope. Hammer mills or cutting mills
may also be used on these materials; however, the same precaution regarding reduction of
fiber size should be taken. Blending /mi lling devices should be disassembled (to the extent
possible) and thoroughly cleaned after each use to minimize contamination.
2.2.5 .2 Analysis
Analysis of bulk building materials consists of the identification and semi-quantitation of
the asbestos typ~(s) present, along with the identification, where possible, of tibrous
nonasbestos materials, mineral components and matrix materials. If the sample is
heterogeneous due to the presence of discrete layers or tw.o or more distinct building
materials, each layer or distinct material should be analyzed. and results reported. Total
asbestos content may also be stAted in terms of a relative percentage of the total sample.
2.2.5.2.1 Identification
Positive identification of asbestos requires the determination of the following opt'ical
properties:
• Morphology . • Birefringence
• Colo.r and, if present, pleochroism • Extinction characteristics
• Refractive indices (± .005) • Sign of elongation
13
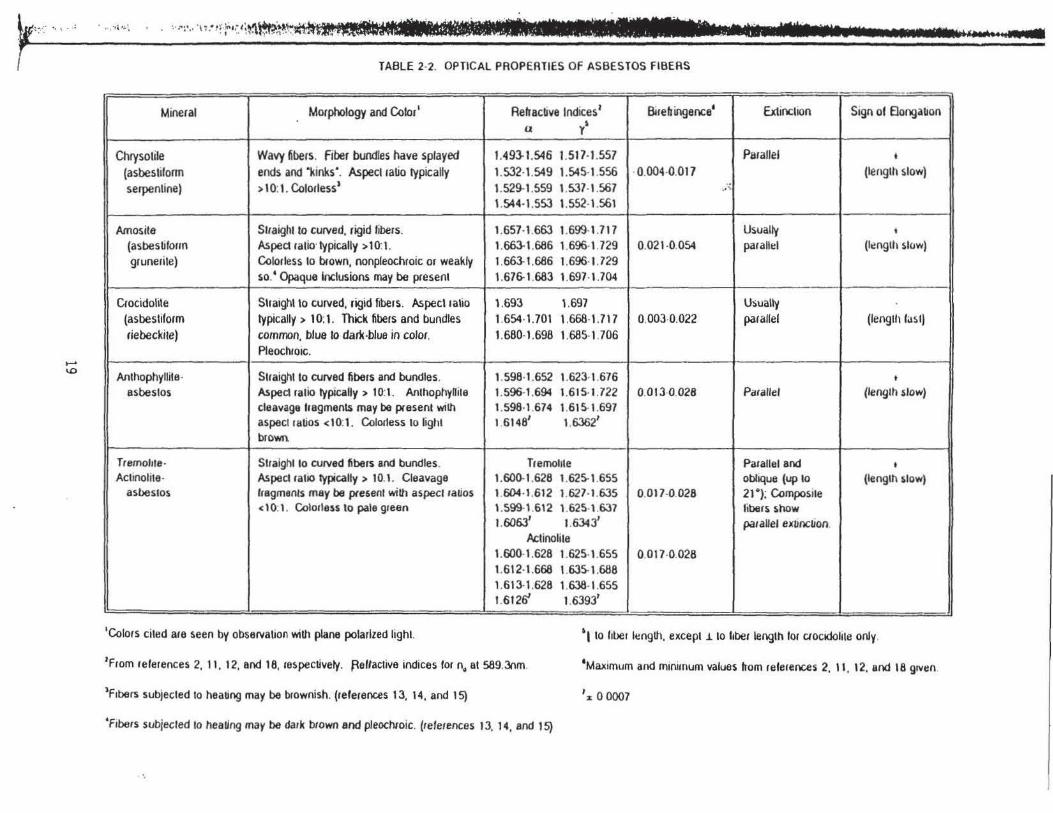
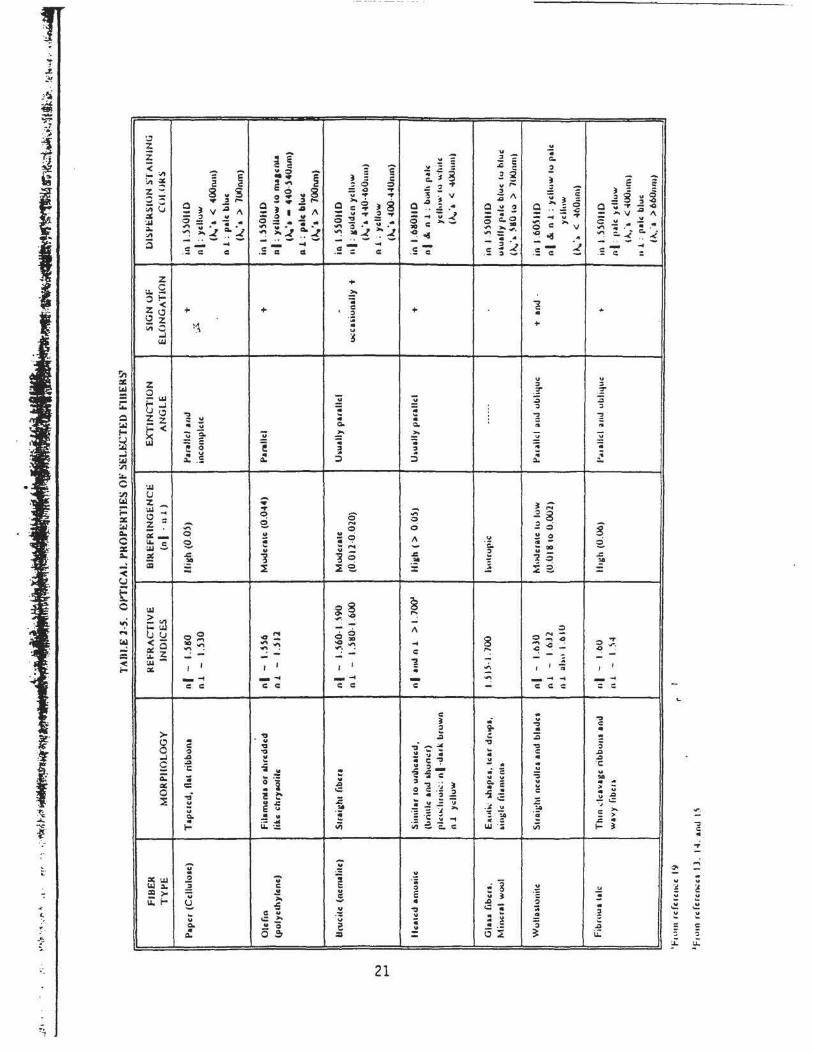
Descriptions of the optical oropenic:s listed above: for ashc:stos tibers may be found in
Apoendix A. Glossary of Terms. Table 2-2 lists the abo\'~ propenies for the six types of
asbestos and Table 2-3 presents the central stop dispc;:rsion staining colors t"or the asbestos
minerals with selected high-dispersion index liquids. Tabl~s 2-4 and 2-5 list selected optical
properties of several mineral and man-made tibers. All tibrous materials in amounts greater
than trace should be identified as asbestos or nonasbestos. with all optical propenies
measured for asbestos and at least one optical property measured for each nonasbestos
fibrous component that will distinguish each from asbestos. Small fiber size and/or binder
may necessitate viewing the sample at higher magnification (400-SOOx) than routinely used
(l00x).
Although it is not the purpose of this section to explain the principles of optical
mineralogy, some discussion of the determination of refractive indices is warranted due to its
importance to ti}e proper identification of the asbestos minerals. Following is a brief
discussion of refractive index determination for the asbestos minerals.
All asbestos minerals are anisotropic. meaning that they exhibit different optical
properties (including indices of refraction) in different directions. All asbestos minerals are
biaxial, meaning that they have one principal refractive index parallel (or nearly parallel) to
the length of the fiber and two principal refractive indices (plus all intermediate indices
between these two) in the plane perpendicular (or nearly so) to the length of the tiber.
Although chrysotile (serpentine) is classitied as a bia"<ial mineral. it behaves as a uniaxial
mineral (two principal refractive indices) due to its scrolled structure. Arnosite and
crocidolite, although also biaxial , exhibit uniaxial properties due to twinning of the crystal
structure and/or random orientation of fibrils in a bundle around the long axis af the bundle.
For all of the asbestos minerals except crocidolite, the highest refractive index (-y) is aligned
with the fiber length (positive sign of elongation). For crocidolite. the lowest refractive
index (a) is aligned with the fiber length (negative sign of elongation). A more complete
explanation of the relationship of refractive indices to the crystallographic directions of the
asbestos minerals may be found in References I. 2. 4. 11 and 12. It should be noted that for
the measurement of refractive indices in an anisotropic particle (e.g. asbestos fibers). the
orientation of the particle is quite critical. Orientation with respect to rotation about the axis
14
·-·----······ -·=· ~-~----~---
of the microscope (and thus with respect to the vibration directions o( the polarizer and
analyzer) and also to the horizontal plane (plane of the microscope srage) will affect the
determinacion of the correct values for refractive indices. The refractive indc!x that is
measured will always correspond 10 a direction perpendicular to the axis of the microscope
(i.e., lying in the plane of the stage} and is the direction in that horizontal plane parallel to
the vibration direction of the polarizer, by convention E-W.
To determine -y(n II) for chrysotile, anthophyllite and arnosite, the index is measured
when the length of the tiber is aligned parallel to the vibration direction of the polarizer (E
W). Under crossed polars, the tiber should be at extinction in this orientation. To
determine''the lowest refractive index, a (n .1 ). for chrysotile and amosite. the tiber should
be oriented N-S (extinction position under crossed polars). The determination of n II and n .L
with crocidolite is accomplished in the same manner as with amosite and chrysotile with the
exception that the a and -y directions are reversed. For crocidolite, a is measured at the E
W position (parallel to the polarizer) and -y is measured at the N-S orientation {perpendicular
to the polarizer). ·For anthophyllite. the tiber should be oriented N-S and the lowest and
highest indices for this orientation should be measured. These correspond lO a and {3
respectively.
The extinction behavior of tremolite-actinolite is anomalous compared to that of most
monoclinic minerals due to the orientation of the optic axes relative to the crystallographic
axes. This relationship is such that the refractive indices of the principal axes a and y are
not measured wh~n the fiber is exhibiting the maximum extinction angle. The values
measured at these positions are a' and y. The tiber exhibits an extinction angle within a few
degrees of the m:uimum throughout inost of its rotation. A wide range of refractive~ indices
from a' to a , and from -y' to-y, are observed. For tremolite-actinolite,/3 is measured on
those fibers displaying parallel extinction when oriented in the N-S position. The refractive
index for a is also measured when the tiber is oriented generally in the N-S posi tion and
exhibits the true extinction angle; true a will be the minimum index. To determine the
refractive index for "Y, the fibers should be oriented E-W and exhibi t the true extinction
angle; true -y will be the maximum value for this orientation.
15
When vi~wing single tib~rs, the analyst may often be able to manipulate the microscope
slide cover slip and ''roll" the tibers to positions that facilitate measuring the true values of
refractive indices. When viewing a large population of fibers with the microscope in the
dispersion staining mode. the analyst can easily detect tibers that exhibit the highest and
lowest indices ({3 and a) in the N-S position and the highest indices (')') in the E-W position .
Since individual asbestos fibrils cannot generally be resolved using polarized light
microscopy, refractive indices are most commonly measured on fiber bundles. Such
measurements would not result in true values for the indices and therefore by convention
should be reported as a' and y. ~'Asbestos types chrysotile, amosite and crocidolite are currently available as SRM 1866
and actinolite, tremolite and anthophyllite as SRM 1867 from the Office of Standard
Reference Materials, National Institute of Scandards and Technology .
2.2.5 .2.2 Quantitation of Asbestos Content
As described in Sections 2.1.5 and 2. 1.6, a calibrated visual volume estimation of the
relative concentr2tions of asbestos and nonasbestos components should be made during the
stereomicroscopic examination. In addition, quantitation of asbestos content should be
performed on subsamp!e slide mounts using ~!ibrated visual area estimates and/or a point
counting procedure. Section 2.1.6 and Appendix C discuss the procedures for preparation
and use of calibration standards. After thorough PLM analysis in which the asbestos and
other components of the bulk material are identified, several slides should be carefully
prepared from randomly selected subsamples. If the sample is not homogeneous, some
homogenization procedure should be performed to ensure that slide preparatio~ made from .. small pinch samples are representative of the total sample. Homogenization may range from
gentle mixing using a mortar and pestle to a brief period of mixing using a blender equipped
with a mini-sample container. The homogenization should be of shor1 duration (- 15
seconds) if using the blender technique so as to preclude a significant reduction in fiber size.
The use of large cover slips (22x30mm) allows for large subsamples to be analyzed. Each
slide should be checked to ensure that the sub sample is representative. uniformly dispersed.
and loaded in a way so as not to be dominated by superimposed (overlapping) panicles.
16
During the qualitative analysis of the sample. the analyst should decide on the appropriate
optical system (including magnitication) to maximize the ,·isibility of tht! :1sbestos in the
sample while still allowing the asbestos to be uniqut!ly distinguished from the matrix
materials. The analyse may choose to alter the mounting medium or the opt1cal system to
enhance contrast. During the quantitative analysis, slides should be scanned using an optical
setup that yields the best visibility of the asbestos. Upon tinding asbestos. the parameters
that were selected in the qualitative analysis for uniquely distinguishing it from the matrix
should be used for identification. These properties will vary with the sample but include any
or all of the parameters required for the qualitative analysis. For instance, low magnification .. allows for"C:oncurrent use of dispersion staining (focal screening). but compromises resolution
of extremely small diameter tibers; use of a compensator plate and crossed polarizers
freque.1tly enhances the contrast between asbestos fibers and matrix material.
Visual area estimates should be made by comparison of the sample to calibration
materials that have similar textures and fiber abundance (see Section 2. 1. 6 and Appendix C).
A minimum of three slide mounts should be examined to determine the asbestos content by
visual area estimation . Each slide should be scanned in its entirety and the relative
proportions of asbestos and nonasbestos noted. It is suggested that the ratio of asbestos to
nonasbestos material be recorded for several fields for each slide and the results be compared
to data derived from the analysis of calibration materials having similar textures and asbestos
content.
For point counting, an ocular reticle (cross-line or point array) should be used to visually
superimpose a point or points on the microscope tield of view . The cross-line retic le is
preferred. Its use requires the scanning of most, if not all, of the slide area, therebY.:
minimizing bias that might result from lack of homogeneity in the slide preparation. In
conjunction with . this reticle, a click-stop counting stage can be used to preclude introducing
bias during slide advancement. Magnification used will be dictated by fiber visibility. The
slide should be examined along multiple parallel traverses that adequately cover the sample
area. The analyst should score (count) only points directly over occupied (nonempty) areas.
Empty points should !lQ! be scored on the basis of the closest particle. If an asbestos fiber
and a nonasbestos particle overlap so that a point is superimposed on their visual intersection.
17
a point should be scorc::d for both categories. If the point(s) is/arc:: superimposed on an area
which has several overlapping particles. the slide should be moved to another field. While
not including them in the total asbestos points counted. the analyst should record the presence
of any asbestos detected but not lying under the reticle cross·line or array points. A
minimum of 400 counts (maximum of eight slides with 50 counts ~ch to minimum of two
slides with 200 counts each) per sample is suggested, but it should be noted that accurac}'
and precision improve with number of counts. Point counting provides a detennination of
the projected area percent asbestos. Conversion of area percent to dry weight percent is not
feasible unless the specific gravities and relative volumes of the different materials are
known .. It should be noted that the total amount of material to be analyzed is dependent on ~
the asbestos concentration, i.e. the lower the concentration of asbestos, the larger !.he amount
of sample that should be analyzed, in both the visual estimation and point councing methods.
Quantitation by either method is made more difficult by low asbestos concentration, small
fiber size, and presence of interfering materials.
It is suggested that asbestos concentration be reported as volume percent, weight percent
or area percent depending on the method of quantitation used. A weight concentration
cannot be determined without knowing the relative specific gravities and volumes of the
sample components.
18
'''*
.. \.; ... ,.,,.;.:. ·.·.·:· .. ·\, .. !: r··:.';~~~~~---~•· -•··.··•··· •·:· ···•··•· •···• ... , ·. fllll·• ·
,_. 1.0
TABLE 2·2. OPTICAL PROPERTIES OF ASBESTOS FIBERS
-Mineral Morphology and Color• Relracbve Indices 1 Birefringence• Ext inchon Sign of Bongabon
I y' u I
I • Wavy fibers. fiber bundles have splayed 1.493-1.546 1.517-1.557 PiiraJJel Chrysohle t
(asbestilonn ends and ·kinks·. Aspect ratio typically 1.532-1.549 1.545-1.556 ·0.004-0.017 (length slow) serpentine) > l 0: 1. Colorless 1 1.529-1.559 \ .537-1.567 .... ":.
\ .544· \.553 1.552-1.561
Amos ita Straight to curved, rigid fibers. 1.657·1.663 1.699-\.7\7 Usually t
(asbestiform Aspect ratio· typically > 10:1. 1.663-1.686 1.696·1.729 0.02\ -0.054 parallel (lenglh slow) grunerite) Colorless to blown, nonpleochroic or weakly 1.663-1.686 1.696·1.729
so. • Opaque Inclusions may be present 1.67&\.683 1.697-1.704
Crocidolile Straight to curved, rigid f1bers. Aspect ratio 1.693 \.697 Usually (asbesliform typically > 1 0: 1. Thick fibers and bundles 1.654·1.701 1.668·1.717 0.003-0.022 parallel (lenglh tas I) riebeckire) common, blue ro dark-blue in color. 1.680·1.698 1.685-1.706
Pleochrotc.
Anthophyllite· Straight to curved fibers and bundles. 1.598·1.652 \.623·1.676 t
asbestos Aspect ralio typically > 10:1. Anthophyllite 1.596-1.694 1.6t5-1.722 0.013·0.028 Parallel (length slow) cleavage lragments may be present wilh 1.598-1 .674 1.61 5·1.697 aspect ratios <10:1. Col01less to lighl 1.61481 1.6362' brown
Tremollte· Straight to curved fibers and bundles. Tremohle Parallel and t
Actinolite· Aspect ratio typically > 10.1. Cleavage 1.600·1.628 1.625-1.655 oblique (up to (lenglh slow) asbestos fragments may be pie6ent with aspect ratios 1.604·1.612 1.627·1.635 0.017-0.028 21 °); Composite
<10:1. Colorless to pale green \.599-1 .612 1.625-1.637 libers show 1.60631 1.6343' paraUel exvoction.
Actinolite 1.600·1.628 1.625-1.655 0.017-0.028 1.612·1.668 1.635-1.688 1.613·1.628 1.638-1.655 1.61 26' 1.63931
----- L_ - -
•eotors cited are seen by obsel'lalion wiUl plane polarized light. ' l to fiber l~nglh, except .i to hber leoglh lor ctocidolite only.
' From references 2, 11, 12. and 18, respectively. ~eflactive indices torn. at 589.3nm •Maximum and minimum values from referenus 2, II , 12. and 18 grven.
1Frbers subjected to heating may be brownish. (references 13, 14, and 15) 1x 0 0007
'fibers subjected to healing may be dark btown and pleochsoic. (references 1 J, 14, and 15)
I
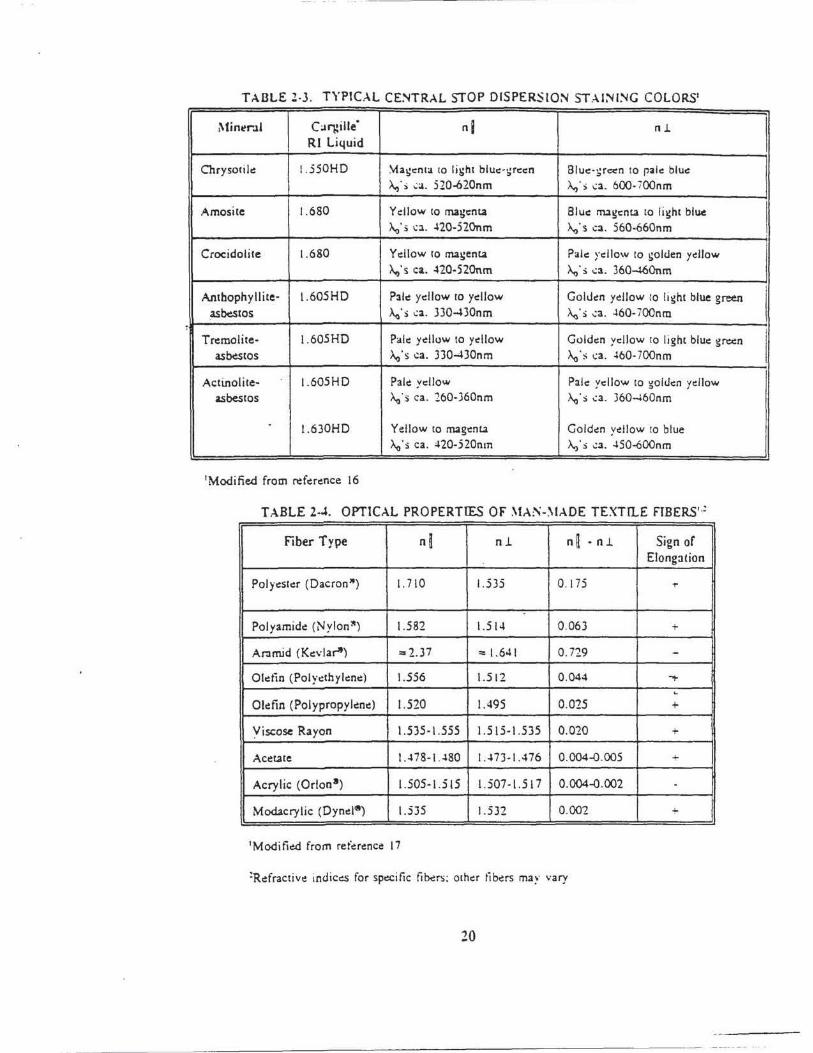
TABLE Z-3. TYPICAL CE~TRAL STOP OISPERSIO:'II STAI~ I~G COLORS1
Min~r.ll Ca11:ille' nl nl.
I R l Liquid
Chrysocile 1.550HD ~a!:enta 10 li~ht blue· !:reen Blue - ~r«n 10 rale blue >.,; s ..:a. 5 20-620nm >..; s ..:a. 600- i OOnm
Amosite 1.680 Yellow to magent.a Blue nugent.a to li!:ht blue
! A.o' s ~a . -l20-520nm A.o' s ca. 560-660nm
Crocidolite 1.680 Ydlow 10 ma~:ent.a Pale )'cilow to !:Olden ydlow A.o's ca. ~20-520nm A.o ' $ ..:a. 360-U~Onm
Anthophyllite· 1.605HD Pale ydlow to yellow Golden yellow to light blue green I asbestos ~·s ..:a. 3J0-430nm A.o's ..:a . .l60- i 00nm ~
I Trr:molite- 1.605HD Pale ydlow to yellow Goldc:n yellow to light blue gn:c:n
asbestos A.o's ca. J30-430nm A.o · s ..:a. .l60· 700n m
Actinolite- 1.605HD Pale: yellow Pale yellow to ~olden yellow asbestos A.o ·~ ca . 260-360nm A.o 's ..:a. J60-460nm
l. 630HD Yellow 10 magcnt.a Golden yellow to blue A.o 's ca. ~20-520nm ~·s .:a . .l50..¢00nm
1Modified from reference 16
T ABL.E 2-J. OPTICAL PROPERTIES OF ~~A~-~ IADE TEXTrLE FIBERS'·:
Fiber Type n~ n l n~ • n l. Sign of Elongation
Polyester (Dacron") 1. 710 1.535 0 . I 75 ...
Polyamide (Nylonlt) 1.582 1.51~ 0 .063 +
Anmid (Kevlar') =- 2.37 ::: 1.641 0. 729 -Oletio (Polyethylene) 1.556 1.512 0.044 ~
L
Oldin {Polypropylene) 1.520 1.495 0.025 +
Yiscose Rayon 1.535-1 .555 1.515-1.535 0 .020 +
Acct.ate JA78-I..l80 I A7J-1 A76 0.004-0 .005 +
Acrylic (Orion•) 1.505-1.515 1.507-1.5 17 0.004-0.002 .
Modacrylic (Oynd•) 1.535 1.532 0.002 +
1Moditied from referc:nce 17
:Refractive indices for sp~itic fibers ; ocher tibus ma~· vary
20
. , .
~ :c 1-.1 = !: Q :..I 1-
~ ..J :..I
- e 2 <:
8 .. ~ . "·-o~V::QI\ -" ., 0- - •
~i~~~ - .. -e
· - <:
+
.. <: <:
·- c: ... Cl
c:-·- c:
~ .
... .; .• 1 ··. =--l .. ~ ...
:
~~~-----~----------~-------------~-------------~-------------r-------+---------4------------~l c :ll 1.11 -;-. :c :.I a. c :c :1..
.-~ 3~ ~ 0 '8 28 e s o E~ .., ~o.· 1\ u ~o ~ = ,... ·- ~ -" ~ .1! ~ _,oo 1 ~0 ·=~ ~ xo ~ ~e l i i
~~~----+----------+-----------r----------~---------4-----~--------r-----------~l E c
_ .. c: c:
., a. t.
_ .. c: c:
-., c: .. >. ~ c: .. ..:: ,..
.!'0 0~
_ .... c: <:
21
1\ .. c: s ; -c:
• ;; --< c: c: c: = c:
... .., c: • ..;
2.2.5 .2.) Microscope Alignment
In order to accurarely measure the required optical properties. a properly aligned
polarized light microscope must be utilized. The microscope is aligned when:
1) the privileged directions of the substage polarizer and the analyzer are at 90° to one another and are represented by rhe ocular cross-tines;
2) the compensator plate's privileged vibration directions are 45° to the privileged directions of the polarizer and analyzer;
3) the objectives are centered with respect to stage rotation; and.
') the substage condenser and iris diaphragm are centered in the optic axis.
Additionally, the accurate measurement of the refractive index of a substance requi res the
use of calibrated refractive index liquids. These liquids should be calibrated regularly to an
accuracy of 0.0El4, with a temperature accuracy of ZOC using a refractometer or R.I. glass
beads.
2.2.6 References
1. Bloss, F. Donald, An Introduction to the Methods of Optical Crystallography, Philadelphia: Saunders College Publishing, 1989.
2. Kerr, Paul F., Optical ~tineralogy, 4th Edition, New York: McGraw Hill, 1977.
3. Chamot, E. M. and C. W. Mason, Handbook of Chemical Microscopy, Volume One, 3rd edition, New York: John Wiley & Sons, 1958.
4. Ehlers, Ernest G., Optical Mineralogy, Vols. 1 and 2, Palo Alto, CA: Blackwell Scientific Publications, 1987.
5. Chay.es, F., Petrographic Modal Analysis: An Elementary Statistical Appraisal , New York: John Wiley & Sons. 1956.
6. Brantley, E. P., Jr .• K. W. Gold, L. E. Myers, and 0. E. Lentzen, Bulk Sample Analysis for Asbestos Content: Evaluation of the Tentative Method. EPA-600/$4-82-021. 1982.
7. Perkins, R.L., "Point-Counting Technique for Friable Asbestos-Conla.ining Materials", The Microscope, 38, 1990, pp.29-39.
22
s. q;;usczo
' 4 f
1 i ,.
-------. ·····-----·--··- · . - .. - -· -··· ..... -·-
8. Webb~r. J .S .. R. J. Janulis, L. J. Carhart and M. B. Gill<::spie, "Quantitating Asbestos Cont~nt in Friable Bulk Samples: Devek)pment of a Stratified PointCounting M~thod" . American Industrial Hygiene Association Journal , 51. 1990. pp. 447--L52.
9. Harvey , 8. W .. R. L. Perkins. J. G. Nickerson. A. J. Newland and M. E. Beard, "Formulating Bulk Asbestos Standards", Asbestos Issues, April !99l. pp. 22-29.
10. Handbook for S&\tl Users, NlST (formerly NBS) Special Publication 260-100, U.S . Department of Commerce, 1985.
11. Deer, W.A., R. A. Howie, and J. Zussman , An Introduction to the Rock Forming Minerals, Longman, 1966.
12. Heinrich, E. W .. Microscopic Identification of .\tinerals. McGraw Hill. 1965.
13. Kressler, J. R., "Changes in Optical Properties of Chrysotile During Acid Leaching", The Microscope, 31 , 1983 , pp. 165- 172.
14. Prentice, J. and M. Keech, "Alteration of Asbestos with Heat", Microscopy and Analysis , 10, 1989, pp. 7-12.
15. Laughlin, G. and W. C. McCrone, "The Effect of Heat on the Microscopical Properties of Asbestos", The Microscope, 37, 1989, pp. 8-15.
16. Interim Method for the Determination of Asbestos in Bulk Insulation Samples, U.S. E.P.A. 600/M4-82-Q20, 1982.
17. McCrone, Walter C., "Routine Detection and Identification of Asbestos", The Microscope, 33, 1985, pp. 273-284
18. Reports of Analysis, SRM 1866 and 1867, National Institute of Standards & Technology.
19. McCrone, Walter C., Asbestos Identification, McCrone Research Institute, 1987.
2.3 Gravimetry
2.3.1 Principle and Applicability
Many components of bulk building materials, specifically binder components, can be
selectively removed using appropriate solvents or, in the case of some organics. by ashing.
The removal of these components serves the following purposes:
23
l) to isolat~ asbl!stos from the sample. allowing its w~ight to be (ktermined:
2) to concentrate asb~stos and th!!retore lowc:r the detec tion limit in the total sample:
3) to aid in the detection and identification of fibrous components: :tnd.
4) to remove organic (ashable) tibers which are optically similar to asbestos.
Common binder materials which are removed easily using the techniques described
include: l) calcite, gypsum, magnesite, brucite, bassanite, ponlandite, and dolomite, using
hydroc~loric acid, and 2) vinyl, cellulose. and other organic components. by ashing. The .,.
rem.oval of the binder components results in a residue containing asbestos. if initially present.
and any other non-soluble or non-ashable components which were present in the original
sample. Unless the procedures employed result in the loss of some asbestos. the weigh t
percent of the rc;sidue is the upper limit for the weight percent of asbestos in the sample.
This section describes the procedure for removing acid-soluble and ashable components.
and for determining the weight percent of the residue. However. the acid dissolution and
ashing techniques can be used without the accompanying weight measurements to ei ther
liberate or clean fibers to aid in qualitative PLM or AEM analyses.
This technique is not an identification technique. Other methods, such as PLM , XRD, or
AEM must be used to determine the identity of the components. A description of the
suggested apparatus, reagents , etc. needed for the techniques described is included in
Appendix B.
2.3.2 [nterferences
Any components which cannot by removed from the sample by selective dissolution or
ashing interfe·re with asbestos quantitation . These components include, but are not limited to,
many silicates (micas, glass fibers, etc. ) and oxides (TiOz, magnetite, etc.). When interfering
phases are present (the residue contains other phases in addi tion to asbestos). other
techniques such as PLM. AEM . or XRD must be used to determine the percent of asbestos
in the residue.
24
1 .,.
._ ; :
Care must be taken to prevent loss of or chemical/structural cllanges in the critical
components (asbestos). Prolonged exposure to acids or excessive heating (above 500°C) can
cause changes in the asbestos components in the sample and affect the optical properties.'·1·3
2.3.3 Quantitation
The weight of the residue remaining after solvent dissolution/ashing should be compared
with the original weight of the material. Presuming no insoluble material is lost, the weight
percent of the residue is the upper limit for the amount of asbestos in the sample. If the
residue is comprised only of asbestos. then the weight percent of residue equals the weight
percent of:asbestos in the sample. If the residue contains other phases, then techniques such
as PLM, XRD, or AEM must be employed to determine the relative abundance of asbesros
in the residue.
The precision and accuracy of the technique are dependent upon the homogeneity of the
material, the accuracy of the weight measurements. and the effectiveness of the sample
reduction and filtering procedures. In practice, the precision can be equal to + l %, and the
accuracy at 1 wt% asbestos can be less than or equal to + 10% relative.
The incomplete solution of components and the presence of other nonasbestos components
in the residue contribute to producing a positive bias for the technique (falsely high
percentages of asbestos).
2.3.4 Preliminary Examination and Evaluation
Stereomicroscopic and PLM examinations of the sample should already have been
conducted prior to initiating this procedure. These examinations should have provideo
information about: 1) whether the sample contains components which can be removed by
acid-washing, solvel')t dissolution, or ashing, and 2) whether the sample contains asbestos, or
fibers that might be asbestos, or whether no asbestos was detected.
If the sample is friable and contains organic (ashable) components, the ashing procedure
should be followed. If the sample is friable and contains HCl·soluble components, the acid
dissolution procedure should be followed . If the sample is friable and contains both types of
25
--------------· ---·-·--
components, the two procl!dures can be applied. preferably with acid dissolution following
ashing.
If the sample is non friable (e.g. floor tiles), it is also recommended that the ashing
procedure be used tirst. followed by the acid dissolution procedure. The ashing procedure
reduces floor tiles to a material which is easily powdered. simplifying the sample preparation
for acid dissolution.
2.3.5 Sample Preparation
2.3.5. 1 Drying
Any moisture in the sample will affect the weight measurements, producing falsely low
percentages of residue. If the sample is obviously wet, it should be dried at low temperature
(using a heat lamp. or simply by exposure at ambient conditions. prior to starting the
weighing procedure). If an oven is used, the drying temperature should not exceed 60°C .
Drying by means of heat lamp or ambient air must be performed within a safety-filtered
hood. Even if the sample appears dry. it can contain enough moisture to affect the precision
and accuracy of the technique. The test for sample moisture involves placing the amount of
sample to be used on the weighing pan; if the weight remains stable with time, then the
sample is dry enough. If the weight decreases as the sample sits on the weighing pan, then
the sample should be dried. Where conditions of moderate to high humidity are known to
exist, all materials to be weighed should be allowed time to stabilize to these ambient
conditions.
2.3.5.2 Homogenization/Grain Size Reduction
To increase the accuracy and precision of the acid dissolution technique. the sample
should be homogenized prior to analysis. This reduces the grain size of the binder material
and releases it from fiber bundles so that it may be dissolved in a shorter time period.
Leaving the sample in the acid for a longer period of time to complete the dissolution process
can adversely affect the asbestos components. and is not recommended. Homogenization of
the sample also ensures that any material removed for analysis wi ll more l ikely be
representative of the entire sample.
26
4»4
.. 1 1 1'!
Homogenization of friable: samples prior to ashing may also acc~lerate the ashing process:
however, the ashing time can simply be increased without affecting the asbestos in ~he
sample. Nonfriable samples. such as vinyl f1oor tiles. can be broken or shaved into pieces to
increase surface area and accelerate the ashing process.
Homogenization and grain size reduction can be accomplished in a variety of ways: I)
hand grinding in a mortar and pestle; 2) crushing with pliers or similar instrument; )) mixing
in a blender; 4) milling (i.e. Wylie mill, cryomill, etc.); or 5) any other technique which
seems suitable. If the fibers are extremely long, a pair of scissors or similar implement can
be used to reduce the fiber length.
2.3.6 Procedure for Ashing
1) Weigh appropriate amount of material.
There is no restriction on the maximum weight of material used; however, a large amount of material may take longer to ash. Enough material should be used to avoid a significant contribution of weighing errors to the total accuracy and precision.
2) Place material in crucible, weigh, and cover with lid .
Placing a lid on the crucible both minimizes the amount of oxygen available. slowing the rate of combustion of the sample, and prevents any foreign material from falling into the crucible during ash ing.
3) Place crucible into furnace, and ash for at least 6 hours.
The furnace temperature at the sample position should be at least Joooc but should not exceed 500°C. If the sample combusts (bums), the temperature of the sample may exceed 500°C. Chrysotile will decompose above approximately 500°C.
The furnace area should be well-ventilated and the fumes produced by ashing should be exhausted outside the building.
The ashing time is dependent on th~ furnace temperature. the amount of sample. and the surface area (grain size}. Six hours at 450°C is usually sufficient.
4) Remove crucible from furnace, allow contents to adjust to room temperature and humidity, and weigh .
i 27 l ,. ~
f
-----·-. -· - ------·--
5) Divide residue weight by starting "eight and multiply by 100 to determine weight% residue.
6) Analy-ze ~idue and/or proc~d to acid dissolution procedure.
If the objective was to remove organic fibers that may be confusc:d optically with asbestos, examine residue with PLM to determine whether any fibers remain.
If the sample is a floor tile, the acid dissolution procedure must now be performed. The residue does not have to be analyzed at this stage.
2.3. 7 Use of Solvents for Removal of Organics
:-1 ·Solvent dissolution may be used as a substitute for low temperature ashing for the
purpose of removing organic interferences from bulk building materials. However. solvent
dissolution, because of the involvement of potentially hazardous reagents such as
tetrahydrofuran·, amyl acetate, 1-1-l. trichlorethane, etc .. requires that all work be
perfonned with extreme caution inside a biohazard hood. Material Safety Data Sheets
should be reviewed before using any solvent. Solvent dissolution involves more apparatus
than does ashing, and requires more time, mainly due to set-up and slow filtration resulting
from viscous solvent/residue mixtures.
The following is a brief description of the solvent dissolution process.
I) Weigh starting material.
Place approximately 15-25ml of solvent in a lOOm! beaker. Add 2.5-3.0 grams (carefully weighed for continued gravimetric tracking) of powdered sa_!!)ple.
2) Untrasonicate sample.
Place the beaker in an ultrasonic bath (or ultrasonic stirrer) for approx imately 0.5 hours. The sample containers should be covered to preclude escape of an aerosol spray.
3) Centrifuge sample.
Weigh centrifuge vial before adding beaker ingredients. Wash beaker with an additional 10-lSml of solvent to remove any remaining concentrate. Then centrifuge
28
- ---- ----- ---
at approximately 2000-2500 rpm for Q_5 hour. U s~ solvent-resistant centriiuge tubes_
4) Oec~mt sample. reweigh.
After separation by centrifuging, decant solvent by pipening. Leave a small amount of solvent in the centrifuge vial to minimize the risk of decanting solid concentrate. Allow solid concentrate to dry in vial, then reweigh.
2.3.8 Procedure for Acid Dissolution
1) Weigh starting material, transfer to acid resistant container.
sni11l. dry sample weights between O.lg and 0.5g are recommended (determined for 47mm filters - adjust amount if different diameter tilters are used). lf too much material is left after acid dissolution the tilter can get clogged and prevent complete filtration. Very small samples are also to be avoided, as the weighing errors will have a large effect on the total accuracy and precision of the technique.
2) Weigh filter.
3) Add HCI to sample in container, stir, allow to sit for 2-10 minutes.
Either concentrated or dilute HCl can be used. If concentrated HC! is used, add enough acid to completely soak the material, allow the reaction to proceed to completion, and then dilute with distilled water. Alternatively, a dilute solution, made by adding concentrated HCI to distilled water, can be used in the place of concentrated HCI. A solution of l part concentrated HCI to } parts distilled water (approximately JN solution) has been found to be qui te effective in removing components within S minutes. For a sample size less than 0.5g. 20~30 ml of a 3N HCl solution is appropriate. ln either case (using concentrated or dilute HCl), the reaction will be more effective if the sample has been homogenized first. All obvious signs of reaction (bubbling) should cease before the sample is tiltered": Add fresh acid , a ml or two at a time, to ensure complete reaction. It should be noted that if dolomite is present, a 15-20 minute exposure to concentrated HC! may be required to completely dissolve the carbonate materials.
NOTE: Other solvents may be useful for selective dissolution of nonasbestos components. For example, acetic acid will dissolve calcite, and will not dissolve asbestos minerals. If any solvent other than hydrochloric acid is used for the dissolution of inorganic components, the laboratory must be ab le ro demonstrate that the solvent does not remove asbestos from the sample.
29
4) Filter solution.
Use the pre·weigh~d tilter. Pour the solution into the va~uum Iiller assembly. then rinse all material fro m conuiner into filter assembly. Rinse down the inside walls of the glass Iiller basin and check ior particles clinging to the basin after removal.
5) Weigh dried filter + residue , subtract weight of filter from total.
6) Divide residue weight by starting weight and multiply by 100 to detennine weight% residue.
7)
~
Analyze residue.
Perform stereomicroscopic examination of residue (can be performed without removing the residue from the tiller) . Note in panicular whether any binder material is still present.
Perform. PLM, AEM. or XRD analysis of residue to iden tify fibers and determine concentration as described in the appropriate sections of this mt!thod.
8) Modify procedure if necessary.
lf removal of the acid soluble components was not complete. stan with a new subsample of material and try any of the following:
a) Decrease grain size of material {by grinding, milling, etc.) b) Put solutions on hot plate - warm slightly c) Increase soak time (e~ercise caution)
9) Calculate relative weight% asbestos in sample.
wt% asbestos in sample = % asbestos in residue x wt% residue + I 00
For floor tiles, if the ashing procedure was used first, multiply the weight % of asbestos in the sample, as determined above, by the weight percent of the residue from ·the ashing procedure, then divide by 100.
Example: A = wt% residue from ashing = 70% B = wt% residue from HCJ = 20% C = wt% of asbestos in HCI residue = 50%
wt% asbestos after HCI dissolution = B x C + 100 = 20 x 50 + 100 = !0%
30
wt% asbestos in tloor tile = (8 x C ~ 100) x A ~ JOO = JO -~ 70 ~ 100 = 7%
If weights are expressed in decimal form, multiply the weight % of asbc!Stos in the sample by the weight % of the residue from the ashing procedure. then multiply by 100.
wt% asbestos after HCI dissolution = 8 x C = 0.2 x 0.5 = 0.1 (x 100 = 10%)
wt% asbestOS in noor tile = (8 X C) X A = 0.1 X 0. 7 = 0.07 (X 100 = 7%)
2.3.9 Determination of Optimal Precision and Accuracy
The pr~~ision of the technique can be determined by extracting multiple subsamples from .. , the original sample and applying the same procedure to each. The optimal accuracy of the
technique can be determined by applying gravimetric standards. Mixtures of calcite and
asbestos (chrysotile, amosite, etc.) in the following proportions are recommended for testing
the accuracy of the acid dissolution technique: 0.1 wt% asbestos/99.9 wt% calcite, 1.0 wt%
asbestos/99.0 wt% calcite, and 10 wt% asbestos/90 wt% calcite. Mixtures of cellulose and
asbestos are useful for testing the accuracy of the ashing technique.
Mixtures of only two components, as described above, are simplifications of "real-world"
samples. The accuracy determined by analyzing these mixtures is considered optimal and
may not apply directly to the measurement of each unknown sample. However. analyzing
replicates and standards using the full laboratory procedure, including homogenization,
ashing, acid dissolucion. filtration. and weighing, may uncover sreps thac incroduce signiticanc
bias or variation that the laboratory may then correct.
2.3.10 References
l. Kressler, J. R., "Changes in Optical Properties of Chrysotile During Acid Leaching", ·The Microscope, 31, 1983, pp. 165-172.
2. Prentice, J. and M. Keech. "Alteration of Asbestos with Heat". Microscopy and Analysis, March 1989.
3. Laughlin, G. and W. C. McCrone, "The Effect of Heat on the MicroscopicaJ Properties of Asbestos", The Microscope, 37, 1989. pp. 8-15.
31
2.4 X-Ray Powder Diffr.tction
2.4. 1 Principle and Applicability
The principle of x-ray powder diffr.~.ction (XRO) analysis is ,,.·ell established. 1•2 Any
solid crystalline material will diffract an incident beam of parallel. monochromatic .x.-rays
whenever Bragg· s Law,
}.. = 2d sin 8,
is satisfied for a particular set of planes in the crystal lattice, where
'~ = the x-ray wavelength. A; d = the interplanar spacings of the set of retlc:cting lattice planes. A and 9 = the angle of incidence between the x-ray beam and the retlecting lattice planes.
By appropriate orientation of a sample relative to the incident :~·ray beam. a diffraction
pattern can be generated that will be uniquely characteristi.: of the structure of the crystalline
phases present.
Unlike optical methods of analysis, however, XRD ca11not determine crystal morphology .
Therefore, in asbestos analysis, XRD does not distinguish between tibrous and nontibrous
forms of the serpentine and amphibole minerals (Table 2-6). However, when used in
conjunction with methods such as PLM or AEM. XRD teo.:hniques can provide a reliable
analytical method for the identification and characterization of asbesti form minerals in bulk
materials.
For qualitative analysis by XRD methods, samples should initially be scanned over
limited diagnostic peak regions for the serpentine (- 7.4 A) and amphibole (8.2-8.5 A) minerals (Tab~e 2-7). Standard slow-scanning methods for bulk sample analysis may be used
for materials shown by PLM to contain significant amounts of asbestos ( > 5 percent).
Detection of minor or trace amounts of asbestos may require special sample preparation and
step-scanning analysis. All samples that exhibit diffraction peaks in the diagnostic regions
for asbestiform minerals should be submitted to a full (5o -60° 28: I o 291 min) qualitative
XRD scan, and their diffraction patterns should be compared with standard reference powder
32
1
~.·
...
---------·-.
diffraction pattern~ ro verify initial peak assignments and to identify possible matrix
interferences when subsequent quantitative analysis will b~ performed.
Accurate quantitative analysis of asbestos in bulk samples by XRD is cri tically
dependent on particle size distribution, crystallite size, pr~ferred orientation and matrix
absoll'tion effects, and comparability of standard reference and sample materials. The most
intense diffraction peak that has been shown to be free from interference by prior qualitative
XRD analysis should be selected for quantitation of each asbestiform mineral. A " thin~layer·
method of analysisu can be used in which, subsequent to comminution of the bulk material
to - 10 J.Lffi bX suitable cryogenic milling techniques, an accurately known amount of the
sample is d1posited on a silver membrane filter. l11e mass of asbestiform material is
determined by measuring the integrated area of the selected diffraction peak using a step
scanning mode, correcting for matrix absorption effects. and comparing with suitable
calibration standards. Alternative "thick-layer" or bulk methods7 .~ are commonly used for
semi-quantitative analysis.
33
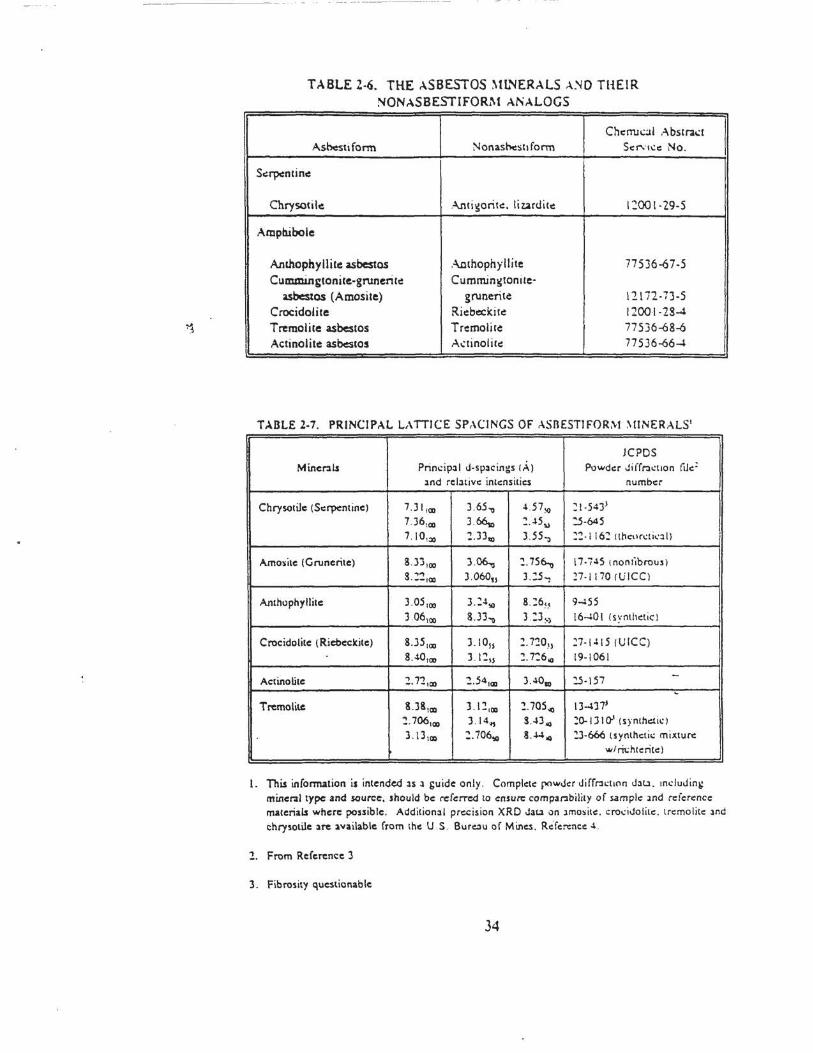
TABLE 2·6. THE ASBESTOS \tL~ERALS A~O THEIR !'iONASBESTIFORM A~ALOGS
ChemJol A bstra~t Asb.estifonn Nonasi:'Csh form Scr>1-:e No.
S.:rpcntino:
Chrysotilo: Anti~oritc:. liurditc 1~001·29-5
Ampllibole
Anthophyllit~ asbestos Anthophyllite 77536-67·5 Cumminstonite-gruneritc Cummin~tonite·
asbeslos (Amosite) grunerite 12172·73-5 Crocidolite Riebeclcitc: 1200·1·28-4 Tremolite asbestos Tremolite 17536-68-6 Actinolit~ asbestos A.:tinolih: 17536-66-4
TABLE 2·7. PRINCIPAL LATTICE SP,\CINGS OF ASBESTIFOR~t \IINERALS'
JC?OS
Miner:1ls Princip:1l <i·sp3cings lA) P<>wder Jiffr:1ct10n fue:
:1nd rel:ltivc intensities number
Chrysotilc (Serpentine) 7.) I tOO 3.65.., -4 .57)0 :t-54)J
7 .36,00 3.66,o :.-45» :5-645 7. JO,::o ~.JJ'Il J .s5. ~"l-1 16"l Hhc••rcti~·ll )
Amosite (Gruncrite) 8.33,00 3.06.., :. 756-.o 17-745 tnontibrous)
s.::!,oo 3.060, 3.:5..., !7-1170 Cli1CCJ
Anth<>phyllite ).05 ,00 3 . :-4~ 8. :6~~ 9-tSS
3.06,00 8 .33.., J . :J~) 16~01 lsynthcticl
Crocidolite (Riebeclcite) 8.35 100 ) . lOll : . 7"10,, :7- 1-415 tUICC)
8 .-'<>,oo 3.1"1H :. 1:6oo 19·1061
Actinolite ~.n,oo ~.54,QI 3.40., :5·157 -~
Tremoli~ 8.38\0D 3 .l ! ,ao :.705"0 13-tl7'
! .706,QI 3.14.., SA300 :~ IJ I 0' (synthctic)
3 . 131ao :.706~ 8.~ ... ~-666 (synthetic mixcurc "'/ril;htcritc)
I
l. This information is intended ls l guide only . Complete powJc:r J iffr:1c11on dlll. mcluJin~:
miner.al type and source. should be referred to ensure companbility of sample Jnd rcic:rence materials "'here possible. Additionll precision XRD Jau on Jmos itc. c ro.:idolitc . tremolite Jnd
c:hrysotile ue available from the U .S. Bure:~u of Mines. Rc"fcrence 4 .
., From Reference 3
3 . Fibrosity questionable
34
.·-~
. ·:.
----·--------
This XRD method is applicable as a confirmatory method lor identitic;:uion and
quantit4ltion of asbestos in bulk material samples that have undergone prior analysis by PLM
or other optical methods.
2.-L! Range and Sensitivity
The range and sensitivity of the method have not been determined. They will be variable
and dependent upon many factors, including matri:r. effects (absorption and interferences),
diagnostic rerlecrions selected and their relative intensities, preferred orientation, and
instrumental limitations. A detection limit of one percent is feasible given certain sample
characteristics.
2.4.3 Limitations
2.4.3.1 Interferences
Since the asbestiform and nonasbestiform analogs of the serpentine and amphibole
minerals (Table 2·7) are indistinguishable by XRD techniqu~s unless special sample
preparation techniques and instrumentation are used,9 the presence of nonasbestiform
serpentines and amphiboles in a sample will pose severe interference problems in the
identification and quantitative analysis of their asbestiform analogs.
The use of XRD for identification and quantitation of asbestiform minerals in bulk
samples may also be limited by the presence of other interfering materials in the sample.
For naturally-occurring materials, the commonly associated asbestos-related mineral
interferences can usually be anticipated. However. for fabricated materials, the nature of the
interferences may vary greatly (Table 2·8) and present more serious problems in
identification and quantitation. 10 Potential interferences are summarized in Table 2-9 and
include the following:
• Chlorite has major peaks at 7.19 A and 3.58 A that interfere with both the primary (7.31 A) and secondary (3.65 A) peaks for serpentine (chrysotile) . Resolution of the primary peak to give good quantitative results may be possible when a step-scanning mode of operation is employed.
• Vermiculite has secondary peaks at 7. 14 A and 3.56 A that could interfere with the primary peak (7.3 I A) and a secondary peak (3.65 A) of serpentine (chrysotile).
35
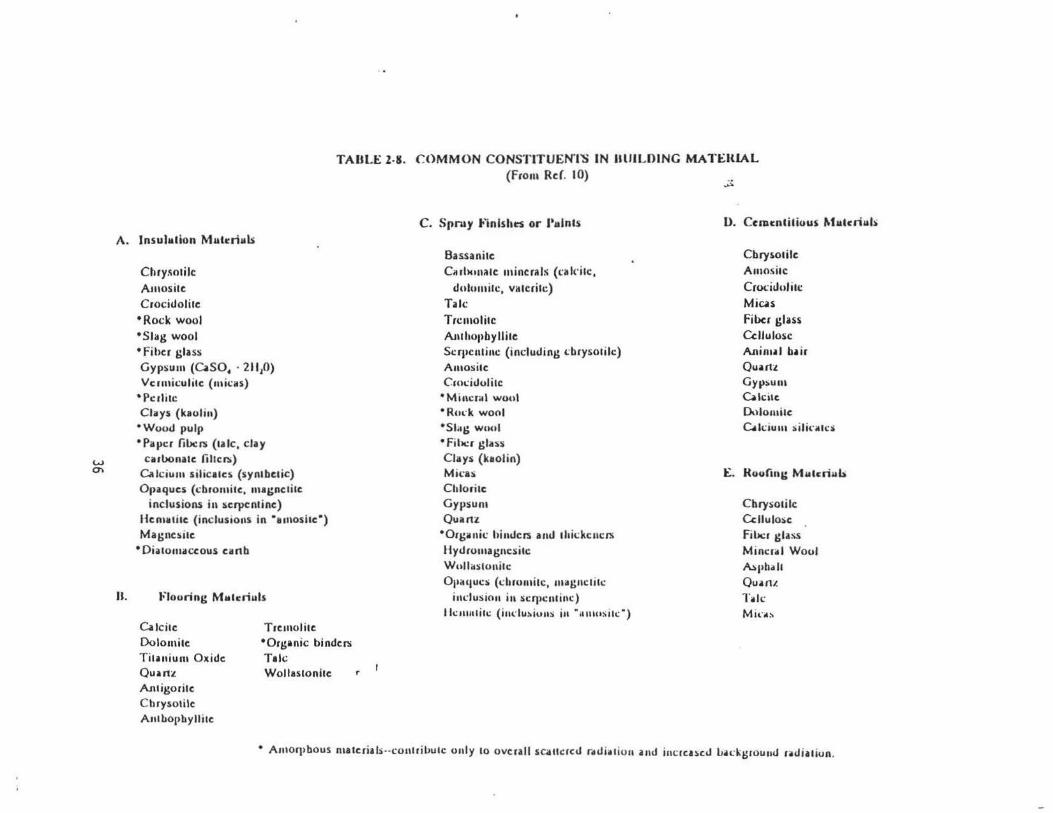
w 0'\
TAIJL£ 2-8. COMMON CONSTITUENTS IN UliiLOING MATt:IUAL
A. lnsul~tlion Mutcriub
Chry~otilc
Amosite C10cidolite
•Rock wool •Stag wool • Fiber glass Gypsum (uSO. · 2lll0) Vermiculite (micas)
•Perlite Clitys (kaolin)
•wood pulp •Paper fil>c ts (talc, clay
caroonate filters) Ca kium silicates (syntbetic) o,nqucs (cbromite, magnetite
inclusions in scrpc:ntine) Htntlltitc (incluSIOns in ·amoshe") Magnesite
• Diatomaceous ea nb
U. Flouring M11tcriuls
Calcite: Dolomite Titanium Oxide Q uan:t Antigorite Cbrysotile AntLO(lbyllitc
Tremolitc: •Organic binders Talc Wollaston he
(From Rd. tO)
C. Spruy •'inlsha::s or l'!tlnts
Bassa nite Ouhun~tc minc:r~ls ( ca kite,
dulumitc, vatc: titc) Talc
Trcmolitc Ant hop by llite Serpentine (induding drysotilc) Amosite Cwcit.lolitc
• Mincr;•l woul •Rm·k wool •stag wuul • fihcr glass Clilys (kaolin) Micas Chlorite Gypsum Quan:t
•Orgllnic hinders and thickeners Hydromagnesite Wullastonite
Ot~<UJUCS (duontite, lllllgnetitc ind usion in serpentine)
llcnllltitc (indu:.ions in ·., nuositc ")
~
U. Cuucntitious M~ttuiuhi
Cbrysotile Amositc
Crocidulitc Mias
Fiber glus O:Jiulosc Anim•l b•ir Quan:t Gypsum ulcile O.l lomite C.ldum silinh.:s
E. Ruufin&; Mutcriub
Cbrysotilc O:Jiulosc: Fil>cr gl1ss Min~.:ro.l Wool AsJihillt Ou1nz hk Min:.
• Amorpbous matcrials-·eontr illutc only to overall SCilllc:rcd r•t.lill tion ind i ncrc:a~c:d lJ;u: j(groum.l udiation.
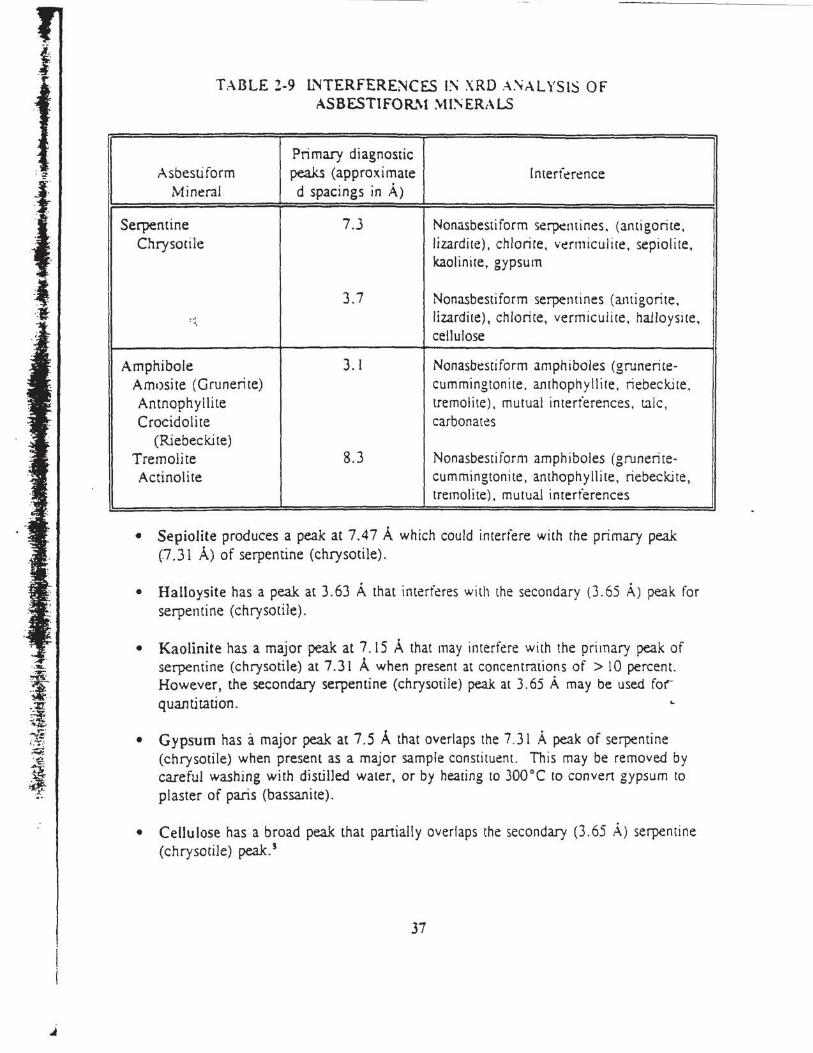
:.~
TABLE 2-9 L~TERFERE;:'<~CES 1:--; \RD .-\ .'tALYSlS OF ASBESTIFOR.'\1 :\--11:\ERALS
Primary diagnostic Asbestiform peaks (approximate Interf ert!nce
Mineral d spacings in A)
Serpentine 7.3 Nonasbestiform se~mines. (antigorite, Chrysocile lizardice). chlorire. vt!rmiculire. sepiolite,
kaolinite, gypsum
3.7 Nonasbestiform serpentines (antigorite, ... lizardite), chlorite, vermiculite, halloysice, . ,
cellulose
Amphibole 3.1 Nonasbestiform amphiboles (grunerice-Amosite (Grunerite) cummingtonite. anthophyllite, riebeckite. Antnophyllite tremolite). mutual interferences. talc,
Crocido1ite carbonates (Riebeckite)
Tremolite 8.3 Nonasbestiform amphiboles (grunerite-Actinolite cummingtonite, anthophyllite, riebeckite,
tremolite), mutual interferences
• Sepiolite produces a peak at 7.47 A which could interfere with the primary peak (7.31 A) of serpentine (chrysotile).
• Halloysite has a peak at 3.63 A that interferes with the secondary (3.65 A) peak for serpentine (chrysotile).
• Kaolinite has a major peak at 7.15 A that may interfere with the primary peak of serpentine (chrysotile) at 7.31 A when present at concentrations of > 10 percent. However, the secondary serpentine (chrysotile) peak at 3.65 A may be used for quantitation.
• Gypsum has a major peak at 7.5 A that overlaps the 7.31 A peak of serpentine (chrysotile) when present as a major sample constituent. This may be removed by careful washing with distilled water, or by heating to 300°C ro convert gypsum to plaster of paris (bassanite).
• Cellulose has a broad peak that partially overlaps the secondary (3.65 A) serpentine (chrysotile) peal<. s
37
I
I
• Overlap of major diagnostic peaks or the amphibole! minerals. grunerite (amosite). anchophyllite, riebeckite {crocidolite), and t remolit~ . at approximately 3.3 A a.Ild 3. 1 A causes mutual interference when these minerals occur in the oresence oi one another. In some instances adequate resolution may be attained by using step· scanning methods and/or by decreasing the collimator slit width at the x-ray port .
• Carbonates may aJso interfere with quantitative analysis of the amphibole minerals grunerite (amosite), anthophyllite, riebeckite (crocidol ite), and tremolite-actinolite. Calcium carbonate (CaCOJ has a peak at 3.035 A tllat overlaps major amphibole peaks at approximately 3.1 A when present in concentrations of > 5 percent. Removal of carbonates with a dilute acid wash is possible: however, the time in acid should be no more than 20 minutes to preclude any loss of chrysotile. 11
'1 • A major talc peak at 3.12 A interferes with the primary tremolite peak at this same position and with secondary peaks of actinolite (3. 14 A). riebeck.ite (crocidol ite) (3.10 A), grunerite (amosite) (3.06 A), and anthophyllite (3.05 A) . In the presence of talc. the major diagnostic peak at approximately 8. J A should be used for quantitation of these asbestiform minerals.
The problem of intraspecies and matrix interference is further aggravated by the
variability of the silicate mineral powder diffraction patterns themselves, which often makes
definitive identification of the asbestos minerals by companson with standard reference
diffraction patterns difficult. This variability results from allerations in the crystal lattice
associated with differences in isomorphous substitution and degree of crystallinity. This is
especially true for the amphiboles. These minerals exhibit a wide variety of very similar
chemical compositions, resulting in diffraction patterns characterizt!d by having major (II 0)
reflections of the monoclinic amphiboles and (210) reflec tions _of onhorhombic anthophyllite
separated by less than 0.2 A. '1
2.4.3.2 Matrix Effects
If a copper x-ray source is used , the presence of iron at high concentrations in a sample
will result in significant x-ray fluorescence, leading to loss of peak intensity . increased
background intensity. and an overall decrease in sensitivity. This situation may be corrected
by use of an x-ray source other than copper; however, this is often accompanied both by loss
of intensity and by decreased resolution of closely spaced reflections. Alternatively. use of a
38
· ..
~-~----·· -··· -------·-----------
diffracted beam monochromator will reduce background rluorescent radiation. c!nabling
weaker diffr.~.ction peaks ro be detected.
X-r.~.y absorption by the sample matrix will result in overall auenuation of the diffracted
beam and may seriously interfere with quantitative analysis. Absorption dfects may be
minimized by using sufficiently "thin" samples for analysis. s.tl.t.a However, unless absorption
effects are known to be the same for both samples and standards. appropriate corrections
should be made by referencing diagnostic peak areas to an internal standard'·' or fiher
substrate (A g) peak. s.o
'1 2.4.3.3 Particle Size Dependence
Because the intensity of diffracted x-radiation is particle-size dependent, it is essential for
accurate quantitative analysis that both sample and standard reference materials have similar
particle _siie distributions. The optimum particle size (i.e .. fiber length) range for
quantitative analysis of asbestos by XRD has been reported to be I to 10 J.Lffi. 1 ~
Comparability of sample and standard reference material particle size distributions should be
verified by optical microscopy (or another suitable method) prior to analysis.
2.4.3.4 Preferred Orientation Effects
Preferred orientation of asbestiform minerals during sample preparation often poses a
serious problem in quantitative analysis by XRD. A number of techniques have been
developed for reducing preferred orientation effects in "thick layer" samples. 7 · ~ · 15 For "thin"
samples on membrane filters, the preferred orientation effects seem to be both reprodu<:_!ble
and favorable to enhancement of the principal diagnostic reflections of asbestos mineral~.
actually increasing the overall sensitivity of the method. 12•14 However, further investigation
into preferred orientation effects in both thin layer and bulk samples is required.
2.4.3.5 Lack of Suitably Characterized Standard Materials
The problem of obtaining and characterizing suitable reference materials for asbesros
analysis is clearly recognized. The National rnstitute of Standards and Technology can
39
provide standard reference mat~rials for chrysotile. amosite and crocidolite (SRM 1866) and
anthophyllite, tremolite and actinolite (SRM 1867).
[n addition. the problem of ensuring the comparability of standard rderence and sample
materials, particularly regarding crystallite size. panicle size distribution . and degree of
crystallinity, has yet to be adequately addressed. For example, Linger et al. 1 ~ have observed
that in insulating matrices, chrysotile tends to break open into bundles more frequently than
amphiboles. This results in a line-broadening effect with a resultant decrease in sensitivity .
Unless this effect is the same for both standard and sample materials. the amount of
chrysotile in the sample will be under-estimated by XRD analysis. To minimize this
prOblem, it is recommended that standardized matrix reduction procedures be used for both
sample and standard materials.
2.4.4 Precision and Accuracy
Neither the· precision nor accuracy of this method has been determined. The indiv idual
laboratory should obtain or prepare a set of calibration materials containing a range of
asbestos weight percent concentrations in combination with a variety of matrix/binder
materials. Calibration curves may be constructed for use in semi-quantitative analysis of
bulk materials.
2.4.5 Procedure
2.4.5.1 Sampling
Samples taken for analysis of asbestos content should be collected as specitied by EPA19
2.4.5.2 Analysis
All samples must be analyzed initially for asbestos content by PLM. XRD may be used
as an additional technique, both for identification and quantitation of sample components.
Note: Asbestos is a toxic substance. All handling of dry materials should be perfonned
in a safety-hood.
40
ce 4&
' • ... ... ....
..-1 -
2.4.5 .2.1 Sample Preparation
The method of sample preparation required lor XRO analysis will depend on : { 1) the
condition of the sample received (sample size, homogeneity. particle size distribution, and
overall composition as determined by PLM); and (2) the type of XRO analysis to be
perfonned (qualitative or quantitative; thin-layer or bulk) .
Bulk materials are usually received as heterogeneous mi:<tures of complex composition
with very wide particle size distributions. Preparation of a homogeneous. representative
sample from asbestos-containing materials is particularly difficult because the fibrous nature
of the asbestos. minerals inhibits mechanical mixing and stirring, and because milling ~.
procedures may cause adverse lattice alterations.
A discussion of specific matrix reduction procedures is given below. Complete methods
of sample preparation are detailed in Sections 2.4.5 .3 and 2.4.5.4 . Note: All samples
should be examined microscopically before and after each m:1trix reduction step to
monitor changes in sample particle size distribution, composition , and crystallinity, and
to ensure sample representati\'ene.ss and homogeneity for an:1lysis.
2.4.5.2.2 Milling
Mechanical milling of asbestos materials has been shown to decrease fiber crystallinity,
with a resultant decrease in diffraction intensity of the specimen; the degree of lactice
alteration is related to the duration and type of milling process. !O.!J Therefore, all milling
times should be kept to a minimum.
For qualitative analysis , particle size is not usually of critical importance and initial
characterization of the material with a minimum of matrix reduction is often desirable to
document_ the composition of the sample as received. Bulk samples of very large panicle
size(> 2-3 mm) should be comminuted to - 100 JLm. A mortar and pestle can sometimes be
used in size reduction of soft or loosely bound materials though this may cause matting of
some samples. Such samples may be reduced by cutting with a razor blade in a mortar. or
by grinding in a suitable mill (e.g .. a microhammer mill or equivalent) . When using a
mortar for grinding or cutting, the sample should be moistened with ethanol, or some other
41
suitable w~tting Jgent. to minimize exposure, and the procedure should be periormed in a
HEPA-tiltered hood.
For accurate. reproducible quantitative :malysis. the particle size of both sample and
standard materials should be reduced to - 10 J.Lm . Dry ball milling at liquid nitrogen
temperatures (e.g. , Spex Freezer Mill· . or l!qu ivaJent) fo r a maximum time of 10 minutes
(some samples may require much shorter milling time) is recommended to obtain satisfactory
particle size distributions while protecting the integrity of the crystal lattice. 1 Bulk samples
of very large particle size may require grinding in two stages for full matrix reduction to
< 10 J.4m . ~ - 1 6
'Final particle size distributions should always be veritied by optical microscopy or
another suitable method.
2.4.5.2.3 Ashing
For materials shown by PLM to contain large amounts of cellulose or other organic
materials , it may be desirable to ash prior to analysis to reduce background radiation or
matrix inrerference. Since chrysotile undergoes dehydroxylation at temperatures between
ssooc and 650°C, with subsequent transformation to forsterite, !u5 ashing temperatures
should be kept below 500°C. Use of a muf~e furnace is recommended. In all cases,
calibration of the furnace is essential to ensure that a maximum ashing temperature of soooc is not exceeded (see Section 2.3).
2.4.5.2.4 Acid Washing
Because of the interference caused by gypsum and some carbonates in the ,9etection of
asbestiform minerals by XRD (see Section 2.4 .3.1) , it may be necessary to reroove these
interferences by a simple acid washing procedure prior to analysis (see Section 2.3).
2.4.5.3 Qualitative Analysis
2.4.5.3.1 Initial Screening of Bulk Material
Qualitative analysis should be performed on a representative. homogeneous portion of the
sample, with a minimum of sample treatment, using the following procedure:
42
• ·'* ±WE
...
··.--. "':,· .. !:~ ~<C!·:
'
rrt
I. Grind and mix the sample with a mortar and pestle (o r equivalent method, see Section 2.4.5.2.2) to a final particle size sufficiently small ( - 100 }.'tn) to allow adequate packing into a sample holder.
2. Pack sample into a standard bulk sample holder. Care should be taken to ensure that a representative portion of the milled sample is selected for analysis. Particular care should be taken to avoid possible size segregation or the sample. (Note: Use of back·packing metbodz' for bulk sample preparation may reduce preferred orientatio0; effects.)
3. Mount the sample on the diffractometer and scan over the diagnostic peak regions for the serpentine { -7.4 A) and amphibole (8.2-8.5 A) minerals (see Table 2-7). The xray diffraction equipment should be optimized for intensity. A slow scanning speed of 1 ~ 29/min is recommended for adequate resolution. Use of a sample spinner is recommended.
4. Submit all samples that exhibit diffraction peaks in the diagnostic regions for asbestiform minerals to a full qualitative XRD scan (5° -60° 28: I o 28/min) to verify initial peak assignments and to identify potential marrix interferences when subseque:lt quantitative analysis is to be performed.
5. Compare the sample XRD pattern with standard reference powder diffraction patterns (i.e., JCPDS powder diffraction datal or those of other well-characterized reference materials). Principal lattice spacings of asbestiform minerals are given in Table 2-7: common constituents of bulk insulation and wall materials are listed in Table 2-8.
2.4.5.3.2 Detection of Minor or Trace Consrituents
Routine screening of bulk materials by XRD may fail to detect small concentrations
( < l %) of asbestos. The limits of detection will, in general, be improved if matrix
absorption effects are minimized. and if the sample particle size is reduced to the optimal
to 10 ,urn range, provided that the crystal lattice is not degraded in the milling process~
Therefore, in those instances when confirmation of the presence of an asbestiform mineral at
very low levels is required: or where a negative result from initial screening of the bulk
material by XRD (see Section 2.4.5.3.1) is in conflict with previous PLM results, it may be
desirable to prepare the sample as des~ribed for quantitative analysis (see Section 2.4.5.4)
and step·scan over appropriate 28 ranges of selected diagnostic peaks (Table 2-7). Accurate
43
f .if' a .
transfer of the sample to the silver membrane rilter is not necessary un less subsequent
quantitative analysis is to be performed.
2.4.5.4 Quantitative Analysis
The proposed method for quantitation of asbestos in bulk samples is a modification of the
NIOSH-recommended thin-layer method for chrysotile in air.~ A thick-layer bulk method
involving pelletizing the sample may be used for semi-quainitative analysis; u however, this
method requires the addition of an internal standard, use of a specially fabricated sample
press, and rel~tively large amounts of standard reference materials. Additional research is
req~ired to evaluate the comparability of thin- and thick-layer methods for quantitative
isbestos analysis.
For quantitative analysis by thin-layer methods, the following procedure is recommended:
1. Mill and size all or a substantial representative portion of the sample as outlined in Section 2.4.5 .2.2.
2. Dry at 60°C for 2 hours; cool in a desiccator.
3. Weigh accurately to the nearest 0.01 mg.
4. Samples shown by PLM to contain large amounts of cellulosic or other organic materials. gypsum, or carbonates, should be submitted to appropriate matrix reduction procedures described in Sections 2.4.5.2.3 and 2.4.5 .2.4. After ashing and/or acid treatment, repeat the drying and weighing procedures described above. and determine the percent weigh£ loss , L.
5. Quantitatively transfer an accurately weighed amount (50-I 00 mg) of the sample to a l-L volumetric flask containing appro~imately 200 mL isopropanol to which 3 to 4 drops of surfactant have been added.
6. Ultrasonicate for lO minutes at a power density of approximately 0 .1 W/mL, to disperse the sample material.
7. Dilute to volume with isopropanol.
8. Place flask on a magnetic-stirring plate. Stir.
9. Place silver membrane filter on the filtration apparatus, apply a vacuum, and attach the reservoir. Release the vacuum and add several milliliters of isopropanol to the reservolr. Vigorously hand shake the asbestos suspension and immediately withdraw
44
• ~ :as a
--·-
,. . -~--~ :c. .
>: .':.·
an aliquot fro m the center of the suspension so that total sample weight, w,, on the tiller will be approximately 1 mg. Do not adjust the volume in the pipet by expelling part of the suspension; if more than the desired aliquot is withdrawn, discard the aliquot and repeat the procedure with a clean pipet. Transfer the aliquot to the reservoir. Filter rapidly under vacuum. Do not wash the reservoir walls. Leave the tilter apparatus under vacuum until dry. Remove the reservoir, release the vacuum, and remove the filter with forceps. (Note: Wacer·soluble matrix interferences such as gypsum may be removed at this time by careful washing of the tiltrate with distilled water. Extreme care should be taken not to disturb the sample.)
10. Attach the filter to a flat holder with a suitable adhesive and place on the diffractometer. Use of a sample spinner is recommended.
11. For:each asbestos mineral to be quantitated, select a rerlection (or reflections) that has (have) been shown to be free from interferences by prior PLM or qualitative XRD analysis and that can be used unambiguously as an index of the amount of material present in the sample (see Table 2· 7).
12. Analyze the selected diagnostic reflection(s) by step-scanning in increments of 0.02° 28 for an appropriate fixed time and integrating the counts. (A fixed count scan may be used alternatively; however, the method chosen should be used consistently for all samples and standards.) An appropriate scanning interval should be selected for each peak, and background corrections made. For a fixed time scan, measure the background on each side of the peak for one·half the peak-scanning time. The net intensity, 1., is the difference between the peak integrated count and the total background count
13. Determine the net count, I_.,,, of the filter 2.36 A silver peak following the procedure in step 12. Remove the filter from the holder, reverse it, and reattach it to the holder. Determine the net count for the unattenuated silver peak, I~, Scan times may be less for measurement of silver peaks than for sample peaks"; however, they should be constant throughout the analysis.
14. Normalize all raw, net intensities (to correct for instrument instabilities) by referencing them to an external standard (e.g., the 3.34 A peak of an ex-quartz reference crystal). After each unknown is scanned, determine the net count, {
0r> of the reference specimen following the procedure in step 12. Determine
the normalized intensities by dividing the peak intensities by I o,:
45
~a =
2.4.6 Calibration
r ·a
2.4.6.1 Preparation of Calibration Standards
and • 0
lAg
0
=~ r
0 . ~
1. Mill and size standard asbestos materials according to the procedure outlined in Section 2A.5.2.2. Equivalent standardized matrix reduction and sizing techniques should be used for both standard and sample materials.
2. Dry at l00°C for 2 hours; cool in a desiccator.
3. Prepare two suspensions of each standard in isopropanol by weighing approximately lO and 50 mg of the dry material to the nearest 0.01 mg. Transfer each to a 1-L volumetric flask containing approximately 200 mL isopropanol to wh ich a few drops of surfactant have been added.
4. Ultrasonicate for 10 minutes at a power density of approximately 0. 1 W/mL, co disperse the asbestos material.
5. Dilute to volume with isopropanol.
6. Place the flask on a magnetic stirring plate. Stir.
7. Prepare, in triplicate, a series of at least five standard filters to cover the desired analytical range, using appropriate aliquots of the 10 and 50 mg/L suspensions. For each standard, mount a silver membrane filter on the filtration apparatus. Place a few mL of isopropanol in the reservoir. Vigorously hand shake the ~bestos suspension and immediately withdraw an aliquot from the center of the suspension. Do not adjust the volume in the pipet by expelling part of the suspension; if more than the desired aliquot is withdrawn, discard the aliquot and resume the procedure with a clean pipet. Transfer the aliquot to the reservoir.. Keep the tip of the pipet near the surface of the isopropanol. Filter rapidly under vacuum . Do not wash the sides of the reservoir. Leave the vacuum on for a time sufticient to dry the filter. Release the vacuum and remove the filter with forceps .
46
.1
~ ·£;_' : ~· . · ~;~
... _ ·.·_:J;:-... · -&..: .
<•
.. · ~-
I
2.4.6.2 Analysis of Calibration Standards
1. Mount each filter on a flat holder. Perform step scans on selected diagnostic reflections of the standards ~d reference specimen using the procedure outlined in Section 2.4.5.4, step 12, and the same conditions as those used for the samples.
2. Determine the normalized intensity for each peak measured, yo d, as outlined in Section 2.4.5.4, step 14. st
2.4. 7 Calculations
For each asbestos reference material, calculate the exact weight deposited on each
standard ftlt(;r from the concentrations of the standard suspensions and aliquot volumes.
Record the weight, w, of each standard. Prepare a calibration curve by regressing yo d, on st
w. Poor reproducibility (± 15 percent RSD) at any given level indicates problems in the
sample preparation technique, and a need for new standards. The data should fit a straight
line equation.
Determine the slope, m, of the calibration curve in counts/microgram. The intercept,
b, of the line with the t;td axis should be approximately zero. A large negative intercept
indicates an error in determining the background. This may arise from incorrectly measuring
the baseline or from interference by another phase at the angle of background measurement.
A large positive intercept indicates an error in determining the baseline or that an impurity is
included in the measured peak.
Using the normalized intensity, t Ag for the attenuated silver peak of a sample, and
the corresponding normalized intensity from the unattenuated silver peak tAg , of the .sample
filter, calculate the transmittance, T, for each sample as follows: 27•21
Determine the correction factor, f(T), for each sample according to the formula:
47
where
f(T) = -R(ln T)
1 - TR
sin 6Ag R =
8A1 = angular position of the measured silver peak (from Bragg's Law), and
8. ~ angular position of the diagnostic asbestos peal<.
Calculate the weight, W., in micrograms, of the asbestos material anaJyzed for in each
sample, using the absorption corrections:
- b
m
Calculate the percent composition, P., of each asbestos mineral analyzed for in the parent
material, from the total sample weight, Wr. on the filter:
Wa(l- . OlL}
where
w T
P. = percent asbestos mineral in parent material;
W, = mass of asbestos mineraJ on filter, in ,ug:
Wr = total sample weight on filter, in J.Lg;
X 100
L = percent weight loss of parent material on ashing and/or acid treatment (see Section 2.4.5.4).
48
-~
..c .. . ~ ~· . ~ ~ ... -;:-·.:::-
-.· ...
~i-..
· ·: :
: -·
· ·~
.. ·:
. . . ..
2.4.8 References
l. Klug. H. P. and L. E. Alexander. X-Ray Diffraction Procedures fur Pofycr)•stalline and Amorphous Materials. 2nd ~d .. New York: John Wiley and Sons. 1979.
2. Azaroff, L. V. and M. 1. Buerger, The Powder 'let hod of X-Ray Crystallography. New York: McGraw-Hill, 1958.
3. JCPDS-International Center for Diffraction Data Powder Diffrnction Studies. 1601 Park Llne, Swarthmore, PA.
4. Cam,pbc:ll, W. J., C. W. Huggins, and A. G. Wylie, Chemical and Physical Characterization of Amosite, Chrysotile, Crocidolite, and Nontibrous Trcmolite for National Institute of Environmental Health Sciences Oral Ingestion Studies, U.S. Bureau of Mines Report of Investigation Rl8452. 1980 .
'
5. Lange. B. A. and 1. C. Haartz, Determination of microgram quantities of asbestos by x-ray diffraction: Chrysotile in thin dust layers of matrix material, Anal. Chern., 51(4):529-525, 1979.
6. NIOSH Manual of Analytical ~ethods. Volume 5, U.S. Dept. HEW. August 1979. pp. 309-1 to 309-9.
7 . Dunn, H. W. and 1. H. Stewart, Jr., Determination of chrysotile in building materials by x-ray diffractometry, Analytical Chemistry, 54 (7); 1122-1125, 1982 .
8. Taylor, A., Methods for the quantitative determination of asbestos and quartz in bulk samples using x-ray diffraction, The Analyst . I 03(1231): 1009-1020, 1973.
9. Birks, L.. M. Fatemi, J. Y. Gilfrich, and E. T. Johnson, Quantitative Analysis of Airborne Asbestos by X-Ray Diffraction, Naval Research Laboratory Repo'! 7879, Naval Research Laboratory, Washington, DC, 1975 .
10. Asbestos-Containing Materials in School Buildings: A Guidance Document, U. S. Environmental Protection Agency. EPA/OTS No. C00090, March 1979.
11. Krause, J. B. and W. H. Ashton, Misidentification of asbestos in talc, pp. 339-353 , In: Proceedings of Workshops on Asbestos: Definitions and Measurement Methods (NBS Special Publication 506), C. C. Gravatt, P. D. LaFleur, and K. F. Heinrich (eds.), Washington, DC: National Measurement Laboratory. National Bureau of Standards, 1977 (issued 1978).
49
12. Stanley. H. D .• The dc::tection and idt!ntitication of asbc::stos and asbl!stiform minerals in talc . pp. 325-337. In: Proceedings of Workshop on Asbestos: Definitions :1nd Measurement \-1cthods (NBS Special Publication 506). C. C. Gravatt . P. D. LaFleur. and K. F. Heinrich (eds.). Washington . DC: National Mt!asurement Laboratory. National Bureau or Standards, 1977 (issued 1978) .
l3. Rickards , A. L.. Estimation of trace amounts of (1\rysocile asbescos by ~-ray diffraction, Anal. Chern., ~4(11) : 1872-3, 1972.
14. Cook, ? . M., P. L. Smith, and D. G. Wilson. Amphibole tiber concentration and determination for a series of community air samples: use of x-ray diffraction to supplement electron microscope analysis. rn : Electron '1icroscopy and X-Ray Applications to Environmental and Occupation Health Analysis . P. A. Russell and A. E. Hutchings (eds.) . Ann Arbor: Ann Arbor Science Publications. 1977.
15. Rohl, A. N. and A. M. Langer, Identification and quantitation of asbestos in talc , Environ. Health Perspectives, 9:95-109. 1974.
16. Graf, J. L., P. K. Ase, and R. G. Draftz, Preparation and Characteriz.'ltion of Anal)rtical Reference \-laterials, DHEW (NIOSH) Publication No. /9-139, June t979.
17. Haartz, J. C., 8. A. Lange, R. G. Draftz, and R. F. Scholl . Selection and characterization of fibrous and nonfibrous amphiboles for analytical methods development, pp. 295-312, In: Proceedings of Workshop on Asbestos: Definitions and Measurement Methods (NBS special Publication 506). C. C. Gravatt, P. D. LaFleur, and K. F. Heinrich (eds.), Washington . DC: National Measurement Laboratory, National Bureau of Standards, 1977 (issued 1978).
18. Personal Communication, A. M. Langer, formerly of Environmental Sciences Laboratory, Mount Sinai School of Medicine of the City University of New York, New York, NY, now of Brooklyn College, Brooklyn. N.Y.
19. Asbestos in Buildings: Simplified Sampling Scheme for Friable Syrfacing Materials, U.S. Environmental Protection Agency. EPA S60/S-85-030a, October 1985.
20. Langer, A. M., M. S. Wolff, A. N. Rohl, and!. J. Selikoff. Variation of properties of chrysotile asbestos subjected to milling, J. Toxicol. and Environ. Health, 4: t73-l88, 1978.
21. Langer, A. M., A. D. Mack.ler, and F. D. Pooley. Electron microscopical invescigation of asbestos fibers. Environ. Health Perspect., 9:63-80, 1974.
50
•4 Elf
. I
i ~ !
-- .;, .
:~ . ·::r
;2 ~-;._~ , ~
it
22. Occella, E. and G. Maddalon. X-ray diffraction characteristics of some types of asbestos in relation co different techniqu~s of comminution. \ ·ted. Lavoro, 54(10) :628-636. 1963.
23. Spumy. K. R. , W. Stober, H. Opiela, and G. Weiss, On the problem of milling and ultrasonic treatment of asbestos and glass fibers in biological and analytical applications, Am. Ind. Hyg. Assoc. J., 41:198-203. 1980.
24. Berry, L. G. and B. Mason, Mineralogy, San Francisco: W. H. Greeman & Co., 1959.
25. Schelz, J. P., The detection of chrysotile asbestos at low levels in talc by differential thermal analysis, Thennochimica Acta. 8:197-204. !974.
~
26. Reference l, pp. 372-374.
27. Leroux, J., St.aub-Reinha1t Luft, 29:26 (English), 1969 .
28. Leroux. J. A. , B. C. Davey, and A. Paillard. Proposed standard methodology for the evaluation of silicosis hazards, Am. Ind. Hyg. Assoc. J .. 34 :409, 1973.
2.5 Analytical Electron Microscopy
2.5.1 Applicability
Analytical electron microscopy (AEM) can often be a reliable method for the detection
and positive identification of asbestos in some bulk building materials, both friable and
nonfriable. The method is particularly applicable to bulk materials that contain a large
amount of interfering materials that can be removed by ashing and/or dissolution and contain
asbestos fibers that are not resolved by PLM techniques. Many floor tiles and plasters would
be included in this type of sample. In combination with suitable specimen preparation
techniques, the AEM method can also be used to quantify asbestos concentrations.
2.5.2 Range
The range is dependent on the type of bulk material being analyzed. The upper detection
limit is 100%, and the lower detection limit can be as low as 0.0001% depending on the
extent to which interfering materials can be separated during the preparation of AEM
51
specimens, the sophi$tication of the AEM preparation. and the amount of labor (!Xpended on
AEM examination.
2.5.3 Interferences
The presence of a large amount of binder/matrix materials associated with tibers can
make it difficult to positively identify tibers as asbestos. The portion of the tiber examined
by either electron diffraction or energy dispersive x-ray analysis (EDXA) must be free of
binder/ matrix materials.
2.5. 4 Precision and Accuracy
~ The precision and accuracy of the method have not been determined.
2.5.5 Procedures
The procedures for AEM specimen preparation depend on the data required. ln analysis
of floor tiles, the weighed residue after removal of the marrix components (see Section 2.3.
Gravimetry) is often mostly asbestos, and the task is primarily to idenci fy the fibers. In this
situation the proportion of asbestos in the residue can be estimated by AEM and this estimate
can be used to refine the gravimetric result. .For many floor tiles. the final result is not v~ry
sensitive to errors in this estimation because the proportion of asbesros in the residue is very
high. For samples in which this is not the case. precise measuremenrs can be made using a
quantitative AEM preparation, in which each grid opening of the specimen grid corresponds
to a known weight of the original sample or of a concentrate derived from the original
sample. Asbestos fibers on these grids are then identified and measured. using a tiber
counting protocol which is directed towards a precise determinacion of mass C'oncenrration.
This latter procedure is suitable for samples of low asbestos concentration, or '"for those in
which it is ryot possible to remove a large proportion of the matrix material.
2.5.5.1 AEM Specimen Preparation for Semi-Quantitative Evaluation
The residual material from any ashing or dissolution procedures {see Section 2.3) used
(usually trapped on a membrane filter) should be placed in a small volume of ethanol or
another solvent such as acetone or isopropyl alcohol, in a disposable beaker, and dispersed
52
, . . ·.i:f.. . .-~ .. -
d
~~--- .... ~ ··- -----
by treatment in an ulcrasonic bath. A small volume or 1llis suspension (approximately 3J..d)
should be pipetted onto the top of a carbon-coated TEM grid. The sus!Xnsion should be
allowed to dry under a heat lamp. The grid is then ready for l!xamination.
Samples that are not conducive to ashing or dissolution may also be prepared in this way
for AEM analysis. A few milligrams of the sample may be ground in a mortar and pestle or
milled, dispersed in ethanol or another solvent using an ultrasonic bach . and pipetted onto a
grid as described previously.
2.5.5.2 AEM Specimen Preparation for Quantitative Evaluation
The ob~tive of this preparation is to obtain a TEM grid on which a known weight of
the bulk sample is represented by a known area of the TEM grid. A known weight of the
bulk sample, or of the residue after extraction, should be dispersed in a known volume of
distilled wacer. Aliquots of this dispersion should then be tiltered through 0.22 J.Lm pore-size
MCE or 0.2 .urn pore-size PC filters, using filtration techniques as described for analysis of
water samples. 1 In order to obtain filters of appropriate particulate loading for AEM
analysis, it may be necessary to perform serial dilutions of the initial dispersion. TEM grids
should then be prepared from appropriately-loaded filters. using the standard methods. 2
Determination of the mass concentration of asbestos on the TEM grids requires a
different fiber counting protocol than chat usually used for determination of numerical tiber
concentrations. Initially. the grids should be scanned co determine the dimensions of the
largest asbestos fiber or fiber bundle on the specimens. The volume of this tiber or bundle
should be calculated. The magnification of the AEM should be set at a value for which the
length of this fiber or bundle just fills the fluorescent screen. Asbestos fiber counting should
then be continued at this magnification. The count should be terminated when the voiHme of
the initial large fiber or bundle represents less than about 5% of the integrated volume of all
asbestos fibers detected. This counting strategy ensures that the fiber counting e.ffort is
directed toward those fibers which contribute .most to the mass, and permits a precise mass
concentration value to be obtained.
53
ps .. =
2.5.5 .2.1 ldentitication
To document the positive identification of ;tsbestos in a sample. the analyst should recorc
the following physical properties: mofl)hology data. electron diffraction data, EDXA data.
and any other distinguishing characteristics observed . For fibrous structures idemified as
nonasbestos, the unique physical property or properties that differentiate the material from
asbestos should be recorded.
The purpose of the identification data collected is to prevent or limit false negatives and
false positives. This can be accomplished by having a system for measuring and recording
the d-spacings and symmetry of the diffraction patterns, determining the relative abundance
oj. the elementS detected by EDXA, and comparing these results to reference data. The
laboratory should have a set of-reference asbestos materials from which a set of reference
diffraction patterns and x-ray spectra have been developed. Also, the laboratory should have
available reference data on the crystallography and chemical composition of mineraJs that
might analytically interfere with asbestos.
2.5.6 References
1. Chatfield, E.J., and M. 1. Dillon. Analytical Method for Detennination of Asbestos Fibers in Water, EPA-600/4·83-043. U.S. Environmenr.a.l Protection Agency Environmental Research Laboratory, t 983.
2. Environmental Protection Agency's Interim Transmission Electron i\·Ucroscopy Analytical Methods--Mandatory and Nonmandatory--and Mandatory Section to Detennine Completion of Response Actions, Appendix A to subpart E, 40 CFR part 763.
2.6 Other Methodologies
Additional analytical methods (e.g. Scanning Electron Microscopy) may be applicable for
some bulk materials. However, the analyst should take ca~e to recognize the limitations of
any analytical method chosen. Conventional SEM. for example. cannot detect small
diameter fibers ( - < 0.2~m), and cannot determine crystal structure. It is, however, very
useful for observing surface features in complex particle matrices, and for determining
elemental compositions.
54
.. . . . .. -··· -· . .. --------~..,....~----·
!
l . .. I
· -,.-.
,~: A.!£: . ~
' . . . ;"--.: : ,:·.
'-~·.: ..
d
3.0 QUALITY CONTROL/QUALITY ASSURANCE OPERATIONS- PL.\1
A program to routinely assess the quality of the results producc!d by the PLM laboratory
must be developed and implemented. Quality Control (QC) is a systl!m of activities whose
purpose is to control the quality of the product or service so that it meets the need of the
users. This also includes Quality Assessment. whose purpose is co provide assurance that
the overall quality control is being done effectively. While che essential elements of a quality
control system are described in detail elsewhere, u.J.u.6 on! y several of the elements will be
discussed here. Quality Assurance (QA) is comprised of Quality Control and Quality
Assessment and is a system of activities designed to provide assurance that a product or ~ .
service meers dettned standards of quality.
The purpose of the Quality Assurance program is to minimize failures in the analysis of
materials prior to submitting the results to the client. Failures in the analysis of asbestos
materials include false positives, false negatives, and misidentification of asbestos types.
False positives result from identification or quantitation errors. False negatives result from
identification, detection, or quanritation errors.
For the stereomicroscopic and PLM techniques, the quality control procedures should
characterize the accuracy and precision of both individual analysts and the techniques.
Analysts should demonstrate their abilities on calibration materials. and also be checked
routinely on the analysis of unknowns by comparison with results of a second analyst. The
limitations of the stereomicroscopic and PLM techniques can be determined by using a
second analytical technique, such as gravimetry, XRD, or AEM. For example,
stereQmicroscopic and PLM techniques can fail in the analysis of floor tiles because the -
asbestos fibers in the sample may be too small to be resolved by light microscopy. An XRD
or AEM analysis is .not subject to the same limitations, and may indicate t.he presence of
asbestos in the sample.
The accuracy, precision, and detection limits of all analytical techniques described in this
method are dependent on the type of sample (matrix components, texture, etc.), on the
preparation of the sample (homogeneity, grain size, etc.) , and the specifics of the method
(number of point counts for PLM. mass of sample for gravimetry. counting time for XRD,
55
-------·-----·-
etc.). These should be kept in mind when designing quality control procedures aJld
characterizing performance, and are variables that must be t rack~ in the quality assurance
system.
3.1 General Considerations
3. 1. 1 Training
Of paramount importance in the successful use of chis or aiiY other analytical method is
the well-trained aJlalyst. It is highly recommended that the aJlalyst have completed course
work in optical mineralogy on the collegiate level. That is not to say that others cannot
s~cessfully use this method, but the classification error rate7 may. in some cases, be directly
attributable to level of training. In addition to completed course work in optical mineralogy,
specialized course work in PLM aJld asbestos identification by PLM is desirable. Experience
is as important as education. A good laboratory training program can be used in place of
course work. Analysts that are in training aJld not yet fully qualified should have aJI
analyses checked by a qualified aJlaiyst before results are released. A QC Plan for asbestos
identification would be considered incomplete without a detai led description of the aJlalyst
training program, together with detailed records of training for each aJlalyst.
3.1.2 Instrument Calibration and Maintenance
Microscope alignment checks (alignment of the polarizer at 90° with respect to the
analyzer, and coincident with the cross-lines, proper orientation of the slow vibration
direction of the Red I compensator plate, image of the field diaphragm focussed in the plane
of the specimen, centering of the central dispersion staining stop, etc.) should._ be performed
with sufficient frequency to ensure proper operations. Liquids used for refractive index
determinatiqn and those optionally used for dispersion staining should have periodic
refractive index checks using a refractometer or known refractive index solids. These
calibrations must be documented.
Microscopes and ancillary equipment should be maintained daily. It is recorr.mended that
at least once per year each microscope be thoroughly cleaned and re-aligned by a
professional microscope service technician. Adequate inventories of replaceable parts
56
~ ...
(illumination lamps. etc.) should be established and maintained. All maintenance must be
documented.
3.2 Quality Control of Asbestos Analysis
3.2.1 Qualitative Analysis
All analysts must be able to correctly identify the six regulated asbestos types (chrysotile.
amosite, crocidolite, anlhophyllite, actinolite, and tremolite) using combined
stereomicroscopic and PLM techniques. Standards for the six asbestos types listed are
available from NIST, and should be used to train analysts in the measurement of optical
properties and~ identification of asbestos. These materials can also be used as identification
standards for XRD and AEM.
Identification errors between asbestos types (e.g. reporting amosite when tremoli te is
present) implies that the analyst cannot properly determine optical properties and is re lying
on morphology as the identification criteria. This is not acceptable. Each analyst in the lab
should prove his or her proficiency in identifying the asbestos types; this can be checked
through use of calibration materials (NVLAP proficiency resting materials. materials
characterized by an independent technique, and synthesized materials) and by comparing
results with another analyst. The identification of all parameters (e.g. refractive indices,
birefringence, sign of elongation, etc.) leading to the identification should fal l within control
limits determined by the laboratory. In addition, a subset of materials should be analyzed
~- ~ using another technique to confirm lhe analysis.
As discussed earlier, the qualitative analysis is dependent upon matrix and asbestos type
and texture. Therefore, the quality assurance system should monitor for samples that are
difficult to analyze and develop additional or special steps to ensure accurate characterization
of these materials. When an analyst is found to be out of the control limits defined by the
laboratory, he or she should undergo additional training and have confirmatory analyses
performed on ill samples until the problem has been corrected.
57
3.2.2 Quantitative Analysis
The determination of the amount of asbestos in a sample can be accomplished using the
various techniques outlined in this method. The mandatory stereomicroscopic and PLM
examinations provide concentrations in terms of volume, area. or weight, depending upon the
calibration procedure. Gravimetric and quantitative XRD techniques result in concentrations
in unitS of weight percent. Specific guidelines for determining accuracy and precision using
these techniques are provided in the appropriate sections of this method. rn general,
however, the accuracy of any technique is determined through analysis of calibration
materials which are characterized by multiple independent techniques in order to provide an
unbiased value for the analyte (asbestos) in question. The precision of any technique is
determined by multiple analyses of the sample. The analyst is the detector for
stereomicroscopic and PLM techniques. as opposed to gravimetric and XRD techniques, and
therefore must be calibrated as an integral part of the procedure.
As in the qualitative analysis, the laboratory should determine its accuracy and prttision
for quantitative asbestos analysis according to the type of material analyzed and the technique
used for analysis. For example, the laboratory may determine that its analysts have a
problem wich calibrated area estimates of samples conlaining cellulose and chrysocile and
therefore needs to make or find special calibration materials for this class of sample.
Calibration materials for quantitative analysis of asbestos are available through the Bulk
Asbestos NVLAP as proficiency testing materials for those laboratories enrolled in NV LAP.
In a report provided following a test round, the concentration of asbestos in each sample is
given in weight percent with 95%/95% tolerance limits, along with a description of the ...
major matrix componentS. Materials from other round robin and quality assurance programs
for asbestos analysis may not have been analyzed by independent techniques; the
concentrations may represent consensus PLM results that could be significantly biased.
Therefore, values from these programs should 1lQ! be used as calibration materials for
quantitative analysis.
Calibration materials for quantitative analysis can also be synthesized by mixing asbestos
and appropriate matrix materials, as described in Appendix C of this method. These
58
.. .
·.~ ·
materials are usually simplifications of "real world" sampks: therer'ore the accuracy and
precision determined from analysis of these materials are probably ideal.
Limits on permissible analytical variability must be established by the laboratory prior to
QC implementation. It is recommended that a laboratory initially be at 100% quality control
(all samples reanalyzed.) The proportion of quality control samples can later be lowered
gradually, as control indicates, to a minimum of 10%. Quantitative results for standards
including the mean and error estimate (typically 95 5'o confidence or tolc:rance intervals)
should be recorded. Over time these data can be used to help determine control limits for
quality control charts.
"' The estab1ishment and use of control chartS is extensively discussed elsewhere in the
literature. l.l.J.• . .s Several cautions are in order:
• Control charts are based on the assumption that the data are distributed normal! y. Using rational subgrouping , the means of the subgroups are approximately normally distributed, irrespective of the distribution of the individual values in the subgroups. Control charu for asbestos analysis are probably going to be based on individual measurements, nor rational subgroups. Chc:ck the data for normality before proceeding with the use of control charts. Ryans suggests a minimum of 50 analyses before an attempt is made to establish control limits. However, for this analysis, consider setting "temporary" limits after accumulating 20-30 analyses of the sample.
• Include both prepared slides as well as bulk samples in your reference inventory.
• Make certain that sample quantities are sufficient to last, and that rhe acr of sampling will not alter the composition of the reference sample.
Data on analytical variability can be obtained by having analysts repeat their analyses of
samples and also by having different analysts analyze the same samples.
3.3 Interlaboratory Quality Control
The. establishment and maintenance of an inrerlaboratory QC program is fundamental to
continued assurance that the data produced within the laboratory are of consistem high
quality. Intralaboratory programs may not be as sensitive to accuracy and precision error.
especially if the control charts (see Section 3.2.2) for all analysts in the laboratory indicate
small percent differences. A routine interlaboratory testing program will assist in the
detection of internal bias and analyses may be performed more frequently than proficiency
59
testing. Arrangements should be made with at least two (preferably more) other laboratories
that conduct asbestos identification by PLM. Samples (the number of which is left to the
participating laboratories, but at least 4-l 0) representing the types of samples and matrices
routinely submitted to the Jab fo r analysis should be exchanged with sufficient frequency to
determine intralaboratory bias. Both reference slides and bulk samples should be used.
Results of the interlaboratory testing program should be evaluated by each of the
pan.icipating laboratories and corrective actions, if needed, identified and implemented.
Since quantitation problems are more pronounced at low concentrations (::; 5% ). it would be
prudent :ff> include approximately 30-50% from this concentration range in the sample
selection process.
3.4 Perfonnance Audits
Performance audits are independent quantitative assessments of laboratory performance.
These audits are similar to the interlaboratory QC programs established between several
laboratories, but with a much larger cohort (the EPA Asbestos Bulk Sample Analysis Quality
Assurance Program had as many as 1100 participating laboratories) . Participation in this
type of program permitted assessment of performance through the use of "consensus" test
materials, and served to assist in assessing the bias relative to individual interlaboratory, as
well as intraJaboratory programs. Caution should be exercised in the use of "consensus"
quantitation results, as they are likely to be significantly responsible for the propagation of
high bias in visual estimates. The current N1ST/NVLAP9 for bulk asbestos laboratories
(PLM) does not use concensus quantitation results . Results are reported in weight percent
with a 95% tolerance interval. The American Industrial Hygiene Association (AIHA)10 also
conducts a proficiency testing program for bulk asbestos laboratories. Quantitation results
for this program are derived from analyses by two reference laboratories and PLM, XRD
and gravimetric analysis performed by Research Triangle lnstitute.
3.5 Systems Audits
Where performance audits are quantitative in nature. systems audits are qual itative.
Systems audits are assessments of the laboratory quality system as specit'ied in the laboratory
60
:..:_· .
·' I :"'!:.: : •;
: ' .. ..
-·· :,... .. =i-: ~~ .. . ,
. ·~ -::·
~
j I
!
I l
I i
····- -----
Quality Assurance Manual. Such an audit might consist or an evaluation of some facet of the
QA Manual, or the audit may be larger in scope. For e:Jlample, the auditor might request
specific laboratory data sheets which will be evaluated against written procedures for data
recording in the laboratory. Or, the auditor might request air monitOring or contamination
control data to review for frequency of sampling, analysis methodology. and/or corrective
actions taken when problems were discovered. The audit report should reflect the nature of
the audit as well as the audit results. Any recommendations for improvement should also be
reflected in such a report.
3.6 References ~
1. Quality Assurance for Air Pollution Measurement Systems. Volume I, Principles. EPA-600/9-76-005, March, 1976.
2 . Juran, J. and F. Gryna, Quality Planning Analysis, 2nd edition, McGraw-Hill, Inc., 1980.
3. Taylor, J.R. , Quality Control Systems, McGraw Hill, Inc., 1989.
4 . Ratliff, T.A. , The Laboratory Quality Assurance System, Van Nostrand Reinhold , 1990.
S. Taylor, J.K., Quality Assurance of Chemical Measurements, ~wis Publishers, 1987.
6. Bulk Asbestos Handbook, National Institute of Standards and Technology. National Voluntary Laboratory Accreditation Program. NISTIR 88-3879. October 1988.
7. Harvey. B. W .• ·classification and Identification Error Tendencies in Bulk lnsulation Proficiency Testing Materials: American Environmental Laboratory , 2(2), 4/90, pp. 8-l4.
8. Ryan , T .P.·, Statistical Techniques ror Quality Improvement, John Wiley & Sons. Inc. , New York, 1989.
9. National Institute of Standards & Technology (NlST) National Voluntary Laboratory Accreditation Program (NVLAP), Building 4\ \. Room A \24 . Gaithersburg, MD 20899. telephone (JO I) 975-4016.
10. American Industrial Hygiene Association (AIHA). 2700 Prosperity Avenue, Suite 250, Fairfax, VA 22031, (703) 849-8888.
61
·-· ·· ------
.. APPENDIX A .~ ..
Glossary Of Terms
fl ~- 1
il - I .... :
~ :
~ ,... -~ ; :-
-A -
. :
·;ii:.t;· ·~-· ···~ .... -
APPEJ"lDIX A. GLOSSARY OF TER.\tS
Accuracy - The degree of agreement of a measured value with the true or expected value.
Anisotropic - Refers to substances that have more than one refractive index (e.g. are birefringent), such as nonisometric crystals. oriented polymers, or strained isotropic substances.
Asbestiform (morphology) · Said of a mineral that is like asbestos. i.e .. crystallized with the habit of asbestos. Some asbestiform minerals may lack the properties which make asbestos commercially valuable, such as long fiber length and high tensile strength. With the light microscope. the asbestiform habit is generally recognized by the following characteristics:
:-:1
• Mean aspect ratios ranging from 20: 1 to I 00: I or higher for fibers longer than 5,um. Aspect ratios should be determined for fibers. not bundles.
• Very thin fibrils, usually less than 0.5 micrometers in width, and
• Two or more of the following:
- Parallel fibers occurring in bundles .
• Fiber bundles displaying splayed ends,
- Matted masses of individual fibers. and/or
• Fibers showing curvature
These characteristics refer to the population of fibers as observed in a bulk sample. It is not unusual to observe occasional particles having aspect ratios of I 0: I or less, but it is unlikely that the asbestos component(s) would be dominated by particles (individual fibers) having aspect ratios of < 20: I for fibers longer than 5p.m. If a sample contains a fibrous component of which most of the fibers have aspect ]atios of < 20:1 and that do not display the additional asbestiform characteristics, by definition the component should not be considered asbestos.
Asbestos • A commercial term applied to the asbestiform varieties of six different minerals. The asbestos types are chrysotile (asbestiform serpentine). amosite (asbestiform grunerite), crocidolite (asbestiform riebeckite), and asbestiform anthophyllite, asbestiform tremolite, and asbestiform actinolite. The propenies of asbestos that caused it to be widely used commercially are: l) its ability, to be separated into long. thin, flexible fibers; 2) high tensile strength; 3) low thermal and electrical conductivity; 4) high mechanical and chemical durabil ity, and 5) high heat resistance.
A·l
Becke Line - A. band of light seen at the periphery of a specimen when the refractive indices of the specimen and the mounting medium are different: it is used to determine refractive index.
Bias - A systematic error characterized by a consistent (non-random) measurement error.
Binder - With reference to a bulk sample, a component added for cohesiveness (e.g. plaster. cement, glue, etc.).
Birefringence -The numerical difference between the maximum and minimum refractive indices of an anisotropic substance. Birefringence may be estimated, using a Michel-Levy chart, from the interference colors observed under crossed polarizers. Interference colors are also dependent on the orientation and thickness of the grain . . and therefore are used qualitatively to determine placement in one of the four
:-1. categories listed below.
Qualitative none low moderate high
Ouantitative{N-n) 0. 00 or isotropic
~0.010
0.011-0.050 >0.050
Bulk Sample - A sample of building material taken for identification and quantitation of asbestos. Bulk building materials may include a wide variety of friable and nonfriable materials.
Bundle - Asbestos structure consisting of several fibers having a common axis of elongation.
Calibration Materials - Materials, such as known weight % standards. that assist in the calibration of microscopists in terms of ability to quantitate the asbestos content of bulk materials.
Color - The color of a particle or tiber when observed in plane polarized light. _
Compensator - A device with known, fixed or variable retardation and vibration direction used for detennining the degree of retardation (hence the thickness or value of birefringence) in an anisotropic specimen. It is also used to d~termine the sign of elongation of elongated materials. The most common compensator is the first-order red plate (530-550nm retardation).
Control Chart - A graphical plot of test results with respect to time or sequence of measurement, together with limits within which they are expected to lie when the system is in a state of statistical control.
A-2
<C.£ [Jf
Detection Limit - The smallest concentration/amount of some component of interest that can be measured by a single measurement with a stated level of confidence.
Dispersion Staining (focal masking) - An optical means of impaning apparent or virtuaJ color to transparent substances by the use of stops in the objective back focaJ plane; ir it is used to determine refractive indices.
Error - Difference between the true or expected value and the measured value of a quantity or parameter.
Extinction - The condition in which an anisotropic substance appears dark when observed between crossed polars. This occurs when the vibration directions in the specimen are parallel to the vibration directions in the polarizer and analyzer. Extinction may be complete or incomplete; common types include parallel, oblique, symmetrical and undulose.
Extinction Angle - For fibers, the angle between the extinction position and the posicion at which the fiber is parallel to the polarizer or analyzer privileged directions.
Fiber - With reference to asbestiform morphology , a structure consisting of one or more fibrils.
Fibril - The individual unit structure of fibers.
Friable - Refers to the cohesiveness of a bulk material, indicating that it may be crumbled or disaggregated by hand pressure.
Gravimetry - Any technique in which the concentration of a component is determined by weighing. As used in this document, it refers to measurement of asbestos-containing residues after sample treatment by ashing, dissolution, etc.
Homogeneous - Uniform in composition and distribution of all components of a material, such that multiple subsamples taken for analysis will contain the same components- in approltimately the same relative concentrations. ~
Heterogeneous - Lacking uniformity in composition and/or distribution of material; components not uniform. Does not satisfy the conditions stated for homogenous; e.g., layered or in clumps, very coarse grained, etc.
Isotropic - Refers to substances that have a single refractive index such a.s unstrained glass, un-oriented polymers and unstrained substances in the isometric crystal system.
A-3
Lamda Zero (.AJ - The wavelength (~,) of the dispersion staining color shown by a specimen in a medium; both the SjXCimen and medium have the same refractive index at that wavelength.
Matrix - Nonasbestos, nonbinder components of a bulk materiaL Includes such components as cellulose, fiberglass, mineral wool, mica, etc.
Michel-Levy Scale of Retardation colors - A chart plotting the relationship between birefringence, retardation and thickness of anisotropic substances. Any one of the three variables can be determined if the other two are known.
Morphology - The structure and shape of a particte. Characterization may be descriptive (platy, rod-like, acicular. etc) or in terms of dimensions such as length and diameter (see asbestiform) . . ,
·.~
Pleochroism - The change in color or hue of colored anisotropic substance when rotated relative to the vibration direction of plane polarized light.
Point Counting - A technique used to determine the relative projected areas occupied by separate components in a microscope slide preparation of a sample. For asbestos analysis, this technique is used to determine the relative concentrations of asbestos minerals to nonasbestos sample components.
Polarization Colors - Interference colors displayed by anisotropic substances between two polarizers. Birefringence, thickness and orientation of the material affect the colors and their intensity.
Precision - The degree of mutual agreement characteristic of independent measurements as the result of repeated application of the process under specified conditions. It is concerned with the variability of results.
Reference Materials • Bulk materials, both asbestos-containing and nonasbestoscontaining, for which the components are well-documented as to identifi~tion and quantitation.
Refractive Index (index of refraction) - The ratio of the velocity of light in a vacuum relative co the velocity of light in a medium. It is expressed as n and varies with wavelength and temperature.
Sign of Elongation - Referring to the location of the high and low refractive indices in an elongated anisotropic substance, a specimen is described as positive when the higher refractive index is lengthwise (length slow), and as negative when the lower refractive index is lengthwise (length fast).
A-4
PC L@lf
Standard Reference Material (SR.l\1) - A r~ference mall!riaJ certified and distribuled by 1he National Institute of Standards and Technology.
Visual Estimate - An estimation of concentration of asbestos in a sample as compared to the other sample components. This may be a volume estimate made during stereomicroscopic examination and/or a projected area estimation made during microscopic (PLM) examination.
A-5
"' $4 " 4 p .t.J¥9 I. U jO
1 i I
APPENDlX B
Apparatus For Sample Preparation And Analysis
-
81.0 INTRODUCTION
The following lists the apparatus and materials required and suggested for the methods of
sample preparation and analysis described in the test method. '·2·'
82.0 STEREOMICROSCOPIC EXAl\IIINA TION
The following are suggested for routine stereomicroscopic examination.
• HEPA-tiltered hood or class I biohazard hood, negative pressure
• Micr~ope: binocular microscope, preferably stereoscopic, S-60X magnification (approximate)
• Light source: incandescent or fluorescent
• Tw~zers, dissecting needles, scalpels, probes, etc. (for sample manipulation)
• Glassine paper, glass plates, weigh boats, petri dishes, watchglasses, etc. (sample containers)
The following are suggested for sample preparation.
• Mortar and pestle, silica or porcelain-glazed
• Analytical balance (readability less than or equal to one milligram) (optional)
• Mill or blender (optional)
83.0 . POLARIZED LIGHT MICROSCOPY
The laboratory should be equipped with a polarized light microscope (preferably capable
of Kohler or Kohler-type illumination if possible) and accessories as described below.
• Ocular(s) binocular or monocular with cross hair reticle, or functional equivalent, and a magnification of at least 8X
• lOX, 20X, and 40X objectives, (or similar magnification)
B-1
................. -· .. . -
• Light source (with optional blue "day-light" tilter)
• 360-degree rotatable stage
• Substage condenser with iris diaphragm
• Polarizer and analyzer which can be placed at 90 dl!grees to one another. and can be calib rated relative to the cross- line reticle in the ocular.
• Accessory slot for wave plates and compensators (or demonstrated equivalent).
• Wave retardation plate (Red ! compensator) with approximately 550 nanometer retardation, and with known slow and fast vibration directions.
; Dispersion staining objective or a demonstrated equivalent. (optional)
• Monochromatic fllter (n0 ). or functional equivalent. (optional)
In addition, the following equipment, materials and reagents are required or recommended. 1
•
• NIST traceable standards for the major asbestos ' types (NIST SRM 1866 and 1867)
• Class I biohazard hood or better (see "Note". Section 2.2.5)
• Sampling utensils (razor knives, forceps, probe needles, etc.)
• Microscope slides and cover slips
• Mechanical Stage
• Point Counting Stage (optional)
• Refractive index liquids: 1.490-1.570, 1.590-1.720 in increments of less than or equal to 0.005; high dispersion, (HD) liquids are optional; however, if using dispersion staining, HD liquids are recommended.
• Mortar and pestle
• Distilled water
• HCl, ACS reagent grade concentrated
B-2
.. ~
--
------ ----··------ . -·-- ···- -- -- ..
• Mur'tl c: furnace (opt ional)
• Mill or blender (optional)
• Beakers and assorted glassware (optional)
• Other reagents (tetrahydrofuran, amyl acetate, acetone. sodium hexametaphosphate, etc.) (optional)
84.0 GRAVIMETRY
The following equipment, materials, and reagents are suggested.
• Scalpels
• Crucibles, silica or porcelain-glazed, with lids
• Muffle furnace- temperature range at least to 500°C, temperature stable to + 10°C, temperature at sample position calibrated to ± 10°C
• Filters, 0.4 ,u..m pore size polycarbonate
• Petri dishes
• Glass filtration assembly, including vacuum flask. water aspirator, and/or air pump
• Analytical balance, readable to 0.001 gram
• Mortar and pestle, silica or porcelain-glazed
• Heat lamp or slide warmer
• Beakers and assorted glassware
• Centrifuge, bench-top
• Class I biohazard hood or better
• Bulb pipettes
• Distilled water
• HCl , reagent-grade concentrated
B-3
• Organic solvents (tetrahydrofuran, amyl acetate,etc)
• Ultrasonic bath
BS.O X-RAY DlFFRACTION
Sample Preparation
Sample preparation apparatus requirements will depend upon the sample type under
consideration and the kind of XRD analysis to be performed.
• Mortar and pestle: agate or porcelain
~ • Razor blades
• Sample mill: SPEX, Inc., freezer mill or equivalent
• Bulk sample holders
• Silver membrane filters: 25-mm diameter. 0.45-J.Lm pore size. Selas Corp. of America, Flotronics Div ., 1957 Pioneer Road , Huntington Va11ey , PA 19006
• Microscope slides
• Vacuum filtration apparatus: Gelman No. 1107 or equivalent, the side-arm vacuum flask
• Microbalance
• U1traSonic bath or probe: Model W 140, Ultrasonics. Inc .. operated at a power density of approximately 0.1 W /mL, or equivalent
• Volumetric flasks: 1-L volume
• Assorted pipets
• Pipet bulb
• Nonserrated forceps
• Polyethylene wash bottle
• Pyrex beakers: 50-mL volume
......
-- -······ ·-·--------
• Desiccator
• Filter storage cassettes
• Magnetic surring plate and bars
• Porcelain crucibles
• Muffle furnace or low temperature asher
• Class 1 biohazard hood or better
Sample A~lysis
Sample analysis requirements include an x-ray diffraction unit. equipped with:
• Constant potential generator: voltage and rnA stabilizers
• Automated diffractometer with step-scanning mode
• Copper target x-ray tube: high intensity; fine focus, preferably
• X-ray pulse height selector
• X-ray detector (with high voltage power supply): scintillation or proportional counter
• Focusing graphite crystal monochromator; or nickel filter (if copper source is used, and iron fluorescence is not a serious problem)
• Data output accessories: - Strip chart recorder - Decade scaler/timer - Digital printer
or
- PC, appropriate software and Laser Jet Printer
• Sample spinner (optional)
• Instrument calibration reference specimen: a-quartz reference crystal {Arkansas quartz standard, # 180-14 7-00, Philips Electronics Instruments, Inc., 85 McKee Drive, Mahwah. NJ 07430) or equivalent.
B-5
Re:1gents, ere.
Reference Materials • The list of reference macerials below is incended to serve as a guide.
Every attempt should be made to acquire pure reference materials that are comparable to
sample materials being analyzed.
• Chrysotile: UICC Canadian, NlST SRM 1866 (UICC reference material available from: UICC, MRC Pneumoconiosis Unit, Llandough Hospital. Penarth, Glamorgan, CF61 XW, UK); (NIST Standard Reference Materials available from the National institute of Standards and Technology, Office of Reference Standards, Gaithersburg, MD 20899)
• Crocidolite: UICC, NIST SRM 1866 .
.... i "Amosite": UICC, NIST SRM 1866.
• Anthophyllite-Asbestos: UICC, NIST SRM 1867
• Tremolite Asbestos: Wards Natural Science Establishment, Rochester, NY; Cyprus Research ·standard, Cyprus Research, 2435 Military Ave., Los Angeles, CA 900064 (washed with dilute HCI to remove small amount of calcite impurity); lndian tremolite, Rajasthan State, India; NIST S RM 186 7.
• Actinolite Asbestos: N1ST SRM 1867
Adhesive - Tape, petroleum jelly, etc. (for attaching silver membrane filters to sample
holders).
Surfactant - I Percent aerosol OT aqueous solution or equivalent.
Isopropanol · ACS Reagent Grade.
B6.0 ANALYTICAL ELECTRON MICROSCOPY
AEM equipment requirements will not be discussed in this document; it is suggested that
equipment requirements stated in the AHERA regulations be followed . Additional
information may be found in the NVLAP Program Handbook for Airborne Asbestos
Analysis. 3
B-6
... -
The following additional materials and equipment are suggt:sted :
• Analytical balance. readable to 0.00 I gram
• Ultrasonic bath
• Glass filtration assembly (25mm}, including vacuum tlask and water aspiralOr
• Mixed cellulose ester (MCE) filters (0.22J.tm pore size} or 0.2J.tm pore size polycarbonate filters
• MCE backing filters (5J.tm pore size)
• Silica morur and pestle
• Beakers-;· glass and disposable
• Pipettes, disposable, 1,5, and 10 ml
B7.0 REFERS~CES
l. National Institute of Standards and Technology (Ntsn Na.tional Voluntary Laboratory Accreditation Program (NVLAP) Bulk Asbestos Handbook, NISTIR 88-3879 , 1988.
2. Interim Method for the Determination of Asbestos in Bulk Insulation Samples, U.S. E.P.A. 600/M4-82·020, 1982.
3. National Institute of Standards and Technology (NIST) National Voluntary Laboratory Accreditation Program (NYLAP) Program Handbook for Airborne Asbestos Analysis. NISTIR 89-4137, 1989.
B-7
I. !.
----------------
APPENDlX C
Preparation and Use of Bulk Asbestos Calibration Standards
-..
··---······ ------------
Cl.O INTRODUCTION
Evaluation of the results from national proficiency testing programs for laboratories
analyzing for asbestos in bulk materials indicates that laboratories have had. and continue to
have, problems with quantiution of asbestos content. especially with samples having a low
asbestos concentration. 1 For such samples, the mean value of asbestos content reported by
laboratories may be four to ten times the true weight percent value. It is assumed that the
majority of the laboratories quantify asbestos content by visual estimation. either
stereomicroscopically or microscopically; therefore. the problem of quantitation must be
attributed \? lack of or inadequate calibration of microscopists.
As calibration standards for asbestos-containing bulk materials are not currently
commercially available, laboratories should consider generating their own calibration
materials. This may be done rather easily and inexpensively.
C2.0 MATERIALS AND APPARATUS
Relatively pure samples of asbestos minerals should be obtained. Chrysotile. amosite and
crocidolite (SRM 1866) and anthophyllite, tremolite and actinolite (SRM 1867) are available
from NIST. A variety of matrix materials are commercially available; included are calcium
carbonate, perlite, vermiculite, mineral wool/fiberglass, and cellulose. Equipment. and
materials needed to prepare calibration bulk materials are listed below.
• Analytical balance, readable to 0.00 I gram
• Blender/mixer; multi-speed, - one quart capacity
• Filtration assembly, including vacuum flask. water aspirator and/or air pump (optional)
• HEPA-filtered hood with negative pressure
• Filters, 0.4J-Lm pore size polycarbonate (optional)
• Beakers and assorted glassware, weigh boats. petri dishes, etc.
• Hot/warm plate
C-1
• Asbestos minerals
• Matrix materials
• Distilled water.
CJ.O MATERIAL FORMULATION PROCEDURES
The formuiation procedure involves first weighing appropriate quantities of asbestos anc
matrix material to give the desired asbestos weight percent. The following formula may be
used to determine the weights of asbestos and matrix materials needed to give a desired
weight percent asbestos.
WTa WTm ~ Wa -wm
Where:
WTa = weight of asbestos in grams (to 0.001 gram) WTm = weight of matrix. materials in grams (to 0.001 gram) Wa = weight percent asbestos Wm = weight percent matrix
Example: The desired total weight for t.he calibration sample is - lO grams containing 5% asbestos by weight. If 0.532 grams of asbestos are first weighed out, what corresponding weight of matrix material is required'?
WTa Wa Wm
= 0.532 grams =5% = 95%
Q.Jll_ wrm 5 - 95
Then: WTm = 10.108 grams
. The matrix is then placed into the pitcher of a standard over-the-counter blender, the
pitcher being previously filled to approximately one-founh capacity (8-10 ~nces) with
distilled water. Blending is performed at the lowest speed setting for approximately ten
seconds which serves to disaggregate the matrix material. The asbestos is then added, with
additional blending of approximately 30 seconds, again at the lowest speed setting. Caution
should be taken not to overblend the asbestos-matrix mixture. This could result in a
significant reduction in the size of the asbestos fibers causing a problem with detection at
normal magnification during stereomicroscopic and microscopic analyses. Ingredients of the
C-2
pitcher are then poured into a filtering apparatus. with thorough rinsing of the pitcher to
ensure complete material removal. After filtering, the mat~rial is transferred to a foil dish
which is placed on a hot plate. The material is covered and allowed to sit ov~r low heat
until drying is complete; intermittent stirring will speed the drying process. For fine-grained
matrix materials such as gypsum, calcium carbonate. clays. etc., the sample is not filtered
after the blending process. Instead, the ingredients in the pitcher are transferred into a series
of shallow. glass (petri) dishes. The ingredients should be stirred well between each
pouring to minimize the possible settling (and over-representation) of some components. The
dishes are covered and placed on a hot plate until the contents are thoroughly dried. For
small guaoi)ties of any matrix materials 05 grams or less), air-drving without Qrior filtering
is ~eneralty very suitable for removin& water from the Qrepared samQie. For each material,
the final step involves placing all formulated, dried subsamples into a plastic bag (or into one
petri dish, for small quantities), where brief hand-mixing will provide additional blending and
help to break up any clumps produced during drying. All operations should be performed
in a safety-hood with negative pressure.
C4.0 ANALYSIS OF MATERIALS
All formulations should be examined with the stereomicroscope to determine
homogeneity. Gravimetric analysis (ashing and/or acid dissolution) should be performed on
those materials containing organic and/or acid-soluble components. Matrix materials to
which no asbestos has been added should be analyzed by gravimetric analysis to determine
the amount of nonashable or insoluble materials that are present. Several subsamples of each
material should be analyzed by the gravimetric technique to provide information con£eming .. the uniformity of the prepared materials. Experience has shown that the previously described
formulation procedure results in relatively homogeneous materials. 1
C4.1 Stereomicroscopic Analysis
Visual estimation of sample components using the stereomicroscope is in reality a
comparison of the relative volumes of the components.1 Therefore, differences in specific
gravity between asbestos and matrix material must be considered and the relationship
C-3
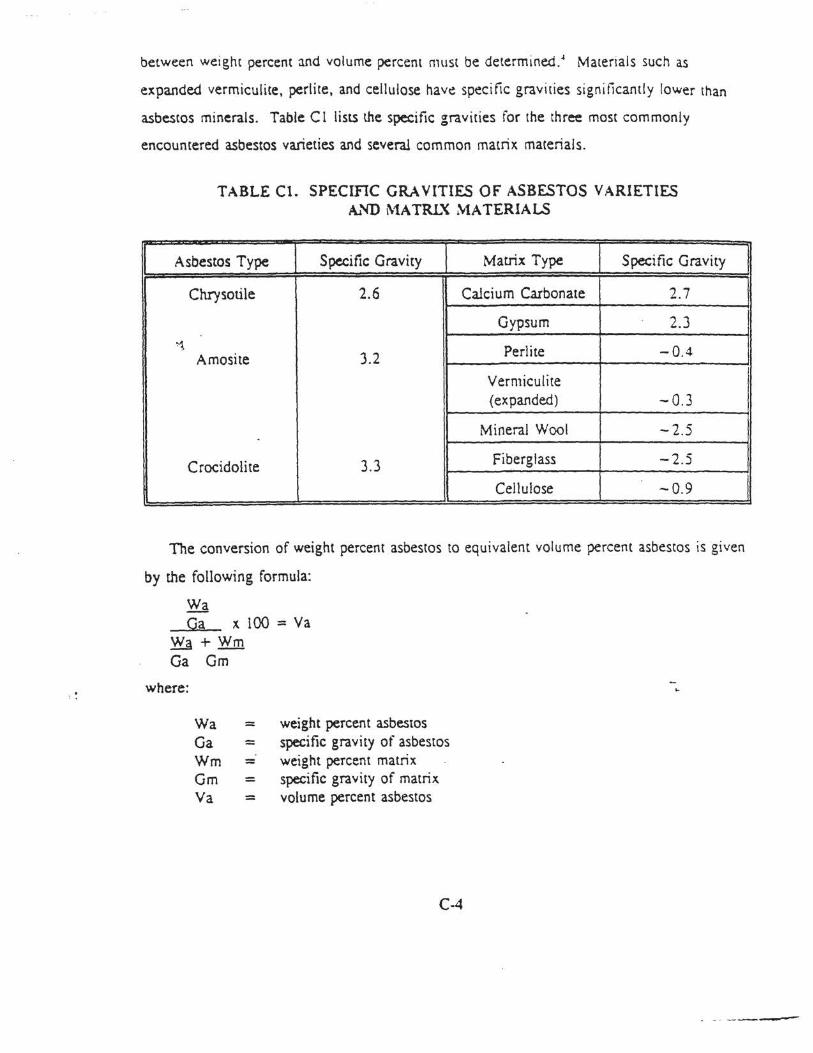
between weight percent and volume percent must be determined.~ Materials such as
expanded vermiculite, perlite, and cellulose have! specitic gravities significantly lower than
asbestos minerals. Table C 1 lists the specific gravities for the three most commonly
encountered asbestos varieties and several common matrix materials.
TABLE Cl. SPECIFIC GRAVITIES OF ASBESTOS VARIETIES AND MATRLX MATERIALS
Asbestos Type Specific Gravity Matrix Type Specific Gravity
Chrysotile 2.6 Calcium Carbonate 2.7
Gypsum 2.3 '1 Perlite -0.4 Amosite 3.2
Vermiculite (expanded) -0.3
Mineral Wool -2.5
Crocidolite 3.3 Fiberglass -2.5
Cellulose -0.9
The conversion of weight percent asbestos to equivalent volume percent asbestos is given
by the following formula:
Wa Ga :< 100 = Va
Wa + Wm Ga Gm
where:
Wa = weight percent asbestos Ga = specific gravity of asbestos Wm = weight percent matrix Gm = specific gravity of matrix Va = volume percent asbestos
C-4
·· · ---
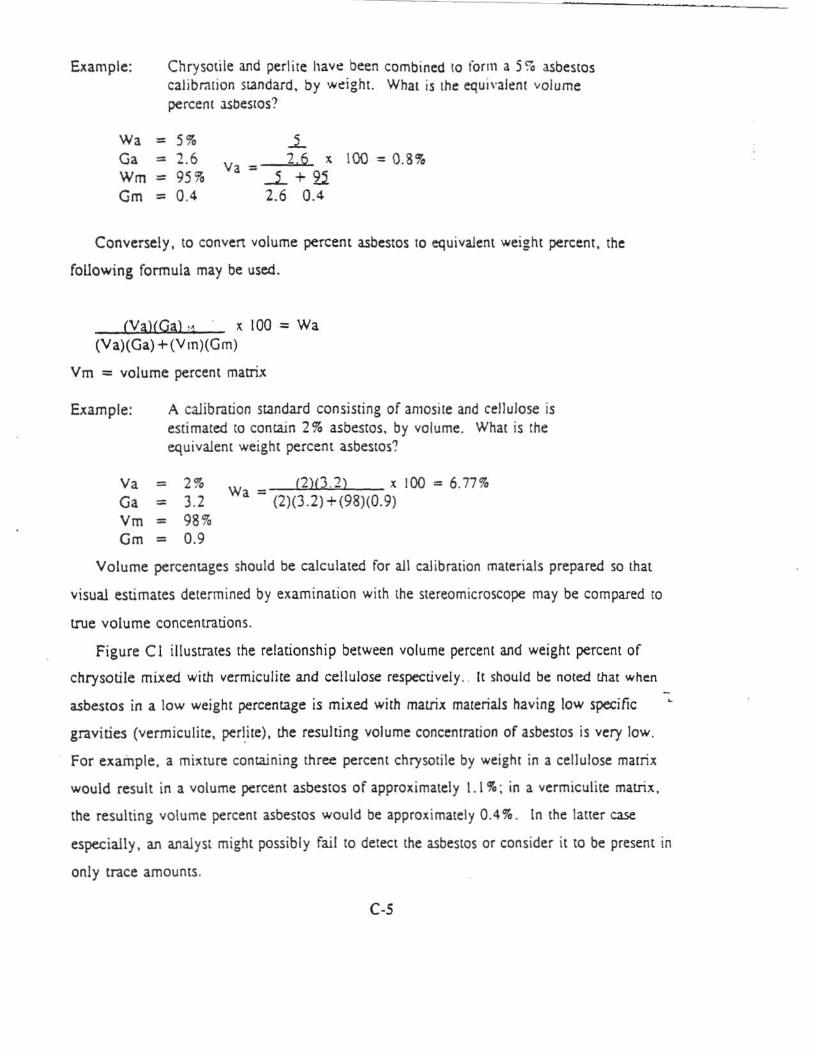
Example:
Wa = Ga = Wm = Gm =
Chrysotile and perlite hav~ been combined to form a 5% asbestos calibration standard, by w~ight What is the equivalent volume percent asbestos?
5% .2.. 2.6 2.6 X 100 = 0.8%
Va = 95% _i_ + 2l 0.4 2.6 0.4
Conversely. to convert volume percent asbestos to equivalent weight percent, the
following formula may be used.
(VaHGa) ,.. x 100 = Wa (Va)(Ga) +(Vm)(Gm)
Vm = volume percent matrix
Example:
Va = Ga = Vm = Gm =
A calibration standard consisting of amosite and cellulose is estimated to contain 2% asbestos. by volume. What is the equivalent weight percent asbestos?
2% W (2)(3.2) X JOQ = 6. 77% 3.2 a = (2)(3.2)+(98)(0.9) 98% 0.9
Volume percentages should be calculated for all calibration materials prepared so that
visual estimates determined by examination with the stereomicroscope may be compared to
true volume concentrations.
Figure C 1 illustrates the relationship between volume percent and weight percent of
chrysotile mixed with vermiculite and cellulose respectively . . It should be noted that when
asbestos in a low weight percentage is mixed with matrix materials having low specific
gravities (vermiculite, perl.ite), the resulting volume concentration of asbestos is very low.
For example, a mi~ture containing three percent chrysotile by weight in a cellulose matrix
would result in a volume percent asbestos of approximately l .l %; in a vermiculite matrix.
the resulting volume percent asbestos would be approx imately 0.4%. In the latter case
especially. an analyst might possibly fail to detect the asbestos or consider it to be present in
only trace amounts.
C-5
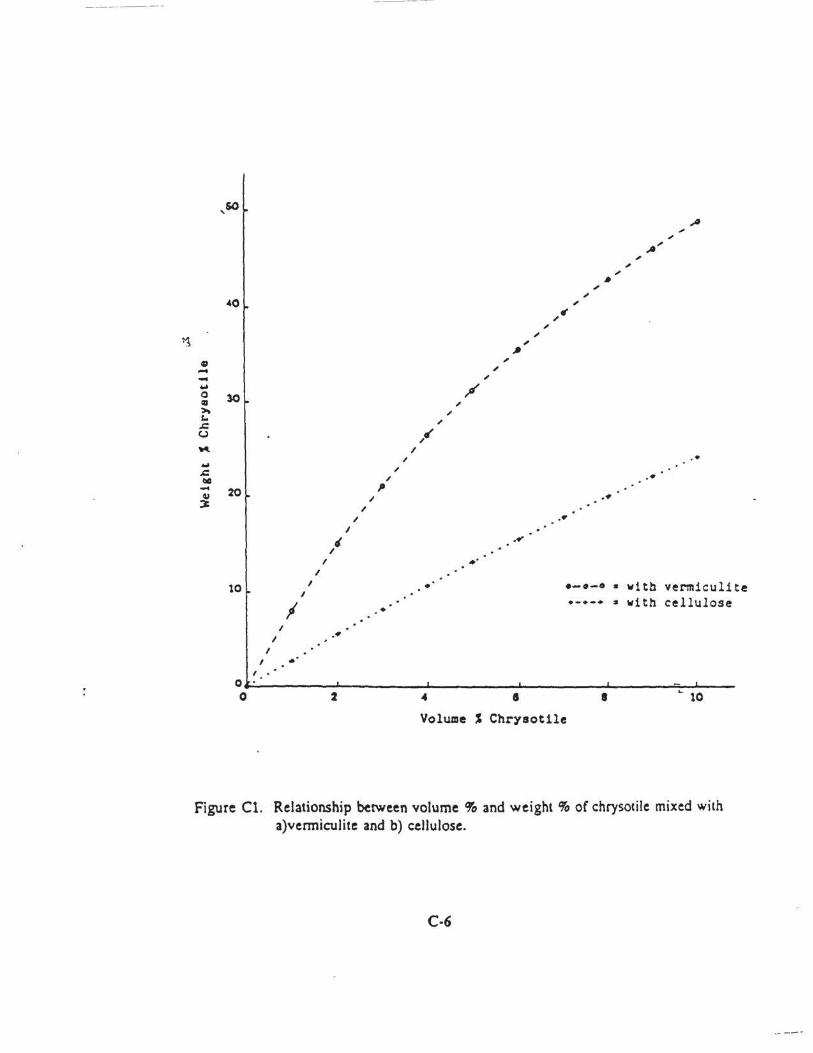
~
,so ....
" ; _., ; ,
" ~ ;
" 40 ;
, ~ " ; , ,
0 , - , - , ... / 0 30 0 ,
~ , "' ;
&. <.J ;_, ~ I
; .. ... ; &. 110 / .. - 20
p
" .. ~
I I
I .. I
' ... I
I .. I
10 I • •-•-o • with vermiculite I
I ·-·-· • with cellulose • I
I ..
I I ..
I . 0 0 2 • • • ... 10
Volume ~ Chrysot1le
Figure Cl. Relationship between volume %and weight% of chrysotile mixed with a)vermiculite and b) cellulose.
C-6
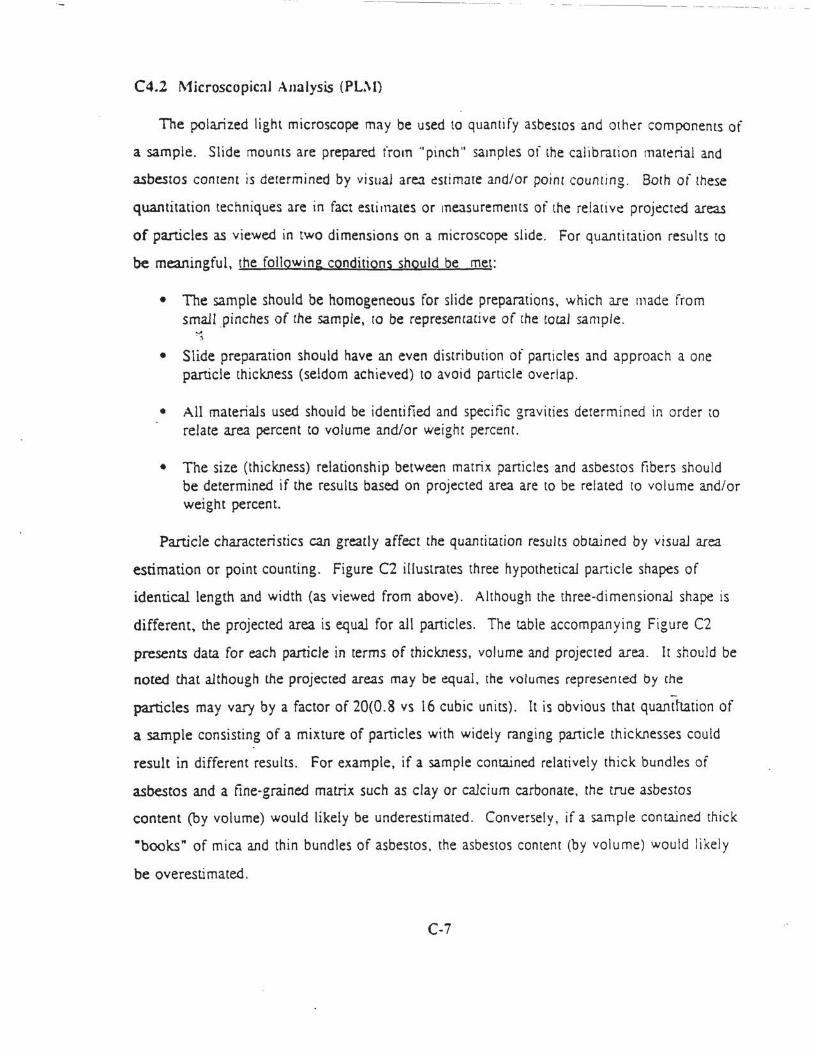
- - - -- --- ··- -··---·-····
C4.2 Microscopical Analysis (PL.\1)
The polarized light microscope may be used to quantify asbestos and othc!r components of
a sample. Slide mounts are prepared from ''pinch" samples oi the calibration material and
asbestos content is determined by visual area ~stimate and/or point counting. Both of these
quantitation techniques are in fact estimates or measurements of the relativ~ projected areas
of particles as viewed in two dimensions on a microscope slide. For quantitation results to
be meaningful, the following conditions should be met:
• The sample should be homogeneous for slide preparations, which are made from small pinches of the sample, to be representative of the total sample .
...,
. ' • Slide preparation should have an even distribution of panicles and approach a one
particle thickness (seldom achieved) to avoid particle overlap.
• All materials used should be identified and specific gravities determined in order to
relate area percent to volume and/or weight percenr.
• The size (thickness) relationship between matrix particles and asbestos fibers should be determined if the results based on projected area are to be related to volume and/or weight percent.
Particle characteristics can greatly affect the quancitation results obtained by visual area
estimation or point counting. Figure C2 illustrates three hypothetical particle shapes of
identical length and width (as viewed from above). Although the three-dimensional shape is
different, the projected area is equal for all particles. The table accompanying Figure C2
presents data for each particle in terms of thickness, volume and projected area. It should be
noted that although the projected areas may be equal. the volumes represc!nted by the
particles may vary by a factor of 20(0.8 vs 16 cubic units). It is obvious that quanthation of
a sample consisting of a mixture of particles with widely ranging panicle thicknesses could
result in different results . For example, if a sample contained relatively thick bundles of
asbestos and a fine-grained matrix such as clay or calcium carbonate, the true asbestos
content (by volume) would likely be underestimated . Conversely, if a sample contained thick
•books" of mica and thin bundles of asbestos. the asbestos content (by volume) would likely
be overestimated.
C-7
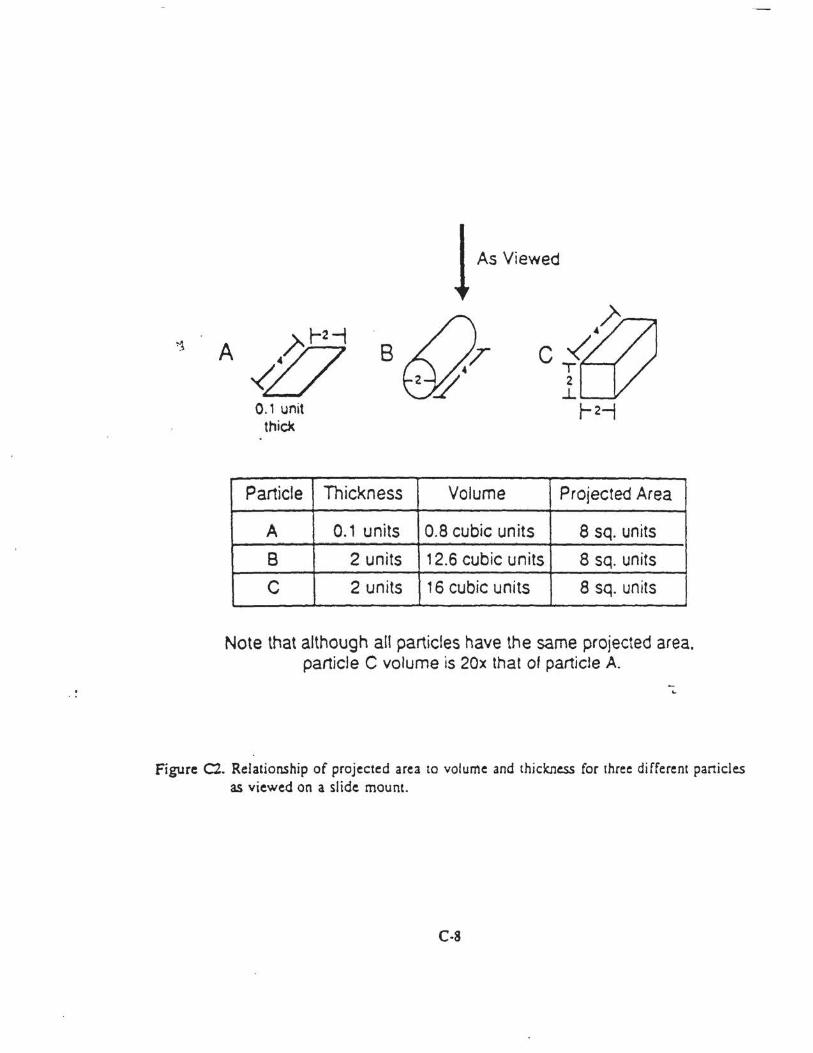
0.1 unit thid<
Particle
A
B
c
8
Thickness
0.1 units
2 units
2 units
1 As Viewed
Volume Projected Area
0.8 cubic units 8 sq. units
12.6 cubic units 8 sq. units
16 cubic units 8 sq. units
Note that although all particles have the same projected area. particle C volume is 20x that of particle A.
-..
Figure C2. Relationship of projected area to volume and thickness for three different particles as viewed on a slide mount.
C-8
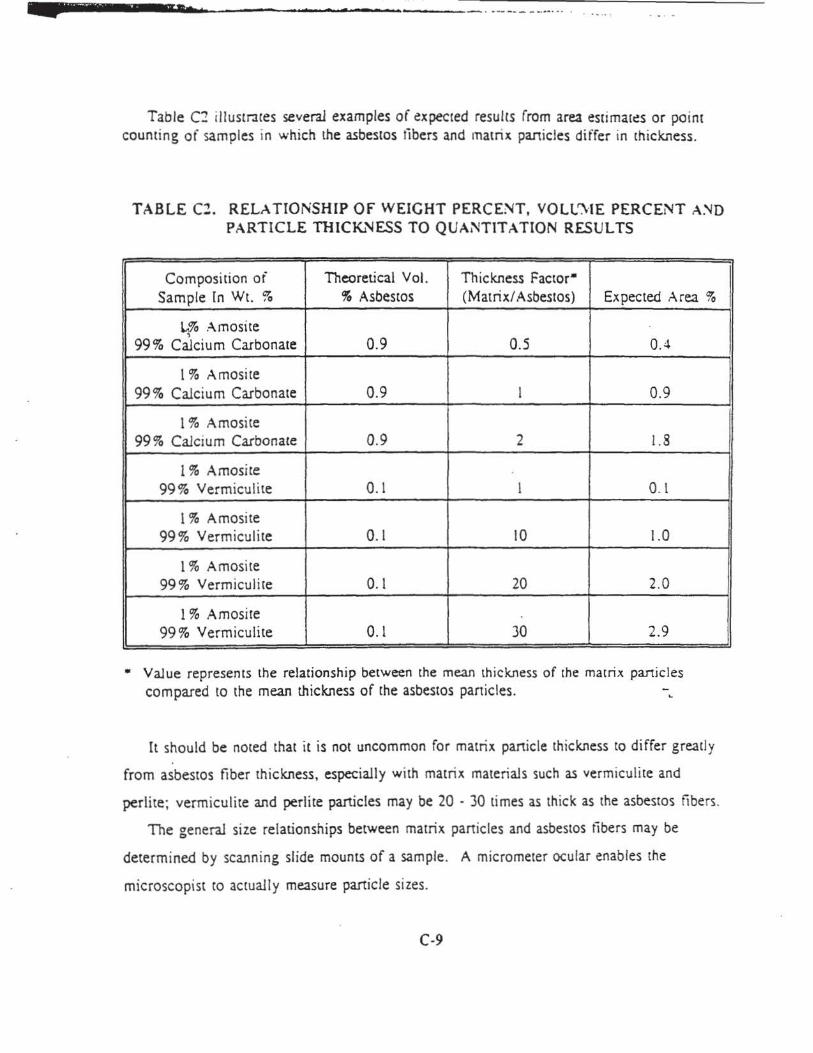
________ ...___ ________ ___::_. ·---- -······· . . · -··.
Table C~ illustr.ttes several examples of expected results from area estimatt!s or point counting of samples in which the asbestos libers and matrix panicles differ in thickness.
TABLE C2. RELATIONSHIP Of WEIGHT PERCENT, VOLL"·tE PERCENT A~D PARTICLE THICKNESS TO QUANTIT ATION RESULTS
Composition of Theoretical Vol. Thickness Factor• Sample ln Wt. % % Asbestos (Matrix/ Asbestos} Ex pee ted A rea %
L.% Amosite )
0.9 99% Calcium Carbonate 0.5 0.4
1% Amosite 99% Calcium Carbonate 0.9 I 0.9
1% Amosite 99% Calcium Carbonate 0.9 2 1.8
1% Amosite 99% Vermiculite 0.1 I 0.1
1% Amosite 99% Vermiculite 0.1 10 1.0
1% Amosite 99% Vermiculite 0.1 20 2.0
1% Amosite 99% Vermiculite 0.1 30 2.9
• Value represents the relationship between the mean thickness of the matrix particles compared to the mean thickness of the asbestos panicles.
It should be noted that it is not uncommon for matrix particle thickness to differ greatly
from asbestos fiber thickness, especially with matrix materials such as vermiculite and
perlite; vermiculite and perlite particles may be 20 · 30 times as thick as the asbestos fibers.
The general size relationships between matrix particles and asbestos tibers may be
determined by scanning slide mounts of a sample. A micrometer ocular enables the
microscopist co actual! y measure particle sizes.
C-9
If a thickness facto r can be dc:tt:rmint:d for a calibrauon sample of known volume
proportions of asbestos and matrix materials, an expected equivalent projected area asbestos
can be calculated using the following formula:
where:
Va Vm T A a
Va ~ tOO = Aa
Y.m + Va T
= = =
true volume percent asbestos true volume percent matrix thickness factor (mean size matrix panicle/mean size asbestos fiber) expected projected area percent asbestos
~
Example: A calibration standard of known weight percent a.sbestos is determined, by factoring in component specific gravities, to be 5.0% asbestos by volume. The matrix particles are estimated to be ten times thicker than the asbestos fibers. What would be the expected projected area percentage or asbestos?
Va = 5% Vm = 95% T = 10
Aa = 5 X JQO = )4.5%
95 + 5 10
Conversely, to convert projected area percent asbestos to equivalent volume percent.
the following formula may be used:
Aa x 100 = Va T(Am) + Aa
Where: Am = projected area matrix
Example: A slide containing a subsample of an amositelmineral wool calibration standard is determined by point counting to have a projected area asbestos of 18.6%. lf the mineral wool fibers are estimated to be si;r; times the asbestos fibers, in diameter, what is the equivalent volume percent asbestos?
C-10
-...
------ ·- ·--·-------
Am= 81.4% Aa = 18.6% T = 6 Va =
(18.6) :< 100 = .).67% 6( 8 I.~) + 18. 6
Va = Ga = Ym = Gm =
Based on specific gravity valuc:s listed in Table: l C and on the above volume asbestos determination. what is the equivalent weight percent asbestos in the sample?
3.67% w - (~-27l(J . 2l ;t tOO = 4 . 7% 3.2 a - (3.67)(3.:!) + (96.33)(2.5) 96.33% 2.5
CS.O USE OF CALIBRATION STANDARDS FOR QA/QC
Once tHe materials have been formulated and thoroughly characterized by all techniques
co determine their suitability as calibration starldards. a system for incorporating them into
the QA/QC program should be established. Someone should be designated (QA officer, lab
supervisor, etc.) to control the distribution of standards and to monitor the analysis results of
the microscopists. Both precision and accuracy may be monitored with the use of suitable
standard setS.
Records such as range charts, control charts. etc. may be maintained for volume
(stereornicroscopic estimates), area (PLM) estimates and point counts. For point counts and
area estimates, relatively permanent slides may be made using epoxy or Melt Mount •. Such
slides may be very accurately quantified over time as to point count values, and due to their
very long shelf life, may be used for QA/QC purposes almost indefinitely.
C6.0 REFERENCES
1. "Analysis Summaries for Samples used in NlST Proficiency Testing", National Institute of Standards and Technology (NIST) National Voluntary Laborarory ~
Accreditation Program (NVLAP) for Bulk Asbestos, January 1989 to present.
2. Harvey, B. W., R. L. Perkins, J. G. Nickerson, A. 1. Newland and M. E. Beard. "Formulating Bulk Asbestos Standards", Asbestos lssues, April 1991.
3. Perkins, R. L. and M. E. Beard, "Estimating Asbestos Content of Bulk Materials", National Asbestos Council Journal , Vol. 9. No. I, 1991, pp. 27-31.
4. Asbestos Content in Bulk Insulation Samples: Visual Estimates and Weight Composition, U.S. Environmental Procection Agency 56015-88-0 II , 1988.
C-11
.. .-------------- ·-·- .. --... -··--··-----
APPENDIX 0
SpeciaJ-Case Building Materials
-·-- -·· . ---- ........ . - - - --··------ --·- - --·- -~~~-~~
Asbestos laboratories are now call~d upon to analyze many t yp~s of bulk building
materials that are very difficult ro characterize by routine PLM analysis. These materials are
dominantly noniriable and can be group~d into the following categories:
• Cementitious Products (pipe. sheeting, etc.)
• Viscous Matrix Products (adhesives, cements, coatings, etc.)
• Vinyl Materials (vinyl t1oor tile. sheeting)
• Asphaltic Roofing Materials (shingles, roll rooting)
~ • Miscellaneous Products (paints. coatings. friction plates. gaskets. ~tc . )
Materials characterized by interfering binder/matrix, !ow asbestos content, and/or small
fiber size may require that additional sample treatment(s) and analysis be performed beyond
routine PLM analysis. The sample treatment(s) required is(are) determined by the dominant
nonasbescos sample components (see Section 2.3. Gravimetry). Materials containing an
appreciable amount of calcareous material may be treated by dissolution with hydrochlo ric
acid. Samples containing organic binders such as vinyl. plasticizers. esters, asphalts , etc.
can be treated with organic solvents or ashed in a muffle furnace (preferred method) or low
temperature plasma asher to remove unwanted components. Materials containing cellulose,
synthetic organic fibers, textiles, etc. may also be ashed in a muftle furnace or low
temperature plasma asher.
The method chosen for analysis of a sample after treatment is dependent on asbestos
concentration and/or fiber size. An examination of the sample residue by PLM may disclose
asbestos if the fibers are large enough to be resolved by the microscope. but additional
analytical methods are required if the sample appears negative. Analysis by XRD is not
fiber-size dependent, but may be limited by low concentration of asbestos and the presence of
interfering mineral phases. In addition . the XRD method does not differentiate between
fibrous and nonfibrous varieties of a mineral. Analysis by AEM is capable of providing
positive identification of asbestos type(s) and semi-quanti cation of asbestos content.
D-1
The following tlowchart illustrates a possible scheme for th~: analysis of special-case
building materials.
NOTE: Preliminary studies indicate that the XRD method is capable of detecting
serpentine (chrysotile) in noor tile samples without extensive sample preparation prior to
XRD analysis. XRD analysis of small, intact sections of noor tile yielded diffraction
patterns that con finned the presence of serpentine, even at concentrations of -one percent
by weight. TEM analysis of these same tiles contirmed the presence of chrysotile asbestos.
With further investigation, this method may prove applicable to other types of nonfriable
material~
D-2
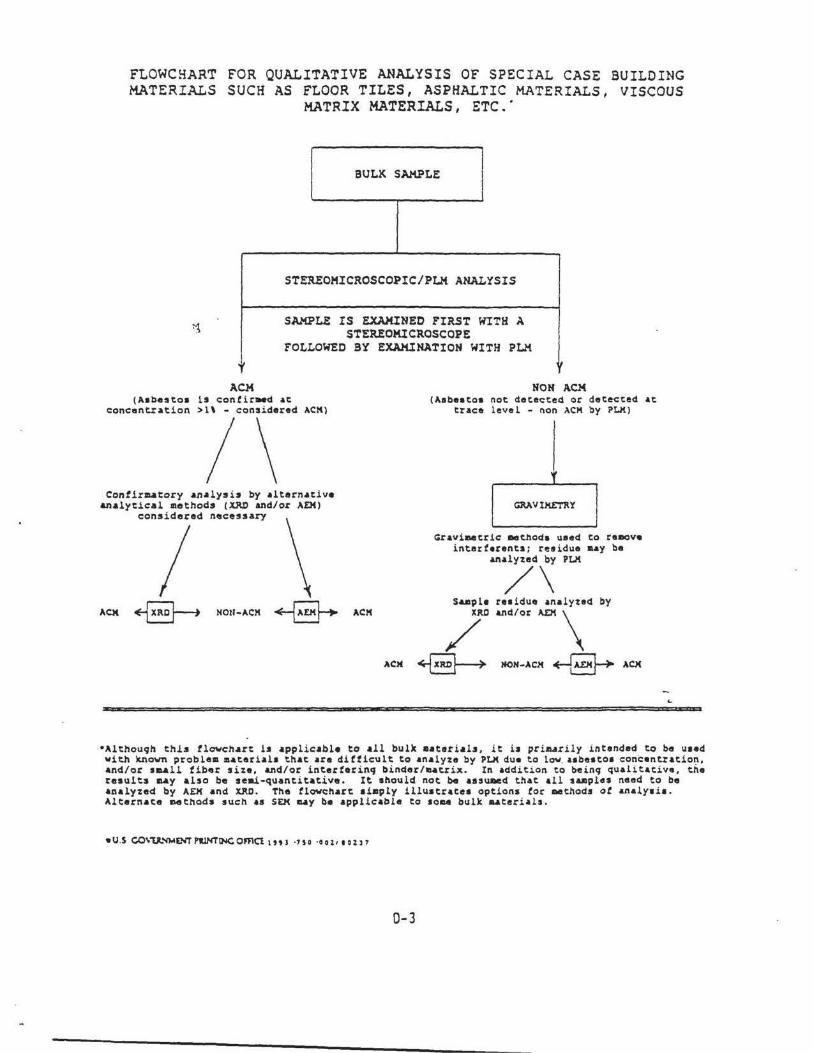
FLOWCHART FOR QUALITATIVE ANALYSIS OF SPECIAL CASE BUILDING MATERIALS SUCH AS FLOOR TILES, ASPHALTIC MATERIALS, VISCOUS
MATRIX MATERIALS, ETc.·
BULK SAMPLE
STEREOMICROSCOPIC/PLM ANALYSIS
SAMPLE IS EXAMINED FIRST WITH A STEREOMICROSCOPE
FOLLOWED BY EXAMINATION WITH PLM
r ACM
(Aabeseoa ts contiraed ae concentr~tion >1\ - considered ACK)
1\ Confir&Atory An~lysis by ~ltern~tive
AnAlyticAl ~ethods (XRO and/or AEM)
I \ considered necess~ry
ACM
if
NON ACM (Aabeatoa not detected or detected at
tr~ce level - non ACK by PLK)
Gravimetric aethoda ueed to reeove interterenta; reaidue aay be
an/d\ PLK
•Althouqn this tlawchart is applic~ble to ~11 bulk ••teriAls, it ia pri~rily intended eo be u1ed with known problea aateri~l• that ~re difficult to analyze by PLK due to Low. a1be1eoa concentratio~. and/or saall tiber size, and/or interterinq binder/aAerix. In addition to beinq qualitative, the reaults a.y also be seai-quaneie~eive. It ahould not be aasuaed that all 'amples need to be analyzed by A£M and XRD. The flowchart aiaply illuatratea options for aetnods of analy1ia. Alternate aethods such &I SEK ~y be applicable to aoae bulk aateriala.
0-3
United States Environmental Protection 1\gency Cenler for Environmental nesearch Information Clnclnn~tl . OH -15268
Qflicial Business Penalty lor Private Use $300
EPA1600JR-93/116
r.'
PittA~" m~~" "" ntte'I~~"'Y cto~nO"' on lhe bttlow l~hel. d•or;•ch 0< OOf>Y. lind t11tvrn to lhe t ddrtu In lht up~r hth-hAnd OOtner .
II you rfo nor wi'h lo rec"IY't '"""'<A pot IS CIIECI< liE nE 0 : dfllllr:fl. or ropy Jhl, co¥t r. • nd ri!Urf\ lo lht "ddrtH In lht upper lell-hand comer. I J
OULK lli\1 F. POSTAGE & FEES PAlO
EPA PEnMIT No G ·:JS