metabolomics in early alzheimer's disease: identification of altered plasma sphingolipidome...
TRANSCRIPT
Metabolomics in Early Alzheimer’s Disease: Identificationof Altered Plasma Sphingolipidome Using ShotgunLipidomicsXianlin Han1, Steve Rozen2, Stephen H. Boyle3, Caroline Hellegers3, Hua Cheng1, James R. Burke4,
Kathleen A. Welsh-Bohmer3,4, P. Murali Doraiswamy3,5, Rima Kaddurah-Daouk3*
1 Sanford-Burnham Medical Research Institute, Orlando, Florida, United States of America, 2 Department of Medicine, Duke-NUS Graduate Medical School, Singapore,
Singapore, 3 Department of Psychiatry and Behavioral Sciences, Duke University Medical Center, Durham, North Carolina, United States of America, 4 Bryan Alzheimer
Disease Research Center, Duke University Medical Center, Durham, North Carolina, United States of America, 5 Duke Institute of Brain Sciences, Duke University Medical
Center, Durham, North Carolina, United States of America
Abstract
Background: The development of plasma biomarkers could facilitate early detection, risk assessment and therapeuticmonitoring in Alzheimer’s disease (AD). Alterations in ceramides and sphingomyelins have been postulated to play a role inamyloidogensis and inflammatory stress related neuronal apoptosis; however few studies have conducted a comprehensiveanalysis of the sphingolipidome in AD plasma using analytical platforms with accuracy, sensitivity and reproducibility.
Methods and Findings: We prospectively analyzed plasma from 26 AD patients (mean MMSE 21) and 26 cognitively normalcontrols in a non-targeted approach using multi-dimensional mass spectrometry-based shotgun lipidomics [1,2] todetermine the levels of over 800 molecular species of lipids. These data were then correlated with diagnosis, apolipoproteinE4 genotype and cognitive performance. Plasma levels of species of sphingolipids were significantly altered in AD. Of the 33sphingomyelin species tested, 8 molecular species, particularly those containing long aliphatic chains such as 22 and 24carbon atoms, were significantly lower (p,0.05) in AD compared to controls. Levels of 2 ceramide species (N16:0 and N21:0)were significantly higher in AD (p,0.05) with a similar, but weaker, trend for 5 other species. Ratios of ceramide tosphingomyelin species containing identical fatty acyl chains differed significantly between AD patients and controls. MMSEscores were correlated with altered mass levels of both N20:2 SM and OH-N25:0 ceramides (p,0.004) though lipidabnormalities were observed in mild and moderate AD. Within AD subjects, there were also genotype specific differences.
Conclusions: In this prospective study, we used a sensitive multimodality platform to identify and characterize an essentiallyuniform but opposite pattern of disruption in sphingomyelin and ceramide mass levels in AD plasma. Given the role of brainsphingolipids in neuronal function, our findings provide new insights into the AD sphingolipidome and the potential use ofmetabolomic signatures as peripheral biomarkers.
Citation: Han X, Rozen S, Boyle SH, Hellegers C, Cheng H, et al. (2011) Metabolomics in Early Alzheimer’s Disease: Identification of Altered PlasmaSphingolipidome Using Shotgun Lipidomics. PLoS ONE 6(7): e21643. doi:10.1371/journal.pone.0021643
Editor: Yu Wang, The University of Hong Kong, Hong Kong
Received March 29, 2011; Accepted June 4, 2011; Published July 11, 2011
Copyright: � 2011 Han et al. This is an open-access article distributed under the terms of the Creative Commons Attribution License, which permits unrestricteduse, distribution, and reproduction in any medium, provided the original author and source are credited.
Funding: Supported in part by NIH R24 GM078233, ‘‘The Metabolomics Research Network’’ (R.K.-D.), R01 NS054008-01A2, (R.K.-D.), NIA/NIDDK R01AG031675(X.H.) and the Bryan ADRC P50 AG01528 and P30 AG028377. No additional external funding received for this study. The funders had no role in study design, datacollection and analysis, decision to publish, or preparation of the manuscript.
Competing Interests: RKD has patents in this field and has received funding from pharmaceutical companies for metabolomic studies. PMD has receivedresearch grants (through Duke) and consulting honoraria from several companies in this field. He owns stock in Sonexa. JRB has been advisor to GSK, Bristol MyersSquibb, and Accera. He is a consultant to Trans Tech and High Point Pharmaceuticals. This does not alter the authors’ adherence to all the PLoS ONE policies onsharing data and materials.
* E-mail: [email protected]
Introduction
As the world population ages, the number of older adults
developing dementia is estimated to quadruple by mid-century to
over 106 million worldwide [3]. Alzheimer’s disease (AD) is the
most common dementia among all the clinically-recognized
dementias in the aging population [4,5]. Although the cause is
not known, there are profound biochemical alterations in multiple
pathways in the AD brain including changes in amyloid-beta
protein metabolism, tau phosphorylation, membrane lipid dysreg-
ulation and synaptic neurotransmission. Recent pathological,
biochemical, and genetic studies have led to major insights into
AD pathogenesis [6]. Among the encouraging observations are
links made between cardiovascular risk conditions, lipid metabo-
lism, and the development of AD [7]. Further, the apolipoprotein
E4 (ApoE4) genotype, a major determinant of risk for sporadic
AD, is a component of lipoproteins in plasma and brain and may
lie at the crossroads between the lipidome and dementia [8].
These insights suggest that treatments aimed at reducing risk
conditions may hold promise to delay the onset of AD dementia,
slow the progression, and possibly prevent AD altogether. Since
disease modifying drugs are likely to be most effective early in the
disease course, the discovery of highly sensitive biomarker(s) for
the early diagnosis of AD (at mild or even preclinical stages) is
PLoS ONE | www.plosone.org 1 July 2011 | Volume 6 | Issue 7 | e21643
extremely important. Currently, the sensitivity and specificity of
the clinical diagnosis of AD is quite low (approximately 80%; [9])
and the currently available central AD biomarkers (MRI
volumetrics, FDG-PET, CSF assays) perform at similar accuracy
levels [10,11]. Moreover, effective biomarkers are also very useful
in assessing disease progression or response to treatment. The
cellular lipidome, consisting of hundreds of thousands of lipid
species, represents a rich source of biomarkers for the early
diagnosis of AD.
Metabolomics tools enable us to study the metabolome, the
repertoire of small molecules present in cells and tissue
[12,13,14]. The identities, concentrations, and fluxes of these
substances are the final product of interactions between gene
expression, protein expression, and the cellular environment.
Metabolomics tools have been used to characterize metabolic
signatures for several diseases including depression [15,16,17],
motor neuron disease [18], Parkinson’s disease [19], cocaine and
opiate addiction [20,21], schizophrenia [22,23,24], and Alzhei-
mer’s Disease [25]. As stated previously, there is now extensive
preclinical and in-vitro literature documenting a relationship
between altered lipid metabolism and amyloidogenesis, oxidative
stress and apoptosis [26]. Previous studies with post-mortem
brain tissue samples have demonstrated altered lipidomes at the
different stage of AD pathogenesis (reviewed in [27]. For
example, multiple classes of sphingolipids are altered not only
at the late stage of the disease [28], but also at the earliest
clinically recognizable stage of AD [29,30]. All major classes of
phospholipids are ubiquitously decreased at the late stage of AD
[31]. Among these, the levels of plasmalogen (a major component
in nerve tissue membranes counting for up to 85% of
ethanolamine glycerophospholipid, or ,30% of total phospho-
lipids of these membranes) are gradually reduced as progress of
AD severity [32]. It is conceivable that these changes could lead
to or be parallel with the changes of either the content or the
composition or both of the lipid species in plasma of AD patients.
There are many obvious advantages to a peripheral plasma
marker (over central markers) in terms of cost, risks and ability to
monitor individuals over time. A very recent study has shown a
promising relationship between altered plasma ceramide levels
and hippocampal volume loss in mild cognitive impairment
supporting the hypothesis that disruptions in ceramide metabo-
lism may be linked to early neurodegenerative and pathologic
changes [33]. However, the lack of sensitive and efficient ‘‘mega’’
lipid biochemistry platforms has limited the ability to simulta-
neously study the dozens of different pathways that may be
affected in AD in relation to clinical phenotype and genotype.
Shotgun lipidomics studies the pathways and networks of
cellular lipids in biological systems on a large scale. It involves the
identification and quantitation of hundreds of cellular lipid
molecular species as well as their interactions with other species.
Multi-dimensional mass spectrometry-based shotgun lipidomics
(MDMS-SL) is one of the leading analytic platforms in current
lipidomics practices due to its high accuracy, efficiency, sensitivity,
and reproducibility [1,2]. In this study, we used a non-targeted
MDMS-SL approach to measure the levels of over 800 molecular
species of choline glycerophospholipid (PC), lysoPC (LPC),
ethanolamine glycerophospholipid (PE), phosphatidylinositol,
sphingomyelin (SM), ceramide, and triacylglycerol (TAG) in the
plasma of AD individuals and cognitively normal controls. The
main goals of the study were to examine the hypothesis that the
plasma lipidome is altered in early AD, and secondary goals were
to characterize lipid changes that might be differentially related to
cognitive status or genotype as well as to identify potential lipid
pathways that might be disrupted in AD.
Materials and Methods
MaterialsSynthetic phospholipids including 1,2-dimyristoleoyl-sn-glycero-
3-phosphocholine (14:1-14:1 PC), 1,2-dipalmitoleoyl-sn-glycero-3-
phosphoethanolamine (16:1-16:1 PE), 1,2-dipentadecanoyl-sn-
glycero-3-phosphoglycerol (15:0-15:0 PG), 1-myristoyl-2-hydrox-
yl-sn-glycero-3-phosphocholine (14:0 LPC), N-lauroyl sphingomy-
elin (N12:0 SM), and N-heptadecanoyl ceramide (N17:0 ceramide)
were purchased from Avanti Polar Lipids, Inc. (Alabaster, AL,
USA). Note that the prefix ‘‘N’’ denote the amide linkage of the
fatty acyl chain. Triheptadecenoylglycerol (T17:1 TAG) was
purchased from Nu-Chek Prep, Inc. (Elysian, MN, USA).
Deuterated cholesterol was purchased from Cambridge Isotope
Laboratories, Inc. (Cambridge, MA, USA). All the solvents were
obtained from Burdick and Jackson (Honeywell International Inc.,
Burdick and Jackson, Muskegon, MI, USA). All other chemicals
were purchased from Sigma-Aldrich (St. Louis, MO, USA).
SubjectsAD (n = 26) and elderly control subjects (n = 26) were recruited
prospectively from the Joseph and Kathleen Bryan Alzheimer’s
Disease Research Center (Bryan ADRC) and the Department of
Psychiatry, both at Duke University. Patients included in the study
had diagnoses of Probable AD (NINDS) using current criteria
following history and informant interview, complete neurological
examination, cognitive screening and securing standard blood
chemistries, imaging, and laboratory studies. The Mini-Mental
State examination (MMSE), a brief screening tool of cognitive
status was used to categorize AD patients as mild or moderate,
consistent with routine clinical practice. Normal controls were
participants who were determined to be free of dementia as well as
other significant neuropsychiatric disorders after reviewing their
medical history, informant interviews, functional status and
neuropsychological performance as well as ratings of mood and
clinical examinations. Our entry criteria excluded subjects with
current major depression or substance abuse, subjects with other
neurologic disorders such as Parkinson’s disease or stroke, and
those who were unwilling or unable to perform cognitive testing.
Of the 26 AD subjects, 17 had mild AD (MMSE$20) and others
Table 1. Clinical and demographic characteristics ofAlzheimer’s subjects and controlsa.
Control AD P Test
n 26 26
Age Range 57–87 61–89
Age, Mean (SD) 73.0 (7.7) 77.2 (6.5) 0.074 WT
% Male 42 46 1 FET
Years Education, Mean (SD) 16.0 (2.6) 14.4 (2.8) 0.062 WT
MMSE, Median (MAD) 29.0 (1.5) 21.0 (3.7) 2.50E-09 WT
Logical Memory I, Median (MAD) 17.0 (4.4) 2.0 (1.5) 1.00E-09 WT
Logical Memory II, Median (MAD) 15.5 (3.7) 0.0 (0.0) 5.10E-10 WT
% Using Statins 27 42 0.38 FET
% with APOE4 Genotype 25% 67% - -
aWT, Wilcoxon rank-sum test, two-sided; FET, Fisher’s exact test, two-sided; SD,standard deviation; MAD, median absolute deviation; MMSE, Mini-Mental StateExamination.
doi:10.1371/journal.pone.0021643.t001
Lipidomics in Alzheimer’s Disease
PLoS ONE | www.plosone.org 2 July 2011 | Volume 6 | Issue 7 | e21643
had moderate AD. The demographic and clinical characteristics of
subjects appear in Table 1.
Ethics statementAll normal control subjects and AD patients provided informed
consent prior to collection of any data. For AD patients, informed
consent was also obtained from their legally authorized represen-
tative/family member if deemed appropriate. This research was
approved by the Duke University Medical Center institutional
review board and was conducted according to the principles
expressed in the Declaration of Helsinki.
Lipid sample preparation from human plasmaFasting samples were collected and cold stored using a
standardized procedure. After fasting overnight, a 10 mL
K3EDTA tube of blood was collected via venipuncture. The
blood was mixed by gentle inversion 8–10 times and placed on ice
until centrifuged for 30 minutes at 3500 rpm’s at 4uC. After
centrifuging, plasma was aliquoted and then frozen at 280uC. All
samples were run blinded. A protein assay on each plasma sample
was performed by using BCA method with bovine albumin as
standard. After 200 ml of plasma from each plasma sample was
transferred to a disposable culture borosilicate glass tube
(166100 mm), a premixed lipid solution used as internal standards
for quantification of lipid species was added to each plasma sample
based on its protein concentration. These internal standards
include 15:0-15:0 PG (150 pmol/mg protein), 16:1-16:1 PE
(15 pmol/mg protein), 14:1-14:1 PC (2000 pmol/mg protein),
T17:1 TAG (3000 pmol/mg protein), 14:0 LPC (1000 pmol/mg
protein), N12:0 SM (500 pmol/mg protein), N17:0 ceramide
(15 pmol/mg protein), and others. Addition of these internal
standards allows the final quantified lipid content to be normalized
to both the protein content and/or the plasma sample volume and
allows the elimination of a potential loss from the incomplete
recovery. These internal standards have been selected because
they only represent %0.1% of the endogenous cellular lipid mass
as demonstrated by ESI/MS lipid analysis.
Lipid extracts were prepared by using a modified procedure of
Bligh and Dyer as previously described [34] and each was
resuspended in 500 ml of dichloromethane/methanol (1:1, v/v)
which corresponded to a concentration of 3 nmol/ml. A portion of
each individual lipid extract (approximately 100 ml) was treated
with LiOMe and followed by being washed with hexane as
previously described [35]. The treated lipid samples were used for
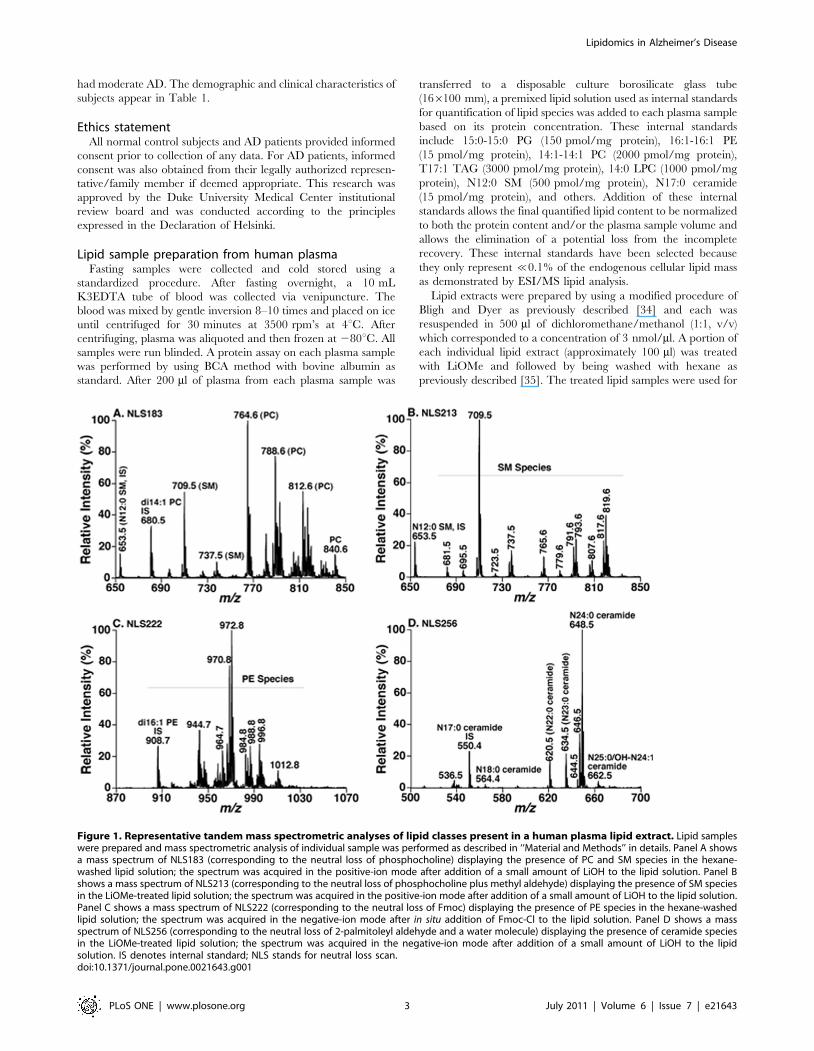
Figure 1. Representative tandem mass spectrometric analyses of lipid classes present in a human plasma lipid extract. Lipid sampleswere prepared and mass spectrometric analysis of individual sample was performed as described in ‘‘Material and Methods’’ in details. Panel A showsa mass spectrum of NLS183 (corresponding to the neutral loss of phosphocholine) displaying the presence of PC and SM species in the hexane-washed lipid solution; the spectrum was acquired in the positive-ion mode after addition of a small amount of LiOH to the lipid solution. Panel Bshows a mass spectrum of NLS213 (corresponding to the neutral loss of phosphocholine plus methyl aldehyde) displaying the presence of SM speciesin the LiOMe-treated lipid solution; the spectrum was acquired in the positive-ion mode after addition of a small amount of LiOH to the lipid solution.Panel C shows a mass spectrum of NLS222 (corresponding to the neutral loss of Fmoc) displaying the presence of PE species in the hexane-washedlipid solution; the spectrum was acquired in the negative-ion mode after in situ addition of Fmoc-Cl to the lipid solution. Panel D shows a massspectrum of NLS256 (corresponding to the neutral loss of 2-palmitoleyl aldehyde and a water molecule) displaying the presence of ceramide speciesin the LiOMe-treated lipid solution; the spectrum was acquired in the negative-ion mode after addition of a small amount of LiOH to the lipidsolution. IS denotes internal standard; NLS stands for neutral loss scan.doi:10.1371/journal.pone.0021643.g001
Lipidomics in Alzheimer’s Disease
PLoS ONE | www.plosone.org 3 July 2011 | Volume 6 | Issue 7 | e21643
the analysis of the sphingolipidome of each individual plasma
sample. Another portion of each individual original lipid extract
was washed with 2 ml of hexane for twice to remove most of the
non-polar lipids such as TAG, cholesterol, and cholesterol esters
which are very abundant in plasma lipid extracts and interfere
with the quantification of phospholipid classes. The residue lipid
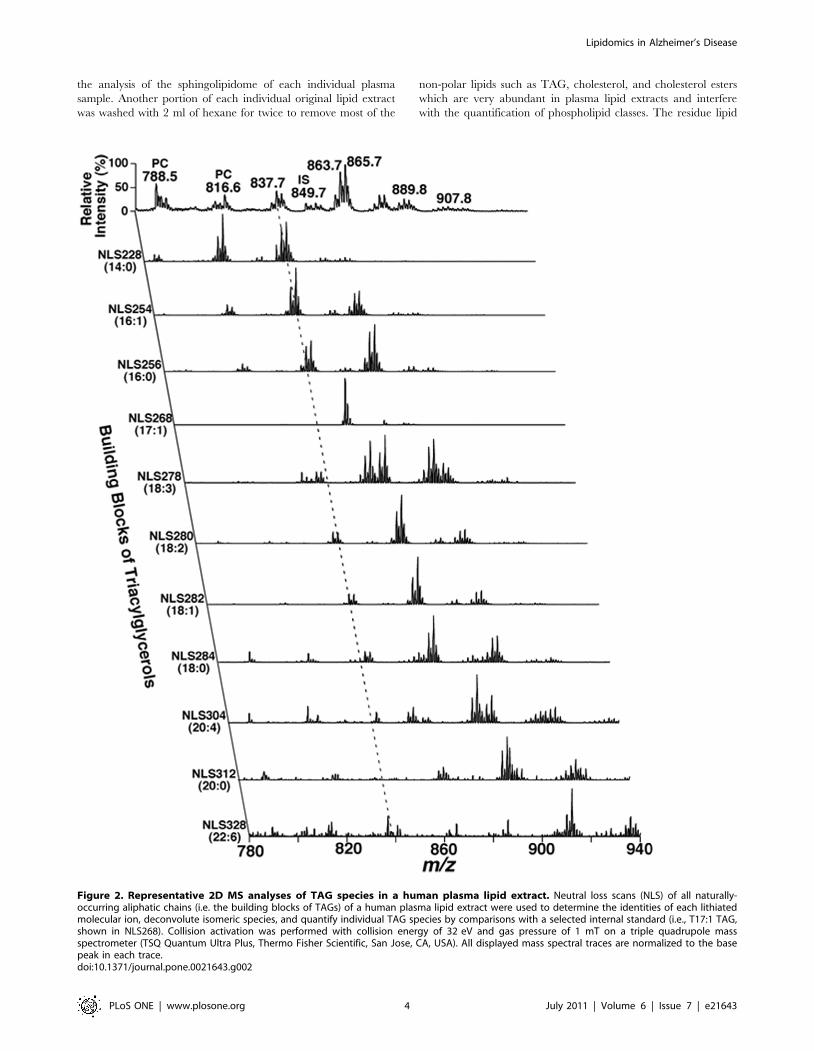
Figure 2. Representative 2D MS analyses of TAG species in a human plasma lipid extract. Neutral loss scans (NLS) of all naturally-occurring aliphatic chains (i.e. the building blocks of TAGs) of a human plasma lipid extract were used to determine the identities of each lithiatedmolecular ion, deconvolute isomeric species, and quantify individual TAG species by comparisons with a selected internal standard (i.e., T17:1 TAG,shown in NLS268). Collision activation was performed with collision energy of 32 eV and gas pressure of 1 mT on a triple quadrupole massspectrometer (TSQ Quantum Ultra Plus, Thermo Fisher Scientific, San Jose, CA, USA). All displayed mass spectral traces are normalized to the basepeak in each trace.doi:10.1371/journal.pone.0021643.g002
Lipidomics in Alzheimer’s Disease
PLoS ONE | www.plosone.org 4 July 2011 | Volume 6 | Issue 7 | e21643
solution after washing was used for the analysis of phospholipids by
using intrasource separation followed by employing multi-
dimensional mass spectrometric analysis.
Lipidomic analysis of human plasma lipid extracts bymulti-dimensional mass spectrometry-based shotgunlipidomics (MDMS-SL)
A triple-quadrupole mass spectrometer (Thermo Fisher TSQ
Vantage, San Jose, CA, USA) equipped with an automated
nanospray apparatus (i.e., Nanomate HD, Advion Bioscience Ltd.,
Ithaca, NY) and Xcalibur system software were utilized in the
study as previously described [36]. Each originally-prepared lipid
extract was diluted to ,50 pmol/ml with dichloromethane/
methanol/isopropanol (1:2:4, v/v/v) prior to infusion to the mass
spectrometer for the analyses of neutral lipids including TAG,
cholesterol, and cholesterol esters. Each lipid solution prepared
after treatment with LiOMe or after washing with hexane was also
properly diluted prior to infusion to the mass spectrometer for the
analyses of sphingolipids or phospholipids, respectively. Proper
dilution of the lipid solution is crucial for quantification to
guarantee no lipid aggregation is formed during analysis and
minimizing any effects of residual inorganic components carried
over during lipid extraction on ion suppression and/or chemical
noise. The diluted lipid extract was directly infused through the
nanomate device. Typically, a 1-min period of signal averaging in
the profile mode was employed for each survey scan. For tandem
mass spectrometry, a collision gas pressure was set at 1.0 mTorr
but the collision energy was varied with the classes of lipids as
described previously [2]. Typically, a 2 to 5-min period of signal
averaging in the profile mode was employed for acquisition of each
tandem MS spectrum. All the MS spectra and tandem MS spectra
were automatically acquired by a customized sequence subroutine
operated under Xcalibur software.
Mass spectra in survey scanning mode were acquired after
intrasource separation of each prepared and properly diluted lipid
solution as previously described [37,38]. TAG species were
Table 2. Lipid classes, species and their mass levels inAlzheimer and control subjectsa.
Lipid Class # of SpeciesControlMean ± SD
ADMean ± SD P
PC 65 3069 2565.1 0.022
PE 86 1.6660.54 1.5360.52 0.41
PI 25 0.5160.15 0.4460.15 0.11
SM 33 9.3563.78 7.3362.38 0.026
LPC 14 2.5760.70 2.4160.59 0.39
Ceramide 29 0.2160.08 0.2360.07 0.26
Free.Chol. 1 1666.2 1666 0.85
Chol.Ester NA 32613 32613 0.96
TAG .500 11.665.5 13.566.0 0.24
aSD denotes standard deviation. P values were computed by Welch two-samplet-test. All the results are obtained by shotgun lipidomics as described underMaterials and Methods and presented in unit of nmol/mg protein. See text forabbreviations.
doi:10.1371/journal.pone.0021643.t002
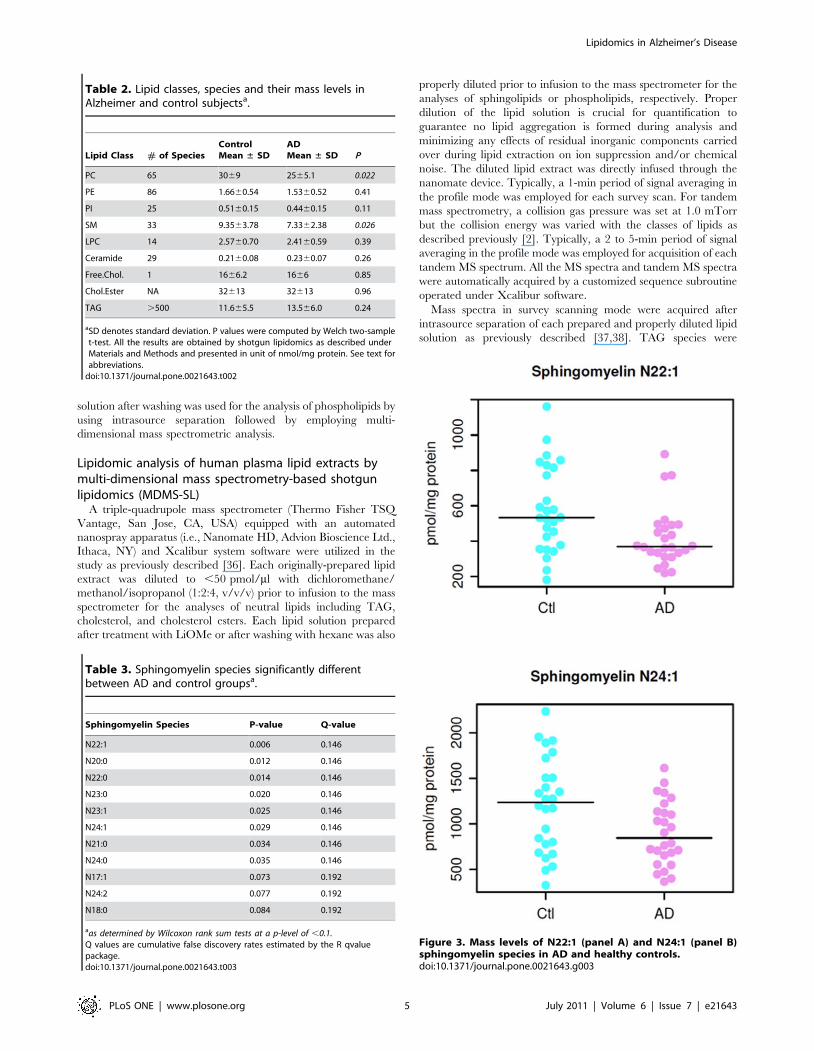
Figure 3. Mass levels of N22:1 (panel A) and N24:1 (panel B)sphingomyelin species in AD and healthy controls.doi:10.1371/journal.pone.0021643.g003
Table 3. Sphingomyelin species significantly differentbetween AD and control groupsa.
Sphingomyelin Species P-value Q-value
N22:1 0.006 0.146
N20:0 0.012 0.146
N22:0 0.014 0.146
N23:0 0.020 0.146
N23:1 0.025 0.146
N24:1 0.029 0.146
N21:0 0.034 0.146
N24:0 0.035 0.146
N17:1 0.073 0.192
N24:2 0.077 0.192
N18:0 0.084 0.192
aas determined by Wilcoxon rank sum tests at a p-level of ,0.1.Q values are cumulative false discovery rates estimated by the R qvaluepackage.doi:10.1371/journal.pone.0021643.t003
Lipidomics in Alzheimer’s Disease
PLoS ONE | www.plosone.org 5 July 2011 | Volume 6 | Issue 7 | e21643
identified and quantified directly from the originally-prepared lipid
solution as described in detail [39]. Cholesterol and cholesterol
esters were quantified directly from the originally-prepared lipid
solution as previously described [40]. Ceramide and SM species
were identified and quantified directly from lipid solutions after
treatment with LiOMe or hexane washing [41,42]. PC and LPC
species were identified and quantified directly from lipid solution
after washing with hexane as described [42]. PE and PI species
were identified and quantified directly from lipid solution with
hexane washing as previously described in detail [2,43]). In
summary, each individual lipid species corresponding to each of
the ion peaks was identified using multi-dimensional mass
spectrometry through building block analyses [2]. The identified
species were quantified using a two-step approach as previously
described [2]. First, the abundant and non-overlapping molecular
species of a class shown in one of the survey scans was quantified
by comparison with a pre-selected internal standard of the class
after 13C de-isotoping. Next, some or all of the determined
molecular species of the class (plus the pre-selected internal
standard) were used as standards to determine the mass content of
other low-abundance or overlapping molecular species using one
or multiple tandem mass traces (each of which represents a specific
building block of the class of interest) by two-dimensional MS.
APOE GenotypingAPOE genotypes were determined using TaqMan-based allelic
discrimination assay (Applied Biosystems). Specifically, APOE
status was established using two separate genotypes: (1) rs429358
334 T/C (ABI assay ID: C_3084793_20), and (2) rs7412 472T/C
(ABI assay ID: C_904973_10). Assays were conducted per
manufacturer’s protocol, using 10 ng of DNA from each subject
per assay. Fluorescence outputs were quantified in real time using
a 7900HT Fast Real Time PCR System and the data will be
analyzed using SDS software v.2.2.2 (Applied Biosystems). APOE
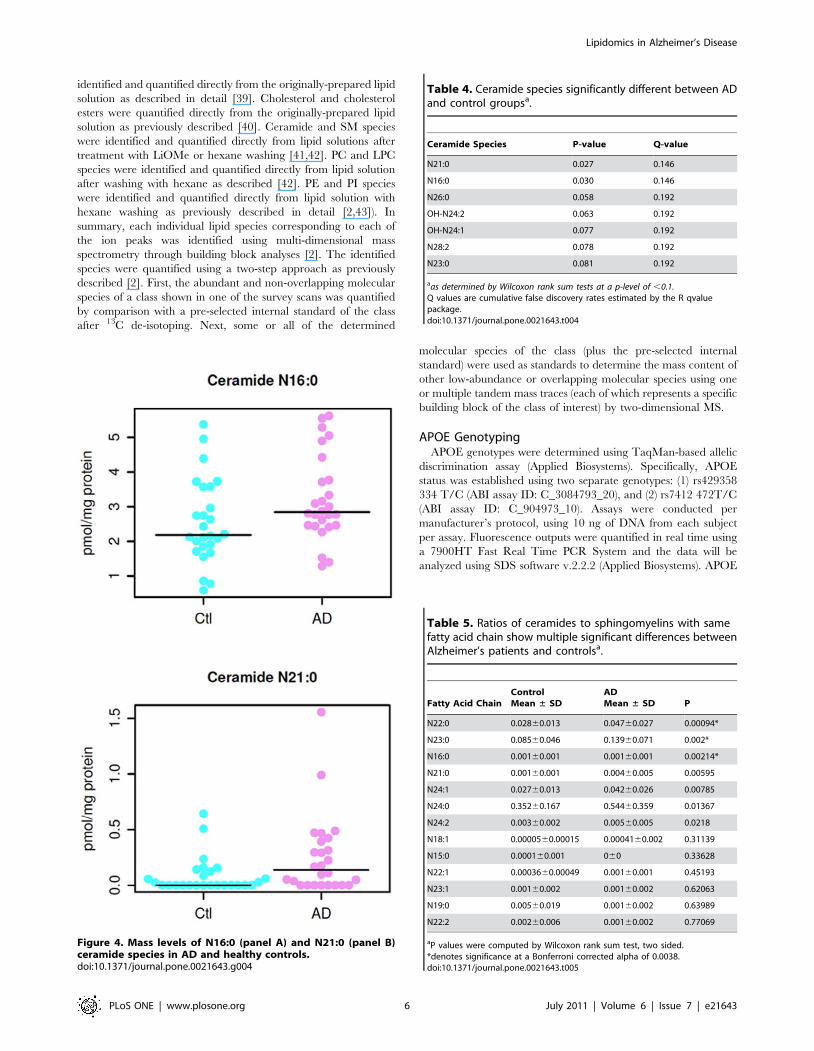
Figure 4. Mass levels of N16:0 (panel A) and N21:0 (panel B)ceramide species in AD and healthy controls.doi:10.1371/journal.pone.0021643.g004
Table 4. Ceramide species significantly different between ADand control groupsa.
Ceramide Species P-value Q-value
N21:0 0.027 0.146
N16:0 0.030 0.146
N26:0 0.058 0.192
OH-N24:2 0.063 0.192
OH-N24:1 0.077 0.192
N28:2 0.078 0.192
N23:0 0.081 0.192
aas determined by Wilcoxon rank sum tests at a p-level of ,0.1.Q values are cumulative false discovery rates estimated by the R qvaluepackage.doi:10.1371/journal.pone.0021643.t004
Table 5. Ratios of ceramides to sphingomyelins with samefatty acid chain show multiple significant differences betweenAlzheimer’s patients and controlsa.
Fatty Acid ChainControlMean ± SD
ADMean ± SD P
N22:0 0.02860.013 0.04760.027 0.00094*
N23:0 0.08560.046 0.13960.071 0.002*
N16:0 0.00160.001 0.00160.001 0.00214*
N21:0 0.00160.001 0.00460.005 0.00595
N24:1 0.02760.013 0.04260.026 0.00785
N24:0 0.35260.167 0.54460.359 0.01367
N24:2 0.00360.002 0.00560.005 0.0218
N18:1 0.0000560.00015 0.0004160.002 0.31139
N15:0 0.000160.001 060 0.33628
N22:1 0.0003660.00049 0.00160.001 0.45193
N23:1 0.00160.002 0.00160.002 0.62063
N19:0 0.00560.019 0.00160.002 0.63989
N22:2 0.00260.006 0.00160.002 0.77069
aP values were computed by Wilcoxon rank sum test, two sided.*denotes significance at a Bonferroni corrected alpha of 0.0038.doi:10.1371/journal.pone.0021643.t005
Lipidomics in Alzheimer’s Disease
PLoS ONE | www.plosone.org 6 July 2011 | Volume 6 | Issue 7 | e21643

genotype assignments were grouped for analyses as E4+ or E42.
APOE genotype data was only available for 49 subjects (34
controls and 15 AD, See Table 1).
Statistical AnalysisWe performed statistical analyses using the R statistical
programming system [44] (http://www.R-project.org). We treated
the variables MMSE, Logical Memory I, and Logical Memory II
as ordered categorical variables, and therefore, rather than
reporting means and standard deviations, we report medians
and median absolute deviations (R function ‘mad’, defined as
1.4826 times the median of the absolute value of the deviation
from the median). We used two-sided Wilcoxon rank sum tests for
differences in location for these variables as well as for age and
years of education. We used two-sided Fisher’s exact tests for
independence of affection status from each of (a) the number of
males, (b) the number of subjects using statins, and (c) the number
of subjects with at least one APOE e4 allele. For tests of differences
between two independent groups, we used Wilcoxon rank sum
tests to compute p-values, as the underlying variables are not in
general normally distributed. We calculated Q values (cumulative
false discovery rates) using the R ‘qvalue’ package [45]. We used
two-sided Wilcoxon signed rank tests of the null hypothesis that
the distribution of differences in standardized means is symmetric
around 0 (R function ‘wilcox.test’).
Results
Shotgun lipidomics analysis of plasma samplesWe analyzed 9 lipid classes in the study including choline
glycerophospholipid (PC), lysoPC (LPC), ethanolamine glycero-
phospholipid (PE), phosphatidylinositol, sphingomyelin (SM),
ceramide, triacylglycerol (TAG), cholesterol and cholesterol esters
by multi-dimensional mass spectrometry-based shotgun lipidomics
[1,2]. This platform has previously employed for quantitative
analysis of lipidomes (e.g., brain tissues and cerebrospinal fluid)
from AD patients [29,46]. A few representative tandem MS
spectra for identification and second step quantification of PC, PE,
SM, and ceramide species were shown in Figure 1. A two
dimensional mass spectrum for identification and quantitation of
TAG species was also illustrated (Figure 2). For example, the
primary ion at m/z 837.7 was crossed with the 14:0, 16:0, 16:1,
18:0, 18:1, and 18:2 fatty acyl building blocks (see the broken line
in Figure 2). A lithiated triacylglycerol species at m/z 837.7 must
contain 53 total carbon atoms with 2 double bonds or 54 total
carbon atoms with 9 double bonds, and the ion intensities resulting
from the neutral loss of the three acyl chains from a given TAG
molecule are nearly equal [39]. Thus, isomeric TAG species of
14:0-18:1-18:1, 14:0-18:0-18:2, 16:0-16:0-18:2, and 16:0-16:1-
18:1 were identified. Other TAG species corresponding to other
primary ions were identified similarly. The numbers of molecular
species and the total masses of each individual lipid class were
Figure 5. Ratios of specific ceramides to the sphingomyelins with the same fatty acid chains. See Table 5 for P values.doi:10.1371/journal.pone.0021643.g005
Lipidomics in Alzheimer’s Disease
PLoS ONE | www.plosone.org 7 July 2011 | Volume 6 | Issue 7 | e21643

tabulated (Table 2). For example, we identified 65 PC molecular
species present in human plasma lipid extracts with mass levels of
3069 and 2565 nmol/mg protein (i.e., 18906567 and
15756315 nmol/ml) in control and AD individuals, respectively
(p = 0.022). These results are well comparable with those
determined by LC-MS, which determined a total mass of
1974 nmol/ml from 31 PC species [47]. In exploratory analyses,
the mass levels of total PC and SM were lower in AD patients in
comparison to the control group (Table 2). Since we determined
over 800 molecular species and covered the categories of
(phospho)glycerolipids, sphingolipids, and sterols in the study, it
is very difficult to process the dataset and make a simple
comparison. Accordingly, in the current report, we mainly focused
on the detailed analyses of sphingolipids at the level of individual
molecular species.
Mass levels of sphingomyelin species in AD patientsWilcoxon rank sum tests revealed significant differences in the
quantified sphingomyelin species between the AD and control
groups. Of the 33 SM species tested, we found that 8 SM
molecular species, particularly those containing long aliphatic
chains such as 22 and 24 carbon atoms, were significantly lower
(p,0.05) in AD patients as compared to the age-matched
cognitively normal controls (Table 3). For example, Figure 3A
displays the distribution of the mass levels of SM species N22:1 in
the AD and control groups and Figure 3B shows the mass
Figure 6. Rank of the changed mean mass levels of individual sphingomyelin and ceramide molecular species in all AD patientsrelative to the normal controls (panel A) and the differences in sphingomyelins and ceramides between patients with moderateAlzheimer’s disease (MMSE,20) and patients with mild Alzheimer’s disease (MMSE. = 20) (panel B). The Y axes show the standardizeddifferences in lipid level: lipid levels were standardized to a mean of 0 and standard deviation of 1 across all samples before ranking and plotting. ForAlzheimer’s disease versus controls, P = 1.661029 for sphingomyelins and P = 0.00034 for ceramides (Wilcoxon signed rank test two sided on meansover the standardized data). For moderate versus mild Alzheimer’s disease, P = 7.161028 for sphingomyelins and P = 0.10 for ceramides.doi:10.1371/journal.pone.0021643.g006
Lipidomics in Alzheimer’s Disease
PLoS ONE | www.plosone.org 8 July 2011 | Volume 6 | Issue 7 | e21643

distribution of N24:1 SM species between the groups. The mass
levels of additional 6 sphingomyelin species are different between
AD and control groups at the p,0.1 level.
Mass levels of ceramide species in AD patientsIn contrast to the reduction of sphingomyelin mass levels in
plasma of AD patients, we identified significantly increased mass
levels of 2 ceramide species (N16:0 and N21:0) (p,0.05) (see
Figure 4 below for distribution in individual patients between the
groups) and of other 5 species at the p,0.1 level in plasma of AD
patients in comparison to those of controls (Table 4). The rest of
the ceramide species were not significantly different between the
AD and control groups.
Ratios of ceramide to sphingomyelin species containingidentical fatty acyl chain
We computed ratios of ceramides to sphingomyelins, and then
used Wilcoxon rank sum tests to compare ratios between groups.
Numerous ratios differed significantly between the groups. The
ratios appeared to discriminate AD versus controls more robustly
than the differences seen with individual ceramide or sphingomy-
elin species (Table 5 and Figure 5 compared to Tables 2 and 3 and
Figures 3 and 4, respectively).
Sphingolipidome Alterations in Mild versus Moderate ADThe rank of the mean mass levels of all determined individual
SM and ceramide species indicates that the reduction of SM mass
levels and the increases in ceramide mass levels in AD plasma
samples are essentially in uniformity, with only a few exceptions
(two SM species and four ceramide species which are located at
the end of small changes) (Figure 6A).
Identical data analysis was performed to compare the mass
levels of these classes in mild AD patients (MMSE. = 20) and in
moderate AD patients (MMSE,20) relative to the normal
controls, respectively. We found that the changes of both lipid
classes in either mild AD patients (p = 2.3e-10 for SM and
p = 0.021 for ceramides) or moderate AD patients (p = 0.0066 for
SM and p = 0.00013 for ceramides) relative to the controls are
significant (Figure 6B).
Mass levels of many sphingomyelin and ceramide species were
correlated with AD severity (Figure 7). For example, the rank of
AD severity (i.e., MMSE) was significantly correlated with the rank
of the altered mass levels of both N20:2 SM and OH-N25:0
ceramide (p values of 0.00328 and 0.00379, respectively).
Exploratory analyses of the effects of statins on masslevels of SM and ceramides
Concomitant statin use is common in the elderly and may
confound the identification of the altered plasma SM and
ceramide profiles in AD. Our data suggests that statins
significantly lowered levels of both SM and ceramides in both
AD and controls (Figure 8). However, this effect does not
significantly affect our main finding of lower SM mass levels and
higher ceramide contents in AD patients relative to the controls
(Figure 8).
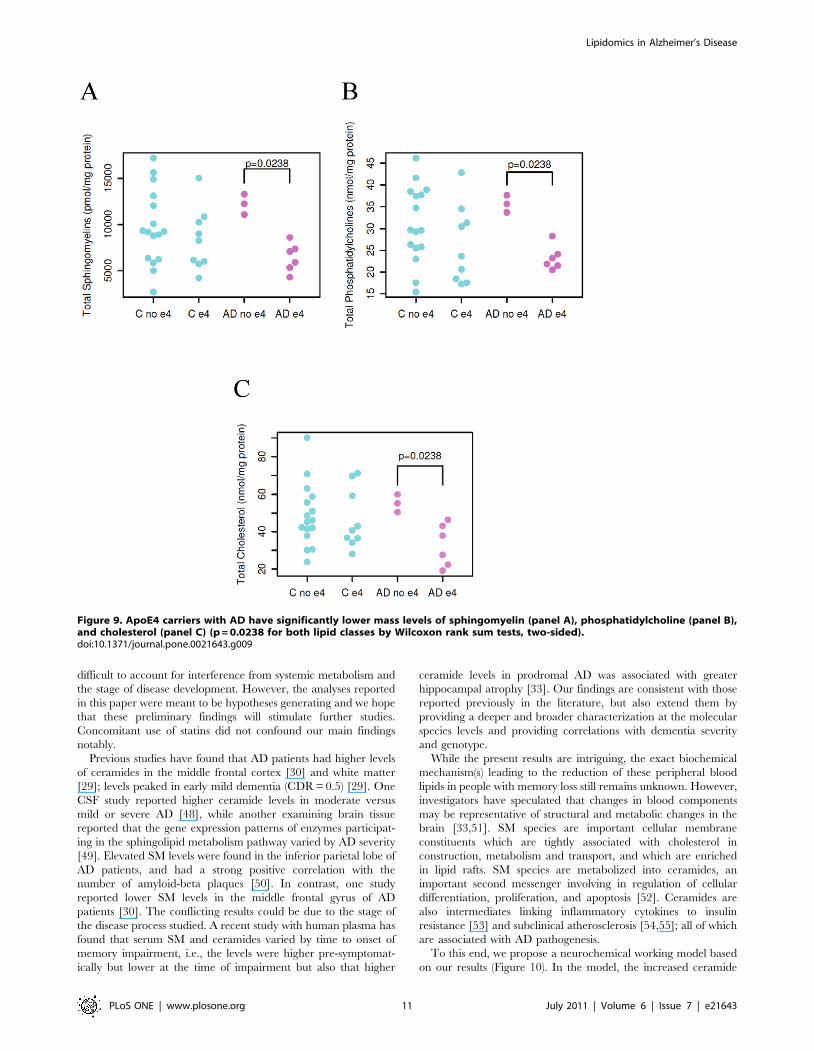
Effect of APOE4 genotype on the mass levels of plasmalipidome
In exploratory analyses, there was no significant relationship
between APOE genotypes and the altered SM and ceramide
profiles. However, mass levels of a few plasma lipid classes
including SM, phosphatidylcholine, and cholesterol were signifi-
cantly lower in AD patients carrying APOE4 allele(s) than those
carrying other APOE isoforms, but such mass differences were not
present in normal controls (Figure 9).
Discussion
This is the first prospective study, to our knowledge, to utilize a
highly efficient multidimensional shotgun lipidomic platform to
examine over 800 lipid species in plasma of a well characterized
sample of AD and control subjects. The median MMSE of our AD
was 21 which is in the mild range, but we also included patients
Figure 7. Correlation of the rank of the changed mean masslevels of sphingomyelin and ceramide species with the rank ofAD severity. P values are based on Pearson’s product momentcorrelation coefficient between the ranks as plotted. The lines representlinear regressions of the ranks of the MMSE scores against the ranks ofthe lipids.doi:10.1371/journal.pone.0021643.g007
Lipidomics in Alzheimer’s Disease
PLoS ONE | www.plosone.org 9 July 2011 | Volume 6 | Issue 7 | e21643

with moderate AD in order to represent the range of severity seen
usually in outpatient clinics. There were several key findings that
emerged: First, we demonstrated significant reductions of
sphingomyelin mass and significant increases in ceramide content
in plasma of AD patients. Second we demonstrated that the rank
order of these opposing changes are essentially species specific and
uniform. Third, we showed that ratios of SM and ceramide species
with identical fatty acyl chains results in more robust discrimina-
tion than either metabolite alone. Fourth, we showed that our
findings are seen both in mild and moderate stages of AD with
some metabolites also showing correlations with cognitive
performance. In addition, although the numbers of samples
genotyped are small our data suggest ApoE4 genotype specific
metabolite differences in AD. The small sample size also made it
Figure 8. Lower sphingomyelins and higher ceramides in Alzheimer’s patients are independent of statin use. Panel A shows thedifferences in sphingomyelin and ceramide mass levels between AD patients and controls who were taking statins. For this comparison, P = 761024
for sphingomyelins and P = 0.00054 for ceramides (Wilcoxon signed rank test). Panel B shows the differences of sphingomyelin and ceramide masslevels between AD patients and controls who were not taking statins. For this comparison, P = 3.261028 for sphingomyelins and P = 0.0056 forceramides (Wilcoxon signed rank test).doi:10.1371/journal.pone.0021643.g008
Lipidomics in Alzheimer’s Disease
PLoS ONE | www.plosone.org 10 July 2011 | Volume 6 | Issue 7 | e21643
difficult to account for interference from systemic metabolism and
the stage of disease development. However, the analyses reported
in this paper were meant to be hypotheses generating and we hope
that these preliminary findings will stimulate further studies.
Concomitant use of statins did not confound our main findings
notably.
Previous studies have found that AD patients had higher levels
of ceramides in the middle frontal cortex [30] and white matter
[29]; levels peaked in early mild dementia (CDR = 0.5) [29]. One
CSF study reported higher ceramide levels in moderate versus
mild or severe AD [48], while another examining brain tissue
reported that the gene expression patterns of enzymes participat-
ing in the sphingolipid metabolism pathway varied by AD severity
[49]. Elevated SM levels were found in the inferior parietal lobe of
AD patients, and had a strong positive correlation with the
number of amyloid-beta plaques [50]. In contrast, one study
reported lower SM levels in the middle frontal gyrus of AD
patients [30]. The conflicting results could be due to the stage of
the disease process studied. A recent study with human plasma has
found that serum SM and ceramides varied by time to onset of
memory impairment, i.e., the levels were higher pre-symptomat-
ically but lower at the time of impairment but also that higher
ceramide levels in prodromal AD was associated with greater
hippocampal atrophy [33]. Our findings are consistent with those
reported previously in the literature, but also extend them by
providing a deeper and broader characterization at the molecular
species levels and providing correlations with dementia severity
and genotype.
While the present results are intriguing, the exact biochemical
mechanism(s) leading to the reduction of these peripheral blood
lipids in people with memory loss still remains unknown. However,
investigators have speculated that changes in blood components
may be representative of structural and metabolic changes in the
brain [33,51]. SM species are important cellular membrane
constituents which are tightly associated with cholesterol in
construction, metabolism and transport, and which are enriched
in lipid rafts. SM species are metabolized into ceramides, an
important second messenger involving in regulation of cellular
differentiation, proliferation, and apoptosis [52]. Ceramides are
also intermediates linking inflammatory cytokines to insulin
resistance [53] and subclinical atherosclerosis [54,55]; all of which
are associated with AD pathogenesis.
To this end, we propose a neurochemical working model based
on our results (Figure 10). In the model, the increased ceramide
Figure 9. ApoE4 carriers with AD have significantly lower mass levels of sphingomyelin (panel A), phosphatidylcholine (panel B),and cholesterol (panel C) (p = 0.0238 for both lipid classes by Wilcoxon rank sum tests, two-sided).doi:10.1371/journal.pone.0021643.g009
Lipidomics in Alzheimer’s Disease
PLoS ONE | www.plosone.org 11 July 2011 | Volume 6 | Issue 7 | e21643
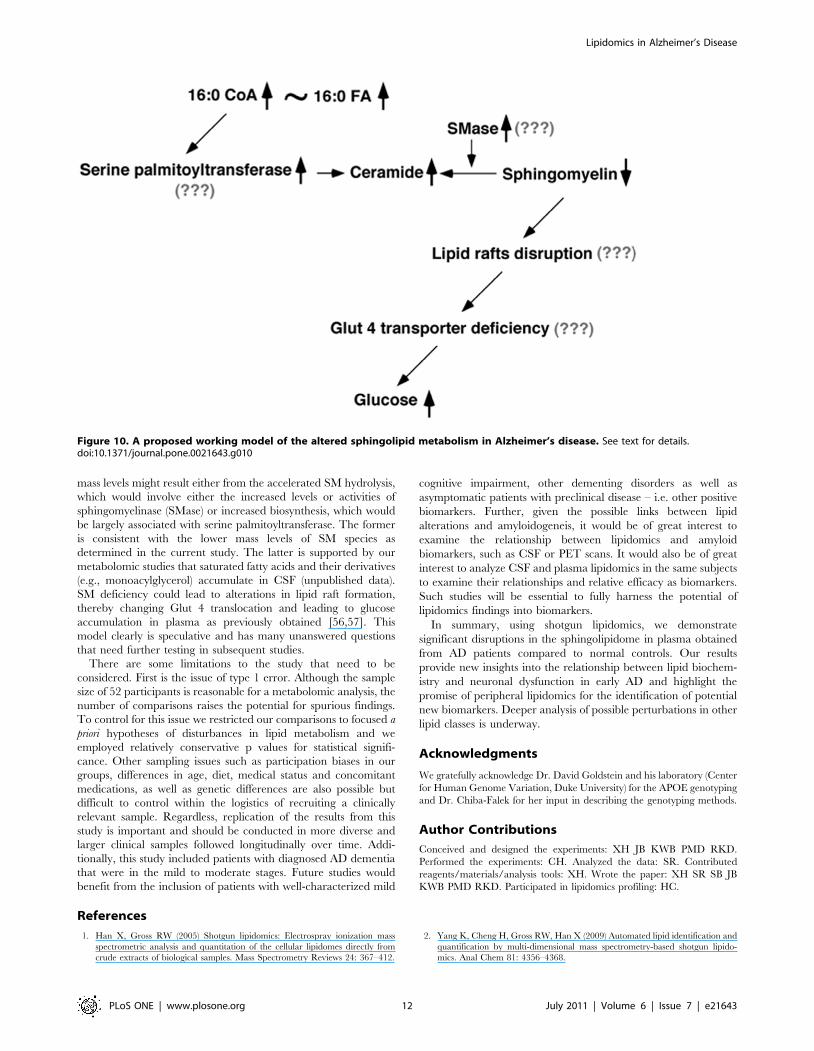
mass levels might result either from the accelerated SM hydrolysis,
which would involve either the increased levels or activities of
sphingomyelinase (SMase) or increased biosynthesis, which would
be largely associated with serine palmitoyltransferase. The former
is consistent with the lower mass levels of SM species as
determined in the current study. The latter is supported by our
metabolomic studies that saturated fatty acids and their derivatives
(e.g., monoacylglycerol) accumulate in CSF (unpublished data).
SM deficiency could lead to alterations in lipid raft formation,
thereby changing Glut 4 translocation and leading to glucose
accumulation in plasma as previously obtained [56,57]. This
model clearly is speculative and has many unanswered questions
that need further testing in subsequent studies.
There are some limitations to the study that need to be
considered. First is the issue of type 1 error. Although the sample
size of 52 participants is reasonable for a metabolomic analysis, the
number of comparisons raises the potential for spurious findings.
To control for this issue we restricted our comparisons to focused a
priori hypotheses of disturbances in lipid metabolism and we
employed relatively conservative p values for statistical signifi-
cance. Other sampling issues such as participation biases in our
groups, differences in age, diet, medical status and concomitant
medications, as well as genetic differences are also possible but
difficult to control within the logistics of recruiting a clinically
relevant sample. Regardless, replication of the results from this
study is important and should be conducted in more diverse and
larger clinical samples followed longitudinally over time. Addi-
tionally, this study included patients with diagnosed AD dementia
that were in the mild to moderate stages. Future studies would
benefit from the inclusion of patients with well-characterized mild
cognitive impairment, other dementing disorders as well as
asymptomatic patients with preclinical disease – i.e. other positive
biomarkers. Further, given the possible links between lipid
alterations and amyloidogeneis, it would be of great interest to
examine the relationship between lipidomics and amyloid
biomarkers, such as CSF or PET scans. It would also be of great
interest to analyze CSF and plasma lipidomics in the same subjects
to examine their relationships and relative efficacy as biomarkers.
Such studies will be essential to fully harness the potential of
lipidomics findings into biomarkers.
In summary, using shotgun lipidomics, we demonstrate
significant disruptions in the sphingolipidome in plasma obtained
from AD patients compared to normal controls. Our results
provide new insights into the relationship between lipid biochem-
istry and neuronal dysfunction in early AD and highlight the
promise of peripheral lipidomics for the identification of potential
new biomarkers. Deeper analysis of possible perturbations in other
lipid classes is underway.
Acknowledgments
We gratefully acknowledge Dr. David Goldstein and his laboratory (Center
for Human Genome Variation, Duke University) for the APOE genotyping
and Dr. Chiba-Falek for her input in describing the genotyping methods.
Author Contributions
Conceived and designed the experiments: XH JB KWB PMD RKD.
Performed the experiments: CH. Analyzed the data: SR. Contributed
reagents/materials/analysis tools: XH. Wrote the paper: XH SR SB JB
KWB PMD RKD. Participated in lipidomics profiling: HC.
References
1. Han X, Gross RW (2005) Shotgun lipidomics: Electrospray ionization mass
spectrometric analysis and quantitation of the cellular lipidomes directly from
crude extracts of biological samples. Mass Spectrometry Reviews 24: 367–412.
2. Yang K, Cheng H, Gross RW, Han X (2009) Automated lipid identification and
quantification by multi-dimensional mass spectrometry-based shotgun lipido-
mics. Anal Chem 81: 4356–4368.
Figure 10. A proposed working model of the altered sphingolipid metabolism in Alzheimer’s disease. See text for details.doi:10.1371/journal.pone.0021643.g010
Lipidomics in Alzheimer’s Disease
PLoS ONE | www.plosone.org 12 July 2011 | Volume 6 | Issue 7 | e21643

3. Brookmeyer R, Johnson E, Ziegler-Graham K, Arrighi HM (2007) Forecasting
the global burden of Alzheimer’s disease. Alzheimers Dement 3: 186–191.
4. Schneider JA, Arvanitakis Z, Bang W, Bennett DA (2007) Mixed brainpathologies account for most dementia cases in community-dwelling older
persons. Neurology 69: 2197–2204.
5. Schneider JA, Aggarwal NT, Barnes L, Boyle P, Bennett DA (2009) Theneuropathology of older persons with and without dementia from community
versus clinic cohorts. J Alzheimers Dis 18: 691–701.
6. Jones L, Harold D, Williams J (2010) Genetic evidence for the involvement oflipid metabolism in Alzheimer’s disease. Biochim Biophys Acta 1801: 754–761.
7. Viswanathan A, Rocca WA, Tzourio C (2009) Vascular risk factors anddementia: how to move forward? Neurology 72: 368–374.
8. Strittmatter WJ, Roses AD (1996) Apolipoprotein E and Alzheimer’s disease.
Annu Rev Neurosci 19: 53–77.
9. Mayeux R, Reitz C, Brickman AM, Haan MN, Manly JJ, et al. (2011)Operationalizing diagnostic criteria for Alzheimer’s disease and other age-
related cognitive impairment-Part 1. Alzheimers Dement 7: 15–34.
10. Vemuri P, Wiste HJ, Weigand SD, Shaw LM, Trojanowski JQ, et al. (2009)MRI and CSF biomarkers in normal, MCI, and AD subjects: diagnostic
discrimination and cognitive correlations. Neurology 73: 287–293.
11. De Meyer G, Shapiro F, Vanderstichele H, Vanmechelen E, Engelborghs S,et al. (2010) Diagnosis-independent Alzheimer disease biomarker signature in
cognitively normal elderly people. Arch Neurol 67: 949–956.
12. Kaddurah-Daouk R, Kristal BS, Weinshilboum RM (2008) Metabolomics: AGlobal Biochemical Approach to Drug Response and Disease. Annu Rev
Pharmacol Toxicol 48: 653–683.
13. Kristal BS, Kaddurah-Daouk R, Beal MF, Matson WR (2007) Metabolomics:
concept and potential neuroscience application. Handbook of Neurochemistry
and Molecular Neurobiology: Brain Energetics Integration of Molecular andCellular Processes. New York: Springer. pp 889–912.
14. Lindon JC, Holmes E, Nicholson JK (2007) Metabonomics in pharmaceutical
R&D. FEBS J 274: 1149–1151.
15. Ji Y, Hebbring S, Zhu H, Jenkins GD, Biernacka J, et al. (2011) Glycine and a
glycine dehydrogenase (GLDC) SNP as citalopram/escitalopram response
biomarkers in depression: pharmacometabolomics-informed pharmacoge-nomics. Clin Pharmacol Ther 89: 97–104.
16. Paige LA, Mitchell MW, Krishnan KR, Kaddurah-Daouk R, Steffens DC(2007) A preliminary metabolomic analysis of older adults with and without
depression. Int J Geriatr Psychiatry 22: 418–423.
17. Steffens DC, Wei J, Krishnan KR, Karoly ED, Mitchell MW, et al. (2010)Metabolomic differences in heart failure patients with and without major
depression. J Geriatr Psychiatry Neurol 23: 138–146.
18. Rozen S, Cudkowicz ME, Bogdanov M, Matson WR, Kristal BS, et al. (2005)Metabolomic analysis and signatures in motor neuron disease. Metabolomics 1:
101–108.
19. Bogdanov M, Matson WR, Wang L, Matson T, Saunders-Pullman R, et al.(2008) Metabolomic profiling to develop blood biomarkers for Parkinson’s
disease. Brain 131: 389–396.
20. Patkar AA, Rozen S, Mannelli P, Matson W, Pae CU, et al. (2009) Alterations intryptophan and purine metabolism in cocaine addiction: a metabolomic study.
Psychopharmacology (Berl) 206: 479–489.
21. Mannelli P, Patkar A, Rozen S, Matson W, Krishnan R, et al. (2009) Opioid useaffects antioxidant activity and purine metabolism: preliminary results. Hum
Psychopharmacol 24: 666–675.
22. Kaddurah-Daouk R, McEvoy J, Baillie RA, Lee D, Yao JK, et al. (2007)Metabolomic mapping of atypical antipsychotic effects in schizophrenia. Mol
Psychiatry 12: 934–945.
23. Yao JK, Dougherty GG, Jr., Reddy RD, Keshavan MS, Montrose DM, et al.(2010) Altered interactions of tryptophan metabolites in first-episode neuroleptic-
naive patients with schizophrenia. Mol Psychiatry 15: 938–953.
24. Yao JK, Dougherty GG, Jr., Reddy RD, Keshavan MS, Montrose DM, et al.(2010) Homeostatic imbalance of purine catabolism in first-episode neuroleptic-
naive patients with schizophrenia. PLoS One 5: e9508.
25. Kaddurah-Daouk R, Rozen S, Matson W, Han X, Hulette CM, et al. (2010)Metabolomic changes in autopsy-confirmed Alzheimer’s disease. Alzheimers
Dement.
26. Han X (2010) Multi-dimensional mass spectrometry-based shotgun lipidomics
and the altered lipids at the mild cognitive impairment stage of Alzheimer’s
disease. Biochim Biophys Acta 1801: 774–783.
27. Han X (2005) Lipid alterations in the earliest clinically recognizable stage of
Alzheimer’s disease: implication of the role of lipids in the pathogenesis of
Alzheimer’s disease. Curr Alzheimer Res 2: 65–77.
28. Svennerholm L, Gottfries CG (1994) Membrane lipids, selectively diminished in
Alzheimer brains, suggest synapse loss as a primary event in early-onset form
(type I) and demyelination in late-onset form (type II). Journal of Neurochem-istry 62: 1039–1047.
29. Han X, Holtzman DM, McKeel DW, Jr., Kelley J, Morris JC (2002) Substantialsulfatide deficiency and ceramide elevation in very early Alzheimer’s disease:
potential role in disease pathogenesis. Journal of Neurochemistry 82: 809–818.
30. Cutler RG, Kelly J, Storie K, Pedersen WA, Tammara A, et al. (2004)Involvement of oxidative stress-induced abnormalities in ceramide and
cholesterol metabolism in brain aging and Alzheimer’s disease. Proceedings of
the National Academy of Sciences of the United States of America 101:
2070–2075.31. Klein J (2000) Membrane breakdown in acute and chronic neurodegeneration:
Focus on choline-containing phospholipids. J Neural Transm 107: 1027–1063.
32. Han X, Holtzman DM, McKeel DW, Jr. (2001) Plasmalogen deficiency in earlyAlzheimer’s disease subjects and in animal models: molecular characterization
using electrospray ionization mass spectrometry. J Neurochem 77: 1168–1180.33. Mielke MM, Bandaru VV, Haughey NJ, Rabins PV, Lyketsos CG, et al. (2010)
Serum sphingomyelins and ceramides are early predictors of memory
impairment. Neurobiology of Aging 31: 17–24.34. Christie WW, Han X (2010) Lipid Analysis: Isolation, Separation, Identification
and Lipidomic Analysis. Bridgwater, England: The Oily Press. 428 p.35. Jiang X, Cheng H, Yang K, Gross RW, Han X (2007) Alkaline methanolysis of
lipid extracts extends shotgun lipidomics analyses to the low abundance regimeof cellular sphingolipids. Analytical Biochemistry 371: 135–145.
36. Han X, Yang K, Gross RW (2008) Microfluidics-based electrospray ionization
enhances intrasource separation of lipid classes and extends identification ofindividual molecular species through multi-dimensional mass spectrometry:
Development of an automated high throughput platform for shotgun lipidomics.Rapid Communications in Mass Spectrometry 22: 2115–2124.
37. Han X, Yang J, Cheng H, Ye H, Gross RW (2004) Towards fingerprinting
cellular lipidomes directly from biological samples by two-dimensional electro-spray ionization mass spectrometry. Analytical Biochemistry 330: 317–331.
38. Han X, Yang K, Yang J, Fikes KN, Cheng H, et al. (2006) Factors influencingthe electrospray intrasource separation and selective ionization of glyceropho-
spholipids. J Am Soc Mass Spectrom 17: 264–274.39. Han X, Gross RW (2001) Quantitative analysis and molecular species
fingerprinting of triacylglyceride molecular species directly from lipid extracts
of biological samples by electrospray ionization tandem mass spectrometry. AnalBiochem 295: 88–100.
40. Cheng H, Jiang X, Han X (2007) Alterations in lipid homeostasis of mousedorsal root ganglia induced by apolipoprotein E deficiency: a shotgun lipidomics
study. J Neurochem 101: 57–76.
41. Han X (2002) Characterization and direct quantitation of ceramide molecularspecies from lipid extracts of biological samples by electrospray ionization
tandem mass spectrometry. Anal Biochem 302: 199–212.42. Yang K, Zhao Z, Gross RW, Han X (2009) Systematic analysis of choline-
containing phospholipids using multi-dimensional mass spectrometry-basedshotgun lipidomics. J Chromatogr B Analyt Technol Biomed Life Sci 877:
2924–2936.
43. Han X, Yang K, Cheng H, Fikes KN, Gross RW (2005) Shotgun lipidomics ofphosphoethanolamine-containing lipids in biological samples after one-step in
situ derivatization. J Lipid Res 46: 1548–1560.44. R Development Core Team (2010) R: A Language and Environment for
Statistical Computing. Vienna, Austria: R Foundation for Statistical Computing.
45. Storey JD, Tibshirani R (2003) Statistical significance for genomewide studies.Proceedings of the National Academy of Sciences, USA 100: 9440–9445.
46. Han X, Fagan AM, Cheng H, Morris JC, Xiong C, et al. (2003) Cerebrospinalfluid sulfatide is decreased in subjects with incipient dementia. Ann Neurol 54:
115–119.47. Quehenberger O, Armando AM, Brown AH, Milne SB, Myers DS, et al. (2010)
Lipidomics reveals a remarkable diversity of lipids in human plasma. Journal of
Lipid Research 51: 3299–3305.48. Satoi H, Tomimoto H, Ohtani R, Kitano T, Kondo T, et al. (2005) Astroglial
expression of ceramide in Alzheimer’s disease brains: a role during neuronalapoptosis. Neuroscience 130: 657–666.
49. Katsel P, Li C, Haroutunian V (2007) Gene expression alterations in the
sphingolipid metabolism pathways during progression of dementia andAlzheimer’s disease: a shift toward ceramide accumulation at the earliest
recognizable stages of Alzheimer’s disease? Neurochem Res 32: 845–856.50. Pettegrew JW, Panchalingam K, Hamilton RL, McClure RJ (2001) Brain
membrane phospholipid alterations in Alzheimer’s disease. Neurochem Res 26:
771–782.51. Ray S, Britschgi M, Herbert C, Takeda-Uchimura Y, Boxer A, et al. (2007)
Classification and prediction of clinical Alzheimer’s diagnosis based on plasmasignaling proteins. Nature Medicine 13: 1359–1362.
52. Merrill AH, Jr., Schmelz EM, Dillehay DL, Spiegel S, Shayman JA, et al. (1997)Sphingolipids–the enigmatic lipid class: biochemistry, physiology, and patho-
physiology. Toxicol Appl Pharmacol 142: 208–225.
53. Summers SA (2006) Ceramides in insulin resistance and lipotoxicity. Prog LipidRes 45: 42–72.
54. Ichi I, Nakahara K, Miyashita Y, Hidaka A, Kutsukake S, et al. (2006)Association of ceramides in human plasma with risk factors of atherosclerosis.
Lipids 41: 859–863.
55. Nelson JC, Jiang XC, Tabas I, Tall A, Shea S (2006) Plasma sphingomyelin andsubclinical atherosclerosis: findings from the multi-ethnic study of atherosclero-
sis. Am J Epidemiol 163: 903–912.56. Nagata Y, Kobayashi H, Umeda M, Ohta N, Kawashima S, et al. (2006)
Sphingomyelin levels in the plasma membrane correlate with the activation stateof muscle satellite cells. J Histochem Cytochem 54: 375–384.
57. Silva LC, Futerman AH, Prieto M (2009) Lipid raft composition modulates
sphingomyelinase activity and ceramide-induced membrane physical alterations.Biophys J 96: 3210–3222.
Lipidomics in Alzheimer’s Disease
PLoS ONE | www.plosone.org 13 July 2011 | Volume 6 | Issue 7 | e21643