meta-analysis of genome-wide association studies for personality
TRANSCRIPT

1
Meta-analysis of genome-wide association studies for personality
Marleen H.M. de Moor 1†, Paul T. Costa 2, Antonio Terracciano 2, Robert F. Krueger 3,
Eco J.C. de Geus 1, Tanaka Toshiko 2, Brenda W.J.H. Penninx 4,5,6, Tõnu Esko 7,8,9,
Pamela A F Madden 10, Jaime Derringer 3, Najaf Amin 11, Gonneke Willemsen 1,
Jouke-Jan Hottenga 1, Marijn A. Distel 1, Manuela Uda 12, Serena Sanna 12, Philip
Spinhoven 5, Catharina A. Hartman 4, Patrick Sullivan 13, Anu Realo 14, Jüri Allik 14,
Andrew C Heath 10, Michele L Pergadia 10, Arpana Agrawal 10, Peng Lin 10, Richard
Grucza 10, Teresa Nutile 15, Marina Ciullo 15, Dan Rujescu 16, Ina Giegling 16, Bettina
Konte 16, Elisabeth Widen 17, Diana L Cousminer 17, Johan G. Eriksson 18,19,20,
21,22, Aarno Palotie 17,23,24, 31, Leena Peltonen 17,23,24, 31 **, Michelle Luciano
25, Albert Tenesa 26, Gail Davies 25, Lorna M. Lopez 25, Narelle K. Hansell 27, Sarah
E. Medland 27, Luigi Ferrucci 2, David Schlessinger 2, Grant W. Montgomery 27,
Margaret J. Wright 27, Yurii S. Aulchenko 11, A.Cecile J.W. Janssens 11, Ben A. Oostra
28, Andres Metspalu 7,8,9, Gonçalo R. Abecasis 29, Ian J. Deary 25, Katri Räikkönen
30, Laura J. Bierut 10, Nicholas G. Martin 27, Cornelia M. van Duijn 11* , and Dorret I.
Boomsma 1*
peer
-006
0188
0, v
ersi
on 1
- 21
Jun
201
1Author manuscript, published in "Molecular Psychiatry (2010)"
DOI : 10.1038/mp.2010.128

2
1 Department of Biological Psychology, VU University Amsterdam, 1081 BT,
Amsterdam, The Netherlands
2 National Institute on Aging, NIH, Baltimore, MD, USA
3 Department of Psychology, University of Minnesota, N218 Elliott Hall, 75 East River
Road, Minneapolis, MN 55455-0344, USA
4 Department of Psychiatry, University Medical Center Groningen, Groningen, The
Netherlands
5 Departments of Clinical Psychology and Psychiatry, Leiden University, Leiden, The
Netherlands
6 Department of Psychiatry, EMGO+ Institute, Neuroscience Campus Amsterdam, VU
University Medical Center Amsterdam, Amsterdam, The Netherlands
7 Institute of Molecular and Cell Biology, University of Tartu, Estonia
8 Estonian Biocentre, Estonia
9 Estonian Genome Project of University of Tartu, Estonia
10 Department of Psychiatry, Washington University School of Medicine, 660 S. Euclid,
CB 8134, St. Louis, MO 63108, USA
11 Department of Epidemiology, Erasmus University Medical Center, P.O. Box 2040,
3000 CA Rotterdam, The Netherlands
12 Istituto di Neurogenetica e Neurofarmacologia, CNR, Monserrato, Cagliari, Italy
13 Department of Genetics, University of North Carolina at Chapel Hill, Chapel Hill,
North Carolina 27599, USA
14 Department of Psychology, University of Tartu, Estonia
15 Institute of Genetics and Biophysics A. Buzzati-Traverso – CNR, Naples, Italy
peer
-006
0188
0, v
ersi
on 1
- 21
Jun
201
1

3
16 Department of Psychiatry, University of Munich (LMU), Germany
17 Institute for Molecular Medicine Finland (FIMM), University of Helsinki, Finland
18 National Institute for Health and Welfare, Helsinki, Finland
19 Department of General Practice and Primary Health Care, University of Helsinki,
Helsinki, Finland
20 Vasa Central Hospital, Vasa, Finland
21 Unit of General Practice, Helsinki University Central Hospital, Helsinki, Finland
22 Folkhälsan Research Centre, Helsinki, Finland
23 Wellcome Trust Sanger Institute, Cambridge, UK.
24 Broad Institute of Harvard and MIT, Cambridge, Massachusetts, USA
25 Centre for Cognitive Ageing and Cognitive Epidemiology, Department of Psychology,
The University of Edinburgh, 7 George Square, Edinburgh, EH8 9JZ, UK
26 MRC Human Genetics Unit, The Institute of Genetics and Molecular Medicine,
Western General Hospital, Edinburgh, EH4 2XU, UK
27 Queensland Institute of Medical Research, Brisbane, QLD, Australia
28 Department of Clinical Genetics, Erasmus University Medical Center, P.O. Box 2040,
3000 CA Rotterdam, The Netherlands
29 Center for Statistical Genetics, Department of Biostatistics, University of Michigan,
Ann Arbor, MI, USA
30 Department of Psychology, University of Helsinki, P.O. Box 9 (Siltavuorenpenger 20
D), 00014 University of Helsinki, Finland
31 Department of Medical Genetics, University of Helsinki and Helsinki University
Hospital, 00290 Helsinki, Finland
peer
-006
0188
0, v
ersi
on 1
- 21
Jun
201
1

4
† To whom correspondence should be addressed: VU University Amsterdam,
Department of Biological Psychology, van der Boechorststraat 1, 1081 BT, Amsterdam,
The Netherlands. Telephone: +31 20 598 8787. Fax: +31 20 598 8832. E-mail:
* Equal last authorship
** Deceased
Running title: Meta-analysis of GWA results for personality
peer
-006
0188
0, v
ersi
on 1
- 21
Jun
201
1

5
Abstract
Personality can be thought of as a set of characteristics that influence people’s thoughts,
feelings, and behaviour across a variety of settings. Variation in personality is predictive
of many outcomes in life, including mental health. Here we report on a meta-analysis of
genome-wide association (GWA) data for personality in ten discovery samples (17 375
adults) and five in-silico replication samples (3 294 adults). All participants were of
European ancestry. Personality scores for Neuroticism, Extraversion, Openness to
Experience, Agreeableness, and Conscientiousness were based on the NEO Five-Factor
Inventory. Genotype data were available of ~2.4M Single Nucleotide Polymorphisms
(SNPs; directly typed and imputed using HAPMAP data). In the discovery samples,
classical association analyses were performed under an additive model followed by meta-
analysis using the weighted inverse variance method. Results showed genome-wide
significance for Openness to Experience near the RASA1 gene on 5q14.3 (rs1477268 and
rs2032794, P = 2.8 x 10⁻⁸ and 3.1 x 10⁻⁸) and for Conscientiousness in the brain-
expressed KATNAL2 gene on 18q21.1 (rs2576037, P = 4.9 x 10⁻⁸). We further conducted
a gene-based test that confirmed the association of KATNAL2 to Conscientiousness. In-
silico replication did not, however, show significant associations of the top SNPs with
Openness and Conscientiousness, although the direction of effect of the KATNAL2 SNP
on Conscientiousness was consistent in all replication samples. Larger scale GWA
studies and alternative approaches are required for confirmation of KATNAL2 as a novel
gene affecting Conscientiousness.
peer
-006
0188
0, v
ersi
on 1
- 21
Jun
201
1

6
Keywords: Personality, Five-Factor Model, Genome-wide association, Meta-analysis,
Genetic variants
peer
-006
0188
0, v
ersi
on 1
- 21
Jun
201
1

7
The structure of human personality has traditionally been accounted for by a relatively
small set of traits. Over the last century, scientific consensus has converged on a
taxonomic model of personality traits based on five higher-order dimensions of
Neuroticism, Extraversion, Openness to Experience, Agreeableness and
Conscientiousness, known as the Five-Factor Model (FFM).1 These five dimensions are
largely independent and provide a broad description of personality. Neuroticism is
commonly defined as emotional instability; it involves the experience of negative
emotions such as anxiety, depression, hostility, and the vulnerability to stress.
Extraversion is characterized by positive emotions, gregariousness, and the tendency to
be active, seek out stimulation and enjoy the company of others. Openness to Experience
involves active imagination, aesthetic attentiveness, variety preference and intellectual
curiosity. Agreeableness can be defined as the tendency to be cooperative and
compassionate rather than suspicious and antagonistic towards others. Lastly, the
dimension of Conscientiousness reflects self-discipline, carefulness, thoroughness,
organization, deliberation and achievement.
Personality traits predict a host of social, behavioral and health outcomes, such as
job performance, longevity, and many psychiatric disorders, including substance abuse
and dependency, mood disorders such as major depressive disorder (MDD), anxiety
disorders, and personality disorders.2-7 For example, Neuroticism reflects a liability trait
for MDD and other mood and anxiety disorders and also explains part of the comorbidity
among these disorders.3,6,8,9 MDD is also predicted by low Conscientiousness.10,11 With
regard to substance (ab)use, tobacco smokers score high on Neuroticism and low on
Conscientiousness.12,13 A similar but more extreme pattern is seen for cocaine and heroin
peer
-006
0188
0, v
ersi
on 1
- 21
Jun
201
1

8
users; in contrast, marijuana users score high on Openness to Experience and low on
Agreeableness and Conscientiousness.13 The FFM dimensions further predict tendencies
toward different types of personality disorder, with high scores on Neuroticism and low
scores on Agreeableness predicting many of the personality disorders and with low or
high scores on Extraversion predicting different disorders.2,14 Personality is also
predictive of beneficial outcomes. High Conscientiousness predicts better performance in
the workplace10,13,15 and high Extraversion larger participation in regular leisure time
exercise.16,17
Twin, adoption and family studies have convincingly shown that each of the FFM
personality dimensions is heritable, with heritability estimates ranging between 33% and
65%.18-21 Lower-order facets that underlie personality dimensions are genetically
correlated 22, confirming the notion that the higher-order personality dimensions are to a
large extent genetically homogenous. Importantly, genetic influences on personality
partly overlap with the genetic factors that influence psychiatric disorders.3,6,10,20 Thus,
gene finding efforts for the major personality dimensions may yield important insights
into the genetic etiology of psychiatric disease.
Gene-finding studies for personality, including genome-wide linkage and
association studies, have largely focused on Neuroticism, as measured by the Eysenck
Personality Questionnaire or as part of the FFM.23-31 Few studies have also included other
traits such as Extraversion.27,31 The study by Terracciano et al.31 is to date the only
genome-wide association study conducted for all five FFM personality dimensions. This
study was performed in an isolated sample of 3 972 Sardinians, analyzing ~362k single
nucleotide polymorphisms (SNPs). Although none of the observed signals reached
peer
-006
0188
0, v
ersi
on 1
- 21
Jun
201
1

9
genome-wide significance (lowest p-value 9.4*10-7), several of the top signals were
found in genes that are thought to affect behavioral traits and mental disorders through
differential brain functioning (for example SNAP25 for Neuroticism, CDH13 for
Extraversion and CLOCK for Agreeableness).
The aim of the current meta-analytic study was to identify novel genetic variants
associated with the FFM personality dimensions by combining genome-wide association
(GWA) study results from 10 studies, including 17 375 individuals of European ancestry
from Europe, the United States and Australia. In-silico replication of the genome-wide
significant SNPs was sought in five additional samples consisting of 3 294 individuals.
Materials and Methods
Discovery samples
The samples included in the discovery stage of this study are described below. Approval
by local institutional review boards was obtained in all studies and written informed
consent was given.
SardiNIA - Italy
The SardiNIA study includes 6 148 related individuals from four towns in the Ogliastra
province of Sardinia, Italy.21 These individuals represent 62% of the population in these
towns. Valid NEO-PI-R1 personality data were available for 5 669 individuals, of which
3 972 were genotyped (56.7% women). The mean age of all participants was 42.8 years
(SD=17). The mean age of the men was 43.0 years (SD=18), and of the women 42.4
peer
-006
0188
0, v
ersi
on 1
- 21
Jun
201
1

10
years (SD=17). The sample has been described in more detail by Terracciano and co-
authors.31
NTR/NESDA - The Netherlands
The NTR/NESDA study consists of unrelated individuals from Dutch twin families
registered at the Netherlands Twin Register (NTR)32 and participants from the
Netherlands Study of Depression and Anxiety (NESDA).33 Individuals were selected to
be genotyped as part of the Genetic Association Information Network (GAIN)
initiative34, of which 1 836 served as controls (mainly from NTR) and 1 862 as cases
(mainly from NESDA) in a genome-wide association study for major depressive
disorder.35,36 Controls were selected for absence of an MDD diagnosis and/or a low
genetic liability for MDD. In this study, 3 540 individuals (65.6% women) were included
with valid NEO personality and GWA data. The mean age of participants was 44.1 years
(SD=13). Men were slightly older (M=46.6 years; SD=13) than women (M=42.8 years;
SD=13). Personality data from NTR participants were collected in 200437 and from
NESDA participants between 2004-2007.33
ERF – The Netherlands
The Erasmus Rucphen Family (ERF) study is a family-based study including over 3 000
individuals from an isolated population in the South-West region of the Netherlands.38
There were 2 400 individuals for whom both NEO personality and GWA data were
available. The mean age of all participants was 49.3 years (SD=14.9) and women
constituted 55.8% of the total sample (M=47.4; SD=15, versus in men M=48.2, SD=14).
SAGE – United States of America
peer
-006
0188
0, v
ersi
on 1
- 21
Jun
201
1

11
The Study of Addiction: Genetics and Environment (SAGE) is part of the Gene
Environment Association Studies initiative (GENEVA) funded by the National Human
Genome Research Institute. The sample consists of DSM-IV alcohol dependent cases and
non-dependent controls.39 The original SAGE sample included 4 121 unrelated
individuals. Of these, 2 223 subjects had data available from the NEO-FFI. We removed
476 subjects due to non-European ancestry, 8 individuals were removed due to missing
genotypes, and 139 were removed because their genotyping consent did not include the
use of their personality data. This resulted in a final sample size of 1 600. Of these 1 600,
60.1% were women. The mean age of all participants was 39.6 (SD=9), of the men 40.4
(SD=10) and of the women 39.0 (SD=9).
HBCS - Finland
The Helsinki Birth Cohort Study (HBCS) is composed of 8 760 individuals born between
the years 1934-1944 in one of the two main maternity hospitals in Helsinki, Finland.
Between 2001 and 2003, a randomly selected sample of 928 males and 1 075 females
participated in a clinical follow-up study with a focus on cardiovascular, metabolic and
reproductive health, cognitive function and depressive symptoms. In 2004, various
psychological phenotypes were assessed, including the NEO personality dimensions.
There were 1 443 subjects with both valid phenotype and genotype data (59.8% women).
The mean age of the subjects was 63.4 (SD=3). The mean age of the men was 63.3
(SD=3) and of the women was 63.5 (SD=3). Detailed information on the selection of the
HBCS participants and on the study design can be found elsewhere.40-42
NAG/IRPG study - Australia
peer
-006
0188
0, v
ersi
on 1
- 21
Jun
201
1

12
Phenotype data from this study were collected as part of the Nicotine Addiction Genetics
study (NAG), for which families were targeted based on heavy smoking index cases
identified in previous interviews and questionnaires.43,44 Personality items, from the
NEO-FFI, were included in a questionnaire mailed to all participants. Genotype data
came from the Interactive Research Project Grants (IRPG). Valid personality and
genotype data were available for 1 349 individuals aged 21-85 years (M=45.4; SD=13.1).
Of these, 56% were women (M=45.4, SD=13) and 44% men (M=45.3, SD=13).
QIMR study - Australia
Data from Australian adolescents were collected in twin family studies conducted at the
Queensland Institute of Medical Research. Participants were mainly recruited through
primary and secondary schools in Queensland for studies of melanocytic naevi (moles).45
NEO personality data (NEO-PI-R or NEO-FFI) were collected as part of the cognition
study (in-person testing, 1996-ongoing)46, as well as a health and wellbeing study (a
mail/phone study 2002-2003)46, and a study of borderline personality disorder
(online/paper survey 2004-2006).47 For the current study, personality and genotypic data
were available for 1 090 individuals (616 females), of whom 254 were monozygotic twin
pairs (for whom average phenotypic data were analyzed). Participants ranged in age from
16 to 27 (M=19.4; SD=3). The mean ages in men and women were very similar (M=19.2,
SD=3 in men versus M=19.4, SD=3 in women).
LBC1936 – United Kingdom
The Lothian Birth Cohort study consists of a cohort of 1 091 individuals born in 1936
(LBC1936). Most subjects lived independently in the Lothian region (Edinburgh city and
surrounding area) of Scotland. The majority of subjects took part in the Scottish Mental
peer
-006
0188
0, v
ersi
on 1
- 21
Jun
201
1

13
Surveys of 1947, and were assessed again on cognition and medical traits at roughly 70
years of age.48 A fuller description about participant recruitment and testing can be found
elsewhere.48,49 There were 888 subjects (447 female) who successfully filled in the NEO-
FFI and survived the DNA and genotyping quality control procedures. The mean age of
these 888 subjects was 69.6 (SD=1). The mean ages of the men and women were the
same.
BLSA – United States of America
The Baltimore Longitudinal Study of Aging (BLSA) is an ongoing multidisciplinary
study of community-dwelling volunteers. Personality traits were assessed from 1989 to
2008, and multiple assessments were available for most participants. Although
personality traits are generally stable over time50,51, to provide more robust estimates, we
used the average across all available assessments. For the current study, we examined
data from 848 subjects of European descent that were successfully genotyped and
completed the NEO-PI-R questionnaire at least once. In this sample, mean age was 68.5
(SD = 17) with 46% of women. The mean age of the men was 60.8 years (SD=16), and of
the women 55.9 years (SD=17).
EGPUT - Estonia
The Estonian cohort comes from the population-based biobank of the Estonian Genome
Project of University of Tartu (EGPUT). The project is conducted according to the
Estonian Gene Research Act and all participants have signed the broad informed consent
(www.geenivaramu.ee).52 In total 38 000 individuals aged 18 years or older participated
in this cohort (33% male, 67% female). The population distributions of the cohort reflect
those of the Estonian population (83% Estonians, 14% Russians, 3% other). Subjects
peer
-006
0188
0, v
ersi
on 1
- 21
Jun
201
1

14
were randomly recruited by the general practitioners (GP) and physicians in the
hospitals.53 A Computer Assisted Personal interview (CAPI) was conducted during 1-2
hours at doctors’ offices. Data on demographics, genealogy, educational and occupational
history, lifestyle and anthropometric and physiological data were assessed. For the
current study, GWA was performed on 600 randomly selected subjects with both
Illumina HumanCNV370 genotype (array according to Illumina protocol
(www.illumina.com) in Estonian Biocenter Genotyping Core Facility) and the NEO-PI-3
questionnaire data available54. In this sample the age range was 18-87 (mean 45.7 (SD
16) years). The sample consisted of 250 males (mean age 45.5 (SD=16) years) and 350
females (mean age 45.7 (SD=16) years).
Replication samples
The samples for in-silico replication are described below. In total, the sample size was 3
294 subjects.
NTR+ - The Netherlands
Within the Netherlands Twin Register, several genotyping projects (additional to the first
genome-wide genotyping study that was part of the GAIN-MDD study) have been
undertaken whose data were combined in the current study to form the replication set. All
individuals came from the NTR-Biobank study55. In total, 1 920 individuals with valid
NEO-FFI and GWA data were available for replication. The mean age of participants was
46.9 years (SD=15) and 67% was female. This sample included 127 MZ twin pairs (254
twins) with phenotype data in both twins. Those twin pairs were treated as one case in the
analysis by averaging their phenotypic scores, resulting in a sample with 1 793 subjects
peer
-006
0188
0, v
ersi
on 1
- 21
Jun
201
1

15
for analysis. For 1 475 subjects, GWA data were available on one SNP chip; for 318
subjects, GWA data were assessed on two chips. For the majority of the 1 475 subjects
genotyped on one chip (N=1 286; 87%), genotyping was part of the NTR2 genotyping
study using the Illumina Human660W-Quad chip. These subjects were unrelated and
unselected for any phenotype. The remaining subjects were genotyped as part of the
GenomEUtwin study (N=137 subjects; Illumina 370k chip), an Attention Deficit
Hyperactivity Disorder study (N=34 subjects; Affymetrix 6.0) and the MDD2000 study
(N=18 MDD cases; Illumina 907K chip). Quality control of genotype data and
subsequent imputation using IMPUTE software was conducted on separate sets, and on
the full set of all genotyped individuals within the NTR. For the purposes of this
replication study, after imputation we selected the SNPs from the discovery set that
showed genome-wide significance, checked their quality and subsequently analyzed the
SNPs.
GERMANY
In this German cohort, 2 420 healthy control participants were randomly selected from
the general population of Munich, Germany, and contacted by mail. We included 476
individuals (56% females) with GWA data (Illumina HumanHap300 chip) in this study.
Several screenings were conducted before the volunteers were enrolled in the study. First,
subjects who responded were initially screened by phone for the absence of
neuropsychiatric disorders. Second, detailed medical and psychiatric histories were
assessed for the participants and their first-degree relatives by using a semi-structured
interview56. Third, if no exclusion criteria were fulfilled, they were invited to a
comprehensive interview including the SCID to validate the absence of any lifetime
peer
-006
0188
0, v
ersi
on 1
- 21
Jun
201
1

16
psychotic disorder57. Additionally, the Family History Assessment Module was
conducted to exclude psychotic disorders among their first-degree relatives. A
neurological examination was also conducted to exclude subjects with current central
nervous system impairment. If participants were older than 60 years, the Mini Mental
Status Test was performed to exclude subjects with possible cognitive impairment58.
Only participants with German descent (all 4 grandparents German) were included.
Furthermore, a large battery of personality questionnaires e.g. on aggression, impulsivity
or neuroticism (NEO-PI-R) was obtained as well as data on life events and traumatic
events. The mean age of the sample was 46 years (SD=15).
EGPUT2 - Estonia
In the Estonian cohort, additional data of 380 individuals with valid NEO-FFI and GWA
data have become available for replication. For a more detailed description of this cohort,
see the description above for EGPUT. The mean age of participants was 38.9 years
(SD=15). Almost half of the sample (49.5%) was female.
Cilento– Italy
The Cilento study is a population-based study that includes 2 137 individuals from three
isolated populations of South Italy. Of these individuals, 859 were genotyped on the
370K SNP map from Illumina. Imputation of 2.5M HapMap SNPs was obtained using
MACH software. Genome-wide significant SNPs were selected, checked and analyzed.
Data available from the NEO-PI-R questionnaire were available for 343 genotyped
subjects representing the final sample. Of this sample, 65.6% were women. The mean
age of all participants was 58.9 (SD=19), of the men 59.5 (SD=18.8) and of the women
58.7 (SD= 19).
peer
-006
0188
0, v
ersi
on 1
- 21
Jun
201
1

17
ERF2- The Netherlands
The ERF2 sample consisted of 302 additionally genotyped individuals with NEO
personality data within the family-based ERF study (see the description above for more
information on this study). The mean age of these individuals was 50.1 years (SD=14).
Women constituted 50.3% of the sample.
Personality assessment
Personality scores for the five factors Neuroticism, Extraversion, Openness to
Experience, Agreeableness, and Conscientiousness were based on the 60 items of the
NEO Five-Factor Inventory (NEO-FFI) (12 items per factor).1 Items were answered on a
5-point Likert-type scale ranging from strongly disagree (0) to strongly agree (4). In the
SardiNIA, BSLA, Germany and Cilento studies, these items were taken from the 240-
item NEO-PI-R 1. In the QIMR study, the 60 items were taken from the 240-item NEO-
PI-R for part of the sample; the remaining subjects filled in the 60-item NEO-FFI.1 In the
NTR, NESDA, ERF, SAGE, HBCS, NAG/IRPG and LBC1936 studies, personality was
assessed using the 60-item NEO-FFI. In the Estonian study samples, the 60 NEO-FFI
items 59 were taken from the NEO-PI-3.54,60
In each study, summed scores were computed for all five personality dimensions
(after reversing negatively keyed items). If more than three items were missing per
dimension, the summed score for that dimension was not computed. If three or less items
were missing, missing data were imputed by taking the individual’s average score for the
valid items of that dimension. The mean scores of the five personality dimensions in each
study are provided in Table 1.
peer
-006
0188
0, v
ersi
on 1
- 21
Jun
201
1
18
<PLEASE INSERT TABLE 1 ABOUT HERE>
Genotyping and imputation
DNA was extracted from blood samples in all participating studies. A detailed overview
of SNP genotyping, including the platforms used and subsequent quality control, is given
in Table 2. The studies used Illumina platforms, except for SardiNIA and NTR/NESDA,
which used Affymetrix and Perlegen platforms, respectively. Genotype data were
checked in each study independently, using slightly different inclusion criteria. Among
the basic checks that were performed were checks for European ancestry, Mendelian
errors, gender inconsistencies and high genome-wide homozygosity. Checks for
relatedness were carried out in those samples that aimed to use unrelated individuals.
Genotype data were further checked based on Hardy-Weinberg Equilibrium (HWE),
minor allele frequencies (MAF), SNP call rate (% of subjects with missing genotypes per
SNP) and sample call rate (% of missing SNPs per subject).
<PLEASE INSERT TABLE 2 ABOUT HERE>
In order to compare results at the SNP level, we imputed ~2.5M common SNPs
included in HapMap, using the HapMap phase II CEU data as the reference sample. Most
studies used NCBI build 36 (UCSC hg18), although in the NTR/NESDA study build 35
(UCSC hg17) was used. Imputation was carried out using IMPUTE for the
NTR/NESDA, SAGE and EGP samples (consisting of unrelated individuals).61 For all
other samples, genotype data were imputed using MACH software. For those studies that
contained related individuals, a maximum likelihood approach was used that takes
peer
-006
0188
0, v
ersi
on 1
- 21
Jun
201
1

19
advantage of the relatedness among individuals.62 Throughout this paper, the location of
SNPs reported is taken from the build 36 (release 22) HapMap data.
Statistical analyses
GWA analysis in each discovery sample
Genome-wide association analyses were conducted in each study independently using
linear regression (under an additive model) and including sex and age as covariates. For
those studies that used IMPUTE software to impute missing genotype data, association
analyses were conducted in SNPtest, taking the uncertainty of the imputed genotypes into
account.61 For the studies that used MACH to impute their data, either MACH QTL or
Merlin was used for association analyses. For the three studies with related individuals
(SardiNIA, ERF and QIMR), association analyses were performed in Merlin using a
variance components approach, which takes into account the relatedness among
individuals in these samples.62
Meta-analysis of GWA results across discovery samples
A meta-analysis of the results was conducted using the weighted inverse variance method
in METAL (http://www.sph.umich.edu/csg/abecasis/metal/index.html)63, which
computes a pooled effect estimate (ln(beta)), its standard error and its p-value by
weighing the effect estimates of the individual samples by the inverse of it’s variance and
by taking into account the direction of effect. Poorly imputed SNPs (r-squared or
proper_info < 0.30) and SNPs with low minor allele frequency (MAF<0.01) were
excluded, resulting in a final dataset of ~2.4M SNPs. We corrected for any population
peer
-006
0188
0, v
ersi
on 1
- 21
Jun
201
1

20
stratification effects by applying genomic control in each sample prior to meta-analysis.
The genomic control inflation factors (λ) for the five personality dimensions for all
participating studies ranged between 0.99 and 1.12 (Supplementary Table 1). After
applying a genomic control correction to the results from the individual studies, the λ’s
for the meta-analyzed results were 1.02, 1.01, 1.03, 1.00 and 1.02, respectively, for
Neuroticism, Extraversion, Openness to Experience, Agreeableness and
Conscientiousness. The corresponding Quantile-Quantile plots are provided in
Supplementary Figure 1. To consider a SNP result genome-wide significant, we used
the threshold of P < 5 x 10⁻⁸ per trait as proposed for populations of European descent.64
Gene-based tests
In addition to the meta-analytic association testing per SNP, we also evaluated the
significance of all genes across the genome. We followed the procedure proposed by Liu
et al. and incorporated in the program VEGAS65, which is suitable for meta-analysis
results because it does not require raw genotype data but instead uses the p-values of
SNPs as input. Gene-based p-values were obtained by using a maximum of 107
simulations to correctly account for the linkage disequilibrium (LD) structure among
SNPs within a gene. We included SNPs located up to 20kb down- or upstream of a gene.
A gene was considered genome-wide significant if a P < 2.5 x 10⁻⁶ (0.05 / 20 000) was
obtained.
Replication analyses
peer
-006
0188
0, v
ersi
on 1
- 21
Jun
201
1

21
Replication of the SNPs that turned out genome-wide significant was performed in five
independent samples. In each sample, an additive test was conducted, with sex and age as
covariates. SNPs in each sample were checked for minor allele frequency, Hardy-
Weinberg equilibrium and if imputed, for imputation quality. The evidence for
replication was summarized across samples by conducting a weighted inverse variance
meta-analysis. A P < 0.05 was taken as significant evidence of replication.
Results
Two SNPs for Openness to Experience on chromosome 5q14.3 and one SNP for
Conscientiousness on chromosome 18q21.1 passed the genome-wide significance level of
P < 5 x 10⁻⁸ in the discovery stage (Table 3). The genome-wide meta-analyzed
association results for the five personality dimensions are given in Supplementary
Figure 2. Top SNPs for Neuroticism, Extraversion and Agreeableness (Supplementary
Tables 2 to 6) did not reach genome-wide significance (lowest P value > 10-8).
<PLEASE INSERT TABLE 3 ABOUT HERE>
The two genome-wide significant SNPs for Openness to Experience (rs1477268,
rs2032794, r-squared among SNPs ranges between 0.92 and 1 across studies) are located
on chromosome 5q14.3 in an intergenic region 135kb downstream from the RASA1 gene
(lowest P = 2.8 x 10⁻⁸, with an explained variance of 0.22%) (Figure 1a). The gene-based
P value for RASA1 was 0.02. RASA1 codes for a GTPase activating protein involved in
intracellular signaling and cellular proliferation and differentiation. The gene is highly
expressed in the bone marrow and bone, and modestly in the brain.66 Further, Figure 2a
shows that the effect for rs1477268 is in the same direction for nine of the ten studies.
peer
-006
0188
0, v
ersi
on 1
- 21
Jun
201
1

22
Heterogeneity in results across studies was not significant (χ2 = 9.15, df = 9, P = 0.42).
The SNP was genotyped in seven of the studies and imputed with high quality in the
SardiNIA, NTRNESDA and ERF studies (r-squared or proper_info > 0.97). The MAFs
were very similar across studies and ranged between 0.15 and 0.24. Furthermore,
genotype and allele proportions of rs1477268 are in HWE in all studies (P > 0.01). The
association of these two SNPs with Openness to Experience could not, however, be
replicated (combined P across the replication samples 0.53 and 0.55 respectively for
rs1477268 and rs2032794, combined P across discovery and replication samples 1.84 x
10-6 and 1.70 x 10⁻⁶).
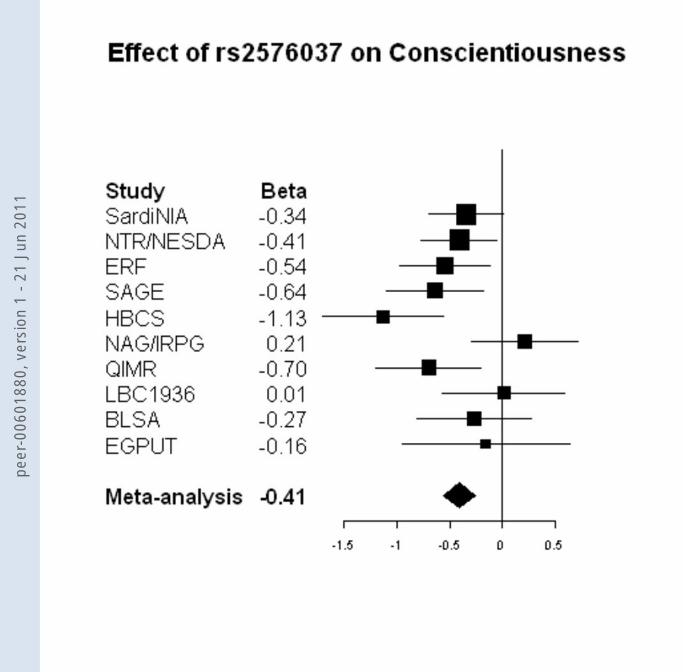
The genome-wide significant SNP for Conscientiousness (rs2576037) is located
in an intron of the KATNAL2 gene on chromosome 18q21.1 (P = 4.9 x 10⁻⁸, explained
variance 0.21%.). The second-most significant SNP for Conscientiousness (rs7233515) is
a non-synonymous SNP in the same gene (lowest P = 7.9 x 10⁻⁸, the r-squared with
rs2576037 ranges between 0.92 and 1 across studies, Figure 1b). Variation in this SNP
leads to a N88S amino acid change, suggesting a biologically relevant variation. In eight
studies the direction of the effect for rs2576037 was the same (Figure 2b). In spite of
this, there was nominal significant heterogeneity in the regression coefficients across
studies (χ2 = 17.98, df = 9, P = 0.04). To test which study caused the observed
heterogeneity, we reran the meta-analysis multiple times, by each time excluding one of
the individual studies. Two studies seemed to account for the heterogeneity. Excluding
the Finnish HBCS study (with the largest effect), heterogeneity was no longer significant
(χ2 = 11.30, df = 8, P = 0.19) and the pooled p-value became 4.3 x 10⁻⁶. When excluding
the NAG/IRPG study (a small opposite effect), heterogeneity was also no longer
peer
-006
0188
0, v
ersi
on 1
- 21
Jun
201
1

23
observed (χ2 = 11.20, df = 8, P = 0.19) and the pooled p-value became 2.2 x 10⁻⁹. The
SNP was genotyped in seven of the studies and imputed with high quality in the
SardiNIA, NTRNESDA and ERF studies (r-squared or proper_info > 0.98). The MAFs
were very similar across studies and ranged between 0.37 and 0.46 and distributions were
in HWE in all studies (P > 0.01).
KATNAL2 encodes a protein similar to the A subunit of the p60 katanin protein
and is widely expressed in the central nervous system.66 Katanin p60 acts to sever
microtubules in the axons of neurons and is thought to play a role in neuronal migration,
axonal growth and dendritic pruning.67-69 Thus, the KATNAL2 gene may play a role in
neurodevelopment. Several other SNPs located in the nearby PIAS2, HDHD2 and
IER3IP1 genes that are in relatively high LD (r-squared > 0.5) with the top SNP showed
suggestive evidence for association (P < 1 x 10⁻⁵) (Figure 1b and Supplementary Table
6). The PIAS2 gene is involved in the regulation of transcription factors involved in the
mitogen-activated protein kinase signaling pathway. Less is known about the biological
function of the HDHD2 and IER3IP1 genes, but all three genes are moderately expressed
in the brain.66
KATNAL2 was significant in gene-based tests as well (Table 3 and
Supplementary Table 7). The cluster of small TCEB3 genes, located within the
KATNAL2 gene (Figure 1b), was also significant, but the other genes in the region were
not genome-wide significant. This suggests that the causal variant may be located in or
very near the KATNAL2 gene rather than in any of the surrounding genes. The association
of rs2576037 was again not significant in the replication stage (combined P across
replication samples = 0.36), although the direction of effect was consistent with the effect
peer
-006
0188
0, v
ersi
on 1
- 21
Jun
201
1

24
found in the discovery stage (Supplementary Table 8). The combined P value across all
discovery and replication samples for rs2576037 was 1.02 x 10⁻⁷.
We also investigated the significance of SNPs that have previously been reported
in the first GWA study for the FFM personality traits (Supplementary Table 9) and in
the two GWA studies for Neuroticism (Supplementary Table 10).23,24,30 None of the
SNPs reported in these studies were significant (p>0.001).
Discussion
This study suggests evidence for two new loci associated with two dimensions of
personality: an intergenic region 135kb downstream from RASA1 on 5q14.3 for Openness
to Experience and the KATNAL2 gene region on 18q21.1 for Conscientiousness.
However, these loci were not unequivocally replicated. The KATNAL2 gene was also
significant in the gene-based test. However, in the replication samples the effect did not
reach a level of significance, although there was a consistency of direction of effects
Thus, KATNAL2 might present a novel gene for personality. It should be noted however
that even if the signal represents a true finding, the effect size is small. No genome-wide
significant results were found for Neuroticism, Extraversion and Agreeableness.
Power analyses showed that the genome-wide significant variants could not have
been detected in any of the individual studies at the genome-wide significant level (power
to detect these effects at α=5 x 10⁻⁸ in sample sizes smaller than 4 000 is less than 1%),
but the power to detect these effects in the current meta-analytic study with a sample size
of 17 375 is 77% for the top SNP for Openness to Experience and 72% for the top SNP
of Conscientiousness. Additional power analyses showed that with a power of 80%, the
peer
-006
0188
0, v
ersi
on 1
- 21
Jun
201
1

25
meta-analysis could detect much smaller effect sizes than any of the individual studies
(0.23% explained variance versus 1% to 6.5% explained variance for sample size of
individual studies between 600 and 3 972; explained variances correspond to
standardized betas of 0.05 versus 0.1 to 0.25).
The findings of the current study show that large-scale collaborative studies with
combined sample sizes on the order of thousands or ten thousands still have difficulties in
identifying common genetic variants that influence complex phenotypes such as
personality traits. It could be that the effects of many SNPs are even smaller than the
0.2% that we were able to detect in this study at a genome-wide significance level. Larger
GWA studies may reveal these variants, as has been already successfully demonstrated
for human height in a large meta-analytic GWA study of over 180 000 individuals, in
which at least 180 loci were identified together explaining about 10% of the variation in
height.70 In addition, a recent paper using a novel technique to estimate the genetic
variance explained by all SNPs, without focusing on genome-wide significance of
individual SNPs, showed that common SNP variation explained about half of the
heritability of human height.71 These papers are consistent with the notion that common
SNP variation is important in explaining complex highly polygenic traits. It also suggests
that the meta-analytic GWA study that we present here was only able to detect the top
few SNPs with the largest effect sizes related to personality.
Many other explanations to explain the heritability of complex traits have been
put forward.72 One of these is that other variants that are currently not captured with the
genome-wide SNP platforms (including copy number and rare variants) play a role in
explaining variation in personality. Next-generation sequencing may reveal more genetic
peer
-006
0188
0, v
ersi
on 1
- 21
Jun
201
1

26
variants that account for the heritability of complex traits including personality.
Nevertheless, identification of genetic variants, even if effect sizes are small, remains an
important goal, because these variants can be critical entry points to increased
understanding of the biological processes underlying personality as well as psychiatric
disorders and other personality-related health, social and behavioral outcomes.
Note: Supplementary information is available at Molecular Psychiatry's website
peer
-006
0188
0, v
ersi
on 1
- 21
Jun
201
1

27
Acknowledgements
We would like to thank the individuals that participated in the studies. Meta-analysis and
statistical analyses for the NAG/IPRG, QIMR and NTR/NESDA studies were carried out
on the Genetic Cluster Computer (http://www.geneticcluster.org) which is financially
supported by the Netherlands Organization for Scientific Research (NWO 480-05-003).
SardiNIA: We acknowledge support from the Intramural Research Program of the NIH,
National Institute on Aging. Funding was provided by the National Institute on Aging,
NIH contract NO1-AG-1-2109 to the SardiNIA (“ProgeNIA”) team.
NTR/NESDA: We acknowledge financial support from the Netherlands Organization for
Scientific Research (NWO): grants 575-25-006, 480-04-004, 904-61-090; 904-61-193,
400-05-717 and Spinozapremie SPI 56-464-14192. M.H.M.deM. is financially supported
by ZonMW (Addiction) Grant number 311-60008. We further acknowledge financial
support from the Center for Medical Systems Biology (NWO Genomics), the Centre for
Neurogenomics and Cognitive Research (CNCR-VU); EU/QLRT-2001-01254; NIMH
R01 MH059160; Geestkracht program of ZonMW (10-000-1002); matching funds from
universities and mental health care institutes involved in NESDA. Genotyping was
funded by the Genetic Association Information Network (GAIN) of the Foundation for
the US National Institutes of Health, and analysis was supported by grants from GAIN
and the NIMH (MH081802). Genotype data were obtained from dbGaP
(http://www.ncbi.nlm.nih.gov/dbgap, accession number phs000020.v1.p1).
ERF: The genotyping for the ERF study was supported by EUROSPAN (European
Special Populations Research Network) and the European Commission FP6 STRP grant
(018947; LSHG-CT-2006-01947). The ERF study was further supported by grants from
peer
-006
0188
0, v
ersi
on 1
- 21
Jun
201
1

28
the Netherlands Organisation for Scientific Research, Erasmus MC, the Centre for
Medical Systems Biology (CMSB) and the Netherlands Brain Foundation
(HersenStichting Nederland). We are grateful to all patients and their relatives, general
practitioners and neurologists for their contributions and to P. Veraart for her help in
genealogy, Jeannette Vergeer for the supervision of the laboratory work and P. Snijders
for his help in data collection.
SAGE: Funding support for the Study of Addiction: Genetics and Environment (SAGE)
was provided through the NIH Genes, Environment and Health Initiative [GEI] (U01
HG004422). SAGE is one of the genome-wide association studies funded as part of the
Gene Environment Association Studies (GENEVA) under GEI. Assistance with
phenotype harmonization and genotype cleaning, as well as with general study
coordination, was provided by the GENEVA Coordinating Center (U01 HG004446).
Assistance with data cleaning was provided by the National Center for Biotechnology
Information. Support for collection of datasets and samples was provided by the
Collaborative Study on the Genetics of Alcoholism (COGA; U10 AA008401), the
Collaborative Genetic Study of Nicotine Dependence (COGEND; P01 CA089392), and
the Family Study of Cocaine Dependence (FSCD; R01 DA013423). Funding support for
genotyping, which was performed at the Johns Hopkins University Center for Inherited
Disease Research, was provided by the NIH GEI (U01HG004438), the National Institute
on Alcohol Abuse and Alcoholism, the National Institute on Drug Abuse, and the NIH
contract "High throughput genotyping for studying the genetic contributions to human
disease" (HHSN268200782096C).
peer
-006
0188
0, v
ersi
on 1
- 21
Jun
201
1

29
The Collaborative Study on the Genetics of Alcoholism (COGA), Principal
Investigators B. Porjesz, V. Hesselbrock, H. Edenberg, L. Bierut, includes ten different
centers: University of Connecticut (V. Hesselbrock); Indiana University (H.J. Edenberg,
J. Nurnberger Jr., T. Foroud); University of Iowa (S. Kuperman, J. Kramer); SUNY
Downstate (B. Porjesz); Washington University in St. Louis (L. Bierut, A. Goate, J. Rice,
K. Bucholz); University of California at San Diego (M. Schuckit); Rutgers University (J.
Tischfield); Southwest Foundation (L. Almasy), Howard University (R. Taylor) and
Virginia Commonwealth University (D. Dick). A. Parsian and M. Reilly are the NIAAA
Staff Collaborators. We continue to be inspired by our memories of Henri Begleiter and
Theodore Reich, founding PI and Co-PI of COGA, and also owe a debt of gratitude to
other past organizers of COGA, including Ting-Kai Li, P. Michael Conneally, Raymond
Crowe, and Wendy Reich, for their critical contributions. This national collaborative
study is supported by NIH Grant U10AA008401 from the National Institute on Alcohol
Abuse and Alcoholism (NIAAA) and the National Institute on Drug Abuse (NIDA).
The Collaborative Genetic Study of Nicotine Dependence (COGEND) project is a
collaborative research group and part of the NIDA Genetics Consortium. Subject
collection was supported by NIH grant CA89392 (PI - L Bierut) from the National
Cancer Institute. Genotyping work at Perlegen Sciences was performed under NIDA
Contract HHSN271200477471C. Phenotypic and genotypic data are stored in the NIDA
Center for Genetic Studies (NCGS) at http://zork.wustl.edu/ under NIDA Contract
HHSN271200477451C (PIs J Tischfield and J Rice). Genotyping services were also
provided by the Center for Inherited Disease Research (CIDR). CIDR is fully funded
through a federal contract from the National Institutes of Health to The Johns Hopkins
peer
-006
0188
0, v
ersi
on 1
- 21
Jun
201
1

30
University, contract number HHSN268200782096. In memory of Theodore Reich,
founding Principal Investigator of COGEND, we are indebted to his leadership in the
establishment and nurturing of COGEND and acknowledge with great admiration his
seminal scientific contributions to the field. Lead investigators directing data collection
are Laura Bierut, Naomi Breslau, Dorothy Hatsukami, and Eric Johnson. The authors
thank Heidi Kromrei and Tracey Richmond for their assistance in data collection.
HBCS: We acknowledge financial support from the Academy of Finland (grant n.o.
120315 and 129287 to EW, 1129457 and 1216965 to KR, 120386 and 125876 to JGE),
the European Science Foundation (EuroSTRESS), the Wellcome Trust (grant n.o.
89061/Z/09/Z and 089062/Z/09/Z ) and the Signe and Ane Gyllenberg foundation.
NAG/IRPG: This study is supported by NIH grants DA12854 (to P.A.F.M.), AA07728,
AA07580, AA11998, AA13320, and AA13321 (to A.C.H.); and grants from the
Australian National Health and Medical Research Council; M.L.P. is supported by
DA019951.
QIMR: We thank Marlene Grace and Ann Eldridge for sample collection; Anjali
Henders, Megan Campbell, Lisa Bowdler, Steven Crooks and staff of the Molecular
Epidemiology Laboratory for sample processing and preparation; Harry Beeby, David
Smyth and Daniel Park for IT support. We acknowledge support from the Australian
Research Council (A7960034, A79906588, A79801419, DP0212016, DP0343921),
Beyond Blue, and the Borderline Personality Disorder Research Foundation. Genotyping
was funded by the National Health and Medical Research Council (Medical
Bioinformatics Genomics Proteomics Program, 389891). Further, we gratefully
acknowledge Drs Dale R Nyholt and especially Scott Gordon for their substantial
peer
-006
0188
0, v
ersi
on 1
- 21
Jun
201
1

31
efforts involving the QC and preparation of the QIMR and NAG/IRPG GWA datasets.
Dr Nyholt also contributed 8% of the NAG/IRPG GWA cohort (NHMRC IDs 339462,
442981, 389938, 496739).
LBC1936: We thank: David Liewald and Paul Redmond for technical assistance; the
study Secretary Paula Davies; Alan Gow, Michelle Taylor, Janie Corley, Caroline Brett
and Caroline Cameron for data collection and data entry; nurses and staff at the
Wellcome Trust Clinical Research Facility, where subjects were tested and at the
genotyping was performed; staff at the Lothian Health Board, and the staff at the SCRE
Centre, University of Glasgow. The research was supported by a programme grant from
Research Into Ageing. The research continues with programme grants from Help the
Aged/Age Concern (The Disconnected Mind). GWA funding awarded by the
Biotechnology and Biological Sciences Research Council (BBSRC) to I.J.D. and A.T.
M.L. is a Royal Society of Edinburgh/Lloyds TSB Foundation for Scotland Personal
Research Fellow.
The study was conducted within the University of Edinburgh Centre for Cognitive
Ageing and Cognitive Epidemiology, supported by the (BBSRC), Engineering and
Physical Sciences Research Council (EPSRC), Economic and Social Research Council
(ESRC), and Medical Research Council (MRC), as part of the cross-council Lifelong
Health and Wellbeing Initiative. This work has made use of the resources provided by the
Edinburgh Compute and Data Facility (ECDF). (http://www.ecdf.ed.ac.uk/). The ECDF
is partially supported by the eDIKT initiative (http://www.edikt.org.uk).
BLSA: We acknowledge support from the Intramural Research Program of the NIH,
National Institute on Aging. We thank Robert McCrae.
peer
-006
0188
0, v
ersi
on 1
- 21
Jun
201
1

32
EGPUT: AM and TE received support from FP7 grants (201413 ENGAGE, 212111
BBMRI, ECOGENE (#205419, EBC)) and OpenGENE. AM and TE also received
targeted financing from Estonian Government SF0180142s08 and by EU via the
European Regional Development Fund, in the frame of Centre of Excellence in
Genomics. The genotyping of the Estonian Genome Project samples were performed in
Estonian Biocentre Genotyping Core Facility, AM and TE thank Mari Nelis and Viljo
Soo for their contributions. AR and JA were supported by a grant from the Estonian
Ministry of Science and Education (SF0180029s08).
peer
-006
0188
0, v
ersi
on 1
- 21
Jun
201
1

33
Conflict of interest: Paul T. Costa, Jr., receives royalties from the NEO Five-Factor
Inventory. Laura J. Bierut is an inventor on the patent "Markers for Addiction" (US
20070258898) covering the use of certain SNPs in determining the diagnosis, prognosis,
and treatment of addiction. Dr. Bierut served as a consultant for Pfizer Inc. in 2008. The
other authors declare that they have no potential conflict of interest.
peer
-006
0188
0, v
ersi
on 1
- 21
Jun
201
1

Table 1. Mean scores of the five personality dimensions in the 10 studies participating in
the GWASNEO Consortium, stratified across sex
Total
sample
Men Women
Neuroticism Mean SD Mean SD Mean SD
1. SardiNIA 22.6 7.3 20.2 6.5 24.4 7.3
2. NTR/NESDA 21.3 9.6 19.6 9.7 22.2 9.4
3. ERF 19.2 7.9 17.6 7.6 20.5 7.9
4. SAGE 18.9 8.6 18.5 8.8 19.2 8.5
5. HBCS 16.9 9.4 14.5 8.7 18.6 9.5
6. NAG/IRPG 20.0 8.2 18.9 7.8 20.8 8.3
7. QIMR 26.5 6.6 27.0 6.5 26.3 6.7
8. LBC1936 17.1 7.7 15.7 7.5 18.5 7.6
9. BLSA 16.0 6.2 15.3 5.8 16.9 6.6
10. EGPUT 21.9 7.8 20.4 7.4 23.0 8.0
Extraversion Mean SD Mean SD Mean SD
1. SardiNIA 27.9 5.2 27.9 4.8 28.0 5.5
2. NTR/NESDA 26.6 7.4 26.1 7.5 26.8 7.4
3. ERF 28.0 6.5 28.3 6.6 27.7 6.5
4. SAGE 29.3 6.7 28.1 6.6 30.1 6.6
5. HBCS 26.2 7.7 25.9 7.7 26.4 7.6
peer
-006
0188
0, v
ersi
on 1
- 21
Jun
201
1

35
6. NAG/IRPG 27.7 6.2 27.6 6.1 27.7 6.2
7. QIMR 28.3 5.9 27.4 5.7 29.1 5.8
8. LBC1936 27.0 5.9 26.5 6.1 27.4 5.7
9. BLSA 27.6 5.5 27.2 5.4 28.2 5.6
10. EGPUT 26.2 8.2 25.4 7.8 26.7 8.4
Openness to Experience Mean SD Mean SD Mean SD
1. SardiNIA 26.9 5.6 26.0 5.4 27.6 5.7
2. NTR/NESDA 24.9 5.6 24.7 5.8 25.0 5.5
3. ERF 21.4 5.6 21.2 5.4 21.6 5.8
4. SAGE 27.1 6.1 27.3 6.4 27.0 5.9
5. HBCS 27.5 7.4 26.1 7.5 28.4 7.2
6. NAG/IRPG 26.0 6.2 24.9 6.2 26.9 6.0
7. QIMR 22.5 5.8 21.6 5.9 23.2 5.7
8. LBC1936 26.0 5.8 25.2 5.7 26.8 5.8
9. BLSA 28.4 5.7 27.3 5.6 29.6 5.7
10. EGPUT 22.7 6.7 20.9 6.1 24.0 6.8
Agreeableness Mean SD Mean SD Mean SD
1. SardiNIA 30.7 4.8 29.4 4.6 31.7 4.7
2. NTR/NESDA 32.3 5.2 30.7 5.2 33.2 4.9
3. ERF 31.7 5.6 30.1 5.3 33.1 5.4
4. SAGE 33.2 6.2 30.2 6.3 35.2 5.2
peer
-006
0188
0, v
ersi
on 1
- 21
Jun
201
1

36
5. HBCS 33.0 6.3 31.4 6.3 34.1 6.1
6. NAG/IRPG 32.1 5.5 30.0 5.4 33.7 5.1
7. QIMR 28.3 5.1 27.8 4.7 28.8 5.4
8. LBC1936 33.4 5.3 31.8 5.2 35.0 4.9
9. BLSA 32.4 4.3 31.2 4.0 33.8 4.2
10. EGPUT 27.9 5.5 26.5 5.5 28.9 5.3
Conscientiousness Mean SD Mean SD Mean SD
1. SardiNIA 32.5 5.7 32.6 5.6 32.5 5.8
2. NTR/NESDA 29.3 6.8 29.6 6.9 29.2 6.8
3. ERF 34.5 5.8 34.7 5.7 34.3 5.8
4. SAGE 33.5 6.4 32.3 6.3 34.3 6.4
5. HBCS 34.4 7.6 34.4 7.6 34.5 7.5
6. NAG/IRPG 33.3 6.1 32.3 5.2 34.1 6.0
7. QIMR 29.2 5.6 28.7 5.1 29.6 5.9
8. LBC1936 34.7 6.0 34.4 6.1 34.9 5.9
9. BLSA 32.2 5.6 31.8 5.4 32.7 5.9
10. EGPUT 33.9 6.5 33.2 6.4 34.4 6.5
SD = Standard Deviation
peer
-006
0188
0, v
ersi
on 1
- 21
Jun
201
1

Table 2. Genotyping information in the 10 studies participating in the GWASNEO Consortium
Study sample Genotyping platform Quality control of genotyped SNPs prior to imputation
HWE p-
value
SNP call
rate
Sample call
rate
MAF
1. SardiNIA Affymetrix 10K (N=3 329) and 500K (N=1,412)
(overlap N=436)
1x10⁻⁶ 0.90 0.95 0.05
2. NTR/NESDA Perlegen 600K - 0.95 0.75 0.01
3. ERF Illumina 6k, 317k and 370k, Affymetrix 250k Chip
specific
Chip
specific
Chip specific Chip
specific
4. SAGE Illumina 1M 1x10⁻⁴ 0.95 0.98 0.005
5. HBCS Illumina 610K 1x10⁻⁶ 0.95 - 0.01
6. NAG/IRPG 274,604 common SNPs from Illumina 610K/ 370K/
317K
1x10⁻⁶ 0.95 0.95 0.01
7. QIMR Illumina 610K 1x10⁻⁵ 0.90 0.90 0.01
peer
-006
0188
0, v
ersi
on 1
- 21
Jun
201
1

38
8. LBC1936 Illumina 610K 1x10⁻³ 0.98 0.95 0.01
9. BLSA Illumina 550K 1x10⁻⁴ 0.99 0.97 0.01
10. EGPUT Illumina 370K 1x10⁻⁶ 0.98 0.95 0.01
- = no threshold applied
peer
-006
0188
0, v
ersi
on 1
- 21
Jun
201
1

39
Table 3. Genome-wide significant associations with Openness to Experience and Conscientiousness in the discovery samples of the
GWASNEO Consortium for the Five-Factor Model of personality, and associations in the replication samples
Pooled results
in discovery samples
Pooled results
in replication samples
Pooled results
in all samples
SNP Chr Closest gene Location Allelesa Effect s.e. P value Effect s.e. P value P value
Openness to Experience
rs1477268 5q14.3 RASA1 Intergenic CT 0.48 0.09 2.8 x 10-08 -0.12 0.19 0.53 1.84 x 10⁻⁶
rs2032794 5q14.3 RASA1 Intergenic CT 0.48 0.09 3.1 x 10-08 -0.11 0.19 0.55 1.70 x 10⁻⁶
Conscientiousness
rs2576037 18q21.1 KATNAL2 Intron TC -0.41 0.07 4.9 x 10-08 -0.13 0.14 0.36
1.02 x 10⁻⁷
SNP=Single Nucleotide Polymorphism, Chr=Chromosome, Effect = unstandardized regression coefficient, s.e.= standard error,
MAF=Minor Allele Frequency, HWE=Hardy-Weinberg equilibrium
a First allele is the minor allele, for which the effect is reported.
peer
-006
0188
0, v
ersi
on 1
- 21
Jun
201
1

40
Figure 1. Regional association plots of the two SNPs genome-wide significant in the discovery set for Openness to Experience and
Conscientiousness
a. Chromosome 5 locus for Openness to Experience
b. Chromosome 18 locus for Conscientiousness
Foot note: Physical positions of SNPs and genes are based on build 36 (hg18). The top SNP is shown in blue. SNPs that have an r-
squared between 0.8-1 with the top SNP are shown in violet, SNPs with an r-squared between 0.5-0.8 in red, SNPs with an r-squared
between 0.2-0.5 in orange, and < 0.2 in yellow.
peer
-006
0188
0, v
ersi
on 1
- 21
Jun
201
1

41
Figure 2. Association of the two SNPs genome-wide significant in the discovery set with Openness to Experience and
Conscientiousness
a. Association of rs1477268 with Openness to Experience
b. Association of rs2576037 with Conscientiousness
Foot note: Effects are reported for the minor allele (see Supplementary Tables 4 and 6).
peer
-006
0188
0, v
ersi
on 1
- 21
Jun
201
1

42
Author contributions
Writing group: M.H.M.deM., P.T.C., A.Ter., R.F.K, C.M.vanD., D.I.B.
Analytic group: M.H.M.deM., J-J.H., T.E., M.L, T.T., S.S., A.Ten, L.M.L., N.K.H.,
S.E.M., N.R.W., E.W., D.L.C., K.R., G.R.A., N.A.
Study design and project management: D.I.B., E.J.C.deG., P.Su., B.W.J.H.P., P.A.F.M,
M.L.P., A.M., I.J.D., M.J.W., N.G.M., N.R.W., G.W.M., J.G.E., A.P., L.P., K.R., M.U.,
L.F., D.S., C.M.vanD., B.A.O., P.T.C., A.Ter.
Sample and phenotype data collection: M.A.D., G.W., E.J.C.deG, B.W.J.H.P., P.Sp.,
A.M.,A.R, J.A., P.A.F.M., A.C.H., N.G.M., M.L.P., M.J.W., N.G.M., N.R.W., L.J.B.,
K.R., J.G.E., M.U., L.F., D.S., A.C.J.W., P.T.C., A.Ter.
Data preparation: M.H.M.deM., M.A.D., J-J.H., G.W., E.J.C.deG, C.A.H., T.E, A.R.,
M.L.P., G.D., M.L., A.Ten., L.M.L., S.E.M., N.K.H., P.L., R.G., A.A., J.D., E.W.,
D.L.C., Y.S.A
peer
-006
0188
0, v
ersi
on 1
- 21
Jun
201
1

43
References
1 Costa PT, McCrae RR. Professional manual: Revised NEO Personality Inventory (NEO-PI-R) and NEO Five-Factor- Inventory (NEO-FFI). Psychological Assessment Resources: Odessa, FL, 1992.
2 Samuel DB, Widiger TA. A meta-analytic review of the relationships between the five-factor model and DSM-IV-TR personality disorders: A facet level analysis. Clin Psychol Rev 2008; 28(8) :1326-1342.
3 Hettema JM, Neale MC, Myers JM, Prescott CA, Kendler KS. A population-based twin study of the relationship between neuroticism and internalizing disorders. Am J Psychiatry 2006; 163(5) :857-864.
4 Terracciano A, Lockenhoff CE, Zonderman AB, Ferrucci L, Costa PT. Personality predictors of longevity: Activity, emotional stability, and conscientiousness. Psychosom Med 2008; 70(6) :621-627.
5 Dick DM, Aliev F, Wang JC, Grucza RA, Schuckit M, Kuperman S et al. Using dimensional models of externalizing psychopathology to aid in gene identification. Arch Gen Psychiatry 2008; 65(3) :310-318.
6 Kendler KS, Gatz M, Gardner CO, Pedersen NL. Personality and major depression - A Swedish longitudinal, population-based twin study. Arch Gen Psychiatry 2006; 63(10) :1113-1120.
7 Lahey BB. Public Health Significance of Neuroticism. Am Psychol 2009; 64(4) :241-256.
8 Bienvenu OJ, Samuels JF, Costa PT, Reti IM, Eaton WW, Nestadt G. Anxiety and depressive disorders and the five-factor model of personality: A higher- and lower-order personality trait investigation in a community sample. Depress Anxiety 2004; 20(2) :92-97.
9 Fanous A, Gardner CO, Prescott CA, Cancro R, Kendler KS. Neuroticism, Major Depression and Gender: a Population-Based Twin Study. Psychol Med 2002; 32(4) :719-728.
10 Kendler KS, Myers J. The genetic and environmental relationship between major depression and the five-factor model of personality. Psychol Med 2009; 40(5) :1-6.
11 Weiss A, Sutin AR, Duberstein PR, Friedman B, Bagby RM, Costa PT. The Personality Domains and Styles of the Five-Factor Model are Related to Incident Depression in Medicare Recipients Aged 65 to 100. Am J Geriatr Psychiatry 2009; 17(7) :591-601.
peer
-006
0188
0, v
ersi
on 1
- 21
Jun
201
1

44
12 Terracciano A, Costa PT. Smoking and the Five-Factor Model of personality. Addiction 2004; 99(4) :472-481.
13 Terracciano A, Lockenhoff CE, Crum RM, Bienvenu OJ, Costa PT. Five-factor model personality profiles of drug users. Bmc Psychiatry 2008; 8.
14 Saulsman LM, Page AC. The five-factor model and personality disorder empirical literature: A meta-analytic review. Clin Psychol Rev 2004; 23(8) :1055-1085.
15 Thoresen CJ, Bradley JC, Bliese PD, Thoresen JD. The big five personality traits and individual job performance growth trajectories in maintenance and transitional job stages. J Appl Psychol 2004; 89(5) :835-853.
16 De Moor MHM, Beem AL, Stubbe JH, Boomsma DI, de Geus EJC. Regular exercise, anxiety, depression and personality: A population-based study. Prev Med 2006; 42(4) :273-279.
17 Rhodes RE, Smith NEI. Personality correlates of physical activity: a review and meta-analysis. Br J Sports Med 2006; 40(12) :958-965.
18 Bouchard TJ, Loehlin JC. Genes, evolution, and personality. Behav Genet 2001; 31(3) :243-273.
19 Vernon PA, Martin RA, Schermer JA, Mackie A. A behavioral genetic investigation of humor styles and their correlations with the Big-5 personality dimensions. Pers Ind Diff 2008; 44(5) :1116-1125.
20 Distel MA, Trull TJ, Willemsen G, Vink JM, Derom CA, Lynskey MT et al. The Five Factor Model of personality and borderline personality disorder: A genetic analysis of comorbidity. Biol Psychiatry 2009; 66 :1131-1138.
21 Pilia G, Chen WM, Scuteri A, Orru M, Albai G, Dei M et al. Heritability of cardiovascular and personality traits in 6,148 sardinians. Plos Genet 2006; 2(8) :1207-1223.
22 Jang KL, Livesley WJ, Angleitner A, Riemann R, Vernon PA. Genetic and environmental influences on the covariance of facets defining the domains of the five-factor model of personality. Pers Ind Diff 2002; 33(1) :83-101.
23 Shifman S, Bhomra A, Smiley S, Wray NR, James MR, Martin NG et al. A whole genome association study of neuroticism using DNA pooling. Mol Psychiatry 2008; 13(3) :302-312.
24 van den Oord EJ, Kuo PH, Hartmann AM, Webb BT, Moller HJ, Hettema JM et al. Genomewide association analysis followed by a replication study implicates a novel candidate gene for neuroticism. Arch Gen Psychiatry 2008; 65(9) :1062-1071.
peer
-006
0188
0, v
ersi
on 1
- 21
Jun
201
1

45
25 Kuo PH, Neale MC, Riley BP, Patterson DG, Walsh D, Prescott CA et al. A genome-wide linkage analysis for the personality trait neuroticism in the Irish affected sib-pair study of alcohol dependence. Am J Med Genet Part B 2007; 144B(4) :463-468.
26 Neale BM, Sullivan PF, Kendler KS. A genome scan of neuroticism in nicotine dependent smokers. Am J Med Genet Part B 2005; 132B(1) :65-69.
27 Gillespie NA, Zhu G, Evans DM, Medland SE, Wright MJ, Martin NG. A genome-wide scan for Eysenckian personality dimensions in adolescent twin sibships: psychoticism, extraversion, neuroticism, and lie. J Pers 2008; 76(6) :1415-1446.
28 Fullerton J, Cubin M, Tiwari H, Wang C, Bomhra A, Davidson S et al. Linkage analysis of extremely discordant and concordant sibling pairs identifies quantitative-trait loci that influence variation in the human personality trait neuroticism. Am J Hum Genet 2003; 72(4) :879-890.
29 Nash MW, Huezo-Diaz P, Sterne A, Purcell S, Hoda F, Cherny SS et al. Genome-wide linkage analysis of a composite index of neuroticism and mood-related scales in extreme selected sibships. Hum Mol Genet 2004; 13(19) :2173-2182.
30 Hettema JM, Van den Oord EJCG, An SS, Kendler KS, Chen XN. Follow-up association study of novel neuroticism gene MAMDC1. Psychiatric Genet 2009; 19(4) :213-214.
31 Terracciano A, Sanna S, Uda M, Deiana B, Usala G, Busonero F et al. Genome-wide association scan for five major dimensions of personality. Mol Psychiatry 2010; 15(6) :647-656.
32 Boomsma DI, de Geus EJC, Vink JM, Stubbe JH, Distel MA, Hottenga JJ et al. Netherlands Twin Register: From twins to twin families. Twin Res Hum Genet 2006; 9(6) :849-857.
33 Penninx BWJH, Beekman ATF, Smit JH, Zitman FG, Nolen WA, Spinhoven P et al. The Netherlands Study of Depression and Anxiety (NESDA): rationale, objectives and methods. Int J Methods Psychiatric Res 2008; 17(3) :121-140.
34 Manolio TA, Rodriguez LL, Brooks L, Abecasis G, Ballinger D, Daly M et al. New models of collaboration in genome-wide association studies: the Genetic Association Information Network. Nat Genet 2007; 39(9) :1045-1051.
35 Boomsma DI, Willemsen G, Sullivan PF, Heutink P, Meijer P, Sondervan D et al. Genome-wide association of major depression: description of samples for the GAIN Major Depressive Disorder Study: NTR and NESDA biobank projects. Eur J Hum Genet 2008; 16(3) :335-342.
peer
-006
0188
0, v
ersi
on 1
- 21
Jun
201
1

46
36 Sullivan PF, de Geus EJC, Willemsen G, James MR, Smit JH, Zandbelt T et al. Genomewide association for major depressive disorder: a possible role for the presynaptic protein piccolo. Mol Psychiatry 2009; 14(4) :359-375.
37 Distel MA, Ligthart L, Willemsen G, Nyholt DR, Trull TJ, Boomsma DI. Personality, health and lifestyle in a questionnaire family study: A comparison between highly cooperative and less cooperative families. Twin Res Hum Genet 2007; 10(2) :348-353.
38 Pardo LM, MacKay I, Oostra B, van Duijn CM, Aulchenko YS. The effect of genetic drift in a young genetically isolated population. Ann Hum Genet 2005; 69 :288-295.
39 Bierut LJ, Agrawal A, Bucholz KK, Doheny KF, Laurie C, Pugh E et al. A genome-wide association study of alcohol dependence. Proc Natl Acad Sci USA 2010; 107(11) :5082-5087.
40 Barker DJP, Osmond C, Forsen TJ, Kajantie E, Eriksson JG. Trajectories of growth among children who have coronary events as adults. N Engl J Med 2005; 353(17) :1802-1809.
41 Eriksson JG, Osmond C, Kajantie E, Forsen TJ, Barker DJP. Patterns of growth among children who later develop type 2 diabetes or its risk factors. Diabetologia 2006; 49(12) :2853-2858.
42 Raikkonen K, Pesonen AK, Heinonen K, Lahti J, Kajantie E, Forsen T et al. Infant growth and hostility in adult life. Psychosom Med 2008; 70(3) :306-313.
43 Pergadia ML, Agrawal A, Loukola A, Montgomery GW, Broms U, Saccone SF. Genetic linkage findings for DSM-IV nicotine withdrawal in two populations. Am J Med Genet Part B 2009; 150B :950-959.
44 Saccone SF, Pergadia ML, Loukola A, Broms U, Montgomery GW, Wang JC et al. Genetic linkage to chromosome 22q12 for a heavy-smoking quantitative trait in two independent samples. Am J Hum Genet 2007; 80(5) :856-866.
45 Aitken JF, Green A, Eldridge A, Green L, Pfitzner J, Battistutta D et al. Comparability of Nevus Counts Between and Within Examiners, and Comparison with Computer Image-Analysis. Br J Cancer 1994; 69(3) :487-491.
46 Wright MJ, Martin NG. Brisbane adolescent twin study: Outline of study methods and research projects. Aus J Psychol 2004; 56(2) :65-78.
47 Distel MA, Trull TJ, Derom CA, Thiery EW, Grimmer MA, Martin NG et al. Heritability of borderline personality disorder features is similar across three countries. Psychol Med 2008; 38(9) :1219-1229.
peer
-006
0188
0, v
ersi
on 1
- 21
Jun
201
1

47
48 Deary IJ, Gow AJ, Taylor MD, Corley J, Brett C, Wilson V et al. The Lothian Birth Cohort 1936: a study to examine influences on cognitive ageing from age 11 to age 70 and beyond. BMC Geriatrics 2007; 7 :28.
49 Deary IJ, Whiteman MC, Starr JM, Whalley LJ, Fox HC. The impact of childhood intelligence on later life: Following up the Scottish Mental Surveys of 1932 and 1947. J Pers Soc Psychol 2004; 86(1) :130-147.
50 Terracciano A, McCrae RR, Brant LJ, Costa PT. Hierarchical linear modeling analyses of the NEO-PI-R scales in the Baltimore longitudinal study of aging. Psychol Aging 2005; 20(3) :493-506.
51 Terracciano A, Costa PT, McCrae RR. Personality plasticity after age 30. Pers Soc Psychol Bulletin 2006; 32(8) :999-1009.
52 Metspalu A. The Estonian Genome Project. Drug Develop Res 2004; 62(2) :97-101.
53 Nelis M, Esko T, Magi R, Zimprich F, Zimprich A, Toncheva D et al. Genetic structure of Europeans: a view from the North-East. PLoS ONE 2009; 4(5) :e5472.
54 McCrae RR, Costa PT, Martin TA. The NEO-PI-3: A more readable revised NEO Personality Inventory. J Pers Assess 2005; 84(3) :261-270.
55 Willemsen G, de Geus EJC, Bartels M, van Beijsterveldt CEM, Brooks AI, Estourgie-van Burk GF et al. The Netherlands Twin Register Biobank: A resource for genetic epidemiological studies. Twin Res Hum Genet 2010; 13(3) :231-245.
56 Rice JP, Reich T, Bucholz KK, Neuman RJ, Fishman R, Rochberg N et al. Comparison of Direct Interview and Family History Diagnoses of Alcohol Dependence. Alcoholism-Clinical and Experimental Research 1995; 19(4) :1018-1023.
57 First MB, Spitzer RL, Gibbon M, Williams JB. Structured Clinical Interview for DSM-IV Axis I Disorders - Patient Edition. Biometrics Research Department, New York State Psychiatric Institute: New York, 1995.
58 Folstein MF, Folstein SE, McHugh PR. Mini-Mental-Status-Test, German Edition. Beltz: Weinheim, 1993.
59 Allik J, Laidra K, Realo A, Pullmann H. Personality development from 12 to 18 years of age: Changes in mean levels and structure of traits. Eur J Pers 2004; 18(6) :445-462.
60 Kallasmaa T, Allik J, Realo A, McCrae RR. The Estonian version of the NEO-PI-R: An examination of universal and culture-specific aspects of the five-factor model. Eur J Pers 2000; 14(3) :265-278.
peer
-006
0188
0, v
ersi
on 1
- 21
Jun
201
1

48
61 Marchini J, Howie B, Myers S, McVean G, Donnelly P. A new multipoint method for genome-wide association studies by imputation of genotypes. Nat Genet 2007; 39(7) :906-913.
62 Chen WM, Abecasis GR. Family-based association tests for genomewide association scans. Am J Hum Genet 2007; 81(5) :913-926.
63 Abecasis G. METAL. 2009 URL: http://www.sph.umich.edu/csg/abecasis/Metal/
64 Dudbridge F, Gusnanto A. Estimation of significance thresholds for genomewide association scans. Genet Epidemiol 2008; 32(3) :227-234.
65 Liu JZ, McRae AF, Nyholt DR, Medland SE, Wray NR, Brown KM et al. A versatile gene-based test for genome-wide association studies. Am J Hum Genet 2010; 87(1) :139-145.
66 Liu X, Yu XP, Zack DJ, Zhu H, Qian J. TiGER: A database for tissue-specific gene expression and regulation. Bmc Bioinformatics 2008; 9.
67 Karabay A, Yu WQ, Solowska JM, Baird DH, Baas PW. Axonal growth is sensitive to the levels of katanin, a protein that severs microtubules. J Neurosc 2004; 24(25) :5778-5788.
68 Lee HH, Jan LY, Jan YN. Drosophila IKK-related kinase Ik2 and Katanin p60-like 1 regulate dendrite pruning of sensory neuron during metamorphosis. Proc Natl Acad Sci USA 2009; 106(15) :6363-6368.
69 Toyo-Oka K, Sasaki S, Yano Y, Mori D, Kobayashi T, Toyoshima YY et al. Recruitment of katanin p60 by phosphorylated NDEL1, an LIS1 interacting protein, is essential for mitotic cell division and neuronal migration. Hum Mol Genet 2005; 14(21) :3113-3128.
70 Lango Allen H, et al. Hundreds of variants clustered in genomic loci and biological pathways affect human height. Nature 2010; 467(7317) :832-838.
71 Yang J, Benyamin B, McEvoy BP, Gordon S, Henders AK, Nyholt DR et al. Common SNPs explain a large proportion of the heritability for human height. Nat Genet 2010; 42(7) :565-569.
72 Manolio TA, Collins FS, Cox NJ, Goldstein DB, Hindorff LA, Hunter DJ et al. Finding the missing heritability of complex diseases. Nature 2009; 461(8) :747-753.
peer
-006
0188
0, v
ersi
on 1
- 21
Jun
201
1

peer
-006
0188
0, v
ersi
on 1
- 21
Jun
201
1

peer
-006
0188
0, v
ersi
on 1
- 21
Jun
201
1

peer
-006
0188
0, v
ersi
on 1
- 21
Jun
201
1
peer
-006
0188
0, v
ersi
on 1
- 21
Jun
201
1