mesenchymal glioma stem cells are maintained by activated glycolytic metabolism involving aldehyde...
TRANSCRIPT
Mesenchymal glioma stem cells are maintainedby activated glycolytic metabolism involvingaldehyde dehydrogenase 1A3Ping Maoa,b, Kaushal Joshia,1, Jianfeng Lic,1, Sung-Hak Kima,d,1, Peipei Lia, Lucas Santana-Santose,f, Soumya Luthrae,Uma R. Chandrane, Panayiotis V. Benosf, Luke Smitha, Maode Wangb, Bo Hug, Shi-Yuan Chengg,2,Robert W. Sobolc,h,i,2, and Ichiro Nakanoa,j,2
aDepartment of Neurological Surgery and jJames Comprehensive Cancer Center, The Ohio State University, Columbus, OH 43210; bDepartment ofNeurosurgery, First Affiliated Hospital of Medical School, Xi’an Jiaotong University, Xi’an, Shaanxi 710061, China; Departments of cPharmacology andChemical Biology, eBiomedical Informatics, and fComputational and Systems Biology, University of Pittsburgh School of Medicine, Pittsburgh, PA 15213;dSchool of Life Sciences and Biotechnology, Korea University, Seoul 136-713, Republic of Korea; gThe Ken and Ruth Davee Department of Neurology andNorthwestern Brain Tumor Institute, Center for Genetic Medicine, The Robert H. Lurie Comprehensive Cancer Center, Northwestern University FeinbergSchool of Medicine, Chicago, IL 60611; hUniversity of Pittsburgh Cancer Institute, Hillman Cancer Center, Pittsburgh, PA 15213-1863; and iDepartment ofHuman Genetics, University of Pittsburgh Graduate School of Public Health, Pittsburgh, PA 15216
Edited* byWebster K. Cavenee, Ludwig Institute for Cancer Research, University of California at San Diego, La Jolla, CA, and approved April 15, 2013 (receivedfor review December 10, 2012)
Tumor heterogeneity of high-grade glioma (HGG) is recognized byfour clinically relevant subtypes based on core gene signatures.However, molecular signaling in glioma stem cells (GSCs) in indi-vidual HGG subtypes is poorly characterized. Here we identifiedand characterized two mutually exclusive GSC subtypes withdistinct dysregulated signaling pathways. Analysis of mRNA pro-files distinguished proneural (PN) from mesenchymal (Mes) GSCsand revealed a pronounced correlation with the correspondingPN or Mes HGGs. Mes GSCs displayed more aggressive phenotypesin vitro and as intracranial xenografts in mice. Further, Mes GSCswere markedly resistant to radiation compared with PN GSCs. Theglycolytic pathway, comprising aldehyde dehydrogenase (ALDH)family genes and in particular ALDH1A3, were enriched in MesGSCs. Glycolytic activity and ALDH activity were significantlyelevated in Mes GSCs but not in PN GSCs. Expression of ALDH1A3was also increased in clinical HGG comparedwith low-grade gliomaor normal brain tissue. Moreover, inhibition of ALDH1A3 attenu-ated the growth of Mes but not PN GSCs. Last, radiation treatmentof PN GSCs up-regulated Mes-associated markers and down-regulated PN-associated markers, whereas inhibition of ALDH1A3attenuated an irradiation-induced gain of Mes identity in PN GSCs.Taken together, our data suggest that two subtypes of GSCs,harboring distinct metabolic signaling pathways, represent inter-tumoral glioma heterogeneity and highlight previously unidenti-fied roles of ALDH1A3-associated signaling that promotes aberrantproliferation of Mes HGGs and GSCs. Inhibition of ALDH1A3-mediated pathways therefore might provide a promising thera-peutic approach for a subset of HGGs with the Mes signature.
cancer stem cell | epithelial-to-mesenchymal transition | glioblastomamultiforme | glioblastoma | proneural-to-mesenchymal transition
Ahallmark of malignant high-grade gliomas (HGGs), includinganaplastic glioma and glioblastoma multiforme (GBM), is
their intrinsic resistance to current therapies that leads to ex-tremely poor clinical outcomes (1). Even patients with well-demarcated tumors in noneloquent areas that allow maximalgross total removal at surgery and respond well to initial com-bined therapies inevitably develop subsequent tumor recurrencewith minimal survival (2). Therefore, there is an urgent need tobetter understand the underlying mechanisms of such malignancy,thereby providing an opportunity to develop novel therapies andapproaches to treat patients with aggressive HGGs.It is established that multiple genetic and metabolic pathways
create intricate networks to facilitate cross-talk between onco-genic and oncometabolic pathways that contribute to tumor pro-gression and therapy resistance of human cancers, includingHGGs (3). Recent genomewide transcriptome analyses suggest
that HGGs can be divided into four clinically relevant subtypes:proneural (PN), neural, classic, and mesenchymal (Mes) HGGs(4, 5). Distinct signals are activated in these individual HGGsubtypes that may account for the observed differential responsesto therapy. Therefore, therapeutic strategies for HGGs should bedesigned based on tumor subtype instead of applying them to allpatients with HGGs (6).HGG tumors are composed of heterogeneous tumor cell
populations that include tumor cells with stem cell propertiestermed glioma initiating/propagating cells or glioma stem cells(GSCs) (7). The unique properties of GSCs are considered tocontribute to the therapeutic resistance of HGG (8, 9). Thus,understanding and targeting tumor-propagating GSCs could bebeneficial in developing effective strategies that overcome ther-apeutic resistance of HGG. Given the distinct gene sets and sig-naling pathways that are differentially expressed in each subtypeof HGG (4, 5), GSCs in each subtype may also harbor distinct anddysregulated pathways that render their unique phenotypes intumor growth, progression, and resistance to therapy.In this study, we tested a hypothesis that HGG subtypes also
contain distinct GSC subtypes that could be differentiated bytranscriptome array analyses, and we then determined individualexpression and phenotypic signatures in two mutually exclusiveGSC subtypes.
ResultsGSC Cultures Derived from HGG Surgical Specimens Displayed TwoDistinct Stem Cell–Related Phenotypes In Vitro. We collected 40patient specimens ofHGGs from surgeries for patients withHGGsand established 19HGG-derived tumor cultures in defined serum-free medium that enriches tumorigenic self-renewing and multi-potent GSCs as previously described (Table S1) (10). Under theseculture conditions, we observed two phenotypically different GSCcultures with distinct morphologies. One set of GSC cultures(n = 10) displayed round neurosphere-like floating aggregates(cluster 1), and the other set (n = 9) formed irregular-shaped
Author contributions: P.M., S.-Y.C., R.W.S., and I.N. designed research; P.M., K.J., J.L., S.-H.K.,P.L., L.S.-S., S.L., U.R.C., P.V.B., L.S., M.W., and B.H. performed research; S.-Y.C., R.W.S., andI.N. analyzed data; and P.M., S.-Y.C., R.W.S., and I.N. wrote the paper.
The authors declare no conflict of interest.
*This Direct Submission article had a prearranged editor.
Freely available online through the PNAS open access option.1K.J., J.L., and S.-H.K. contributed equally to this work.2To whom correspondence may be addressed. E-mail: [email protected],[email protected], and [email protected].
This article contains supporting information online at www.pnas.org/lookup/suppl/doi:10.1073/pnas.1221478110/-/DCSupplemental.
www.pnas.org/cgi/doi/10.1073/pnas.1221478110 PNAS Early Edition | 1 of 6
GEN
ETICS

floating aggregates with some adherent cells on the bottom of theculture dish (cluster 2; Fig. S1A). Immunocytochemistry with sev-eral stem cell–associated markers demonstrated that GSCs incluster 1 were highly positive for Sox2 (markers for PNHGGs) andcapable of differentiating into GFAP-positive glial cells and TuJ1-positive neuronal cells, whereas GSCs in cluster 2 were positive forCD44 but negative for Sox2 (Fig. S1B). Additionally, both types ofGSCs retain their multipotency properties (Fig. S1 C and D).However, no single factor that correlates with a statistically sig-nificant difference distinguishes the clinical characteristics ofpatients with the HGGs from which these two groups of GSCswere derived.
Distinct Expression Profiles of mRNA Distinguish Mes from PN GSCSubtypes. Recently, two reports proposed the existence of twoGSC subtypes as determined by microarray based gene expres-sion profiles (11, 12). To investigate whether our GSC samplesdisplay two distinct expression profiles in a similar manner, weperformed transcriptome microarray analysis of 27 GSC samples(triplicate samples from nine patient-derived GSC cultures), aswell as cells comprising human astrocytes, fetal neural progeni-tors, and five glioma cell lines. For expression signature analysis,we performed a differential expression analysis of GSCs (PN vs.Mes) and found 5,796 genes to be differentially expressed (falsediscovery rate < 0.05; Fig. S2A). As shown in the heat map ofdifferentially expressed genes in Fig. 1A, one group showed highexpression of what are considered PN-associated genes and theother with Mes-associated genes. Our samples cluster accord-ingly with the PN and Mes HGG subtypes from the Philipsdataset, as shown in the hierarchical cluster analysis (Fig. 1B,Upper) (4). Furthermore, 3,376 genes (FDR < 0.05) were founddifferentially expressed between the PN and Mes samples in theTCGA dataset (Fig. 1B, Lower). A total of 1,986 differentiallyexpressed genes were present in both analyses (GSCs and TCGAdatasets). Interestingly, fewer genes were found statistically sig-nificantly and differentially expressed in the TCGA dataset thanin our dataset, a fact that might be explained by the higherheterogeneity of TCGA tumor samples (Fig. S2B). To validatethese microarray results, we performed quantitative real-time–PCR (qRT-PCR) analysis of some of the most highly differen-tially expressed genes (lowest P value). The data shown in Fig.1C highlight the consistent results of expressions between themicroarray and qRT-PCR analysis with the PN-associated genes(CD133, Olig2, Sox2, and Notch1) and the Mes-associated genes(CD44, Lyn, WT1, and BCL2A1) in PN and Mes GSCs (4, 5),respectively. The expression of these representative PN and Mesgenes displayed similar, if not identical, expression patterns in thematched original tumors and their derived tumor spheres (Fig.S3A). We also found that within the PN or Mes groups, the GSC
samples were better correlated with each other than the TCGAsamples, likely due to the higher heterogeneity among the TCGAtumors (Fig. 1B). As for isocitrate dehydrogenase 1 (IDH1) mu-tation status, all four PN and two Mes GSCs we sequenced wereIDH1 WT (Fig. S3B).
Mes GSCs Show More Aggressive Phenotypes than PN GSCs In Vitroand In Vivo. Next, we investigated whether PN and Mes GSCsdisplay any differences in cellular and tumorigenic behaviors.As shown in Fig. 2A, under identical growth conditions, MesGSCs showed higher potential for in vitro cell growth than PNGSCs (Fig. 2A; Fig. S4). We then implanted individual PN GSCs(84, AC17, and AC20) or Mes GSCs (83, 326, and 1123) into thebrains of immunocompromised mice. As shown in Fig. 2 B andC, mice that received Mes GSCs succumbed to intracranialGBM-like tumors within 18 d, with a median survival of 15 dafter implantation. In contrast, mice that received PN GSCsdeveloped brain tumors at a much slower rate, with a mediansurvival of 123 d. Mes GSC–derived brain tumors containedmultiple large hemorrhagic lesions and abundant tumor vessels,as well as tumor-associated necrosis, whereas PN GSC–derivedtumors showedminimal or no increase of angiogenesis or necrosiscompared with the adjacent normal brain (Fig. 2B, arrows).We then assessed the expression of CD133 and CD44, two cell
surface proteins that often associate with cancer stem cells, inthese GSCs by FACS analysis (13, 14). As shown in Fig. 2D, mostPN GSCs were positive for CD133, whereas Mes GSCs presentedwith only minimal to undetectable CD133-expressing cells. Con-versely, the majority of Mes GSCs were positive for CD44,whereas PN GSCs had minimal to modest levels of CD44 ex-pression. We next tested whether these data recapitulate the ex-pression of the original clinical HGG tumors from which theseGSCs were derived and whether these expression patterns aremaintained in the intracranial xenografts. As a PN-associatedmarker for immunohistochemistry (IHC), we used Olig2 becauseIHC staining for CD133 did not reliably correlate with our FACSresults of dissociated tumor cells. Most of the original HGGsamples that gave rise to PN GSCs expressed the PN markerOlig2 at high levels but were negative or only faintly stained forthe Mes marker CD44 (Fig. 2E; Fig. S5). In contrast, those HGGspecimens that gave rise to Mes GSCs exhibited high levels ofexpression of CD44 but minimal levels of Olig2. Interestingly,most of the GSC-derived intracranial xenograft tumors main-tained similar patterns of immunoreactivity to Olig2 and CD44(six of eight samples). Taken together, these results suggested twodistinct GSC subtypes established from clinical HGG samplesretained, at least to a major extent, the expression signatures ofthe original HGG tumors and recapitulated the major phenotypesof the original clinical HGGs in their xenograft brain tumors.
Fig. 1. Microarray analysis of two distinctive GSC samples. (A) Hierarchical biclustering of genes differentially expressed between PN and Mes cell lines. (B)Heat map with pairwise Pearson correlation for the Phillips HGG dataset and TCGA GBM dataset with the microarray samples. Stronger correlation is observedamong microarray samples of the same type compared among and with TCGA samples of the same subtype. (C) qRT-PCR and microarray of two GSC subtypes(**P < 0.01). Data are representative of three independent experiments with similar results.
2 of 6 | www.pnas.org/cgi/doi/10.1073/pnas.1221478110 Mao et al.

Aldehyde Dehydrogenase 1A3 Activity Is Markedly Elevated in MesGSCs Compared with Mes Non-GSCs and PN GSCs. Based on thetranscriptome array analyses, we found that a total of 5,796 genesare differentially expressed between our PN and Mes GSCs (Fig.S2A). Pathway enrichment analysis [Kyoto Encyclopedia of Genesand Genomes (KEGG) pathways] for all differentially expressedgenes identified the pathway of glycolysis and gluconeogenesiscontaining aldehyde dehydrogenase (ALDH) genes to be themost significantly enriched in Mes GSCs (P = 0.000315; Fig. 3A).Furthermore, glycolytic activity was significantly elevated inMesGSCs (n = 4) compared with PN GSCs (n = 4; Fig. 3B). Inparticular, four key enzymes in this pathway, PCK2, LDHC,
ALDH1A3, and ALDH9A1, were significantly up-regulated inMes GSCs, whereas ACSS1 is expressed at higher levels in PNGSCs (Fig. 3C).Of note in the transcriptome analyses, ALDH1A3, an iso-
enzyme of ALDH1 in the glycolysis and gluconeogenesis path-way, showed an ∼150-fold increase in mRNA levels in Mes GSCscompared with that in PN GSCs (Fig. 4A). Thus, we examined theexpression of all 19 members of the ALDH family in these GSCsand found that only ALDH1A3 was up-regulated in Mes GSCscompared with PN GSCs (Fig. S6A). Next, we investigatedALDH1 activity of these GSCs using FACS analysis after stainingwith Aldefluor (Fig. 4B). Aldefluor is a nontoxic substrate that
Fig. 2. Phenotypic differences between PN and Mes GSCs. (A) In vitro growth curves of PN GSC samples (n = 4) and Mes GSC samples (n = 5). (B) Repre-sentative H&E staining of various mouse brain sections with tumors established by two PN and two Mes GSCs. (C) Kaplan-Meier survival curves of mice bearingPN GSC– and Mes GSC–derived tumors (**P < 0.01). (D) FACS analyses of cell surface expression of CD133 and CD44 in cultured PN (n = 10) and Mes (n = 9)GSCs. (E) Representative images of IHC with the original patient tumors and PN or Mes GSCs–derived mouse intracranial tumors. PN GSCs are Olig2high; CD44-/low,whereas Mes GSCs are Olig2low; CD44high. Data in A–E are representative of three independent experiments with similar results.
Fig. 3. Glycolysis pathway as the most differentiallyactivatedpathway inMes GSCs. (A) Glycolytic pathwaycontaining aldehyde dehydrogenase genes (KEGG ID:hsa00010) was significantly enriched in Mes GSCs (P =0.0001315). Genes in red were differentially expressedbetween Mes and PN tumors. (B) Elevated glycolyticactivity in Mes GSCs (n = 4) compared with PN GSCs(n = 4; **P < 0.01). (C) Difference of expression of in-dividual genes in the glycolytic pathway in PN andMesGSC samples, normal astrocytes, and neural progeni-tors (16wf), and the glioma cell line LN486 (LN) (*P <0.05, **P < 0.01).
Mao et al. PNAS Early Edition | 3 of 6
GEN
ETICS

diffuses into living cells and then is broken down to the fluorescentmolecule Bodipy-aminoacetate by ALDH1. Thus, the amount ofintracellular accumulated fluorescent reaction product is directlyproportional to intracellularALDH1activity (15).As shown inFig.4B and Fig. S6B, ALDH1 activity-high (ALDH1-high) cells areonly found inMesGSCs (n= 3) but not in PNGSCs (n= 3) or non-GSCs derived from Mes GSCs (n = 3). We then assessed whetherALDH1 activity inMesGSCs correlates with the stemness of theseGSCs (e.g., in vitro clonality and bipotent capacity) by a clonalsphere formation assay. After separation of Mes GSCs intoALDH1-high cells and ALDH1-low cells by FACS, ALDH1activity positively correlated with the in vitro clonogenic potentialof ALDH1-high GSCs (Fig. 4C). Then we performed bipotencytests of ALDH1-high and ALDH1-low cells and determinedwhether FACS-sorted Mes ALDH1-high and ALDH1-low cellsgive rise to both ALDH1-high and ALDH1-low cells 7 d followingFACS separation (Fig. 4D; Fig. S6C). Although the majority ofALDH1-low cells remained as ALDH1-low cells (92.1–95.5%),∼16.2–28.3% of the sorted ALDH1-high cells retained theALDH1-high phenotype, similar to the proportions within theunsorted Mes GSCs. These results suggest that ALDH1 activitycorresponds to bipotency of Mes GSCs in vitro.Next, we tested whether the ALDH1 activity is required for
growth of Mes GSCs in vitro. When various GSCs were incubatedwith the ALDH1 inhibitor diethylaminobenzaldehyde (DEAB)(15), Mes GSCs, but not PN GSCs, showed marked decreasesin in vitro growth (Fig. 4E; Fig. S7A). We then used two shRNAconstructs to deplete ALDH1A3 in three PN GSCs and threeMes GSCs. As shown in Fig. 4F and Fig. S7B, knockdown ofALDH1A3 by shRNA constructs markedly inhibited the growthof Mes GSCs yet had minimal impact on the growth of PN GSCs.Decreased expression of ALDH1A3 by ALDH1A3 knockdownwas confirmed in both PN and Mes GSCs (Fig. 4F; Fig. S7C).Collectively, ALDH1A3 appears to be required for the in vitrogrowth of Mes GSCs but not PN GSCs. To further demonstrateclinical relevance of ALDH1A3 expression, we performed IHCstaining for ALDH1A3 expression in a collection of 76 clinicalglioma samples containing WHO grade II–IV tumors, as well as
adjacent normal brain tissues (Fig. 4G; Fig. S7D). In sharp con-trast to the observed negative expression of ALDH1A3 in 15normal brain tissues and 7 low-grade glioma tissues, expression ofALDH1A3 in HGG tissue specimens was markedly increased(n = 51; Fig. 4G). Taken together, these results demonstrate thatALDH1A3 is highly expressed in clinical HGG tumor specimensand suggest that ALDH1A3 could be a unique functional bio-marker for Mes GSCs.
Mes GSCs Are More Resistant to Radiation Treatment than PN GSCs InVitro. A recent study demonstrated that the mesenchymal phe-notype is a hallmark of tumor aggressiveness in brain tumors(16). Thus far, our in vitro and in vivo data suggest that MesGSCs display a more aggressive tumor phenotype than PN GSCs(Fig. 2). Therefore, we postulated that Mes GSCs could be moreresistant than PN GSCs to radiation treatment, the current first-line therapy for HGGs. Thus, we first examined the expressionprofiles of several genes involved in the repair of DNA double-strand breaks, comparing the PN and Mes GSCs by tran-scriptome microarray and qRT-PCR. Expression of most, if notall, of these DNA damage signaling and DNA repair genes wassignificantly higher in Mes GSCs than PN GSCs (Fig. 5A).Furthermore, a striking difference in radiosensitivity was ob-served between PN and Mes GSCs (n = 11; Fig. 5B; Fig. S8A).As expected, Mes GSCs were significantly resistant to radiationtreatment compared with PN GSCs.
Radiation Treatment Induces Mes-Associated Marker Expression in PNGSCs. The transition of epithelial tumors to a Mes phenotypeplays a critical role in advancing aggressiveness, tumor cell mo-tility, and metastasis in various types of human cancers (17).Given that Mes GSCs appear to be more radioresistant, wepredicted that radiation treatment may induce a shift of the GSCphenotype from PN to Mes [PN-to-Mes transformation (PMT)].To test this hypothesis, we first performed qRT-PCR and foundthat Sox2, a PN marker, was decreased, whereas CD44, Vimentin,and CDH1, all of which are mesenchymal markers, increased byradiation treatment of PN GSCs (n = 3; Fig. 5C). Then we
Fig. 4. ALDH1A3 is a functional Mes GSC marker. (A) qRT-PCR analysis of ALDH1A3 expression in PN and Mes GSCs (**P < 0.01). (B) FACS analysis usingAldeflour. ALDH activities in PN GSCs (n = 3), Mes GSCs (n = 3), and non-GSCs (n = 3) derived fromMes GSCs (**P < 0.01). (C) Frequency of sphere-forming cellsbetween ALDH1high and ALDH1low Mes GSCs. FACS-sorted based on ALDH expression Mes GSCs were used in the assays (**P < 0.01). (D) FACS reanalysis: ALDHactivity after 1-wk postcell sorting of Mes 326 ALDHhigh cells. ALDHhigh Mes GSC spheres generated both ALDHhigh and ALDHlow cells, whereas the majority ofALDHlow sphere cells retain as ALDHlow cells. (E) Effect of an ALDH inhibitor DEAB on cell growth of PN (n = 3) and Mes (n = 3) GSCs. DEAB abrogates the invitro growth of Mes GSCs but has a marginal effect on PN GSCs. (F) Effect of shALDH1A3 knockdown on growth and ALDH1A3 gene expression of both PNand Mes GSCs. The growth of Mes GSCs is significantly reduced by shRNA-mediated depletion of ALDH1A3 compared with PN GSCs. RNA interference with 2shALDH1A3 constructs significantly reduced ALDH1A3 expression levels in PN and Mes GSCs (n = 3 each, **P < 0.01). (G) Pie chart indicating the number ofsamples that were analyzed in different WHO tumor grades of clinical glioma samples or normal brain tissues that are ALDH(+) or (−). Data in A–F arerepresentative of three independent experiments with similar results.
4 of 6 | www.pnas.org/cgi/doi/10.1073/pnas.1221478110 Mao et al.

examined the expression of the Mes marker CD44 and the PNmarker Sox2 in three PN and three Mes GSCs before and afterradiation treatment in vitro (Fig. 5D; Fig. S8B). Although the MesGSCs (n = 3) did not show any detectable difference in the ex-pression of these markers when comparing expression before andafter radiation (Fig. S8 B and C), all three PN GSCs (n = 3)showed a marked increase in the expression of CD44 and an ap-preciable decrease in expression of Sox2 after radiation treatment,suggesting radiation may induce expression of the Mes signature inPN GSCs, leading to PMT in these HGG-derived PN GSCs (Fig.5D; Fig. S8D). Because ALDH1A3 is aberrantly up-regulated inMes GSCs compared with PN GSCs (Fig. 4), we examinedwhether ALDH1 is required for the putative PMT in these GSCs.Treatment with the ALDH1 inhibitor DEAB before radiation forPN GSCs (n = 3) blocked the shift of expression of Sox2 and CD44in the treated PN GSCs (Fig. 5D; Fig. S8D), suggesting that in-hibition of ALDH1 attenuates radiation-induced transformationof PN GSCs into Mes GSCs. Taken together, these data suggestthat radiation treatment of PN GSCs induces expression of Mes-associated markers and inhibition of the operational Mes GSCmarker ALDH1A3 in irradiated PN GSCs attenuates their trans-formation into Mes GSCs.
DiscussionIn our analysis of well-characterized clinical HGG-derived GSCs,we report the following findings. First, we are able to classifytwo distinct tumor-derived GSC subtypes in HGGs (PN GSCsand Mes GSCs) by genomewide transcriptome microarray anal-ysis, as well as in vitro and in vivo tumor growth assays. Second,genes involved in glycolysis and gluconeogenesis pathways in-cluding ALDH family genes, in particular ALDH1A3, are sig-nificantly up-regulated in Mes GSCs compared with PN GSCs.Third, activities of ALDH1, the enzyme that catalyzes the con-version of acetate from acetaldehyde, is markedly increased inMes GSCs but not PN GSCs. Fourth, inhibition of ALDH1 bya pharmacological inhibitor or shRNA knockdown of ALDH1A3attenuates PMT and in vitro growth of Mes GSCs. Fifth,ALDH1A3 is highly expressed in clinical HGGs but not in low-grade glioma or normal brain samples. Sixth, Mes GSCs display
a significantly higher radioresistance, with markedly elevatedlevels of expression of genes associated with DNA repair. Last,irradiation induces transformation of PN GSCs into a Mes-likeGSC phenotype (PMT) that is highly resistant to radiation treat-ment, and inhibition of ALDH1 reverses the radiation-resistantphenotype of Mes GSCs. Taken together, our data suggest thatsubtypes of GSCs in clinical HGG tumor tissues are identifiable bytheir in vitro and in vivo behaviors, as well as their global mRNAexpression profiles. Up-regulation of ALDH1A3 and DNA repairgenes not only distinguishes Mes GSCs from PN GSCs but alsocontributes to the irradiation-induced PMT.One novelty of this study is the significance related to our
identification of elevated expression of ALDH1A3 in Mes GSCs.First, ALDH1A3 can be a potentially useful biomarker for MesGSCs. The ALDH gene superfamily is composed of 19 isoenzymes,and their expression appears to be cancer type dependent (18).We found that most Mes GSCs do not express the commonlyused GSC marker CD133. Instead, of all 19 members of theALDH gene family, the expression level of ALDH1A3 is in-creased up to 150-fold in Mes compared with PN GSCs. Addi-tionally, ALDH1 has been recently recognized as a surrogatemarker for cancer stem cells (CSCs), and knockdown of ALDH1inhibited CSC growth and sensitized CSCs to chemotherapiesin various types of human cancers including breast (19), colon(20), and pancreatic (18) cancers. Consistent with these reports,we demonstrate that ALDH1A3 could be a biomarker for MesGSCs in HGG. Second, increased ALDH1 activity in Mes GSCsis associated with stem cell properties. This observation is clini-cally relevant because the increased ALDH1 expression corre-lates with malignancy of glioma in patients. Third, up-regulatedALDH1A3 could also be a potential biomarker to indirectlymonitor lipid metabolism in gliomas. Activated cell metabolism(e.g., glycolysis) in cancer cells play critical roles in renderingmalignancy and poor responses to therapies of malignant gliomas(21). In the clinic, 18F-fludeoxyglucose (FDG) PET is routinelyused to evaluate increased glucose consumption and glycolysisin tumors. We found that ALDH1A9 and ALDH1A3, theenzymes that catalyze conversion of acetaldehyde into acetate,are markedly increased in Mes GSCs. Detection of malignant
Fig. 5. Prominent radioresistance of Mes GSCs and radiation induces transformation of PN GSCs into Mes GSCs. (A) DNA microarray analyses and qRT-PCRvalidation of DNA damage-repair gene expression in GSCs. Various DNA damage-repair genes are expressed at higher levels in Mes GSCs than that in PN GSCs(*P < 0.05, **P < 0.01). Box: various GSC cells depicted in bar graphs. (B) Effect of radiation treatment on in vitro growth of PN and Mes GSCs (11 samples intotal) at indicate doses. (C) Representative PN and Mes gene expressions in PN GSC samples (n = 3) with and without radiation treatment (5 Gy, tested atday 5; **P < 0.01). (D) FACS analyses for Sox2 (PN marker) and CD44 (Mes marker) in PN GSCs (84, AC17, and AC20) pre- and postradiation (5 Gy) at day 5.DEAB (100 μM), a selective inhibitor of ALDH1, partially blocked the changes of expression of the markers (**P < 0.01). Bar graphs: the average of levels ofmarker expression among 3 PN GSC neurospheres. Data in A–D are representative of three independent experiments with similar results.
Mao et al. PNAS Early Edition | 5 of 6
GEN
ETICS

HGG by 11C-acetate PET based on increased activity of thesetwo enzymes has been reported recently (22). Thus, a potentialclinical application of 11C-acetate PET would be useful forevaluation of subtypes of human HGGs.We also demonstrate a potential role for ALDH1A3 in radi-
ation-induced PMT. Previous studies described that in some, ifnot all, GBMs, tumor recurrence after failure of standard ther-apies is accompanied with a phenotypic shift from PN to Mestumors (4). Activated MET activity in Mes HGGs was shown toinduce a program reminiscent of the epithelial-to-mesenchymaltransition and enhanced Mes features (23). In this study, werevealed that such a PMT also occurs in GSCs. We found thatPN GSCs are more sensitive to radiation than Mes GSCs, andradiation treatment of PN GSCs down-regulated PN markersand up-regulated Mes markers, suggesting radiation-inducedPMT. In contrast, radiosensitivity of individual GSCs did notshow any statistically significant correlation with tumor grade,despite the distinct genetic background of WHO grade III gliomascompared with grade IV tumors (e.g., 1p/19q LOH in malignantoligodendrogliomas). Our observation of more PN GSCs derivedfrom grade III tumors including oligodendrogliomas and moreMes GSCs derived from grade IV GBMs demonstrates the sig-nificance of a Mes signature, specifically in GSCs. The molecularinsight of this unique phenomenon warrants further investigation.Moreover, our results do suggest several open questions that
will require further discussion. First, during this study, we no-ticed that some of the grade III tumor samples (e.g., 1123) gaverise to Mes GSCs, and some of the recurrent GBM (e.g., 347,816, and 528Rec) after failure of whole brain radiation gave riseto PN GSCs. This result may reflect the existence of both PN andMes GSC subtypes within individual tumors. Second, the clinicalsignificance of PN and Mes signatures in HGGs needs further in-depth investigation. Although contribution of a Mes signature inglioma (and other cancers) for aggressiveness and poorer prog-nosis of affected patients is also well recognized, a recent studyby Sturm et al. (24) reported that a small subset of PN GBM(after removing IDH1 mutant samples) has a worse prognosis. Itappears still debatable which subtype of gliomas has a better orworse prognosis. Third, although we observed a clear increaseof Mes-associated genes and proteins in irradiated PN GSCs,further investigation is needed to determine whether radiationtreatment causes a complete and irreversible transformationfrom the PN to Mes phenotype. In fact, both the Phillips studyand the Verhaak study identified all three (or four) subtypesin newly diagnosed and recurrent tumors (4, 5). In addition, our
data do not rule out the possibility that radiating mixed pop-ulations in PN GSCs could potentially allow for a small subset ofradiation-resistant Mes-like cells to preferentially survive andemerge as the dominant population under our experimental con-dition (radiation). In fact, preirradiated PN GSCs contain a subsetof CD44-expressing/Sox2-negative cells (Fig. 5D), suggesting thatour hypothesis could be at least a potential possibility.In conclusion, in this study, we identified two mutually exclu-
sive GSCs in HGGs (PN and Mes) with striking phenotypicand genetic differences including aberrantly high expression ofALDH1A3 inMesGSCs.We also showed that irradiation inducesa change of expression of the PN andMes representative markersindicating a transformation of PN toMes GSCs and ALDH1A3 isrequired for this transformation. Collectively, our data providea set of evidence suggestive of a unique signaling mechanismunderlying the transformation of PN GSCs to Mes-like cells andmaintenance of stemness of Mes GSCs. Future characterizationof the ALDH1-mediated pathways could potentially elucidatenovel molecular mechanisms of GSC maintenance and/or prop-agation and eventually lead to the development of novel and ef-fective molecularly targeted therapies for HGGs.
Materials and MethodsExperimental methods are detailed in SI Materials and Methods. Methodsinclude generation of HGG tumor-derived neurospheres, reagents andantibodies, immunostaining, gene expression profiling and genetic analyses,qRT-PCR and FACS, in vitro cultures, xenotransplantation, glycolysis cell-based assay, IDH1 mutation detection, and statistical analyses. A completelist of cohort demographics is provided in Table S1.
ACKNOWLEDGMENTS. We thank Drs. H. Kornblum (University of Californiaat Los Angeles) and K. Palanichamy (Ohio State University) for sharing theirtumor samples for this study. This work was supported in part by the start-upfund from the Ohio State University; the Department of Neurological Sur-gery; American Cancer Society Grant MRSG-08-108-01; National Institutes ofHealth (NIH) Grants CA135013 (to I.N.), LM009657 (to P.V.B.), UL1RR024153(Reis, Clinical and Translational Science Institute University of Pittsburgh),CA130966 and CA158911 (to S.-Y.C. and B.H.), CA148629, GM087798, NS037704,ES019498, and GM099213 (to R.W.S.), and P30 CA047904 for the Universityof Pittsburgh Cancer Institute Core Facility (the Lentiviral and the CancerBiomarkers Facility, to R.W.S.); a Brain Cancer Research award from theJames S. McDonnell Foundation (to B.H.); a Zell Scholar award from the ZellFamily Foundation; funds from Northwestern Brain Tumor Institute and De-partment of Neurology Northwestern University (to S.-Y.C.); and the BasicScience Research Program through National Research Foundation of Korea(NRF) Grant 2011-0024089 (to S.-H.K.). P.M. was supported by the ChinaScholarship Council.
1. Dunn GP, et al. (2012) Emerging insights into the molecular and cellular basis ofglioblastoma. Genes Dev 26(8):756–784.
2. Adamson C, et al. (2009) Glioblastoma multiforme: A review of where we have beenand where we are going. Expert Opin Investig Drugs 18(8):1061–1083.
3. Haar CP, et al. (2012) Drug resistance in glioblastoma: A mini review. Neurochem Res37(6):1192–1200.
4. Phillips HS, et al. (2006) Molecular subclasses of high-grade glioma predict prognosis,delineate a pattern of disease progression, and resemble stages in neurogenesis.Cancer Cell 9(3):157–173.
5. Verhaak RG, et al.; Cancer Genome Atlas Research Network (2010) Integrated ge-nomic analysis identifies clinically relevant subtypes of glioblastoma characterized byabnormalities in PDGFRA, IDH1, EGFR, and NF1. Cancer Cell 17(1):98–110.
6. Lai A, et al. (2011) Phase II study of bevacizumab plus temozolomide during and afterradiation therapy for patients with newly diagnosed glioblastoma multiforme. J ClinOncol 29(2):142–148.
7. Singh SK, et al. (2004) Identification of human brain tumour initiating cells. Nature432(7015):396–401.
8. Joo KM, et al. (2012) MET signaling regulates glioblastoma stem cells. Cancer Res72(15):3828–3838.
9. Guvenc H, et al. (2013) Impairment of glioma stem cell survival and growth by a novelinhibitor for Survivin-Ran protein complex. Clin Cancer Res 19(3):631–642.
10. Miyazaki T, et al. (2012) Telomestatin impairs glioma stem cell survival and growththrough the disruption of telomeric G-quadruplex and inhibition of the proto-on-cogene, c-Myb. Clin Cancer Res 18(5):1268–1280.
11. Lottaz C, et al. (2010) Transcriptional profiles of CD133+ and CD133- glioblastoma-derived cancer stemcell lines suggest different cells of origin.Cancer Res 70(5):2030–2040.
12. Günther HS, et al. (2008) Glioblastoma-derived stem cell-enriched cultures form dis-tinct subgroups according to molecular and phenotypic criteria. Oncogene 27(20):2897–2909.
13. Bao S, et al. (2006) Glioma stem cells promote radioresistance by preferential acti-vation of the DNA damage response. Nature 444(7120):756–760.
14. Nakano I, Chiocca EA (2011) Finding drugs against CD133+ glioma subpopulations.J Neurosurg 114(3):648–, discussion 648–650.
15. Huang EH, et al. (2009) Aldehyde dehydrogenase 1 is a marker for normal and ma-lignant human colonic stem cells (SC) and tracks SC overpopulation during colontumorigenesis. Cancer Res 69(8):3382–3389.
16. Carro MS, et al. (2010) The transcriptional network for mesenchymal transformationof brain tumours. Nature 463(7279):318–325.
17. Chakrabarti R, et al. (2012) Elf5 inhibits the epithelial-mesenchymal transition inmammary gland development and breast cancer metastasis by transcriptionally re-pressing Snail2. Nat Cell Biol 14(11):1212–1222.
18. Marcato P, Dean CA, Giacomantonio CA, Lee PW (2011) Aldehyde dehydrogenase: Itsrole as a cancer stem cell marker comes down to the specific isoform. Cell Cycle 10(9):1378–1384.
19. Marcato P, et al. (2011) Aldehyde dehydrogenase activity of breast cancer stem cells isprimarily due to isoform ALDH1A3 and its expression is predictive of metastasis. StemCells 29(1):32–45.
20. Carpentino JE, et al. (2009) Aldehyde dehydrogenase-expressing colon stem cellscontribute to tumorigenesis in the transition from colitis to cancer. Cancer Res 69(20):8208–8215.
21. Wolf A, et al. (2011) Hexokinase 2 is a key mediator of aerobic glycolysis and pro-motes tumor growth in human glioblastoma multiforme. J Exp Med 208(2):313–326.
22. Tsuchida T, Takeuchi H, Okazawa H, Tsujikawa T, Fujibayashi Y (2008) Grading ofbrain glioma with 1-11C-acetate PET: Comparison with 18F-FDG PET. Nucl Med Biol35(2):171–176.
23. Lu KV, et al. (2012) VEGF inhibits tumor cell invasion and mesenchymal transitionthrough a MET/VEGFR2 complex. Cancer Cell 22(1):21–35.
24. Sturm D, et al. (2012) Hotspot mutations in H3F3A and IDH1 define distinct epigeneticand biological subgroups of glioblastoma. Cancer Cell 22(4):425–437.
6 of 6 | www.pnas.org/cgi/doi/10.1073/pnas.1221478110 Mao et al.

Supporting InformationMao et al. 10.1073/pnas.1221478110SI Materials and MethodsGlioma Tumor–Derived Neurospheres. All of the work related tohuman tissues was performed at The Ohio State University underan institutional review board–approved protocol according toNational Institute of Health (NIH) guidelines. Glioma andnormal neurospheres were derived from 19 of high-grade glioma(HGG) samples, 3 fetal brain-derived astrocytes (such as 16wf),and neural progenitors (Table S1) as described previously(1–4). Surgeries of brain tumor resections were performed byDrs. I. Nakano and E. A. Chiocca at the Department of Neu-rological Surgery, The Ohio State University (Columbus, OH).Briefly, freshly resected glioma tumor samples were dissociatedinto single cells using both mechanical (gently pipet neuro-spheres with P1000 pipet tips four to five times) and enzymaticmethods (TrypLE Express, 1; Invitrogen). The dissociated tumorcells were cultured in DMEM/F12 (Invitrogen) supplementedwith B27 (1:50), heparin (5 mg/mL), basic FGF (bFGF) (20 ng/mL), and EGF (20 ng/mL). Growth factors (bFGF and EGF)were added twice a week. To differentiate glioma stem cells(GSCs), neurospheres were cultured in DMEM/F12 supplementedwith 10% (vol/vol) FBS for 10 d. Phenotypic characterization ofthese primary cultures was performed as described previously(1, 5). The human fetal neural stem cell sample (16wf) was es-tablished at the University of California at Los Angeles asdescribed previously (6). All of the neurospheres analyzed inthis study were cultured <20 passages. In some experiments,various neurospheres were exposed to radiation (5 Gy) aftercells were plated at a density of 1 × 10⁶ cells/flask 1 d before ra-diation treatment. Single cells of various neurospheres were alsotreated with diethylaminobenzaldehyde (DEAB) (100 μM; Sigma)or DMSO as a vehicle control.
Reagents and Antibodies. The following primary antibodies andreagents were used in this study: anti-Nestin (mouse), anti-Sox2(mouse), anti-Olig2 (rabbit), anti-Vimentin (mouse), and anti-Snail (rabbit) antibodies were fromMillipore; anti-CD44 (mouse)antibodyused for immunocytochemistry (ICC)was fromBiolegend;anti-CD44 (mouse) antibody used for immunohistochemistry(IHC) was fromDako; and anti–aldehyde dehydrogenase (ALDH)1A3 (rabbit) antibody was from Sigma (catalog no. SAB1300933,polyclonal). For ICC, primary antibodies were visualized withAlexa Fluor 488–(green)–conjugated secondary antibodies (CellSignaling), and nuclei were stained with Hoechst 33342 (blue).B27 (1:50) was from Invitrogen; heparin (5 mg/mL) was fromSigma; and bFGF (20 ng/mL) and EGF (20 ng/mL) were fromPepro Tech. DMEM/F12 and FBS were from Invitrogen. AlizarinRed S Stain Solution (1×) was from Millipore.
ICC and IHC. ICC and IHC were performed as previously described(1). Samples incubated without primary antibodies were used asnegative controls. For IHC, experimental mice were perfusedwith ice-cold PBS followed by 4% (wt/vol) paraformaldehyde(PFA). Then brains were fixed in 4% (wt/vol) PFA, paraffin-embedded, and cut into 10-μm sections. Brain sections wereincubated with the indicated primary antibodies overnight at4 °C, followed by incubation with an HRP-conjugated secondaryantibody for 1 h at room temperature. Signals were detectedusing DAB substrate kit (Vector). Nuclei were counter stainedwith hematoxylin or Hoechst, respectively.
RNA Isolation. Cells were lysed with 1 mL Qiazol lysis reagent.Total RNA was then extracted and purified using the Qiagen
RNeasy Mini kit (catalog no. 217004) according to the manu-facturer’s instructions. After a wash with buffer RWT followedby two washes with buffer RPE, RNA products were eluted fromthe column with 30 μL RNase-free water. For each cell culture,three independent RNAs were prepared. RNA quality was de-termined using an Agilent 2100 Bioanalyzer at the Cancer Bio-markers Facility at the University of Pittsburgh Cancer Institute.In all sample preparations, the average RNA integrity number(RIN) was >9.0. RNA concentration was determined using aNanodrop 2000.
Quantitative Real-Time PCR. The ImProm-II Reverse TranscriptionSystem (Promega) was used to synthesize cDNA from theresulting RNAs according to the manufacturer’s protocol. Thereverse-transcribed cDNA was analyzed by quantitative RT-PCR(qRT-PCR), and GAPDH was used as an internal control. EachqRT-PCR included a 25-μL reaction mixture per well that in-cludes 2 μL cDNA, 1 μL forward primer (10 μM), 1 μL reverseprimer (10 μM), 8.5 μL of DNase/ RNase-free distilled water,and 12.5 μL SYBR green reagent (QIAGEN). The followingcycles were performed during DNA amplification: programstarted from heating to 94 °C for 2 min, then followed by 45cycles of 94 °C (30 s), 60 °C (30 s), and 72 °C (40 s), and endingwith the addition of melt curves as an evaluation of quality. Theprimer sequences for various human genes used in this studyinclude the following: CD133 forward: ACTCCCATAAAGCT-GGACCC; CD133 reverse: TCAATTTTGGATTCATATGC-CTT; Olig2 forward: CTCCTCAAATCGCATCCAGA; Olig2reverse: AGAAAAAGGTCATCGGGCTC; Sox2 forward: ACC-GGCGGCAACCAGAAGAACAG; Sox2 reverse: GCGCCGC-GGCCG GTATTTAT; Sox11 forward: GGCGTTAACCAGG-TTCTCAA; Sox11 reverse: TACCACCAATGGCTGCATTA;Notch1 forward: AGTGTGAAGCGGCCAATG; Notch1 reverse:ATAGTCTGCCAC GCCTCTG; CD44 forward: CC CAGAT-GGAGAAAGCTCTG; CD44 reverse: ACTTGGCTTTCTGT-CCTCCA; LYN forward: CTGAA CTCAAGTCACCGTGG;LYN reverse: TCCATCGTCACTCAAGCTGT; WT1 forward:TTAAAGGGAGTTGCTGCTGG; WT1 reverse: GACACCG-TGCGTGTGTATTC; BCL2A1forward: ATGGATAAGGCA-AAACGGAG; BCL2A1 reverse: TGGAGTGTCCTTTCTG-GTCA; Chek1 forward: TTGGGCTATCAATGGAAGAAA;Chek1 reverse: CCCTTAGAAAGCCGGAAGTC; Chek2 forward:CCTGAGGACCAAGAACCTGA; Chek2 reverse: TGTCCC-TCCCAAACCAGTAG; Rad17 forward: TGCCTACCAGCT-TTATGCCT; Rad17 reverse: AAAGTGTCGCTTCAGAGG-GA; Rad51 forward: CTGAGGGTACCTTTAGGCCA; Rad51reverse: CTGGTGGTCTGTGTTGAACG; GAPDH forward:GAAGGTGAAGGTCGGAGTCA; GAPDH reverse: TTGAGGTCAATGAAGGGGTC; Vimentin forward: GGAGGACAT-CTTCGAGCTTC; Vimentin reverse: ATGCCTGAGATGTA-GATGCG;CDH1 forward: GGAGGAGAGCGGTGGTCAAA;CDH1 reverse: TGTGCAGCTGGCTCAAGTCAA.For the qRT-PCR analysis of the DNA damage-repair genes,
Taqman Gene Expression Assay probes from Life Technologieswere used, and β-actin (catalog no. 4352935E) was used as aninternal control. Each qRT-PCR assay was performed in a 20-μLvolume with 4 μL cDNA, 1 μL Taqman probe, 10 μL TaqManFast Universal Master Mix (2×; catalog no. 4367846), and 5 μLof DNase/ RNase-free distilled water. The reactions were per-formed in an ABI StepOnePlus RT-PCR system according tothe manufacturer’s protocol. The probe IDs for this study areas follows: ATM, Hs01112307_m1; BRCA1, Hs01556193_m1;
Mao et al. www.pnas.org/cgi/content/short/1221478110 1 of 8

BRCA2, Hs00609073_m1; RAD50, Hs00990023_m1; RAD51,Hs00153418_m1; and CDC25C, Hs00156411_m1.
In Vitro Growth Assay. Tumor neurospheres from individual gliomatumor samples were dissociated into single cells, and cell densitywas quantified by counting viable cells using a hematocytometerfollowing the addition of 10% (vol/vol) Trypan Blue (Invitrogen).Then cells were seeded into 96-well plates containing 100 μLsphere medium at a density of 1,000 cells per well. AlamarBlue (Invitrogen) was added into each well, and cell pro-liferation was evaluated at different time points according to themanufacturer’s protocol.
Limiting Dilution Neurosphere Forming Assay. Tumor neurospheresfrom individual samples were dissociated into single cells andseeded into 96-well plates ranging from 5 to 1,000 cells seeded perwell. Each well contained 100 μL serum-free medium (1). Spherenumbers were then counted at day 3 under an inverted microscopefrom Optronics equipped with a digital camera. Those aggregatesmore than 50 μm in diameter were defined as tumorspheres.
Transient Transfection. Culture medium for tumor neurosphereswas changed into sphere medium without antibiotics 1 d beforetransfection. Then tumor neurospheres were transfected withshALDH1A3 using lipofectamine2000. Growth medium waschanged 6 h after transfection. The following shRNAs forALDH1A3 (Sigma) were used in this study: shALDH1A3 clone 1:CCGGGCAACCAATACTGAAGTTCAACTCGAGTTGAACT-TCAGTATTGGTTGCTTTTT; shALDH1A3 clone 2: CCGGG-CCGAATACACAGAAGTGAAACTCGAGTTT CACTTCT-GTG TATTCGGCTTTTT.
Xenotransplantation. All animal experiments were performed atThe Ohio State University under an Institutional Animal Careand Use Committee (IACUC)-proved protocol according toNIH guidelines. Various GSCs (1 × 10⁴ cells in 5 μL of PBS)were implanted into the brains of immunocompromised mice aspreviously described (5, 6). Mice were killed at the indicatedtimes or when neuropathological symptoms developed in braintumor–bearing animals.
FACS Analyses. FACS analyses were performed as previously de-scribed (1, 5). Briefly, cells were fixed by 4% (wt/vol) PFA at 4 °Cfor 30 min and blocked with 10% (vol/vol) normal goat serum(NGS) in 0.1% triton/1× PBS solutions. Cells were then in-cubated with primary antibodies for 1 h following incubation ofan additional hour with Alexa Fluor 488–(green)–conjugatedsecondary antibodies. FACSCalibur (BD Biosciences) was used todetect amplified signals, and the data were analyzed by FlowJo7.6.1 software. The following antibodies or kits were used in thisstudy for FACS: Sox2 antibody (Millipore); CD44 antibody(Biolegend); Alexa Fluor 488–(green)–conjugated anti-mouseantibody (Cell Signaling); CD133 Kit (MiltenyiBiotec); FcR block-ing reagent, CD133/2(293C3)-APC, and mouse IgG2b-APC; andthe ALDEFLUOR Kit (Stem Cell Technologies).
Cell Sorting of GSCs Using ALDH as a Surface Marker. GSCs weredissociated into single cells followed by immunostaining with orwithout the selective ALDH1 inhibitor, DEAB (150 μM), ac-cording to the manufacturer’s protocol (Aldefluor Kit; StemCellTechnologies). ALDH1-high and ALDH1-low GSC cells wereisolated using a FACSCalibur flow cytometer (BD Biosciences)based on fluorescence signals of these cells. Autofluorescence of theGSCs was gated on GSCs that were treated without anti-ALDH1antibody or with a specific ALDH1 inhibitor (DEAB, 150 μM).
Glycolysis Cell-Based Assay. A glycolysis cell-based assay kit wasused to measure the glycolytic activity in GSC samples according
to the manufacturer’s instructions. Briefly, GSCs were seeded ina 96-well plate at a density of 1 × 10⁴ cells per well in 120 μL ofneurosphere medium and cultured overnight in a CO2 incubatorat 37 °C. Then we used a new 96-well plate and added 100 μL ofthe standards into standard wells. Next, 10 μL of supernatantfrom cultured cell plates and 90 μL of assay buffer (total 100 μLeach well) were added in to all wells except standard wells. Then,100 μL of reaction solution was added into each well includingstandard wells. After a 30-min incubation at room temperature,the absorbance of each well at 490 nm was read with a platereader. L-lactate concentrations of each sample was calculatedusing the corrected absorbance of each sample. Assay buffer andreaction solution mentioned above were prepared based on themanufacturer’s kit reagents.
DNA Microarray Analysis. Comparative analysis of mRNA expres-sion was performed using the Human U219 Array Strip and theAffymetrix GeneAtlas system, as per the manufacturer’s in-structions. Microarray analysis for each of the cell cultures (intriplicate) was accomplished with 100 ng purified total RNA (de-scribed above) as the initial material and the corresponding am-plified and labeled antisense RNA (aRNA) using an GeneCHip 3′IVT Express kit (Affymetrix), as described by the manufacturer.The resulting aRNA was fragmented as described by the manu-facturer. The labeled aRNAs were then mixed with hybridizationmaster mix, and the hybridization mixtures were then denatured at95 °C for 5 min, followed by 45 °C for 5 min, and then kept at 45 °Cuntil applied to the hybridization tray (GeneAtlas System; 120 μLhybridizationmixture of a cell culture was transferred into a well ofa four-well hybridization tray). The array strip was immerse intohybridizationmixture and incubated in theHybridizationStation at45 °C for 16 h.After hybridization, the stripwaswashed and stainedin the GeneAtlas Fluidics Station using the GeneAtlas Hybridiza-tion,Wash, and Stain Kit (#900720; Affymetrix), and the intensityof each hybridized probe was generated using the GeneAtlas Im-aging Station. Raw .cel files from the Human U219 Array Stripwere analyzedusing the “affy”package inRBioconductor. The rawdata were normalized and summarized using the robust multichipaveragemethod (RMA). At this point, each gene is represented byone or more probe sets. The probe sets expressing<75 units for allsamples were filtered out for the genes that have other probe setsthat are being expressed (>75 units). The selective filtering wasperformed to avoid getting rid of any gene altogether. For genesrepresented by multiple probe sets, the probe set with the highestinterquartile range (a descriptive statistic used to summarize theextent of the spread of the data)was selected to represent the gene.As a result of the filtering procedure, all genes are represented bya single probe set for further statistical analysis.
In Silico Analysis of Differentially Expressed Genes and Pathways.Biclustering was performed on all 5,475 differentially expressedgenes and 27 samples by independently clustering samples andgenes. Euclidean distance and average linkage were used assimilarity metric and clustering method, respectively. Clusteringwas done using the R statistical package (hclust function). Dif-ferentially expressed genes were compared with all pathwayslisted in Kyoto Encyclopedia of Genes and Genomes (KEGG),and the enrichment P value was calculated using the Fisher’sexact test. Pathways that had P < 0.05 were considered signifi-cantly enriched.
Comparison of Expression Data with The Cancer Genome AtlasGlioblastoma Multiforme Dataset and Phillips HGG Dataset. TheCancer Genome Atlas (TCGA) gene expression data (level 3)for mesenchymal and proneural tumors (7, 8) were downloadedfrom the TCGA website (https://tcga-data.nci.nih.gov/tcga/tcgaDownload.jsp). The Phillips HGG dataset and the in-house expression data were individually processed as described
Mao et al. www.pnas.org/cgi/content/short/1221478110 2 of 8
above, and then batch effects were removed by using the Com-Bat algorithm (9). Before comparing TCGA and in-house da-tasets, a similar procedure was used: datasets were individuallyprocessed and the ComBat algorithm (9) was used for removingbatch effects. Data for the proneural (PN) and mesenchymal(Mes) signature genes (7) were extracted from both datasets,and hierarchical biclustering performed as described above.Pearson correlation between TCGA and in-house datasets wereperformed in R (“cor” function).
Mesenchymal Differentiation Assay. Cells were seeded at a densityof 5 × 10⁴ cells in a six-well plate. After 24 h, cell differentiationwas induced with osteogenesis induction medium and adipogenicinduction/maintenance medium from Lonza, which was usedaccording to the manufacturer’s instructions. Cells were fed every3–4 d by completely replacing the medium with fresh osteogenesisinduction medium. After 3–4 wk, cells were rinsed in PBS, fixedwith 4% (wt/vol) PFA for 30 min, and stained with Alizarin Red.Adipocytes were distinguished after 3 wk of adipogenesis dif-ferentiation.For the chondrogenic assay, cell pellets were prepared by
spinning down 3 × 10⁵ cells in 15 mL polypropylene tubes andwere grown in complete chondrogenic medium (Lonza). Cellpellets were fed every 2–3 d by completely replacing the mediumwith freshly prepared complete chondrogenic medium. After
3–4 wk, pellets were fixed in 4% (wt/vol) PFA and embedded inparaffin. Five-micrometer-thick sections were slide-mountedand stained for glycosaminoglycans with Safranin O.
Isocitrate dehydrogenase 1 Mutation Detection.Genomic DNA wasisolated from PN and Mes GSCs using the DNeasy Blood andTissue kit (Qiagen), according to the manufacturer’s in-structions. The quantity of isolated DNA was assessed usinga NanoDrop 1000 spectrophotometer (Thermo Scientific).For the detection of IDH1 mutations, forward and reverseprimers were designed to amplify exon 4 (codon R132) of theisocitrate dehydrogenase 1 (IDH1) gene using primer 3 software(forward primer = 5′-ACCAAATGGCACCATACGA-3′; reverseprimer = 5′-GCAAAATCACATTATTGCCAAC-3′) to generatea 130-bp PCR product. PCR amplification was performed using50 ng of DNA, 0.2 μmol of each primer, and the Ex Taq PCRkit (Takara). The amplified PCR product was cloned into thepGEM-T easy vector (Promega), and the nucleotide sequencewas determined.
Statistical Analysis. Student t test and one-way ANOVA wereperformed for data analysis by using SPSS 17.0 software (IBM).Log-rank analysis was used to determine statistical significanceof Kaplan–Meier survival curve. For all statistical methods, P <0.05 was considered significant.
1. Jijiwa M, et al. (2011) CD44v6 regulates growth of brain tumor stem cells partiallythrough the AKT-mediated pathway. PLoS ONE 6(9):e24217.
2. Guvenc H, et al. (2013) Impairment of glioma stem cell survival and growth by a novelinhibitor for Survivin-Ran protein complex. Clin Cancer Res 19(3):631–642.
3. Nakano I, et al. (2008)Maternal embryonic leucine zipper kinase is a key regulator of theproliferation ofmalignant brain tumors, including brain tumor stem cells. J Neurosci Res86(1):48–60.
4. Dougherty JD, et al. (2005) PBK/TOPK, a proliferating neural progenitor-specificmitogen-activated protein kinase kinase. J Neurosci 25(46):10773–10785.
5. Miyazaki T, et al. (2012) Telomestatin impairs glioma stem cell survival and growththrough the disruption of telomeric G-quadruplex and inhibition of the proto-oncogene,c-Myb. Clin Cancer Res 18(5):1268–1280.
6. Nakano I, et al. (2011) Siomycin A targets brain tumor stem cells partially througha MELK-mediated pathway. Neuro-oncol 13(6):622–634.
7. Phillips HS, et al. (2006) Molecular subclasses of high-grade glioma predict prognosis,delineate a pattern of disease progression, and resemble stages in neurogenesis. CancerCell 9(3):157–173.
8. Verhaak RG, et al.; Cancer Genome Atlas Research Network (2010) Integratedgenomic analysis identifies clinically relevant subtypes of glioblastoma characterizedby abnormalities in PDGFRA, IDH1, EGFR, and NF1. Cancer Cell 17(1):98–110.
9. Johnson WE, Li C, Rabinovic A (2007) Adjusting batch effects in microarray expressiondata using empirical Bayes methods. Biostatistics 8(1):118–127.
Mao et al. www.pnas.org/cgi/content/short/1221478110 3 of 8
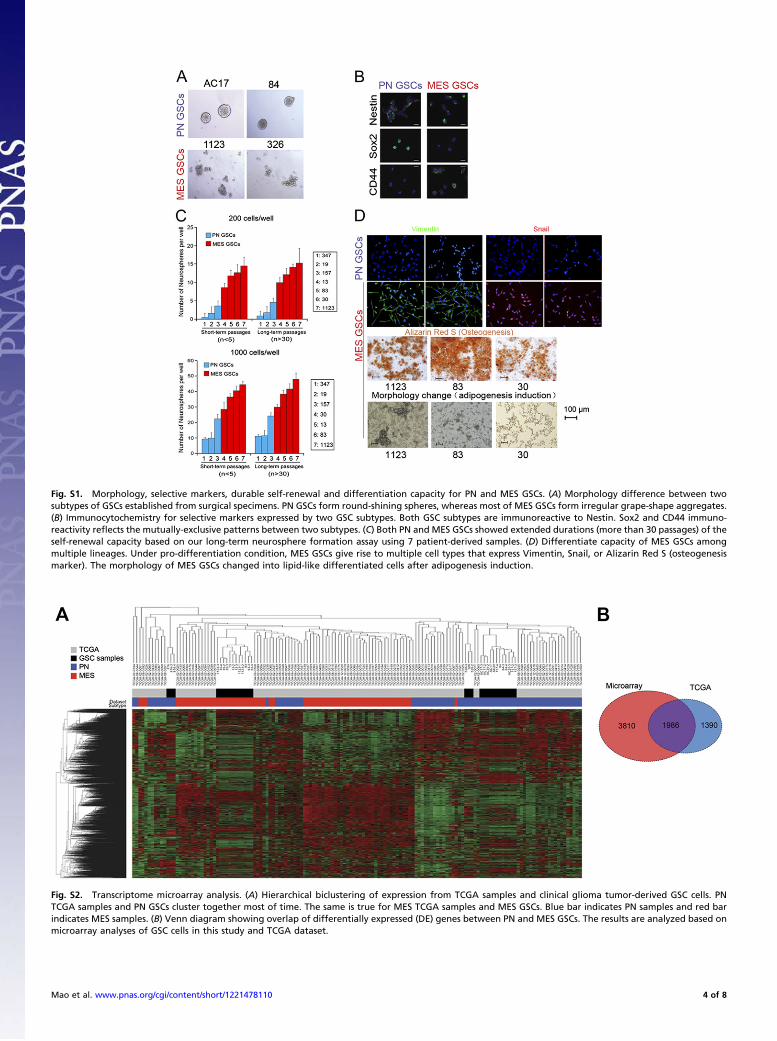
Fig. S1. Morphology, selective markers, durable self-renewal and differentiation capacity for PN and MES GSCs. (A) Morphology difference between twosubtypes of GSCs established from surgical specimens. PN GSCs form round-shining spheres, whereas most of MES GSCs form irregular grape-shape aggregates.(B) Immunocytochemistry for selective markers expressed by two GSC subtypes. Both GSC subtypes are immunoreactive to Nestin. Sox2 and CD44 immuno-reactivity reflects the mutually-exclusive patterns between two subtypes. (C) Both PN and MES GSCs showed extended durations (more than 30 passages) of theself-renewal capacity based on our long-term neurosphere formation assay using 7 patient-derived samples. (D) Differentiate capacity of MES GSCs amongmultiple lineages. Under pro-differentiation condition, MES GSCs give rise to multiple cell types that express Vimentin, Snail, or Alizarin Red S (osteogenesismarker). The morphology of MES GSCs changed into lipid-like differentiated cells after adipogenesis induction.
Fig. S2. Transcriptome microarray analysis. (A) Hierarchical biclustering of expression from TCGA samples and clinical glioma tumor-derived GSC cells. PNTCGA samples and PN GSCs cluster together most of time. The same is true for MES TCGA samples and MES GSCs. Blue bar indicates PN samples and red barindicates MES samples. (B) Venn diagram showing overlap of differentially expressed (DE) genes between PN and MES GSCs. The results are analyzed based onmicroarray analyses of GSC cells in this study and TCGA dataset.
Mao et al. www.pnas.org/cgi/content/short/1221478110 4 of 8

Fig. S3. Representative gene expression patterns and IDH1 mutation status of two GSC subtypes. (A) The expression of representative PN and MES genesdisplayed similar expression patterns in the matched original tumors and their derived tumor sphere samples. (B) IDH1 mutation status in PN and MES samples.All the 6 PN and MES GSCs were IDH1 wild type.
Fig. S4. Two GSC subtypes display distinct growth kinetics in vitro. Graph indicating the average of the in vitro growth curves of PN (n = 4) and Mes (n = 5) GSCsamples. Note that Mes GSCs grow substantially faster than PN ones (*P < 0.05, **P < 0.01). Data are from three independent experiments with similar results.
Mao et al. www.pnas.org/cgi/content/short/1221478110 5 of 8

Fig. S5. IHC with the matched tumors from patients and mouse intracranial xenografts. Representative images of IHC for Olig2 (a PN marker) and CD44 (a Mesmarker) on glioma tumor tissues from patients and mouse xenografts. Most of PN tumors from the patient and mice (528, 84, and 157) show high levels ofOlig2 expression, whereas CD44 was at low levels. In contrast, strong IHC staining for CD44 (326, 1123, and 524) are found in most of Mes tumors but not PNtumors from patients and mice. Tumor sections were counter stained with hematoxylin (blue).
Fig. S6. ALDH1A3 serves as a Mes GSC marker. (A) Relative signal intensities of transcripts for individual ALDH isoenzymes in Mes GSCs compared with PNGSCs. (B) FACS analysis with Aldefluor for ALDH1 activity in PN and Mes GSCs and Mes non-GSCs. ALDH1high cells are present in Mes GSCs but not in PN GSCs orMes non-GSCs. A pharmacological inhibitor DEAB is used to suppress ALDH1 activity. (C) FACS reanalysis of ALDH activity using Aldefluor in cultures derivedfrom ALDHhigh or ALDHlow cell populations. ALDHhigh sphere cells in Mes GSCs generated both ALDHhigh and ALDHlow cell populations, whereas the majority ofALDHlow cells retained as ALDHlow cells.
Fig. S7. Effect of ALDH inhibition on growth of GSCs and ALDH1A3 staining in glioma samples. (A) Blocking effects of DEAB, a selective ALDH1 inhibitor, ongrowth of PN and Mes GSCs. DEAB significantly reduced growth of Mes GSCs (Right; **P < 0.01) but had no impact on the growth of PN GSCs (Left). (B) Effectof one shRNA knockdown of ALDH1A3 on growth of PN and Mes GSCs (n = 3 each). Growth of Mes GSCs was significantly reduced by shRNA against ALDH1A3compared with PN (**P < 0.01). (C) ALDH1A3 expression levels of PN and Mes GSCs after shALDH1A3 #1. The expression levels of ALDH1A3 were significantlyreduced by knockdown of ALDH1A3 in both PN and Mes GSCs (**P < 0.01). (D) Representative images of IHC-stained clinical glioma tumor tissue sections usingan anti-ALDH antibody. NB, normal brain; Gr. II, low-grade glioma; Gr. III and glioblastoma multiforme (GBM)-1, high-grade glioma. Negative control, stainingwithout primary antibody; positive sample, 83 (Mes GBM).
Mao et al. www.pnas.org/cgi/content/short/1221478110 6 of 8

Fig. S8. Radiation sensitivity and PN-to-Mes transition by irradiation treatment. (A) Mes GSCs were more resistant to radiation treatment compared with PNones (**P < 0.01). (B) FACS analyses for Sox2 (PN marker) and CD44 (Mes marker) in Mes GSCs with and without radiation treatment. No significant differenceof Sox2 and CD44 expression was observed in Mes GSCs (83, 1123, and 326) before and after radiation treatment (5 Gy, day 5). (C) Graphs show the averageresults of Sox2 and CD44 expression with and without radiation treatment in three Mes GSC samples. (D) ALDH1 inhibition partially attenuates up-regulationof Mes markers in postradiation PN GSCs. Representative data of FACS analyses for Sox2 and CD44 of 2 PN GSC samples (AC20 and 84) with and withoutradiation treatment (5 Gy). Radiation treatment decreases expression of Sox2 (a PN marker) but increases CD44 (a Mes marker) expression in PN GSCs. Pre-treatment with DEAB (100 μM) partially reversed this conversion. DMSO is used as a control vehicle.
Mao et al. www.pnas.org/cgi/content/short/1221478110 7 of 8
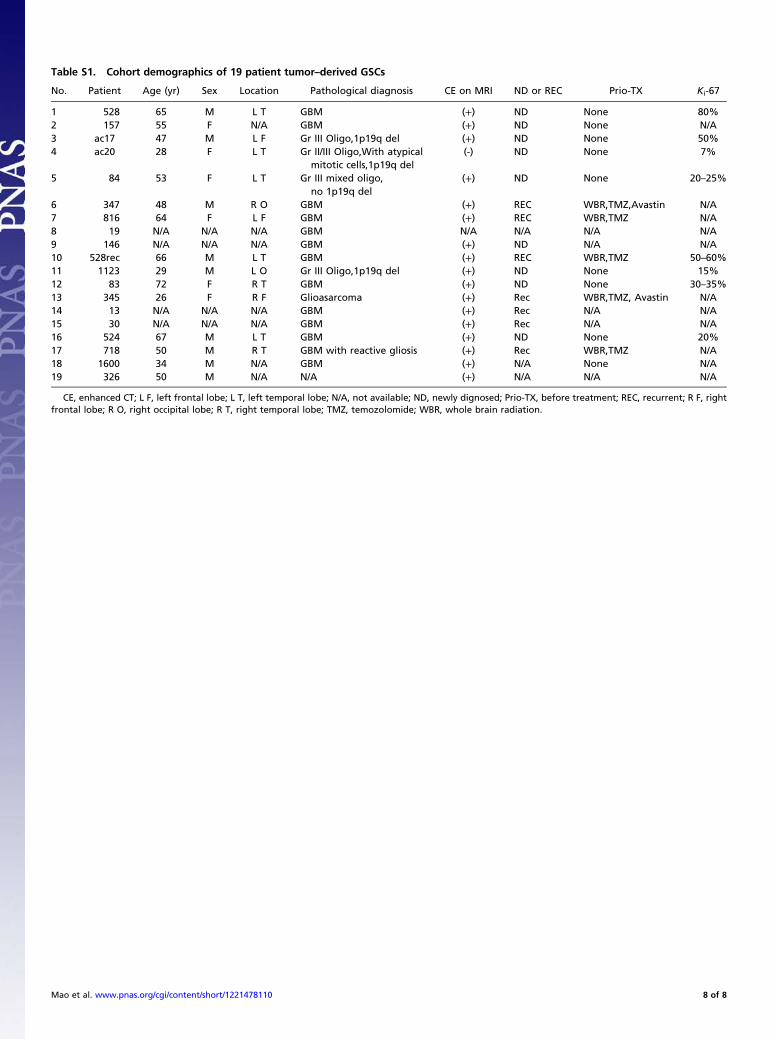
Table S1. Cohort demographics of 19 patient tumor–derived GSCs
No. Patient Age (yr) Sex Location Pathological diagnosis CE on MRI ND or REC Prio-TX Ki-67
1 528 65 M L T GBM (+) ND None 80%2 157 55 F N/A GBM (+) ND None N/A3 ac17 47 M L F Gr III Oligo,1p19q del (+) ND None 50%4 ac20 28 F L T Gr II/III Oligo,With atypical
mitotic cells,1p19q del(-) ND None 7%
5 84 53 F L T Gr III mixed oligo,no 1p19q del
(+) ND None 20–25%
6 347 48 M R O GBM (+) REC WBR,TMZ,Avastin N/A7 816 64 F L F GBM (+) REC WBR,TMZ N/A8 19 N/A N/A N/A GBM N/A N/A N/A N/A9 146 N/A N/A N/A GBM (+) ND N/A N/A10 528rec 66 M L T GBM (+) REC WBR,TMZ 50–60%11 1123 29 M L O Gr III Oligo,1p19q del (+) ND None 15%12 83 72 F R T GBM (+) ND None 30–35%13 345 26 F R F Glioasarcoma (+) Rec WBR,TMZ, Avastin N/A14 13 N/A N/A N/A GBM (+) Rec N/A N/A15 30 N/A N/A N/A GBM (+) Rec N/A N/A16 524 67 M L T GBM (+) ND None 20%17 718 50 M R T GBM with reactive gliosis (+) Rec WBR,TMZ N/A18 1600 34 M N/A GBM (+) N/A None N/A19 326 50 M N/A N/A (+) N/A N/A N/A
CE, enhanced CT; L F, left frontal lobe; L T, left temporal lobe; N/A, not available; ND, newly dignosed; Prio-TX, before treatment; REC, recurrent; R F, rightfrontal lobe; R O, right occipital lobe; R T, right temporal lobe; TMZ, temozolomide; WBR, whole brain radiation.
Mao et al. www.pnas.org/cgi/content/short/1221478110 8 of 8