mechanical properties of polypropylene fiber cement mortar
TRANSCRIPT
sustainability
Article
Mechanical Properties of Polypropylene Fiber Cement Mortarunder Different Loading Speeds
Hui Chen 1,2, Xin Huang 2, Rui He 3,*, Zhenheng Zhou 1, Chuanqing Fu 3 and Jiandong Wang 3
�����������������
Citation: Chen, H.; Huang, X.; He,
R.; Zhou, Z.; Fu, C.; Wang, J.
Mechanical Properties of
Polypropylene Fiber Cement Mortar
under Different Loading Speeds.
Sustainability 2021, 13, 3697. https://
doi.org/10.3390/su13073697
Academic Editor: Asterios Bakolas
Received: 1 March 2021
Accepted: 23 March 2021
Published: 26 March 2021
Publisher’s Note: MDPI stays neutral
with regard to jurisdictional claims in
published maps and institutional affil-
iations.
Copyright: © 2021 by the authors.
Licensee MDPI, Basel, Switzerland.
This article is an open access article
distributed under the terms and
conditions of the Creative Commons
Attribution (CC BY) license (https://
creativecommons.org/licenses/by/
4.0/).
1 Department of Architecture and Civil Engineering, Oujiang College, Wenzhou University,Wenzhou 325035, China; [email protected] (H.C.); [email protected] (Z.Z.)
2 College of Architecture and Civil Engineering, Wenzhou University, Wenzhou 325035, China;[email protected]
3 College of Civil Engineering and Architecture, Zhejiang University of Technology, Hangzhou 310034, China;[email protected] (C.F.); [email protected] (J.W.)
* Correspondence: [email protected]
Abstract: In this work, the relationships between the mechanical properties (i.e., compressive strengthand flexural strength) and loading speed of polypropylene fiber (PPF)-incorporated cement mortarat different ages (before 28 days) were studied. A total of 162 cubic samples for compressivestrength tests and 162 cuboid samples for flexural strength tests were casted and tested. Analyticalrelationships between the sample properties (i.e., sample age, PPF content, and loading speed) andcompressive and flexural strength were proposed based on the experimental data, respectively. Ofthe predicted compressive and flexural strength results, 70.4% and 75.9% showed less than 15%relative error compared with the experimental results, respectively.
Keywords: polypropylene fiber (PPF) cement mortar; loading speed; compressive strength; flexu-ral strength
1. Introduction
Cement-based materials are the most widely used construction materials aroundthe world. However, normal cement-based materials usually present some unfavorableproperties (i.e., high porosity [1,2], high chloride diffusivity and oxygen diffusivity [3–7],limited tensile strength [8], fracture toughness [9], and early-age cracking [10,11]), whichaffect the durability of concrete structures.
Fiber reinforcement of cement-based materials has shown a good improvement inmechanical properties [12]. Polypropylene fiber (PPF) is a cheap [13] and popular materialin the construction industry. The polypropylene fiber market reached $122.7 billion in2019 [14]. Many studies have been conducted to investigate the improvement of PPF-incorporated cement-based materials’ performance [15–18], especially the improvementin mechanical properties [19–22]. The addition of PPF can significantly reduce the dryingshrinkage while improving the compressive strength and freeze-thaw resistance of con-crete [23]. PPF has also been used in light-weight concrete to improve the compressivestrength and the crack-resistance performance [15]. The incorporation of PPF in prepackedaggregate concrete also shows an improved resistance against elevated temperatures [24,25].Medina et al. [26] reported that the water permeability and CO2 diffusion are reduced dueto the excellent cracking control of the PPF-incorporated concrete, which makes PPF-mixedconcrete structures more resistant to CO2-induced durability deterioration (i.e., carbonationand corrosion), and results in more sustainable concrete structures.
The loading speed has a significant influence on the results of mechanical tests [27–30].The first study of the loading speed influence on the mechanical properties of cement-basedmaterials was performed by Abrams in 1917 [31]. Since then, a lot of research has beencarried out to study the relationship between the loading speed and mechanical properties
Sustainability 2021, 13, 3697. https://doi.org/10.3390/su13073697 https://www.mdpi.com/journal/sustainability
Sustainability 2021, 13, 3697 2 of 17
of cement-based materials [27,28,32,33]. Kaplan [34] studied the influence of loading rateon the compressive strength of concrete and found that the moisture content is one ofthe important variables affecting the relationship between strength and loading speed.Fu et al. [35] found that both compressive strength and stiffness increase with increasingloading rate, and that wet concrete is relatively more sensitive to a change in loading ratethan dry concrete. Bischoff and Perry [32] reviewed the relationship between compres-sive strength and loading speed, and found that the ultimate strength is affected mostsignificantly by the loading rate, and a linear relationship was found between compressivestrength and loading speed. Quantitative relationships between the loading speed andmechanical properties of PPF-incorporated cement mortar are still lacking, despite a lot ofqualitative relationships having been obtained in the existing literature.
To fill the aforementioned knowledge gaps, a total of 162 cubic PPF-incorporatedcement mortar samples for compressive strength tests and 162 cuboid PPF-incorporatedcement mortar samples for flexural strength tests were casted and tested before 28 days ofage in this work, and the relationships between mechanical properties (i.e., compressiveand flexural strength) and loading speed of PPF-incorporated cement mortar at differentages were studied. Analytical relationships between the sample properties (i.e., sampleage, PPF content, and loading speed) and compressive and flexural strength are proposed,respectively, based on the experimental data.
2. Experimental Program2.1. Raw Materials and Mixture Design
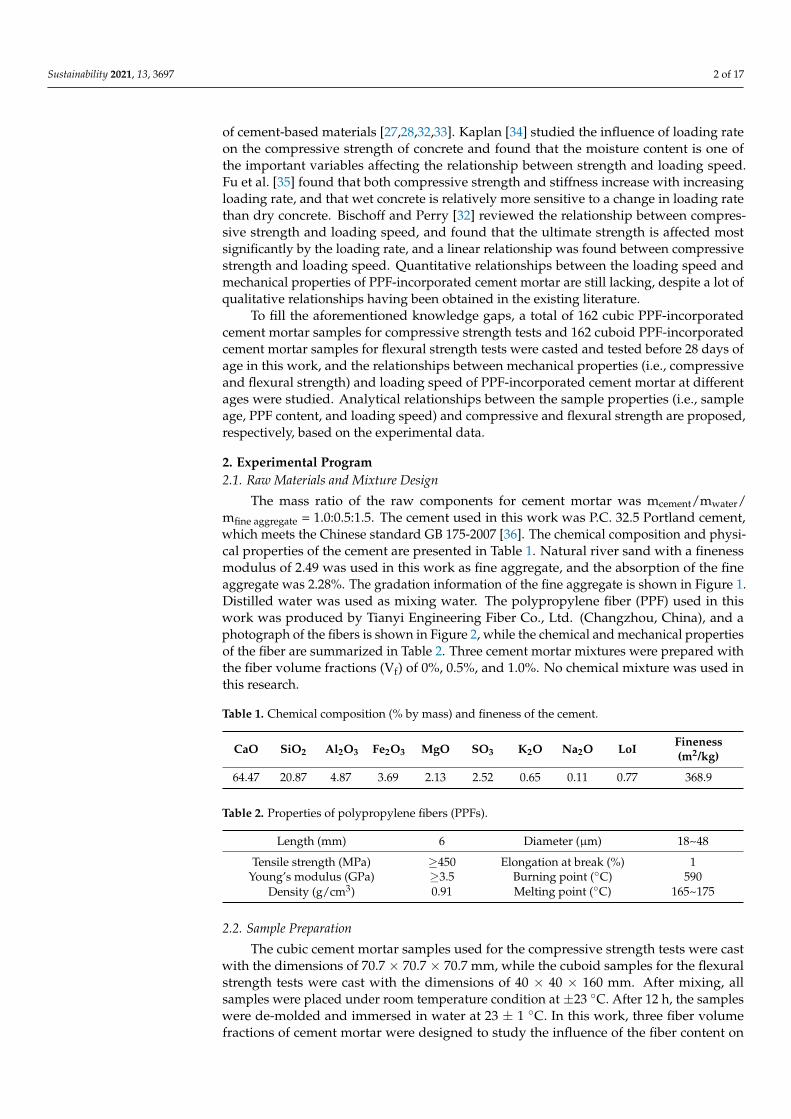
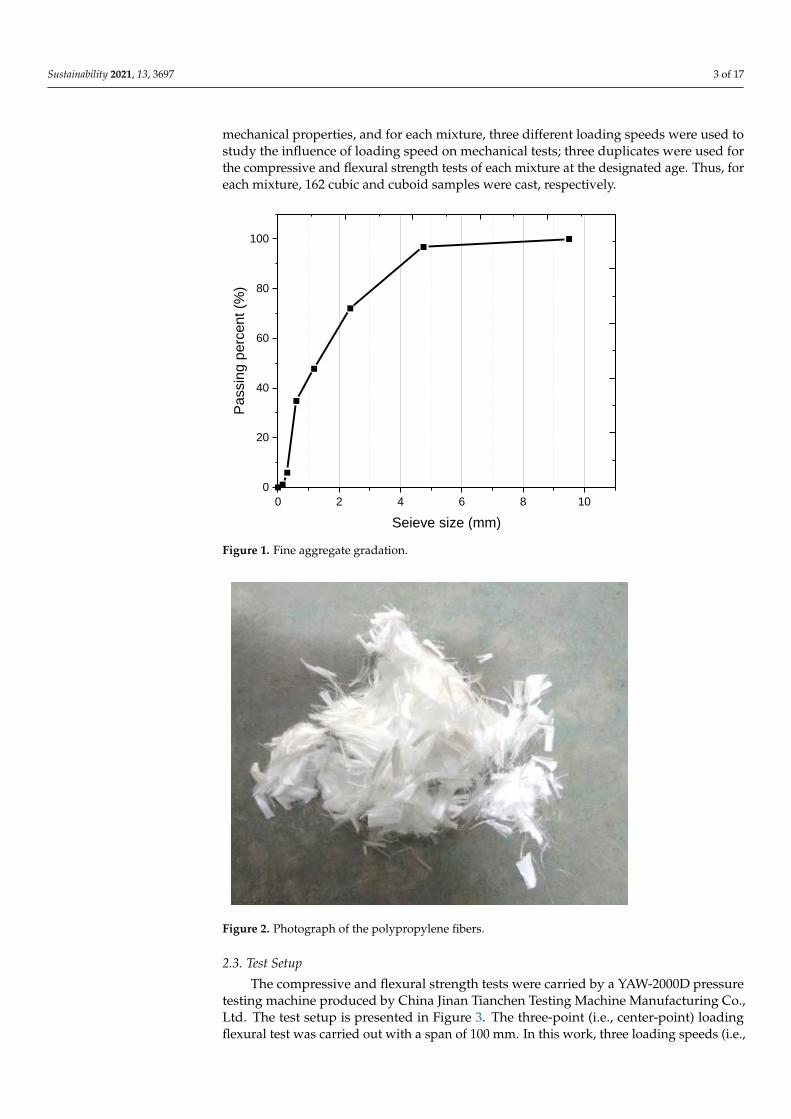
The mass ratio of the raw components for cement mortar was mcement/mwater/mfine aggregate = 1.0:0.5:1.5. The cement used in this work was P.C. 32.5 Portland cement,which meets the Chinese standard GB 175-2007 [36]. The chemical composition and physi-cal properties of the cement are presented in Table 1. Natural river sand with a finenessmodulus of 2.49 was used in this work as fine aggregate, and the absorption of the fineaggregate was 2.28%. The gradation information of the fine aggregate is shown in Figure 1.Distilled water was used as mixing water. The polypropylene fiber (PPF) used in thiswork was produced by Tianyi Engineering Fiber Co., Ltd. (Changzhou, China), and aphotograph of the fibers is shown in Figure 2, while the chemical and mechanical propertiesof the fiber are summarized in Table 2. Three cement mortar mixtures were prepared withthe fiber volume fractions (Vf) of 0%, 0.5%, and 1.0%. No chemical mixture was used inthis research.
Table 1. Chemical composition (% by mass) and fineness of the cement.
CaO SiO2 Al2O3 Fe2O3 MgO SO3 K2O Na2O LoI Fineness(m2/kg)
64.47 20.87 4.87 3.69 2.13 2.52 0.65 0.11 0.77 368.9
Table 2. Properties of polypropylene fibers (PPFs).
Length (mm) 6 Diameter (µm) 18~48
Tensile strength (MPa) ≥450 Elongation at break (%) 1Young’s modulus (GPa) ≥3.5 Burning point (◦C) 590
Density (g/cm3) 0.91 Melting point (◦C) 165~175
2.2. Sample Preparation
The cubic cement mortar samples used for the compressive strength tests were castwith the dimensions of 70.7 × 70.7 × 70.7 mm, while the cuboid samples for the flexuralstrength tests were cast with the dimensions of 40 × 40 × 160 mm. After mixing, allsamples were placed under room temperature condition at ±23 ◦C. After 12 h, the sampleswere de-molded and immersed in water at 23 ± 1 ◦C. In this work, three fiber volumefractions of cement mortar were designed to study the influence of the fiber content on
Sustainability 2021, 13, 3697 3 of 17
mechanical properties, and for each mixture, three different loading speeds were used tostudy the influence of loading speed on mechanical tests; three duplicates were used forthe compressive and flexural strength tests of each mixture at the designated age. Thus, foreach mixture, 162 cubic and cuboid samples were cast, respectively.
Sustainability 2021, 13, x FOR PEER REVIEW 3 of 17
Figure 1. Fine aggregate gradation.
Figure 2. Photograph of the polypropylene fibers.
2.2. Sample Preparation
The cubic cement mortar samples used for the compressive strength tests were cast
with the dimensions of 70.7 × 70.7 × 70.7 mm, while the cuboid samples for the flexural
strength tests were cast with the dimensions of 40 × 40 × 160 mm. After mixing, all samples
were placed under room temperature condition at ±23 °C. After 12 h, the samples were
de-molded and immersed in water at 23 ± 1 °C. In this work, three fiber volume fractions
of cement mortar were designed to study the influence of the fiber content on mechanical
properties, and for each mixture, three different loading speeds were used to study the
influence of loading speed on mechanical tests; three duplicates were used for the com-
pressive and flexural strength tests of each mixture at the designated age. Thus, for each
mixture, 162 cubic and cuboid samples were cast, respectively.
0 2 4 6 8 10
0
20
40
60
80
100P
assin
g p
erc
ent (%
)
Seieve size (mm)
Figure 1. Fine aggregate gradation.
Sustainability 2021, 13, x FOR PEER REVIEW 3 of 17
Figure 1. Fine aggregate gradation.
Figure 2. Photograph of the polypropylene fibers.
2.2. Sample Preparation
The cubic cement mortar samples used for the compressive strength tests were cast
with the dimensions of 70.7 × 70.7 × 70.7 mm, while the cuboid samples for the flexural
strength tests were cast with the dimensions of 40 × 40 × 160 mm. After mixing, all samples
were placed under room temperature condition at ±23 °C. After 12 h, the samples were
de-molded and immersed in water at 23 ± 1 °C. In this work, three fiber volume fractions
of cement mortar were designed to study the influence of the fiber content on mechanical
properties, and for each mixture, three different loading speeds were used to study the
influence of loading speed on mechanical tests; three duplicates were used for the com-
pressive and flexural strength tests of each mixture at the designated age. Thus, for each
mixture, 162 cubic and cuboid samples were cast, respectively.
0 2 4 6 8 10
0
20
40
60
80
100P
assin
g p
erc
ent (%
)
Seieve size (mm)
Figure 2. Photograph of the polypropylene fibers.
2.3. Test Setup
The compressive and flexural strength tests were carried by a YAW-2000D pressuretesting machine produced by China Jinan Tianchen Testing Machine Manufacturing Co.,Ltd. The test setup is presented in Figure 3. The three-point (i.e., center-point) loadingflexural test was carried out with a span of 100 mm. In this work, three loading speeds (i.e.,
Sustainability 2021, 13, 3697 4 of 17
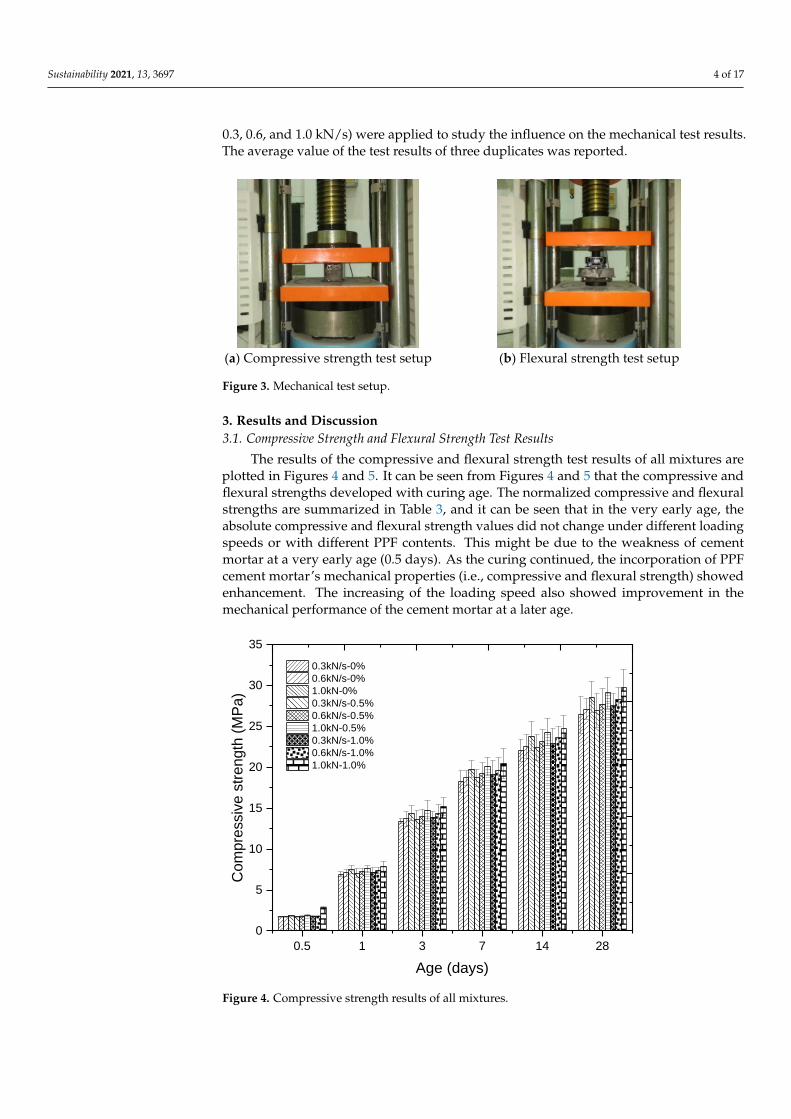
0.3, 0.6, and 1.0 kN/s) were applied to study the influence on the mechanical test results.The average value of the test results of three duplicates was reported.
Sustainability 2021, 13, x FOR PEER REVIEW 4 of 17
2.3. Test Setup
The compressive and flexural strength tests were carried by a YAW-2000D pressure
testing machine produced by China Jinan Tianchen Testing Machine Manufacturing Co.,
Ltd. The test setup is presented in Figure 3. The three-point (i.e., center-point) loading
flexural test was carried out with a span of 100 mm. In this work, three loading speeds
(i.e., 0.3, 0.6, and 1.0 kN/s) were applied to study the influence on the mechanical test
results. The average value of the test results of three duplicates was reported.
(a) Compressive strength test setup (b) Flexural strength test setup
Figure 3. Mechanical test setup.
3. Results and Discussion
3.1. Compressive Strength and Flexural Strength Test Results
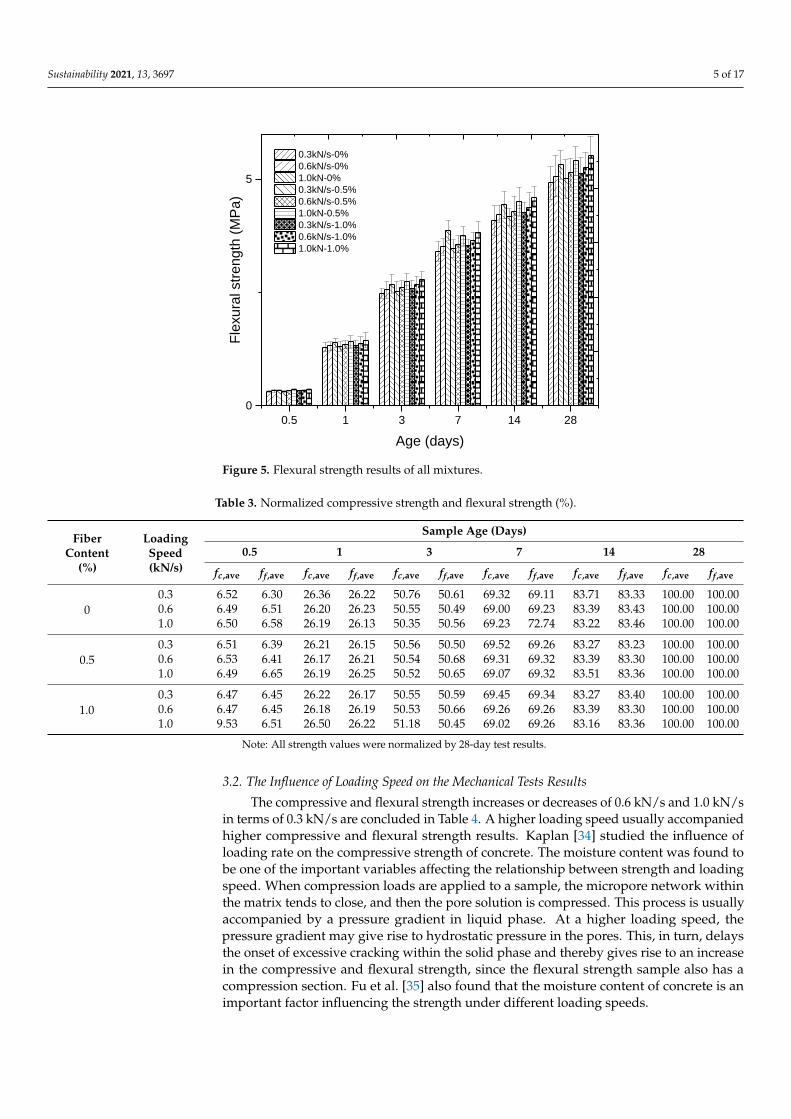
The results of the compressive and flexural strength test results of all mixtures are
plotted in Figures 4 and 5. It can be seen from Figures 4 and 5 that the compressive and
flexural strengths developed with curing age. The normalized compressive and flexural
strengths are summarized in Table 3, and it can be seen that in the very early age, the
absolute compressive and flexural strength values did not change under different loading
speeds or with different PPF contents. This might be due to the weakness of cement mor-
tar at a very early age (0.5 days). As the curing continued, the incorporation of PPF cement
mortar’s mechanical properties (i.e., compressive and flexural strength) showed enhance-
ment. The increasing of the loading speed also showed improvement in the mechanical
performance of the cement mortar at a later age.
Figure 4. Compressive strength results of all mixtures.
0.5 1 3 7 14 28
0
5
10
15
20
25
30
35
Co
mpre
ssiv
e s
tren
gth
(M
Pa)
Age (days)
0.3kN/s-0%
0.6kN/s-0%
1.0kN-0%
0.3kN/s-0.5%
0.6kN/s-0.5%
1.0kN-0.5%
0.3kN/s-1.0%
0.6kN/s-1.0%
1.0kN-1.0%
Figure 3. Mechanical test setup.
3. Results and Discussion3.1. Compressive Strength and Flexural Strength Test Results
The results of the compressive and flexural strength test results of all mixtures areplotted in Figures 4 and 5. It can be seen from Figures 4 and 5 that the compressive andflexural strengths developed with curing age. The normalized compressive and flexuralstrengths are summarized in Table 3, and it can be seen that in the very early age, theabsolute compressive and flexural strength values did not change under different loadingspeeds or with different PPF contents. This might be due to the weakness of cementmortar at a very early age (0.5 days). As the curing continued, the incorporation of PPFcement mortar’s mechanical properties (i.e., compressive and flexural strength) showedenhancement. The increasing of the loading speed also showed improvement in themechanical performance of the cement mortar at a later age.
Sustainability 2021, 13, x FOR PEER REVIEW 4 of 17
2.3. Test Setup
The compressive and flexural strength tests were carried by a YAW-2000D pressure
testing machine produced by China Jinan Tianchen Testing Machine Manufacturing Co.,
Ltd. The test setup is presented in Figure 3. The three-point (i.e., center-point) loading
flexural test was carried out with a span of 100 mm. In this work, three loading speeds
(i.e., 0.3, 0.6, and 1.0 kN/s) were applied to study the influence on the mechanical test
results. The average value of the test results of three duplicates was reported.
(a) Compressive strength test setup (b) Flexural strength test setup
Figure 3. Mechanical test setup.
3. Results and Discussion
3.1. Compressive Strength and Flexural Strength Test Results
The results of the compressive and flexural strength test results of all mixtures are
plotted in Figures 4 and 5. It can be seen from Figures 4 and 5 that the compressive and
flexural strengths developed with curing age. The normalized compressive and flexural
strengths are summarized in Table 3, and it can be seen that in the very early age, the
absolute compressive and flexural strength values did not change under different loading
speeds or with different PPF contents. This might be due to the weakness of cement mor-
tar at a very early age (0.5 days). As the curing continued, the incorporation of PPF cement
mortar’s mechanical properties (i.e., compressive and flexural strength) showed enhance-
ment. The increasing of the loading speed also showed improvement in the mechanical
performance of the cement mortar at a later age.
Figure 4. Compressive strength results of all mixtures.
0.5 1 3 7 14 28
0
5
10
15
20
25
30
35
Com
pre
ssiv
e s
trength
(M
Pa)
Age (days)
0.3kN/s-0%
0.6kN/s-0%
1.0kN-0%
0.3kN/s-0.5%
0.6kN/s-0.5%
1.0kN-0.5%
0.3kN/s-1.0%
0.6kN/s-1.0%
1.0kN-1.0%
Figure 4. Compressive strength results of all mixtures.
Sustainability 2021, 13, 3697 5 of 17Sustainability 2021, 13, x FOR PEER REVIEW 5 of 17
Figure 5. Flexural strength results of all mixtures.
Table 3. Normalized compressive strength and flexural strength (%).
Fiber
Content
(%)
Loading
Speed
(kN/s)
Sample Age (Days)
0.5 1 3 7 14 28
fc,ave ff,ave fc,ave ff,ave fc,ave ff,ave fc,ave ff,ave fc,ave ff,ave fc,ave ff,ave
0
0.3 6.52 6.30 26.36 26.22 50.76 50.61 69.32 69.11 83.71 83.33 100.00 100.00
0.6 6.49 6.51 26.20 26.23 50.55 50.49 69.00 69.23 83.39 83.43 100.00 100.00
1.0 6.50 6.58 26.19 26.13 50.35 50.56 69.23 72.74 83.22 83.46 100.00 100.00
0.5
0.3 6.51 6.39 26.21 26.15 50.56 50.50 69.52 69.26 83.27 83.23 100.00 100.00
0.6 6.53 6.41 26.17 26.21 50.54 50.68 69.31 69.32 83.39 83.30 100.00 100.00
1.0 6.49 6.65 26.19 26.25 50.52 50.65 69.07 69.32 83.51 83.36 100.00 100.00
1.0
0.3 6.47 6.45 26.22 26.17 50.55 50.59 69.45 69.34 83.27 83.40 100.00 100.00
0.6 6.47 6.45 26.18 26.19 50.53 50.66 69.26 69.26 83.39 83.30 100.00 100.00
1.0 9.53 6.51 26.50 26.22 51.18 50.45 69.02 69.26 83.16 83.36 100.00 100.00
Note: All strength values were normalized by 28-day test results.
3.2. The Influence of Loading Speed on the Mechanical Tests Results
The compressive and flexural strength increases or decreases of 0.6 kN/s and 1.0 kN/s
in terms of 0.3 kN/s are concluded in Table 4. A higher loading speed usually accompa-
nied higher compressive and flexural strength results. Kaplan [34] studied the influence
of loading rate on the compressive strength of concrete. The moisture content was found
to be one of the important variables affecting the relationship between strength and load-
ing speed. When compression loads are applied to a sample, the micropore network
within the matrix tends to close, and then the pore solution is compressed. This process is
usually accompanied by a pressure gradient in liquid phase. At a higher loading speed,
the pressure gradient may give rise to hydrostatic pressure in the pores. This, in turn,
delays the onset of excessive cracking within the solid phase and thereby gives rise to an
increase in the compressive and flexural strength, since the flexural strength sample also
has a compression section. Fu et al. [35] also found that the moisture content of concrete
is an important factor influencing the strength under different loading speeds.
0.5 1 3 7 14 28
0
5
Fle
xura
l str
ength
(M
Pa)
Age (days)
0.3kN/s-0%
0.6kN/s-0%
1.0kN-0%
0.3kN/s-0.5%
0.6kN/s-0.5%
1.0kN-0.5%
0.3kN/s-1.0%
0.6kN/s-1.0%
1.0kN-1.0%
Figure 5. Flexural strength results of all mixtures.
Table 3. Normalized compressive strength and flexural strength (%).
FiberContent
(%)
LoadingSpeed(kN/s)
Sample Age (Days)
0.5 1 3 7 14 28
fc,ave ff,ave fc,ave ff,ave fc,ave ff,ave fc,ave ff,ave fc,ave ff,ave fc,ave ff,ave
00.3 6.52 6.30 26.36 26.22 50.76 50.61 69.32 69.11 83.71 83.33 100.00 100.000.6 6.49 6.51 26.20 26.23 50.55 50.49 69.00 69.23 83.39 83.43 100.00 100.001.0 6.50 6.58 26.19 26.13 50.35 50.56 69.23 72.74 83.22 83.46 100.00 100.00
0.50.3 6.51 6.39 26.21 26.15 50.56 50.50 69.52 69.26 83.27 83.23 100.00 100.000.6 6.53 6.41 26.17 26.21 50.54 50.68 69.31 69.32 83.39 83.30 100.00 100.001.0 6.49 6.65 26.19 26.25 50.52 50.65 69.07 69.32 83.51 83.36 100.00 100.00
1.00.3 6.47 6.45 26.22 26.17 50.55 50.59 69.45 69.34 83.27 83.40 100.00 100.000.6 6.47 6.45 26.18 26.19 50.53 50.66 69.26 69.26 83.39 83.30 100.00 100.001.0 9.53 6.51 26.50 26.22 51.18 50.45 69.02 69.26 83.16 83.36 100.00 100.00
Note: All strength values were normalized by 28-day test results.
3.2. The Influence of Loading Speed on the Mechanical Tests Results
The compressive and flexural strength increases or decreases of 0.6 kN/s and 1.0 kN/sin terms of 0.3 kN/s are concluded in Table 4. A higher loading speed usually accompaniedhigher compressive and flexural strength results. Kaplan [34] studied the influence ofloading rate on the compressive strength of concrete. The moisture content was found tobe one of the important variables affecting the relationship between strength and loadingspeed. When compression loads are applied to a sample, the micropore network withinthe matrix tends to close, and then the pore solution is compressed. This process is usuallyaccompanied by a pressure gradient in liquid phase. At a higher loading speed, thepressure gradient may give rise to hydrostatic pressure in the pores. This, in turn, delaysthe onset of excessive cracking within the solid phase and thereby gives rise to an increasein the compressive and flexural strength, since the flexural strength sample also has acompression section. Fu et al. [35] also found that the moisture content of concrete is animportant factor influencing the strength under different loading speeds.
Sustainability 2021, 13, 3697 6 of 17
Table 4. Compressive and flexural strength % increase or % decrease in terms of loading speed.
FiberContent
(%)
LoadingSpeed(kN/s)
Sample Age (Days)
0.5 1 3 7 14 28
fc ff fc ff fc ff fc ff fc ff fc ff
00.6 2.33 6.45 2.01 3.10 2.24 2.81 2.19 3.24 2.26 3.17 2.65 3.051.0 8.14 12.90 7.61 7.75 7.46 8.03 8.20 13.82 7.69 8.29 8.33 8.13
0.50.6 3.43 3.13 2.84 3.05 2.94 3.16 2.67 2.88 3.13 2.88 2.97 2.791.0 8.00 12.50 8.09 8.40 8.09 8.30 7.49 8.07 8.48 8.15 8.18 7.98
1.00.6 2.81 3.03 2.77 2.99 2.88 3.09 2.62 2.82 3.06 2.81 2.91 2.931.0 58.99 9.09 9.15 8.21 9.35 7.72 7.33 7.89 7.86 7.96 8.00 8.01
3.3. The Influence of PPF Content on the Mechanical Test Results
The compressive and flexural strength increases or decreases of PPF mortar in termsof plain mortar are concluded in Table 5. It can be seen from Table 5 that the compressivestrength of the PPF mortar was higher than the plain mortar of the same age and loadingspeed. The improvement in compressive strength came principally from the fibers interact-ing with the advancing cracks [37]. When withstanding an increasing compression load,fibrous mortar samples might develop lateral tension, thus initiating microcracks, andthen these microcracks could advance into macrocracks. As the advancing microcracksapproached a fiber, debonding at the fiber–matrix interface began due to the tensile stressesperpendicular to the expected path of the advancing crack. When the advancing microc-racks finally reached the fiber–matrix interface, the tip of the crack encountered a process ofblunting because of the already presented debonding cracks. The blunting process reducedthe crack-tip stress concentration, thus blocking the forward propagation of the crack andeven diverting the path of the crack. The blunting, blocking, and even diverting of thecrack allowed the fibrous mortar samples to withstand additional compressive load, thusupgrading its compressive strength over the plain mortar samples.
Table 5. Compressive and flexural strength % increase or % decrease in terms of fiber content.
LoadingSpeed(kN/s)
FiberContent
(%)
Sample Age (Days)
0.5 1 3 7 14 28
fc ff fc ff fc ff fc ff fc ff fc ff
0.30.5 1.74 3.23 1.29 1.55 1.49 1.61 2.19 2.06 1.36 1.71 1.89 1.831.0 3.49 6.45 3.59 3.88 3.73 4.02 4.37 4.41 3.62 4.15 4.17 4.07
0.60.5 2.84 0.00 2.11 1.50 2.19 1.95 2.67 1.71 2.21 1.42 2.21 1.581.0 3.98 3.03 4.37 3.76 4.38 4.30 4.81 3.99 4.42 3.78 4.43 3.94
1.00.5 1.61 2.86 1.74 2.16 2.08 1.86 1.52 −3.10 2.10 1.58 1.75 1.691.0 52.15 2.86 5.07 4.32 5.56 3.72 3.54 −1.03 3.78 3.83 3.85 3.95
3.4. Analytical Model for the Compressive Strength Prediction of PPF Mortar under DifferentLoading Speeds
There are several available mathematical models that can be used to predict thecompressive strength development of cementitious materials with age, as concluded inTable 6.
The prediction models presented in Table 6 are based on the plain cementitiousmaterials without the addition of PPF. The error between the prediction models and thecompressive strength test results of plain cement mortar under a 0.3 kN/s loading speed inthis work is shown in Figure 6.
Sustainability 2021, 13, 3697 7 of 17
Table 6. Available time-dependent compressive strength prediction models.
Source Model
ACI 209 [38] ( fc)t( fc)28
= t4+0.85t
CEB-FIP [39] ( fc)t( fc)28
= exp(
0.25(
1 −√
28t
))GL 2000 [40] ( fc)t
( fc)28= t0.75
2.8+0.77t0.77
Note: In the models, (fc)t denotes the compressive strength under different ages, (fc)28 denotes the compressivestrength at 28 days of age, and t represents the sample age (days).
Sustainability 2021, 13, x FOR PEER REVIEW 7 of 17
CEB-FIP [39] ( )
( )28
28exp 0.25 1
c t
c
f
f t
= −
GL 2000 [40] ( )
( )
0.75
0.77
282.8 0.77
c t
c
f t
f t=
+
Note: In the models, (fc)t denotes the compressive strength under different ages, (fc)28 denotes the
compressive strength at 28 days of age, and t represents the sample age (days).
The prediction models presented in Table 6 are based on the plain cementitious ma-
terials without the addition of PPF. The error between the prediction models and the com-
pressive strength test results of plain cement mortar under a 0.3 kN/s loading speed in
this work is shown in Figure 6.
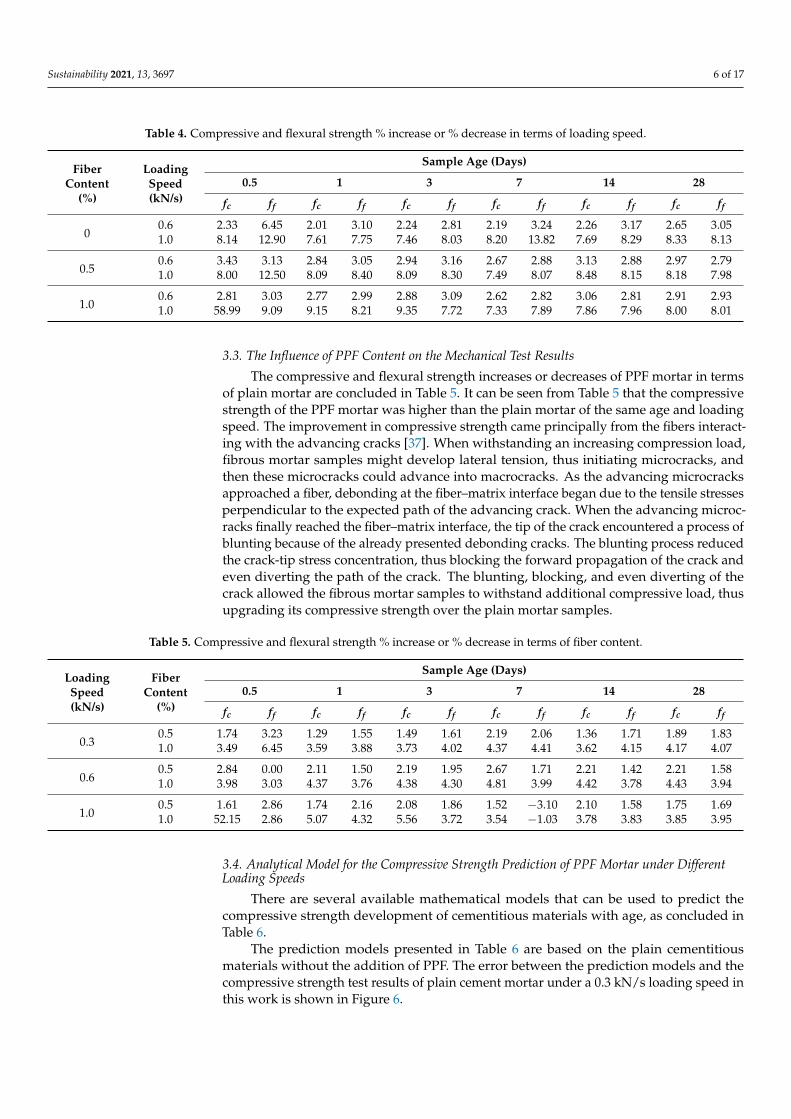
Figure 6. Prediction errors of the three existing models.
It can be seen from Figure 6 that the ACI 209 model provided the best prediction
results for plain cement mortar compressive strength. Thus, in this work, the proposed
prediction model for PPF mortar under different loading speeds was based on the ACI
209 model. A series of very good linear relationships between the fiber content and com-
pressive strength under a 0.3 kN/s loading speed can be observed in Figure 7, with all
fitting parameters (R2) being higher than 0.97. For the linear relationship between the fiber
content and compressive strength, the basic relationship can be summarized as:
( ) ( )1% 0%c cPPF PPFf k x f= + (1)
where (fc)%PPF denotes the compressive strength of different contents of PPF fiber, x de-
notes the PPF fiber content, k1 denotes the fitting parameter in terms of the fiber content’s
influence on compressive strength, and (fc)0%PPF denotes the compressive strength of plain
cement mortar.
Figure 6. Prediction errors of the three existing models.
It can be seen from Figure 6 that the ACI 209 model provided the best predictionresults for plain cement mortar compressive strength. Thus, in this work, the proposedprediction model for PPF mortar under different loading speeds was based on the ACI209 model. A series of very good linear relationships between the fiber content andcompressive strength under a 0.3 kN/s loading speed can be observed in Figure 7, with allfitting parameters (R2) being higher than 0.97. For the linear relationship between the fibercontent and compressive strength, the basic relationship can be summarized as:
( fc)%PPF = k1x + ( fc)0%PPF (1)
where (fc)%PPF denotes the compressive strength of different contents of PPF fiber, x denotesthe PPF fiber content, k1 denotes the fitting parameter in terms of the fiber content’sinfluence on compressive strength, and (fc)0%PPF denotes the compressive strength ofplain cement mortar.
Sustainability 2021, 13, 3697 8 of 17Sustainability 2021, 13, x FOR PEER REVIEW 8 of 17
0.0 0.2 0.4 0.6 0.8 1.0
0
5
10
15
20
25
30
0.5 d
1 d
3 d
7 d
14 d
28 d
Co
mpre
ssiv
e s
tren
gth
(M
Pa)
Fiber content (%)
y=1.11x+26.38 R2=0.9977
y=0.93x+22.08 R2=0.9787
y=0.80x+18.30 R2=0.9999
y=0.49x+13.40 R2=0.9957
y=0.24x+6.96 R2=0.9800
y=0.06x+1.72 R2=0.9999
Figure 7. Linear fitting of the fiber content’s influence on compressive strength.
In this work, the compressive strength of plain cement mortar under different ages
was predicted using the ACI 209 model. The relationship between the fiber content’s fit-
ting parameter k and the sample age is presented in Figure 8. Thus, the time-dependent
model for the PPF cement mortar compressive strength prediction model can be expressed
as:
( ) ( ),% 28,0%3.75 0.77 4 0.85
c ct PPF PPF
t tf x f
t t= +
+ + (2)
where (fc)t,%PPF denotes the compressive strength (MPa) of cement mortar at age t (days)
with x (%) content of PPF fiber, (fc)28,%PPF denotes the compressive strength (MPa) of cement
mortar at age 28 (days) with 0 (%) content of PPF fiber.
Figure 8. The relationship between the fiber content’s fitting parameter “k1” and sample age.
0 5 10 15 20 25 30
0.0
0.2
0.4
0.6
0.8
1.0
1.2
Fitting p
ara
mete
r "k
"
Sample age (d)
y=x/(3.75+0.77x)
R2=0.9924
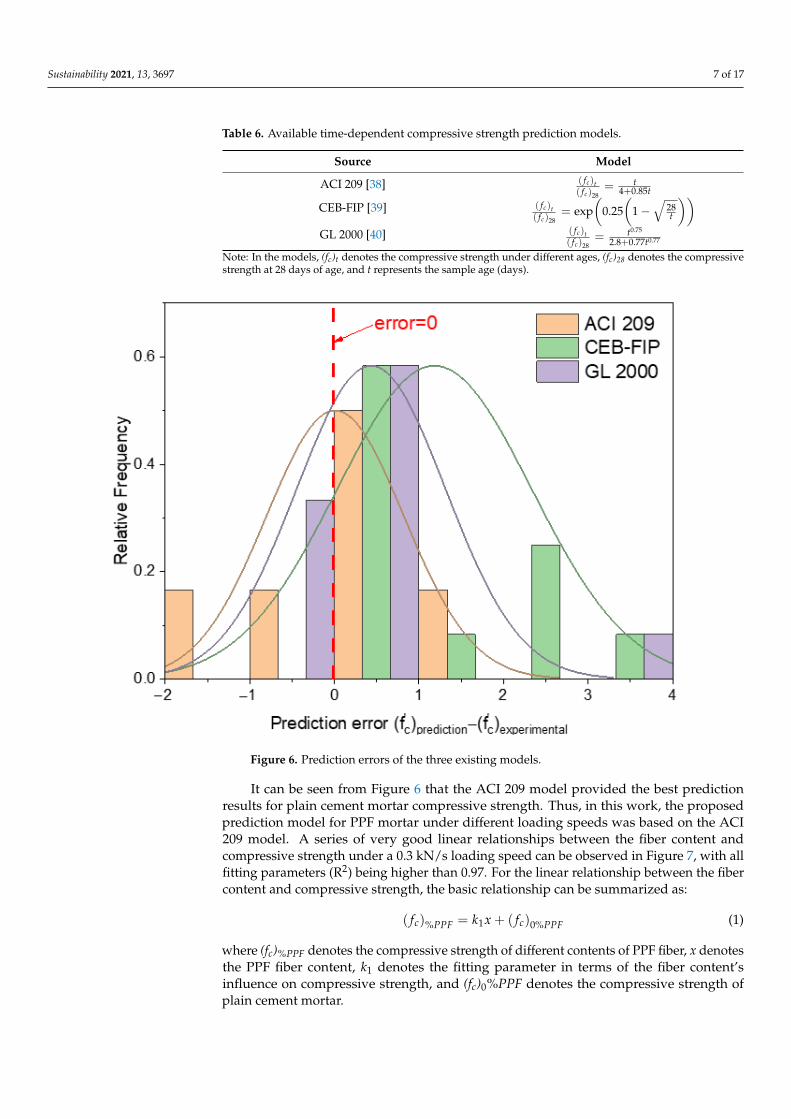
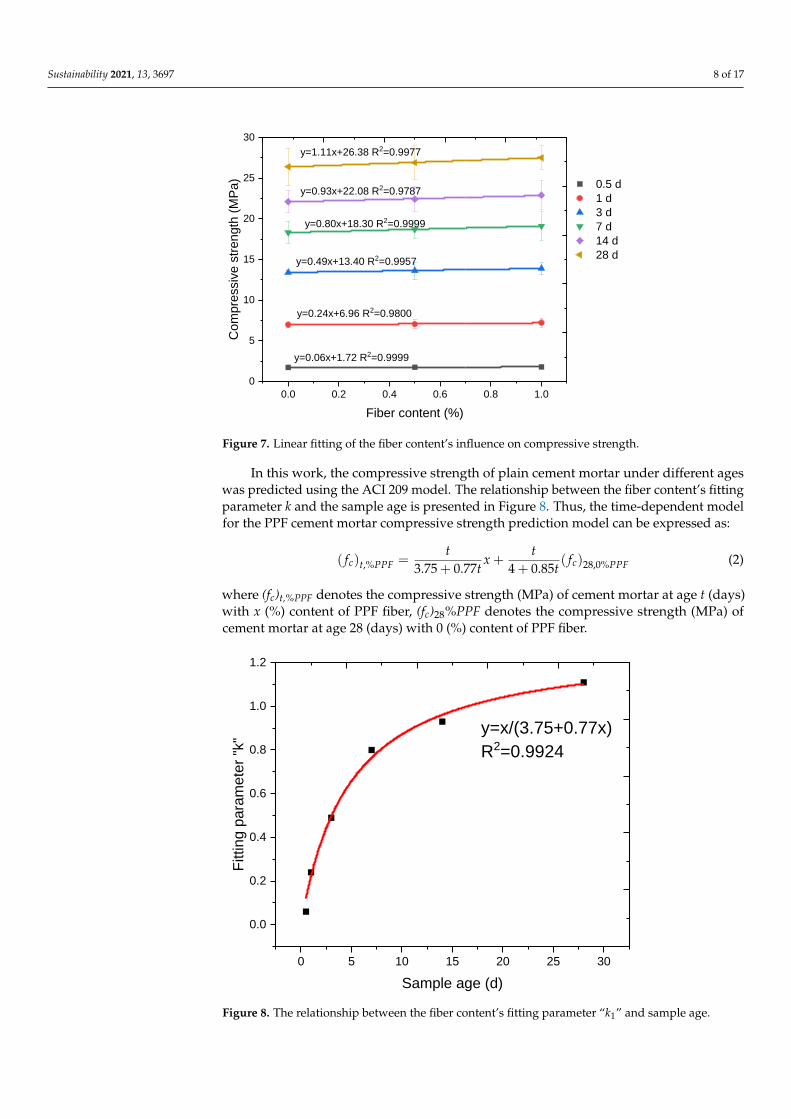
Figure 7. Linear fitting of the fiber content’s influence on compressive strength.
In this work, the compressive strength of plain cement mortar under different ageswas predicted using the ACI 209 model. The relationship between the fiber content’s fittingparameter k and the sample age is presented in Figure 8. Thus, the time-dependent modelfor the PPF cement mortar compressive strength prediction model can be expressed as:
( fc)t,%PPF =t
3.75 + 0.77tx +
t4 + 0.85t
( fc)28,0%PPF (2)
where (fc)t,%PPF denotes the compressive strength (MPa) of cement mortar at age t (days)with x (%) content of PPF fiber, (fc)28%PPF denotes the compressive strength (MPa) ofcement mortar at age 28 (days) with 0 (%) content of PPF fiber.
Sustainability 2021, 13, x FOR PEER REVIEW 8 of 17
0.0 0.2 0.4 0.6 0.8 1.0
0
5
10
15
20
25
30
0.5 d
1 d
3 d
7 d
14 d
28 dC
om
pre
ssiv
e s
tren
gth
(M
Pa)
Fiber content (%)
y=1.11x+26.38 R2=0.9977
y=0.93x+22.08 R2=0.9787
y=0.80x+18.30 R2=0.9999
y=0.49x+13.40 R2=0.9957
y=0.24x+6.96 R2=0.9800
y=0.06x+1.72 R2=0.9999
Figure 7. Linear fitting of the fiber content’s influence on compressive strength.
In this work, the compressive strength of plain cement mortar under different ages
was predicted using the ACI 209 model. The relationship between the fiber content’s fit-
ting parameter k and the sample age is presented in Figure 8. Thus, the time-dependent
model for the PPF cement mortar compressive strength prediction model can be expressed
as:
( ) ( ),% 28,0%3.75 0.77 4 0.85
c ct PPF PPF
t tf x f
t t= +
+ + (2)
where (fc)t,%PPF denotes the compressive strength (MPa) of cement mortar at age t (days)
with x (%) content of PPF fiber, (fc)28,%PPF denotes the compressive strength (MPa) of cement
mortar at age 28 (days) with 0 (%) content of PPF fiber.
Figure 8. The relationship between the fiber content’s fitting parameter “k1” and sample age.
0 5 10 15 20 25 30
0.0
0.2
0.4
0.6
0.8
1.0
1.2
Fitting p
ara
mete
r "k
"
Sample age (d)
y=x/(3.75+0.77x)
R2=0.9924
Figure 8. The relationship between the fiber content’s fitting parameter “k1” and sample age.

Sustainability 2021, 13, 3697 9 of 17
The relationship between the loading speed and compressive strength of plain cementmortar is summarized in Figure 9. A series of linear relationships could be obtained, withall linear fitting parameters (R2) being higher than 0.91. Similar to the influence of fibercontent, the time-dependent relationship of loading speed in terms of the compressivestrength’s linear fitting parameter “k2” and sample age are presented in Figure 10.
Sustainability 2021, 13, x FOR PEER REVIEW 9 of 17
The relationship between the loading speed and compressive strength of plain ce-
ment mortar is summarized in Figure 9. A series of linear relationships could be obtained,
with all linear fitting parameters (R2) being higher than 0.91. Similar to the influence of
fiber content, the time-dependent relationship of loading speed in terms of the compres-
sive strength’s linear fitting parameter “k2” and sample age are presented in Figure 10.
0.0 0.2 0.4 0.6 0.8 1.0
0
5
10
15
20
25
30
0.5 d
1 d
3 d
7 d
14 d
28 d
Co
mpre
ssiv
e s
tren
gth
(M
Pa)
Loading speed (kN/s)
y=2.28x+26.13 R2=0.9340
y=2.01x+22.01 R2=0.9392
y=1.58x+18.09 R2=0.9165
y=0.92x+13.39 R2=0.9649
y=0.50x+6.94 R2=0.9297
y=0.0.15x+1.71 R2=0.9382
Figure 9. Linear fitting of the loading speed’s influence on compressive strength.
Figure 10. The relationship between the loading speed’s fitting parameter “k2” and sample age.
Thus, the time-dependent model for PPF cement mortar compressive strength pre-
diction model under different loading speeds can be expressed as:
( ) ( ),% , / 28,0% ,0.3 /3.75 0.77 1.98 0.36 4 0.85
c ct PPF kN s PPF kN s
t t tf x y f
t t t= + +
+ + + (3)
where (fc)t,%PPF,kN/s denotes the compressive strength (MPa) of cement mortar at age t (days)
with x (%) content of PPF fiber and a test loading speed of y (kN/s), (fc)28,%PPF,0.3kN/s denotes
0 5 10 15 20 25 30
0.0
0.5
1.0
1.5
2.0
2.5
Fitting p
ara
mete
r "k
"
Sample age (d)
y=x/(1.98+0.36x)
R2=0.9951
Figure 9. Linear fitting of the loading speed’s influence on compressive strength.
Sustainability 2021, 13, x FOR PEER REVIEW 9 of 17
The relationship between the loading speed and compressive strength of plain ce-
ment mortar is summarized in Figure 9. A series of linear relationships could be obtained,
with all linear fitting parameters (R2) being higher than 0.91. Similar to the influence of
fiber content, the time-dependent relationship of loading speed in terms of the compres-
sive strength’s linear fitting parameter “k2” and sample age are presented in Figure 10.
0.0 0.2 0.4 0.6 0.8 1.0
0
5
10
15
20
25
30
0.5 d
1 d
3 d
7 d
14 d
28 d
Co
mpre
ssiv
e s
tren
gth
(M
Pa)
Loading speed (kN/s)
y=2.28x+26.13 R2=0.9340
y=2.01x+22.01 R2=0.9392
y=1.58x+18.09 R2=0.9165
y=0.92x+13.39 R2=0.9649
y=0.50x+6.94 R2=0.9297
y=0.0.15x+1.71 R2=0.9382
Figure 9. Linear fitting of the loading speed’s influence on compressive strength.
Figure 10. The relationship between the loading speed’s fitting parameter “k2” and sample age.
Thus, the time-dependent model for PPF cement mortar compressive strength pre-
diction model under different loading speeds can be expressed as:
( ) ( ),% , / 28,0% ,0.3 /3.75 0.77 1.98 0.36 4 0.85
c ct PPF kN s PPF kN s
t t tf x y f
t t t= + +
+ + + (3)
where (fc)t,%PPF,kN/s denotes the compressive strength (MPa) of cement mortar at age t (days)
with x (%) content of PPF fiber and a test loading speed of y (kN/s), (fc)28,%PPF,0.3kN/s denotes
0 5 10 15 20 25 30
0.0
0.5
1.0
1.5
2.0
2.5
Fitting p
ara
mete
r "k
"
Sample age (d)
y=x/(1.98+0.36x)
R2=0.9951
Figure 10. The relationship between the loading speed’s fitting parameter “k2” and sample age.
Thus, the time-dependent model for PPF cement mortar compressive strength predic-tion model under different loading speeds can be expressed as:
( fc)t,%PPF,kN/s =t
3.75 + 0.77tx +
t1.98 + 0.36t
y +t
4 + 0.85t( fc)28,0%PPF,0.3kN/s (3)
where (fc)t,%PPF,kN/s denotes the compressive strength (MPa) of cement mortar at age t (days)with x (%) content of PPF fiber and a test loading speed of y (kN/s), (fc)28,%PPF,0.3kN/s denotes
Sustainability 2021, 13, 3697 10 of 17
the compressive strength (MPa) of cement mortar at age 28 (days) with 0 (%) content ofPPF fiber under a test loading speed of 0.3 (kN/s).
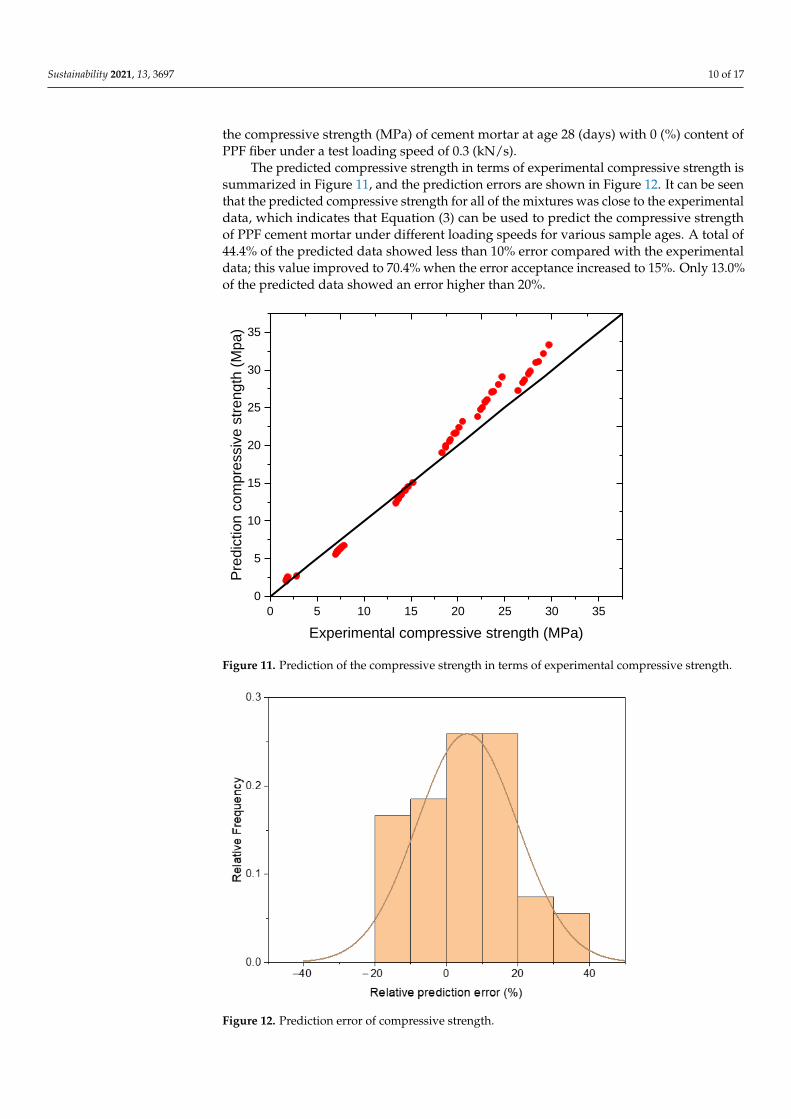
The predicted compressive strength in terms of experimental compressive strength issummarized in Figure 11, and the prediction errors are shown in Figure 12. It can be seenthat the predicted compressive strength for all of the mixtures was close to the experimentaldata, which indicates that Equation (3) can be used to predict the compressive strengthof PPF cement mortar under different loading speeds for various sample ages. A total of44.4% of the predicted data showed less than 10% error compared with the experimentaldata; this value improved to 70.4% when the error acceptance increased to 15%. Only 13.0%of the predicted data showed an error higher than 20%.
Sustainability 2021, 13, x FOR PEER REVIEW 10 of 17
the compressive strength (MPa) of cement mortar at age 28 (days) with 0 (%) content of
PPF fiber under a test loading speed of 0.3 (kN/s).
The predicted compressive strength in terms of experimental compressive strength
is summarized in Figure 11, and the prediction errors are shown in Figure 12. It can be
seen that the predicted compressive strength for all of the mixtures was close to the ex-
perimental data, which indicates that Equation (3) can be used to predict the compressive
strength of PPF cement mortar under different loading speeds for various sample ages. A
total of 44.4% of the predicted data showed less than 10% error compared with the exper-
imental data; this value improved to 70.4% when the error acceptance increased to 15%.
Only 13.0% of the predicted data showed an error higher than 20%.
Figure 11. Prediction of the compressive strength in terms of experimental compressive strength.
Figure 12. Prediction error of compressive strength.
0 5 10 15 20 25 30 35
0
5
10
15
20
25
30
35
Pre
dic
tion c
om
pre
ssiv
e s
trength
(M
pa)
Experimental compressive strength (MPa)
Figure 11. Prediction of the compressive strength in terms of experimental compressive strength.
Sustainability 2021, 13, x FOR PEER REVIEW 10 of 17
the compressive strength (MPa) of cement mortar at age 28 (days) with 0 (%) content of
PPF fiber under a test loading speed of 0.3 (kN/s).
The predicted compressive strength in terms of experimental compressive strength
is summarized in Figure 11, and the prediction errors are shown in Figure 12. It can be
seen that the predicted compressive strength for all of the mixtures was close to the ex-
perimental data, which indicates that Equation (3) can be used to predict the compressive
strength of PPF cement mortar under different loading speeds for various sample ages. A
total of 44.4% of the predicted data showed less than 10% error compared with the exper-
imental data; this value improved to 70.4% when the error acceptance increased to 15%.
Only 13.0% of the predicted data showed an error higher than 20%.
Figure 11. Prediction of the compressive strength in terms of experimental compressive strength.
Figure 12. Prediction error of compressive strength.
0 5 10 15 20 25 30 35
0
5
10
15
20
25
30
35
Pre
dic
tion c
om
pre
ssiv
e s
trength
(M
pa)
Experimental compressive strength (MPa)
Figure 12. Prediction error of compressive strength.
Sustainability 2021, 13, 3697 11 of 17
3.5. Analytical Model for Flexural Strength Prediction of PPF Mortar under DifferentLoading Speeds
Non-linear relationships between the cement mortar’s flexural strength and its inde-pendent variables (i.e., sample age, fiber content, and loading speed) can be performed bythe Vipulanandan correlation model [41,42] as follows:
Y =X
(A + B ∗ X)C (4)
where Y stands for the flexural strength of cement mortar; A, B, and C represent the modelparameters; X denotes the independent variables (i.e., sample age, fiber content, andloading speed).
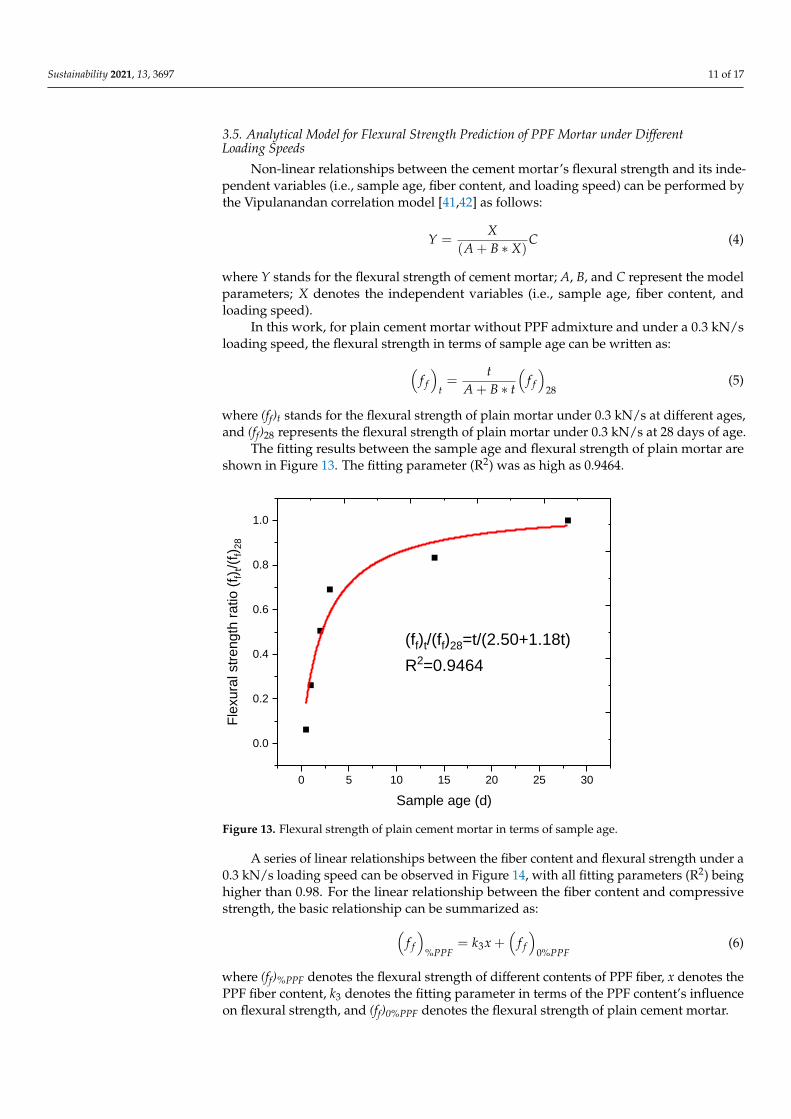
In this work, for plain cement mortar without PPF admixture and under a 0.3 kN/sloading speed, the flexural strength in terms of sample age can be written as:(
f f
)t=
tA + B ∗ t
(f f
)28
(5)
where (ff)t stands for the flexural strength of plain mortar under 0.3 kN/s at different ages,and (ff)28 represents the flexural strength of plain mortar under 0.3 kN/s at 28 days of age.
The fitting results between the sample age and flexural strength of plain mortar areshown in Figure 13. The fitting parameter (R2) was as high as 0.9464.
Sustainability 2021, 13, x FOR PEER REVIEW 11 of 17
3.5. Analytical Model for Flexural Strength Prediction of PPF Mortar under Different Loading
Speeds
Non-linear relationships between the cement mortar’s flexural strength and its inde-
pendent variables (i.e., sample age, fiber content, and loading speed) can be performed by
the Vipulanandan correlation model [41,42] as follows:
( )X
Y CA B X
=+
(4)
where Y stands for the flexural strength of cement mortar; A, B, and C represent the model
parameters; X denotes the independent variables (i.e., sample age, fiber content, and load-
ing speed).
In this work, for plain cement mortar without PPF admixture and under a 0.3 kN/s
loading speed, the flexural strength in terms of sample age can be written as:
( ) ( )28f ft
tf f
A B t=
+ (5)
where (ff)t stands for the flexural strength of plain mortar under 0.3 kN/s at different ages,
and (ff)28 represents the flexural strength of plain mortar under 0.3 kN/s at 28 days of age.
The fitting results between the sample age and flexural strength of plain mortar are
shown in Figure 13. The fitting parameter (R2) was as high as 0.9464.
Figure 13. Flexural strength of plain cement mortar in terms of sample age.
A series of linear relationships between the fiber content and flexural strength under
a 0.3 kN/s loading speed can be observed in Figure 14, with all fitting parameters (R2)
being higher than 0.98. For the linear relationship between the fiber content and compres-
sive strength, the basic relationship can be summarized as:
( ) ( )3% 0%f fPPF PPFf k x f= + (6)
where (ff)%PPF denotes the flexural strength of different contents of PPF fiber, x denotes the
PPF fiber content, k3 denotes the fitting parameter in terms of the PPF content’s influence
on flexural strength, and (ff)0%PPF denotes the flexural strength of plain cement mortar.
0 5 10 15 20 25 30
0.0
0.2
0.4
0.6
0.8
1.0
Fle
xura
l str
ength
ratio (
f f)t/(
f f)2
8
Sample age (d)
(ff)t/(ff)28=t/(2.50+1.18t)
R2=0.9464
Figure 13. Flexural strength of plain cement mortar in terms of sample age.
A series of linear relationships between the fiber content and flexural strength under a0.3 kN/s loading speed can be observed in Figure 14, with all fitting parameters (R2) beinghigher than 0.98. For the linear relationship between the fiber content and compressivestrength, the basic relationship can be summarized as:(
f f
)%PPF
= k3x +(
f f
)0%PPF
(6)
where (ff)%PPF denotes the flexural strength of different contents of PPF fiber, x denotes thePPF fiber content, k3 denotes the fitting parameter in terms of the PPF content’s influenceon flexural strength, and (ff)0%PPF denotes the flexural strength of plain cement mortar.
Sustainability 2021, 13, 3697 12 of 17Sustainability 2021, 13, x FOR PEER REVIEW 12 of 17
0.0 0.2 0.4 0.6 0.8 1.0
0
1
2
3
4
5
6
0.5 d
1 d
3 d
7 d
14 d
28 d
Fle
xu
ral str
eng
th (
MP
a)
Fiber content (%)
y=0.20x+4.92
R2=0.9973
y=0.18x+4.09
R2=0.9851
y=0.15x+3.40
R2=0.9988
y=0.10x+2.49
R2=0.9921
y=0.05x+1.29
R2=0.9858
y=0.02x+0.31
R2=0.9998
Figure 14. Linear fitting of the fiber content’s influence on flexural strength.
In this work, the flexural strength of plain cement mortar of different ages can be
described by the fitting relationship in Figure 13. The relationship between the fiber con-
tent’s fitting parameter k3 and sample age is presented in Figure 15. Thus, the time-de-
pendent model for the PPF cement mortar compressive strength prediction model can be
expressed as:
( ) ( ),% 28,0%16.70 4.37 2.50 1.18
f ft PPF PPF
t tf x f
t t= +
+ + (7)
where (ff)t,%PPF denotes the flexural strength (MPa) of cement mortar at age t (days) with x
(%) content of PPF fiber, and (ff)28,%PPF denotes the flexural strength (MPa) of cement mortar
at age 28 (day) with 0 (%) content of PPF fiber.
Figure 15. The relationship between the fiber content’s fitting parameter “k3” and sample age.
0 5 10 15 20 25 30
0.00
0.02
0.04
0.06
0.08
0.10
0.12
0.14
0.16
0.18
0.20
0.22
Fittin
g p
ara
mete
r "k
"
Sample age (d)
y=x/(16.70+4.37x)
R2=0.9979
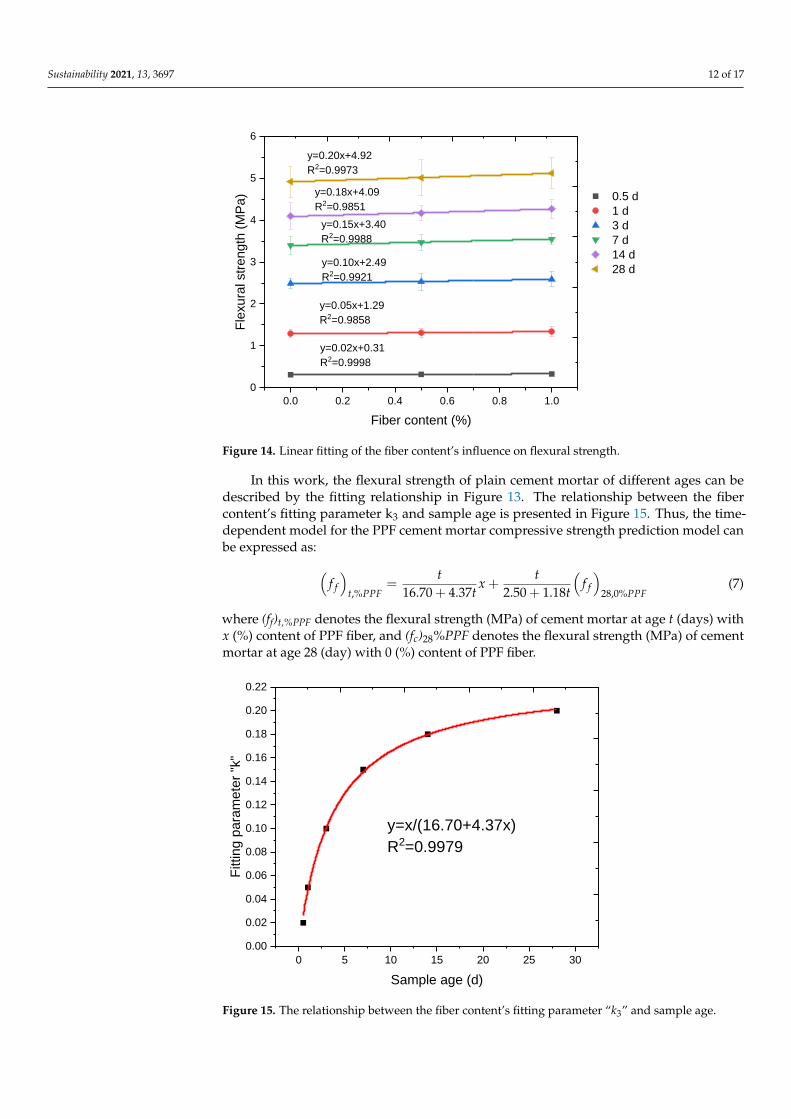
Figure 14. Linear fitting of the fiber content’s influence on flexural strength.
In this work, the flexural strength of plain cement mortar of different ages can bedescribed by the fitting relationship in Figure 13. The relationship between the fibercontent’s fitting parameter k3 and sample age is presented in Figure 15. Thus, the time-dependent model for the PPF cement mortar compressive strength prediction model canbe expressed as: (
f f
)t,%PPF
=t
16.70 + 4.37tx +
t2.50 + 1.18t
(f f
)28,0%PPF
(7)
where (ff)t,%PPF denotes the flexural strength (MPa) of cement mortar at age t (days) withx (%) content of PPF fiber, and (fc)28%PPF denotes the flexural strength (MPa) of cementmortar at age 28 (day) with 0 (%) content of PPF fiber.
Sustainability 2021, 13, x FOR PEER REVIEW 12 of 17
0.0 0.2 0.4 0.6 0.8 1.0
0
1
2
3
4
5
6
0.5 d
1 d
3 d
7 d
14 d
28 d
Fle
xu
ral str
eng
th (
MP
a)
Fiber content (%)
y=0.20x+4.92
R2=0.9973
y=0.18x+4.09
R2=0.9851
y=0.15x+3.40
R2=0.9988
y=0.10x+2.49
R2=0.9921
y=0.05x+1.29
R2=0.9858
y=0.02x+0.31
R2=0.9998
Figure 14. Linear fitting of the fiber content’s influence on flexural strength.
In this work, the flexural strength of plain cement mortar of different ages can be
described by the fitting relationship in Figure 13. The relationship between the fiber con-
tent’s fitting parameter k3 and sample age is presented in Figure 15. Thus, the time-de-
pendent model for the PPF cement mortar compressive strength prediction model can be
expressed as:
( ) ( ),% 28,0%16.70 4.37 2.50 1.18
f ft PPF PPF
t tf x f
t t= +
+ + (7)
where (ff)t,%PPF denotes the flexural strength (MPa) of cement mortar at age t (days) with x
(%) content of PPF fiber, and (ff)28,%PPF denotes the flexural strength (MPa) of cement mortar
at age 28 (day) with 0 (%) content of PPF fiber.
Figure 15. The relationship between the fiber content’s fitting parameter “k3” and sample age.
0 5 10 15 20 25 30
0.00
0.02
0.04
0.06
0.08
0.10
0.12
0.14
0.16
0.18
0.20
0.22
Fittin
g p
ara
mete
r "k
"
Sample age (d)
y=x/(16.70+4.37x)
R2=0.9979
Figure 15. The relationship between the fiber content’s fitting parameter “k3” and sample age.
Sustainability 2021, 13, 3697 13 of 17
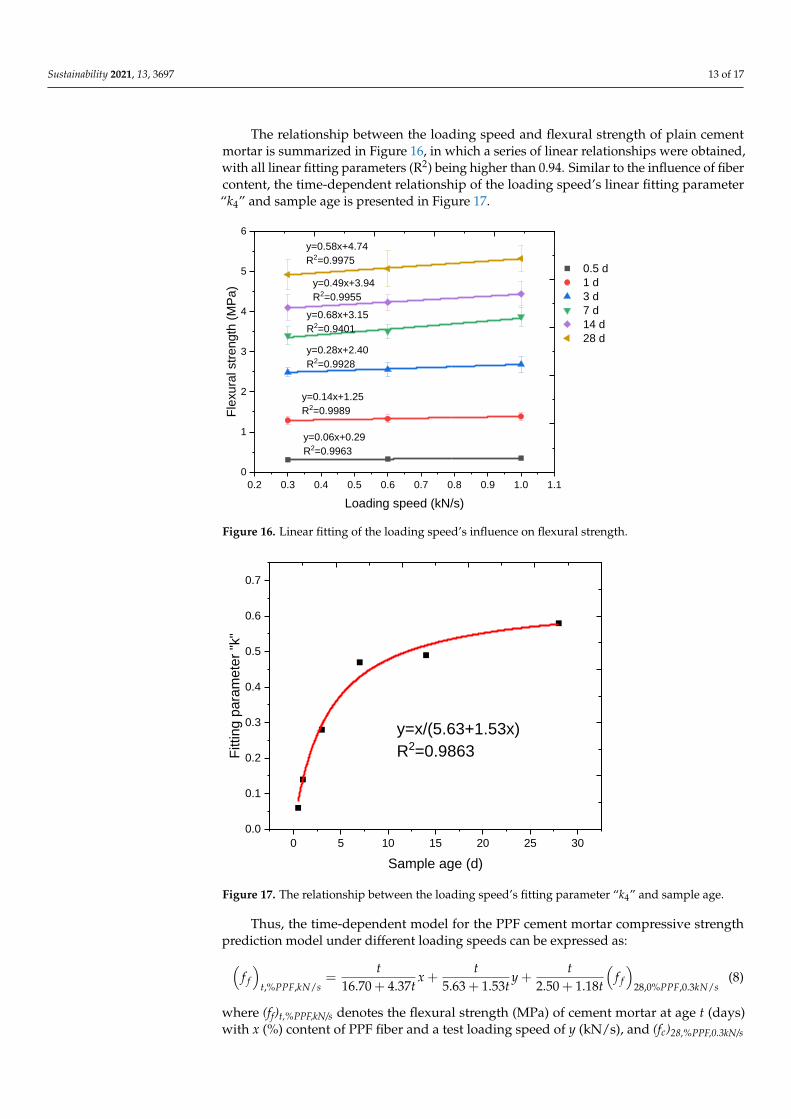
The relationship between the loading speed and flexural strength of plain cementmortar is summarized in Figure 16, in which a series of linear relationships were obtained,with all linear fitting parameters (R2) being higher than 0.94. Similar to the influence of fibercontent, the time-dependent relationship of the loading speed’s linear fitting parameter“k4” and sample age is presented in Figure 17.
Sustainability 2021, 13, x FOR PEER REVIEW 13 of 17
The relationship between the loading speed and flexural strength of plain cement
mortar is summarized in Figure 16, in which a series of linear relationships were obtained,
with all linear fitting parameters (R2) being higher than 0.94. Similar to the influence of
fiber content, the time-dependent relationship of the loading speed’s linear fitting param-
eter “k4” and sample age is presented in Figure 17.
0.2 0.3 0.4 0.5 0.6 0.7 0.8 0.9 1.0 1.1
0
1
2
3
4
5
6
0.5 d
1 d
3 d
7 d
14 d
28 d
Fle
xu
ral str
eng
th (
MP
a)
Loading speed (kN/s)
y=0.58x+4.74
R2=0.9975
y=0.49x+3.94
R2=0.9955
y=0.68x+3.15
R2=0.9401
y=0.28x+2.40
R2=0.9928
y=0.14x+1.25
R2=0.9989
y=0.06x+0.29
R2=0.9963
Figure 16. Linear fitting of the loading speed’s influence on flexural strength.
Figure 17. The relationship between the loading speed’s fitting parameter “k4” and sample age.
Thus, the time-dependent model for the PPF cement mortar compressive strength
prediction model under different loading speeds can be expressed as:
( ) ( ),% , / 28,0% ,0.3 /16.70 4.37 5.63 1.53 2.50 1.18
f ft PPF kN s PPF kN s
t t tf x y f
t t t= + +
+ + + (8)
where (ff)t,%PPF,kN/s denotes the flexural strength (MPa) of cement mortar at age t (days) with
x (%) content of PPF fiber and a test loading speed of y (kN/s), and (fc)28,%PPF,0.3kN/s denotes
0 5 10 15 20 25 30
0.0
0.1
0.2
0.3
0.4
0.5
0.6
0.7
Fittin
g p
ara
mete
r "k
"
Sample age (d)
y=x/(5.63+1.53x)
R2=0.9863
Figure 16. Linear fitting of the loading speed’s influence on flexural strength.
Sustainability 2021, 13, x FOR PEER REVIEW 13 of 17
The relationship between the loading speed and flexural strength of plain cement
mortar is summarized in Figure 16, in which a series of linear relationships were obtained,
with all linear fitting parameters (R2) being higher than 0.94. Similar to the influence of
fiber content, the time-dependent relationship of the loading speed’s linear fitting param-
eter “k4” and sample age is presented in Figure 17.
0.2 0.3 0.4 0.5 0.6 0.7 0.8 0.9 1.0 1.1
0
1
2
3
4
5
6
0.5 d
1 d
3 d
7 d
14 d
28 d
Fle
xu
ral str
eng
th (
MP
a)
Loading speed (kN/s)
y=0.58x+4.74
R2=0.9975
y=0.49x+3.94
R2=0.9955
y=0.68x+3.15
R2=0.9401
y=0.28x+2.40
R2=0.9928
y=0.14x+1.25
R2=0.9989
y=0.06x+0.29
R2=0.9963
Figure 16. Linear fitting of the loading speed’s influence on flexural strength.
Figure 17. The relationship between the loading speed’s fitting parameter “k4” and sample age.
Thus, the time-dependent model for the PPF cement mortar compressive strength
prediction model under different loading speeds can be expressed as:
( ) ( ),% , / 28,0% ,0.3 /16.70 4.37 5.63 1.53 2.50 1.18
f ft PPF kN s PPF kN s
t t tf x y f
t t t= + +
+ + + (8)
where (ff)t,%PPF,kN/s denotes the flexural strength (MPa) of cement mortar at age t (days) with
x (%) content of PPF fiber and a test loading speed of y (kN/s), and (fc)28,%PPF,0.3kN/s denotes
0 5 10 15 20 25 30
0.0
0.1
0.2
0.3
0.4
0.5
0.6
0.7
Fittin
g p
ara
mete
r "k
"
Sample age (d)
y=x/(5.63+1.53x)
R2=0.9863
Figure 17. The relationship between the loading speed’s fitting parameter “k4” and sample age.
Thus, the time-dependent model for the PPF cement mortar compressive strengthprediction model under different loading speeds can be expressed as:(
f f
)t,%PPF,kN/s
=t
16.70 + 4.37tx +
t5.63 + 1.53t
y +t
2.50 + 1.18t
(f f
)28,0%PPF,0.3kN/s
(8)
where (ff)t,%PPF,kN/s denotes the flexural strength (MPa) of cement mortar at age t (days)with x (%) content of PPF fiber and a test loading speed of y (kN/s), and (fc)28,%PPF,0.3kN/s
Sustainability 2021, 13, 3697 14 of 17
denotes the flexural strength (MPa) of cement mortar at age 28 (days) with 0 (%) content ofPPF fiber under a test loading speed of 0.3 (kN/s).
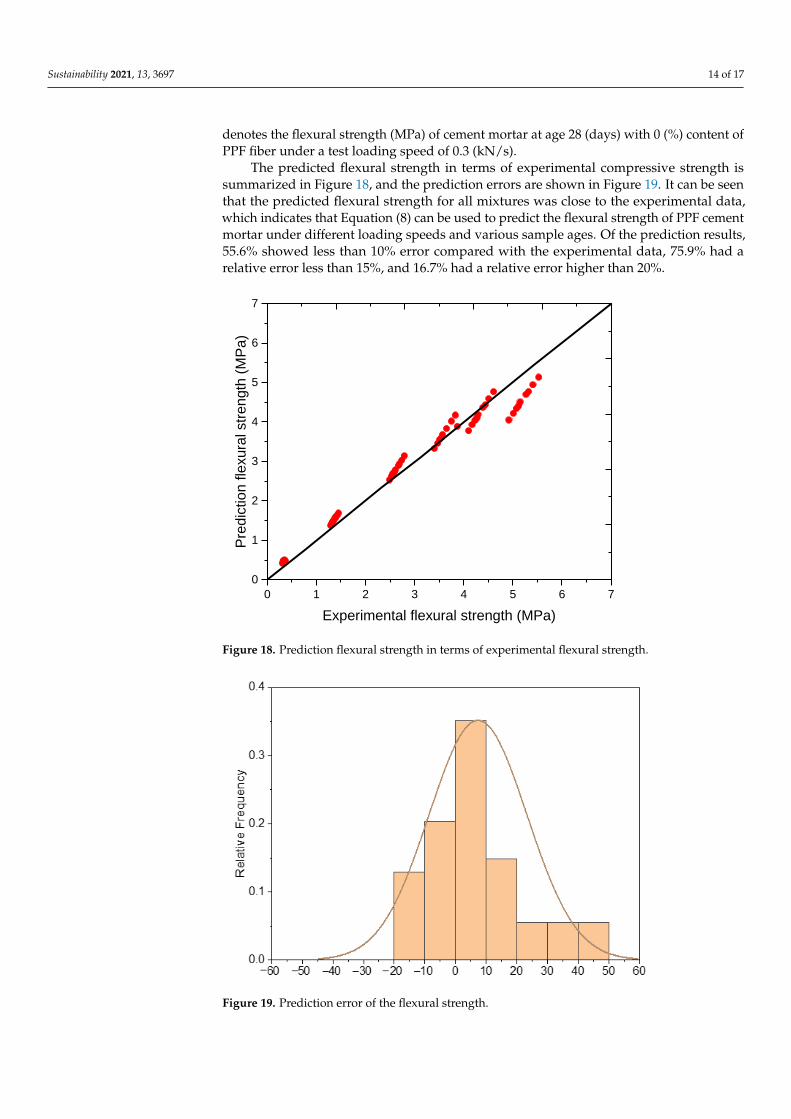
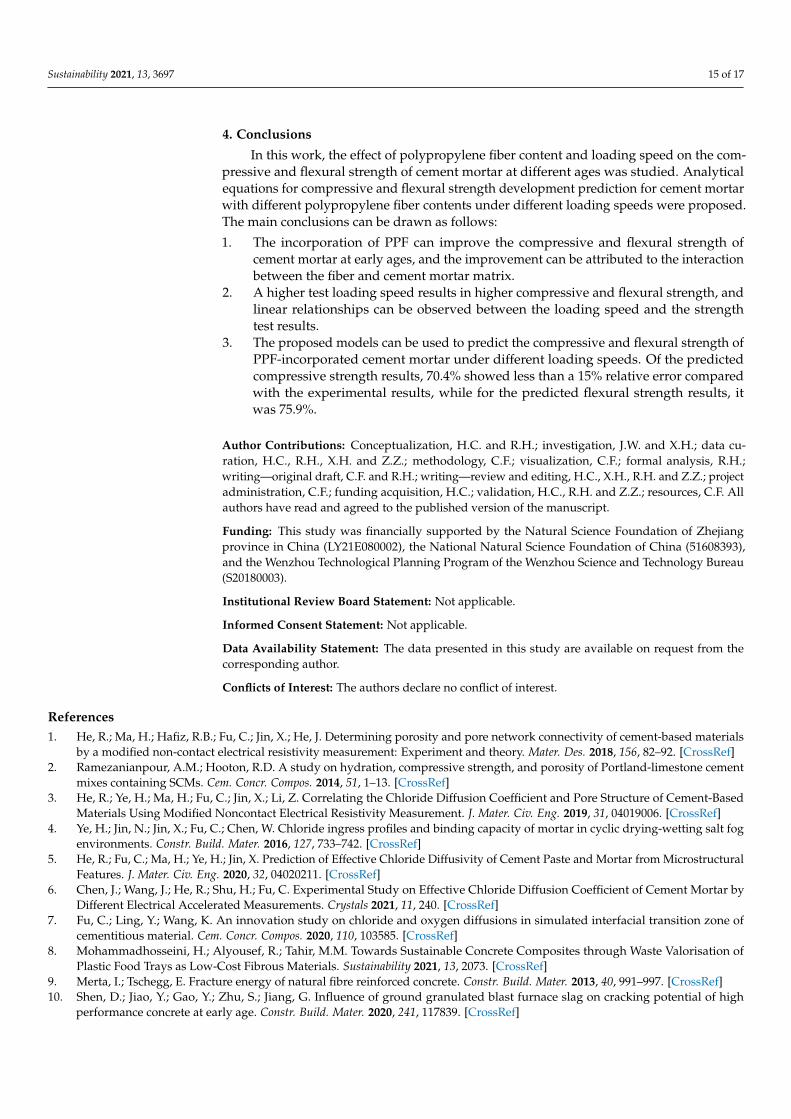
The predicted flexural strength in terms of experimental compressive strength issummarized in Figure 18, and the prediction errors are shown in Figure 19. It can be seenthat the predicted flexural strength for all mixtures was close to the experimental data,which indicates that Equation (8) can be used to predict the flexural strength of PPF cementmortar under different loading speeds and various sample ages. Of the prediction results,55.6% showed less than 10% error compared with the experimental data, 75.9% had arelative error less than 15%, and 16.7% had a relative error higher than 20%.
Sustainability 2021, 13, x FOR PEER REVIEW 14 of 17
the flexural strength (MPa) of cement mortar at age 28 (days) with 0 (%) content of PPF
fiber under a test loading speed of 0.3 (kN/s).
The predicted flexural strength in terms of experimental compressive strength is
summarized in Figure 18, and the prediction errors are shown in Figure 19. It can be seen
that the predicted flexural strength for all mixtures was close to the experimental data,
which indicates that Equation (8) can be used to predict the flexural strength of PPF ce-
ment mortar under different loading speeds and various sample ages. Of the prediction
results, 55.6% showed less than 10% error compared with the experimental data, 75.9%
had a relative error less than 15%, and 16.7% had a relative error higher than 20%.
Figure 18. Prediction flexural strength in terms of experimental flexural strength.
Figure 19. Prediction error of the flexural strength.
0 1 2 3 4 5 6 7
0
1
2
3
4
5
6
7
Pre
dic
tion fle
xura
l str
ength
(M
Pa)
Experimental flexural strength (MPa)
Figure 18. Prediction flexural strength in terms of experimental flexural strength.
Sustainability 2021, 13, x FOR PEER REVIEW 14 of 17
the flexural strength (MPa) of cement mortar at age 28 (days) with 0 (%) content of PPF
fiber under a test loading speed of 0.3 (kN/s).
The predicted flexural strength in terms of experimental compressive strength is
summarized in Figure 18, and the prediction errors are shown in Figure 19. It can be seen
that the predicted flexural strength for all mixtures was close to the experimental data,
which indicates that Equation (8) can be used to predict the flexural strength of PPF ce-
ment mortar under different loading speeds and various sample ages. Of the prediction
results, 55.6% showed less than 10% error compared with the experimental data, 75.9%
had a relative error less than 15%, and 16.7% had a relative error higher than 20%.
Figure 18. Prediction flexural strength in terms of experimental flexural strength.
Figure 19. Prediction error of the flexural strength.
0 1 2 3 4 5 6 7
0
1
2
3
4
5
6
7
Pre
dic
tion fle
xura
l str
ength
(M
Pa)
Experimental flexural strength (MPa)
Figure 19. Prediction error of the flexural strength.
Sustainability 2021, 13, 3697 15 of 17
4. Conclusions
In this work, the effect of polypropylene fiber content and loading speed on the com-pressive and flexural strength of cement mortar at different ages was studied. Analyticalequations for compressive and flexural strength development prediction for cement mortarwith different polypropylene fiber contents under different loading speeds were proposed.The main conclusions can be drawn as follows:
1. The incorporation of PPF can improve the compressive and flexural strength ofcement mortar at early ages, and the improvement can be attributed to the interactionbetween the fiber and cement mortar matrix.
2. A higher test loading speed results in higher compressive and flexural strength, andlinear relationships can be observed between the loading speed and the strengthtest results.
3. The proposed models can be used to predict the compressive and flexural strength ofPPF-incorporated cement mortar under different loading speeds. Of the predictedcompressive strength results, 70.4% showed less than a 15% relative error comparedwith the experimental results, while for the predicted flexural strength results, itwas 75.9%.
Author Contributions: Conceptualization, H.C. and R.H.; investigation, J.W. and X.H.; data cu-ration, H.C., R.H., X.H. and Z.Z.; methodology, C.F.; visualization, C.F.; formal analysis, R.H.;writing—original draft, C.F. and R.H.; writing—review and editing, H.C., X.H., R.H. and Z.Z.; projectadministration, C.F.; funding acquisition, H.C.; validation, H.C., R.H. and Z.Z.; resources, C.F. Allauthors have read and agreed to the published version of the manuscript.
Funding: This study was financially supported by the Natural Science Foundation of Zhejiangprovince in China (LY21E080002), the National Natural Science Foundation of China (51608393),and the Wenzhou Technological Planning Program of the Wenzhou Science and Technology Bureau(S20180003).
Institutional Review Board Statement: Not applicable.
Informed Consent Statement: Not applicable.
Data Availability Statement: The data presented in this study are available on request from thecorresponding author.
Conflicts of Interest: The authors declare no conflict of interest.
References1. He, R.; Ma, H.; Hafiz, R.B.; Fu, C.; Jin, X.; He, J. Determining porosity and pore network connectivity of cement-based materials
by a modified non-contact electrical resistivity measurement: Experiment and theory. Mater. Des. 2018, 156, 82–92. [CrossRef]2. Ramezanianpour, A.M.; Hooton, R.D. A study on hydration, compressive strength, and porosity of Portland-limestone cement
mixes containing SCMs. Cem. Concr. Compos. 2014, 51, 1–13. [CrossRef]3. He, R.; Ye, H.; Ma, H.; Fu, C.; Jin, X.; Li, Z. Correlating the Chloride Diffusion Coefficient and Pore Structure of Cement-Based
Materials Using Modified Noncontact Electrical Resistivity Measurement. J. Mater. Civ. Eng. 2019, 31, 04019006. [CrossRef]4. Ye, H.; Jin, N.; Jin, X.; Fu, C.; Chen, W. Chloride ingress profiles and binding capacity of mortar in cyclic drying-wetting salt fog
environments. Constr. Build. Mater. 2016, 127, 733–742. [CrossRef]5. He, R.; Fu, C.; Ma, H.; Ye, H.; Jin, X. Prediction of Effective Chloride Diffusivity of Cement Paste and Mortar from Microstructural
Features. J. Mater. Civ. Eng. 2020, 32, 04020211. [CrossRef]6. Chen, J.; Wang, J.; He, R.; Shu, H.; Fu, C. Experimental Study on Effective Chloride Diffusion Coefficient of Cement Mortar by
Different Electrical Accelerated Measurements. Crystals 2021, 11, 240. [CrossRef]7. Fu, C.; Ling, Y.; Wang, K. An innovation study on chloride and oxygen diffusions in simulated interfacial transition zone of
cementitious material. Cem. Concr. Compos. 2020, 110, 103585. [CrossRef]8. Mohammadhosseini, H.; Alyousef, R.; Tahir, M.M. Towards Sustainable Concrete Composites through Waste Valorisation of
Plastic Food Trays as Low-Cost Fibrous Materials. Sustainability 2021, 13, 2073. [CrossRef]9. Merta, I.; Tschegg, E. Fracture energy of natural fibre reinforced concrete. Constr. Build. Mater. 2013, 40, 991–997. [CrossRef]10. Shen, D.; Jiao, Y.; Gao, Y.; Zhu, S.; Jiang, G. Influence of ground granulated blast furnace slag on cracking potential of high
performance concrete at early age. Constr. Build. Mater. 2020, 241, 117839. [CrossRef]
Sustainability 2021, 13, 3697 16 of 17
11. Shen, D.; Liu, C.; Feng, Z.; Zhu, S.; Liang, C. Influence of ground granulated blast furnace slag on the early-age anti-crackingproperty of internally cured concrete. Constr. Build. Mater. 2019, 223, 233–243. [CrossRef]
12. Lehner, P.; Konecný, P.; Ponikiewski, T. Comparison of Material Properties of SCC Concrete with Steel Fibres Related to Ingress ofChlorides. Crystals 2020, 10, 220. [CrossRef]
13. Yew, M.K.; Bin Mahmud, H.; Shafigh, P.; Ang, B.C. Effects of polypropylene twisted bundle fibers on the mechanical properties ofhigh-strength oil palm shell lightweight concrete. Mater. Struct. 2015, 49, 1221–1233. [CrossRef]
14. Prescient & Strategic Intelligence, Polypropylene Market Research Report: By Type, Application, End Use—Global IndustryAnalysis and Demand Forecast to 2030, Global. 2020. Available online: https://www.researchandmarkets.com/reports/5184632/polypropylene-market-research-report-by-type?utm_source=CI&utm_medium=PressRelease&utm_code=6lvqdn&utm_campaign=1491061+-+Global+Polypropylene+Markets%2C+2019-2020+%26+2030+-+Increasing+Use+in+Packaging+Industry+%26+Growing+Nonwoven+Polypropylene+Fiber+Industry&utm_exec=chdo54prd (accessed on 24 March 2021).
15. Badogiannis, E.; Christidis, K.; Tzanetatos, G. Evaluation of the mechanical behavior of pumice lightweight concrete reinforcedwith steel and polypropylene fibers. Constr. Build. Mater. 2019, 196, 443–456. [CrossRef]
16. Wang, D.; Ju, Y.; Shen, H.; Xu, L. Mechanical properties of high performance concrete reinforced with basalt fiber and polypropy-lene fiber. Constr. Build. Mater. 2019, 197, 464–473. [CrossRef]
17. Mohseni, E.; Khotbehsara, M.M.; Naseri, F.; Monazami, M.; Sarker, P. Polypropylene fiber reinforced cement mortars containingrice husk ash and nano-alumina. Constr. Build. Mater. 2016, 111, 429–439. [CrossRef]
18. Turba, Y.; Solodkyy, S. Crack Resistance of Concretes Reinforced with Polypropylene Fiber. In Proceedings of the Lecture Notesin Civil Engineering; Metzler, J.B., Ed.; Springer: Cham, Switzerland, 2020; pp. 474–481.
19. Shen, D.; Liu, X.; Zeng, X.; Zhao, X.; Jiang, G. Effect of polypropylene plastic fibers length on cracking resistance of highperformance concrete at early age. Constr. Build. Mater. 2020, 244, 117874. [CrossRef]
20. Shen, D.; Liu, C.; Li, C.; Zhao, X.; Jiang, G. Influence of Barchip fiber length on early-age behavior and cracking resistance ofconcrete internally cured with super absorbent polymers. Constr. Build. Mater. 2019, 214, 219–231. [CrossRef]
21. Sachet, W.H.; Salman, W.D. Compressive Strength Development of Slag-Based Geopolymer Paste Reinforced with Fibers Curedat Ambient Condition. In Proceedings of IOP Conference Series: Materials Science and Engineering, Thi-Qar, Iraq, 15–16 July2020; 16 July 2020.
22. Guo, X.; Xiong, G. Resistance of fiber-reinforced fly ash-steel slag based geopolymer mortar to sulfate attack and drying-wettingcycles. Constr. Build. Mater. 2021, 269, 121326. [CrossRef]
23. Karahan, O.; Atis, C.D. The durability properties of polypropylene fiber reinforced fly ash concrete. Mater. Des. 2011, 32,1044–1049. [CrossRef]
24. Mohammadhosseini, H.; Alrshoudi, F.; Tahir, M.M.; Alyousef, R.; Alghamdi, H.; Alharbi, Y.R.; Alsaif, A. Performance evaluationof novel prepacked aggregate concrete reinforced with waste polypropylene fibers at elevated temperatures. Constr. Build. Mater.2020, 259, 120418. [CrossRef]
25. Nuaklong, P.; Boonchoo, N.; Jongvivatsakul, P.; Charinpanitkul, T.; Sukontasukkul, P. Hybrid effect of carbon nanotubesand polypropylene fibers on mechanical properties and fire resistance of cement mortar. Constr. Build. Mater. 2021, 275,122189. [CrossRef]
26. Medina, N.F.; Barluenga, G.; Hernández-Olivares, F. Enhancement of durability of concrete composites containing naturalpozzolans blended cement through the use of Polypropylene fibers. Compos. Part B Eng. 2014, 61, 214–221. [CrossRef]
27. Grote, D.; Park, S.; Zhou, M. Dynamic behavior of concrete at high strain rates and pressures: I. experimental characterization.Int. J. Impact Eng. 2001, 25, 869–886. [CrossRef]
28. Xu, Z.; Hao, H.; Li, H. Experimental study of dynamic compressive properties of fibre reinforced concrete material with differentfibres. Mater. Des. 2012, 33, 42–55. [CrossRef]
29. Zhang, M.; Wu, H.; Li, Q.; Huang, F. Further investigation on the dynamic compressive strength enhancement of concrete-likematerials based on split Hopkinson pressure bar tests. Part I: Experiments. Int. J. Impact Eng. 2009, 36, 1327–1334. [CrossRef]
30. Fischer, I.; Pichler, B.; Lach, E.; Terner, C.; Barraud, E.; Britz, F. Compressive strength of cement paste as a function of loading rate:Experiments and engineering mechanics analysis. Cem. Concr. Res. 2014, 58, 186–200. [CrossRef]
31. Abrams, D.A. Effect of rate of application of load on the compressive strength of concrete. Proceeding ASTM 1917, 17, 364–377.32. Bischoff, P.H.; Perry, S.H. Compressive behaviour of concrete at high strain rates. Mater. Struct. 1991, 24, 425–450. [CrossRef]33. Gary, G.; Bailly, P. Behaviour of quasi-brittle material at high strain rate. Experiment and modelling. Eur. J. Mech. A Solids 1998,
17, 403–420. [CrossRef]34. Kaplan, S.A. Factors affecting the relationship between rate of loading and measured compressive strength of concrete. Mag.
Concr. Res. 1980, 32, 79–88. [CrossRef]35. Fu, H.C.; Erki, M.A.; Seckin, M. Review of Effects of Loading Rate on Concrete in Compression. J. Struct. Eng. 1991, 117,
3645–3659. [CrossRef]36. GB 175-2007. Common Portland Cements, Chinese Natl. Stand. 2019. Available online: https://www.codeofchina.com/standard/
GB175-2007.html (accessed on 24 March 2021).37. Song, P.; Hwang, S.; Sheu, B. Strength properties of nylon- and polypropylene-fiber-reinforced concretes. Cem. Concr. Res. 2005,
35, 1546–1550. [CrossRef]

Sustainability 2021, 13, 3697 17 of 17
38. ACI Committee 209, Prediction of Creep, Shrinkage, and Temperature Effects in Concrete Structures (Reapproved 2008). 2002.Available online: https://www.concrete.org/store/productdetail.aspx?ItemID=20992&Format=DOWNLOAD&Language=English&Units=US_AND_METRIC (accessed on 24 March 2021).
39. Ceb-Fip Model Code 1990, 1993: Design Code; Telford: London, UK, 1993. [CrossRef]40. Design Provisions for Drying Shrinkage and Creep of Normal-Strength Concrete. ACI Mater. J. 2001, 98. [CrossRef]41. Vipulanandan, C.; Mohammed, A.S. Smart cement modified with iron oxide nanoparticles to enhance the piezoresistive behavior
and compressive strength for oil well applications. Smart Mater. Struct. 2015, 24, 125020. [CrossRef]42. Vipulanandan, C.; Mohammed, A. New Vipulanandan Failure Model and Property Correlations for Sandstone. Shale Limest.
Rocks 2018. [CrossRef]