measuring social value: - sussex research online
TRANSCRIPT
1
Measuring Social Value: Developing a national framework and applying
it to the Republic of Ireland (1994-2007)
Eilís Lawlor
Submitted for the Degree of Doctor of Philosophy
Department of Sociology
School of Law, Politics and Sociology
May 2017

2
I hereby declare that this thesis has not been and will not be, submitted in whole or in
part to another University for the award of any other degree.
Signature: .....................................................................................
3
Table of Contents
Abstract .................................................................................................................... 8
Chapter 1 Background and context ........................................................................ 9
1.0 Introduction ................................................................................................... 9
1.1 Progress, value and the good life ................................................................ 10
1.2 In defence of measurement ........................................................................ 14
1.3 GDP as a measure of social value .............................................................. 16
1.4 Developing an alternative measure of social value ..................................... 19
1.5 Research questions .................................................................................... 21
1.6 Contribution ................................................................................................ 22
1.6 Report structure .......................................................................................... 23
1.7 Conclusion .................................................................................................. 27
PART 1: DEVELOPING A CONCEPTUAL FRAMEWORK: CONTEXT, THEORY AND
METHOD ................................................................................................................. 29
Chapter 2 GDP measurement, alternatives and the need for this research ...... 29
2.0 Introduction ................................................................................................. 29
2.1 The Development of GDP ........................................................................... 29
2.2 Challenges to GDP ..................................................................................... 30
2.3 Alternatives to GDP .................................................................................... 35
2.4 The politics of measuring social value ......................................................... 44
2.5 Conclusion .................................................................................................. 45
Chapter 3 Theoretical framework: The theory of value ....................................... 47
3.0 Introduction ................................................................................................. 47
3.1 The history of the philosophy of well-being ................................................. 48
3.2 Modern theories of value ............................................................................ 52
3.3 Individual and collective notions of value: towards a conceptual framework 60
3.4 Conclusion .................................................................................................. 62
Chapter 4 Incorporating natural capital into the conceptual framework ........... 63
4.0 Introduction ................................................................................................. 63
4.1 Defining sustainability ................................................................................. 64
4.2 The substitutability of capital ....................................................................... 66
4.3 Discount rates ............................................................................................. 68
4.4 Intergenerational vs intragenerational inequality ......................................... 70
4.5 An environmental accounting framework .................................................... 73
4.6 Conclusion .................................................................................................. 75
Chapter 5 Methodology and indicators ................................................................ 76
5.0 Introduction ................................................................................................. 76
4
Section A: Epistemology and methodology .............................................................. 76
5.1 Combining the subjective and objective ...................................................... 76
5.2 Reflexivity ................................................................................................... 78
5.3 Research design ......................................................................................... 79
Section B: Identifying indicators - the determinants of well-being ............................. 86
5.4 The efficacy of well-being measurement ..................................................... 87
5.5 Macroeconomic determinants ..................................................................... 88
5.6 Social policy determinants .......................................................................... 92
5.7 Determinants in the personal sphere .......................................................... 96
5.8 Demographic determinants ......................................................................... 98
5.9 Developing the survey using the indicators ................................................. 99
5.10 Conclusion .............................................................................................. 101
PART 2: APPLYING THE CONCEPTUAL FRAMEWORK ................................... 103
Chapter 6 The economic and social context of Ireland ..................................... 103
6.0 Introduction ............................................................................................... 103
6.1 Nationalism, protection and self-sufficiency 1921- 1987 ............................ 104
6.2 The Irish Model (1992 – 1999) .................................................................. 106
6.3 Failures in the model................................................................................. 110
6.4 Why Ireland was chosen for testing the approach ..................................... 113
6.5 Conclusion ................................................................................................ 115
Chapter 7 Describing and operationalising the conceptual framework ........... 116
7.0 Introduction ............................................................................................... 116
7.1 Describing the conceptual framework ....................................................... 116
7.2 Operationalising the survey....................................................................... 123
7.3 Operationalising the social value index ..................................................... 127
7.4 Conclusion ................................................................................................ 128
Chapter 8 Findings from the survey and index development ........................... 130
8.0 Introduction ............................................................................................... 130
8.2 Findings from the survey ........................................................................... 130
8.3 Findings from the index development ....................................................... 158
8.4 Conclusion ................................................................................................ 167
Chapter 9 Testing the index: a focus on the Celtic Tiger .................................. 170
9.0 Introduction ............................................................................................... 170
9.1 Data quality ............................................................................................... 171
9.2 Mental health and well-being .................................................................... 171
9.3 Employment .............................................................................................. 179
9.4 Education .................................................................................................. 180
5
9.4 Physical health.......................................................................................... 181
9.6 Trust ......................................................................................................... 184
9.7 Social relationships ................................................................................... 185
9.8 Incomes, inequality and poverty ................................................................ 188
9.9 The environment ....................................................................................... 189
9.10 Conclusion .............................................................................................. 191
Chapter 10 Conclusion ........................................................................................ 192
10.0 Introduction ............................................................................................. 192
10.1 Chapter summary ................................................................................... 192
10.2 Reflecting on the ‘use’ of the framework ................................................. 196
10.3 The politics of data and accounting in national policymaking .................. 204
10.4 Caveats and lessons learned .................................................................. 207
10.5 Conclusion .............................................................................................. 210
Bibliography ......................................................................................................... 212
Appendices .......................................................................................................... 251
Appendix 1: Cross-sectional sample weights ......................................................... 251
Appendix 2: Results of independent t-tests with equal variances ........................... 256
Appendix 3: Codebook .......................................................................................... 257
Appendix 4: Stata Do File ...................................................................................... 258
Appendix 5: Survey ................................................................................................ 266
6
Table of figures
Figure 1.1: Report structure ..................................................................................... 23
Figure 2.1: Genuine Savings since 1976 ................................................................. 37
Figure 5.1: Ways to conceptualise and measure different kinds of outcomes .......... 78
Figure 5.2: Scope for policy influence in determinants of well-being ........................ 87
Figure 6.1: Irish GDP 1971- 2011 .......................................................................... 105
Figure 7.1: Constrained utilitarianism conceptual framework ................................ 117
Figure 8.1: Bar chart of household income ............................................................ 117
Figure 8.2: Net migration 1987-2013...................................................................... 138
Figure 8.3 Comparison of respondent’s perception of material things ................... 141
Figure 8.4: Comparison of respondent’s perception of family ................................. 142
Figure 8.5: Comparison of respondent’s perception of religion ............................... 142
Figure 8.6: Scree plot of eigenvalues ..................................................................... 159
Figure 9.1: Per capita GDP 1994-2014 .................................................................. 172
Figure 9.2: Psychological health in Ireland ............................................................. 173
Figure 9.3: Suicide rate in Ireland 1980-2002 ........................................................ 189
Figure 9.4: Satisfaction with aspects of life ............................................................ 179
Figure 9.5: Unemployment rate (% of the labour house) ........................................ 181
Figure 9.6: Combined reading, maths and science PISA scores for Ireland ........... 182
Figure 9.7: Change in health spending 1990-2001 ................................................. 183
Figure 9.8: Health Life Years 2002-2013 ............................................................... 183
Figure 9.9: Self-report on health status .................................................................. 183
Figure 9.10: Evolution of trust in political parties .................................................... 185
Figure 9.11: Percentage of people who have relative or friends they can count on 186
Figure 9.12: Social contact outside of the household ............................................. 187
Figure 9.13: Percentage of people at risk of poverty or social exclusion ................ 189
Table of tables
Table 8.1: Ordering of the means from the positive phrased questions .................. 131
Table 8.2: Ordering of the means from the negatively phrased questions .............. 134
Table 8.3: Crosstabulation of income and occupation ............................................ 137
Table 8.4: Chi Square results from positively phrased questions ........................... 147
Table 8.5: Chi Square results negatively phrased questions .................................. 148
Table 8.6: Cross-tabulation of being wealthy by gender ......................................... 149
Table 8.7: Mean responses to SWB questions ...................................................... 152
Table 8.8: Categorisation of materialist and non-materialist values ........................ 153
Table 8.9: Dependent Variable: How worthwhile do you consider your life to be? .. 154
Table 8.10: Dependent Variable; How satisfied are you with your life? .................. 155
Table 8.11: Dependent variable: How happy were you yesterday? ........................ 155
Table 8.12: Dependent Variable; How anxious were you yesterday? ..................... 157
Table 8.13: Proportion of variance accounted for in PCs with eigenvalues >1 ....... 160
Table 8.14: Summary of components .................................................................... 158
Table 8.15: Final list of indicators ........................................................................... 160
Table 9.1: Well-being data for Ireland .................................................................... 173
Table 9.2: Ranking of social capital measures ....................................................... 176
Table 9.3: Changes in values for social capital measures ...................................... 176
Table 9.4: Employment intensity of growth, comparing Ireland with EU ................. 180
7
List of acronyms
CS Competition State DS Developmental State ECB European Central Bank EFA Exploratory factor Analysis EFR Environmental Fiscal Reform EU European Union EU-SILC European Survey on Income and Living Conditions FDI Foreign Direct Investment FDS Flexible Developmental State GDP Gross Domestic Product GGD General Government Debt GNI Gross National Income GNP Gross National Product GS Genuine Savings HDI Human Development Index HYL health Life Years ICU interpersonal Comparisons of Utility ILO International Labour Organisation IMF International Monetary Fund ISEW index of Sustainable Economic Welfare NNI Net National Income NNP Net national Product OECD Organisation of Economic Cooperation and Development PCA Principle Component Analysis SWB Subjective Well-being
Acknowledgements
I would like to thank my supervisors for their guidance and support. I would especially
like to thank Dr. Catherine Will, Prof. Jo Moran-Ellis and Prof. Luke Martell for their
generosity with their time throughout. Thanks also to Dr. Stephen Spratt for comments
on the draft.
8
Abstract
This thesis develops a methodology to capture ‘social value’ in a national-level index.
Social value describes the individual and collective benefits derived from social,
economic and environmental goods and services. Gross Domestic Product (GDP) is
often treated as a proxy measure for social value (at least implicitly), and large parts of
policy are geared towards increasing it despite significant conceptual and
methodological flaws. Alternatives to GDP, including subjective well-being are reviewed
but none are found to provide an adequate framework for setting collective goals and
driving policy decisions to achieve those goals.
A conceptual framework – constrained utilitarianism – is developed. This is a hybrid of
the most appealing features of modern theories of value: objective list theory, hedonic
theory and desire theory. The framework combines people’s subjective preferences with
‘expert’ opinion on phenomena such as climate change, which people may not prioritise.
The framework is then applied to the Republic of Ireland. Subjective views of the things
people value are canvassed through an online survey of people resident in Ireland. Ten
outcome areas emerged from the research and appropriate national indicators were
identified. Due to the data limitations that individual researchers inevitably face, the
approach is not fully operationalised as an index, but illustrated through a comparison
with GDP in a dashboard format. The full methodology, however, is designed to be used
by national policymakers who would have, or could obtain, the data required to
operationalise the approach.
I highlight three key innovations. First, the conceptual framework provides a structure for
collectively agreeing goals, whilst constraining those choices subject to (for example)
scientific evidence. Second, I challenge the requirement for such indices to be
internationally comparable and make the case for more culturally-specific measures of
social value. Finally, I argue that a test of such an index is its relevance for policy i.e. that
it identifies changes that can improve the lives of citizens in a way that is transparent and
increases the accountability of policy-makers. I show through two worked examples –
mental health and the environment – how such an approach would lead to different
directions for policy. Several areas of future research are identified, including issues with
collation, ownership and use of data in the public sphere.
9
Chapter 1 Background and context
1.0 Introduction
In today’s age of hyper specialisation in academic subjects, it is difficult to imagine that
in ancient times, the distinctions between what we often see as widely divergent, even
competing subjects, were not perceived. As well as being the forefather of philosophy,
Aristotle wrote extensively across the natural sciences and on logic, politics and
mathematics. A central question motivating ancient philosophers was what constituted a
‘good life’ (Shields, 2016). It would be well over a millennium before the disciplines most
closely associated with answering that question today - economics, sociology,
psychology, anthropology and epidemiology would begin to emerge as distinct subjects.
With the decline of ancient Greece and the role of the philosopher, and the rise of
monotheistic religion came a decline in interest in this central question.1 It was not until
the Enlightenment when utilitarians became interested in what makes us happy and how
this could be promoted through policy that it saw something of a revival (Hausman,
2013). This philosophical movement was closely linked to the development of
economics, a subject that more than any other would go on to dominate our
understanding of value and how it intersects with policy. The notion of ‘utility’ - narrowly
defined as consumption – became a proxy for human welfare and the primary objective
of economic policy. This approach dominated in part because few alternatives were
being developed in other disciplines. As more varied approaches to economic
scholarship have emerged in the late 20th century, and as interdisciplinary approaches
have become more commonplace, there has been a manifold improvement in our
understanding of human happiness, which is reflected in the explosion of academic
research in recent decades (Greve, 2016).
I argue that well-being is a complex, multifaceted phenomenon that is best approached
from this holistic, interdisciplinary perspective. Whilst a grounding in philosophy and a
priori reasoning is a necessary first step, it is not in itself sufficient to answer what I
believe is at least partly an empirical question. I approach the subject from a social
science perspective and throughout the thesis I will explore ways in which the social
sciences can be used to identify pathways towards a better life for citizens and polices
to achieve this. I will do this by developing a theoretically defensible conceptual
1 Christian and Islamic philosophers did theorise about happiness (e.g. St. Augustine de Hippo in
the 4th century, Al Ghazali in the 12th century and St. Thomas Aquinas in the 13th century. However, the existence of God fundamentally alters the interpretation of ‘the good’ and monotheism marks a sharp break with Aristotelian tradition. Early modern philosophers that also discussed happiness/virtue were Kant and Montaigne.
10
framework for identifying the constituent elements of the good life. This is not just an
abstract exercise and the approach will be tested empirically by applying it to the
Republic of Ireland. This will enable me to assess the strengths and weaknesses of the
approach, as well as generate country-specific data on the things that people value and
implications for policy.
This chapter begins with a brief introduction the ideas of progress and value and how
these have developed over time. I will then make the case for the research that I am
doing and the contribution that it makes. I will conclude the chapter by setting out the
research questions and the structure for the rest of the thesis.
1.1 Progress, value and the good life
Ideas of progress have been a central part of the development of European society, or
what Bury calls the "animating and controlling idea [behind it]" (Bury, 1932 p. 2). There
is some debate as to whether the ancient philosophers had an idea of progress, but they
certainly did not understand it in the way later progress theorists would, and believed
that decline and fall were an inevitable part of society (Meek Lange, 2011). Nonetheless,
in The Republic, Plato created the first account of a utopian society in his depiction of
the ideal city of Kallipolis. The philosopher, being the most just and wise person is also
identified as the ideal ruler of the city (Brown, 2011). These philosopher-kings were
essentially highly trained benevolent dictators who would eliminate poverty and fairly
distribute resources.
The search for utopias continued throughout the centuries – in discussions of economics,
ecology, gender relations, sexuality, and political reform – pursued on both the right and
the left of modern politics. These discussions stem from discontent with the present and
offer visions of a better way to organise human life (Sargisson, 2012).
Utopian studies2 reached a high point in the 18th and 19th century. The Victorian period
in Britain was known as the Age of Reform due to the scale of social change and
profusion of reformers that were active in the period (Haggard, 2001). These reformers
saw social progress as a linear process where the tools of science could be used to solve
problems that arose because of the industrial revolution (ibid.). They were inspired by
Enlightenment philosophers such as Godwin and Condorcet who believed in the
‘perfectability’ of society. A feature of Enlightenment thinking was the belief in the use of
2 The term utopia was coined by Sir Thomas More in his philosophical novel of the same title
published 500 years ago (1516) where he describes an imaginary republic ruled by reason.
11
reason to promote better decision-making and to inform the masses of the benefits of
these policies.
There are many tangible achievements that can be traced to this reforming tradition. The
welfare state, for example, began with the Liberal welfare reforms in the early 20th
century and gender equality owes much to those that promoted women’s rights during
this time (Barker, 1984). As well as being a product of political philosophy these reforms
were influenced by knowledge and awareness generated by the documenting of
deprivation and injustice (ibid.). The mapping of poverty in London and York by Charles
Booth and Benjamin Rowntree respectively, helped change attitudes towards the causes
of poverty (Glennerster et al. 2004). They provided statistical evidence for the scale of
poverty but also demonstrated that most of the poor were working poor and that illness
and old age were greater causes of poverty than idleness or moral weakness. This is an
early example of the use of empirical data to counter prejudice and formulate more
effective and fairer policies. In a similar way, evidence on the contribution of women to
economic life during the World War 1 was one of the factors that helped to change deeply
entrenched views on voting rights and women’s ability to participate in the workforce.
Although there was opposition to the Enlightenment project in the 18th and 19th century
(Kuznar, 2008), after World War 2, many of its central ideas - the inevitability of human
progress, the idealisation of human happiness, positivism and the potential for reason to
address social conditions - fell completely out of favour in the social sciences (Boyne
and Rattansi, 1990). When Adorno and Horkheimer published Dialectic of Enlightenment
they declared that “enlightenment is totalitarian” and argued that the attempt to replace
revelation with reason had led directly to imperialism, two world wars and the horrors of
the Holocaust (1979 p.24). The epistemological shift associated with this period was
away from determinacy and certainty towards contingency and relativism (Susen, 2015).
Two of the primary critiques of Enlightenment thinking were of method/evaluation and
Western institutions and knowledge (Kuznar, 2008). Social progress, goal-directed
history and its measurement were also anathema to later postmodern philosophers that
rejected any notion of metanarratives or single frameworks (Eagleton, 1996).
Whilst, postmodernists wrote widely about culture, architecture, sociology, punishment
and psychology – and were highly influential in those disciplines - they had little to say
about economics. This developed quite a different epistemological tradition in the 20th
century and was mainly dominated by neoclassicism and neopositivism. Although there
was much to divide postmodernism from liberal economics, Marxist critics such as
Jameson (1984) and Harvey (1990) drew attention to the ways in which they converge:
championing of the individual, wariness of state power and collectivism and a mistrust of
12
regulation. Added to this, there is a shared belief that philosophical debate on the
meaning of the good society is largely irrelevant. Despite this, we could argue that liberal
economics has an implicit view of what constituted a good society. It is underpinned by
a market-based epistemology, where rational consumers armed with perfect information
maximise their utility in competitive markets. The sum of these decisions – aggregate
consumption, or Gross Domestic Product (GDP)3 – is considered a sufficient measure
of both quantity and quality. Many postmodernists strongly reject this view. Nonetheless,
it can be argued that the influence of postmodernism led to a side-lining of debates on
what constitutes the good life in other areas of social science, allowing a narrower, more
economistic view to become more influential than it might otherwise have been.
In practice, GDP growth is the closest approximation to a measure of progress that we
have today. Itay describes it as a byword for progress, being both the generator of
progress and the essence of what it is (Itay, 2009). Although GDP is simply the value of
goods and services being produced in an economy, to the casual observer it is infinitely
more important than that. GDP information runs through the institutions of our economy
and society, and can even on occasion determine the national mood by shaping how we
feel about our society and ourselves.
The appropriateness of this has been called into question in recent decades. Prior to the
2007 financial crisis, national governments, along with international institutions like the
Organisation for Economic Cooperation and Development (OECD) and the World Bank
had been investing resources into developing alternatives. For a time, it seemed as if
there was real momentum behind the search for alternatives that would rival GDP. Most
notably France established an independent commission led Joseph Stiglitz and Amartya
Sen to recommend an approach that would better reflect the social, economic and
environmental outcomes that people value (Stiglitz et al., 2009a). Similar projects were
underway in Britain, Canada, Italy and Australia. Alongside this, there was a growing
interest in measuring subjective well-being, as measured by life satisfaction, or feelings
of happiness. However, these projects were all sidelined by the crisis. Governments,
when faced with the task of boosting tax receipts and job creation, appear to have
abandoned even the most limited efforts to create parallel (not to mention alternative)
measures of progress. Although Canada and Britain produce annual updates of their
well-being indices, there is no evidence that these data are any threat to the role of GDP
i.e. there are few examples of binding policies influenced by this agenda (Allin and Hand,
3 For the purposes of this argument these can be treated as the same. However GDP also
includes other variables such as government spending and net exports.
13
2016). Indeed, there is no advanced economy where sidelining or replacing GDP is being
taken seriously.
The literature in this field is replete with critiques of GDP for its failure to capture
economic externalities such as climate change (see Section 1.3). Despite the strength
of counterarguments however, the role of GDP in our societies has not changed, and its
position following the crisis has, if anything, been strengthened. Given this, one of the
aims of the research is to critically engage with the assertion that GDP is an appropriate
indicator of social progress. Central to the study is a critique of the concept of value that
is implied in its measurement.
The idea of progress is extremely complex and has attracted criticism from many
quarters, some of which are more compelling than others. In the first instance, the
determinacy and certainty that underpinned the reforming zeal of the Victorians now
seems frightfully naïve. At the time, many would have assumed that by the 21st century,
the squalor, destitution and ignorance that they were railing against would be things of
the past. This was based on several mistaken beliefs. First, that progress was linear and
that positive reforms would build upon other positive reforms. Second, there was
(contrary to today) an overemphasis on structural forces as the root cause of social
problems as espoused in Marxist thinking. Third, the influence of positivism led to the
erroneous belief that measurement was a neutral activity and that more data could lead
to rational, apolitical decisions about how to improve social conditions. Finally, progress
theorists of the past may have lacked an understanding of the complexity of social
change and the multiplicity of causes of social problems.
A 21st century view of both progress and measurement is much more conditional,
cautious, nuanced, and realist. Some of the most irrefutable modern critiques of progress
come from anthropologists and environmentalists such as Jared Diamond (see
Diamond, 2005) and Ronald Wright (2005). Diamond and Wright use examples of
historical civilisations to show that change is non-linear and best explained by
environmental variables such as the availability of resources. Both leave open the
possibility of global collapse in the next 100 years due to poor group choices and
subsequent environmental impacts (Meek Lange, 2011). There is a recognition also of
the messiness and complexity of social change and that both the process and content
of measurement can be highly political. Whilst data can be informative it can also be
misleading, and that there are limits both to what can be measured and how useful that
measurement can be.
14
Due to the controversy surrounding the idea of ‘progress’, I do not believe it is possible
to rehabilitate it for use in this thesis. Instead I offer the concept of ‘social value’. In the
UK, this term is used quite narrowly to describe the impact of social programmes (see
Public Services Act, 2012). I employ it more widely. Like economic value, social value is
concerned with resource allocation (not just those that are scarce) but also the impact
that those resources have on individual and collective outcomes. In the case of a nation
state, this is about how the collective economic and non-economic resources of the
country are used to maximise the welfare/well-being of citizens. These, and other
cognates of well-being are other terms that could have been used. However, these over-
emphasise the importance of subjective perceptions of value. As we will see later in this
thesis, the intention is to combine both the subjective and objective, and social value is
a suitably neutral term in that regard. In the literature, the terms happiness, well-being,
value, utility and welfare are often used interchangeably. However, although some such
as well-being can be used loosely, others, such as happiness have quite specific
meanings. For clarity, I will apply them only in their ‘technical’ usage e.g. when I use the
term happiness, it will refer to pleasure, contentment or the state of being happy. The
term social value, it is a catch-all label that will incorporates elements of all those terms
listed above, and I use it in a bespoke way to describe the concept that this thesis is
trying to operationalise and measure.
After decades of highs and lows in many attempts to measure social progress, most
social scientists are sceptical about the utopian visions, or even the desirability of trying
to articulate what that might look like. We have learned that one person’s utopia might
be another’s dystopia and that it is certainly not in the gift of policymakers to tell us what
that should be. Nonetheless, I reject the notion that this means we should eschew all
measurement. Instead, I make the case for the value of collectively identifying what a
better future might look like, how we might know it when we get there and what kinds of
changes we would need to make to have any chance of reaching it.
In the next section, I make a case for the setting and measuring of such collective goals
and why this should be considered a legitimate and important area of social research.
1.2 In defence of measurement
Throughout this thesis, I argue that ‘the good life’ is something that can, and should, be
measured. However, it is possible to take contrary positions, not least regarding the
appropriateness of attempting to quantify something so intangible, and given the
subjective nature of the phenomenon. In Chapter 5, I reflect on the relationship between
objective and subjective measurement and argue that the distinctions are not as clear
15
as is sometimes assumed. I also reflect on the benefits of taking a mixed methods
approach and complementing the quantitative dataset developed here with qualitative
data. I explain why, for practical reasons it was not possible to do both as part of this
thesis but acknowledge that this would enhance it. This is therefore a quantitative thesis
informed by a neopositivist epistemological position. This standpoint is not without
controversy and in this section, I set out the reasons why I think measurement matters
and provide a defence for why the approach taken here is appropriate to answer the
question this question.
The first defence is that it provides incentives for behaviour and can therefore shape
desired outcomes. The earlier example of Booth's poverty mapping led directly to
awareness of the circumstances of the poor in London and measures to alleviate poverty
such as the introduction of the old age pension (Haggard, 2001). There are numerous
other examples throughout history. In recent times the Millennium Development Goals
have led – shortcomings notwithstanding - to a focus of resources on critical
development issues such as health and education (Fehling et al., 2013). By the same
token, if you measure the wrong things, you run the risk of focusing resources and
activities on things that are unimportant or even detrimental to social value. We could
argue that the roots of the 2007/8 financial crisis lay in part in inadequate or misleading
indicators being measured by central banks. In Ireland, for example, there were no
official sources of information on house prices during the property collapse, nor was there
a centralised source of information on mortgage arrears within the banking sector
(Kennedy and McIndoe-Calder, 2011).
A second reason is that it is impossible to imagine a system of accountability in public
life where measurement and aggregation of data does not play a role. If we accept that
at least in some areas of life resources are limited and decisions about allocation must
be made, then we need some basis for making those decisions that is transparent and
that avoids dogma, favouritism or corrupt practices. As discussed above, contemporary
thinking on measurement owes much to cultural influences in sociology and the other
social sciences. Methodological approaches influenced by constructivism such as
participatory methods where the research process is geared towards “those people
whose life-world and meaningful actions are under study” (Bergold and Thomas 2012,
unpaginated) are commonplace.
Yet there are substantial tensions too. One of these tensions is an ontological
disagreement about the role of public or ‘expert’ opinion in decision-making. Despite
universal education and the expansion of tertiary education in many countries in the
world, the divergence between the expert and public does not appear to be waning. Most
16
of the research on this comes from the US where the Pew Centre regularly survey public
attitudes and compare them to the attitudes of scientists or other experts. There are
some huge gulfs in opinion, which they call ‘agreement gaps’. For example, the
agreement gap as to whether humans have evolved over time is 33 percentage points
(98% of experts vs. 65% of the public). There are large agreement gaps on whether
human activity causes climate change, the safety of GM crops, and whether childhood
vaccinations are dangerous (Pew Research Centre, 2015). Crime is another example.
As crime has fallen across the developed world in recent decades, fear of crime has
risen or stayed constant and incarceration rates have increased in many countries
(Tonry, 2014). The response has not been to tell people they are ‘wrong’ but to measure
and understand why people feel afraid and to incorporate indicators of fear into crime
statistics (for example in the British Crime Survey). This seems like a good approach to
mediating subjective and objective views, but it is not always that simple. Work by Bishop
et al (1986) demonstrates the dangers of misinformation. They interviewed respondents
about three fictitious pieces of legislation in the US. Between 22 and 40% of respondents
were willing to express opinions even when they knew nothing about the topic. By
creating dual lines of accountability – i.e. flows of information from citizen to policy-maker
and from scientist to citizen - the intention is to cut through these tensions and create a
better framework for deciding policy. This process should help inform the electorate on
issues that are complex such as the science of climate change, and it should act as a
bulwark against dogma, propaganda and faith-based assessments of policy.
The final reason to focus interdisciplinary academic attention on the measurement of
social value is that it is already happening. Whether we do so explicitly or not, we
regularly review how well we are doing and compare this with other nations. In the
absence of formal alternatives, economic measures such as GDP are heavily relied upon
and stretched beyond their capabilities. This creates a vicious cycle where we value,
resource and focus on the wrong things. In the next section I discuss the problems with
GDP in more detail.
1.3 GDP as a measure of social value
GDP has been the subject of sustained criticism by economists and non-economists for
decades. Van den Bergh (2014) identifies the most well-known economists that have
tackled the subject including Galbraith (1958), Sen (1976), Arrow (1995) and Layard
(2005).4 The reasons why GDP acts a poor proxy for social value are many and varied.
4 See also Kuznets (1946), Samuelson (1961), Mishan (1967), Nordhaus and Tobin (1972),
Hueting (1980), Hirsch (1976), Scitovsky (1976), Daly (1977), Hartwick (1990), Tinbergen and
17
Others5 have provided comprehensive summaries of these, which have been compiled
and paraphrased in sections 1.3.1 – 1.3.5 (for a fuller critique see van den Berg, (2009)).
1.3.1 Accounting and methodological problems
There are five main problems with the way that GDP is calculated:
1. GDP breaks the principles of proper accounting by measuring only one side of
the balance sheet. It measures the costs but not the (dis)benefits of economic
activity.
2. GDP is biased towards services provided by the private sector. If a country
privatises public services, ceteris paribus, GDP will increase, irrespective of
service (dis)improvements. For example, public education is valued at input costs
(salaries, buildings) but private education is valued at its market price. The US
health services have the largest contribution to its GDP compared to other
countries but the worst outcomes, so are overvalued in GDP. Productivity
improvements in the public sector are also excluded.
3. Often the aggregate income of a country’s citizens (GNI and NNI)6 will be different
than the size of domestic production, meaning that GDP misrepresents the level
of economic resources that contribute to social value. Countries with large
amounts of Foreign Direct Investment (FDI) such as Ireland regularly experience
a large GNI/GDP gap. In 2015, Ireland created controversy by posting a growth
rate of 26%, which was a direct result of this.
4. GDP is a measure of flows, so does not measure the stock of wealth in the
economy, this is only a partial measure of the total wealth that citizens have at
their disposal. Income and consumption calculations are therefore often not
equal.
5. Although Net National Product (NNP) is offered as an improvement on GDP,
there are difficulties in measuring depreciation, especially for new types of capital
goods such as information technologies (Stiglitz et al., 2009)
Hueting (1992), Vellinga and Withagen (1996), Weitzman and Löfgren (1997), Dasgupta and Mäler (2000), Dasgupta (2001), Fleurbaey (2009) and Victor (2010) 5 Drawn primarily from (Boarini et al., 2006; Costanza et al., 2009; England, 1998a; Harris, 1997;
Stiglitz et al., 2009b; Talberth, 2008; van Den Berg, 2009) 6 Gross National Income adds income transfers received by residents from abroad to GDP and
subtracts transfers made by residents to people in other countries. It can also be influenced by ‘terms of trade’ effects. Net National Income combines GNI and Net Domestic Product (NDP). NDP is the maximum amount of output that can be spent on consumption during a year while maintaining the country's future productive capacity unaltered. NNI levels are systematically below levels of GDP per capita, however, the ranking tends to be similar with simple and rank correlation coefficients of 0.98 and 0.95, respectively (Boarini et. al. 2006). Net National Produce takes account of depreciation in the nationals stock of assets.
18
1.3.2 Empirical evidence of GDP and social value
GDP growth has for some periods of time correlated with social improvements, most
notably life expectancy in post-war Europe when countries experienced large increases
in per capita incomes (Preston, 1975) but this relationship has weakened as the 20th
century has progressed (Preston, 1975). As discussed in more detail in Chapters 2 and
5, empirical studies of happiness generally do not find a relationship between growth and
happiness beyond a certain level of income. This is partly explained by the ‘hedonic
treadmill model’, which says that as we adapt to changing income our levels of
satisfaction return to the baseline, and we strive for even more to achieve the same level
of happiness (Diener et al. 2006).
1.3.3 Devalorisation of non-market activities
GDP does not capture non-market transactions e.g. childcare, voluntary work,
subsistence agriculture. For example, estimates by ONS have shown that the value of
home production is around the same size as conventional GDP (Fender et al. 2011). It
also overvalues transitions from an informal to a formal economy because it assumes
that informal labour has no value.
The prices on which the GDP are based are incomplete. There are a host of ‘externalities’
where prices do not capture the underlying valuation, most notably perhaps
environmental damage. In 2007, oil and gas production contributed to 50 per cent of
Saudi Arabia’s GDP but the negative environmental impacts of this were not accounted
for anywhere (Tabata, 2009). In addition, the valuation of some goods and services is
extremely challenging (e.g. complex financial products) and in some instances, may be
net negative.
Some goods and services are non-substitutable - no amount of luxury services can
compensate for a lack clean air, water or food. GDP cannot distinguish between meeting
basic needs and providing luxury goods. Substitutability is discussed in more detail in
Chapter 4.
1.3.4 Poor incentives for social improvement
GDP cannot capture changes in the distribution of goods and services. For example,
status acquisition from the purchase of positional goods is a zero-sum game (for your
status to increase it requires someone else’s to decrease).
GDP counts ‘defensive expenditure’: prisons, the military etc. Although the definition of
what constitutes a defensive expenditure is controversial, there is scope for perverse
incentives. For example, 3.9 per cent of the US labour force is either in prison or working
19
in a prison, compared to 2.4 per cent employed in farming, fishing and forestry (Wagner,
2003).
1.3.5 GDP as a measure of welfare
There is a sparser literature supporting GDP as a measure of welfare. Proponents tend
to see merit in its seeming objectivity. It is considered non-normative and therefore free
of government influence (Coyle, 2015; Norberg, 2010; Posner, 2009). Those who are
naturally suspicious of government intervention tend to favour it on these grounds.
However, whilst national accounting may have the appearance of objectivity, this is not
always the case. The economist who first calculated GDP – Simon Kutznets – described
how: “For those not intimately acquainted with this type of work [national accounting] it
is difficult to realize the degree to which estimates of national income have been and
must be affected by implicit or explicit value judgements.” (quoted in England, 1998, p.
374). Others argue that for to measure improved variants such as Net National Product7
(Weitzman, 1976), GDP is required (Oulton, 2012). Proponents often find themselves
defending growth-based policies and the merits of economic growth rather than the
metric itself (Coyle, 2015; Oulton, 2012).
Supporters of GDP also argue – as Kutznets did - that GDP was never intended as a
measure of social value and is misused by governments (England, 1998). Whilst this is
partly true, it does not detract from the argument for an alternative and may even support
it further were a suitable alternative to be found. It can also be disingenuous, as
supporters of retaining GDP solely for economic management, do not tend to be strong
supporters of alternatives. As Daly et al. have pointed out “as long as GNP is treated by
economists as the ‘central framework’…political leaders and the media will continue to
view the GNP as a measure of welfare.” (Daly et al., 1994, p. 250).
Whilst alternatives are often the subject of severe criticism, GDP is sometimes treated
as if exempt from such analysis, and GDP data are often reported uncritically in the
media (Van den Bergh et al., 2014). The politics of GDP will be returned to again in
Chapter 2 when I explore alternatives in more detail.
1.4 Developing an alternative measure of social value
This research is motivated by an interest in the ways in which measurement be used to
improve public policy and subsequent social, economic and environmental outcomes. I
will therefore explore whether a country can develop a transparent system of national
7 NNP is defined in real terms as consumption plus net investment (gross investment less
depreciation), all deflated by the price index for consumption. This is sometimes thought of as the yield on society’s wealth and therefore equal to the maximum sustainable level of consumption
20
measurement with dual lines of accountability that is philosophically and empirically
robust. I will also explore whether this measure would lead to better policy-making, by
which I mean policies that improve collectively identified social outcomes.
The approach taken is to develop a conceptual framework to guide the development of
a national indicator and test it by applying it in a real-world context. Hall at el. (2011)
argue that any successful measure of social value requires such a framework, i.e. a basic
structure that can be used to present a preferred and reliable approach to an idea or
thought. The aim of the framework will be to delineate the dimensions used to build up
the concept of social value and create a logical structure that illustrates how these
dimensions relate to one another. To test how well the framework works I will apply the
methodology to one country – the Republic of Ireland. I am most interested in the period
from the late 1990s to the mid-2000s when Ireland experienced a large increase in the
size of its GDP, which earned it the moniker of the Celtic Tiger.
There are several reasons why I chose to focus this study on Ireland. First, in recent
decades it has seen unusually large fluctuations in GDP within a short space of time. At
the end of the last century it had gone from being the permanent ‘sick man of Europe’ to
the fastest growing economy in the region, reaching growth rates of 10 per cent per
annum. This was followed by one of the largest peak to trough falls in GDP during the
financial crisis. It therefore provides a good model through which to explore the
relationship between national income and social value (Delaney, 2009). Second,
alongside this (and partly because of it) Ireland has undergone huge social and cultural
changes in a short space of time. This makes any study of the things that people value
more interesting.
Third, although dubbed the ‘Celtic Tiger’, Irish economic development differed from the
so-called tiger economies of Asia with which it was being compared. Whilst somewhat
analogous in the early stages, policy became focused on short-term growth strategies to
keep the GDP statistic high until it was eventually undone by the scale of the losses in
the banking sector following the financial crisis. There is a reasonable literature on the
Celtic Tiger, yet little of it is devoted to evaluating its success. Although difficult to
separate from the crash that follows, it is worth asking whether the social and economic
transformation in that period was net positive on its own terms. In other words, assuming
there were positive and negative externalities from growth, did the positives outweigh
the negatives and by what proportion?
Fourth, Ireland is something of an outlier in terms of well-being data. Historically, it has
higher levels of life satisfaction than would be expected given its level of development.
21
More recently, this high relative position has been maintained despite comparatively low
levels of public spending and, unlike other peripheral EU economics, happiness levels
appear to have been unaffected by the recent recession.
Finally, Ireland is a small peripheral economy that has always operated in a narrow policy
space. It has historically been influenced by larger neighbours – Britain, the EU and the
US. The need to collectively identify social goals is arguably more pronounced in
countries, where policy autonomy is limited, or considered an unaffordable luxury.
One critique of the way in which alternatives have been developed is that they have not
brought the public with them. They are often remote, with the alternative priorities and
goals being overly influenced by the assumptions of developers and academics
(England, 1998b; Neumayer, 1999). Others have tried to take a more participatory
approach such as the UK’s Office for National Statistics and have been more successful
in prompting public debate. In this thesis I will argue that a system of national accounts
has the potential both to improve the accountability of policymakers and engage people
with the challenges and trade-offs inherent in making policy. I will therefore explore
whether a focus on GDP obscures of crowds out things that are of value to people, and
what the implications of this are for policy. In the next section I set out the research
questions that underpin this analysis and describe some additional research problems
that the thesis will explore
1.5 Research questions
In this thesis, I will address the following primary research questions:
1. What do we know about what societies value, how is this understood
philosophically and empirically, and how can it be operationalised and
measured?
2. Are people’s perceptions of the things that matter in life a sufficient indicator of
social value, or do we need to complement this with other kinds of information
e.g. expert opinion?
3. Can an index of progress for measuring social value be developed and what
conceptual framework/principles would underpin it?
4. Using this approach, what can we learn about social value creation in Ireland
during periods of low and high growth? What conclusions can we reach about
the adequacy of GDP as a measure of social value from that example?
5. What are the policy implications, if any, of using this alternative approach?
Throughout the thesis I will also explore the following three tensions:
22
1. How can we balance subjective and objective data in reaching conclusions about
what people value?
I assume no ontological hierarchy, rather I take as a starting point that subjective and
objective data are both important and must be considered. However, they sometimes
lead to a difference in emphasis or even contradictory conclusions and balancing these
kinds of analysis is philosophically challenging.
2. What is the balance to be struck between completeness and parsimony in
developing an index of social value?
Central to the critique of GDP is that it is a partial measure and that it doesn’t capture
many of the things that matter in life. At the same time, too much data could also obscure
the things that are material. GDP’s strength is its parsimony. This makes it comparable,
relatively simple to understand and to use to inform policy. However, this is also a
weakness. A more diverse or complex measure of social value would also need to be
sensitive to national/cultural differences but incorporating these also reduces the
comparability of the measure.
3. How can we balance the interests of the individual with those of the collective?
Whilst I recognise that the collective interest is more than the sum of individual
preferences, this is a subtle point that may be challenging to communicate. If most
individuals express a preference that is not arguably in the collective interest, how do we
deal with that in a participatory and democratic framework such that I set out here?
1.6 Contribution
In this thesis I aim to move beyond research silos to draw on different research
techniques and academic traditions. First, the research is intentionally interdisciplinary,
drawing on literature from across sociology, economics, psychology, epidemiology,
politics and environmental studies. I argue that no one discipline should have a monopoly
over questions of what constitutes a good life, and that an interdisciplinary approach is
most appropriate. This departs from much of the existing literature, which is often silloed
in terms of subject and research design. For example, economics (and to a lesser extent
psychology) have dominated the field of happiness studies, leading to the development
of a discreet sub-discipline known as ‘happiness economics’ (e.g. Layard, 2005). The
methods employed by happiness economists mirror those used in other branches of
economics, most notably cross-country panel regressions that test for correlations
between well-being measures and a series of independent variables. These studies have
much merit but are also limited, and (for example) rarely employ qualitative research.
23
On the other hand, the contribution of sociology to the field of ‘happiness studies’ has
been relatively limited (Bartram, 2012; Hyman, 2014; Cieslik, 2015). There are some
notable exceptions, (e.g. Veenhoven, 2012, 1996, 1993) and Hyman (2014). Several
reasons can be identified. First, the study of happiness is sometimes seen as an
individualist phenomenon and therefore not a natural theme for sociologists (Cieslik,
2012). Second, cultural influences discussed above have led sociologists to critique the
concept of happiness (e.g. Ahmed, 2010) and resulting ‘therapy culture’ (e.g. Furedi,
2004). Finally, sociologists have traditionally been concerned with “pathologies” –
inequalities, injustice and so on (Hyman, 2014 p 3-4), rather than the reasons why people
flourish. Following the sociologists cited here, I make the case that well-being – and the
findings from its study – are of most interest and have most to offer policy at the societal,
rather than individual level making it fertile ground for sociological enquiry. As I will
discuss in Chapters 3 and 5, the hedonistic, atomised description of well-being is a “thin”
one (Cieslik, 2015 p 432), and is not supported by the empirical research. The absence
of sociologists working in the field may be one reason why economics (and quantitative
methods) have dominated the field. Sociologists have responded by calling for more
qualitative research (e.g. Hyman, 2010; Cieslik 2015), however, there is a clear gap for
non-economists to use quantitative or mixed methods.
Although sociology is late to this topic, it has an essential contribution to make because
it brings a social dimension that is often lacking. This thesis will therefore seek to make
a general contribution to this literature. More specifically, it will contribute in two ways.
The main contribution will be methodological. It will explore how a new approach to
developing an indicator of social value could address some of the challenges set out in
this section. The conceptual framework as a set of philosophically defensible guiding
principles is also a unique contribution. A final contribution will be its application to
Ireland, for which no detailed study of the measurement of social value has been carried
out to date. The primary dataset on the things people value is bespoke to this thesis as
are the conclusions that are drawn about the implications for how the economy and
society may be organised.
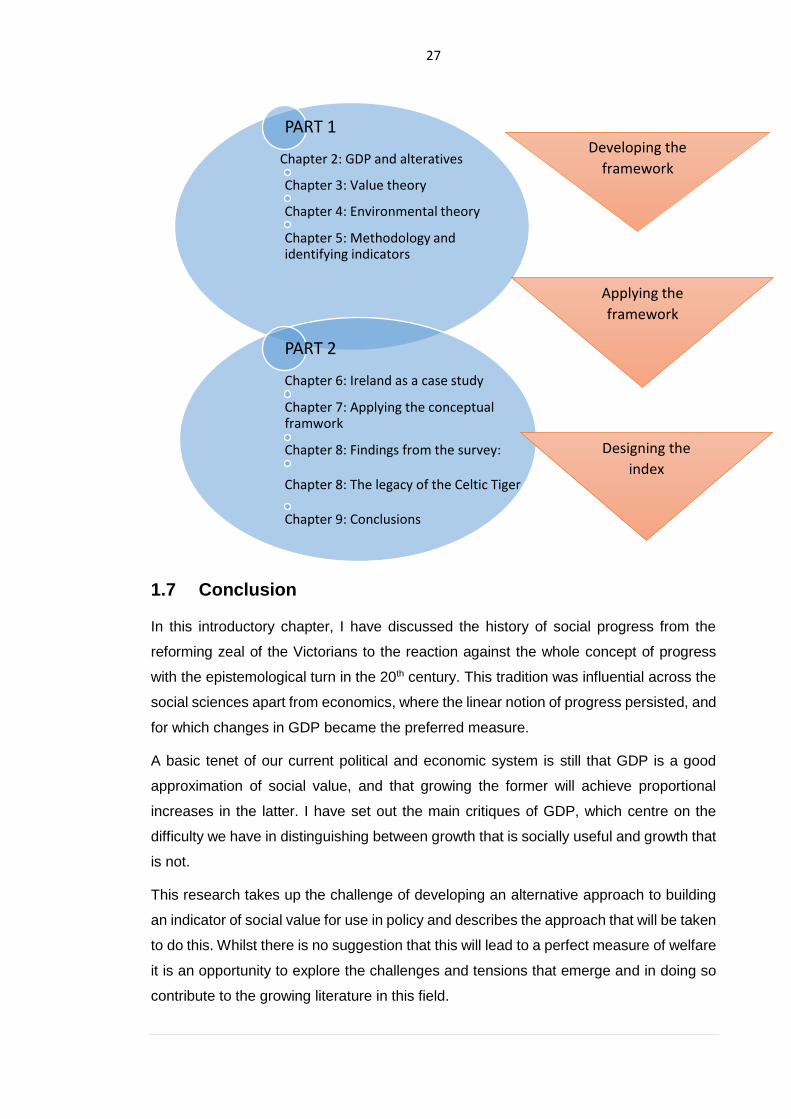
1.6 Report structure
The thesis is structured in two parts. The first part (Chapters 2-5) develops the
conceptual framework and the second part (Chapters 6-10) applies it to the example of
the Republic of Ireland. This section précises each chapter. The structure is also
represented in the diagram in Figure 1.1.
24
Chapter 2 begins by describing how GDP was developed and rose to dominance in most
developed countries. It then goes on to document the reactions against this. Although
criticisms came from many quarters, in this chapter I focus on four influential
developments from across the social sciences, which all began in the 1970s. In
economics, the Limits of Growth and subsequent publications spawned the discipline of
ecological economics and Easterlin's work on the paradox of growth and happiness led
to a very vibrant branch of research sometimes referred to as 'happiness economics'. In
sociology, postmaterialism purported to document a change in values away from more
materialist goals within developed societies and work on different forms of capital aimed
to highlight the importance of nurturing non-economic assets within a society. I then
discuss the alternatives to GDP that have been influenced by these critiques, focusing
on three categories: adjusted GDP, composite indicators and dashboard approaches.
Exemplars are chosen from each category and the pros and cons of each are discussed.
Finally, I make a case for composite indices and conclude the chapter with a brief
discussion of the political issues that have enabled GDP to remain dominant in the face
of overwhelming criticism.
In Chapter 3, I theoretically interrogate the concept of value. I describe the history of
ideas as it pertains to value from ancient times, through the Enlightenment to the 20th
century. I then discuss modern conceptions of value using Parfitt's taxonomy of hedonic
value theory, objective list theory and desire/preference satisfaction theory. I then
describe how value has been used in economics and how preference satisfaction theory
has influenced the use of GDP as a proxy for welfare. I conclude that whilst each theory
contains some attractive elements none is sufficient on its own. I therefore advocate a
hybrid theory, which draws mainly on objective list and desire theory, or subjective and
objective perceptions of value. This hybrid influenced the development of the conceptual
framework, which I call ‘constrained utilitarianism’.
Environmental impacts are proposed as a possible candidate for a ‘constraint’ and this
proposition is explored in Chapter 4. I begin this discussion by defining sustainability and
explaining why some forms of capital, most notably critical natural capital, should be
accounted for separately. I do this by introducing the concept of the substitutability of
capital, demonstrating how it is not always possible to trade some forms of capital (e.g.
non-renewables) off against other forms (e.g. renewable), at least not if we want to
ensure non-declining welfare over time. This leads to a discussion of intergenerational
equity and the extent to which we should be morally concerned with ensuring the well-
being of future generations, particularly where their interests compete with the welfare of
25
people in developing countries today. The chapter concludes by describing the principles
of environmental accounting that would form part of the conceptual framework.
In Chapter 5 I describe the methodology for the primary research and the empirical
analysis for selecting indicators. The chapter begins with a discussion of the relative
merits of subjective and objective data and the epistemological challenges of combining
them. I make a case for the research, discuss reflexivity and describe the research
design including survey design, data selection and analysis. The second part of the
chapter reviews the determinants of well-being. The aim of this section is to identify from
this literature a ‘long list’ of possible indicators that could inform the design of a survey
into the things people value. In this way subjective and objective perceptions of value
are combined in line with the conceptual framework.
In the second part of the thesis, I apply the framework to the example of the Republic of
Ireland. In Chapter 6 I describe the history of Irish economic development, including the
long period of economic underperformance from the foundation of the State in the 1920s
to the end of the 1980s. I then describe the domestic and external policies that led to the
‘Irish Model’ better known as the Celtic Tiger. The strengths and weaknesses of the
model are discussed, as are the reasons for its eventual collapse. I conclude the chapter
with further discussion of the reasons why Ireland makes an interesting case study for
this research.
Chapter 7 describes the conceptual framework in more detail and how it will be
operationalised. This chapter begins by describing the principles that underpin the
framework, some of the conceptual challenges it poses, and how I proposed to resolve
these. I then provide further detail on how it was operationalised in the primary research.
I cover two further methodological points relating to the survey: the measurement of
values and attitudes and identifying the correct level of measurement. I then go on to
describe Principal Component Analysis, the method of data reduction used distil the 68
variables into a manageable set of indicators with a coherent factor structure. I conclude
the chapter by providing some further detail on ways to align the methodology for the
index with my theoretical framework.
In Chapter 8 I present the findings from the primary research. In the first instance, this
answers a central research questions – what do people value – and these are reduced
to 10 outcome areas that I recommend for inclusion. Indicators for these outcomes are
then identified. Data limitations of both time series and range of indicators are measured,
restricting the scope of the analysis at this stage. The final steps of completing the index,
normalisation and aggregation, could not therefore be completed in a robust way.
26
Instead, these are discussed with reference to the conceptual framework and the lessons
that can be drawn from it about how they would be completed. The survey data also
allowed me to explore whether there is evidence of changes in valuations over time and
the amount of income people believe they would need to make them happy. I conclude
the chapter with some additional statistical analysis of the datasets. Using Chi Squares,
I test two null hypotheses 1) that there is no relationship between gender and overall
valuations and 2) that there is no relationship between religion and overall valuations.
Then, using Ordered Probit I test the null hypothesis that there is no relationship between
material goals and self-reported subjective well-being (SWB).
Drawing on the outcomes that have been identified as being important in the previous
analysis, I review the successes or failures of the Celtic Tiger in generating social value
in Ireland in Chapter 9. Working with the best available data I review trends in relation
to:
• Mental health and well-being
• Physical Health
• Employment
• Education
• Income poverty and inequality
• The environment
Where possible I calculate correlations with GDP over time and draw some conclusions
about the wider impact of the Celtic Tiger.
In the final chapter I discuss the strengths and weaknesses of the conceptual framework
and lessons learned for future research in this field. An ambition of this thesis is to inform
policy and in the final chapter I set out some policy conclusions that emerge from the
research. I test the usefulness of the framework for informing policy by taking two worked
examples: mental health and the environment. Mental health emerged from the primary
and secondary literature as being the most important determinant of social value. It is
also interesting to discuss here because it is not generally thought of as an ‘outcome’ of
the economic system and this chapter discusses the evidence for structural determinants
of mental ill-health and their implications. The environment is interesting because it is
the archetypal ‘constraint’ in my framework. I consider ways we might take its role as a
constraint seriously by adopting things like environmental fiscal reform. The third area of
policy for consideration relates to information strategies adopted by governments. The
politics of data are discussed, and a new information strategy is recommended.
Figure 1.1: Report structure
27
1.7 Conclusion
In this introductory chapter, I have discussed the history of social progress from the
reforming zeal of the Victorians to the reaction against the whole concept of progress
with the epistemological turn in the 20th century. This tradition was influential across the
social sciences apart from economics, where the linear notion of progress persisted, and
for which changes in GDP became the preferred measure.
A basic tenet of our current political and economic system is still that GDP is a good
approximation of social value, and that growing the former will achieve proportional
increases in the latter. I have set out the main critiques of GDP, which centre on the
difficulty we have in distinguishing between growth that is socially useful and growth that
is not.
This research takes up the challenge of developing an alternative approach to building
an indicator of social value for use in policy and describes the approach that will be taken
to do this. Whilst there is no suggestion that this will lead to a perfect measure of welfare
it is an opportunity to explore the challenges and tensions that emerge and in doing so
contribute to the growing literature in this field.
PART 1
Chapter 2: GDP and alteratives
Chapter 3: Value theory
Chapter 4: Environmental theory
Chapter 5: Methodology and identifying indicators
PART 2
Chapter 6: Ireland as a case study
Chapter 7: Applying the conceptual framwork
Chapter 8: Findings from the survey:
Chapter 8: The legacy of the Celtic Tiger
Chapter 9: Conclusions
Designing the
index
Applying the
framework
Developing the
framework
28
In the next chapter, I look in more detail at the growth of GDP, the main theories that
have challenged it and the alternatives that these theories spawned. I describe the
further the research problems that I am addressing and make a case for synthetic
measures like the one that is being advocated here.
29
PART 1: DEVELOPING A CONCEPTUAL FRAMEWORK:
CONTEXT, THEORY AND METHOD
Chapter 2 GDP measurement, alternatives and the need for
this research
2.0 Introduction
People have always been motivated by attempts to improve the human condition (Sen,
2001). However, as discussed in Chapter 1, the identification and promotion of better
societies is not a neutral act, as the metrics, method of measuring and, indeed, the
decision to undertake measurement in the first place are all contested. It is peculiar
perhaps in this context that a single, ‘simple’ indicator has come to dominate public life
in most parts of the world without it ever having been collectively decided upon.
Criticisms of GDP as a proxy for social value are as old as GDP itself. Because of the
controversy that surrounds it, academics and policy-makers have always searched for
alternatives but despite many promising possibilities, there is no serious candidate in
contention.
This chapter begins with some historical context on the development of GDP, how it grew
in significance and how it has been undermined by theoretical critiques as well as social
and environmental data that highlight its shortcomings. I then discuss the development
of alternatives, focusing on the strengths and weaknesses of monetary measures,
synthetic measures and dashboard approaches. I then make a case for synthetic
measures over the other approaches and conclude with a discussion of the politics of
measuring social value and the implications of these discussions for this research.
2.1 The Development of GDP
GDP was first calculated in the 1930s by a team led by the American economist Simon
Kuznets and gained popularity in the 1940s for its usefulness in measuring the size of
the war effort.8 Kuznets told US Congress at the time that it should not be mistaken for
a measure of welfare and that:
8 There are three methods for estimating GDP: production, expenditure and income approaches. Data for these estimates come from a variety of statistical surveys and administrative datasets. All three methods are used depending on when they become available. As the data tend to vary, the figures are updated as and when new datasets can be incorporated, which sometimes leads to GDP being revised up or down.
30
“Distinctions must be kept in mind between quantity and quality of growth, between its costs and return, and between the short and the long term. Goals for more growth should specify more growth of what and for what.”
(Kuznets, 1962, p. 29).
By the 1960s however, GDP measurement was firmly established, and questions of
quality growth as described by Kutznets fell away. Okun’s Law purported to establish an
empirical relationship between an increase in GDP and a decrease in the rate of
unemployment and since then it has been a permanent feature of most economies
(Okun, 1962). Crucially, it was adopted by the Bretton Woods Institutions for the
purposes of international comparison and became the bellweather of social and
economic performance. This vision of progress was also rooted in social pacts, which
promised a balanced share of production between labour and capital (Thiry, et al. 2010).
In some respects, this all made sense. North America was, by the 1960s, both a
powerhouse of market production and at the forefront of progressive politics. It had the
largest GDP per capita in the world and was much admired internationally for its
entrepreneurialism and social mobility. However, by the time the 20th century drew to a
close, America’s reputation as a social and economic success was much diminished.
Doubts began to emerge about the proxy role that was being assigned to GDP and the
direction in which it was leading society. In the next section I discuss the most salient of
these criticisms, which came from different perspectives from across the social sciences.
2.2 Challenges to GDP
The 1970s saw the publication of several pieces of research that suggested that growth,
as measured by GDP, might be off-track for monitoring and promoting human and
environmental ends. These came from different disciplines: from political science the
concept of postmaterialism, suggested a devalorisation of material wealth, from
sociology the multiple capitals approach challenged the primacy of economic outcomes,
and from the ecological movement The Limits of Growth theory suggested that the
existing model was unsustainable. There was also criticism from within the economics
profession however, and I begin this discussion with the paradox made famous by the
economist who first observed it, Richard Easterlin.
2.2.1 The Easterlin Paradox
The main catalyst for the study of what today is sometimes referred to as ‘happiness
economics’ came from Easterlin’s seminal article on income and happiness (1974
updated in 1995). It described the seeming ‘paradox’ that although real incomes were
rising in developed countries, it was not associated with a proportional rise in self-
31
reported happiness (Clark et al., 2008). The implication was that substantially increasing
affluence was failing to translate into improvements in human well-being. One possible
explanation was the ‘relative income hypothesis’ first developed by Duesenberry (1949).
This posits that in rich countries, it might be relative rather than absolute income that
matters most for people’s well-being and Easterlin used it to help explain this finding.
Given that we know that wealthier individuals within a society are happier, the relative
income effect must dominate the absolute income effect, as this would explain why
average well-being levels remain constant as all members become wealthier (Easterlin,
2005). A second phenomenon that Easterlin suggested might be at play was habituation
(Easterlin, 1974). He argued that people adapt to new levels of income, and as they
adapt their levels of satisfaction return to the baseline, so they strive for even more to
achieve the same level of happiness. Adaptation appears to swamp the effects of
changes in economic circumstances (and other objective circumstances) on happiness.
2.2.2 The Limits of Growth
Although ecological writing in economics can be traced back to Polanyi (1944), the
discipline of ecological economics only began to emerge in the 1970s with the publication
of seminal works such as Shumacher’s Small is Beautiful (1974) and Daly’s Steady State
Economics (1977). The most influential publication in this genre was the Club of Rome’s
Limits of Growth which was published in 1972 (Meadows, et al. 1972). It contained
computer simulations that projected future growth of several variables (e.g.: population,
industrialisation, pollution, food production and resource depletion) at different rates. It
assumed population and industrialisation grew exponentially, while food production grew
in a linear fashion, and resources remained broadly fixed. The conclusion was a neo-
Malthusian world of exhausted natural resources, endemic pollution and inadequate food
supplies. The solution offered by the paper was to restrain growth, either through
managed policy or as an imposition. Economists and business largely dismissed the
report at the time. Critics such as Nordhaus (1992) and Solow (1974) pointed to
insufficient data and problematic modelling techniques. Like Malthus, they argued, the
authors had ignored technological innovation and the potential to find new resources. In
addition, there was the potential of economic solutions like the adjusting role of the price
mechanism.
Limits of Growth was written in the context of the oil shocks and recessions of the 1970s
and its influence waned in the 1980s. Although the authors were not as concerned as
they might have been with ‘sink’ pressures i.e. the planet’s ability to absorb carbon
emissions, their thesis was in fact more prescient than they may have realised. As
awareness of climate change has grown, the Limits of Growth thesis has been rescued
32
from obscurity (albeit for the wrong reasons). Its legacy is still being debated today. It
firmly established the position of what Neumayer (2004) calls ‘growth pessimists’.
Counter arguments were put forward by ‘growth optimists’ (Neumayer, ibid.). Central to
the growth optimists’ argument is the existence of what is known as the Environmental
Kuznets Curve (EKC). This is the theory that there is an inverted u-shaped relationship
between growth and environmental degradation - that as countries develop, they
become more environmentally aware and pursue more sustainable policies (Beckerman,
1992; Grossman & Krueger, 1994; Lomborg, 2001). Growth optimists had argued that it
was possible to ‘decouple’ growth and resource use i.e. break the link through increased
efficiency (Goldin & Winters, 1995) and that growth could even reverse environmental
degradation if the ‘proceeds’ of growth could be reinvested in clean technology
(Nordhaus, 2006). These proponents also pointed to evidence that economic growth
suppresses population growth, engenders technological improvements, and is
associated with a greater number of environmental lobby groups.
Unfortunately, the empirical evidence has been kinder to the Limits of Growth thesis than
the EKC: technological solutions have been slow to materialise and many of the Limits
of Growth forecasts have turned out to be relatively accurate (Turner, 2008). Long-run
data also suggest that the EKC relationship does not exist (Perman et al. 2003, Shafik
1994, Koop and Tole 1999, Nguyen Van and Azomahou 2007). Even if environmental
consciousness rises with income, demand for material goods also rises to more than
offset this concern. Although this might be the case for some pollutants, it is not the case
for greenhouse gases and most ecosystem services – fisheries, soil, water – which
continue to decline in developed countries (Perman et al 2003). Critics of the EKC also
argue that high-income countries are cleaner because they export their polluting goods
to other countries, so called ‘pollution havens’ (Cole, 2004) It is argued that other factors
such as female education and retirement plans are more important in curbing population
growth than economic growth. Perhaps the most convincing argument against the EKC
however is that it does not take account of past emissions. For countries to reach a level
of growth such that major pollutants begin to fall, they need to emit large amounts,
making total emissions very high (Neumayer, 2004).
Uncertainty about the future - the trajectory of different emissions, the consequences of
policy responses and the speed of technological improvements – make it difficult to
answer conclusively the growth optimism/pessimism question. Looking ahead to a world
where nine billion people aspire to the level of affluence of OECD nations however, the
economy would need to be 40 times bigger by the end of the century to provide this
33
(Jackson, 2009). It is difficult to see how decoupling, if it could be achieved, could happen
on this scale.
Coming to terms with the Limits of Growth thesis raises a whole host of additional
questions. These are summarised well by Gowdy:
“…how much economic growth do we need to provide money for the material things that contribute to making people happy? Can we “develop” without growing? Can one country stop growing, or would this amount to unilateral disarmament…”
(Gowdy, 2005)
Although it is not the intention of the research to answer these, they will be referred to in
the primary research regarding the case study of Ireland.
2.2.3 Post-materialism
A further challenge to GDP is the hypothesis that changing values in society mean that
an entirely materialist measure cannot fully capture the things that matter to people.
Inglehart uses the concept of postmaterialism to help explain the changes he observed
in the values in modern societies (Inglehart, 1977; Inglehart, 1971). Starting in the 1970s,
this hypothesis describes the transformation in many countries from a culture dominated
by material-oriented goals to a society in which an increasing proportion of the population
begins to favour non-material goals. He argued that this transformation was a part of the
development process - as scarcity was reduced this impacted on the value individuals
placed on material goods - and that this was accompanied by a decrease in confidence
in authoritarian and hierarchical institutions. According to the theory, younger birth
cohorts in developed countries attach less importance to economic and physical security
than older birth cohorts who experienced poverty and/or the impacts of war in their early
years. Not only has the economic well-being of the average citizen increased objectively,
but also their sense of economic security.
Much of the empirical work to support this has been carried out by Ingelhart (Inglehart,
1997, 1990, 1977; Inglehart and Klingemann, 2000). However, it has been highly
influential, and questions inspired by the concept are included in trans-national surveys
such as the World Values Survey and Eurobarometer. Findings from these studies
generally find – in line with the theory - a devalorization of material concerns and a
valorization of post-materialist concerns over time (Delhey, 2010). More recent analysis
using the World Values Survey from before and after the 2007/8 financial crisis suggests
a change in these trends. Cameron (2013) in a study of 14 democracies finds that
postmaterialism is in decline across a range of age groups. She finds evidence for the
scarcity hypothesis i.e. that that materialist values will take precedence during times of
34
scarcity (Inglehart, 1981, p. 881). The suggestion of a return to materialist values brought
on by economic scarcity should come as no surprise. Recent research by McKinsey
Global Initiative found that between 65% and 70% of people in 25 advanced countries
saw no increase in their earnings between 2005 and 2014, suggesting that today’s
younger generation are likely to end up worse off than their parents (Elliot, 2016).
2.2.4 The multiple capitals approach
A more contemporary challenge to GDP comes from the ‘capitals’ approach to evaluating
social value. The concept of ‘capital’ refers to a stock or asset that provides a flow of
goods and services for the benefit of human wellbeing. The conventional economic
definition of capital – essentially the manufactured goods which produce, or facilitate the
production of, other goods and services – ignores the vital inputs produced by the natural
environment and society. This idea proposes that there is a range of sources of value
(capitals) that give rise to economic and social benefits, but that current accounting and
economic approaches recognise only one through the measurement of GDP. It therefore
takes the economic concept of wealth creation or ‘capital’ and applies it across non-
economic areas of life, treating those types of capital as assets.
There are variations in the number of capitals depending on the framework (the Gleeson
White framework identifies six (Gleeson-White, 2015)) but they tend to include some
combination of natural, social, manufactured, human, cultural, built and financial capital.
Two types of capital hare particular relevant here. This first is natural capital. The natural
capitals approach has been taken up by environmental economists who have developed
ways to incorporate this type of capital into accounting frameworks.9 Natural Capital is
described by the World Forum on Natural Capital as:
…the world's stocks of natural assets which include geology, soil, air, water and all living things. It is from this natural capital that humans derive a wide range of services, often called ecosystem services, which make human life possible
(Naturalcapitalforum.com, 2017).
Natural capital and environmental accounting will be returned to in Chapter 4.
The second form of capital is social capital. Social relationships, networks and norms of
reciprocity have a long history in sociology, indeed social solidarity has been described
as one of its ‘founding concepts’ (Oosterlynck and Van Bouchaute, 2013). Early
sociological theorists such as Durkheim, Weber and Simmel were concerned with the
9 For example, (Costanza et al., 1997, p. 254) calculated the dollar value of 17 ecosystem services
to highlight that the natural capital stocks that produce them are critical the Earth’s life support system. He argued that “they contribute to human welfare, both directly and indirectly, and therefore represent part of the total economic value of the planet” (Costanza et al., 1997, p. 253).
35
destabilizing effects of industrialization and the breakdown of traditional forms of social
relationships (ibid.). The term social capital however is viewed differently by social
scientists from different traditions. Even within sociology leading theorists - Bourdieu,
Coleman and Putnam – conceive of it differently (Tzanakis, 2013). For example,
Bourdieu, relates it to the size of the network and the volume of past accumulated social
capital (Bourdieu, 1986, p. 249). Although not necessarily linked directly to profit by the
individual it is reducible to profit e.g. through access to employment and so on (Bourdieu,
1986) and this is the main reason actors engage in social capital activities. Putnam sees
it in a more positive light as ‘features of social organizations, such as networks, norms
and trust that facilitate action and cooperation for mutual benefit’. (1993a, p. 35). It is
this conceptualization that has been the most influential, and can clearly be seen in the
widely-used World Health Organisation definition “the quality of social relationships
within societies or communities, including community networks, civic engagement, sense
of belonging and norms of cooperation and trust” (WHO, 2011 p.3). Where social capital
is discussed in this thesis (Chapters 8 and 9) this is also how it is being conceptualised.
2.3 Alternatives to GDP
In recognition of GDP’s deficiencies as set out above, significant efforts have been
underway in recent times to develop additional measures of social value. Empirical work
in this area has tended to fall into two areas: the development of alternative indicators
and the testing of those indicators in various settings (national, regional and local). These
activities have been taking place at the international level (e.g. World Bank),
supranational level (e.g. OECD) and national level (e.g. UK’s Office of National
Statistics). WWWforEurope is a project set up by the European Commission in the wake
of the financial crisis to research welfare, wealth and work across Europe. A key question
it set itself was “What kind of development strategy should Europe opt for in the face of
the financial crisis and the big challenges ahead: globalisation, demographic shifts,
climate change and new technologies?” (Foreurope.eu, 2016). As part of this it has
initiated a review of alternative measures of progress. It concludes that whilst all available
approaches are far from perfect they can all expect to serve as a better approximation
of social value than GDP. It recommends that the UN pick up the task of promoting the
most acceptable alternative with the aim of promoting better choices in public decision-
making and policy preparation, especially with regard to pressing issues like economic
crises and climate change (Van den Bergh et al., 2014).
These alternative measures are sometimes described as indicators and sometimes
indices. Most of the indicators used in public policy – including GDP - are indices, or
macro-indicators i.e. a “synthetic indicator constructed by aggregating other so-called
36
'basic indicators’. (Boulanger, 2008, p. 46). Indices can be broadly classified into two
categories
• Monetary measures – that start with and correct GDP or variant
• Synthetic indices – that combine a composite of indicators into a single number
(Evans, 2011), and
There are two other approaches that are of interest here:
• Dashboard approaches - that present a dashboard of indicators but stop short of
aggregation.
• Single indicators, such as ecological footprint, life satisfaction).
Next, I describe each of these approaches in more detail and provide examples of each.
2.3.1 Monetary Measures
This term refers to indices that take the approach of monetising total welfare. They
usually do this by retaining consistency with national accounts but then correcting them
for missing costs and extending them for missing benefits i.e. they start with GDP or a
variant and correct for problems with it. The first attempt to adjust GDP to take account
externalities was Nordhaus and Tobin’s Measure of Economic welfare (Nordhaus &
Tobin, 1972).10 To explore this further, I discuss two of the best-known most recent
approaches: Genuine Savings (GS) and the Index of Sustainable Economic
Welfare/Genuine Progress Indicator (ISEW/GPI).
Genuine Savings
Pearce and Atkinson (1993) developed the first Genuine Savings (GS) estimates for 18
countries in 1993. Following this, the World Bank adopted the methodology and now
regularly publishes data for over 150 countries. The indicator is calculated by deducting
from GDP the value of resource depletion, pollution damage, welfare losses in human
health and net foreign borrowing, and by adding net official transfers. Expenditure on
education is treated as a saving, rather than as consumption because it increases human
capital (Everett and Wilks, 1999)
In contrast to other approaches, GS has the advantage of giving countries a single, clear,
positive or negative figure. When a country has persistently high negative results that
means that the country is pursuing an unsustainable path with long run effects on welfare
10 Other notable examples include Zolotas’ 1981 Economic aspects of Welfare (Zolōtas, 1981),
Eisner’s 1990 Total Incomes System of Accounts, Cobb and Dalys’ Index of Sustainable Economic Welfare (Cobb & Daly, 1989) and Pearce and Atkinson’s Genuine Savings (1993).
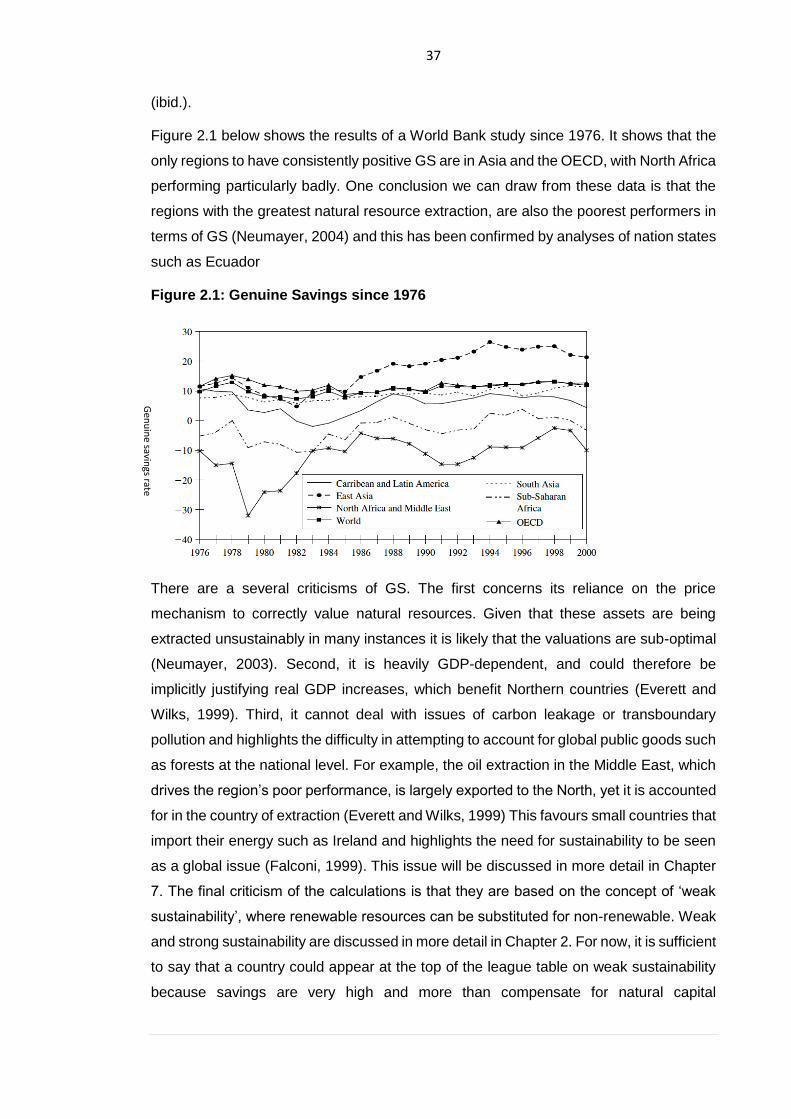
37
(ibid.).
Figure 2.1 below shows the results of a World Bank study since 1976. It shows that the
only regions to have consistently positive GS are in Asia and the OECD, with North Africa
performing particularly badly. One conclusion we can draw from these data is that the
regions with the greatest natural resource extraction, are also the poorest performers in
terms of GS (Neumayer, 2004) and this has been confirmed by analyses of nation states
such as Ecuador
Figure 2.1: Genuine Savings since 1976
There are a several criticisms of GS. The first concerns its reliance on the price
mechanism to correctly value natural resources. Given that these assets are being
extracted unsustainably in many instances it is likely that the valuations are sub-optimal
(Neumayer, 2003). Second, it is heavily GDP-dependent, and could therefore be
implicitly justifying real GDP increases, which benefit Northern countries (Everett and
Wilks, 1999). Third, it cannot deal with issues of carbon leakage or transboundary
pollution and highlights the difficulty in attempting to account for global public goods such
as forests at the national level. For example, the oil extraction in the Middle East, which
drives the region’s poor performance, is largely exported to the North, yet it is accounted
for in the country of extraction (Everett and Wilks, 1999) This favours small countries that
import their energy such as Ireland and highlights the need for sustainability to be seen
as a global issue (Falconi, 1999). This issue will be discussed in more detail in Chapter
7. The final criticism of the calculations is that they are based on the concept of ‘weak
sustainability’, where renewable resources can be substituted for non-renewable. Weak
and strong sustainability are discussed in more detail in Chapter 2. For now, it is sufficient
to say that a country could appear at the top of the league table on weak sustainability
because savings are very high and more than compensate for natural capital
Gen
uin
e savings rate
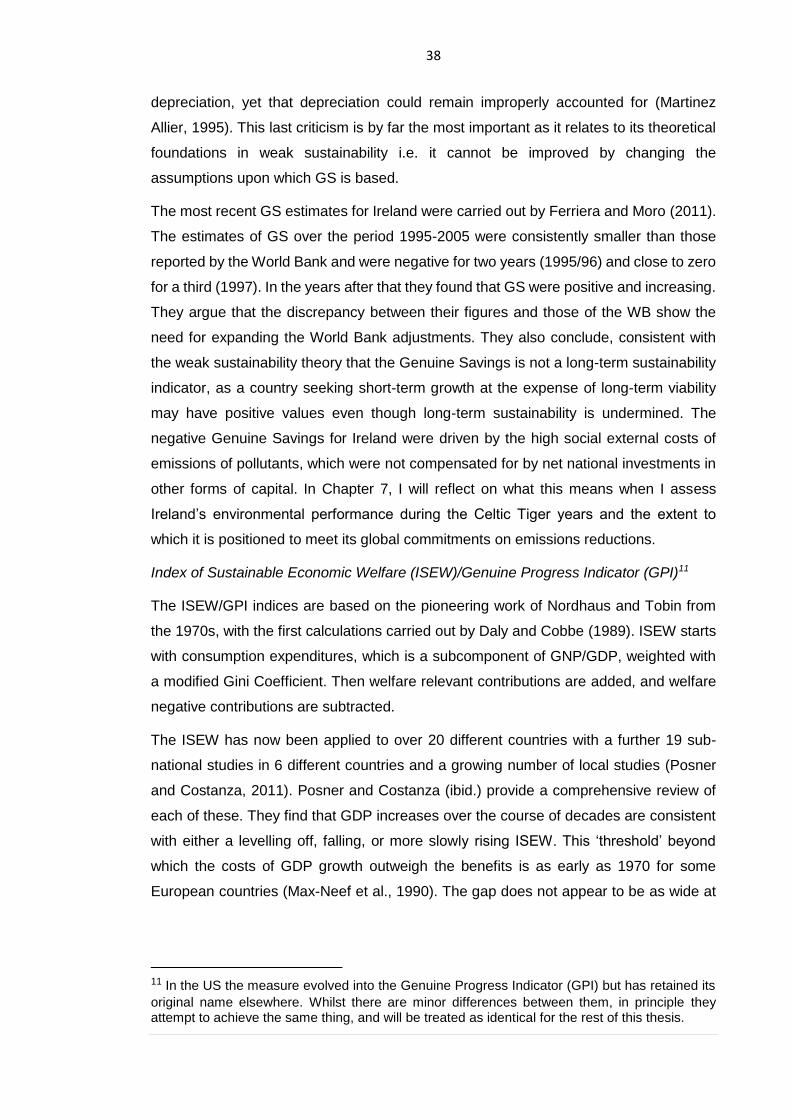
38
depreciation, yet that depreciation could remain improperly accounted for (Martinez
Allier, 1995). This last criticism is by far the most important as it relates to its theoretical
foundations in weak sustainability i.e. it cannot be improved by changing the
assumptions upon which GS is based.
The most recent GS estimates for Ireland were carried out by Ferriera and Moro (2011).
The estimates of GS over the period 1995-2005 were consistently smaller than those
reported by the World Bank and were negative for two years (1995/96) and close to zero
for a third (1997). In the years after that they found that GS were positive and increasing.
They argue that the discrepancy between their figures and those of the WB show the
need for expanding the World Bank adjustments. They also conclude, consistent with
the weak sustainability theory that the Genuine Savings is not a long-term sustainability
indicator, as a country seeking short-term growth at the expense of long-term viability
may have positive values even though long-term sustainability is undermined. The
negative Genuine Savings for Ireland were driven by the high social external costs of
emissions of pollutants, which were not compensated for by net national investments in
other forms of capital. In Chapter 7, I will reflect on what this means when I assess
Ireland’s environmental performance during the Celtic Tiger years and the extent to
which it is positioned to meet its global commitments on emissions reductions.
Index of Sustainable Economic Welfare (ISEW)/Genuine Progress Indicator (GPI)11
The ISEW/GPI indices are based on the pioneering work of Nordhaus and Tobin from
the 1970s, with the first calculations carried out by Daly and Cobbe (1989). ISEW starts
with consumption expenditures, which is a subcomponent of GNP/GDP, weighted with
a modified Gini Coefficient. Then welfare relevant contributions are added, and welfare
negative contributions are subtracted.
The ISEW has now been applied to over 20 different countries with a further 19 sub-
national studies in 6 different countries and a growing number of local studies (Posner
and Costanza, 2011). Posner and Costanza (ibid.) provide a comprehensive review of
each of these. They find that GDP increases over the course of decades are consistent
with either a levelling off, falling, or more slowly rising ISEW. This ‘threshold’ beyond
which the costs of GDP growth outweigh the benefits is as early as 1970 for some
European countries (Max-Neef et al., 1990). The gap does not appear to be as wide at
11 In the US the measure evolved into the Genuine Progress Indicator (GPI) but has retained its
original name elsewhere. Whilst there are minor differences between them, in principle they attempt to achieve the same thing, and will be treated as identical for the rest of this thesis.
39
the subnational level, nonetheless GDP-equivalents are found to consistently overstate
the welfare of regions when compared with the ISEW.
The ISEW has been criticized on many of the same grounds as Genuine Savings: the
arbitrary nature of the chosen adjustments, the lack of a theoretical foundation
(Neumayer, 1999, 2000). In addition, there is an element of arbitrariness to what
constitutes ‘defensive spending’.12 Cobb and Cobb (1994) for example consider most
schooling to be defensive. The argument being that people attend school because others
are in school and the failure to attend would mean falling behind in competition for
diplomas or degrees that confer higher incomes on people. However, other versions
have chosen to count education as consumption (Jackson and Marks, 1999). In some
iterations, some health expenditure is also considered defensive but as Neumayer points
out, food and drink could equally be considered defensive against hunger and thirst
(Neumayer, 1999). Like Genuine Savings, natural resources are accounted for in the
country within which they are extracted, which can mean that one region's economic
welfare is being artificially supported by externalizing costs to another region.
2.3.2 Synthetic indicators
A composite indicator is formed when individual indicators are compiled into a single
index based on an underlying model. The composite indicator should ideally measure
multidimensional concepts, which cannot be captured by a single indicator (Nardo et al.,
2005). Composite indices are often trying to attach a number to an important, but
unobserved, concept (Ravallion, 2011). The aim is to bring greater clarity and
understanding to a large dataset by collapsing it into something easier to digest (ibid.)
There has been a phenomenal growth in the development of composite indices in recent
years. In 2008 Bandura (2008) found that of the 160 composite cross-country indices in
existence, 83% had been generated since 1991 and 50% in the five years prior to her
study. By contrast before 1991 there were fewer than 20% of the composite indices found
that are available today.
Foa and Tanner (2012) identify four reasons for the popularity of composite measures:
• Ability to summarize complex issues allowing policy-makers to have tractable and
representative sense of a situation
• A single estimate provides ease of interpretation and allows social value to be
assessed over time
12 This refers to public spending that is not welfare-enhancing. Spending on expanding the prison
population is a good example.
40
• Facilitates communication with citizens because it forces regular updating of data
on relevant measures
Despite their growing popularity composite indicators remain controversial (Cherchye et
al., 2007). Criticisms focus on the subjectivity involved in indicator choice, the
dependence of country rankings on the preliminary normalization stage and the
disagreement amongst experts on the approach to weighting (ibid.) As McGillivray and
Noorbakhsh have written: “Irrespective of how elegantly and emphatically the
justifications for components choices might be articulated, in the final analysis the
selection is ad hoc.” (2004, p. 3). A further problem is that questionable assumptions can
be hidden in the data and important trade-offs between different dimensions are not
made explicit (Ravallion, 2011).
Composite indices also give rise to several tensions, most notably between the need for
universalism and specificity and between completeness and parsimony. Universalism
such as that espoused by the Human Development Index attempts to capture common
human capabilities such as health, education and income. The problem with
universalism is that in striving for commonality it loses the specificity of contextual
experience for a specific country or group of countries. This leads to the exclusion of
some elements such as security (McGillivray and Noorbakhsh, 2004) and human rights
(Dasgupta, 1990). It is not possible for an index to be both universal and specific, which
is an inherent flaw. The alternative, as advocated here, is to develop country-specific
indices that are sensitive to cultural norms and socio-economic objectives, but this loses
any element of comparability between countries, which for some composite indices is
their main purpose. However, striving for comparability assumes it is a worthwhile goal
of such measurement, which is something that I question in this thesis and return to later.
In addition, it is not possible to have a complete and exhaustive list of indicators.
Developers need to take a view on the optimum number of indicators and be prepared
to lose some pieces of information in the interests of parsimony. Foa and Tanner (op.
cit.) cite at one extreme the Worldwide Governance Indicators that uses 300 indicators
from 33 different data sources (Kaufmann et al., 2007). At the other extreme is the
Human Development Index (HDI) that uses six items in total (Verenigde Naties, 2007).
Foa and Tanner argue that the decision as to whether to adopt a parsimonious or
comprehensive approach depends on the latent variable that the measure is intended to
capture (ibid.). In this example, measuring social value is much more complex and
requires a more comprehensive set than say diabetes which might reasonably rely on
just a few indicators.
41
A final criticism of composite indicators is that the choice of variables sometimes
confuses wellbeing means with ends. Even measures like the HDI use things like health
spending as a proxy for health outcomes. This is highly problematic as it ranks the US
health system more highly than others like France that have much more efficient and
effective systems. Sometimes, means and ends are mixed within the same index. We
might agree that adult literacy is an outcome but school enrolment an output (or means
to the end) but these are sometimes treated a being equivalent pieces of information.
(Booysen, 2002; McGillivray and Noorbakhsh, 2004; Veenhoven, 1996). In this section I
discuss the Human Development Index in more detail, as it is the composite that has
received the most attention and the highest level of acceptability to date.
The Human Development Index
The HDI was created by the United Nations as an explicit challenge to the notion of
comparing countries in relation to economic growth. Instead it argues that this
comparison should be based on people and their capabilities. The framework that
underpins it is based on the work of Amartya Sen (e.g. Sen, 1976, 1979). The theoretical
framework - The Capability Approach - provided by Sen is a good starting point for any
attempt at social value measurement. For Sen, ‘poverty’ is when people are deprived of
the capability to live a life which they have reason to value.
There are three dimensions to the HDI: health (as measured by life expectancy),
education (as measured by years of schooling for adults and expected schooling for
children) and standard of living (measured using the logarithm of income, to reflect the
diminishing importance of income with increasing GNI). To its credit, the HDI has
achieved something no other alternative has, which is considerable credibility and buy-
in from across the political spectrum. However, its saleability may depend entirely on it
being uncontroversial. Indeed, it is heavily GDP dependent and some argue that the
components are too highly correlated with GDP to make it worthy as an alternative.
(Dijkstra and Hanmer, 2000; McGillivray and White, 1993; Cahill, 2005). McGillivray has
even gone as far as saying that the HDI, “…is yet another redundant composite
intercountry development indicator.” (McGillivray, 1991, p. 1467). Van den Bergh et al.
(2014) in their review argue that the HDI is the least attractive of the alternatives from a
methodological standpoint and that it is certainly unsuitable for wealthy countries. Yet
despite its failures (and perhaps because of some of them), the HDI is perhaps the only
alternative indicator described here that has achieved a measure of success and to gain
enough legitimacy to become institutionalised (Boulanger, 2008).13
13 see Gadrey and Jany-Catrice's (2003) and Sharpe (2004).
42
Several studies have suggested that the HDI weighting scheme is overly subjective, or
even random and that alternative (plausible) weights would greatly affect the ranking
(Noorbakhsh, 1998). In addition, Stiglitz et al. (2009) point out that adding the logarithm
of per capita GDP to the level of life expectancy implicitly values an additional year of life
expectancy in the United States as worth 20 times an additional year of life in India. They
also criticize it for not taking account of the distribution of outcomes within each country.14
From the perspective of this research, the HDI is more appropriate for measuring change
in developing countries. For countries where public services are quite well established,
and incomes are already high, these indicators are less sensitive to change, and
therefore less relevant. Ireland’s HDI was fifth in the world in 2010 at 89.9. This has been
unchanged since 2007 demonstrating that it is not sensitive enough to reflect (or predict)
the crisis that developed there. Moreover, it does not aim to play this role (see England
(1998) for a critical discussion of the HDI as a measure of welfare in developed
countries).
2.3.3 Dashboard approach
The dashboard approach is similar in design to a synthetic index but stops short of
aggregating indicators into a single index. As such, dashboard approaches avoid some
of the criticisms set out above in relation to the risk of information loss and arbitrary
selection. However, there are also problems with dashboards and they arguably avoid,
rather than resolve the issues raised with synthetics. According to Stiglitz et al., they
suffer because of their heterogeneity and provide little information about the hierarchy of
different indicators. In addition, and perhaps most importantly, they lack what has made
GDP a success, the attraction of a single headline figure to convey socio-economic
performance (Stiglitz et al., 2009, p. 63).
Michalos (2011) argues that dashboard approaches reinforce the already siloed
approach towards generating statistics. This leads to the collection of needless data,
rather than seeing a dataset as a complete whole, as it discourages researchers from
raising concerns about the completeness of existing stocks of statistical time series and
correlations between indicators housed in each silo. In terms of informing policy, it is
difficult to move beyond “…some kind of a cost-benefit dominance of values, i.e., one
counts the number of indicator values showing positive movement compared to the
number showing negative movement...” (2011, p. 118).
14 An inequality-adjusted version does exist but is not the headline indicator
43
One notable example of a dashboard approach is the OECD Better Life Index. This
Initiative focuses on developing statistics to capture aspects of life that “matter to people”.
These are based on the OECD’s own experience of measuring social change, so
reflecting the priorities as identified by OECD researchers. The approach is designed to
allow the reader to create their own index based on what they value, so the rankings of
countries will vary depending on the importance individuals place on a particular
dimension. The OECD believes that this avoids the issue of arbitrary weights (OECD,
2013). It acknowledges however that the framework covers dimensions of well-being that
are universal and that they may be usefully complemented by “national similar initiatives,
which can add context-specific information on what constitutes a good life” (OCED, 2016)
2.3.4 Single indicators
Conceptually, single indicators are the easiest to explain as they use a single variable to
represent an outcome such as well-being or environmental impact. The issues of
complexity and aggregation that dominate other approaches, including the GDP, are
therefore absent (Barrington-Leigh and Escande, 2017). They are also very influential
and reports that use them are widely reported in the press (ibid.). The most relevant to
this research are SWB measures such as life satisfaction and happiness. As discussed,
the last two decades have seen a substantial growth in interest in well-being or
happiness studies.15 Most of the recent interest has come from an interdisciplinary focus
in economics, which now incorporates aspects of psychological theories – such
behavioural theory - to expand and ‘humanise’ abstract economic theory. Many
economists, seeking an improvement on consumption-based definitions of utility have
seen happiness as a more holistic way of building a utility function into quantitative
models. Improvements in the ‘science’ of well-being measurement has been thought to
provide an alternative that overcame the obvious problems with the standard utility
function (Bok, 2010).
However, as we will see later, although empirical findings from well-being studies have
been very informative, for example by highlighting the Easterlin paradox, they can lose
their explanatory power in some contexts. For example, they are often too ‘global’ to
distill to specific policy recommendations i.e. there are too many potential explanatory
variables. SWB measures are also often quite stable over time (including in Ireland). So,
although there may be short-term fluctuations over the longer-term it is difficult to link
15 In 2006 Kahneman and Krueger (2006) identified only 4 papers on subjective well-being from
1991-1995. Clark, Frijters and Shields (2008) put the figure at 173 papers for the 2003-2006 period. In 2012 the World Database of Happiness (2012) had 3,478 reports that include empirical investigations using accepted measures of happiness.
44
them to policy changes. This lack of sensitivity to policy reduces the usefulness of these
measures as complete measures of social value. Finally, and in contrast to the
conceptual approach I will develop, they are based on a narrow representation of what
matters i.e. only subjective perceptions of how well one’s life is going. The risks with an
entirely subjectivist view of value is discussed in Chapters 3 and 5.
2.4 The politics of measuring social value
In this final section I ask why, if there is so much support for alternatives from academics,
NGOs and even some policy makers has so little progress been made in seriously
considering adopting one of these approaches? The politics matter because even if all
of the weaknesses in alternatives could be eradicated, GDP will never be replaced
unless there is the political will to do so.
Van den Bergh (2009) suggests that we need to look to psychology and behavioural
economics for reasons as to why we persist with GDP. One explanation is that it is a
case of ‘bounded rationality’. This was an idea originally advanced by Herbert Simon
(1972) who argued that uncertainty and incomplete information limit the extent to which
we can make rational decisions. Bounded rationality implies that humans take reasoning
shortcuts that may lead to suboptimal decision-making. So even though we know GDP
is flawed, it offers a simple, easy-to-understand answer to the complex question of
whether we are making progress.
A second explanation is historical lock-in. GDP measurement came about because of
accidents of history and now an element of docility and an uncritical nature allow it to
remain in place. Huge resources also go into measuring GDP and the infrastructure for
doing so is well-established (van den Bergh, 2009). These ‘sunk costs’ make it more
difficult to make a break with it. The economist John Quiggin uses the term ‘zombie
economics’ to describe how ideas that are discredited still retain a currency even when
they have been shown to be ineffective (Quiggin, 2010). Quiggin writes about this in
relation to the economic policies that led to the 2006/7 financial crisis, which continued
in many countries after they had been shown to be ineffective. This analysis could
similarly be applied to GDP.
Politicians may (perhaps correctly) see little electoral gain in questioning GDP, especially
in times of recession as it is closely associated in people’s minds with employment. GDP
figures, for all their faults are a known quantity whereas alternative data might force
politically difficult policy changes. It has been suggested that this was behind China’s
decision to halt their Green GDP program (Liu, 2016). Vested interests that already
benefit from the system have little to gain from changing it. The implications of this are
45
very important for this thesis i.e. identifying what needs to be changed in the political
landscape to make alternatives acceptable may be as important as finding the right
alternative, even more so. I return to some of the political barriers in the concluding
chapter.
2.5 Conclusion
In this chapter I have also described the history of GDP and how it became so closely
associated with ideas of societies’ performance. I show how during the good times of the
post-war settlement GDP became embedded as an institution in Western democracies
and the USSR, and became an important measure of comparison between communist
and capitalist societies. However, by the 1960s Robert Kennedy had made his famous,
and highly prescient speech, on the deficiencies of GDP and called the need for broader
measures (DiTella and MacCulloch 1995). In the 1970s, several pieces of data began to
emerge which challenged the efficacy of GDP measurement to enable the pursuit of
social goals. The Easterlin Paradox identified a trend of flat or declining subjective well-
being, the Limits of Growth thesis highlighted the ecological impacts of growth, trends
towards more postmaterial values suggested that material concerns were being
deprioritised and finally, the multiple capitals approach demonstrated the importance of
natural and social capital to a well-functioning society. This led to a search for alternative
indices of social value. Monetary measures sought to ‘adjust’ GDP for positives and
negatives, synthetic measures sought to create a composite of individual indicators that
were deemed important, dashboard approaches reported on similar kinds of indicators
that are disaggregated to avoid some of the problems with synthetics, and single
indicators avoided many of these challenges but can have limited policy application.
All the approaches have assets and limitations, as have been outlined here. What is
clear is that there is no perfect alternative. Reflecting on these strengths and weaknesses
I make a case (limitations notwithstanding) for synthetic indices. The main reasons are
that they allow for a holistic set of indicators to be included but also provide a single
figure that can rival GDP. As we will see in Chapters 4 and 7, a synthetic indicator also
allows for a stronger approach to sustainability than is required in the monetary
approaches. The politics of measuring alternatives is also important here i.e. it doesn’t
matter how good alternatives become if there is no political will to change the system. I
conclude the chapter by briefly discussing the psychological and political reasons why
GDP exists.
In this chapter I have discussed the tension between universality – being general enough
to be comparable - and specificity – being specific enough to be culturally relevant - in
46
synthetic indices. Many indices appear to sacrifice the latter for the former. Central to
this is the need for comparability across countries. As with GDP, comparability is at once
an index’s greatest strength and greatest weakness. Approaches such as the HDI
include data on many countries but in doing so exclude large areas of life that people
might find important. I argue that we should not fetishize comparability in such an index
because it is not always relevant to whether a country is creating social value for its
citizens. Of course, we will want to learn from other countries and comparison enables
that, but we can do this using individual indicators, or dashboards, rather than
overworking the data to fit with a perfectly comparable index. In the universality vs
specificity debate, I therefore argue that the latter is more important. This will be returned
to again in Chapter 7 where I describe the conceptual framework in more detail.
A key objective of this research is to set out a framework for identifying the things that
matter to people so that a set of priorities can be established that do not use growth as
a starting point. Some of these priorities will require growth, some will not, and some
may require different kinds of growth. In this way, it may be possible for nations to judge
the extent to which growth furthers social value and under what conditions. In the next
chapter, I begin to develop the conceptual framework of this thesis by exploring theories
of value from ancient to modern times. I return to first principles by asking ‘what is value’,
and start to develop a framework for building an index of social value that is based on
this theoretical exploration.
47
Chapter 3 Theoretical framework: The theory of value
3.0 Introduction
The issue of value unifies the study of a variety of questions—economic, ethical and
moral (Heathwood, 2012). Value theory is a catch-all label used to encompass all
branches of moral philosophy, or at least any which are deemed to have an evaluative
aspect (Schroeder, 2013). It is similar to axiology, which is primarily concerned with
classifying what things are good and how good they are (Hartman, 1967). Well-being
has similar philosophical origins as value theory. When Jeremy Bentham talked about
the greatest happiness for the greatest number not only was he prefiguring the
measurement of well-being, but he was also making an axiological claim about how and
for whom value was being created.
Although sometimes referred to as a ‘new science’, the search for happiness has ancient
roots. It has been a constant narrative throughout history from ancient fairy tale weddings
to 21st century lifestyle guides, and folk traditions in every culture refer to it. Questioning
the nature of goodness and happiness has a long philosophical tradition (Carson, 2000).
Beginning with Socrates and Plato, and formalised by Aristotle, the idea of happiness
was not a temporary emotional state as we might think of it today, but a life well lived. In
this tradition, Cicero famously claimed that a happy man would be happy even on the
torture rack (McMahon, 2006). With the spread across Europe of the Judeo-Christian
tradition came the idea that happiness was something that could not be attained in this
life. McMahon argues that prior to the 17th century people thought of happiness as a
matter of divine favour or a reward for virtue and points to the fact that in all Indo-
European languages (including Greek and Latin) the origin of the word happiness is a
cognate with the word for luck or good fortune (McMahon, 2006).
The Enlightenment, which began with the scientific revolutions of the sixteenth and
seventeenth centuries, swept away this medieval world-view and led to dramatic
upheavals in science, philosophy, society and politics. Superstition and unquestioning
faith were replaced with appeals to reason and scholarship. It was characterised by a
belief in the idea of progress, the expectation that the human lot could be improved, and
information arrived at through the scientific method was elevated to the highest form of
knowledge. Suffering and pain were no longer a function of divine retribution, or
misfortune to be endured for future happiness but ‘bads’ that could and should be
eradicated through the application of science. John Locke declared at the end of the 17th
century that the business of men is to be happy in this world (Locke, 1677). The
Enlightenment definition of happiness, popularised by the utilitarians, was of an
48
emotional state that contained a greater amount of pleasure than pain. There was little
advance on this position until the 20th century which, as mentioned, has seen an
explosion of research on happiness and well-being including a rediscovery of ancient
perspectives. For example, recent scholars have explored the contribution of altruism
(Music, 2014), autonomy (Deci and Ryan, 1985), and meaning (Peterson et al., 2005) to
well-being, all of which share similarities with the Greek concept of virtue.
This section reviews the main theories of value that have been advocated beginning with
the ancient philosophers. This is a broad, multi-disciplinary literature that is difficult to do
justice in a limited space. It is frustrated further by the fact that there is no consensus
among modern-day philosophers concerning which general kind of theory of well-being
or value is the right one (Heathwood, 2014).
The first section starts with a discussion of the history of value theory and its evolution
into utility and then well-being. This leads on to a discussion of what we mean by ‘the
good’ and how a priori reasoning on the nature of the good life can inform the research.
This is a philosophical question that is different but related to the empirical question of
what makes us happy (Feldman, 2012). This philosophical reflection should provide the
conceptual foundations for the primary research that is to come.
3.1 The history of the philosophy of well-being
3.1.1 Ancient Greece
Greek philosophy was dominated by one question: ‘what makes a good life?’, and each
of the great philosophical schools developed highly influential answers to this question.
‘Eudamonia’ loosely translates as the Greek word for happiness and its mention in the
Socratic Dialogues is probably the earliest philosophical reference to it. A more accurate
translation would be the state of living in accordance with one’s ‘daimon’ or ‘true self’.
The daimon is one’s personal state of excellence, which gives life meaning and direction.
Eudamonia is therefore the condition of self-realisation (Waterman, 1993). Socrates
considered virtue16 to be both necessary and sufficient for eudemonia and thought it was
what human beings wanted more than anything else. In the Republic Plato defends virtue
as the most important constituent of eudemonia against the sophist charge that
conventional morality prevents the strong man from achieving eudemonia (Plato, 2007).
Aristotle developed this idea further and most of the Nicomachean Ethics is an enquiry
into human well-being. Like Plato, he considered virtue to be the most important
16 Virtue to the Greeks was a state of moral excellence, which emphasised the importance of character, principle and moral goodness
49
constituent in eudamonia, but he also acknowledged a role for external qualities such as
wealth and beauty. He held that to have a good life was to fulfil one’s purpose or essential
nature as a human being (Aristotle, 1962). The virtue ethics that these philosophers
developed emphasised the character and habits of the actor and their ability to lead an
‘examined life’.
Also of great concern were the relative merits of a life of pleasure compared with a life
of philosophical reasoning. In Philebus, Socrates’ friend defends the life of pleasure by
maintaining that pleasure is the good, while Socrates contends that wisdom, right
opinion, and right reasoning are better than pleasure. Socrates argues that if a man
cannot appreciate his life through philosophical reasoning then it is no better than that of
an oyster. Eventually Socrates and his fellow discussants agree that the good life is one
with a measured mix of the two (Plato & Jowett, 1937). Epicurus argued that pleasure
and pain were the basic human experiences and that it was necessary to minimize pain
and maximize pleasure to live well. Epicurianism was about more than pure hedononism
however; it acknowledged that pain was sometimes necessary to gain happiness and
that sometimes pleasure leads to more suffering than it was worth.
By contrast, the Stoics emphasised the importance of duty, self-control and mastering
your emotions at the expense of external or material factors. Stoics like Seneca agreed
with Socrates that "virtue is sufficient for happiness". From the teachings of Plato, they
derived four cardinal virtues: wisdom, courage, justice and temperance.
Whereas Stoics and Aristotelians believed that the acquisition of knowledge was
essential for a happy life, Sceptics believed that knowledge of truth was impossible. The
school’s founder Pyrrho was influenced by Eastern traditions such as Buddhism and
believed that the suspension of judgment was a means to achieving the freedom from
‘disturbance’ that can lead to happiness. The Sceptics argued that Socrates had
revealed to us how little we really know about truth or God and that over-dogmatic beliefs
caused ‘emotional disturbances’.
There has been relatively little philosophical advance on these positions in the
intervening period. Today we still speak of hedonistic versus eudemonic conceptions of
happiness and Epicureanism and Stoicism have entered the lexicon to describe different
philosophies of life. Mastery, self-control and purpose are all standard measures of
psychological well-being. Empirically we have discovered that Aristotle was right, that
internal and external factors both influence our happiness, but we might also argue in
the Socratic tradition that knowledge is a candidate for good that has ‘intrinsic value. We
50
can even see the influence of the sceptical position in the popularity of the eastern
philosophical tradition today.
With the spread of monotheism in Europe, virtue ethics gave way to deontological ethics
where the emphasis was on appeals to a deity and the intrinsic rightness or wrongness
of an action. The next major movement in value theory took place during the
Enlightenment with the development of utilitarianism and consequentialism, which
sought to replace ethical principles based on appeals to a higher power with appeals to
reason. Crucially, the role of governments in creating a utilitarian framework and shaping
the conditions under which value would be also grew in importance.
3.1.2 Classical Utilitarianism
Utilitarianism is a highly influential ethical philosophy, developed by Jeremy Bentham.
The utility principle was based on the axiom that “it is the greatest happiness of the
greatest number that is the measure of right and wrong” (Bentham, 1776). Like Epicurus,
Bentham saw pleasure and pain as mankind’s two ‘sovereign masters’ (ibid.). Bentham’s
was also an arch-consequentialist.17 He did not believe in intrinsic value (or disvalue)
and so did not think of any law as being intrinsically wrong, it was the effect that the law
had, it’s implication for overall utility that mattered. Such a law in another context might
be a good law.
Many of the critiques of utilitarianism are actually critiques of consequentialism, and there
are numerous well-worn examples that highlight the potential grotesqueness of the
extreme consequentialist position: the fat man being pushed in front of a train that will
kill five workers trapped on a track, the surgeon that has five patients dying of organ
failure and one healthy patient that can save the five. These critiques are undermined
by the safeguard (which Bentham also espoused) that some special laws (or rights)
should be upheld within a broadly consequentialist framework (i.e. the right to life)
(Bentham, 1781).
A leading critic of the period was Thomas Carlyle who famously described utilitarianism
as the ‘philosophy of swine’, because it assumes equality of all pleasures whether of the
lowest pleasures of animals or the highest of aesthetic appreciation (Crisp, 2013). This
makes a very long life of a lower simple creature (Socrates’ oyster for example)
preferable to a well-lived human life and creates a moral equivalence between harming
17 The two are sometimes considered part of the same philosophical position but this is
inaccurate as it is possible to be both a utilitarian and a non-consequentialist (Eggleston & Miller, 2014).
51
animals and humans that most people would find objectionable. He also criticized it for
reducing “God’s-world…[to a balance]…for weighing hay and thistles on” (Carlyle, 1993).
John Stewart Mill, a student of Bentham’s and a friend of Carlyle, responded to these
criticisms by developing the idea of higher and lower pleasure. Bentham had argued that
duration and intensity were important components of utility, and Mill added a third –
quality. The claim is that some pleasures, by their very nature, are more valuable than
others. To those that might argue that everyone might not enjoy reading Shakespeare,
he responded that it was because they had not had the pleasure of the experience: it
was better to be a dissatisfied Socrates he argued than a satisfied fool (Mill, 1863). Mill
was essentially making the case for certain goods having intrinsic value irrespective of
whether they were widely appreciated or not.
Although often associated with individualistic philosophical traditions, arguably it was the
first theory of value that was concerned with how people live together, rather than how
they live in relation to themselves or a god. Bentham and Mill were both radical social
reformers that were concerned with changing corrupt laws and social practices, and they
offered utility as an enlightened way of assessing the appropriateness of a law (Crisp,
2013). Bentham promoted the utility principle on the part of governments as well as
individuals, and was very much concerned with societal calculations of utility. Later
utilitarians such as Sidgwick however were attracted to more individualistic strains like
psychological egoism and went on to influence 20th century neoclassical economists,
such as Alfred Marshall (Martinoia, 2003).
Utilitarianism is a powerful idea, and although its appeal has waxed and waned it has
remained influential, even amongst those that reject it, and it continues to occupy a
central place in moral philosophy (Eggleston & Miller, 2014). A more modern definition
might be that of Timmons where “An act is right if and only if (and because) it would (if
performed) likely produce at least as high a utility (net overall balance of welfare) as
would any other alternative action one might perform instead” (Timmons, 2013, p8). The
relativity introduced into this statement enables utilitarianism to compare different policy
options, which is why it has been so influential on policy makers that seek a basis for
making such comparisons.
3.1.3 The science of happiness
The first empirical studies on subjective well-being (SWB) began in the 20th century.
Angner describes its emergence as an area of scientific study as early as 1917, the year
in which a paper was published promoting the discipline of ‘eupathics’ (2011). He
describes an “uninterrupted stream of research” going back to the 1920s and disputes
52
its recent description as a ‘new science’ (e.g (Layard, 2005). For example, in 1925, Flugel
published a quantitative study on feelings and emotions of participants and SWB-type
measures were used in marital success studies in the 1920s and educational psychology
in the 1930s (Angner, 2011).
By the 1960s studies of subjective mental health were carried out by epidemiologists
sometimes using large representative samples (Angner, 2011). Empirical work on well-
being grew rapidly in the 1980s and 90s. Some of the reasons for this were discussed in
Chapter 2. Further relevant trends included an increase in material abundance which
sparked an interest in quality of life issues (Kahneman et al., 2003) wider societal trends
that placed greater value on the individual (Diener et al. in Snyder and Wright, 2001) and
the rise of positive psychology18 (Diener et al., 1999).
Those that were concerned with the shortcomings of economic measures such as GDP
also began to take an interest. The social indicators movement emerged in the late 1960s
(Campbell, 1976) to attempt to capture the ‘goodness of life’ (Andrews, 1989, p. 401). It
was focused on generating statistics on life expectancy, health, housing etc. Over time,
academics working on social indicators began to play a role in the development of
subjective measures, which they saw as a more direct way of capturing the quality of
people’s lives (Angner, 2011). Concepts like happiness and life satisfaction began to be
measured as domains of well-being. The sophistication of the research in this field has
increased substantially and most practitioners draw on different historical traditions to
incorporate an expanded notion of what we mean by well-being (cf. Dolan et al. 2010).
Although initially treated with scepticism as being either too scientific or not scientific
enough, these types of measures are now widely accepted as having scientific merit and
have become influential in policy circles (Diener et al., 1999). The next section discusses
contemporary theories of value and how they influence its conceptualization and
measurement.
3.2 Modern theories of value
A central concern to modern day philosophers of value is the subjectivist/objectivist
debate (Heathwood, 2014). A subjectivist thinks that only things that matter in our lives
are those that we want and know we want whereas the objectivist thinks that there are
things that are good for us even if we don’t want them or know that we want them. A
18 Positive psychology was a response to the previous emphasis in the discipline on psychological
pathology. The aim was to use the scientific method to study and determine positive human development, rather than the presence or absence of mental illness (Seligman and Csikszentmihalyi, 2000).
53
theory of welfare is subjective if it makes your well-being at least in part depend on your
set of attitudes or concerns. (Sumner, 1996).
A useful way of discussing the dichotomy is through taxonomy developed by Parfitt
(Parfit, 1986):
1. Hedonism, according to which pleasure or enjoyment is the only thing that
ultimately makes a life worth living;
2. Objectivism (or object list/objectivist) according to which at least some of what
makes our lives better does so whether or not we desire it, or it gives us pleasure
(Crisp, 2015)
3. Desire theory, according to which what is ultimately in a person’s interest is
getting what he wants
Before discussing the taxonomy in detail, I begin with a summary of ideas in relation to
the concept of intrinsic value. Intrinsic value is something that has value ‘in itself’, or ‘for
its own sake’ and is not derived instrumentally. For those that advocate its existence, it
takes priority over extrinsic value, which is merely derivative or reflective of intrinsic value
(Zimmerman, 2010).
One of the first writers to concern himself with the question of what exactly is at issue
when we ascribe intrinsic value to something was G. E. Moore. Moore was a prominent
critic of the notion of well-being not because he disagreed that we should search for the
good but because he objected to the idea of ‘good for’ (Moore, 1993). His aim was to
challenge ‘teleological’ or end-based notions of value promoted by consequentialists
such as Sidgwick. He argued that when someone says that ‘pleasure is good for me’,
they can only mean that the pleasure is good but that nothing can be added by saying
that it is good ‘for me’. He argued that a beautiful object had value independent of any
pleasure it might generate in a viewer, and that a world that contained just one Vermeer
painting but nobody to appreciate it was a better world than an empty world that
contained one person living a life that they valued.
There are many different answers to the question “What things are intrinsically good?”
Bentham thought it was pleasure; Nietzche thought it was strength, Kant thought it was
a good will, Aristotle thought it was eudamonia and GE Moore thought it was beauty.
Those that think there is only one intrinsic good are known as monists and those that
think there is more than one are known as pluralists. For example, Bentham was a monist
because he singled out only pleasure as having intrinsic value whereas all other goods
or attributes were valuable only insofar as they have implications for pleasure or pain.
Mill we might think of as a pluralist, as his identification of higher and lower pleasures is
54
making an a priori case for a certain set goods (e.g. high arts) as having intrinsic value.
The validly or otherwise of intrinsic value is central to any of the modern theories of value
described in this section.
3.2.1 Hedonism
Hedonism is generally associated with the tradition of Epicurus/Bentham. It is not,
however, necessarily the egoistic view that one should only be concerned with one’s own
pleasures and pain and hedonists often emphasize - in the tradition of Mill - the greater
reliability and permanence of intellectual, aesthetic or moral pleasures. As discussed,
Mill considered these pleasures to have a much higher value than bodily pleasures of
equal intensity and duration. Psychological hedonism has more similarity with egoism
where your own pleasure is the intrinsic good. Pure egoism is a rare thing and has been
described by one philosopher as ‘solely a creature of economic textbooks (Sumner,
1996)
What is attractive about hedonism - what Bentham was attracted to - is that it appears
to provide a common metric that enables us to compare two very different experiences
(Sumner, 1996). One objection to this approach, however, is that it relies entirely on
one’s mental state and not on the way the world is, which makes the common metric
less common that we might at first think. Cross-cultural research suggests that people
differ in the importance that they place on hedonic experiences (Diener et al., 2000; Oishi
et al.,1999). Robert Nozick brought this objection to life with his thought experiment, the
‘experience machine’. Nozick imagines someone who is plugged into a machine, which
provides them with intensely pleasurable experience. Nozick, making a case for desire
theory or ‘preferentism’ asks if it matters that the person is not satisfying their desires
such as climbing a mountain or falling in love unbeknownst to themselves? On this
theory, a life on the experience machine will be in many ways worse than an ordinary
life, in which many desires about the external world are satisfied. Nozick argues that we
want to do things, not just experience them, and want to be certain types of people
(Nozick, 1977).
Baber (2008) counters that we should not accept the terms of the thought experiment
and that this is only acceptable according to the desire theory of value where well-being
consists of getting what you want. In a similar vein, Donner responds that philosophers
should not be expected to take seriously remote, ‘desert island’ examples that are thrown
at them. She argues that it is implausible that the ‘plugged in’ person is having a
hallucinatory experience and that it therefore does not count (Donner, 1991).
55
Nonetheless, it does remind us of the importance of taking account of what philosophers
call ‘pro-attitudes’19 in any conceptualisation of wellbeing (Fletcher, 2013).
In a similar vein, Carson gives us the ‘contented pig’ example. He compares the well-
being of a lonely, unfulfilled, badly-paid academic and a pig with the perfect conditions
for ‘hog heaven’. The objection to hedonic value is that it is possible to imagine a world
where the pig’s life is superior, yet it is still implausible that anyone would chose to be a
pig over a human (Carson, 2000). Mill accepted this when he wrote: “Few human
creatures would be content to be charged into any of the lower order animals for the
promise of the fullest allowance of that beast’s pleasure” (Mill, 1863, p. 311).
3.2.2 Objective List Theories
Objective list theories are usually understood as theories that seek to identify the
ingredients of well-being or the good life such as income, friendship to education. As the
name suggests, objective list theory takes an objectivist view of well-being and would
advance a definition of well-being with more similarity to welfare than to psychological
states outlined earlier. Proponents of objective list theories tend to be axiological realists.
Contrary to desire theorists, they hold that certain things are good independently of
whether anyone would want them or believes they are good, even if they were rational
and fully informed (Carson, 2000). The main concern for objectivism is how to decide
which goods are included, as well as how to compare and rank them. Without some
recourse to a set of principles or pro-attitudes this could be very challenging (Heathwood,
2010).
This leads to an obvious objection to list theories i.e. that they are attitude dependent
and therefore violating of autonomy (Fletcher, 2013). As mentioned earlier, there are
considerable cross-country differences in values and requirements of basic needs
meaning that the same fulfilment of needs might lead to different levels of well-being.
Even if you have different lists for different people, there is a risk that you exclude things
that matter to well-being and that the list reflects the researcher’s, rather than
participant’s interest (Tiberius, 2004). In its defence, Fletcher argues that this can be a
charge against all theories except desire theory. This can even be true of hedonism. He
gives the example of the ascetic who eschews pleasure because he thinks it is corrupting
(Fletcher op. cit.). A related objection might be that the approach is elitist. However, Crisp
19 Pro-attitudes are positive attitudes towards something and the opposite of con-attitudes
56
points out that elitism is not a philosophically sound criticism because it is possible to
take an elitist approach and for it also to be true (Crisp, 2013).
This theory is often associated with the work of neo-Aristotelians such Amartya Sen and
Martha Nussbaum (2011). Sen’s work on capabilities and functioning has already been
discussed. He rejects accounts of wellbeing that equate welfare with utility – preference,
choice, satisfaction – he considers these accounts to be too influenced by social
conditioning. He argues that finding something pleasant or wanting it is not the same as
valuing it: “while goods and services are valuable, they are not valuable in themselves.
Their value rests on what they can do for people…” (Sen, 1984, cited in Sumner, 1996,
p. 60). His account has been described by Sumner as mediating between the extremes
of the overly subjective and overly objective (Sumner, 1996). The basic notion is that of
functioning, which he defines as anything a person manages to do or to be. He then adds
capabilities – the freedom or opportunity to achieve a certain functioning. Even if we don’t
pursue all our opportunities for functioning we are better off if they are open to us, which
is why our well-being is determined by both. However, this approach is not without
criticism either. Michalos (2011) argues for example that one could not be said to be
living a good life if we never choose to act on our moral goodness. It is not enough to
have the right framework but how people act and respond within that framework also
matters.
3.2.3 Desire theory
The desirability of a good or a service has always been a powerfully attractive way of
determining what is valuable. As mentioned, desire is paradigmatic of the subjectivist
approach (Heathwood, 2014) as it values what we desire whether it is good for us or not.
Mill‘s proof that something was desirable, in fact the sole evidence he considered
possible to produce was “that people actually desire it” (Mill, 1863). Perhaps the earliest
in-depth discussion of the desire theory is in Sidgwick’s Methods of Ethics. It gained
prominence in the 20th century with the rise of welfare economics and decision theory,
where utility is understood as people’s preferences. Sidgwick’s formula defined value as
“the good is what ought to be desired” (Sidgwick, 1981).
Carson is a modern-day proponent of desire theory (also known as preference
satisfaction). He writes:
It is impossible to explain the practical import of value judgements unless we assume that being desirable is at least part of what we mean when we say something is good (Carson, 2000, p. 20)
A central critique of desire theory is that it is difficult to know which came first, the good
or the desire. Do we want these things in our lives because it is good to have them, or is

57
it good to have them in our lives because we want them? In addition, we sometimes want
things that turn out to be no good for us because our actual desires are ill-informed or a
result of false belief.
Desire/preference philosophers deal with this by arguing that our wellbeing is connected
to idealised desires; desires we would have if we knew all the relevant facts, and were
making rational and reasonable decisions. In this vein, Carson argues for a qualified
version of desire theory known as divine-preference theory. By this theory, we should
value the desires we would have if we were rational (Carson, 2000). Carson even argues
that facts about what happens after we die are relevant to how well one is faring when
they are alive i.e. having a legacy is better than being completely forgotten even if we
are not there to appreciate it. This is like the ‘informed desire’ advocated by John Rawls,
a great critic of consequentialism. He asked us to imagine a brilliant Harvard
mathematician, fully informed about the options available to them that develops an
overriding desire to count the blades of grass on the lawns of Harvard. For Rawls, if the
academic is really informed and considers counting grass to be the best option for him
or her, then it should be so (Rawls, 1999).
Heathwood describes this move as ‘running the risk of turning the desire theory into an
objective theory of well-being in subjectivist clothing” (Heathwood, 2014 p.13). He argues
that it should not be open to desire theorists to claim that part of what it is to be idealized
is to desire the right things; a view also echoed by Crisp (Crisp, 2013).
Informed desire also has short-comings. As Brandt points out our preferences change
(Brandt, 1998) and to be fully informed we would need to know what our future
preferences were likely to be, otherwise we might endanger them. Taylor argues that,
like hedonism it is overly individualistic and that it fails to take account of irreducible
social goods that are better when shared than enjoyed alone, such as sharing a joke
(Taylor, 1995). Desire theorists might respond that irreducible goods can also be desired
(Carson, 2000).
Desire theory is very popular and has been highly influential. It has been adopted by
some utilitarians such as Harsanyi and is widely endorsed by economists on the basis
that people’s preferences are considered the best guide to their utility or welfare. This
makes it possible to observe their behaviour in markets and infer whether they are
receiving improvements in their welfare or not (Sumner, 1996). However, when
economists talk about value, they tend to use the term differently to how it is used in
philosophy. In the next section, I discuss this further before reflecting on the implications
for this research.
58
3.2.4 Value in economics
In classical economics, there were two types of value: exchange value - value as it is
expressed in the price of something in exchange - and use-value, the potential capacity
that an object has to meet human needs, its ability to satisfy desire. In the Wealth of
Nations Adam Smith discusses how these two types of value can diverge from each
other:
The things that have the greatest value in use have frequently little or no value in
exchange; on the contrary, those which have the greatest value in exchange have
frequently little or no value in use.
(Smith, 1776, pp. 44–45)
He went on to describe the ‘paradox of value’, sometimes known as the ‘water/diamond
paradox’. This is the apparent contradiction that although nothing could be more useful
than water it has no value, whereas a diamond scarcely has any use value, but a large
number of goods could be frequently exchanged for it. This led to the idea of the ‘labour
theory of value’; that it was the amount of labour that went into producing something that
determined its value. Karl Marx adopted the theory and made famous the concept of
‘surplus value’. Marx who was an ardent critic of utilitarianism along with all ethical
theories (Eggleston & Miller, 2014) thought that all exchange value is created by the
worker, and this value is then appropriated by the capitalist. In the process of
‘valorisation’, whatever part of the value of a commodity falls to the landlord or the
capitalist Marx regarded as a deduction from the fruits of labour, since labour alone
created value (Marx, 1867).
By contrast, the subjective theory of value is one of the core ideas of the Austrian School.
It is based on the idea that the value of a good is not based on any intrinsic quality of
that good, nor by the labour embedded in the good but on the importance placed on that
good by an individual willing to purchase it. It could be described as an explicit denial of
the existence of intrinsic value. According to this theory, there is no proper price of a
good or service other than the rate at which it trades in a free market, and as a result all
voluntary trades are mutually beneficial otherwise they would not happen.
Perhaps the most influential of all the theories of value in any discipline is the theory of
marginal utility, which remains a leading theory in modern economics. It states that value
is determined neither by how much labour was exerted in the production of a good, nor
on how useful it is on a whole, instead its value is determined by its marginal utility.
Marginal utility is based on a well-known psychological principle, that the pleasure
derived from the satisfaction of any given want declines with each successive unit of
59
satisfaction experienced and the ‘final’ or ‘marginal’ unit may yield little satisfaction,
irrespective of how great the satisfaction from the first unit may have been. In exchange,
both buyer and seller compare the marginal utility of the commodity to be bought and
sold with the marginal utility of money. It claimed to solve the paradox of value by
demonstrating that the marginal cost of water is far lower than that of diamonds, so rather
than being asked to choose between the whole world of water and the whole world of
diamonds, they were being asked to choose between definite amounts that relate to their
subjectively ranked preferences.
Marginalism, as it is known, was based on ideas developed by the classical utilitarians.
One implication of it was that marginal utility varied with people’s subjective experience
of the consumption of a good and how much of that good was consumed. This idea was
described by Bentham as follows:
Tis vain to talk of adding quantities which after the addition will continue to be as distinct as they were before; one man’s happiness will never be another man’s happiness: a gain to one man is no gain to another: you might as well pretend to add 20 apples to 20 pears.
(Bentham 1789, quoted in Binmore, 2009, p. 2,)
The implications of this idea which came to be known as Interpersonal Companions of
Utility (ICU) were quite radical in the field of economics i.e. that utility was measurable,
and goods and services could at least in principle be distributed in a way that would
maximise total welfare.
Whilst most economists today accept the Law of Diminishing Marginal Utility i.e. the more
of a good you consume the less utility you gain from that good, the idea that utility can
be compared across groups of people and over time has fallen out of favour. Two
movements in the 20th century led to the rejection of ICU within mainstream economics.
First, the positivist movement that swept Europe in the early part of the 20th century
heavily influenced the assumptions upon which economics came to be based.
Specifically, it considered subjective experience to be irrelevant because it was “neither
analytic, nor subject to empirical test” (Robbins, 1935, p. 151). The leading ‘new welfare
economists’ from the period sought to delimit “the neutral area of science from the more
disputable area of moral and political philosophy.” (Robbins, 1935, p. 151). Secondly,
the latter part of the century saw the rise and eventual dominance of neo-classical
economics, the central tenets of which relied on theories, which did not require
interpersonal comparisons (General Equilibrium, Pareto Optimality, Kaldor/Hicks
criteria). Empirical work by leading economists, (such as Hicks, Arrow and Samuelson),
appeared to ‘prove’ that measures of cardinal utility – i.e. the intensity of preferences -
60
were impossible. The use of GDP as a proxy for social value and welfare is arguably a
product of this philosophical position as it assumes that the quantity, rather than the
quality of goods produced is what matters. It does not seek to answer the question that
Bentham considered to be the test of any instrument of the state: “What use is it?” In this
thesis, I make the case for applying Bentham’s question to the subject of national
measurement. The previous chapters described some of the reasons why GDP has been
assigned the proxy role of national and international measure of success, none of which
relate to its use in planning, directing and evaluating public policy. In the next section I
reflect on these theories and how they can inform this research. I propose an alternative
approach by setting out a conceptual framework that satisfies an acceptable theory of
value. This will provide the foundations for the empirical work to come.
3.3 Individual and collective notions of value: towards a conceptual
framework
In the Platonic Dialogue Protagoras, Socrates argued that the reason people act
harmfully, to others or themselves, is because they only see the short-term gains while
ignoring the long-term losses which might outweigh them, just like one makes errors in
judging the size of objects that are far away (Plato, 2009). If people could calculate these
things correctly, they would make better decisions to further their own happiness. In this
Dialogue, Plato was suggesting that our individual utility is bound up with social value,
or what is good for those around us, and that what is good for society is also good for
us. We can contrast this with desire preference theory as expressed in neoclassical
economics, where satisfying our desires (maximising our utility) is not just good for us
but for wider society.
Almost all the theories of value described here have attractive elements, but each is also
flawed, and plausible concerns have been raised about all of them. We might conclude
from this that no theory is sufficiently complete to be applied without modifications.
Furthermore, the most appealing solution - and the one that is likely to achieve the widest
acceptability - lies somewhere in the middle. In this vein, I argue for an approach that
draws on the most appealing aspects of Parfitt’s taxonomy, a hybrid of objective list and
desire theory. Hedonism can also be incorporated here as one item on the objective list.
I do not argue that it has intrinsic value, but that pleasure/satisfaction is important,
particularly if people perceive it to be so. This hybrid may in practice be like Carson’s
qualified version of desire theory - divine-preference theory – i.e. the things we would
value if we were rational (Carson, 2000). What Carson does is to introduce an ‘objective’
element to preferences. However, I agree with Heathwood who argues that this is
61
essentially an objectivist theory cloaked in subjectivism. Carson’s solution does not
provide sufficient clarity about what is rational, for whom and under what conditions.
Instead, I argue that preferences should be ‘constrained’ where they run counter to what
is in the wider public interest, or where they are destructive of irreducible social goods.
An example might be where we restrict the use of certain fossil fuels because of scientific
evidence of their impact on the environment. This arguably enables us to consider (in a
limited way) the preferences of those that will inherit the planet from us and to enable us
to have a positive legacy after we die. I call this approach ‘constrained utilitarianism’ i.e.
a utilitarian framework that sits within a social and environmental rights-based framework
where the maximizing of wellbeing is determined by informed desire. However, my
argument that the environment is an archetypal constraint is not motivated by a claim
that it has intrinsic value. For Moore and Mill, intrinsic value was innate to a good,
whether we could perceive it or not, and was generally used to describe works of art of
literature. The value that the environment provides does not stem (in my account of it at
least) from a pantheist view of nature as an end in itself. Rather, the environment matters
because it provides humans with a flow of essential environmental services without
which our ability to generate well-being would be greatly diminished. This is a subtle but
important distinction, which will be returned to later in the thesis.
In this research, I argue for taking people’s preferences into account by eliciting their
view as to what they value, but complementing this with different kinds of information
e.g. cultural norms, irreducible social goods, or expert opinion. I apply this by first
developing a long list of things that the research has found to enhance people’s well-
being – the objective list. I then transform into a subjective list by asking people to
prioritise from within that list. This sets some constraints or limits on the set of choices
that are available to people because factors that are deemed to be of wider social value
are not included in the subjective aspect. For example, climate change (and
environmental issues generally) are a relatively low priority in most polls and studies on
the subject. If we followed a purely desire preference theory of valuation, we would limit
policy in this area to things people care about like local pollution. However, by applying
an a priori constraint I can remove climate change from the set of available choices. In
this model, goods that are deemed to be of wider social value are accounted for
separately. These are goods that people might desire if they were fully informed (e.g.
environmental goods), or that may be at risk in a utilitarian framework (e.g. human
rights/minority rights), or whose benefits are difficult to perceive (like collective
infrastructure or forms or regulation). Of course, tensions will arise, such as when there
are direct clashes between preferences and expert opinion. However, this already
62
happens in many areas of policy. Part of the contribution of this research is to provide a
methodology for navigating these tensions to so that policy-making is neither abstracted
from people’s daily concerns, nor is it ignorant of important advances in science or ethics.
3.4 Conclusion
This chapter has reviewed the development of theories of value from the ancients to the
present day. Throughout this period, we can observe a shift away from an emphasis on
duty, virtue, self-realisation and even self-denial to theories focused around the individual
with a greater emphasis on material gain. Alongside this, it is also possible to trace a
corresponding dramatic rise in the standard of living. These theories therefore were not
just abstract philosophies but most likely reflected and were shaped by the cultures and
norms of their times.
We might classify the theories of value on a continuum therefore - from the psychological
egoism advocated by Sidgwick to Socratic ideas of virtue - based on the extent to which
they promote concern for individual or social good (Sumner, 1996). I have argued that
the most appealing theory lies somewhere between these extremes. I advocate a hybrid
theory of value, which combines the subjective and objective. I propose that the objective
list should be drawn from empirical data about what is good for us (Chapter 5) and that
pro-attitudes should be identified through primary data gathering (Chapter 8). The
conceptual framework that will form the basis of this will be discussed in more detail in
Part 2.
I have concluded this chapter by arguing that climate change/environmental goods and
services is an area that is at risk in desire/preference theory of value and are emblematic
of why a constraint is needed. However, the rationale for this requires further discussion.
I turn to this in the next chapter, including what can be learned from environmental theory
about the best way of incorporating the environment into such a framework.
63
Chapter 4 Incorporating natural capital into the conceptual
framework
There is need of matter for the growth of later generations, all of which, nevertheless, shall follow you when they have lived their lives; and in like matter generations before you have died, and others shall die hereafter. Thus, without end one springs from another, and life is granted to no one as possession but as a loan.
(Lucretius 1965, Book 3, 967–971)
4.0 Introduction
Although classical philosophy, especially Aristotelianism is sometimes invoked to
support arguments for sustainability, classical philosophers did not have much to say
about the environment. Lucretius was a Roman poet and philosopher and advocate of
Epicurianism. The above quote, in which he describes the earth as being ‘loaned’ to us
is one of the earliest philosophical examples of concern for future generations (O’Neill,
2006). Of course, classical, and even Enlightenment philosophers were not aware that
the environment provides crucial functions to support economic performance and human
well-being. During the 20th century a scientific consensus on climate change and its
anthropogenic origins has emerged, and we have become increasingly aware of the
scarcity of natural resources, which also threaten the sustainability of this system. Yet
as discussed in the previous chapter, the environment is not a special case because it
is intrinsically valuable in a philosophical sense but because it is an area where people’s
preferences and scientific evidence diverge.
The purpose of this chapter is to review the theoretical perspectives in this field and
identify the most ethically and technically defensible way of accounting for sustainability
at the national level. Not accounting for the private and social costs of the use of natural
resources and the degradation of the environment, sends the wrong signals of social
value creation i.e. it overestimates how well we are doing if we are exploiting resources
or using sink functions in an unsustainable way. A key issue at stake in environmental
accounting is the substitutability of different forms of capital. Substitutability refers to the
extent to which one form of capital e.g. manufactured capital can replace, or substitute
for another form of capital such as natural capital. This is sometimes characterized as a
debate between economists and ecologists (Ayres et al., 1998), with the economists
arguing for substitutability (or weak sustainability) and the ecologists arguing against
(strong sustainability). The section will begin with a discussion of the definition of
sustainability; in order to know whether we are living sustainably we need to be clear
64
about what we mean by it. I then go on to describe the concepts of strong and weak
sustainability, and how they relate to definitions of sustainability. This leads on to a
discussion of inter and intra generational inequality and the tension between these two
forms of inequality. I conclude the chapter by setting out an approach to dealing with
sustainability in this thesis and how it can inform the conceptual framework
4.1 Defining sustainability
As discussed in Chapter 3, a distinctive aspect of Aristotle’s ethical thinking was that his
reflections on the good life were concerned not only with what is good for an individual
but also the wider community. However, this conception did not extend to maintaining
the welfare of future generations: Aristotle never discusses sustainability as such,
however, as O’Neill points out his focus on “a community engaged in common projects
that stretches beyond our own lives…opens up the space for an account of inter-
generational citizenship” (O’Neill, 2004 p. 167). Nonetheless, value theory has
historically been mainly concerned with the present generation, not least because we
cannot know the preferences or contexts of future generations. Increasingly moral
philosophers are recognising that environmental threats require us to have an ethical
framework that incorporates environmental concerns (see for example Sandel, 2012)
In 1987 the Brundtland Commission defined sustainability as "development that meets
the needs of the present without compromising the ability of future generations to meet
their own needs" (Brundtland, 1987). This often cited and well-known definition of
sustainability is the most widespread, having been adopted by the World Bank,20 the
United Nations,21 the European Union,22 and the OECD (Schneider, 2008). However, the
Brundtland definition has satisfied neither the economist nor the ecologist side of the
debate. The ecologist concerns include the fact that that ‘need’ could be very broadly
defined to include a wide range of luxury items, and that the definition is entirely
anthropocentric, ignoring the ‘needs’ of other species (Goffman, 2005; Lélé, 1991;
Montani, 2007). Economists argue that it traps the poorest in the world into a cycle of
impoverishment from which they could never escape (Beckerman, 1992, 1994;
Bernstam, 1990; Pezzey, 1997).
Neumayer (1999, 2004) offers an alternative definition, which does not commit to
providing equivalent welfare to future generations – after all future generations could
20 See at http://www.worldbank.org/depweb/english/sd.html 21 See at http://www.un.org/en/globalissues/environment/ 22 See at
http://europa.eu/legislation_summaries/environment/sustainable_development/index_en.htm
65
squander their inheritance and we cannot make current generations responsible for that
– but ensures that the conditions under which non-declining welfare can be achieved are
provided for. For example, it is not the responsibility of the current generation to
guarantee that future generations send the same proportion of their young people to
university but to ensure that universities still exist and are accessible to the same number
of people should future generations wish to do so. The benefit of this definition is that it
minimizes (although by no means eliminates) the complexity of the ethical challenge
proposed by sustainability i.e. how should we prioritise the welfare of future generations
relative to the current generation. It requires a ‘stronger’23 definition of sustainability,
which has a greater chance of protecting those aspects of natural capital that are critical
to our wellbeing but allows the exploitation of those that are renewable, or substitutable.
The stronger definition improves on Brundtland in a number of ways. It moves the focus
of the debate away from the tension between today’s generations and those in the future.
Because a level of welfare does not have to be maintained, the definition of ‘need’ also
becomes less important: if future generations abolish automatic washing machines, this
is only a concern if they are obliged to do so (e.g. because of energy shortages) not if
they do so freely. The charge of anthropocentrism still holds. However, if we assume that
there is no value as we understand it outside of human perception then valuation is
necessarily performed through the lens of the definition of value by humans.
This definition also requires us to distinguish between capital, which is ‘critical’ to
maintaining welfare over time, and that which is non-critical. Critical natural capital
cannot be traded off against non-critical natural capital i.e. it cannot be combined into a
single index such as is done with existing indices such as the ISEW or the green HDI.
The alternative paradigm in sustainability accounting is weak sustainability, which is
sometimes called the ‘economic definition’. Weak sustainability is based on work
associated with new welfare economists, most notably Solow (Solow, 1974) and
Hartwick (Hartwick, 1977) and is sometimes referred to as “Hartwick-Solow
sustainability” (Common & Perrings, 1992). In the weak sustainability framework,
substitution is not only allowed but it can even be a moral imperative: if the value
generated by transforming natural capital into human-made capital is greater than the
value generated by leaving natural capital intact, then this transformation should be done
23 Weak sustainability is a paradigm within economics that holds the position that human or
produced capital is directly substitutable for natural capital. Strong sustainability maintains that all forms of capital must be maintained intact independent of one another, and that produced capital used in harvesting and processing timber is of no value in the absence of stocks of timber to harvest. Strong sustainability emerged as a critique of weak sustainability in the 1990s. It is widely used by academics and institutions such as the OECD and UN.
66
(Beckerman, 1994; Solow, 1993). For example, if cutting down forests to build homes for
villagers can be shown to be more valuable than maintaining the forests intact then not
only should it be done but it would be morally objectionable not to. It fits more comfortably
with the Brundtland definition as weak sustainability does not consider the economy’s
capacity to produce economic wellbeing over time (Weitzman, 1997) but rather that
wellbeing is produced. The type of wellbeing, or how it is produced is not specified. In
principle, if human capital outcomes continued to rise these could compensate for severe
energy shortages so long as the sum of human welfare was still rising.
Although the strong sustainability approach is theoretically more attractive, it would be
rash to discount weak sustainability entirely. Pearce and Atkinson (1993) provide a
robust defence. First, they argue that the costs of inaction in such a framework can often
be extremely high. In practice, as the costs of environmental damage become intolerably
high, it may achieve the same policy end as a strong sustainability approach, such as
regulation. In the previous example, it is very difficult to imagine that human capital
outcomes would be unaffected by energy shortages. They also argue that if prices are
irrelevant, constant natural capital has no meaning either, as without a unit of account it
is unclear how to ‘value’ the stock of natural capital that is to be kept constant (ibid.).
Developments in weak sustainability and environmental valuation are also practical and
have arguably been more influential than the stronger more ecological approaches (see
for example The Economics of the Environment and Biodiversity (TEEB)).
Nonetheless, there are dangers in accounting for natural capital purely within a price
driven framework (Gray, 1990), which have been well-documented elsewhere (Pearce
and Turner, 1990). This is especially the case for sink constraints, which are much more
difficult to predict, and involve incurring definite and real costs for intangible and
uncertain benefits (Neumayer, 2004). Any damage to critical natural capital would, in
theory, be valued at an infinite cost because of its irreplaceability. It is therefore with
source constraints that environmental valuation (and weak sustainability solutions) have
the greatest contribution to make. It is much more straightforward to value the marginal
costs of mineral extraction than the preservation of Bengali Tigers. This is not just
because we are concerned with more tangible ‘use values’ such as impacts on
livelihoods but because we are generally interested in changes at the margin, whereas
species preservation is concerned with total costs of extinction, which are much harder
to quantify (ibid.).
4.2 The substitutability of capital
67
We can conclude from the previous discussion that certain kinds of capital can be
substitutable under certain conditions. Some further categorisation is required to
incorporate this into an accounting framework (Pearce & Atkinson, 1993). Gray (1990)
suggests four categories:
• Critical: for example, the ozone layer, tropical hardwood, biodiversity
• Non-renewable/non-substitutable: oil, petroleum and mineral products
• Non-renewable/substitutable: waste disposal, energy usage
• Renewable: plantation timber, fisheries
This enables us to distinguish between fossil fuels, which are non-substitutable and
energy usage, which is. This distinction leads us to an important question. Leaving aside
the climatic impacts of the burning of fossil fuels, does it matter if we exhaust our
resources of coal and oil, if we use the revenues and energy generated to invest in
renewable sources of energy? Using our test of the conditions for non-declining welfare,
it is difficult to argue that it does. That question does not apply to water, or a reasonably
stable and predictable climate as there are currently no plausible predictions for how
either might be substituted in the foreseeable future (OECD, 2008). We could conclude
from this that capital that meets the critical criteria must always be preserved but this is
not always the case for those in the non-substitutable category. Different forms of capital
have different ‘sustainability value’ (Pearce & Atkinson, 1993) and this value can change
over time. This might be because of technological progress but also things like changes
in taste and expectations (Pearce & Atkinson, ibid.).
In deciding which elements qualify as ‘critical’, it is useful to first think about the functions
that natural capital fulfils. Pearce and Turner (1990) have identified four main functions.
1. Inputs into production (food, timber and fuel)
2. Provides amenity services, such as the visual amenity of a landscape.
3. Assimilates the waste products of production and consumption.
4. Provides the basic life-support functions on which human life depends.
If we consider the things that are most critical to our survival and our long-term well-
being, it is the last two, the ‘sink’ and ‘life support’ functions i.e. the earth’s ability to
accumulate pollutants, and global environmental resources such as the climate and the
ozone layer. This is what denotes them as critical.
Neumayer (2004) also points to human’s capacity to overcome resource constraints in
the past as a reason to presume that substitution and technical progress can overcome
global resource constraints in a way that is not likely for global climate constraints. This
is certainly true in relation to energy constraints, the supply of which has worried
68
economists and scientists for decades. There are around sixty years of natural gas and
oil reserves (assuming no new discoveries, around 1,500 years of coal and vast shale
reserves (Petrol Strategies, 2016)). Judging the energy shortage problem on these terms
it does seem feasible that we could replace these energy sources. However, it is unlikely
that the climate can absorb the pollutants from the burning of these reserves, hence the
emphasis in climate policy on emissions reductions.
Unfortunately, most climate predictions based on business as usual scenarios are quite
pessimistic (Pachuari et al. 2014) and campaigners quite rightly ask why we are so slow
to act. One mechanism for accelerating the transition to low carbon growth is through
changes in the portfolio of private investors. A key variable influencing investment
decisions is the discount rate that is used to calculate future returns. This is not just an
abstract technical point but links directly to the complex philosophical trade-offs that I
have been discussing. In the next section I introduce discount rates and discuss their
relevance to the issue.
4.3 Discount rates
In economics and finance the discounted cash flow (DCF) is a method of valuing a
company or asset in real terms. Future cash flows are estimated and discounted to give
their present values (PVs). The rate at which those cash flows are discounted is known
as the discount rate. This reflects two things:
• The time value of money – The theory of time preference states that investors
would rather have cash immediately than having to wait and must therefore be
compensated by paying for the delay.
• A risk premium – This reflects the extra return investors demand because they
want to be compensated for the risk that the cash flow might not materialise.
The discount rate used is therefore highly material to investment decisions, and will
depend on several factors, for example, the tolerance for risk amongst the investors.
In public policy, where prospective social projects are subject to benefit cost forecasting,
a social discount rate (SDR) is also usually applied. An investment is generally
considered to be worth pursuing if the marginal social benefit exceeds the marginal social
cost. Determining this rate is more complex as estimating the benefits of social projects
requires making ethically complex choices about benefits to others, including non-
monetary benefits (see Paulden (2010) for a discussion of the issues relating to the UK
Treasury’s rate). Yet SDRs can play a major role in influencing investment decisions,
indeed the decision to proceed or not may rest entirely on the choice of rate used
(Frederick et al., 2002). As with discounted cash flow, SDRs reflect the fact that people
69
prefer benefits today than having to wait for them in the future, and it compensates the
current generation of taxpayers for this ‘patience’. In addition, it assumes prosperity will
rise, and that future generations will be better off. Not applying a discount rate would
result in an intergenerational transfer from the current generation to our wealthier
counterparts in the future.24 The question it raises, which is pertinent here, is whether
rising living standards can be sufficient to compensate future generations for the loss of
critical natural capital to enable them to pursue non-declining welfare.
In 2005, Gordon Brown, the then Prime Minister of the United Kingdom, commissioned
the economist Nicholas Stern to carry out a review of the costs and benefits of climate
change mitigation. A year later, Stern concluded that 1% of global GDP was required to
keep warming below the 2 per cent level, which is considered safe by most climate
scientists. Stern predicted that inaction would cost the global economy the equivalent to
losing at least 5% of global gross domestic product (GDP) each year. Including a wider
range of risks and impacts could increase this to 20% of GDP or more (Stern et al.,
2006). Stern later increased his cost estimate to 2 per cent of GDP, as few of his policies
were successfully implemented, and because of faster than expected climate change. A
key variable in Stern’s analysis was the SDR, which he set at 3 per cent. Whilst accepting
the case for discounting, he argued that setting the pure time preference rate (PTP)
anything much above zero – his was set at 0.1 per cent - was ethically inappropriate
because of intergenerational fairness (ibid.). His argument was that if future generations
were real stakeholders in today’s markets and policy decisions, they would opt for lower
discount rates and higher investment. There is some support for this view amongst
economists (Brekke & Johansson-Stenman, 2008; Dietz & Stern, 2008; Heal, 2008;
Sterner & Persson, 2008) but also much criticism (Dasgupta, 2007; Mendelsohn,
Sterner, Persson, & Weyant, 2008; Neumayer, 2007; Nordhaus, 2007; Tol & Yohe, 2007;
Weitzman, 2007).
Prior to the Stern review, the most well-known cost benefit study on climate change was
by William Nordhaus (2007). In his analysis, the case for investment in mitigation was
not as convincing. Unlike Stern, the discount rate used was not based on ethical
principles but on the opportunity costs of investment and the real rates of return on
capital. For example, Nordhaus has argued that rather than investing in climate change
mitigation, that money could be spent in a more socially valuable way by providing
24 This final point is increasingly controversial on its own terms, as many would argue that wages
and standards of living have stalled for the first time since the 1940s. Certainly, returns to workers have been in decline relative to capital (ref) and for many real incomes have seen only marginal increases (Karabarbounis and Neiman, 2014).
70
opportunities for growth in developing countries today. He points to the rate of return on
primary education, which is as high as 26 per cent in some countries as evidence of this
(ibid.).
Critics of Stern (including Nordhaus) argue that the actions of the current generation do
not demonstrate a preference for a low discount rate, otherwise we would be saving and
investing in the future (Nordhaus, 2007). According to Schelling this applies to recipients
of aid as well who, if offered a choice between development assistance now or
investments that will benefit them in the future, would opt for the immediate (Schelling,
1995). Neumayer reminds us, that if the aim is intergenerational equity, then large-scale
emissions abatement is ethically problematic if it is the case that future generations will
be better off than us anyway (Neumayer, 2007). It may be imposing inefficient
investments on developing countries, which they would rather use for other purposes.
Accepting the arguments about our own short-termism implies inaction on climate
change; a conclusion that only a minority of economists agree with (e.g. Mendelsohn et
al., 2008). As with the weak/strong sustainability argument it is unlikely that this question
can be resolved with better information. Most economists agree that we need some
discounting of the future but beyond that, technical arguments about the precise way of
calculating them may imply a false sense of accuracy and in the process, miss the point
of what they are trying to achieve. Both the Stern and Nordhaus positions are based on
a priori assumptions that we cannot possibly test empirically. We cannot know the
preferences of future generations. Neither is it likely that we have enough information to
accurately value the loss of utility from the destruction of the biosphere, or quantify the
risks of different courses of action. Under these conditions, discount rates must stem
from ethical judgements about (for example) the level of risk we are prepared to
tolerate.25 Nordhaus, for example, argues for the setting of strong policy objectives to
prevent the loss of biodiversity, irrespective of the discount rate.
4.4 Intergenerational vs intragenerational inequality
As discussed earlier, economists have long been aware of the unequal distribution of
costs and benefits across the generations. However, it is only since our knowledge of
climate change emerged that intergenerational inequality has become an ethical
concern, as it had been previously assumed that future generations would be better off.
25 Neumayer distinguishes between risk, uncertainty and ignorance in order of their proximity to
certainty. Risk is where all possible states of the world and their probability distributions and resulting payoffs can be objectively known. With uncertainty, these cannot be objectively known but people have subjective opinions about the distribution of payoffs, whereas with ignorance little is known about the probability distribution or the resulting payoffs (Neumayer, 2004)
71
Future generations have no market power and cannot hold us to account for our
investment decisions today any more than we can hold Victorian industrialists to account
for their polluting industries of the past. In addition, we have benefited enormously for
the investments and sacrifices of previous generations. This places the present
generation in a position of considerable power (Neumayer, 2004). We know that people
care about the future to some extent. They save, have children, and make social
contributions and personal sacrifices. However, as the generations move further into the
future, the bond with descendants weakens.26 Although we cannot know the preferences
of future generations we must assume that they would not want to be worse off than us.
This requires making a special case for them, essentially treating them as a public good.
We already collectively fund public goods for societal benefit, which we may never
directly benefit. This is the only model under which we can make a case for the present
generation to knowingly make such sacrifices.
If we accept that there is an ethical case for the protection of the welfare of future
generations, how do we prioritise this relative to the current generation; especially in
those parts of the world that are desperately in need of investment? Should funds be
diverted from development projects today towards climate mitigation projects?
Beckerman has commented that it is difficult to see in what way the environment is in
some moral class of its own (Beckerman, 1992). John Rawls’ maximin principle is often
invoked in favour of intergenerational equality.27 However, as Solow has argued maximin
could lock countries into poverty traps because rising prosperity makes future
generations better off, so investments that benefit the future cannot be made (Dasgupta,
2007). This is not a problem for rich countries because previous generations have
already made those investments. Again, this is where Neumayer’s definition is useful
because it doesn’t require constant or equal utility but the capacity to ensure it does not
decline.
Several commentators cite Gowdy and McDaniel’s (1999) research on the small Pacific
island state of Nauru to highlight the tension between development and resource
depletion. In 1900 Nauru had one of the world’s richest sources of phosphate deposits,
yet today as a result of just over ninety years of phosphate mining, about 80 per cent of
the island is environmentally damaged. At the same time, the people of Nauru have had,
over the past several decades, the highest per capita income in Micronesia. Income from
26 Gowdy (2004) makes the case for ‘hyperbolic discounting’ which is non-linear. He cites
evidence that people have a high discount rate for the immediate future but that this decreases over time. However, the evidence on this is mixed. 27 The maximum is a justice criterion proposed by Rawls. According to this principle the system
should be designed to maximize the position of those who will be worst off in it.
72
phosphate mining enabled the Nauruans to establish a trust fund estimated to be as
large as $1 billion (the population is less than 10,000). Interest from this trust fund should
have insured a substantial and steady income and the economic sustainability of the
island. However, the Asian financial crisis, among other factors, has wiped out the value
of most of the trust fund.
What rarely gets mentioned in the retelling of this story is that the strategy could have
worked well for the Nauruans had they made better investments. Nauru is the world’s
smallest republic, and (like most tiny islands) its opportunities for economic development
are very limited. Such countries have little by way of comparative advantage except to
exploit natural resources. After the value of the trust fund diminished, they were forced
to adopt economic development strategies like hosting an Australian detention centre
and operating as a tax haven. Whilst environmental degradation accompanied the
exploitation, if it had been managed more carefully to ensure that mining companies
picked up more of the costs of the damage, the outcome may have also been more
favourable. The fact remains, that Nauru’s most viable economic development strategy
may still have been to extract the phosphate and use the income to invest in future
livelihoods (e.g. the Norwegian model with regards to oil). That it ended badly does not
mean it was the wrong strategy. If Nauruans left the phosphate in the ground, future
generations would have to sign up to an unwritten “intertemporal contract” (Pearce &
Turner, 1990) created by the current generation, which is difficult way to make
sustainability policy.
In practice, we are not usually faced with such stark choices. Let us take another, more
nuanced example, that of Irish peat. One sixth of the landmass of Ireland is covered in
bog, more than any other country in Europe except Finland. Peat has been a source of
fuel for people in Ireland, probably for thousands of years, and the only source of fuel for
much of that time. It was after the foundation of the Irish Free State in the 1920s that bog
began to be exploited on a commercial scale in a bid for energy security and to reduce
reliance on British coal. The Turf Development Board was established in 1934 and by
1969 there were just 100,000 hectares of raised-bog left in Ireland, over half of which
was owned by the State. Most of this will be exhausted by the middle of this century
(Aalen, 2010). The Irish Forestry Board estimate that only 18% of the original area of
blanket bog and 8% of the original area of raised bog remains of conservation interest.
In the space of thirty years, a large proportion of raised bogs were destroyed. This would
not only have damaging environmental consequences but would also limit the
opportunities for commercial exploitation of peat in the future. Whilst it created some
much needed employment and revitalized some towns and villages this was very short-
73
lived. The only longer-term consequences are habitats destroyed, spoilt landscapes, and
the end of an ancient tradition of local turf cutting. Even without doing the calculations, it
is difficult to argue that the exploitation of the bog was ‘worth it’. However, to a newly
founded state striving for economic independence and prosperity, intangible benefits are
difficult to sell compared with immediate jobs and incomes.
Both cases illustrate Schelling’s (1995) point that recipients of aid if offered a choice
between development assistance now and investments that will benefit them in the future
would opt for the former. In reality, impoverished people (and often well-off people) will
always take short-term benefits irrespective of the long-term consequences unless they
are otherwise compensated. The UN’s Reducing Emissions from Deforestation and
forest Degradation (REDD) programme is trying to create a framework to disincentivise
low-income countries from exploiting their forest stocks by providing adequate
compensation. The saleability of sustainability measures such as this will also rest in part
on the acceptance of the principle of strong sustainability and the interconnected nature
of the ecosystem. In the final section of this chapter, I discuss my proposed approach to
environmental accounting that would function as a constraint in the conceptual
framework.
4.5 An environmental accounting framework
What I propose as part of this thesis that the index described in the previous section is
complemented by an environmental indicator that is managed and maintained
separately. Following Neumayer (2005), the approach I propose is along the lines of
Genuine Savings where the stock of capital must be maintained at or above zero for a
country to be progressing sustainably i.e. that future generations have the conditions
under which non-declining welfare can be achieved. However, rather than following an
entirely weakly sustainable framework like Genuine Savings where different forms of
capital are perfectly substitutable, certain non-substitutable resources would need to
meet a stronger test of sustainability i.e. never fall below zero. This would apply to things
like a safe level of greenhouse gas emissions and water pollution. This test would not
apply to renewable natural capital like timber or certain substitutable metals. This
overcomes the problem of substitutability but is also consistent with Hartwick's rule i.e.
natural capital should be exploited where it can be shown to increase welfare. Over time,
data would be produced that would give a better understanding of the inter-related nature
of human wellbeing and the natural environment and the extent to which changes in one
affected the other. Some principles that would underpin such a framework are as follows:
74
1. As discussed, some aspects of capital (primarily but not exclusively natural)28 are
critical to our capacity to pursue non-declining welfare and to bequeath that to
future generations. These need to be physically maintained and accounted for
separately to the stock of capital. As discussed in the previous chapter, this does
not mean abandoning the utilitarian framework, which has its merits, particularly
for decisions at the margins for which we have good quality information on costs
and benefits. However, the non-substitutability of some forms of capital point to
its limitations.
2. The polluter pays (production accounting) is the most ethically defensible
approach to transboundary pollution. However, it would be very difficult to
implement in practice. A compromise between polluter pays and recipient pays
will need to be found. Production accounting will be returned to in a practical
example for Ireland in Chapter 6.
3. The geographical and temporal nature of the problem should be taken account
of to ensure more support and compensation by past emitters. For example,
research suggests that 90 companies have caused two-thirds of global warming
emissions and that half of these have been emitted since 1986 (Heede, 2014).
Historical data on per capita emissions are also available. However, where this
is considered some balance needs to be struck between production and
consumption. For example, lots of oil producing countries have high per capita
emissions but relatively low incomes.
In practice, we see examples of both weak and strong sustainability policies being
implemented. The ozone layer is an example of natural capital that is non-substitutable
and a ban on CFCs was introduced in the 1990s in most countries in the world. As a
result, depletion of the ozone has halted. Whenever we remove fossil fuels from the
ground and convert them into heat and light we are conforming to the weak sustainability
tradition, i.e. that some environmental costs are ‘worth it’ for certain social benefits.
Efforts (for example) to pay people to leave coal in the ground are closer to a strong
sustainability approach as it is more than just a financial incentive. A view often put
forward is that weak sustainability is a first step or a special case of strong sustainability
(Hediger, 2006)
28 Social capital could be described as critical because once lost it can be almost impossible to
recreate. However, unlike the ozone layer it is at least in principle replaceable, or the benefits that
it produces may be replicable.
75
I am calling the approach that is being advocated here quasi-strong sustainability.
According to this approach the socio-economic and environmental account are kept
separate from each other, therefore, in line with a strong sustainability approach they
cannot be traded off against each other. However, it is not always the case that every
environmental good need to be preserved intact and some trading off of substitutable
goods is appropriate. To some extent this is already built into existing environmental
accounting where the costs of environmental goods rise with scarcity. However, we
cannot always rely on the pricing to be set at the optimal level to achieve the required
behaviour change, and strong sustainability approaches would imply a greater role for
legislation and regulation alongside price signals.
4.6 Conclusion
Green accounting and social accounting in their various guises have been with us for
some time. However, at both the micro and macro level they have failed to mount any
real challenge to mainstream economic accounting. This chapter has sketched out some
of the main ethical and political problems with sustainability theory, namely, the
substitutability of natural capital, discount rates and intergenerational inequality. I discuss
the merits and challenges of weak and strong sustainability and make the case for quasi-
strong sustainability, where a special case is made for certain types of critical natural
capital.
It is this approach that I advocate using in this thesis to support the conceptual
framework. As well as enabling better more coherent environmental accounting, it should
enable better policy decisions about where to make investments and how to manage
trade-offs. The ‘constraint’ identified in the previous chapter, does not just imply that
environmental issues are on the table whether they are perceived to be of value or not,
it also means that the stock of some forms of capital must be maintained due to their
irreplaceability.
In the next chapter, I return to developing other indicators of social value through
further work to refine the conceptual framework with reference to the literature on the
determinants of well-being. The environment will be returned to in Chapter 8 when I
present the findings from the research.
76
Chapter 5 Methodology and indicators
5.0 Introduction
A primary objective of this research is to develop a conceptual framework and
methodology for measuring social value. This approach starts from first principles by
asking what value is and how can it be operationalized and measured. The contribution
of the thesis is therefore part conceptual and part methodological. Chapters 3 and 4
described the theories that underpin this research and set out the conceptual framework.
This chapter has two aims. First, it provides a guide to the methodology used in carrying
out the primary research. Second, it begins the process of index development by
identifying indicators, and discusses the methodological issues that this process raises
The chapter is therefore structured in two sections. Section A (5.1-5.4) describes the
methods used for the primary research and data analysis, and gives an overview of
relevant epistemological issues. Section B (5.5-5.11) reviews the literature on the
determinants of well-being, identifies a ‘long-list’ of indicators and sets out the
methodology for completing the index in line with the conceptual framework.
Section A: Epistemology and methodology
5.1 Combining the subjective and objective
In Chapter 3, I posed the question, ‘what is value?’ A conclusion reached was that the
answer will vary depending on whom you ask and when you ask them. I argued that
people’s perception of value was a necessary but not sufficient part of a satisfactory
theory of value. Rather, a satisfactory theory, needed to draw on other sources of
information such as expert opinion, or collective assessments of ‘the good’. The hybrid
theory of value I proposed combines objective data on sources of value with people’s
subjective experiences (or pro-attitudes).
In anthropology, this distinction is referred to as emic – how people perceive things to be
– and etic – from the outside or the perspective of the observer (Jardine, 2004). Kottak
(2006, p. 47) describes this as follows:
The etic (scientist-oriented) approach shifts the focus from local observations, categories, explanations, and interpretations to those of the anthropologist. The etic approach realizes that members of a culture often are too involved in what they are doing to interpret their cultures impartially.
The pioneer of the approach Kenneth Pike, saw the emic/etic dichotomy as a way around
philosophical issues about the nature of objectivity, with both types of information having
77
value (Pike, 1967). I also propose no epistemological hierarchy. Emic and etic
approaches serve different purposes and provide different perspectives; both are
necessary, but neither is usually sufficient.
There are several critiques of subjective measures. These can be somewhat circular
however, as most relating to subjective measures stem from the fact that they lack
objectivity. They have been found to suffer from cognitive biases such as the ‘halo’
effect29 (Halstead et al., 1996) and as we will see later, they are often difficult to
aggregate as they are often expressed in ordinal scales. However, in a review of the
success of subjective measures, Jahedi and Mendez (2014) find that whilst they do suffer
from systematic biases, they also correlate highly with the variables they are designed
to capture, and in some instances, may be preferable to the use of purely objective
measures. Jahedi and Mendez (ibid.) distinguish between two types of subjective
measures: specific and general. The former refers to “well-defined concepts that can in
principle be observed” such as “the amount of times you were racially discriminated
against” whereas the latter refers to broader concepts such as “the extent of racism”
(Jahedi and Méndez, 2014, p. 2).
Objective measurement tends to be taken for granted and there are fewer criticisms and
therefore defences of it. The main problems with objective measurement is that it is often
more difficult and costly to capture e.g. doing a comprehensive health check on someone
compared with asking them to rate their health. However, objective data can be flawed
over and above the practical, and subjective information can sometimes have greater
value. For example, people are often best placed to report on their own mental health
and people’s subjective views of things like crime and health are useful for policy, even
where they differ from ‘objective’ data, such as recorded crime. Yet, despite the success
and take-up of subjective measures, there are still those that have called for a return to
purely objective measures in areas such as crime and corruption (Banerjee et al., 2005;
Olken, 2009).
As discussed in Chapter 1, this thesis recognises that social value is more than the sum
of individual outcomes, or perceptions of value. Figure 5.1 shows how subjective and
objective data might be used to measure outcomes at the individual and collective level.
Examples are given of measures that are paradigmatic of these kinds of outcomes.
However, in practice many are hybrids. For example, relationships matter most to the
29 When a participant’s overall impression of a person, company, brand, or product influences
their feelings and thoughts about that entity's character or properties.
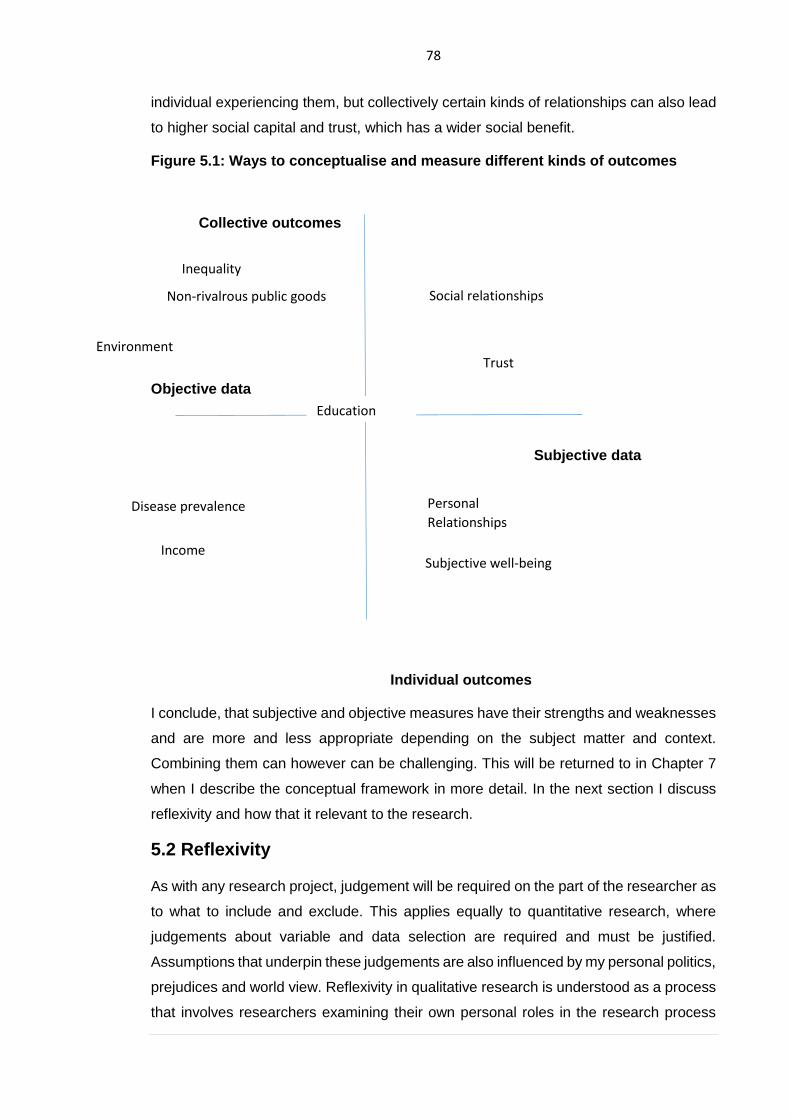
78
individual experiencing them, but collectively certain kinds of relationships can also lead
to higher social capital and trust, which has a wider social benefit.
Figure 5.1: Ways to conceptualise and measure different kinds of outcomes
Collective outcomes
Objective data
Subjective data
Individual outcomes
I conclude, that subjective and objective measures have their strengths and weaknesses
and are more and less appropriate depending on the subject matter and context.
Combining them can however can be challenging. This will be returned to in Chapter 7
when I describe the conceptual framework in more detail. In the next section I discuss
reflexivity and how that it relevant to the research.
5.2 Reflexivity
As with any research project, judgement will be required on the part of the researcher as
to what to include and exclude. This applies equally to quantitative research, where
judgements about variable and data selection are required and must be justified.
Assumptions that underpin these judgements are also influenced by my personal politics,
prejudices and world view. Reflexivity in qualitative research is understood as a process
that involves researchers examining their own personal roles in the research process
Non-rivalrous public goods
Personal
Relationships
Environment
Subjective well-being
Trust
Inequality
Education
Social relationships
Disease prevalence
Income
79
(Alvesson and Sköldberg, 2009; Babones, 2015). Although, historically reflexivity was
not considered an epistemological necessity, increasingly it is being suggested that
quantitative researchers can benefit as much from reflection on their role in the research
as qualitative researchers (Ryan and Golden, 2006) and that the quality of research
would benefit greatly from it (Babones, 2015). My a priori critique of GDP is relevant here
as is my interest in promoting a more equitable distribution of resources and
environmental sustainability. Although I can make a case for the importance of these
outcomes through the conceptual framework i.e. empirical evidence for their contribution
to the ‘greater good’, nonetheless, they also reflect and reproduce my own politics and
values. As well as knowing all research is to some extent normative and to take account
of my own biases in conducting the research, I have also aimed for maximum
transparency, which should be a guiding principle in the development of any index where
key steps such as aggregation and normalisation can easily obscure data. In the next
section I discuss the overall design for the research.
5.3 Research design
There were four stages to the research, which were approached chronologically:
1. A review of the international literature to identify a list of variables to inform the
survey design (objective/etic)
2. A survey asking Irish people to rate the importance of these variables. The most
highly ranged determinants are then considered for inclusion in the index
(subjective/emic)
3. Multivariate analysis to reduce the list of variables to its most salient components
4. Database and literature search to identify appropriate national indicators to
measure each outcome (e.g. ways to measure mental health)
5. Analysis of national trends during periods of boom and bust to look for specific
relationships (e.g. long run data on changes in those indicators)
This section describes the design of the research to identify variables for inclusion in the
survey.
5.3.1 Methodology for the determining which variables to include in the survey
As discussed above, the variables were arrived at by researching the existing literature
on the determinants of well-being. I was mainly concerned with variable oriented
research e.g. panel regressions of large datasets. However, on occasion I included
findings from other approaches such as the Day Reconstruction Method (DRM).
Variable-oriented methods are most common in the economics (and to a lesser extent)
psychology literature and, in line with the thrust of academic interest discussed above,
80
most papers included are from these disciplines. However, some sources from
sociology, epidemiology and political science are also used. The substantial ‘grey’
literature in the area is mostly excluded. A final scoping criterion was that the focus was
entirely on developed countries. Although there is a growing literature on wellbeing in
developing countries (see Helliwell, Layard and Sachs, 2015), the research question of
this review relates specifically to well-being in circumstances of relative economic
prosperity. I was mainly concerned with subjective well-being as an outcome but
occasionally included studies that had other dependent variables such as mental health.
Bibliographic databases were used to obtain literature, and these included ProQuest,
Wilson Select Plus, Econlit LexisNexis and Google Scholar. In the search, multiple words
and phrases related to well-being such as ‘life satisfaction’ and ‘happiness’ were
combined with terms relating to determinants such as ‘causes’ ‘predictors’ or
‘explanations’ to yield maximum matches. Articles were also acquired by identifying
relevant references from the bibliographies of literature reviews and related sources (e.g.
Dolan et al., 2010). Only English-language reports were included. It was conducted
between January and May 2012. A second set of searches was then carried out that
combined well-being and its synonyms with each of the main determinants identified in
the first search (e.g. ‘well-being* + ‘unemployment’). These findings were entered in an
Excel spreadsheet and used to develop the survey, the design of which I now describe.
5.3.2 Survey design
When people think about the reliability of a survey they tend to think about its size and
representativeness. However, methodologists also recognise the importance of survey
design in reducing error and bias. Fowler and Cosenza (2009, p.376) identify five basic
characteristics of surveys, which are important to a good measurement process:
• Questions need to be consistently understood
• Respondents need to have access to the information required to answer the
question
• The way in which respondents are asked to answer the questions should be
considered
• The question must provide an appropriate way to report on what respondents
have to say
• Respondents must be willing to provide the answers called for in the question
The survey in this study was developed based on the domains of wellbeing that will be
reviewed in the second part of this chapter. To improve the quality of the questions, the
survey was piloted with 20 people and changes to wording were made accordingly.
81
Respondents were asked to place themselves on a scale of 1-10 with 1 being not at all
important and 10 being extremely important, and ‘other’ options were always provided to
ensure that important determinants were not missed out. This type of phasing is typical
in well-being research and has been successful used by numerous well-being
researchers (cf. Diener and Biswas-Diener, 2002; Diener and Suh, 1997). Other options
would have been to use a shorter number of scale items e.g. 1-5 or a Likert Scale Likert
(Jamieson et al. 2004). After some deliberation, I eschewed these approaches in favour
of a 10-point scale for the following reasons:
1. The 9-point scale gives the respondent more options to vary their answers. A
shorter scale would run the risk of people clustering in the middle and may not
have been sensitive enough to capture very high or low well-being.
2. There is no evidence that longer scales are less reliable (Matell and Jacoby,
1972) whilst collapsing scales may discard reliable information unnecessarily
3. The strength of agreement wording in a Likert Scale is not appropriate for these
questions. There is a risk with the ‘neither agree, not disagree’ that it would
mislead respondents.
Respondents were asked both positively and negatively phrased questions i.e. about the
things that would enhance and limit their happiness. They were also asked to rank the
ones that they considered most important for an index of social value, to get a different
perspective on how they valued the outcomes, and these are reported on later. Due to
the pace and scale of social change in Ireland, respondents were also asked to consider
extent to which people considered society to have changed over time.
As well as asking people about the things that contribute to their happiness, the
questionnaire asked people to evaluate their own level of wellbeing. Subjective well-
being is measured using four questions that draw on research by Dolan and Metcalfe
(2011) into the best way to combine the main theoretical approaches to measuring
wellbeing. This research was commissioned by the UK’s Office of National Statistics
and has informed the UK’s measurement of wellbeing. It is also the approach
recommended by the OECD in its Guidelines for Measuring Subjective Well-being
(OECD, 2013). The approaches are as follows:
• The ‘evaluative’ approach that asks individuals to step back and reflect on their
life and make a cognitive assessment of how their life is going overall, or on
certain aspects of their life. This is sometimes also known as the ‘hedonic
approach’.
82
• The ‘eudemonic’ approach, sometimes referred to as the psychological or
functioning/flourishing approach, which draws on self-determination theory and
tends to measure such things as people’s sense of meaning and purpose in life,
connections with family and friends, a sense of control and whether they feel part
of something bigger than themselves.
• The ‘experience’ approach which seeks to measure people’s positive and
negative experiences (or affect) over a short timeframe to capture people’s
subjective well-being on a day-to-day basis. This is also known as the Day
Reconstruction Method
(Dolan and Metcalfe, 2011, pp. 12–13)
Although these measures are widely adopted, they have some limitations, and a
discussion of their efficacy is provided in section 5.5. Finally, environmental questions
are included in the survey. As discussed in Chapter 4, although environmental issues
are being dealt with separately i.e. they are still included here to elicit the strength of
people’s pro-attitudes.
5.3.3 Accessing participants
The survey was designed using Survey Monkey and published and promoted online
through political blogs and social networks30 over a five-month period (October to
February 2012/13). As part of the strategy, Facebook ads were taken out and
respondents were offered a prize draw incentive for completing the survey. Although this
approach potentially introduces additional forms of bias (Nozek et al 2002), it
successfully increased the sample size (about 50% of the responses were gathered in
this way). ‘E-research’ has become a major phenomenon in the social sciences and
social networks are now widely used to attract research participants (Wilson et al. 2012).
Systems such as Amazon’s Mechanical Turk provide access to a large pool of research
participants (Buhrmester 2011). Granello and Wheaton (2004) describe the limitations
and risks of online surveys. Representativeness is chief amongst them though this
should be improving all the time as more people come online and technical skills
improve. Nonetheless, age is still the biggest determinant of digital exclusion (Dutton and
Blank, 2014) and there is a decreasing likelihood of being on online as you age. Granello
and Wheaton (2004) also make the point that less is known about the psychometric
properties of answering an online survey e.g. whether people scroll to the bottom of lists,
or how they read information online. Others argue that if the electronic survey format is
30 Published at www.wellbeinginireland.com for the period during which the survey was live
83
similar to paper-and-pencil surveys, traditional surveys can appropriately be transferred
to the Web (Lazar & Preece, 1999).
An alternative methodological approach was considered during the research design
stage. This was to carry out an exercise to map society’s ‘stakeholders’ and to hold focus
groups with representatives of these groups. This might have involved holding groups
with unions, business groups, farmers, interest groups, voluntary sector groups,
unemployed people, professional groups etc. However, it was decided that whilst this
might be interesting, a large-scale survey approach fitted better with the conceptual
framework. Whilst the use of additional qualitative methods would have brought some
further explanation of the data, it would not have been as efficient a way of answering
the research questions relating to the sum of society’s preferences (Calrson and Glenton,
2011). It would also introduce a whole host of additional biases, including selection bias
(Valdez and Kaplan, 2008). Despite attempts to be comprehensive a further risk with this
design is that sectional interests would overstate the interests of those groups and
reinforce existing social, economic and political hierarchies. Interpreting the data for
inclusion in a quantitative index would also have been challenging.
In total, 502 people attempted the survey, only 350 responses were complete. The first
question had many sub-domains and this clearly discouraged people from answering all
of them. This impacts on the statistical analysis later as incomplete responses are
excluded from the analysis, reducing the overall sample size and statistical power. This
is discussed again when I reflect on the survey in Chapter 10.
5.3.4 Data analysis
The data were analysed using Excel and Stata. Excel was used to generate some simple
descriptive statistics and report on the general findings from the study. The raw data
were then imported into Stata and poststratification was carried out to adjust the sample
survey (by applying sampling weights) to match national population data (see Appendix
1). This gives a greater weight to the views of sub-groups (strata) that have been over
or under-sampled. It does this by adjusting the degree of influence each stratum has on
the study results. When no weighting occurs, each respondent is "counted" once (i.e.,
each respondent receives a weight of one). When weighting is used to post-stratify
results, the weight (or influence) respondents are given can be more or less than one.
There are risks with using sampling weights. For example, there may be a penalty when
carrying out statistical tests of an increase in variance. It is also the case the some of the
changes may not be visible to the researcher. To check for this, statistical tests were
84
carried out with and without weighting, to see if it there were large differences in the
results. Both sets of results are reported on in Chapter 8.
Once the weights were calculated the following additional statistical tests were carried
out:
• Ordered Probit to test whether there was a relationship between people’s
subjective well-being and the type of things they valued
• Chi square to test whether demographic differences could be observed in the
things people valued (e.g. men and women)
5.3.5 Data selection
Data selection is a crucial step in designing an index and it is where much criticism has
been levied at composite indicators (Nardo et al., 2005). Any index is only as good as
the data on which it is built. Here we will focus on finding suitable national level indicators
for the outcomes that people value.
Brizius and Campbell describe an indicator as providing “evidence that a certain
condition exists, or certain results have or have not been achieved” (Brizius and
Campbell, 1991, p. A-15). Indicators enable decision-makers to assess progress towards
the achievement of intended processes, outputs or outcomes31. As such, indicators are
an integral part of any accountability system. Indicators can exist at various units of
analysis: population, agency, and programme level (Horsch, 1997). In selecting
indicators, it is good practice to involve more than one stakeholder in deciding on the
indicators. Although residents of the country were consulted on prioritising the outcomes,
it was outside the scope of the study to return to them again for inputs on the indicators.
In a larger research project, however, we might return to the population in question (Irish
people) to canvass opinion on the best way to measure the outcomes that they have
identified. This would be combined with expert opinion on the best way to measure an
outcome32 (Horsch, 1997).
31 We can think about the difference between these terms in the following ways. Take for
instance a project that aims to reduce loneliness amongst a group of people by giving them access to technology. The process would be the deployment of the technology, the output would be people’s usage of the technology and the outcome would be a reduction in loneliness that this would bring about. An appropriate outcome indicator would be a way of measuring loneliness, such as people’s self-reports of changes in their perception of being lonely. 32 For example, whilst people might tell us that their perception of their own health is the most
important measure of health, we might also know about problems with self-reporting of health outcomes and want to combine this with a more objective measure. See Chapter 9 for a discussion of issues with self-reported health in Ireland.
85
According to the OECD, indicators should be selected on the basis of their analytical
soundness, measurability, coverage, relevance to the phenomenon being measured and
relationship to each other (Nardo et al., 2005). In practice, however some of these
principles will conflict with each other. For example, an indicator may be an excellent
measure of an outcome but lack data of sufficient quality over a sufficient period.
Sometimes, an indicator will by its nature reveal partial information in relation to an
outcome. For example, if an outcome is ‘good quality work’, we will need more than one
piece of information to tell us whether this is happening. The employment rate will tell us
how many people are in work, but we will also need to know whether those jobs are of
good quality. Income is a good proxy for the quality of a job, but we may also want to
know about job security, working conditions and union coverage. Finally, it may make
sense to combine objective indicators with subjective data such as job satisfaction or
subjective views on how worthwhile the job is. Combining these data provides a much
more rounded picture of whether the outcome of quality work is being achieved.
However, a limitation of this list is that it is long, and depending on the resources and
time available, it may not be possible to measure all these things. Reducing the list to
the most important elements in this example requires some judgement and it is most
important that it is done in a transparent manner with clear rationales.
Multivariate analysis
The findings from the survey resulted in several ranked determinants. The next step was
to further reduce the number of outcomes to a core set of components using multivariate
analysis. Once the components were decided upon, indicators of each outcome were
selected in line with the guidance above.
It is recommended that multivariate techniques are used in the process of building an
index (Nardo et al. 2005). According to the OECD, indicators can be chosen in an
arbitrary manner, which can lead to indices, which overwhelm, confuse and mislead
decision-makers and the general public (ibid.). They describe this environment as
“indicator rich but information poor” (Nardo et al. ibid. p 35).
There are two types of multivariate analysis that would be appropriate here: Principal
Component Analysis (PCA) and Exploratory Factor Analysis (DeCoster, 1998). Whilst
the techniques share many similarities, there are some differences (ibid.). PCA it is more
important for researchers seeking to reduce the number of variables, which was a priority
here. EFA on the other hand is useful when the underlying construct cannot be directly
measured. For example, EFA is quite common in the measurement of psychiatric
problems (e.g. Spence 1997). PCA was considered the most appropriate method.
86
PCA reduces a larger set of variables into a smaller set of 'artificial' variables, called
'principal components', which account for most of the variance in the original variables
(Joliffe, 2014). The new set of variables are uncorrelated and are ordered by the fraction
of the total information each retains (the greater the variance, the higher the principal
component).
In this dataset, there is a high number of variables which are all measuring the same
underlying construct (e.g. the things in life that make people happy). By applying PCA it
is possible to test whether the variables ‘load’ onto all the components or just some of
them and whether there are superfluous variables that can be removed from the analysis.
PCA should therefore enable greater parsimony without a great loss of information. PCA
is returned to again in Chapter 6. In Section B of this chapter, I present the findings from
the literature review that informed the survey questions.
Section B: Identifying indicators - the determinants of well-being
The aim of this section is to review the literature on the determinants of well-being to
identify the variables to be included in the survey. The aim is to use the literature to arrive
at a ‘long list’ of indicators that participants are then asked to rate in terms of importance
to their well-being. The methodology for the review is discussed in the previous section.
The findings have been split into four sections:
1. Macroeconomic determinants 2. Social policy determinants 3. Determinants in the social sphere, and 4. Demographic determinants
The research takes as a starting point that most people’s happiness is socially and
economically determined, and the review focuses mainly on those aspects of wellbeing
that are amenable to influence through policy changes as opposed to personality and
demographic factors, which are fixed (see Figure 5.2). Although these will be discussed,
they are largely outside the scope of the review. The section begins with a discussion of
the efficacy of well-being measures.
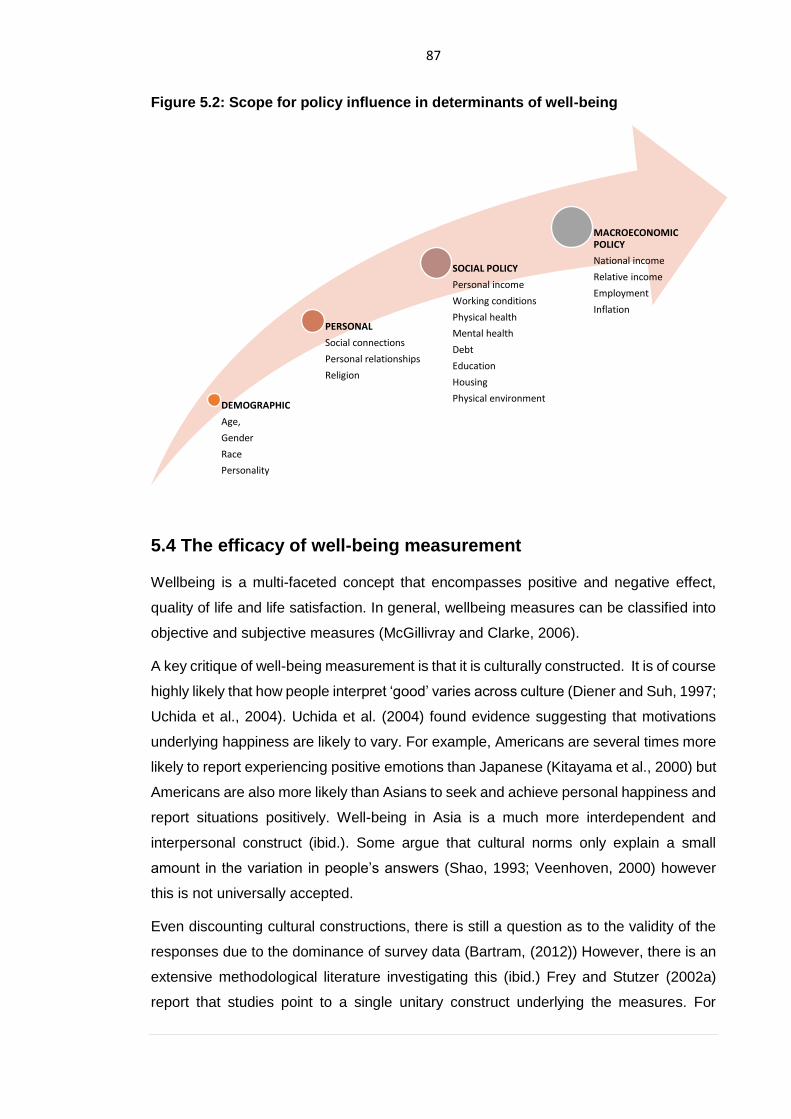
87
Figure 5.2: Scope for policy influence in determinants of well-being
5.4 The efficacy of well-being measurement
Wellbeing is a multi-faceted concept that encompasses positive and negative effect,
quality of life and life satisfaction. In general, wellbeing measures can be classified into
objective and subjective measures (McGillivray and Clarke, 2006).
A key critique of well-being measurement is that it is culturally constructed. It is of course
highly likely that how people interpret ‘good’ varies across culture (Diener and Suh, 1997;
Uchida et al., 2004). Uchida et al. (2004) found evidence suggesting that motivations
underlying happiness are likely to vary. For example, Americans are several times more
likely to report experiencing positive emotions than Japanese (Kitayama et al., 2000) but
Americans are also more likely than Asians to seek and achieve personal happiness and
report situations positively. Well-being in Asia is a much more interdependent and
interpersonal construct (ibid.). Some argue that cultural norms only explain a small
amount in the variation in people’s answers (Shao, 1993; Veenhoven, 2000) however
this is not universally accepted.
Even discounting cultural constructions, there is still a question as to the validity of the
responses due to the dominance of survey data (Bartram, (2012)) However, there is an
extensive methodological literature investigating this (ibid.) Frey and Stutzer (2002a)
report that studies point to a single unitary construct underlying the measures. For
DEMOGRAPHIC
Age,
Gender
Race
Personality
PERSONAL
Social connections
Personal relationships
Religion
SOCIAL POLICY
Personal income
Working conditions
Physical health
Mental health
Debt
Education
Housing
Physical environment
MACROECONOMIC POLICY
National income
Relative income
Employment
Inflation
88
example, studies have found that they are consistent with other measures of well-being
(e.g. that happy people smile more often (Fernández-Dols and Ruiz-Belda, 1995) and
are less likely to commit suicide (Koivumaa-Honkanen, 2001). Developments in
neuroscience find that changes in brain electrical activity and heart rate account for
substantial variance in reported negative affect (Davidson et al., 2000).
Finally, there is a question about their reliability. Frey and Stutzer (2002a) quote reliability
studies, which find that reported subjective wellbeing is moderately stable and sensitive
to changing life circumstances. According to Diener et. al. (1995) people appear to form
life satisfaction questions in response to the question, rather than recalling a sorted life
satisfaction judgment and reporting it. Elsewhere, Diener et al (1999) consider the
validity, reliability and consistency to have been well-established, given that they
correlate with other measurement methods such as clinical assessments and the
number of positive and negative events recalled by the individual ( Clark, Frijters, &
Shields, 2008).
This does not mean that SWB measurement is without critics. Whilst many of these have
been based on a priori scepticism, (Clark et al., 2008) this is not always so. In a review
of biases in self-reported data, Bertrand and Mullainathan (2001) also argue that much
of the scepticism is well-founded. Dolan et. al. caution against drawing firm conclusions
about the causes of SWB due to contradictory findings, issues with the direction of
causality and potentially unobserved variables (Dolan et al., 2008). As we will see in this
review, it is not unusual for studies to find that contradictory factors are simultaneously
contributing to well-being. In addition, the chapter will flag areas where the direction of
causality is unclear. As we will see, some determinants are more well-researched than
others and the grounds for claiming causality therefore stronger.
5.5 Macroeconomic determinants
Macroeconomic determinants relate to economy-wide phenomena, such as income,
inflation and employment. Although some of these have direct personal impacts, such
as employment, I include them here as they tend to be managed at the economy-wide
level.
5.5.1 Income - national
Beginning with Easterlin’s work in the 1970s described in Chapter 2, repeated studies
have found a non-linear relationship between increases in GDP and well-being. Like with
personal income, there is a point at which the returns to well-being from increases in
GDP begin to diminish (Blanchflower and Oswald, 2011; Easterlin, 1995). It is generally
accepted that increases in national income have a small but significant effect on well-
89
being, which is greater for poorer people (Diener and Biswas-Diener, 2002). However,
this relationship does not appear to hold over the long-term for developed countries
(Blanchflower & Oswald, 2004a). Controlling for other factors such as democracy
(Inglehart and Klingemann, 2000), health, the quality of government and human rights
reduces the effect of GDP (Frey & Stutzer, 2002a), although as Stoll et al. (2012) have
pointed out, these also correlate with GDP and separating it from other features of
advanced economies is challenging.
This so-called paradox has been particularly striking in the US. Some claims to debunk
the Easterlin Paradox have used other data to suggest a stronger relationship in Europe
and Japan between income and growth (Stevenson & Wolfers, 2008). However, even
these authors have been puzzled by the US. Traditionally the engine of economic growth,
since the 1970s this has been accompanied by little rise in SWB (ibid.)
The most recent work questioning the paradox is an update of the Stevenson and
Wolfers 2008 paper (Sacks et al., 2012). However, it is based on a shorter time-period
(approximately a decade). Easterlin (2013) has published a rebuttal arguing that short-
term movements in life satisfaction can be mistaken for a longer-term relationship,
particularly for outlier economies such the former Soviet Union that experienced changes
in both GDP and life satisfaction due to a common third variable. He also uses the
example of Ireland to show that whilst short-term decadal changes suggest a marginally
statistically significant relationship, this disappears when replaced with long-run data
(ibid: 7-8).
In addition, the relationship between the rate of growth and well-being appears mixed.
Although some papers report a positive relationship (Campbell, Shaw, & Gilliom, 2000;
Hagerty & Veenhoven, 2003;) others do not (Easterlin & Sawangfa, 2009; Easterlin,
1995). Divergent results also appear to relate to the time period over which the
relationship is observed (Stoll et al., 2012).
5.5.2 Income - relative
As discussed in Chapter 2, the relative income hypothesis states that what matters to an
individual in a rich country might be relative, rather than absolute income (Duesenberry,
1949). The hypothesis appears to be confirmed by empirical research on well-being with
many studies finding that the income of a reference group is as at least as important as
one’s own income in influencing well-being (Ball and Chernova, 2008; Hagerty, 2000a;
Helliwell and Huang, 2006b).33 Luttmer (2005) finds that controlling for an individual’s
33 For more evidence of this see also (Ball & Chernova, 2008; Barrington-Leigh & Helliwell, 2008;
Daly, Oswald, Wilson, & Wu, 2011; Di Tella & MacCulloch, 2008; Ferrer-i-Carbonell, 2005;
90
own income, higher earnings of neighbours are associated with lower levels of self-
reported happiness. This is confirmed by Dynan and Ravina who also find that the effect
is concentrated among those with above-average incomes. Frey and Stutzer (2005) find
that life satisfaction is associated with the level of income that people consider to be
‘sufficient’, which is drawn from a reference group. They find no independent role for
absolute income.
Easterlin also hypothesized that adaptation swamps the effects of changes in economic
circumstances (and other objective circumstances) on happiness. This has been
demonstrated by other research which shows that lottery winners (Brickman, Coates, &
Janoff-Bulman, 1978) and severe accident victims (Silver, 1982) adapt to their new
circumstances and eventually return to their previous levels of self-reported happiness.
Brown et al. (2005) also find lower General Health Questionnaire scores when people
perceived their current financial situation to be worse than last year and when next year’s
situation is predicted to be even worse (quoted in Dolan et al., 2008). Other research
suggests that habituation to improved economic circumstances is quite rapid, so any
gains in happiness are short-lived (Headey, Muffels, & Wooden, 2008).
The weight of evidence in favour of the relative income hypothesis has led to a general
acceptance that relative positions matter at least as much as absolute (Hopkins, 2008).
Although this might be interpreted as evidence that inequality is bad for our well-being,
it seems curious at first that some studies have found positive relationships between
inequality and happiness (Berg & Veenhoven, 2010; Bjornskov, 2008; Clark & Delta,
2003; Veenhoven, 1996). However, other studies find that inequality does negatively
affect wellbeing (Alesina, et al. 2004; Fahey & Smyth, 2004; Graham & Felton, 2006)34.
Where authors find a relationship, it seems to hold across countries (Diener et al., 1995;
Helliwell & Huang, 2006) and across states in the US (Alesina et al., 2004; Wilkinson &
Pickett, 2010). It has also been found in studies of child well-being (Bradshaw et al. 2007;
Pickett & Wilkinson, 2007; Statham & Chase, 2010).
There is also some evidence for inequality-aversion i.e. that people don’t like to live in
unequal societies (Frey and Stutzer, 2002a; Oishi et al., 2011) with higher inequality
aversion in Europe than the US (Alesina et al., 2004a). Inequality aversion is lower in
countries like the US where there is a perception (erroneously) that social mobility is high
i.e. that everyone has a shot at reaching the top of the ladder no matter how steep the
Hagerty, 2000a; Heliwell & Huang, 2005; Knight, Song, & Gunatilaka, 2009; Powdthavee, 2010; Senik, 2005; Bernard Van Van Praag & Ferrer-i-Carbonell, 2011). 34 For more evidence of this see also (Alesina, Di Tella, & MacCulloch, 2004; Fahey & Smyth,
2004; Graham & Felton, 2006; Graham & Pettinato, 2001; Hagerty, 2000b; Oishi, Kesebir, & Diener, 2011; Schwarze & Härpfer, 2004)
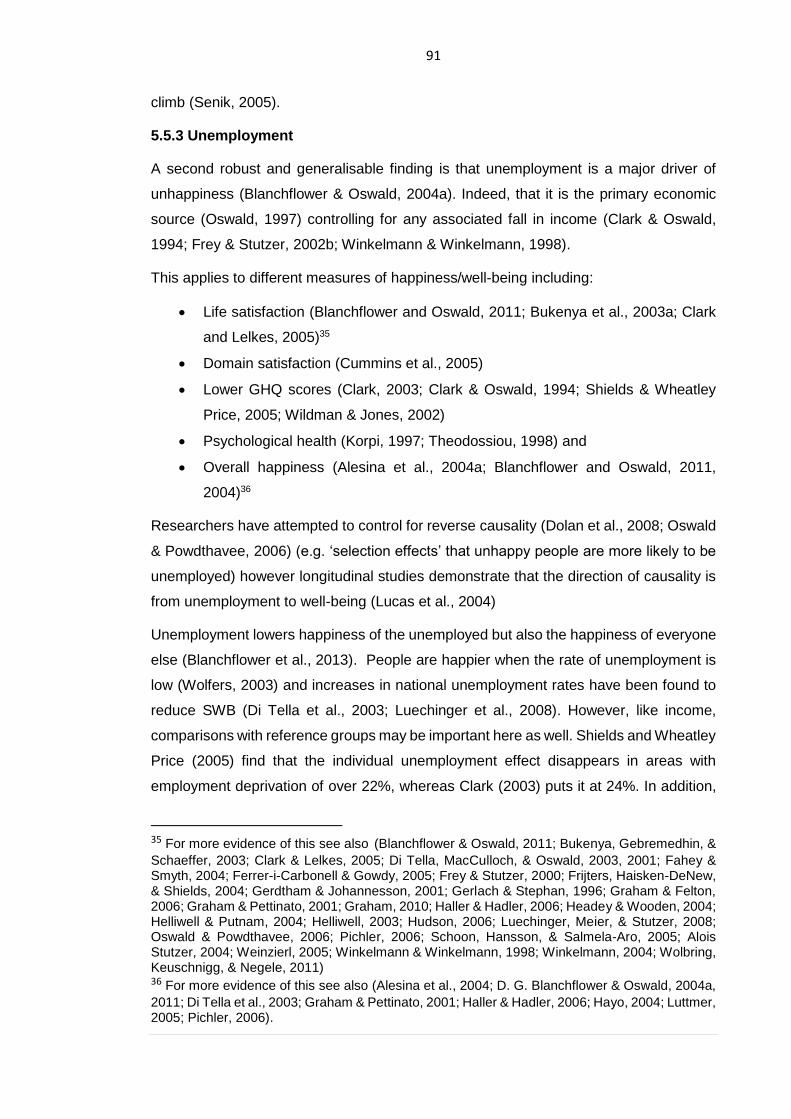
91
climb (Senik, 2005).
5.5.3 Unemployment
A second robust and generalisable finding is that unemployment is a major driver of
unhappiness (Blanchflower & Oswald, 2004a). Indeed, that it is the primary economic
source (Oswald, 1997) controlling for any associated fall in income (Clark & Oswald,
1994; Frey & Stutzer, 2002b; Winkelmann & Winkelmann, 1998).
This applies to different measures of happiness/well-being including:
• Life satisfaction (Blanchflower and Oswald, 2011; Bukenya et al., 2003a; Clark
and Lelkes, 2005)35
• Domain satisfaction (Cummins et al., 2005)
• Lower GHQ scores (Clark, 2003; Clark & Oswald, 1994; Shields & Wheatley
Price, 2005; Wildman & Jones, 2002)
• Psychological health (Korpi, 1997; Theodossiou, 1998) and
• Overall happiness (Alesina et al., 2004a; Blanchflower and Oswald, 2011,
2004)36
Researchers have attempted to control for reverse causality (Dolan et al., 2008; Oswald
& Powdthavee, 2006) (e.g. ‘selection effects’ that unhappy people are more likely to be
unemployed) however longitudinal studies demonstrate that the direction of causality is
from unemployment to well-being (Lucas et al., 2004)
Unemployment lowers happiness of the unemployed but also the happiness of everyone
else (Blanchflower et al., 2013). People are happier when the rate of unemployment is
low (Wolfers, 2003) and increases in national unemployment rates have been found to
reduce SWB (Di Tella et al., 2003; Luechinger et al., 2008). However, like income,
comparisons with reference groups may be important here as well. Shields and Wheatley
Price (2005) find that the individual unemployment effect disappears in areas with
employment deprivation of over 22%, whereas Clark (2003) puts it at 24%. In addition,
35 For more evidence of this see also (Blanchflower & Oswald, 2011; Bukenya, Gebremedhin, &
Schaeffer, 2003; Clark & Lelkes, 2005; Di Tella, MacCulloch, & Oswald, 2003, 2001; Fahey & Smyth, 2004; Ferrer-i-Carbonell & Gowdy, 2005; Frey & Stutzer, 2000; Frijters, Haisken-DeNew, & Shields, 2004; Gerdtham & Johannesson, 2001; Gerlach & Stephan, 1996; Graham & Felton, 2006; Graham & Pettinato, 2001; Graham, 2010; Haller & Hadler, 2006; Headey & Wooden, 2004; Helliwell & Putnam, 2004; Helliwell, 2003; Hudson, 2006; Luechinger, Meier, & Stutzer, 2008; Oswald & Powdthavee, 2006; Pichler, 2006; Schoon, Hansson, & Salmela-Aro, 2005; Alois Stutzer, 2004; Weinzierl, 2005; Winkelmann & Winkelmann, 1998; Winkelmann, 2004; Wolbring, Keuschnigg, & Negele, 2011) 36 For more evidence of this see also (Alesina et al., 2004; D. G. Blanchflower & Oswald, 2004a,
2011; Di Tella et al., 2003; Graham & Pettinato, 2001; Haller & Hadler, 2006; Hayo, 2004; Luttmer, 2005; Pichler, 2006).
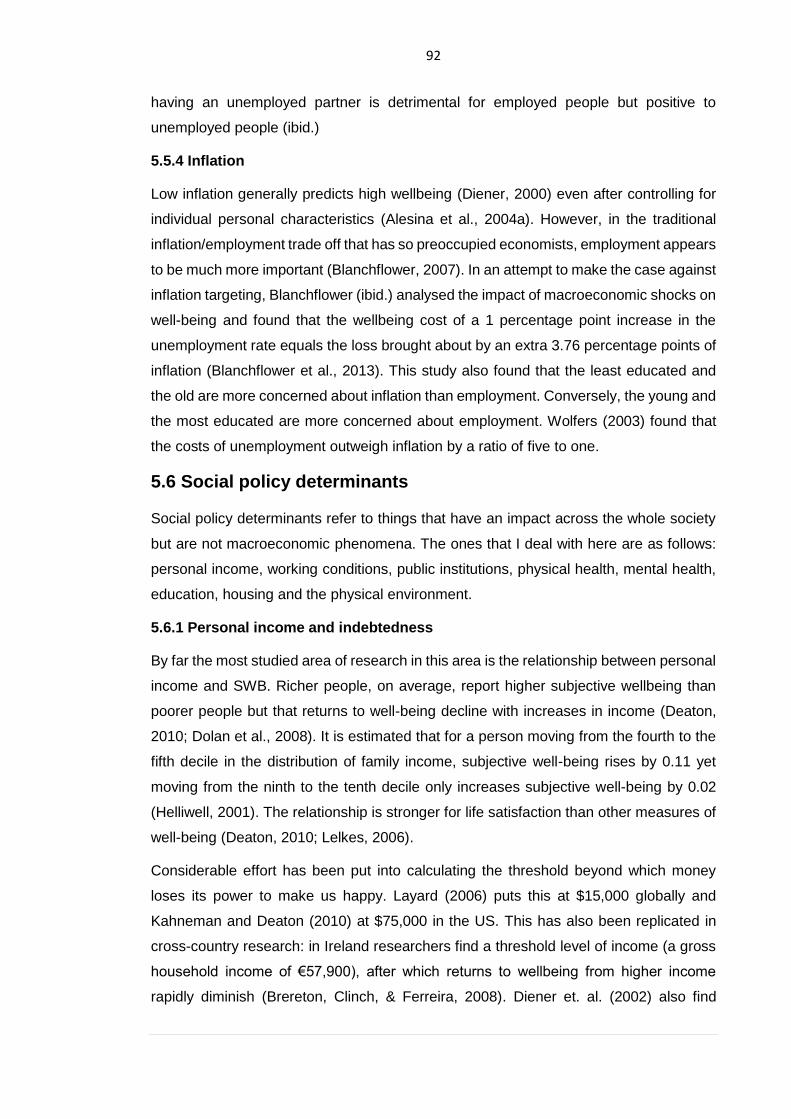
92
having an unemployed partner is detrimental for employed people but positive to
unemployed people (ibid.)
5.5.4 Inflation
Low inflation generally predicts high wellbeing (Diener, 2000) even after controlling for
individual personal characteristics (Alesina et al., 2004a). However, in the traditional
inflation/employment trade off that has so preoccupied economists, employment appears
to be much more important (Blanchflower, 2007). In an attempt to make the case against
inflation targeting, Blanchflower (ibid.) analysed the impact of macroeconomic shocks on
well-being and found that the wellbeing cost of a 1 percentage point increase in the
unemployment rate equals the loss brought about by an extra 3.76 percentage points of
inflation (Blanchflower et al., 2013). This study also found that the least educated and
the old are more concerned about inflation than employment. Conversely, the young and
the most educated are more concerned about employment. Wolfers (2003) found that
the costs of unemployment outweigh inflation by a ratio of five to one.
5.6 Social policy determinants
Social policy determinants refer to things that have an impact across the whole society
but are not macroeconomic phenomena. The ones that I deal with here are as follows:
personal income, working conditions, public institutions, physical health, mental health,
education, housing and the physical environment.
5.6.1 Personal income and indebtedness
By far the most studied area of research in this area is the relationship between personal
income and SWB. Richer people, on average, report higher subjective wellbeing than
poorer people but that returns to well-being decline with increases in income (Deaton,
2010; Dolan et al., 2008). It is estimated that for a person moving from the fourth to the
fifth decile in the distribution of family income, subjective well-being rises by 0.11 yet
moving from the ninth to the tenth decile only increases subjective well-being by 0.02
(Helliwell, 2001). The relationship is stronger for life satisfaction than other measures of
well-being (Deaton, 2010; Lelkes, 2006).
Considerable effort has been put into calculating the threshold beyond which money
loses its power to make us happy. Layard (2006) puts this at $15,000 globally and
Kahneman and Deaton (2010) at $75,000 in the US. This has also been replicated in
cross-country research: in Ireland researchers find a threshold level of income (a gross
household income of €57,900), after which returns to wellbeing from higher income
rapidly diminish (Brereton, Clinch, & Ferreira, 2008). Diener et. al. (2002) also find
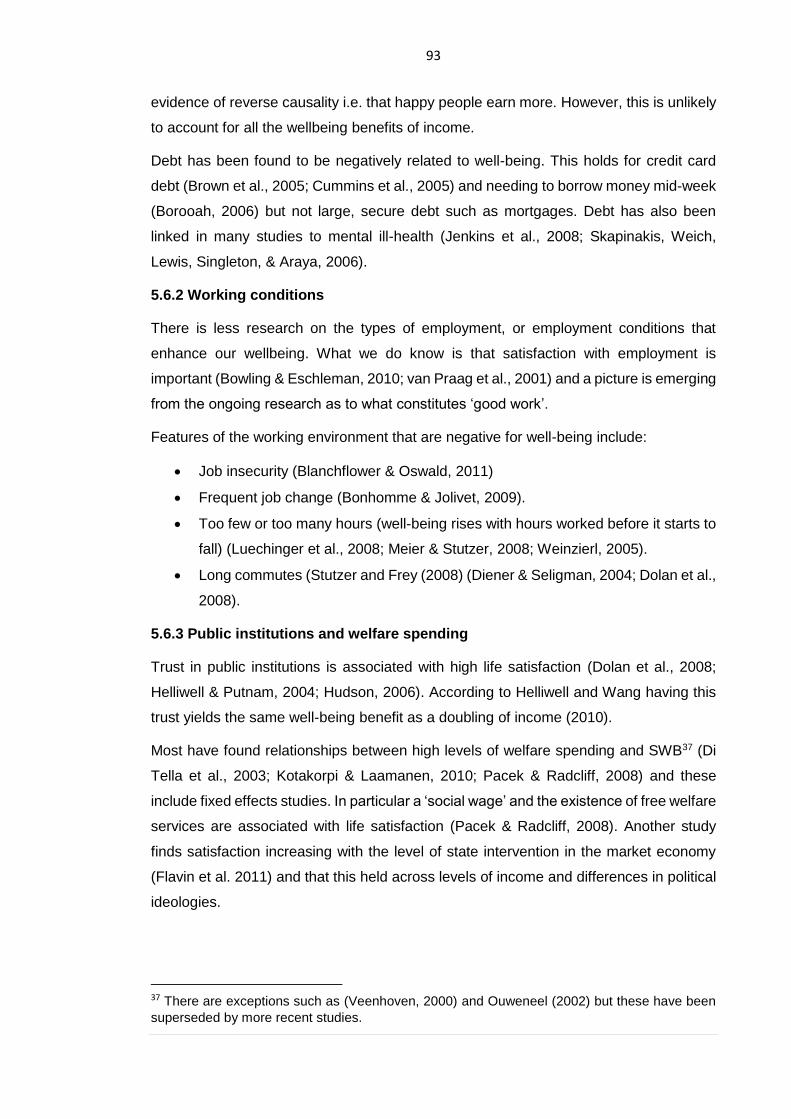
93
evidence of reverse causality i.e. that happy people earn more. However, this is unlikely
to account for all the wellbeing benefits of income.
Debt has been found to be negatively related to well-being. This holds for credit card
debt (Brown et al., 2005; Cummins et al., 2005) and needing to borrow money mid-week
(Borooah, 2006) but not large, secure debt such as mortgages. Debt has also been
linked in many studies to mental ill-health (Jenkins et al., 2008; Skapinakis, Weich,
Lewis, Singleton, & Araya, 2006).
5.6.2 Working conditions
There is less research on the types of employment, or employment conditions that
enhance our wellbeing. What we do know is that satisfaction with employment is
important (Bowling & Eschleman, 2010; van Praag et al., 2001) and a picture is emerging
from the ongoing research as to what constitutes ‘good work’.
Features of the working environment that are negative for well-being include:
• Job insecurity (Blanchflower & Oswald, 2011)
• Frequent job change (Bonhomme & Jolivet, 2009).
• Too few or too many hours (well-being rises with hours worked before it starts to
fall) (Luechinger et al., 2008; Meier & Stutzer, 2008; Weinzierl, 2005).
• Long commutes (Stutzer and Frey (2008) (Diener & Seligman, 2004; Dolan et al.,
2008).
5.6.3 Public institutions and welfare spending
Trust in public institutions is associated with high life satisfaction (Dolan et al., 2008;
Helliwell & Putnam, 2004; Hudson, 2006). According to Helliwell and Wang having this
trust yields the same well-being benefit as a doubling of income (2010).
Most have found relationships between high levels of welfare spending and SWB37 (Di
Tella et al., 2003; Kotakorpi & Laamanen, 2010; Pacek & Radcliff, 2008) and these
include fixed effects studies. In particular a ‘social wage’ and the existence of free welfare
services are associated with life satisfaction (Pacek & Radcliff, 2008). Another study
finds satisfaction increasing with the level of state intervention in the market economy
(Flavin et al. 2011) and that this held across levels of income and differences in political
ideologies.
37 There are exceptions such as (Veenhoven, 2000) and Ouweneel (2002) but these have been
superseded by more recent studies.
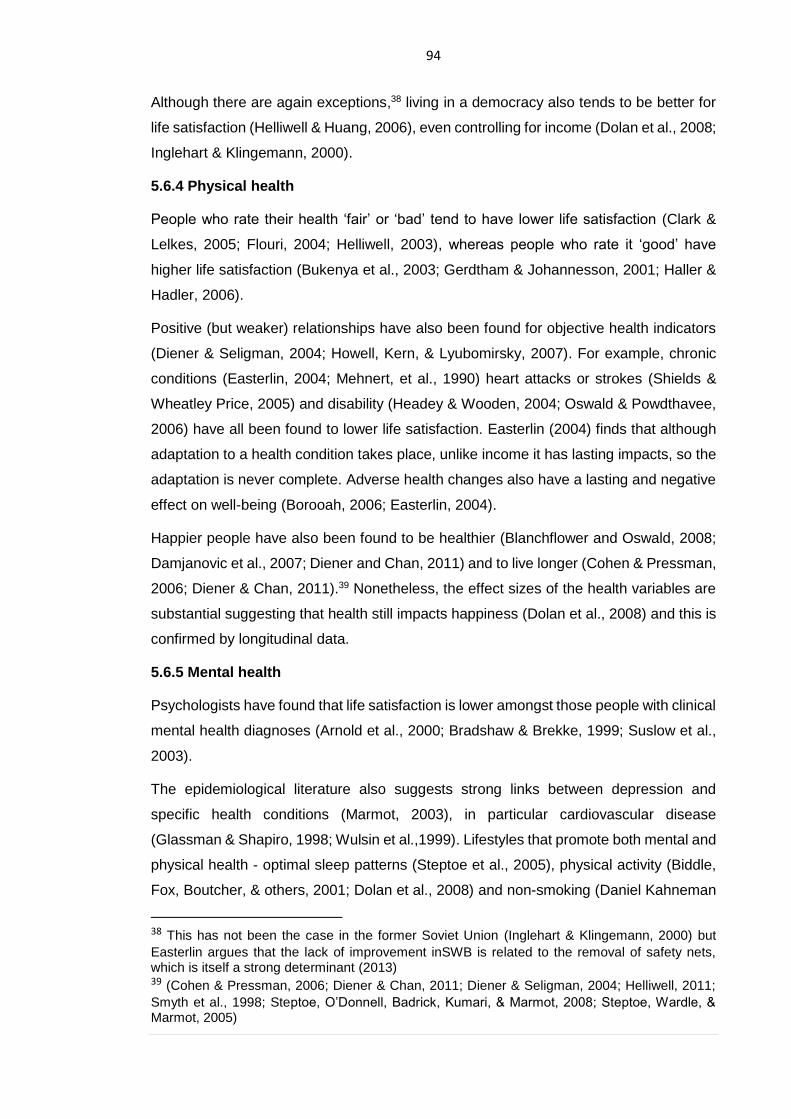
94
Although there are again exceptions,38 living in a democracy also tends to be better for
life satisfaction (Helliwell & Huang, 2006), even controlling for income (Dolan et al., 2008;
Inglehart & Klingemann, 2000).
5.6.4 Physical health
People who rate their health ‘fair’ or ‘bad’ tend to have lower life satisfaction (Clark &
Lelkes, 2005; Flouri, 2004; Helliwell, 2003), whereas people who rate it ‘good’ have
higher life satisfaction (Bukenya et al., 2003; Gerdtham & Johannesson, 2001; Haller &
Hadler, 2006).
Positive (but weaker) relationships have also been found for objective health indicators
(Diener & Seligman, 2004; Howell, Kern, & Lyubomirsky, 2007). For example, chronic
conditions (Easterlin, 2004; Mehnert, et al., 1990) heart attacks or strokes (Shields &
Wheatley Price, 2005) and disability (Headey & Wooden, 2004; Oswald & Powdthavee,
2006) have all been found to lower life satisfaction. Easterlin (2004) finds that although
adaptation to a health condition takes place, unlike income it has lasting impacts, so the
adaptation is never complete. Adverse health changes also have a lasting and negative
effect on well-being (Borooah, 2006; Easterlin, 2004).
Happier people have also been found to be healthier (Blanchflower and Oswald, 2008;
Damjanovic et al., 2007; Diener and Chan, 2011) and to live longer (Cohen & Pressman,
2006; Diener & Chan, 2011).39 Nonetheless, the effect sizes of the health variables are
substantial suggesting that health still impacts happiness (Dolan et al., 2008) and this is
confirmed by longitudinal data.
5.6.5 Mental health
Psychologists have found that life satisfaction is lower amongst those people with clinical
mental health diagnoses (Arnold et al., 2000; Bradshaw & Brekke, 1999; Suslow et al.,
2003).
The epidemiological literature also suggests strong links between depression and
specific health conditions (Marmot, 2003), in particular cardiovascular disease
(Glassman & Shapiro, 1998; Wulsin et al.,1999). Lifestyles that promote both mental and
physical health - optimal sleep patterns (Steptoe et al., 2005), physical activity (Biddle,
Fox, Boutcher, & others, 2001; Dolan et al., 2008) and non-smoking (Daniel Kahneman
38 This has not been the case in the former Soviet Union (Inglehart & Klingemann, 2000) but
Easterlin argues that the lack of improvement inSWB is related to the removal of safety nets, which is itself a strong determinant (2013) 39 (Cohen & Pressman, 2006; Diener & Chan, 2011; Diener & Seligman, 2004; Helliwell, 2011;
Smyth et al., 1998; Steptoe, O’Donnell, Badrick, Kumari, & Marmot, 2008; Steptoe, Wardle, & Marmot, 2005)
95
& Deaton, 2010) - also appear to be good for our well-being. Although there are again
issues with the direction of causality –- the evidence is particularly strong for physical
activity, even for simple activities like gardening (Ferrer-i-Carbonell & Gowdy, 2005).
5.6.6 Education
The existence of formal education in a country is, broadly speaking, positively correlated
with well-being. This is true of in-country studies in the USA (Blanchflower & Oswald,
2011), Switzerland (Frey & Stutzer, 2000), Sweden (Gerdtham & Johannesson, 2001)
and Northern Ireland (Borooah, 2005), as well as in cross-national studies ( Dorn, et al.,
2007; Graham & Felton, 2006; Hudson, 2006). Several studies find a relationship
between completion of high school and well-being (Clark & Lelkes, 2005; Hudson, 2006;
Lelkes, 2006), whereas Blanchflower and Oswald find that it increases with each
additional level of education (Blanchflower & Oswald, 2011).
On the other hand, some studies find no such relationship (Flouri, 2004; Haller & Hadler,
2006; Headey & Wooden, 2004). Others find a negative association in the USA (Baker
et al., 2005; Thoits & Hewitt, 2001) and in Britain (Ferrer-i-Carbonell & Gowdy, 2005;
Shields & Price, 2005). Certainly, once other factors such as aspirations (Stutzer, 2004)
and social mobility (Graham & Pettinato, 2001) are controlled for, the relationship
between education and SWB weakens.
Once explanation for the mixed results might be diminishing returns. Those that offer this
suggest that it is middle education (secondary school) where the cut-off takes place
(Helliwell & Putnam, 2004; Helliwell, 2003; Alois Stutzer, 2004). A second explanation is
that raised aspirations acquired through higher levels of education lead to lower
satisfaction when these are unfulfilled (Frey and Stutzer, 2002a; Stutzer, 2004). A third
explanation is that the well-being impacts are captured indirectly through income, and
controlling for income underestimates the effect education has (Bukenya et al., 2003a;
Dolan et al., 2008; Gerdtham and Johannesson, 2001)
5.6.7 Housing
There is a dearth of good quality studies on housing and well-being (Thomson et al.,
2002). A few studies in the economics literature have found that the quality of housing
correlates with life satisfaction (Clark & Lelkes, 2005; Ferrer-i-Carbonell & Gowdy, 2007).
However, the bulk of the research in this field has taken place within social psychology.
Most notably, Gary Evans (2003) has conducted numerous research studies examining
the effects of the physical environment on children’s well-being. Evans’ body of research
shows that physical environments - noise level, overcrowding, housing and
neighbourhood quality significantly predict various aspects of child development. In
96
addition, frequent relocations, which occur more often among people living in poor-
quality housing, are a risk factor for socioemotional problems in children (ibid.). Single-
family detached homes are associated with the best mental health outcomes (Evans,
2003; Weich et al., 2002). In a recent update of Evans’ review Nakazato and Fujihara
(2015) provide further evidence that better housing leads to higher levels of well-being.
The relationship between home ownership and well-being appears to be particularly
robust, with renters consistently experiencing lower levels of life satisfaction, which rises
upon purchasing a home (Cummins et al., 2005; Robinson et al., 2008; Vera-Toscano &
Ateca-Amestoy, 2008).
5.6.8 Physical environment
Physical deprivation in the local environment reduces SWB, even after controlling for
income (Abraham, et al., 2010; Ferrer-i-Carbonell & Gowdy, 2007; Shields & Price,
2005). There is also some evidence that people prefer rural landscapes (Korpela,
Klemettilä, & Hietanen, 2002; Staats & Hartig, 2004) and that SWB is higher in rural
areas (Brereton et al., 2011; Clinch, et al. 2006; Gerdtham & Johannesson, 2001; Hayo,
2004; Rehdanz & Maddison, 2005). High density living also appears to be bad for SWB
(Lelkes, 2006).
High levels of pollution in an area is bad for the SWB of its inhabitants (Di Tella &
MacCulloch, 2008; Frey et al. 2009), as are perceptions of an area having environmental
problems (Ferrer-i-Carbonell & Gowdy, 2007). This includes both air pollution (Welsch,
2006) and noise pollution (Van Praag & Baarsma, 2005).
5.7 Determinants in the personal sphere
This section covers determinants that relate to personal factors about how we live our
lives and relate to one another. These are: social connections, relationships and
marriage and religion.
5.7.1 Social connections
In general, a greater number of social connections, more meaningful social connections
and more time spent socialising are all associated with higher life satisfaction (Dolan et
al., 2008; Lelkes, 2006; Pichler, 2006) and appear to be strong predictors of well-being
(Stiglitz et al., 2009).
People who participate in their community and undertake voluntary work report higher
levels of life satisfaction (Keyes, 1998). However, there is evidence of reverse causality
(DeNeve and Cooper, 1998; Haller and Hadler, 2006; Thoits and Hewitt, 2001) and some
evidence that this effect is mediated by reducing loneliness (Bramston, 2002).
97
Social capital and trust in others are both positive for well-being (Helliwell and Putnam,
2004; Hooghe and Vanhoutte, 2010). Countries with above average levels of well-being
report high social capital and stronger friendship networks (Bjornskov, 2008; Bjørnskov,
2003; Vemuri & Costanza, 2006), and Bartolini and Bilancini (2010) argue that declining
social capital helps explain long-term trends in well-being in the US.
Membership of organisations increases wellbeing (Helliwell, 2003; Pichler, 2006) but
again there are issues with reverse causality. More time spent in informal care for others
lowers happiness and increases depressive symptoms (Hirst, 2003, 2005; Marks,
Lambert, & Choi, 2002; Van den Berg & Ferrer-i-Carbonell, 2007).
5.7.2 Personal relationships and marriage
Some studies suggest that relationships with partners and family are the most important
explanatory factor in understanding well-being (Bacon et al. 2010). Repeated studies
have find that marriage is associated with happiness (Blanchflower & Oswald, 2000;
Clark & Oswald, 1994; Coombs, 1991) and this holds for many countries across the
world40 (Diener et al., 2000). This is also the case where it is compared with other
domestic arrangements (Blanchflower & Oswald, 2000; Clark & Oswald, 1994; Coombs,
1991). Reverse causality is also an issue: happier singles are more likely to marry
(Stutzer and Frey, 2006).
MacKerron (2011) points out there is a strong risk of omitted variable bias in these
studies, namely the benefits of being in a partnership. Other studies suggest that it is the
ingredients of a good marriage (companionship, stability etc.) that are important
(Blanchflower and Oswald, 2000; Dolan et al., 2008; Hooghe and Vanhoutte, 2010)
In terms of children’s well-being, family conflict is the largest predictor of low well-being
(Gutman, et al., 2010; Rees, et al., 2010). Some studies find that parental divorce lowers
well-being (MacKerron, 2011), however, this has not been found in all studies (Bradshaw
et al., 2007). Evidence on the effect on parents of having children is rather mixed,
depending on the measure, country, number and age of children, and parental situation
(MacKerron, 2011).
5.7.3 Religion
Findings that relate to religion are quite conclusive: religious belief and practice is
positive for wellbeing (Borooah, 2006; Francis and Lester, 1997; Helliwell, 2003)
40 An exception here appears to be Ireland. Clinch et. al. (2006) find no difference between
married and single respondents. The authors cite an explanation offered by Stack and Eshleman (1998) that due to the low divorce rate more couples may be ‘trapped’ in unhappy marriages.
98
(Helliwell, 2003). This applies for life satisfaction (Clark & Lelkes, 2005; Hayo, 2004) and
positive emotion (Kahneman et al., 2004b) and is consistent across denominations
(Cohen, 2002). Regular attendance at religious activity is generally positive (Clark &
Lelkes, 2005; Ferriss, 2002; Hayo, 2004; Helliwell, 2003; Myers, 2001). Some scholars
have found that the effect is primarily social (Stark and Maier, 2008) but others have
found belief also to be important (Borooah, 2006; Francis & Lester, 1997).
5.8 Demographic determinants
This final section looks at the extent to which demographic variables such as age,
gender, race and personality impact on our well-being.
5.8.1 Age, gender and race
Most studies suggest a U-shaped relationship between age and well-being with higher
levels of well-being at the younger and older age points and the lowest life satisfaction
occurring in middle age, between about 32 and 50 years, depending on the study
(Blanchflower & Oswald, 2007; Easterlin, 2006; Helliwell, 2003). Wellbeing is at a
minimum for those in their late 30s early 40s (Clark, Oswald, & Warr, 1996). However,
this varies from country to country (a minimum of 35.2 in Switzerland and 61.9 in France).
The evidence on gender differences in inconclusive. Some studies find that women
report higher happiness (Alesina et al., 2004a) but have the worst scores on measures
such as the General Health Questionnaire (GHQ) (Clark & Oswald, 1994). It is not clear
whether this greater range is attributable to greater variance, or greater willingness to
report different emotional states (Stoll et al., 2012). This demonstrates again the
importance of using different types of measures.
In the US, race is an important determinant of well-being: white and Hispanic people
have higher SWB than African Americans (Dolan et al., 2008; Thoits & Hewitt, 2001).
There are few studies that consider this issue at the European level, so it is not clear if
these findings can be generalized beyond the US.
5.8.2 Personality and culture
The estimates for the influence of personality factors vary from 40-50% (Lykken and
Tellegen, 1996) (Røysamb et al., 2002) to 19 per cent (Helliwell and Huang, 2006a).
Research has shown that personality traits such as optimism, self-esteem
agreeableness, and extraversion are predictors of life satisfaction (DeNeve & Cooper,
1998; Diener, 1996; Oishi et al., 1999). The reverse has been found for those with
neurotic personalities (DeNeve & Cooper, 1998; Schimmack, Radhakrishnan, Oishi, &
Ahadi, 2002). Stutzer (2004) finds that having high aspirations and expectations have a
99
negative effect on SWB. As discussed earlier, it is clear from the research on cross-
country comparisons of wellbeing that cultural factors can pay a role in explaining
differences in SWB e.g. Latin America and Russia (Diener et al., 2000; Kacapyr, 2008).
5.9 Developing the survey using the indicators
The last few decades have seen researchers from across a range of disciplines -
psychology, economics, epidemiology, sociology, medicine, statistics, political science
and management - take an interest in happiness studies. Although they often approach
this question from different methodological and epistemological standpoints, common
findings have begun to emerge about the nature of happiness, its causes and
consequences (Oswald and Blanchflower 2011). The findings presented in this chapter
are not exhaustive. However, I have attempted to produce a reasonably comprehensive
overview that includes the main predictors of happiness and life satisfaction. Although
there are many gaps, some general conclusions have been reached from this review:
1. The determinants of well-being are broadly stable across developed societies.
2. Many of the findings are predictable: some of the most basic human needs –
reasonable income, employment and health – are among the most important
factors. Yet there are some surprises: the mixed findings for having children, or
education for example.
3. There is much scope for economic, social and environmental policy to influence
people’s well-being and happiness studies have a substantial contribution to
make to public policy
4. Finally, many of the studies report on correlations from cross-sectional studies.
Whilst these are the first step to identifying causality (Oswald and Blanchflower,
2011) they do not carry the same weight as fixed effects studies. This means, for
example, that the evidence for some areas that benefit from fixed effects studies
such as employment is stronger than in others such as housing. The reason that
there is a higher standard of evidence may be because the relationships with the
former are stronger and correlations are easily observed but it may also relate to
the amount of research interest there has been in that topic (e.g. the proliferation
of economists working in the field).
In this final sub-section, I will extract the most important domains, i.e. those that the
literature emphasises the most and for which the weight of evidence is greatest. These
will in turn be used to develop the survey for the primary research.
The review identified the following possible ‘domains’ for inclusion in the survey:
• National income
100
• Personal income
• Relative income
• Democracy
• Quality of public institutions
• Employment
• Quality of employment
• Welfare spending
• Physical health
• Mental health
• Religion
• Education
• Housing
• Physical environment (rural, coastal, low density, amenities)
• Relationships
• Social capital and trust
• Marriage/partnerships
• Politics and values
Each of these domains was then operationalized into a variable, which was phrased as
a question on a 9-point scale (see Appendix 6). As discussed earlier, some judgement
was required on the part of the researcher to decide what was included and omitted. For
example, for mental health, I included questions that corresponded with both positive
and negative effect (Watson, Clark and Tellegen, 1988) and referred directly to mental
ill-health. This was an attempt to represent a complex phenomenon widely. On the other
hand, this may have been achieved more successfully in some places than others.
Specific factors informing my judgement here are as follows:
• The extent to which a domain or indicator is likely to matter in the context of all
the information included i.e. whether its inclusion or exclusion is likely to be
material to the overall index
• Practical considerations/ expediency. This may relate to things like the ease with
which a piece of information can be included or the ease with which it can be
operationalized or measured. However, the survey was too long in the end, which
is discussed again in Chapter 10
• Policy amenability. An explicit aim of this research is build an index which could
be used to inform policy. Very intangible or hard to define domains are less
amenable to policy. In addition, factors that are not influenced by policy such as
demographic factors have been excluded.
101
5.10 Conclusion
Warner Wilson is often credited with the first major review of research on happiness
(Diener et al. 1999) and in a widely-quoted example of his work concluded that the happy
person is:
…young, healthy, well-educated, well-paid, extroverted, optimistic, worry-free, religious, married, with high self-esteem, job morale, modest aspirations, of either sex and a wide range of intelligence.
(Wilson, 1967 p.294)
In many ways, our understanding of what makes people happy has not improved
substantially on this description. Since then, academic scholarship has been testing and
seeking to refute or confirm empirically what Wilson casually observed. Perhaps the
most important finding from this is that people everywhere want broadly the same things
to be happy: a decent standard of living; a job; a good family and social life; a good
neighbourhood in which to live; good health; and to compare favourably with other people
around them, and that this hasn’t changed much over time. In other words, people’s
happiness or unhappiness appear predictable and easy-to-explain. A second
observation from the literature is that the direction of causality is often challenging to
establish. Happy people such as the one described by Warner Wilson are also more
likely to have good health, be promoted, find good marriages. However, it is clear in each
of the areas where this is an issue that the causality runs in both directions: there may
be positive reinforcement between the two variables, but the environmental factors are
still impacting on happiness.
Although the state of knowledge on well-being is well advanced, there are also many
examples of public policy moving against the grain of what makes people happy rather
than with it, and the enthusiasm for well-being measurement is not obviously translating
into policy responses that take account of this. For example, a social safety net and
welfare spending are consistently shown to boost national well-being but since the 2008
crisis, policy in most countries in the world has followed an austerity path, directly
countering the evidence. Some further discussion of this will be provided in Chapter 10
with respect to the Irish example.
This chapter also concludes Part 1 of the thesis. It has set the scene for Part 2 by
describing the methodology and by reviewing the literature on the determinants of well-
being. In doing this, it has identified empirically, the most important domains of life that
could be considered for inclusion in an index of social value. The next stage of the
research is to apply the conceptual framework to the Irish example. I begin in Chapter 6
by providing some background on the history of Irish economic development with an
102
emphasis on changes in GDP and SWB. Chapter 7 describes the conceptual framework
used to propose a new measure of SWB in more detail and how it will be operationalised.
Chapters 8 and 9 present the findings from the primary research and Chapter 10
concludes.
103
PART 2: APPLYING THE CONCEPTUAL FRAMEWORK
In part 2 of this study, I will test the conceptual framework by applying it to Ireland. In
Chapter 6 I begin with a discussion of the Irish economy including some further
explanation of why it is an interesting context within which to test the conceptual
framework. In Chapter 7, I describe the final conceptual framework in more detail and in
Chapter 8 I present the findings from the survey, develop the indicator set and describe
the statistical analysis of those data. In Chapter 9, I analyse the secondary data for the
indicator set for Ireland during the Celtic Tiger period and the extent to which these
correlated with movements in GDP. Chapter 10 concludes both Parts 1 and 2 of the
thesis by looking at the success or otherwise of the conceptual framework, reflecting on
lessons learned and future areas of research.
Chapter 6 The economic and social context of Ireland
6.0 Introduction
"You say "lower" when you ought to say a less costly standard of living. I think it quite possible that a less costly standard of living is desirable and that it would prove, in fact, to be a higher standard of living. I am not satisfied that the standard of living and the mode of living in Western Europe is a right or proper one."
Eamon de Valera41
Eamon de Valera’s place in Irish history is a controversial one. Although his economic
policies are now considered naive and to have damaged Irish prosperity for decades, in
some respects, he was attempting to chart a new type of economic policy for a newly
founded country. This was bound up with his involvement with the nationalist movement,
which was historically strongly interventionist in its economics (Barrett, 2004). In the
quote above, de Valera, perhaps unintentionally, talks about the externalities from rapid
economic growth. As a staunch social conservative, he was certainly more concerned
with the impact on Catholic morality than for example on the quality of life, nonetheless,
the principle he was espousing is the same. Whilst he may well have been making a
virtue of necessity given the performance of the Irish economy, in his own way he was
prefiguring debates about the quality of growth long before this critique was fashionable.
This would contrast greatly with the views of the Taoiseach who presided over the bubble
of the early 21st century. It would be just over half a century later that Bertie Ahern would
celebrate the ostentatious wealth of the electorate and declare that it was second homes
41 Taoiseach (Prime Minister) 1937-48, 1951-54 and 1957-59. Comment was in response to a
journalist on the failure of self-sufficiency to boost standards of living, quoted in Garvin (2004)
104
that were people’s biggest concerns ‘on the doorstep’. Both men had completely different
political philosophies and different attitudes towards GDP: whereas de Valera did not
value it, Ahern saw his electoral success as inextricably tied to it.
The dramatic change in policy and the journey from poverty to prosperity and then
austerity is the subject of this chapter. It begins with a short history of Irish economic
development since the foundation of the Free State in the 1922. It then looks at the
determinants of growth from the 1990s. This section is split into two phases: 1987-1999
when there was ‘proper’ economic development and sustainable sources of growth, and
2000 – 2007 when a bubble developed, particularly in the housing market. I then go on
to discuss the limitations of the Celtic Tiger model and reasons for the economic
collapse. I conclude with some discussion as to why Ireland provides a good example
for the testing of this approach and for how the conceptual framework will be applied to
this national context.
6.1 Nationalism, protection and self-sufficiency 1921- 1987
The first Government elected to the Irish parliament in 1922, adopted a fiscally
conservative economic policy. Like many former British colonies, it aimed to develop
indigenous industry through import substitution and a dynamic agricultural sector
specializing in livestock and dairy farming (O’Grada, 1997). A change in government in
1932 led to the election of de Valera’s Fianna Fáil who would go on to dominate Irish
politics until the 2008 financial crisis and economic collapse. De Valera continued with
the protectionist policies of his predecessors. The effects of these policies were
exacerbated by an economic war with Britain, which was far more economically
damaging to Ireland (O’Grada, 1997). The Second World War followed, during which
Ireland was cut off from all international markets. After the war, protectionism remained
a key feature of Irish economic policy and Ireland did not benefit from the post-war
economic boom that raised living standards elsewhere in Europe. De Valera’s lack of
interest in people’s material wealth began to be reflected in the economic statistics and
in the 1950s a large income gap emerged between Ireland and its neighbours (including
Northern Ireland). It lost about 16% of the population to emigration in that decade and
was the only country in Western Europe to see its population decline (Barry, 2003).
A change of policy from the 1960s in favour of more free trade and membership of the
European Economic Community (EEC) did not have much relative impact and incomes
remained about 58-60% of those in Britain. The failure of indigenous industry led to an
exclusive focus by the 1970s on the EEC and foreign direct investment and to the
abandoning of state planning and interventionism (Girvin, 2010).
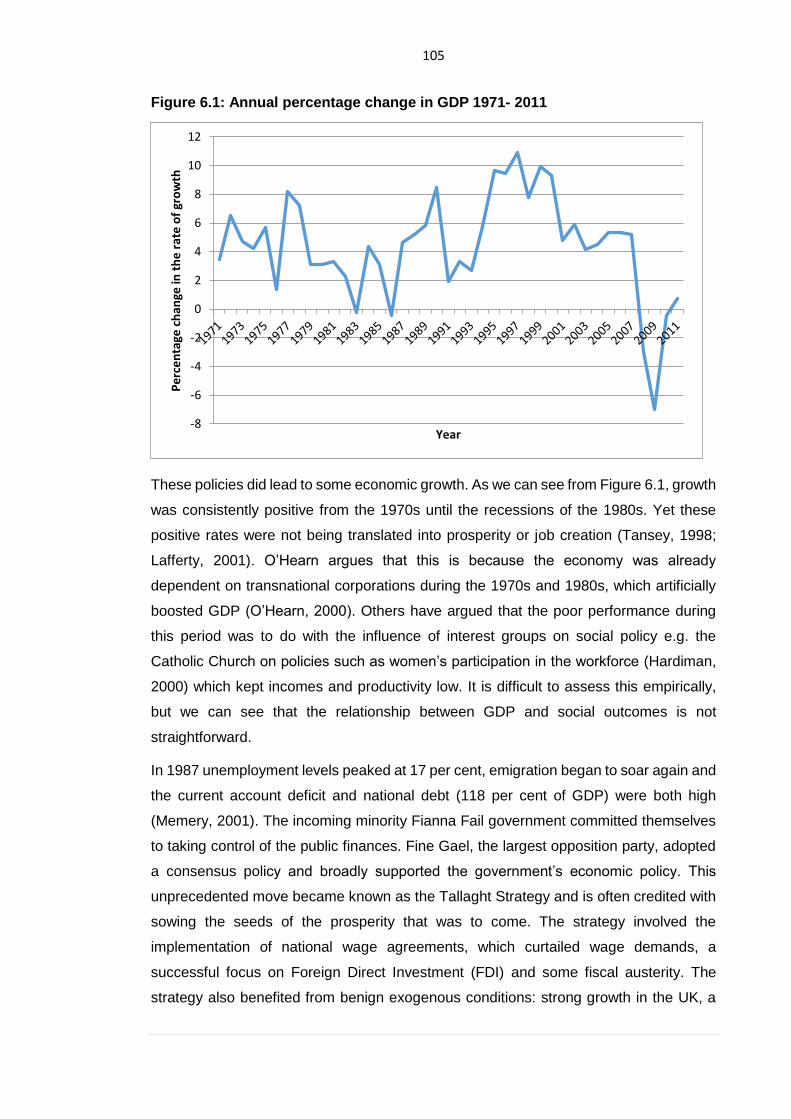
105
Figure 6.1: Annual percentage change in GDP 1971- 2011
These policies did lead to some economic growth. As we can see from Figure 6.1, growth
was consistently positive from the 1970s until the recessions of the 1980s. Yet these
positive rates were not being translated into prosperity or job creation (Tansey, 1998;
Lafferty, 2001). O’Hearn argues that this is because the economy was already
dependent on transnational corporations during the 1970s and 1980s, which artificially
boosted GDP (O’Hearn, 2000). Others have argued that the poor performance during
this period was to do with the influence of interest groups on social policy e.g. the
Catholic Church on policies such as women’s participation in the workforce (Hardiman,
2000) which kept incomes and productivity low. It is difficult to assess this empirically,
but we can see that the relationship between GDP and social outcomes is not
straightforward.
In 1987 unemployment levels peaked at 17 per cent, emigration began to soar again and
the current account deficit and national debt (118 per cent of GDP) were both high
(Memery, 2001). The incoming minority Fianna Fail government committed themselves
to taking control of the public finances. Fine Gael, the largest opposition party, adopted
a consensus policy and broadly supported the government’s economic policy. This
unprecedented move became known as the Tallaght Strategy and is often credited with
sowing the seeds of the prosperity that was to come. The strategy involved the
implementation of national wage agreements, which curtailed wage demands, a
successful focus on Foreign Direct Investment (FDI) and some fiscal austerity. The
strategy also benefited from benign exogenous conditions: strong growth in the UK, a
-8
-6
-4
-2
0
2
4
6
8
10
12
Pe
rce
nta
ge c
han
ge in
th
e r
ate
of
gro
wth
Year

106
large exchange rate devaluation had boosted exports and an end to conventionally
fractious politics brought about by the political consensus (Bradley & Whelan, 1997).
Either way, dramatic changes in economic indicators were to follow (D’Agostino,
McQuinn, & O’Reilly, 2008). In terms of GDP per person, Ireland went from being the
22nd richest per capita country to the fifth (IMF, 2016) and Foreign Direct Investment
(FDI) I increased by over 23.5 per cent (OECD, 2009). This was coupled with a large
increase in domestic demand, which resulted in a shift in the balance of payments from
surplus to deficit. Irish Gross National Product (GNP) per head – a more meaningful
measure for Ireland42 – overtook Italian GNP per head in 2001 and UK GNP per head in
2004, the latter being symbolically and psychologically important (O’Gráda, 2008). The
number of married women in the labour force increased to 46 per cent, and by the end
of the decade labour shortages became a major constraint on growth. By the end of the
1990s the population had grown to 3.8 million, the highest it had been since the Potato
Famine in 1845, primarily due to net migration. In addition, Irish house prices averaged
an annual increase of over 13 per cent between 1995 and 2007, the largest across an
18-country sample of OECD countries for the period (McCarthy et al., 2013).
Underlying these strong economic data was a set of policies that have been the subject
of much debate. The next section discusses the features of this model and its successes
and failures.
6.2 The Irish Model (1992 – 1999)
The ‘developmental state’ model of East Asia (originally South Korea, Taiwan, Singapore
and Hong Kong) has for many years been held up as a counterweight against the forces
of economic globalization, as they provided examples of how nations could promote their
own economic development, even from a subordinate position (O'Riain, 2000). Against
the odds, these states moved from peripheral to a semi-peripheral or even core status
within the world economy (O’Hearn, 2000). Until the 1990s, they also experienced
spectacular rates of growth, while Latin America and Africa languished. Indeed, it was to
describe these rates of growth that the ‘tiger economy’ metaphor was first coined. Most
analysts give credit to state intervention in controlling markets for the success of these
models (So & Chiu, 1996; Wade, 1990). States intervened heavily to promote local
industry and boost exports and selectively supported key industries with tariffs and import
controls (O’Hearn, 2000).
By the 1990s, the model came under some pressure, and any weaknesses were
42 Gross National Product was defined in chapter 2. As it measures incomes exclusive of FDI it
is more meaningful for Ireland as, which has for decades had higher than average FDI
107
exacerbated by the Asian financial crisis of 1997/8. Some economists pointed to a new
model – the flexible developmental state - that was thought to have emerged in the late
1990s in countries such as Ireland and Chile (O’Riain, 2000). These countries were
considered to be more mobile and flexible and therefore better placed to deal with the
challenges of globalisation than the original tigers. O’Hearn argues that there is evidence
of this policy in East Asia itself, particularly amongst new Tigers – Malaysia and Thailand
– that privatized state companies, prioritised exports, liberalized rules on foreign
ownership and cut corporation tax (O’Hearn, 2000). O’Higgins (2002) describes the
‘flexible’ element as working through state agencies to shape the organisational cultures
and capabilities of both multinational and indigenous companies without dictating their
activities. For O’Riain the crucial difference with the traditional developmental state is
rather than relying heavily on state intervention to industrialise, states can achieve their
goals “not by taking on the tasks of development but rather by shaping the capabilities
of society and the market to do so” (O’Riain, 2000, p.23). The size of the role of the state
in shaping policy in Ireland is a subject of debate with some experts arguing that it was
substantial (Nolan, O’Connell, & Whelan, 2000). However, unlike the original Tigers,
under EU rules, Ireland was prevented from intervening in its markets e.g. manipulating
exchange rates and selectively supporting sectors, industries or entrepreneurs.
The Flexible Developmental State (DS) concept is a controversial one. Kirby for example
prefers to describe the Irish model as a ‘Competition State’ (CS) (Kirby, 2005). The CS
is defined as prioritizing economic competitiveness over social cohesion and welfare
(Kirby & Murphy, 2011). In the CS model, rather than the state retreating or its role being
marginalized, its core activities are being redefined in response to globalization. For
example, in place of deregulation, the CS promotes ‘market-friendly re-regulation’, as
exemplified by the policy agenda of the New Labour Government in the UK (Cerny and
Evans, 2004). As with DS theorists, CS theorists recognise the importance of the state
but whereas the former emphasise the centrality of the state in achieving developmental
outcomes, the latter promotes the restricting the state’s actions to the promotion of
enterprise and profitability (Kirby & Murphy, 2011). Kirby is not alone in applying the CS
model to Ireland. Dukelow for example described the Irish state as having taken a
“selective interventionist role in the manner of a competition state to re-orient social
security policy to enhance economic competitiveness by tackling unemployment, yet
leaving levels of income inequality and poverty relatively high” (Dukelow, 2005 p7). (For
more discussion on this see Boyle, 2002; Murphy, 2002). Other commentators have
rejected the binary DS/CS distinction. Smith, for example argues that whilst the Irish
model cannot be neatly categorised as ‘developmental’, it has had some developmental
108
tendencies that are not consistent with the CS model (Smith, 2004). Kitchen and Bartley
describe it as a blend of American liberalisation (minimal state, privatisation of public
services, public/private partnerships, light touch regulation and clientelism) and
European social welfarism (developmental state, social partnership, welfare safety net,
high indirect tax, EU directives and obligations) (Kitchin & Bartley, 2007).
A final question is whether what took place in Ireland really constituted a model of
development or a continuation of existing policy. A convincing reason for the rapid period
of growth was that latent productivity was being released and that ‘catch-up’ was
inevitable. Ireland’s membership of the EU, proximity to Europe, proficiency of its citizens
in English, historical links with the US and highly educated population were all positive
‘initial conditions’ for growth (Honohan and Walsh, 2002). As has been mentioned,
perhaps a greater puzzle is why the Irish economy struggled for so long, not why it
eventually started to grow. Although most commentators tend to focus on the change of
policy in 1987, and the failure of policies prior to then, some consideration needs to be
given to long-run policies eventually paid off. Cooney has documented how consistent
education policies of the preceding decades bore fruit during the 1990s (Cooney, 2008).
In addition, there is the role of EU structural funds which went mainly to fund
infrastructural investment and in promoting enterprise which took time to have an impact
(O’Higgins, 2002).
Following the dot com crash, Ireland’s economy recovered quickly, posting growth rates
of between 4 and 6 per cent by 2002. However, by this stage things had already started
to unravel. Honohan and Walsh (2002) warned of difficult times ahead with most of the
potential for catch-up exhausted. In reality, and with hindsight, the ‘Celtic Tiger’ was over.
Few sources of sustainable growth emerged during the 2000s; inflation was high and
labour productivity was no longer increasing. Instead, the economy became dependent
on house building and increasing levels of private consumption. During the 1990s, house
prices only rose in line with increases in disposable income and the ratio of prices to
income remained at a relatively low level (Whelan, 2009). By 2006–07, at the peak of
the bubble in house prices, 23% of Irish GDP was made up of construction, Ireland was
building four and half times as many per capita housing units as Britain and one in eight
employees in the Irish economy was directly employed in construction (ibid.). With the
exception of Spain and Portugal, Ireland’s share of construction employment exceeded
all other OECD member states by almost five percentage points (Whelan, 2009).
Government subsidies fuelled a frenzy of building around the country and banks lent
recklessly to developers and customers to buy land and houses at grossly inflated prices.
According to O’Sullivan and Kennedy, whilst the global financial crisis exacerbated
109
matters, the banking crisis in Ireland was largely a home-grown phenomenon brought
on by the eventual collapse of the property sector (O’Sullivan and Kennedy, 2010). Taxes
on income and capital gains were eroded relative to the booming property sector, which
meant that Government finances became heavily dependent on them (went from 8% of
total tax revenue in 2002 to over 16% in 2006).
Spectacular as the rise was, so was the fall and Ireland became the first EU country to
enter recession in 2008. The IMF concluded in 2009 that it was “perhaps the most
overheated of all advanced economies” and said that the Irish crisis “matches episodes
of the most severe economic distress in post-World War II history” (International
Monetary Fund, 2005 p.5). The economy contracted by 7.1 per cent in that year. Ireland’s
debt (the repayment of which had crippled the country during the 1980s) was back.
Ireland’s general government debt (GGD) increased by 320% over the period (Kinsella,
2012), a third of which was incurred by bank bailouts (The Economist, 2013).
In September 2008, the government issued an unlimited bank guarantee in favour of six
banks that would end up costing far more than the government estimated, a deal which
the European Commission approved at the time. By the end of 2010 yields on Irish
government debt reached 9 per cent. This effectively meant that the government was
unable to borrow to fund the deficit and made external intervention inevitable. According
Kinsella (2012), by guaranteeing existing senior bonds and some types of subordinated
debt, the capacity to allocate some part of the ultimate loan losses to bondholders was
compromised, raising the ultimate cost to the taxpayer of resolving the banking crisis and
contaminating the public balance sheet with private assets and liabilities. On 28
November, the EU and the government agreed to an €85 billion rescue deal.
The funding provided by the ‘troika’ was contingent on banking sector reforms
(recapitalisation of domestic banks and deleveraging of bank balance sheets), fiscal
consolidation (austerity measures) and structural reforms (pay cuts and supply-side
labour market measures). In response to less punishing conditions in subsequent EU
bailouts, and continued high unemployment (almost 15 per cent in 2012 (Central
Statistics Office, 2012). EU leaders agreed in 2011 to reduce the interest rate and to
extend the maturity on the EU loans provided to Ireland under the programme.
Whether competitive or developmental, the model was beset by internal contradictions
and weaknesses, the scale of which only became apparent once external circumstances
became less favourable. Although the history of this period is still being written, there is
some consensus about where mistakes were made, particularly in the later period. The
next section discusses each of these weaknesses in turn.
110
6.3 Failures in the model
Throughout the late 1990s and early 2000s, other small island states and developing
economies sought to emulate the Irish model. As Thorhallsson and Kirby have written:
[viewed] from a distance, they saw the Irish state as having played an active role in winning high levels of foreign investment in cutting-edge, high-tech sectors and thereby upgrading the industrial and services economy and co-ordinating policymaking between the main stakeholders through social partnership, resulting in a spectacular increase in living standards and employment. This appeared to contradict the dominant neo-liberal model being promoted by agencies like the World Bank and the IMF and to offer a new form of state-led successful development, one able to manoeuvre deftly amid the pressures and threats of globalization.
(Thorhallsson and Kirby 2011, p.5/6)
However, not only was this view a misunderstanding of the nature of the project but it
underplayed the importance of the booming international economy in supporting growth.
For example, in comparing the Irish and Danish models, Sørensen drew attention to the
fact that ‘the Danish model has been developed and strengthened by having to cope
with several major challenges, including two world wars and the economic crisis of the
1930s’ whereas ‘the successful Irish model has not faced a real critical challenge so far;
it’s been all smooth sailing in sunshine and tailwinds’ (Sørensen, 2007, p. 8). By 2004,
O Riain, who had first applied the FDS concept to Ireland and a keen supporter of the
model was warning that “significant elements of the Celtic Tiger were a mirage” (O Riain,
2004).
There are five features of the model that are referenced most often (O’Riain, 2000,
O’Hearn, 2000, Kirby and Murphy, 2011) and appear to be the most important:
• Social partnership
• Promoting property ownership
• Foreign Direct Investment
• Economic liberalization
• Limiting government intervention
This section discusses each of these in turn, their initial successes and weaknesses and
their role in failing to prevent, or even contributing to the crash.
1. Social partnership
Social partnership refers to the negotiation of triennial national wage agreements that
brought to the table employer representatives, unions and since 1997 voluntary and
community organisations. This ‘corporatist’ form of wage negotiations replaced local
level bargaining that had been common throughout the 1980s. Proponents of social
partnership describe it as a ‘critical pillar’ in the economic success (Mac Sharry, White,
111
& O’Malley, 2000). By forging a consensus and limiting wage rises they argue that it kept
Ireland competitive and minimized industrial action (O’Higgins, 2002).
The critique of the approach is that partners were limited to policies that would not
undermine the conditions that were seen to attract high levels of foreign investment
(Allen, 2000) and that it is difficult to point to any concrete examples of economic or
social policies that emerged from it (Connolly, 2007). Large areas of social policy that
could have been tackled – such as the housing market - were left untouched (Memery,
2001). This was particularly the case where social policies were considered anti-
competitive (Connolly, 2007). Finally, unlike central wage bargaining in other countries,
it only survived in times of plenty.
2. Property ownership
As sources of growth started to dry up following the dot com boom, more speculation
crept into the market. The government in this period adopted procyclical policies across
the board (O’Sullivan & Kennedy, 2010), but these were probably most damaging in the
property sector. Clientalist policies that subsidised developers and gave tax breaks for
housing development helped to fuel rising costs (Kirby, 2010). The liberalised banking
system enabled credit to fuel an already overheated market and Euro membership
meant access to European markets and zero exchange rate risk. For homeowners, there
was an absence of any property-based tax, high levels of mortgage relief and preferential
stamp duty treatment for the purchase of new-build homes (Memery, 2001). All of this
was exacerbated by a policy of low interest rates set by the ECB, which was designed
to stimulate growth in Germany and in France. In Ireland, it led to negative real interest
rates and high inflation, which were extremely counterproductive (O’Sullivan & Kennedy,
2010).
3. Foreign Direct Investment
As we have seen, the Irish economy had been dependent on attracting transnational
corporations as a source of growth and employment since the 1970s, but the pace of
this investment increased dramatically in the 1990s with the slashing of corporation tax.
Unlike with domestically-owned firms, when profits are repatriated this reduces
substantially the rate of investment and has an impact on the employment intensity of
output. It has been argued that the Irish manufacturing sector contained ‘invisible
entrepôts” such as software duplication.43 It was estimated that these sectors accounted
for about 30 per cent of manufacturing output but only 10 per cent of employment
43 This analogy attempts to explain the way in which TNCs accounted for output in Ireland even
if it was not produced there to make benefit from low corporation tax.
112
(Conroy, Honohan, & Maître, 1998). As we will see later on, dependence on FDI reduced
the government’s control over industrial composition, which limited its ability to diversify
the industrial base and to promote certain types of industry. These dependencies also
led to structural weaknesses, not only because they were unsustainable on their own
terms but because they displaced the need to seek alternative sources of growth
(O’Sullivan & Kennedy, 2010).
4. Economic liberalisation
In the 1980s Ireland was a highly regulated and taxed economy and in the space of two
decades become one of the most open and ‘pro-business’ in the world (O’Sullivan &
Kennedy, 2010). Ireland was held up as a model of what liberalisation can achieve
(Kitchin, et al., 2012). The introduction of more market-orientated regulatory frameworks
was a key part ofIreland’s economic growth, particularly in relation to the financial
services sector. However, as we shall see this also changed its risk profile and
vulnerability to market fluctuations (ibid.)
Deregulation was another key feature of the model and took place across a number of
sectors. Some of these were highly popular and successful on many measures such as
the deregulation of airlines and taxis. However, others were problematic, particularly
where they were initiated as a cost cutting measure to avoid public investment (O Riain,
2004). O’Riain argues that just when public investment was most needed to support new
sources of growth after the dot com crash, it was the subject of cuts and the “blind
implementation of market liberalisation” (O Riain, 2004, p.26). Two forms of deregulation
have had a particularly damaging legacy however, the liberalisation of banking and
finance and the housing market. The post 2000s boom in housing is in large part
attributable to the government’s role in liberalizing the mortgage markets and the
globalization of housing finance markets (Norris & Winston, 2011). By 2007, the three
largest Irish banks had between 34 and 84 per cent of their loan book exposed to the
commercial sector and property-related lending had reached 62.5 per cent of private
sector lending (O’Sullivan & Kennedy, 2010).
5. Limited government intervention
In his critique of the Celtic Tiger, Peadar Kirby describes the tendency of the State to
seek low-cost solutions as a key factor in weakening its effectiveness to achieve the
goals it set itself (Kirby, 2010). In practice, this involved a series of ‘give-away budgets’,
offering tax breaks primarily focused on high earners (Coulter & Coleman, 2003). They
also reduced taxes on incomes and capital gains, which contributed further to the tax
113
base erosion described earlier (Whelan, 2009).44 In addition, in spite of posting huge
surpluses, Ireland had the lowest levels of government expenditure as a proportion of
GDP relative to any EU economy the period 1997-2007 (O’Sullivan & Kennedy, 2010).
According to O’Sullivan and Kennedy, the capacity constraint caused by the bias in the
construction industries towards housing also meant that sufficient funds could not be
spent on infrastructure and public services (ibid.).
Kirby argues that the low tax model undermined the state’s ability to build up its own
capacity to innovate and regulate, as well as its room for manoeuvre once the collapse
began (ibid.). Taxation is often understood simply as a mechanism for raising revenue.
However, in development economics its role in building and sustaining the power of
states, and shaping their ties to society is increasingly recognised (Brautigam, Fjeldstad,
& Moore, 2008). The fiscal reliance on construction and US multinationals narrowed the
space for the government to pursue policy on its own terms. Fragile income streams
clearly led to a lack of policy autonomy; and this was an important difference between
the Irish and developmental state model. This would be brought into sharp relief by the
financial crisis, which exposed how limited the government’s options were.
6.4 Why Ireland was chosen for testing the approach
Throughout this chapter, I have drawn attention to the unique features of Irish economic
development over the past century. In this final section, I focus on two additional issues.
First, there was the exceptional impact that GDP had on public policy towards the end
of the boom. Second, I discuss the position of Ireland as a small, globalised economy.
In 2006, the gaffe-prone Taoiseach Bertie Ahern tried to explain rising inflation by stating
that: “the boom times are getting even boomier”.45.Ahern’s attitude, and the context that
produced it capture well several articles of faith about the GDP statistic: that more is
always better, a high growth rate was always to be celebrated and above all else it must
not slip into negative. His party’s re-election in 2007 and decimation in 2011 after the
financial crisis seemed to confirm these views. Ahern’s party was always an astute
electoral machine, and he and his ministers were aware that their electoral fate was
linked inexorably to the rise and fall of GDP. The failure of GDP to provide any indication
of the looming financial crisis is symptomatic of its greatest weakness: its inability to
44 By 2007, the combined PAYE and PRSI average tax rate for a single earning married couple
with two children, taking home the average wage, was 6.7 percent in Ireland, compared with an EU-15 average of 23.7 percent and an OECD average of 21.1 percent. 45 Quoted in The Irish Times newspaper article: Economic growth shows little sign of letting up,
14 July 2006.
114
measure the quality as well as the quantity of economic growth. It could not easily tell us
if the economy was overheating, if it was over-reliant on a small number of sectors, if
those sectors were ‘productive’ in the widest sense i.e. job-creating, not to mention
whether on the whole whether life could be considered by most people to be getting
better or at least not getting worse. Nor could it tell us about the ‘externalities’ of growth,
climate change and resource depletion, work/life balance, commuting times, impacts on
children and so on. Although the Irish example is an extreme one it is by no means
unique, economic crises happen with great regularity. The contribution of GDP, as a pro-
cyclical measure, or indeed the role of data generally in predicting, or preventing
economic crises is under-researched. In this example, it appears to have obscured,
rather than revealed what was really going on with the economy.
Being a small peripheral economy also makes Ireland interesting to study. Political
independence for newly established states is often associated with attempts to reduce
political and economic ties with the former colonial power. This was the case in Ireland
for the first 40 years of independence as it attempted to reduce its reliance on Britain, a
pattern followed by most post-colonial independent states (Commoner, 2014).
Consistent with the small states literature, Ireland was used to the trade-off between
policy autonomy and political influence (Goetshel, 2013). Ireland was arguably at its most
influential when it was sending MPs to Westminster, where they had often held the
balance of power. Ireland was so dependent on the relationship with Britain after
independence, that when Britain’s membership of the EEC was rejected, Ireland also
withdrew its application and only joined when Britain was eventually accepted. Since
then, Ireland has always been the most pro-EU of members. This is not just about having
been a net recipient of structural funds, it also reflects a relaxed attitude towards
sovereignty and self-determination that is common within small states (Goetshel, 2013).
Replacing dependence on Britain with dependence on Europe was seen as a positive
thing, strongly supported by both nationalists and free market advocates. Complete
policy autonomy was never a realistic option. In addition, efforts to attract FDI were
largely focussed on the US, which is now far more important as a source of FDI than the
UK (Commoner, 2014). For a country with a history of colonisation and a long struggle
for independence, there is an awareness that sovereignty can also come at a cost. Or to
put it another way if pooling risks and exploiting the opportunities offered larger
neighbours can be seen to offer economic benefits then sovereignty might be a luxury
that you cannot afford. However, it was this interdependence particularly of the Euro that
contributed in large part to the financial crash and its aftermath. Attention has focused
again recently on Ireland’s globalised role in relation to tax avoidance by foreign-owned
115
companies. The response by the Irish Government to appeal the 2016 EU’s fine of Apple
is indicative of how reliant it is on this source of economic development and how deeply
globalised the country remains.
Conclusion
This chapter described the history of Irish economic development with emphasis on the
Celtic Tiger period, the features of the model and key weaknesses. After decades of
stagnating wages, Ireland began in the 1990s to converge with other nations before
overtaking them, including Britain and Northern Ireland. Although there is controversy
about how ‘developmental’ this phase of growth was, the first ten years saw important
investments made in infrastructure and industry and improvements in many economic
fundamentals: despite the flaws in the model, these decisions are mostly viewed
positively. In the 2000s, with sources of growth drying up, a bubble emerged, especially
in housing. This was fuelled domestically but was exacerbated by membership of the
Euro and exposure to the wider sub-prime crisis. As I have argued, domestic politicians
were keen to keep the GDP statistic high and (with hindsight) were prepared to do this
at any cost. Few saw the financial crisis coming, so it is unlikely they realised they were
fuelling a bubble. Nonetheless, such is the power of the GDP statistic that it can blind
even the highly economically literate to what is really going on in an economy, as
evidenced by IMF reports on the ‘health’ of the Irish economy immediately preceding the
crisis. However, as a system for providing an early-warning system it was clearly left
wanting.
Ireland is an interesting example to study for anyone interested in the interplay between
GDP growth, economic policy and social value. Not only has it had a turbulent economic
history, but it has experimented with different forms of economic development, some of
which have been successful and some of which have spectacularly unsuccessful. As
discussed here, these periods of growth, decline, boom and bust should provide unique
insights into the impact that growth has on wider measures of social value.
This chapter has set the scene for part 2 of this thesis where I apply the conceptual
framework. In the next chapter, I begin this by discussing framework in more detail and
how it was operationalised.
116
Chapter 7 Describing and operationalising the conceptual
framework
7.0 Introduction
In the previous chapters I have argued that creating social value should be the primary
goal of policy. Whilst no system of national accounting is plausible that ignores entirely
people’s preferences, at the same time, where we know that preferences are damaging
to ourselves or others we should intervene to discourage their fulfilment. This still leaves
room for people to express preferences but within a limited set of choices, or with certain
options being off-limits. This is broadly in line with the way society currently operates in
terms of the social contract, but it places a wider set of concerns at the centre of social
and economic policy than are currently considered. In Chapters 3 and 4 I developed the
concept of constrained utilitarianism. This was informed by the theoretical and empirical
literature. In this chapter I return to the framework again to describe how it informed the
research and how it was operationalised in the primary research.
This chapter begins by describing the principles that underpin the framework, some of
the conceptual challenges it poses, and how I propose to resolve these. I then provide
further detail on how it is being operationalised in the primary research. There are two
parts to the primary research: the survey to identify what people value and the selection
of indicators for inclusion in the index. This chapter prepares for the presentation of these
findings in Chapter 8. I cover two further methodological points relating to the survey: the
measurement of values and attitudes and identifying the correct level of measurement.
In then go on to describe the choice of multivariate analysis used: Principal Component
Analysis (PCA). I conclude the chapter by providing some further detail on ways to align
the methodology for the index with my theoretical framework.
7.1 Describing the conceptual framework
A framework for measuring social value has been described by Hall et al. as a multi-
dimensional concept that encompasses both material and immaterial aspects of well-
being (2011). The framework that I have developed is represented diagrammatically in
Figure 7.1.
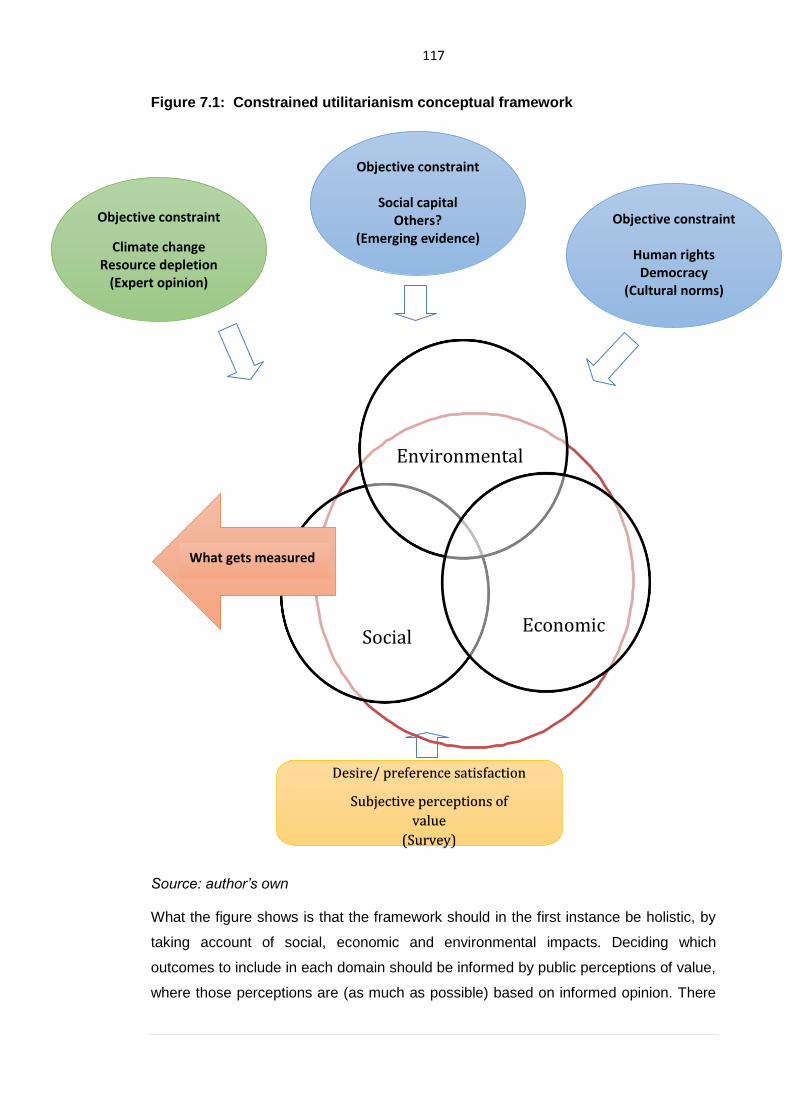
117
Figure 7.1: Constrained utilitarianism conceptual framework
Source: author’s own
What the figure shows is that the framework should in the first instance be holistic, by
taking account of social, economic and environmental impacts. Deciding which
outcomes to include in each domain should be informed by public perceptions of value,
where those perceptions are (as much as possible) based on informed opinion. There
Desire/ preference satisfaction
Subjective perceptions of
value
(Survey)
Objective constraint
Climate change Resource depletion
(Expert opinion)
Objective constraint
Human rights Democracy
(Cultural norms)
Objective constraint
Social capital Others?
(Emerging evidence)
Environmental
Social Economic
What gets measured
118
will of course be areas of controversy. Take for example something like immigration. It
is an area where economists (the expert in this example) often disagree with the public.
Economists (in the main) tend to be in favour of immigration because it ensures a supply
of young, skilled labour and does not displace incumbent workers. There is a technical
reason for this, which is known as the lump of labour fallacy i.e. that the amount of labour
in the economy is not fixed and new entrants to the labour market increase aggregate
demand and stimulate additional economic activity. Labour shortages on the other hand
are a drag on growth. For example, a meta-analysis by Longhi et al. (2008) of the impact
of migration on wages and employment of native born workers from 45 countries found
very little impact. For incumbents, however, it may feel as if wages are lower and jobs
are scarcer and that this is causally connected to an increase in immigration. It is also
the case that there may be geographic and income skews in the distribution of these
impacts that may not be picked up in national studies. This means that we do not know
if the lump of labour theory is fallacious at the local level. Therefore, who is right in this
situation?
On the one hand, if people feel like they are losing out, should that not matter? On the
other, unease about migration may stem from xenophobic attitudes that run counter to
equality legislation and which should be resisted by governments i.e. equality legislation
could become a constraint. There is currently not system for holding politicians to
account regarding the promulgation of misleading data, or misinformed opinions. Neither
does there appear to be a demand to empirically interrogate claims that certain groups
are disproportionately affected by immigration with a view to compensating those groups.
Making visible the costs and benefits of this policy could inform policies on industrial
policy, social welfare and public service provision. The process of deciding on collective
goals could create opportunities for people to debate priorities in a structured manner.
As Figure 7.1 shows, these choices would be constrained to protect some policies that
are in the national, or international interest, such as emissions reductions. Next, I
discuss the principles that I believe should underpin the framework.
7.2.1 Principles of the conceptual framework
I propose that the framework should have the following six characteristics:
1. Be built on sound conceptual and theoretical ground;
2. Contain broad domains that are valuable, incommensurable (measuring different
things) and irreducible (not measuring more than one thing);
3. Be transparent regarding assumptions
4. Focus on outcomes (or ends) rather than outputs (or means);
119
5. Combine subjective and objective data (incorporate stakeholder perceptions of
value, which are combined with different sources of evidence)
6. Be specific and relevant to the country to which it is being applied i.e. not aim for
universality.
Hall et al. (2011) also propose that a framework should be non-hierarchical. This would
imply that equal weights are applied to the different components of the index. This is a
complex issue and in Chapter 8 I discuss weighting in more detail and why I have not
included non-hierarchy as a principle. Their work also calls for more stakeholder
involvement and the incorporation of the things that they value. They make the point
however, as I have done, that taking the individual as a point of departure does not imply
neglecting communities or collective outcomes (ibid.). The conceptual and theoretical
foundations for the framework have been discussed at length in Chapter 3 and require
no further discussion. In addition, the suitability of indicators, is returned to in detail in
Chapter 8 as part of the indicator selection process. In the rest of this section I discuss
the remaining principles beginning with transparency.
7.2.1.1 Transparency
Indicators carry axiological and normative conceptions, which are embedded in the way
they are built (Thiry et al., 2010). It is not that subjectivity can be avoided but unless it is
made explicit, assumptions underpinning the selection of indicators and weights can
appear ad hoc. Even worse than this is where an index assumes objectivity but is replete
with judgements, which reflect the preferences of researchers and institutions that have
developed. This is often the case where concern for conceptual foundations is subsumed
under technical consideration, which dominate the literature (ibid.). GDP is a good case
in point.
In this research, I propose to achieve transparency in three ways:
a) Having a clear theoretical/conceptual framework
Any indicator of social value should be well grounded in a theory of what constitutes the
‘good life’ (Stiglitz et al. 2009). However, many of the indices described earlier are not
based on a sound theoretical footing to help guide the selection of indicators, see
(Neumayer, 1999) on the ISEW and (Thiry et al., 2010) on Genuine Savings. Having an
explicit theoretical framework will guide decisions about the approach taken, the
selection of indicators and the choice of weights. This approach seeks to avoid a
‘democratic deficiency’ (ibid): 3) by decrypting the “values and vison of the world that
numbers implicitly carry (Thiry et al. ibid.).
120
b) Endorsement by stakeholders
A second way to deal with subjectivity is to establish a participatory framework upon
which to deliberate about assumptions. There are few examples of where this currently
happens (Stiglitz et al. 2009). Of course, it is possible that the views expressed by
individuals would clash with the normative framework that has been established but as
discussed above the intention is that this will provide a transparent way of resolving those
tensions.
c) Providing a clear methodological discussion
Finally, it is important to provide a clear methodological guide to how the analysis is
conducted and the assumptions that are taken at each point in the analysis. Each
decision should be reported clearly, and the different scenarios or options discussed.
This is also a principle of any good quality research. However, it is especially important
where the intention is to create greater accountability around a shared set of goals as is
the case here.
7.2.1.2 Focus on ends rather than means
The language of outcomes is something that has become very commonplace in the
measurement of public services (Propper and Wilson, 2003). Nonetheless, the term is
often used loosely to describe things that are really outputs, indicators or process
measures. An outcome is a measure of change. For example, if the aim is to achieve
some positive change in education, measuring the amount of spending on education (as
with the Human Development Index) will not tell us that. It is true that countries that
spend on more public services usually have better outcomes, but this is not always the
case; the US health service being the obvious example (OECD, 2011). The amount
spent on a service is an input to that service, it is not even an output. Relevant output
might be the number of people that go through the system, or the ratio of pupils to
teachers. Outcomes in an educational context could be numerous but might include
grades, skills level, progression to employment or training, equality of attainment by
class, gender etc. The exact set of outcomes would depend on the type of educational
intervention and the goals and priorities of the citizenry. The framework set out here
aspires to be an outcomes framework, although, as we will see data limitations often
prevented this from being achieved.
121
7.2.1.3 Combine subjective and objective data
As discussed in Chapter 5, social value requires the measurement of both objective and
subjective data. In the former, well-being is crudely understood as the command over
resources, by which a person can control and consciously direct their own happiness
and living conditions. The latter is based on the premise that well-being is perceived by
individuals and is best judged by them. It is possible for these things to be broadly right
at the same time. Whilst, combining them presents ontological challenges, which were
discussed in Chapter 5, it could be argued (as I do) that any worthy alternative to GDP
should include both objective and subjective data i.e. combine people’s perceptions of
how their life is going and how they feel with more objective data that complements the
subjective view.
There are limitations to an overly subjective approach to measuring well-being and it is
most useful where it compliments objective data relating to health, education and so on.
As Sen as written:
“…consider a very deprived person who is poor, exploited, overworked and ill, but who has been made satisfied with his lot by social conditioning (through, say, religion, political propaganda, or cultural pressure). Can we possibly believe that he is doing well just because he is happy and satisfied?”
(Sen, 1991, pp. 8–9).
This can apply to those who strive for more, mistakenly thinking it will make them happy
as much as those that believe themselves to be happy with nothing. Like King Midas,
such individuals might be suffering from a false self-knowledge of what will increase their
satisfaction. Perhaps it was for this reason that Aristotle thought that people were no
judge of their own happiness (Kenny, 1992). There are numerous examples of how this
happens in practice. Deaton finds that HIV prevalence appears to have little or no effect
on the proportion of the population reporting dissatisfaction with their health (Deaton et
al., 2009). Policymakers should not be tempted to ignore HIV prevalence just because it
does not show up in wellbeing statistics. Although this ‘happy slave’ phenomenon is well
documented, researchers still regularly ponder the seeming paradox of poor
communities in low-income countries that report high levels of wellbeing. Although
ultimately a subjective concept, these examples remind us again about the importance
of not relying solely on subjective data.
7.2.1.4 Prioritise the specific over the universal
In Chapter 2, I introduced the tension between comparability and specificity in index
design particularly regarding the Human Development Index. I made the case there that
aiming for comparability reduced the usefulness of indices as a guide to policy by
122
rendering them too unspecific. In his Nobel acceptance lecture, Amartya Sen whose
work inspired the HDI reflected on the difficulty of making aggregate judgements about
what society wants:
How can we find any rational basis for making such aggregative judgements as “the society prefers this to that,” or “the society should choose this over that,” or “this is socially right”? Is reasonable social choice at all possible, especially since, as Horace noted a long time ago, there may be “as many preferences as there are people”?
(Sen, 1999, p. 178)
However, contrary to Horace’s remark, people’s views can usually be categorised into
broad groupings with intermediate or cross-cutting positions, and the evidence from
political science would suggest that there is in fact a small number of social cleavages
(Lipset and Rokkan, 1967). Sen goes on to say that, if we have enough information and
do not aim for too much precision, we can consider the diversity of the preferences, and
concerns of different members of society to produce a reasoned and democratic social
choice (Sen, 1999).
At the same time, it is reasonable to assume that the things that people value may exist
within a specific historical and cultural milieu. For example, Girvan (2010) describes how
the political cleavages produced in the post-independence period in Ireland deviate from
traditional left right divide found in other European countries (although this may be
changing, as traditional cleavages have shifted in Ireland and elsewhere in the 21st
century). Across Europe we can see growing divisions between countries in terms of the
direction of public opinion on issues like immigration and membership of the EU
(Eurobarometer, 2017). As discussed in Chapter 2, more than ever, ‘measuring what
matters’ might therefore result in each country having distinctive indicators that reflect
these cultural preferences.
Within the framework presented here, I therefore make the case for enriching a set of
universal dimensions with country-specific detail. Country context could be provided
through the inclusion of different indicators or through weighting decisions that reflect
national priorities. There is support for this approach in the literature. Alkire, for example,
has pointed out that “in order for human development to become an operational objective
in the sense of a feasible goal for which planning, monitoring and evaluation frameworks
can be designed, heroic specification is required” (2005, p. 77). In addition, it would be
possible to abstract a group of common indicators for international comparison to retain
some comparability were this deemed necessary.
In the next section I move on to describe some of the issues in operationalising the
survey.
123
7.2 Operationalising the survey
The main aim of the survey was to reveal the things that mattered to people: essentially
their attitudes and values. There is a substantial literature associated with the
measurement of these concepts and I begin this section by summarising the most salient
points. As discussed in Chapter 5. The answer options provided in the survey used
ordinal scales. I also provide a defence for this approach and discuss some of the issues
relating to ordinal measurement that are relevant for interpreting the findings in Chapter
8.
7.2.1 Measurement of attitudes and values
Attitudes and values are closely related but different in subtle ways. An attitude could be
described as the evaluation of an object. Bergman (1998) argues that attitude objects
are not understood in the same way by everyone. People can differ in their evaluation of
an object but also in their how they construct the object cognitively i.e. have different
reactions towards it but also perceive of it differently. The cognitive construction and the
evaluation of the object are therefore both components of an attitude (ibid). In a meta-
analysis of the value concept, Schwartz and Bilsky (1990) concluded that values are a)
relatively stable beliefs b) refer to major life goals and modes of conduct that promote
these goals; and c) transcend specific actions and guide behaviour.
A simple interpretation is that values are socially constructed and give rise to object-
specific attitudes (Rokeach and others, 1973). However, this constructivist approach
may undermine the role of human agency (Bergman, 1998) and the possibility that
attitudes can be formed independent of values and themselves influence values
(Kristiansen and Zanna, 1991). Values have been described as more ephemeral
attitudes that can be incorporated into research on attitudes (Schuman, 1995).
Nonetheless, Bergman warns against using the terms interchangeably because it can
lead to misleading interpretations of empirical findings (1998). For example, values and
attitudes can diverge and values themselves be contradictory, which undermines an
entirely structural source for attitudes (ibid.). It is interesting to note, that in intra-national,
national, or transnational value studies dealing with topics from law and order to the
protestant work ethic, atomised values tend not to exist. Groups of values almost always
occur together, while others almost never do (Bergman, 1998). This suggests that in
spite of anomalies or inconsistencies, it is possible to talk about ‘value systems’ as a
whole (Schwartz, 1992, 1997). For example, environmentalists have long had an
opposition to nuclear power because environmental values are often grouped with anti-
nuclear ones (Kasperson et al., 1980). Anti-nuclear/environmental values developed at
124
the same time in the 1960s and 1970s when concerns about nuclear weapons were
widespread. However, nuclear power and nuclear weapons are very different things.
From an environmental perspective, nuclear power plants produce almost no carbon
emissions, acid rain or smog. Although many environmentalists have shifted position,
these values continue to be more closely associated than might be expected.
In terms of this research, it is expected that both values and attitudes will be expressed,
however it will not always be clear which is being expressed or is informing the response
in any given situation. This is not necessarily a problem. An empirical link has been found
between the two (Maio and Olson, 2000) and it is expected that the response will be
broadly reflective of both.
A bigger challenge to the study is Daniel Kahneman’s work which has shown that
people’s choices and behaviour are irrational and subject to a whole variety of cognitive
biases (Kahneman, 2011). Contrary to the once rational, utility maximizing agent of
economics, repeated experiments have found human decision-making to be sub-
optimal. In his 2011 book Thinking, Fast and Slow, which summarises findings from his
life’s work on decision-making, Kahneman describes two systems of thought: System 1
is fast, instinctive and emotional; System 2 is slower, more deliberative, and more logical.
System 1 decisions result from heuristics and are the subject of all sorts of irrational
biases and interference effects, including loss aversion, anchoring, overconfidence, the
halo effect and confirmation bias. System 2 decisions are more thoughtful and logical,
requiring us to concentrate on the decision at hand rather than give an instant, intuitive
response.
One cognitive bias that may affect responses is social desirability bias where the group
norm or value influences how the respondent answers the question (Seligman and Katz,
1996). One example might be where someone holds a value that is considered non-
materialistic but who takes a more acquisitive attitude towards material possessions in
their day-to-day life. In contrast to the reality of how people live, certain value systems
may be activated by the phrasing of the question, which would lead someone to express
the ideal of themselves, rather than their day-to-day attitude or related behaviour (ibid.).
One way of describing this might be that their System 1 thinking may be dominant in
their day-to-day life, but they make decisions closer to what they would like to see
themselves when they can master System 2 thinking. However, it is important to note
that the survey is interested in the value people place on things, not in how they act on
a day to day basis. There is a well-documented ‘value-action gap’ (e.g. (Blake, 1999). In
other words, people often do not act in accordance with what they know or care about.
The value-action gap suggests that behaviour is not always preceded by deliberation,
125
most notably in the case of habits (Vliet et al., 2005). The existence of the value-action
gap does not mislead us as to how important things are to people; indeed, it is all but
irrelevant in this context. The purpose is to produce data that would inform the
development of a measure of social value, therefore it should represent an idealized
version of how we would like to world to be, not how it is. It should appeal to our best
interests, the decisions we would make if we employed System 2 thinking all the time. It
should encourage us to plan and think long-term to apply our logic and concentration to
decisions that we make. An important distinction here is that the questions are not asking
people to report on how they behave or how much money, education or friendships they
have, simply to report on how important they are.
We may want such measures to adopt a paternalistic role and play to our better instincts.
It is not often that people are given an opportunity to express their values in a reflective
way. With the exception of voting, it is difficult to think of examples of where our System
2 thinking is given voice. Smaller everyday decisions – what we eat, how we drive, what
we buy, whether we exercise – these are more likely to be dominated by System 1. We
may want to be more altruistic, more economical, healthier, more community-spirited and
environmentally friendly but our System 1 decisions may mean we make decisions that
diverge from these values. A survey of this kind may provide an opportunity for System
2 thinking to override System 1. A measure of social value should provide a framework
to encourage more System 2 thinking. The mirror it holds up to society should be an
aspirational one. This is a key argument in this research and will be returned to in Chapter
10 as part of the conclusion.
Bergman (1998) provides guidance on measuring attitudes and values. For attitudes, he
recommends understanding the subject matter and its context well to interpret
respondent’s answers. He argues for allowing granularity in response options, rather
than simple binary responses. For values, he recommends looking for attitude and
behavioural patterns. These can be decided a priori or sought in the data. He
recommends aggregation and analysis of patterns in the data such as comparison
between groups of value statements. Both approaches have been followed. First, all
responses have been structured on a rating scale. People are asked to rate how aspects
of their life contribute towards their happiness and to rank a similar set of indicators
according to their appropriateness to a national measure of social value. The rating
approach has allowed for a more complete list and for the inclusion of negatively framed
questions. It also allows people to ascribe equal importance to all attributes if they so
wish. In addition, the questionnaire consists of almost entirely closed questions which
enable aggregation, statistical analysis and comparisons between clusters of value
126
statements. There is some controversy as to whether rating or rankings are more
appropriate for value researchers. However, Maio et al. (1996) present evidence that
rating scales provide a higher level of validity.
A final relevant point relates to the changing nature of values and attitudes over time.
For example, Johnson (2002) found that adolescent’s values become more realistic as
they age and that their aspirations become more limited through experience with the
adult world. It has been suggested that more research is needed on the longitudinal
nature of values and what the determinants of those changes are (Roberts et al., 1999).
This is particularly relevant in Ireland, which has undergone massive social and cultural
change in the past 30 years. The survey has taken account of this by asking people
about how they consider their values and the values of others to have changed over
time. The responses to this will be discussed later in the chapter. Next, I discuss the
levels of measurement employed in the survey.
7.2.2 Interval data and levels of measurement
There is a debate in the literature as to whether interval data should be interpreted as
categorical or continuous.46 Some researchers interpret interval data as ordinal and
therefore suitable for parametric tests. If interval data are interpreted as categorical,
parametric tests are not appropriate (e.g. it is not meaningful to talk about an average
hair colour, or an average levels of education) (Jamieson et al., 2004). On the other
hand, researchers often consider Likert scales, where respondents are given fewer
options to choose from than a 10-point scale, as continuous data (e.g. Lubke and
Muthén, 2004).
In some ways, the data gathered as part of this research could be considered continuous;
there are many points on the scale - a minimum of five is sometimes recommended47
and there is an intrinsic ordering of the levels of the categories. However, there is a
concern over whether the differences between the category levels are mathematically
meaningful. We cannot be sure that someone who values a variable at 4 values it by half
the amount of someone who values it at 8. Whilst we can say that mental health is more
important to the sample than church attendance, we cannot say that it is almost three
times as important because it is not clear that respondents would interpret the scale in
this way.
The data are therefore defined as ordinal and the appropriate test of difference – Chi
Square – has been chosen to see whether there are differences in responses between
46 http://www.ats.ucla.edu/stat/mult_pkg/whatstat/nominal_ordinal_interval.htm 47 http://www.theanalysisfactor.com/can-likert-scale-data-ever-be-continuous/
127
groups. However, due to this being a subjective decision, I have also compared means
using independent t-tests (appropriate for continuous data) and reported on any notable
differences. The results of the t-tests are included in Appendix 2.
7.3 Operationalising the social value index
The second part of the primary research is the design of the index of social value. This
takes the findings from the survey and uses them to inform the choice of indicators to
include. The results of this will be discussed in Chapter 8. Here, I describe the statistical
technique that were used and the assumptions that underpinned it.
7.3.1 Principal Component Analysis
Principal component analysis (PCA) is a type of multivariate analysis that shares many
similarities with Exploratory Factor Analysis (EFA) (Joliffe and Morgan, 1992). Whereas
EFA is concerned with finding a latent concept that is being measured by the data, PCA
is concerned with reducing the number of variables in a dataset to its principal
components. The purpose of this stage of the research is to do both – identify a latent
structure for well-being – and reduce the number of variables. However, as the variables
are already based on things that have been shown to have an empirical relationship with
well-being, the latter objective was considered most important and PCA was chosen as
the preferred methodology. Although PCA and EFA should not be mistaken as the same
statistical method, in practice the results are often very similar.
PCA reduces a larger set of variables into a smaller set of 'artificial' variables, called
'principal components', which account for most of the variance in the original set of
variables. The new set of variables are uncorrelated and are ordered by the fraction of
the total information each retains (the greater the variance, the higher the principal
component). It is recommended that multivariate techniques like PCA are used in the
process of building an index (Nardo et al., 2005). PCA should enable greater parsimony
without a great loss of information.
In this dataset, there is a large number of variables which are all measuring the same
underlying construct (e.g. the things in life that contribute to well-being). By applying PCA
it is possible to test whether the variables ‘load’ onto all the variables or just some of
them and whether there are superfluous variables that can be removed from the analysis.
7.3.4 PCA Assumptions
Like any type of statistical analysis, PCA has assumptions that underpin it and several
tests were run to assess the ‘factorability’ of the data. First, PCA is based on the Pearson
correlation coefficient, so it assumes linearity in the data. However, PCA is also often
128
applied to ordinal data, as it is with this dataset. In practice, therefore this assumption is
somewhat relaxed. Second, PCA requires a large enough sample. Tabachnick and Fidell
(2001, p. 588), cite Comrey and Lee's (1992) advice regarding sample size: 50 cases is
very poor, 100 is poor, 200 is fair, 300 is good, 500 is very good, and 1000 or more is
excellent. As a rule of thumb, a minimum of 10 observations per variable is necessary
to avoid computational difficulties. Once missing data are excluded the sample in this
research totals 314 observations, which is in the ‘good’ range. The Kaiser-Meyer-Olkin
(KMO) test can be used to test for sampling adequacy. The KMO for this analysis was
.84, which is above the recommended minimum of 0.6 (Kaiser, 1974).
Third, the data should be suitable for data reduction i.e. there needs to be adequate
correlation between the variables. A simple strategy is to visualize the correlation matrix.
If the values outside the main diagonal are often high (in absolute value), some variables
are correlated; if most of the values are close to zero, the PCA is not really useful. Due
to the large number of variables, it is difficult to assess this conclusively using this
method. However, a correlation matrix did reveal reasonably high correlations between
some of the variables (as high as 0.59) and clustering around themes such as the quality
of public institutions and mental health. The Bartlett’s test of sphericity tests this
assumption statistically. The results were significant (Chi-square=7692; p=0.000). As
these conditions were met, all 38 variables were included in the model.
7.4 Conclusion
In this chapter, I have introduced the conceptual framework and the principles that
underpin it in more detail. Specifically, I have argued for a) high levels of transparency
achieved through clear theoretical framework, endorsement by stakeholders and a clear
methodological exposition, b) a focus on ends rather than means, c) combining
subjective and objective data and d) prioritising the specific over the universal. The final
principle runs counter to the aims of other synthetic indices such as the Human
Development Index. I have argued here that this enables my index to be a more
successful guide to policy, a discussion I will return to in Chapter 10.
The second part of this chapter provides some further detail on how I operationalised the
two parts of the primary research. First, I described some of the issues relating to the
measurement of attitudes and values. I showed how this literature informed my decisions
around the design of my survey. I also reflected on the role that an index should play by
appealing to our better instincts and by holding up a mirror of how we would like to be,
rather than how we are. I employed Kahneman’s System 1 and System 2 Thinking to
explain this further. I argued that such a way of deciding what matters in life should
129
encourage people to engage System 2 thinking, which in itself overcomes Kahenman’s
critique of decision-making more generally. I also provide some empirical evidence for
this by way of the ‘value action gap’, which suggests that behaviour is not always
preceded by deliberation and were it to be actions may conform more to expressed
values.
I then go on to describe how I operationalised the index development. I discuss the
choice of the Principal Component Analysis technique to reduce my list of variables. I
conclude with a discussion of the assumptions that underpin it and demonstrate how
they were consistent with the objectives of my research. In the next chapter I present the
findings of the two parts of the primary research.
130
Chapter 8 Findings from the survey and index development
8.0 Introduction
In this chapter I present the results from the primary research and analysis. There are
three main research questions that it seeks to answer:
1. What do people in the Republic of Ireland value?
2. What are the indicators of the outcomes that people value?
3. Can these indicators be incorporated into an index of national social value?
In addition, this chapter seeks to answer the following sub-research questions.
1. What level of income do people think they need to earn to be happy?
2. Is there evidence that there has been a shift in the things people value over time?
3. How do subjective views on climate change fit with the conceptual framework
and the theory of quasi-strong sustainability that underpins it?
4. Do demographic factors such as gender, age and religion influence the way in
which people value things?
5. Is there any evidence of a relationship between holding more materialistic values
and self-reported well-being?
I begin by reporting on how people rated different aspects of their lives in terms of how
they contributed to their well-being. This includes their responses to questions on the
level of income that they need to be happy, whether they believe their values have
changed over time, and whether they prioritise environmental concerns. I also test
whether there are statistical relationships between value orientation and a) demographic
variables and b) self-reported well-being.
In the second part of the chapter I focus on the findings from the index development. I
first describe the findings from the PCA analysis and the outcomes that were selected
for inclusion. I then identify indicators for those outcome areas. Due to a lack of time
series data on those indicators, I stop short of aggregating the index. Instead, I set out
the ways in which this could be done to be consistent with the conceptual framework
with an emphasis on weighting i.e. determining the value of different dimensions relative
to each other.
8.2 Findings from the survey
8.2.1 What people value
The first set of questions in the survey (1-9 and 11) are designed to ascertain which
aspects of life people consider most important for their well-being. In total, respondents
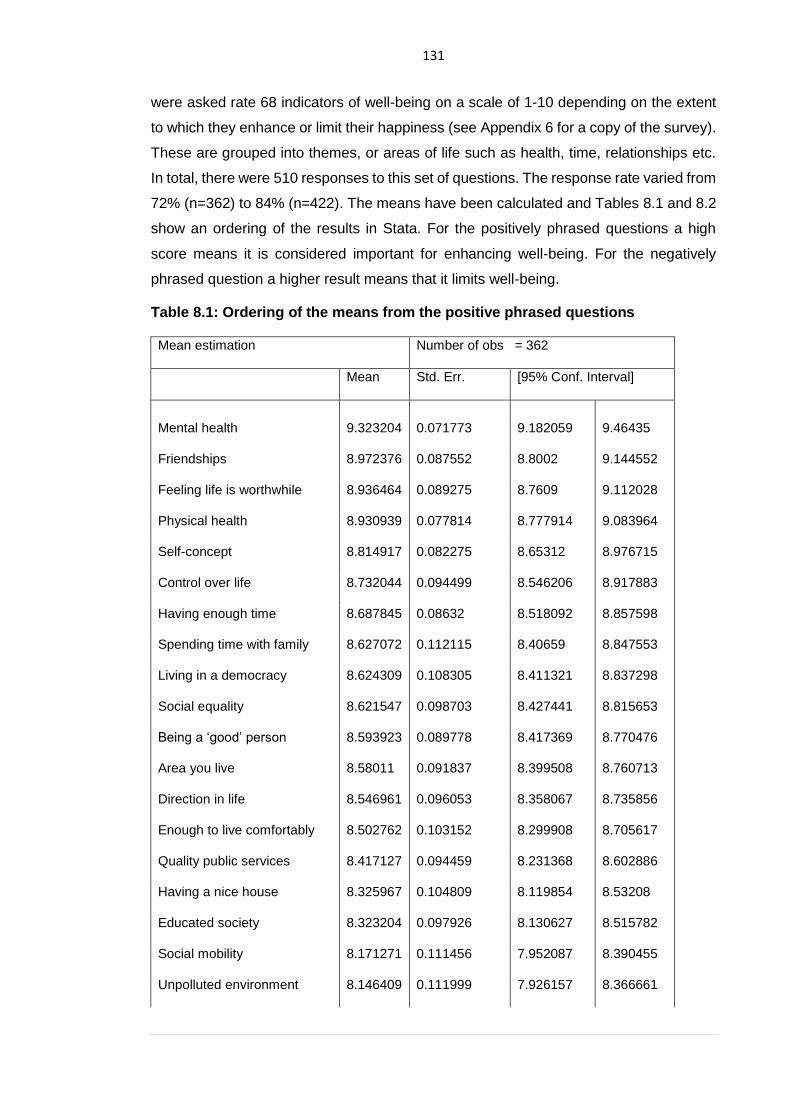
131
were asked rate 68 indicators of well-being on a scale of 1-10 depending on the extent
to which they enhance or limit their happiness (see Appendix 6 for a copy of the survey).
These are grouped into themes, or areas of life such as health, time, relationships etc.
In total, there were 510 responses to this set of questions. The response rate varied from
72% (n=362) to 84% (n=422). The means have been calculated and Tables 8.1 and 8.2
show an ordering of the results in Stata. For the positively phrased questions a high
score means it is considered important for enhancing well-being. For the negatively
phrased question a higher result means that it limits well-being.
Table 8.1: Ordering of the means from the positive phrased questions
Mean estimation Number of obs = 362
Mean Std. Err. [95% Conf. Interval]
Mental health 9.323204 0.071773 9.182059 9.46435
Friendships 8.972376 0.087552 8.8002 9.144552
Feeling life is worthwhile 8.936464 0.089275 8.7609 9.112028
Physical health 8.930939 0.077814 8.777914 9.083964
Self-concept 8.814917 0.082275 8.65312 8.976715
Control over life 8.732044 0.094499 8.546206 8.917883
Having enough time 8.687845 0.08632 8.518092 8.857598
Spending time with family 8.627072 0.112115 8.40659 8.847553
Living in a democracy 8.624309 0.108305 8.411321 8.837298
Social equality 8.621547 0.098703 8.427441 8.815653
Being a ‘good’ person 8.593923 0.089778 8.417369 8.770476
Area you live 8.58011 0.091837 8.399508 8.760713
Direction in life 8.546961 0.096053 8.358067 8.735856
Enough to live comfortably 8.502762 0.103152 8.299908 8.705617
Quality public services 8.417127 0.094459 8.231368 8.602886
Having a nice house 8.325967 0.104809 8.119854 8.53208
Educated society 8.323204 0.097926 8.130627 8.515782
Social mobility 8.171271 0.111456 7.952087 8.390455
Unpolluted environment 8.146409 0.111999 7.926157 8.366661
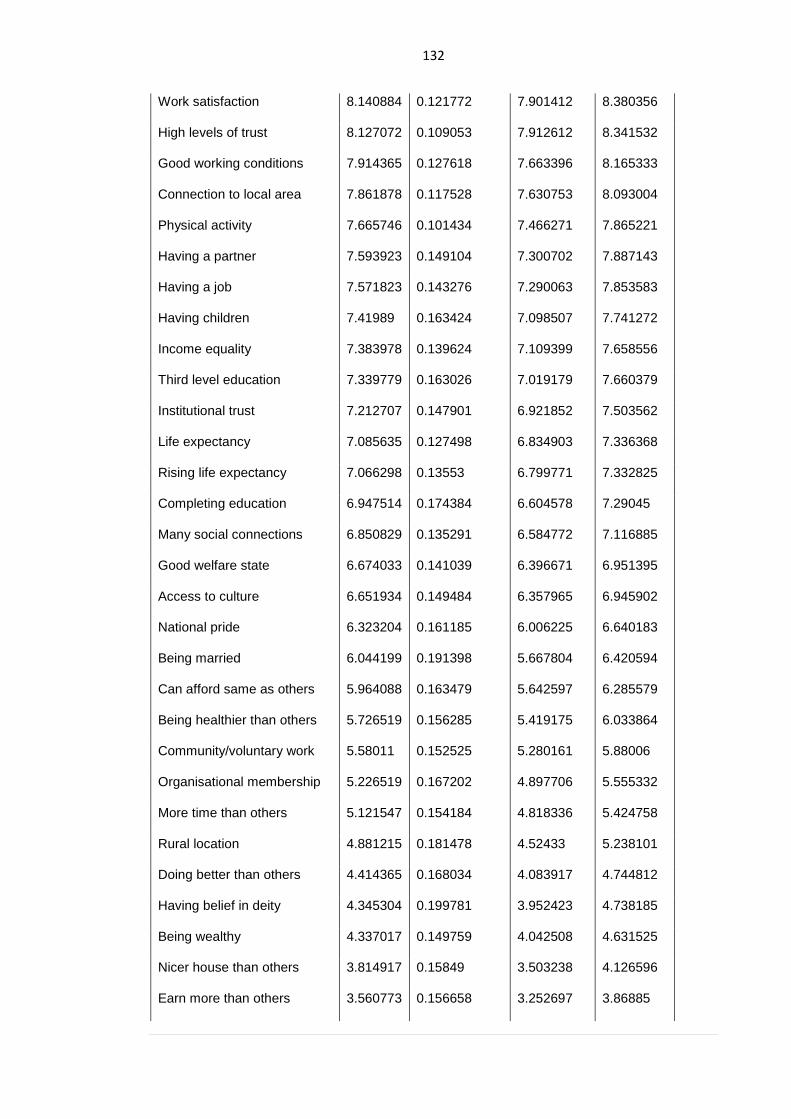
132
Work satisfaction 8.140884 0.121772 7.901412 8.380356
High levels of trust 8.127072 0.109053 7.912612 8.341532
Good working conditions 7.914365 0.127618 7.663396 8.165333
Connection to local area 7.861878 0.117528 7.630753 8.093004
Physical activity 7.665746 0.101434 7.466271 7.865221
Having a partner 7.593923 0.149104 7.300702 7.887143
Having a job 7.571823 0.143276 7.290063 7.853583
Having children 7.41989 0.163424 7.098507 7.741272
Income equality 7.383978 0.139624 7.109399 7.658556
Third level education 7.339779 0.163026 7.019179 7.660379
Institutional trust 7.212707 0.147901 6.921852 7.503562
Life expectancy 7.085635 0.127498 6.834903 7.336368
Rising life expectancy 7.066298 0.13553 6.799771 7.332825
Completing education 6.947514 0.174384 6.604578 7.29045
Many social connections 6.850829 0.135291 6.584772 7.116885
Good welfare state 6.674033 0.141039 6.396671 6.951395
Access to culture 6.651934 0.149484 6.357965 6.945902
National pride 6.323204 0.161185 6.006225 6.640183
Being married 6.044199 0.191398 5.667804 6.420594
Can afford same as others 5.964088 0.163479 5.642597 6.285579
Being healthier than others 5.726519 0.156285 5.419175 6.033864
Community/voluntary work 5.58011 0.152525 5.280161 5.88006
Organisational membership 5.226519 0.167202 4.897706 5.555332
More time than others 5.121547 0.154184 4.818336 5.424758
Rural location 4.881215 0.181478 4.52433 5.238101
Doing better than others 4.414365 0.168034 4.083917 4.744812
Having belief in deity 4.345304 0.199781 3.952423 4.738185
Being wealthy 4.337017 0.149759 4.042508 4.631525
Nicer house than others 3.814917 0.15849 3.503238 4.126596
Earn more than others 3.560773 0.156658 3.252697 3.86885

133
Religious services 2.342541 0.167113 2.013904 2.671179
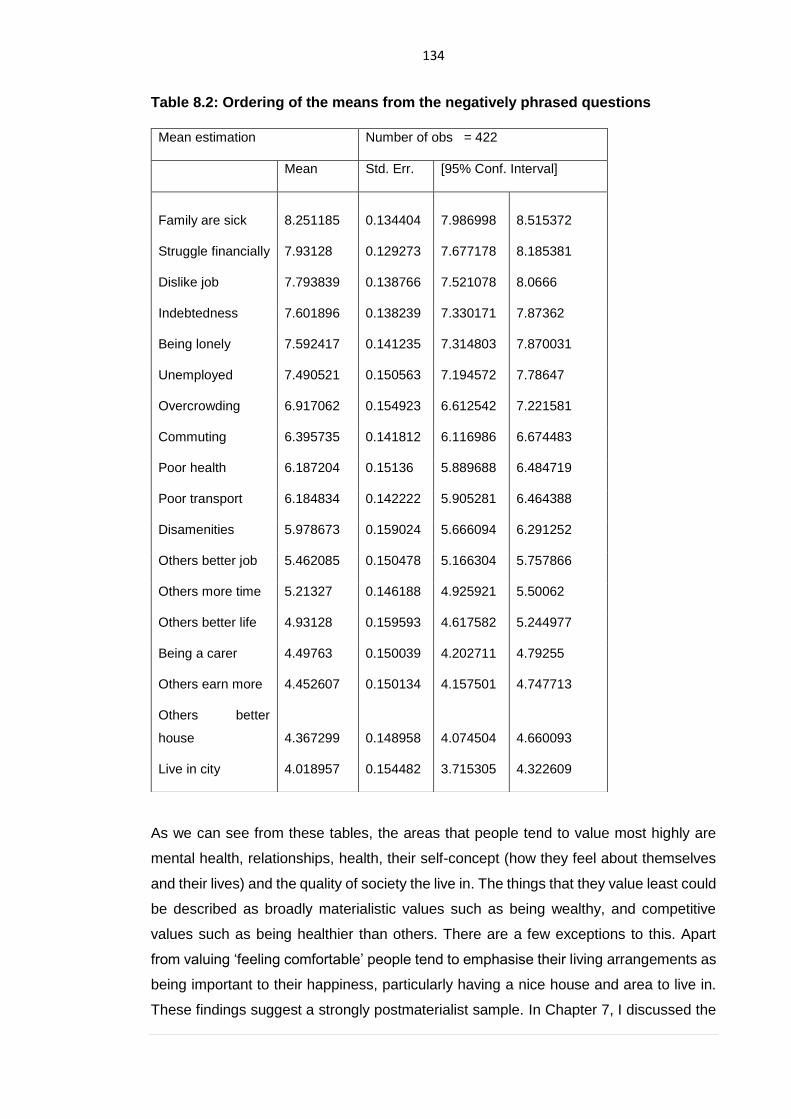
134
Table 8.2: Ordering of the means from the negatively phrased questions
As we can see from these tables, the areas that people tend to value most highly are
mental health, relationships, health, their self-concept (how they feel about themselves
and their lives) and the quality of society the live in. The things that they value least could
be described as broadly materialistic values such as being wealthy, and competitive
values such as being healthier than others. There are a few exceptions to this. Apart
from valuing ‘feeling comfortable’ people tend to emphasise their living arrangements as
being important to their happiness, particularly having a nice house and area to live in.
These findings suggest a strongly postmaterialist sample. In Chapter 7, I discussed the
Mean estimation Number of obs = 422
Mean Std. Err. [95% Conf. Interval]
Family are sick 8.251185 0.134404 7.986998 8.515372
Struggle financially 7.93128 0.129273 7.677178 8.185381
Dislike job 7.793839 0.138766 7.521078 8.0666
Indebtedness 7.601896 0.138239 7.330171 7.87362
Being lonely 7.592417 0.141235 7.314803 7.870031
Unemployed 7.490521 0.150563 7.194572 7.78647
Overcrowding 6.917062 0.154923 6.612542 7.221581
Commuting 6.395735 0.141812 6.116986 6.674483
Poor health 6.187204 0.15136 5.889688 6.484719
Poor transport 6.184834 0.142222 5.905281 6.464388
Disamenities 5.978673 0.159024 5.666094 6.291252
Others better job 5.462085 0.150478 5.166304 5.757866
Others more time 5.21327 0.146188 4.925921 5.50062
Others better life 4.93128 0.159593 4.617582 5.244977
Being a carer 4.49763 0.150039 4.202711 4.79255
Others earn more 4.452607 0.150134 4.157501 4.747713
Others better
house 4.367299 0.148958 4.074504 4.660093
Live in city 4.018957 0.154482 3.715305 4.322609
135
risks with biases in how people respond to such questions, the so-called ‘value action
gap’. I return to this again in 8.2.3 when I discuss other evidence for postmaterialism in
the survey results.
There are other anomalies here as well. Some activities, which are often recommended
for inclusion in an index of well-being such as engagement in voluntary or community
work (Colman, 2003) received low scores. Other activities that we would expect people
to value, given the literature on their contribution to our happiness such as religion (see
Chapter 5) also received low scores. This may be related to a bias towards non-believers
in the sample, however whilst the relative position of religion and religious services
increased when sampling weights were applied, both remained quite close to the bottom
of the ordering. This will be explored further in the statistical analysis later in the chapter.
People’s rating of negative determinants of well-being seems to be consistent with this
(Table 8.2). Respondents tend to think that factors that relate to health, financial stress,
indebtedness and relationships are detrimental for their well-being, with relative or
competitive factors receiving a low score.
As discussed in Chapter 5, this seems to be broadly supportive of what has been found
in the secondary literature to be good for our well-being. If this were to be replicated on
a larger scale, it would suggest that people demonstrate logical and informed decision-
making consistent with the System 2 approach. This may have related to the way in
which the questions were phrased i.e. setting out that the purpose was to engage people
in a discussion about what matters in life to build an index of social value We could
potentially conclude that people appear to ‘know’ what is good for them, following
reflection, irrespective of whether they are prioritising those things in their day-to-day life.
In Chapter 5 I discussed the importance of relative measures of welfare to people’s well-
being. Although it is still an under-researched field, there is some evidence that people
tend to care less about being poor, unemployed, or lonely when others are poor,
unemployed or lonely. However, there was no support for this in my survey, where
people gave low scores to all questions that asked them to judge their lives relative to
others e.g. earning more than other people. Further research e.g. using experimental, or
qualitative designs might contribute here as they are less at risk of being influenced by
cognitive biases.
8.2.2 Identifying an income threshold?
As mentioned in Chapter 4, there have been several attempts to capture the level of
income beyond which returns to well-being diminish. These have varied from $15,000
globally to $75,000 in the US (Kahneman and Deaton, 2010; Layard, 2003). In Ireland,
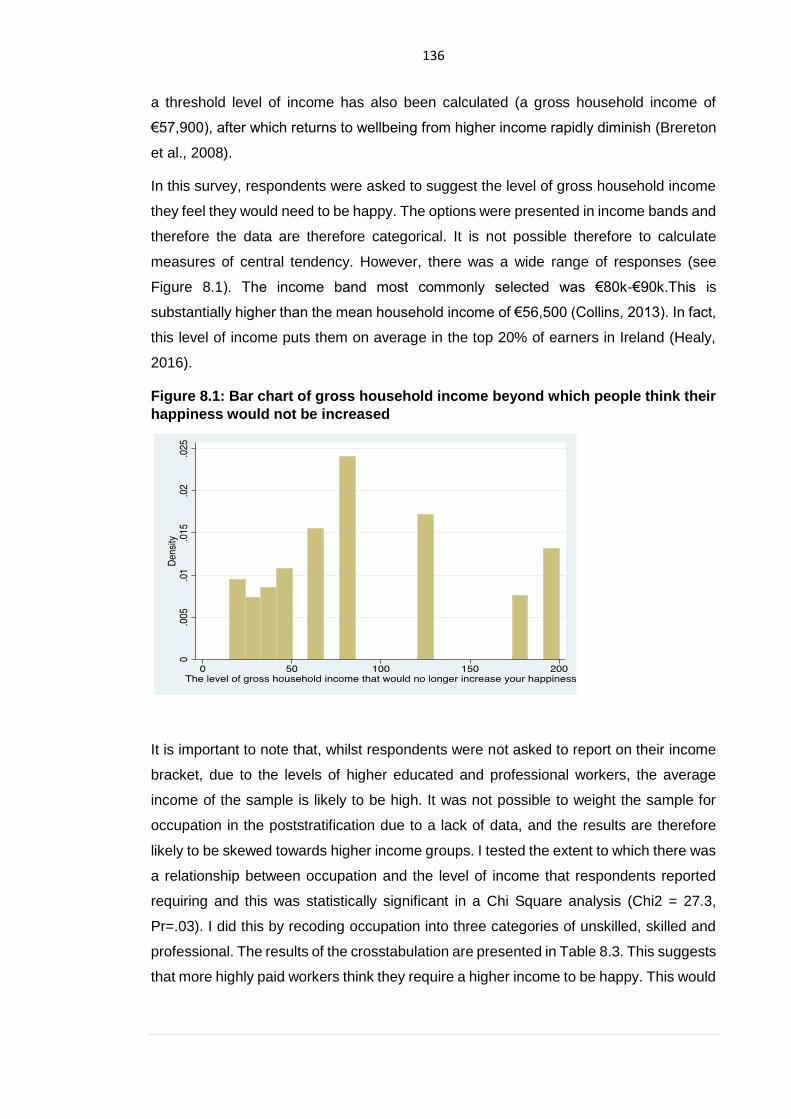
136
a threshold level of income has also been calculated (a gross household income of
€57,900), after which returns to wellbeing from higher income rapidly diminish (Brereton
et al., 2008).
In this survey, respondents were asked to suggest the level of gross household income
they feel they would need to be happy. The options were presented in income bands and
therefore the data are therefore categorical. It is not possible therefore to calculate
measures of central tendency. However, there was a wide range of responses (see
Figure 8.1). The income band most commonly selected was €80k-€90k.This is
substantially higher than the mean household income of €56,500 (Collins, 2013). In fact,
this level of income puts them on average in the top 20% of earners in Ireland (Healy,
2016).
Figure 8.1: Bar chart of gross household income beyond which people think their
happiness would not be increased
It is important to note that, whilst respondents were not asked to report on their income
bracket, due to the levels of higher educated and professional workers, the average
income of the sample is likely to be high. It was not possible to weight the sample for
occupation in the poststratification due to a lack of data, and the results are therefore
likely to be skewed towards higher income groups. I tested the extent to which there was
a relationship between occupation and the level of income that respondents reported
requiring and this was statistically significant in a Chi Square analysis (Chi2 = 27.3,
Pr=.03). I did this by recoding occupation into three categories of unskilled, skilled and
professional. The results of the crosstabulation are presented in Table 8.3. This suggests
that more highly paid workers think they require a higher income to be happy. This would
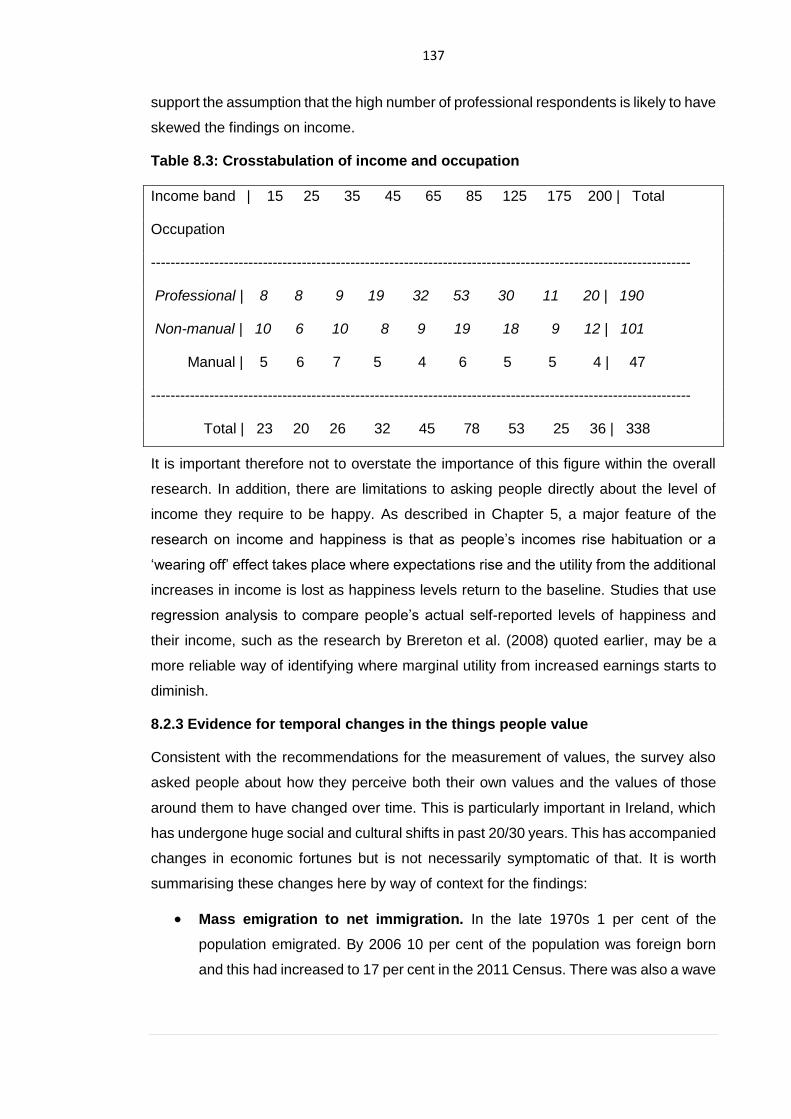
137
support the assumption that the high number of professional respondents is likely to have
skewed the findings on income.
Table 8.3: Crosstabulation of income and occupation
Income band | 15 25 35 45 65 85 125 175 200 | Total
Occupation
---------------------------------------------------------------------------------------------------------------
Professional | 8 8 9 19 32 53 30 11 20 | 190
Non-manual | 10 6 10 8 9 19 18 9 12 | 101
Manual | 5 6 7 5 4 6 5 5 4 | 47
---------------------------------------------------------------------------------------------------------------
Total | 23 20 26 32 45 78 53 25 36 | 338
It is important therefore not to overstate the importance of this figure within the overall
research. In addition, there are limitations to asking people directly about the level of
income they require to be happy. As described in Chapter 5, a major feature of the
research on income and happiness is that as people’s incomes rise habituation or a
‘wearing off’ effect takes place where expectations rise and the utility from the additional
increases in income is lost as happiness levels return to the baseline. Studies that use
regression analysis to compare people’s actual self-reported levels of happiness and
their income, such as the research by Brereton et al. (2008) quoted earlier, may be a
more reliable way of identifying where marginal utility from increased earnings starts to
diminish.
8.2.3 Evidence for temporal changes in the things people value
Consistent with the recommendations for the measurement of values, the survey also
asked people about how they perceive both their own values and the values of those
around them to have changed over time. This is particularly important in Ireland, which
has undergone huge social and cultural shifts in past 20/30 years. This has accompanied
changes in economic fortunes but is not necessarily symptomatic of that. It is worth
summarising these changes here by way of context for the findings:
• Mass emigration to net immigration. In the late 1970s 1 per cent of the
population emigrated. By 2006 10 per cent of the population was foreign born
and this had increased to 17 per cent in the 2011 Census. There was also a wave
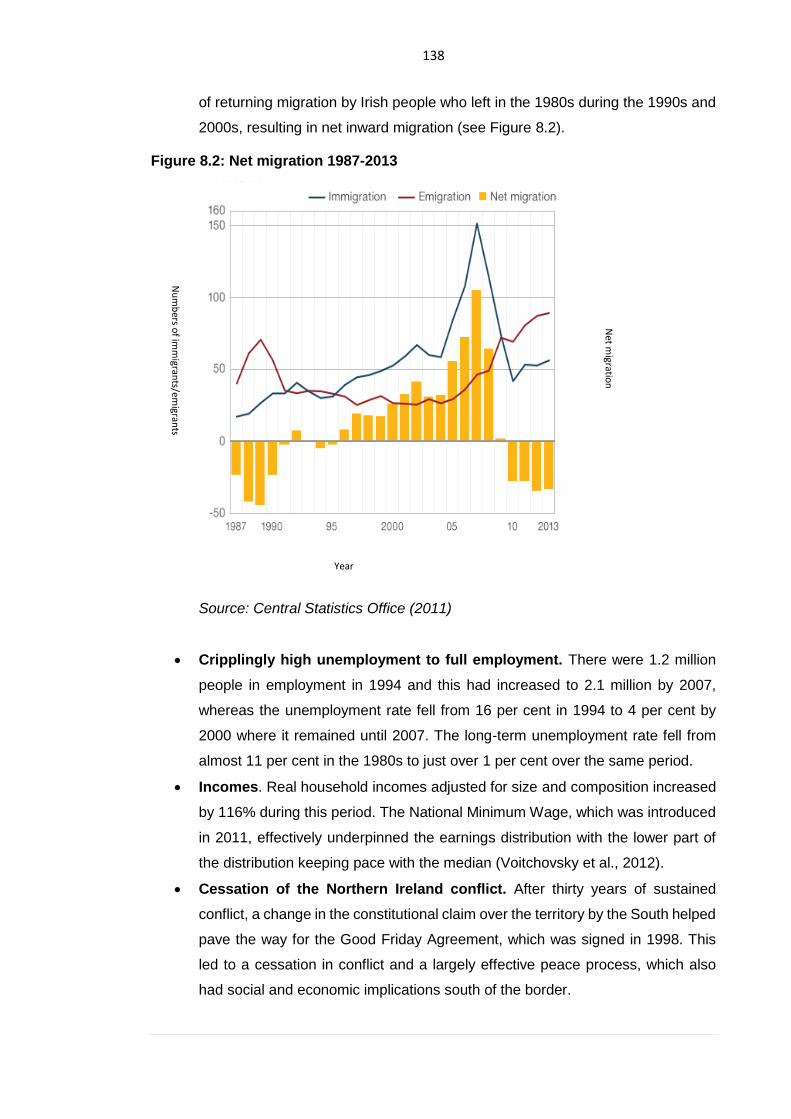
138
of returning migration by Irish people who left in the 1980s during the 1990s and
2000s, resulting in net inward migration (see Figure 8.2).
Figure 8.2: Net migration 1987-2013
Source: Central Statistics Office (2011)
• Cripplingly high unemployment to full employment. There were 1.2 million
people in employment in 1994 and this had increased to 2.1 million by 2007,
whereas the unemployment rate fell from 16 per cent in 1994 to 4 per cent by
2000 where it remained until 2007. The long-term unemployment rate fell from
almost 11 per cent in the 1980s to just over 1 per cent over the same period.
• Incomes. Real household incomes adjusted for size and composition increased
by 116% during this period. The National Minimum Wage, which was introduced
in 2011, effectively underpinned the earnings distribution with the lower part of
the distribution keeping pace with the median (Voitchovsky et al., 2012).
• Cessation of the Northern Ireland conflict. After thirty years of sustained
conflict, a change in the constitutional claim over the territory by the South helped
pave the way for the Good Friday Agreement, which was signed in 1998. This
led to a cessation in conflict and a largely effective peace process, which also
had social and economic implications south of the border.
Nu
mb
ers of im
migran
ts/emigran
ts
Net m
igration
Year
139
• EU integration and the introduction of the Euro. Ireland consistently reports
higher than average levels of satisfaction with the EU. Support for treaty changes
has been in decline in constitutional votes and there is some evidence of a shift
in attitudes, nonetheless, EU membership has been a defining feature of Irish
social and economic life in the past four decades. It has also been symbolic of a
more outward looking country and a move away from its historical relationship
with Britain.
• Fall in religious observance. Although belief in a deity and membership of
organized religion (predominantly Catholic) are still very high, there has been a
dramatic fall in church attendance. Between the 2006 and 2011 Census the
numbers stating, ‘no religion’ almost doubled, albeit from a low base (186,000 to
269,000). This was most marked in the 25-29 age group.
• Introduction of divorce. Divorce was legalized in a referendum in 1995 and the
divorce rate rose steadily to 9.2 per cent by 2011. Although low by European
standards, this should be seen in the context of there being no legal provision for
divorce at the beginning of this period
• Female participation in the workforce. Employment for women rose from 40
per cent of the workforce to 60 per cent. Again, this is low by European averages,
but is still a 50 per cent increase in a short period of time. The fertility rate fell
from 3.23 to 2.1 by 2008 (1.38 2011 census)
• Expansion of higher education. The period saw an increase from 20 per cent
in 1980 to 44 per cent in 1998 to 55 per cent in 2004. This included increases
from across all social class groups but was most marked for professional groups,
which went from about 50 per cent to near saturation.
• Change in voting patterns. A further dramatic change in the social structure
was the decline in support for the Fianna Fail party, which had a hegemonic
influence over Irish political life since the foundation of state (see Chapter 6). In
2011, its share of the vote was 17.4 per cent, which was half of its share in the
previous election. The gap was mainly filled by Sinn Féin and other left-wing
parties which saw their seats increase from 5 to 20 in the same election. It
recovered its position somewhat in 2016 (rising to 24%) but this was still far from
being able to form a government.
• Changing traditional values. Although abortion remains illegal, it has been
liberalized through a series of constitutional changes and a new referendum
seems likely. There have also been very dramatic changes in attitudes towards
140
homosexuality, most notably the passing of a referendum in 2015 to legalise gay
marriage.
Although much of these changes might be seen as ‘catching up’ with other modern
economies, the scale and pace of change was quite dramatic within a short space of
time. Kitchen and Bartley (2007) describe Ireland as “unrecognisable” to migrants who
left in the 1980s. We would expect, considering this to see this translate into changes in
the things people value. The most recently available data on values in Ireland comes
from the European Values Survey, a pan-European project that focuses on values
relating to work, religion and lifestyle. Results from this have been analysed by Breen
and Reynolds (2011) and show an interesting set of trends.
Whilst there has not been a marked fall in the number of people reporting a decline in
belief in God, (97% in 1981 to 91% in 2008), there have been falls in the number of
people reporting declines in belief in some of the major tenets of faith: heaven and hell,
sin etc. The biggest fall however was in church attendance, which dropped from 82% to
44% in 2008. A survey by the Association of Catholic Priests (2012) found it to be 35%
in 2011, whilst another survey from the same year found it to be 18% in Dublin and as
low as 2% in some areas (Smyth, 2011). Breen and Reynolds summarise these findings
as a pronounced church-oriented decline but a persistence of religious sentiment – most
people still identify as Catholic48. Concepts such as belief without belonging (Davie,
1990), or cultural Catholicism (Inglis, 2007) are relevant here. As Breen and Reynolds
(ibid.) point out that these levels of attendance are very high by European standards and
the secularisation does not appear to have been accompanied by a major drop in the
permanence in religious belief. Robust confidence in the church was at 50% in 1981 and
fell to 20% in 2008. This has been accompanied by falls in trust in all institutions
(excepting education). The church saw the biggest fall, but it started from a much higher
base than say the press or parliament. Other commentators have argued the unusually
high levels of religiosity north and south of the border is a legacy of the church’s role in
opposition to occupation by Britain (Maguire, 2002). Similarly, for Inglis, ‘cultural
Catholicism’ is less about following rules and observance and more about shared
heritage and bonding to a community (2007).
Analysis of the European Values survey also finds that on average Irish people see
family as most important to them, followed by friends, leisure time, work, religion and
lastly politics. This ranking has not changed dramatically over the period of social and
48 The 2016 census found that Catholicism had dropped to 78%, whilst this has been falling with
each census, it has not been falling dramatically.
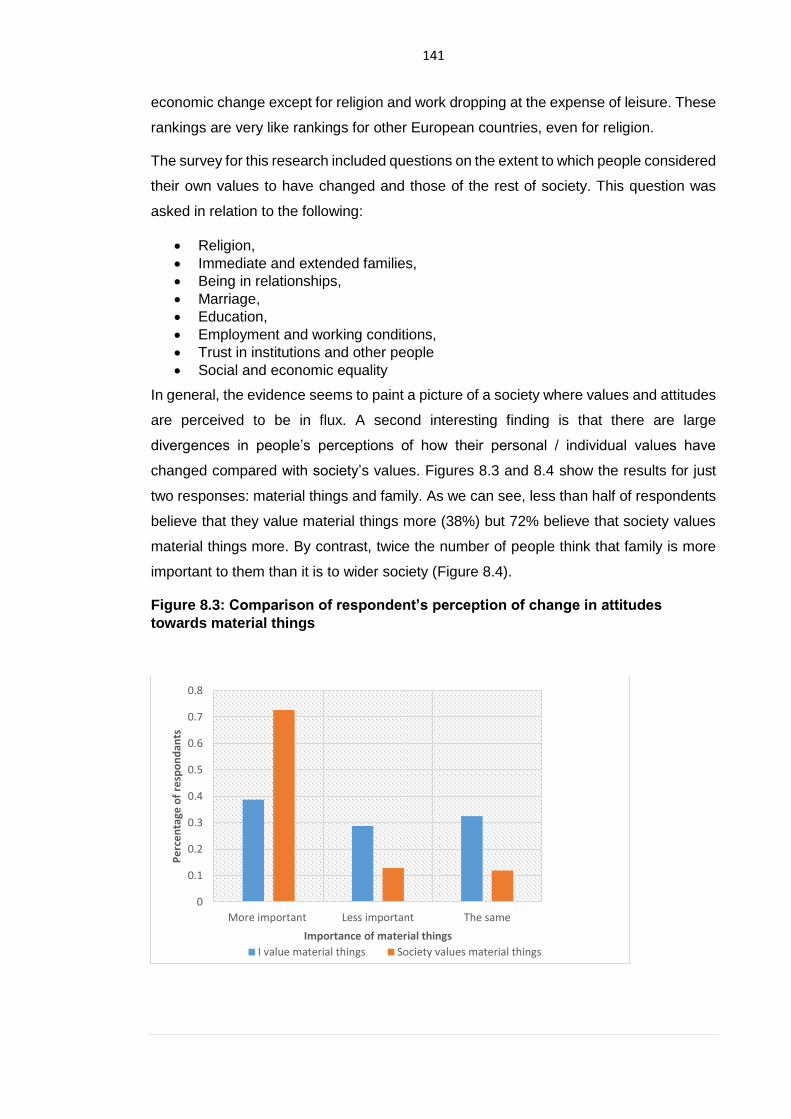
141
economic change except for religion and work dropping at the expense of leisure. These
rankings are very like rankings for other European countries, even for religion.
The survey for this research included questions on the extent to which people considered
their own values to have changed and those of the rest of society. This question was
asked in relation to the following:
• Religion,
• Immediate and extended families,
• Being in relationships,
• Marriage,
• Education,
• Employment and working conditions,
• Trust in institutions and other people
• Social and economic equality
In general, the evidence seems to paint a picture of a society where values and attitudes
are perceived to be in flux. A second interesting finding is that there are large
divergences in people’s perceptions of how their personal / individual values have
changed compared with society’s values. Figures 8.3 and 8.4 show the results for just
two responses: material things and family. As we can see, less than half of respondents
believe that they value material things more (38%) but 72% believe that society values
material things more. By contrast, twice the number of people think that family is more
important to them than it is to wider society (Figure 8.4).
Figure 8.3: Comparison of respondent’s perception of change in attitudes
towards material things
0
0.1
0.2
0.3
0.4
0.5
0.6
0.7
0.8
More important Less important The same
Pe
rce
nta
ge o
f re
spo
nd
ants
Importance of material things
I value material things Society values material things
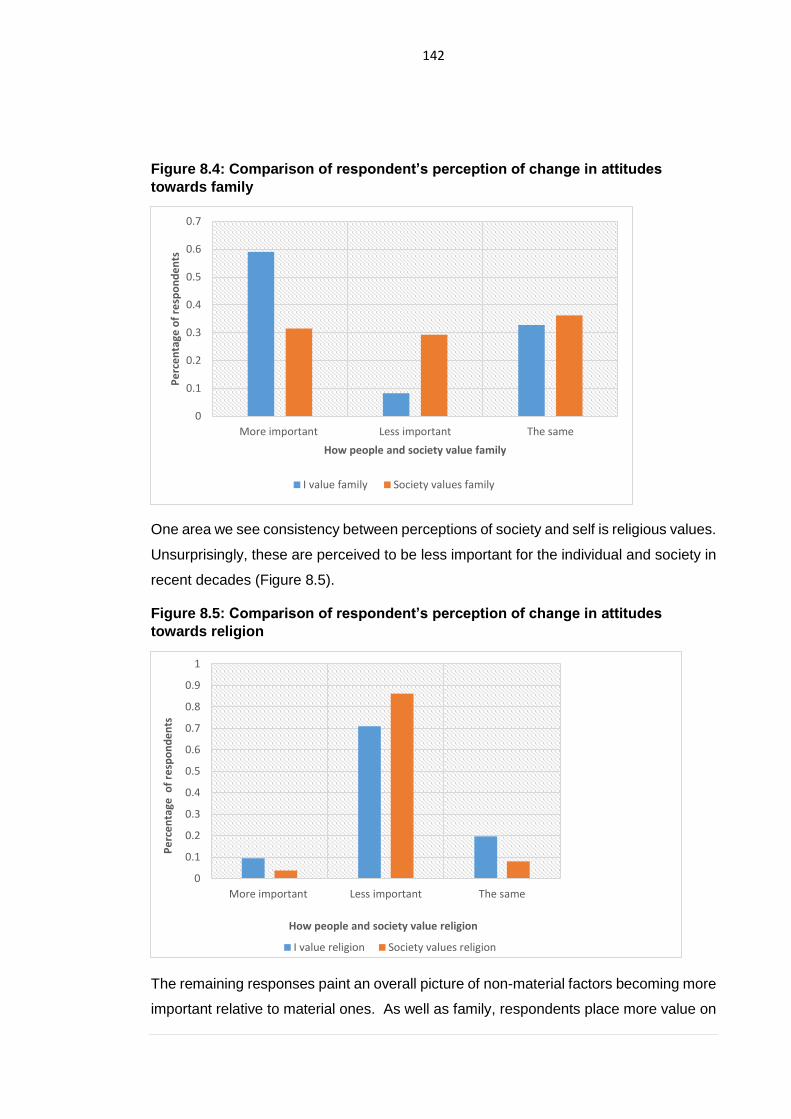
142
Figure 8.4: Comparison of respondent’s perception of change in attitudes
towards family
One area we see consistency between perceptions of society and self is religious values.
Unsurprisingly, these are perceived to be less important for the individual and society in
recent decades (Figure 8.5).
Figure 8.5: Comparison of respondent’s perception of change in attitudes
towards religion
The remaining responses paint an overall picture of non-material factors becoming more
important relative to material ones. As well as family, respondents place more value on
0
0.1
0.2
0.3
0.4
0.5
0.6
0.7
More important Less important The same
Pe
rce
nta
ge o
f re
spo
nd
en
ts
How people and society value family
I value family Society values family
0
0.1
0.2
0.3
0.4
0.5
0.6
0.7
0.8
0.9
1
More important Less important The same
Pe
rce
nta
ge o
f re
spo
nd
en
ts
How people and society value religion
I value religion Society values religion
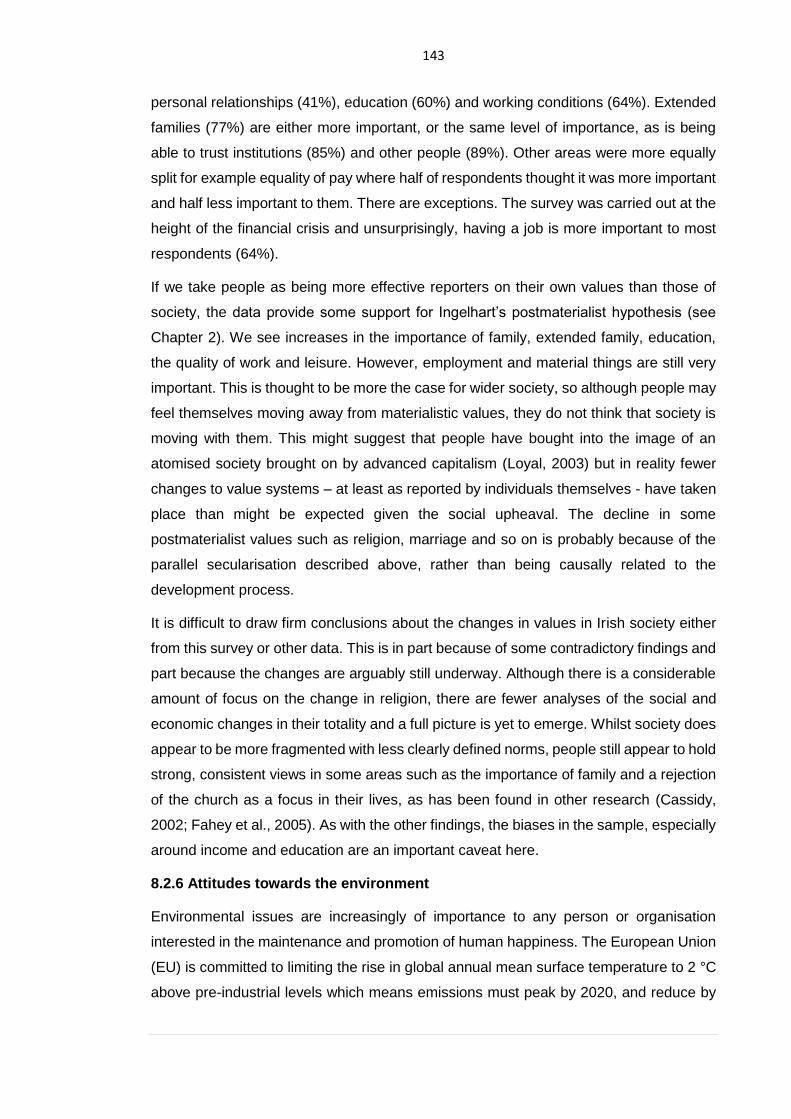
143
personal relationships (41%), education (60%) and working conditions (64%). Extended
families (77%) are either more important, or the same level of importance, as is being
able to trust institutions (85%) and other people (89%). Other areas were more equally
split for example equality of pay where half of respondents thought it was more important
and half less important to them. There are exceptions. The survey was carried out at the
height of the financial crisis and unsurprisingly, having a job is more important to most
respondents (64%).
If we take people as being more effective reporters on their own values than those of
society, the data provide some support for Ingelhart’s postmaterialist hypothesis (see
Chapter 2). We see increases in the importance of family, extended family, education,
the quality of work and leisure. However, employment and material things are still very
important. This is thought to be more the case for wider society, so although people may
feel themselves moving away from materialistic values, they do not think that society is
moving with them. This might suggest that people have bought into the image of an
atomised society brought on by advanced capitalism (Loyal, 2003) but in reality fewer
changes to value systems – at least as reported by individuals themselves - have taken
place than might be expected given the social upheaval. The decline in some
postmaterialist values such as religion, marriage and so on is probably because of the
parallel secularisation described above, rather than being causally related to the
development process.
It is difficult to draw firm conclusions about the changes in values in Irish society either
from this survey or other data. This is in part because of some contradictory findings and
part because the changes are arguably still underway. Although there is a considerable
amount of focus on the change in religion, there are fewer analyses of the social and
economic changes in their totality and a full picture is yet to emerge. Whilst society does
appear to be more fragmented with less clearly defined norms, people still appear to hold
strong, consistent views in some areas such as the importance of family and a rejection
of the church as a focus in their lives, as has been found in other research (Cassidy,
2002; Fahey et al., 2005). As with the other findings, the biases in the sample, especially
around income and education are an important caveat here.
8.2.6 Attitudes towards the environment
Environmental issues are increasingly of importance to any person or organisation
interested in the maintenance and promotion of human happiness. The European Union
(EU) is committed to limiting the rise in global annual mean surface temperature to 2 °C
above pre-industrial levels which means emissions must peak by 2020, and reduce by
144
at least 50% below their 1990 levels by 2050 (Pachauri et al., 2014). The primary EU
policy instrument related to energy and climate change is the Climate and Energy
package. This sets a series of targets to be met by 2020, known as the “20-20-20”
targets. These are a reduction of GHGs to 20% below 1990 levels, 20% of energy to
come from renewables and 20% reduction in primary energy through energy efficiency.
Public opinion on climate change poses a challenge for participative or inclusive
approaches to policy-making, including the setting of goals and priorities. There is not a
lot of comparative data on attitudes towards climate change but a Gallup poll from 2007-
8 found that there was 94% awareness of climate change in Ireland, that 66% believed
it was a result of human activity and 60% that it was a personal threat (Pelham, 2009).
This was the 4th highest in Europe for belief in anthropogenic climate change.
Nonetheless, contrary to what we might expect from a sample of people with
postmaterialist values, the responses to this survey were not suggestive of strong
support for robust environmental policy. Living in an unpolluted environment ranked 21
out of 50 positively phrased questions in the survey. People also ranked living close to
disamenities (e.g. landfill, airports etc.) in the bottom half of the negatively phased
questions. These are the kinds of environmental concerns that people tend to feel most
strongly about (i.e. local environmental impacts as opposed to climate change) yet they
were not very highly valued in comparison to wider social and personal concerns. In
addition, respondents were asked to rank the extent to which governments should be
concerned with 'present and future conditions of the environment' i.e. the extent to which
it should be a policy priority irrespective of personal impact. This did not receive very
strong support either. It was ranked 11 out of 20 and received about half the overall score
of either employment or health. This low level of environmental concern is particularly
notable given the bias in the sample towards more highly educated people who tend to
be most supportive of environmental policies (Cleary and Rhead, 2013).
These results are difficult to interpret but there are a few possible explanations. First,
these results may simply reflect the fact, as has been found elsewhere, that the
environment is not a big concern for people relative to other things (Lorenzoni and
Pidgeon, 2006; Lorenzoni et al., 2007). The survey was conducted at the height of the
recession in 2012/13 when environmental concerns were low on policy agendas
worldwide. Poortinga and Pidgeon (2003) have found that in the context of other, more
immediate or tangible concerns (e.g., health, finances), climate change takes a low
priority. Either way, the data show that respondents do not see environmental issues as
integral to their well-being as other social determinants.
145
8.2.4 Values and demographic factors
Several factors have been identified, which influence people’s attitudes or value-
formation. These include temperament (Roccas et al., 2002), race, gender, family
influence, religion and nationality (Hitlin and Piliavin, 2004). Some of these – nationality
and race - are not relevant here to due to the homogenous nature of the sample. Others
– temperament or family influence were not elicited by the survey. This section looks
therefore at the extent to which the remaining demographic variables - religion and
gender - are related to different types of clusters of attitudes or value-orientations. These
are discussed in the next two sections.
8.2.4.1 Gender and values
An assumption underpinning feminist economics is that the methods, models and
measurement applied in mainstream economics are biased towards masculine
preferences (Ferber and Nelson, 2003). This is epitomised by GDP/GNP measurement,
and many of the wider feminist critiques of economics - normativity, the exclusion of non-
market activity, the impossibility of interpersonal comparisons of utility, the fixed and
exogenous nature of preferences – are also relevant here. This was the subject of Marlyn
Waring’s groundbreaking book If Women Counted (Waring, 1988), in which she argued
that women’s work and the environment were systematically excluded from what counts
as the productive environment.
A central critique of national measures of social value discussed in Chapter 2 is that
unpaid work – domestic labour, child-raising, family life – are absent. Indeed, engaging
in unpaid labour is often treated as an opportunity cost because of foregone productivity.
These also happen to be things that have been traditionally associated with women’s
roles. Waring was critiquing the way in which the things that women traditionally valued
(or were valued for) were not counted and therefore did not count / have weight in policy.
There is a potential tension here for feminists who have long argued for a value to be
placed on traditional female roles, whilst also promoting greater sharing of domestic and
care work and better opportunities for women in the workplace. Feminist economics
resolves this by valuing the contribution made in the private sphere to public life. For
example, by treating children and future generations as a public goods, this has the
potential to raise the status of this type of work and recast parenting as a valued public
service. For this to happen in a meaningful way, it would require counting the unpaid
contribution to ensure that both parents had the flexibility and support to care for their
children, carry out domestic chores and participate in the workforce. This approach has
been more influential in countries such as Norway, which makes greater investments in
146
supporting families and childcare. It is interesting that these investments generally
correlate with high female participation in the workforce, more women in senior roles,
fewer sexist attitudes and high labour productivity (Rønsen and Sundström, 1996).
It does appear that women also value non-financial benefits in work more than men do,
whether they relate to valuing more altruistic types of labour (Eccles, 1994; Konrad et
al., 2000; Marini et al., 1996; Johnson, 2001; Cinamon and Rich, 2002), or opportunities
to combine work and family life. There is a tendency for example for women to forgo
income and career opportunities and accept lower paid jobs, more part-time work and
careers that are compatible with family life (Nieva and Gutek, 1981; Waldfogel, 1997,
1998; Alksnis et al., 2008).
Other research on differences in male and female values has focused on political
orientation and support for socially compassionate policies. This so-called ‘gender
gap’,49 has received most attention in the US, which has seen women voters shift away
from support for conservative, family-values parties in the post-war era towards long-
term and consistent support for left-leaning parties (Inglehart and Norris, 2000; Edlund
and Pande, 2002), and similar trends have been observed in other developed economies
(Abendschön and Steinmetz, 2008). Across Europe, women are less likely to vote for
populist radical right-wing parties (Immerzeel et al. 2015). There is also evidence of a
gender policy gap in the US where women favour policies that are more associated with
the left such as being anti-war and sensitive to humanitarian projects (Eichenberg, 2002),
gun control (Goss, 2010), an end to capital punishment (Boots and Cochran, 2011), and
support for the provision of social protection (Eagly et al., 2004). Female politicians have
been found to support more post-materialist values (Vanderleeuw et al., 2011), and to
be associated with higher levels of spending in areas such as health (Mavisakalyan,
2012). Gender gaps have also been reported in environmental attitudes (Bord and
O’Connor, 1997; Fox and Firebaugh, 1992; Stern et al., 1993; Zelezny et al., 2000),
materialist attitudes, compassion and meaning in life (Beutel and Marini, 1995), intrinsic
values (Schwartz and Rubel, 2005), attitudes towards nuclear power (Solomon et al.,
1989), attitudes towards bribery (Swamy et. al. 2000), attitudes to religion, (Miller and
Hoffmann, 1995; Miller and Stark, 2002; Freese, 2004) altruism, (Simmons and
Emanuele, 2007) and willingness to engage in unethical behaviour (Betz et al., 1989).50
49 A gender gap is the difference between the attitudes, interests, or preferences of men and
women in a given context. 50 These studies are not always conclusive and some studies have not found these relationships
(Rokeach et al, 1973; Struch et al., 2002; Prince-Gibson and Schwartz, 1998).
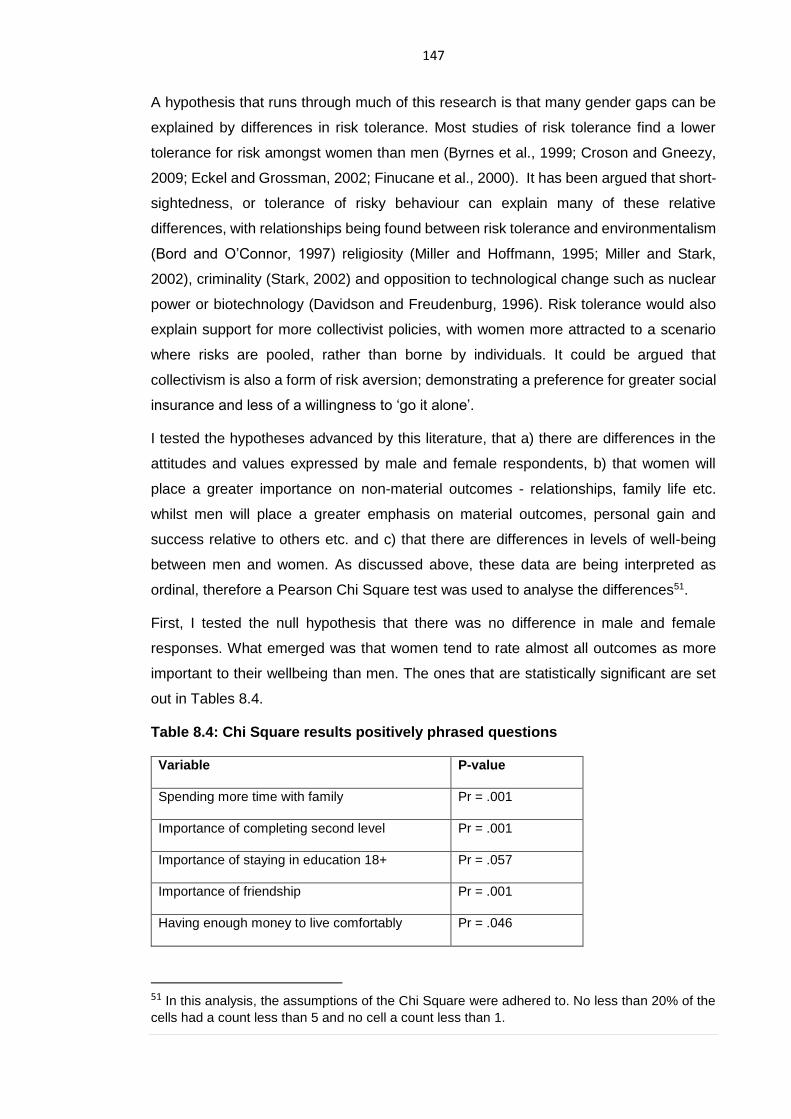
147
A hypothesis that runs through much of this research is that many gender gaps can be
explained by differences in risk tolerance. Most studies of risk tolerance find a lower
tolerance for risk amongst women than men (Byrnes et al., 1999; Croson and Gneezy,
2009; Eckel and Grossman, 2002; Finucane et al., 2000). It has been argued that short-
sightedness, or tolerance of risky behaviour can explain many of these relative
differences, with relationships being found between risk tolerance and environmentalism
(Bord and O’Connor, 1997) religiosity (Miller and Hoffmann, 1995; Miller and Stark,
2002), criminality (Stark, 2002) and opposition to technological change such as nuclear
power or biotechnology (Davidson and Freudenburg, 1996). Risk tolerance would also
explain support for more collectivist policies, with women more attracted to a scenario
where risks are pooled, rather than borne by individuals. It could be argued that
collectivism is also a form of risk aversion; demonstrating a preference for greater social
insurance and less of a willingness to ‘go it alone’.
I tested the hypotheses advanced by this literature, that a) there are differences in the
attitudes and values expressed by male and female respondents, b) that women will
place a greater importance on non-material outcomes - relationships, family life etc.
whilst men will place a greater emphasis on material outcomes, personal gain and
success relative to others etc. and c) that there are differences in levels of well-being
between men and women. As discussed above, these data are being interpreted as
ordinal, therefore a Pearson Chi Square test was used to analyse the differences51.
First, I tested the null hypothesis that there was no difference in male and female
responses. What emerged was that women tend to rate almost all outcomes as more
important to their wellbeing than men. The ones that are statistically significant are set
out in Tables 8.4.
Table 8.4: Chi Square results positively phrased questions
Variable P-value
Spending more time with family Pr = .001
Importance of completing second level Pr = .001
Importance of staying in education 18+ Pr = .057
Importance of friendship Pr = .001
Having enough money to live comfortably Pr = .046
51 In this analysis, the assumptions of the Chi Square were adhered to. No less than 20% of the
cells had a count less than 5 and no cell a count less than 1.
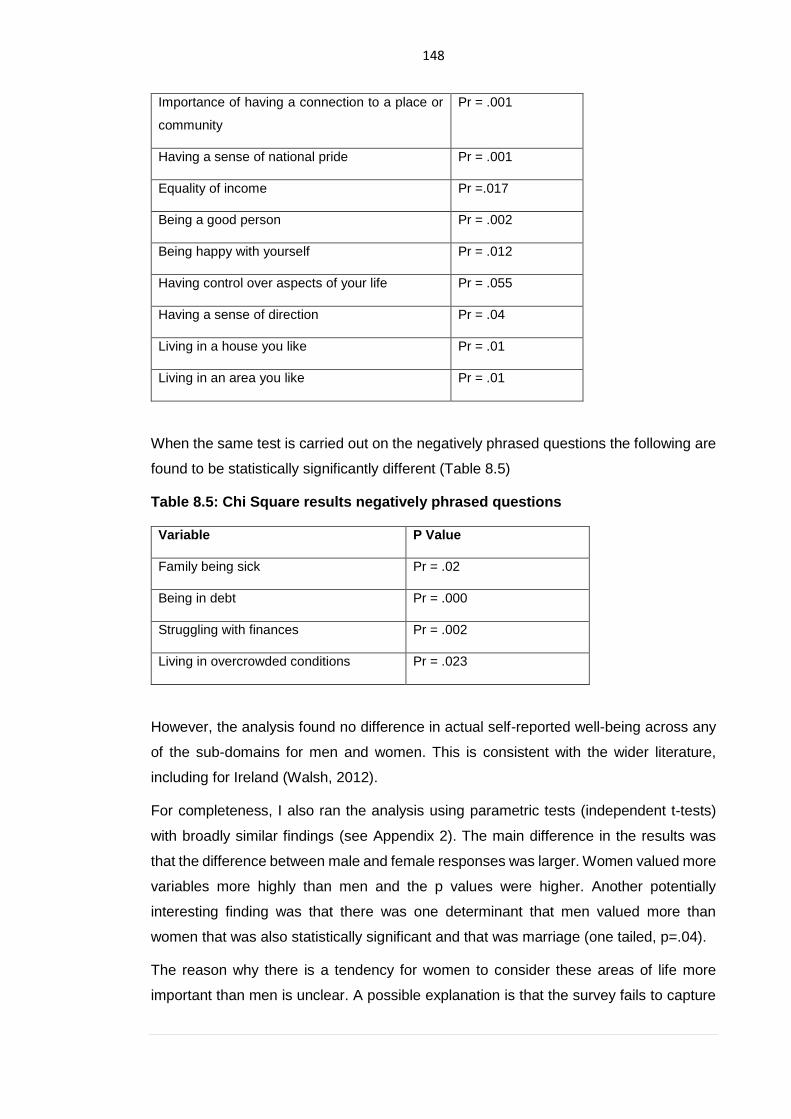
148
Importance of having a connection to a place or
community
Pr = .001
Having a sense of national pride Pr = .001
Equality of income Pr =.017
Being a good person Pr = .002
Being happy with yourself Pr = .012
Having control over aspects of your life Pr = .055
Having a sense of direction Pr = .04
Living in a house you like Pr = .01
Living in an area you like Pr = .01
When the same test is carried out on the negatively phrased questions the following are
found to be statistically significantly different (Table 8.5)
Table 8.5: Chi Square results negatively phrased questions
Variable P Value
Family being sick Pr = .02
Being in debt Pr = .000
Struggling with finances Pr = .002
Living in overcrowded conditions Pr = .023
However, the analysis found no difference in actual self-reported well-being across any
of the sub-domains for men and women. This is consistent with the wider literature,
including for Ireland (Walsh, 2012).
For completeness, I also ran the analysis using parametric tests (independent t-tests)
with broadly similar findings (see Appendix 2). The main difference in the results was
that the difference between male and female responses was larger. Women valued more
variables more highly than men and the p values were higher. Another potentially
interesting finding was that there was one determinant that men valued more than
women that was also statistically significant and that was marriage (one tailed, p=.04).
The reason why there is a tendency for women to consider these areas of life more
important than men is unclear. A possible explanation is that the survey fails to capture
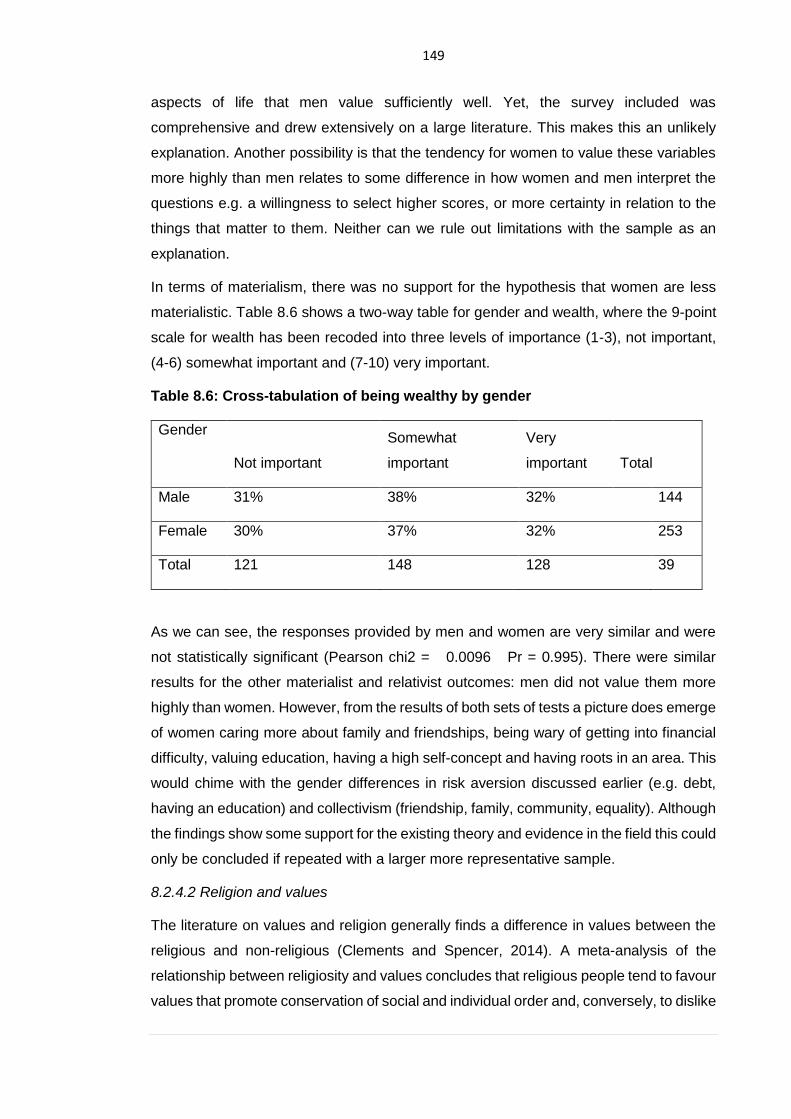
149
aspects of life that men value sufficiently well. Yet, the survey included was
comprehensive and drew extensively on a large literature. This makes this an unlikely
explanation. Another possibility is that the tendency for women to value these variables
more highly than men relates to some difference in how women and men interpret the
questions e.g. a willingness to select higher scores, or more certainty in relation to the
things that matter to them. Neither can we rule out limitations with the sample as an
explanation.
In terms of materialism, there was no support for the hypothesis that women are less
materialistic. Table 8.6 shows a two-way table for gender and wealth, where the 9-point
scale for wealth has been recoded into three levels of importance (1-3), not important,
(4-6) somewhat important and (7-10) very important.
Table 8.6: Cross-tabulation of being wealthy by gender
Gender
Not important
Somewhat
important
Very
important Total
Male 31% 38% 32% 144
Female 30% 37% 32% 253
Total 121 148 128 39
As we can see, the responses provided by men and women are very similar and were
not statistically significant (Pearson chi2 = 0.0096 Pr = 0.995). There were similar
results for the other materialist and relativist outcomes: men did not value them more
highly than women. However, from the results of both sets of tests a picture does emerge
of women caring more about family and friendships, being wary of getting into financial
difficulty, valuing education, having a high self-concept and having roots in an area. This
would chime with the gender differences in risk aversion discussed earlier (e.g. debt,
having an education) and collectivism (friendship, family, community, equality). Although
the findings show some support for the existing theory and evidence in the field this could
only be concluded if repeated with a larger more representative sample.
8.2.4.2 Religion and values
The literature on values and religion generally finds a difference in values between the
religious and non-religious (Clements and Spencer, 2014). A meta-analysis of the
relationship between religiosity and values concludes that religious people tend to favour
values that promote conservation of social and individual order and, conversely, to dislike
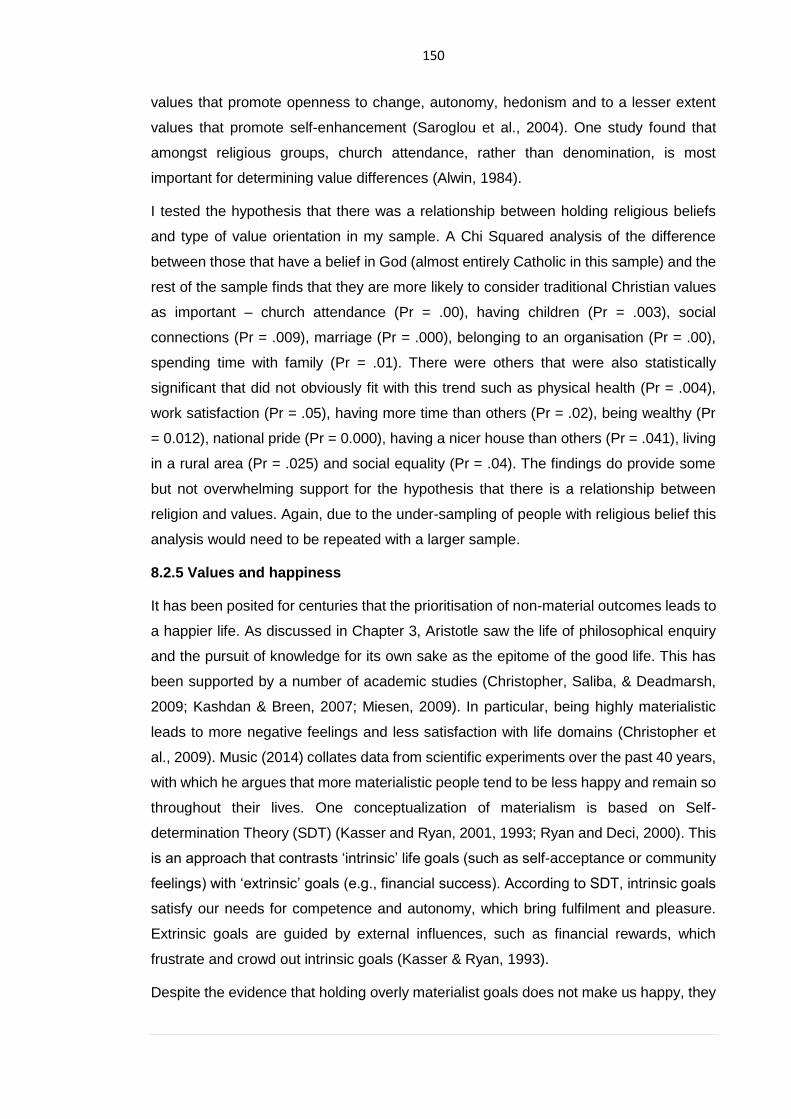
150
values that promote openness to change, autonomy, hedonism and to a lesser extent
values that promote self-enhancement (Saroglou et al., 2004). One study found that
amongst religious groups, church attendance, rather than denomination, is most
important for determining value differences (Alwin, 1984).
I tested the hypothesis that there was a relationship between holding religious beliefs
and type of value orientation in my sample. A Chi Squared analysis of the difference
between those that have a belief in God (almost entirely Catholic in this sample) and the
rest of the sample finds that they are more likely to consider traditional Christian values
as important – church attendance (Pr = .00), having children (Pr = .003), social
connections (Pr = .009), marriage (Pr = .000), belonging to an organisation (Pr = .00),
spending time with family (Pr = .01). There were others that were also statistically
significant that did not obviously fit with this trend such as physical health (Pr = .004),
work satisfaction (Pr = .05), having more time than others (Pr = .02), being wealthy (Pr
= 0.012), national pride (Pr = 0.000), having a nicer house than others (Pr = .041), living
in a rural area (Pr = .025) and social equality (Pr = .04). The findings do provide some
but not overwhelming support for the hypothesis that there is a relationship between
religion and values. Again, due to the under-sampling of people with religious belief this
analysis would need to be repeated with a larger sample.
8.2.5 Values and happiness
It has been posited for centuries that the prioritisation of non-material outcomes leads to
a happier life. As discussed in Chapter 3, Aristotle saw the life of philosophical enquiry
and the pursuit of knowledge for its own sake as the epitome of the good life. This has
been supported by a number of academic studies (Christopher, Saliba, & Deadmarsh,
2009; Kashdan & Breen, 2007; Miesen, 2009). In particular, being highly materialistic
leads to more negative feelings and less satisfaction with life domains (Christopher et
al., 2009). Music (2014) collates data from scientific experiments over the past 40 years,
with which he argues that more materialistic people tend to be less happy and remain so
throughout their lives. One conceptualization of materialism is based on Self-
determination Theory (SDT) (Kasser and Ryan, 2001, 1993; Ryan and Deci, 2000). This
is an approach that contrasts ‘intrinsic’ life goals (such as self-acceptance or community
feelings) with ‘extrinsic’ goals (e.g., financial success). According to SDT, intrinsic goals
satisfy our needs for competence and autonomy, which bring fulfilment and pleasure.
Extrinsic goals are guided by external influences, such as financial rewards, which
frustrate and crowd out intrinsic goals (Kasser & Ryan, 1993).
Despite the evidence that holding overly materialist goals does not make us happy, they
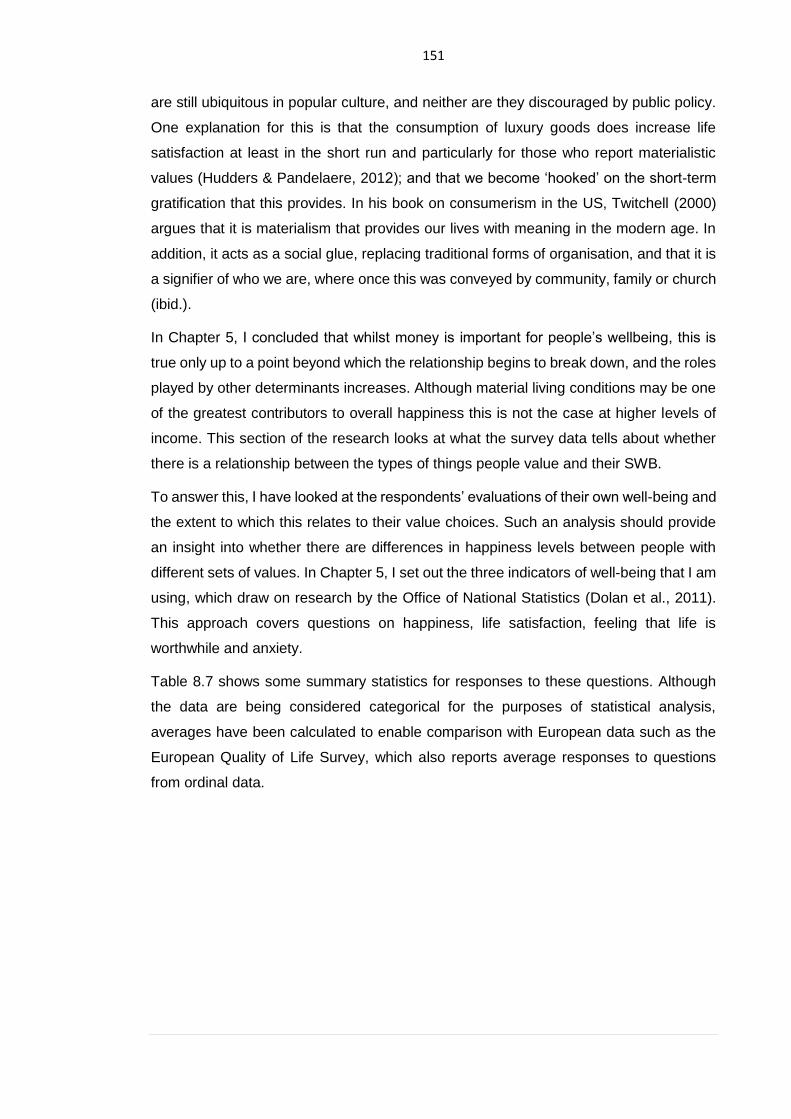
151
are still ubiquitous in popular culture, and neither are they discouraged by public policy.
One explanation for this is that the consumption of luxury goods does increase life
satisfaction at least in the short run and particularly for those who report materialistic
values (Hudders & Pandelaere, 2012); and that we become ‘hooked’ on the short-term
gratification that this provides. In his book on consumerism in the US, Twitchell (2000)
argues that it is materialism that provides our lives with meaning in the modern age. In
addition, it acts as a social glue, replacing traditional forms of organisation, and that it is
a signifier of who we are, where once this was conveyed by community, family or church
(ibid.).
In Chapter 5, I concluded that whilst money is important for people’s wellbeing, this is
true only up to a point beyond which the relationship begins to break down, and the roles
played by other determinants increases. Although material living conditions may be one
of the greatest contributors to overall happiness this is not the case at higher levels of
income. This section of the research looks at what the survey data tells about whether
there is a relationship between the types of things people value and their SWB.
To answer this, I have looked at the respondents’ evaluations of their own well-being and
the extent to which this relates to their value choices. Such an analysis should provide
an insight into whether there are differences in happiness levels between people with
different sets of values. In Chapter 5, I set out the three indicators of well-being that I am
using, which draw on research by the Office of National Statistics (Dolan et al., 2011).
This approach covers questions on happiness, life satisfaction, feeling that life is
worthwhile and anxiety.
Table 8.7 shows some summary statistics for responses to these questions. Although
the data are being considered categorical for the purposes of statistical analysis,
averages have been calculated to enable comparison with European data such as the
European Quality of Life Survey, which also reports average responses to questions
from ordinal data.
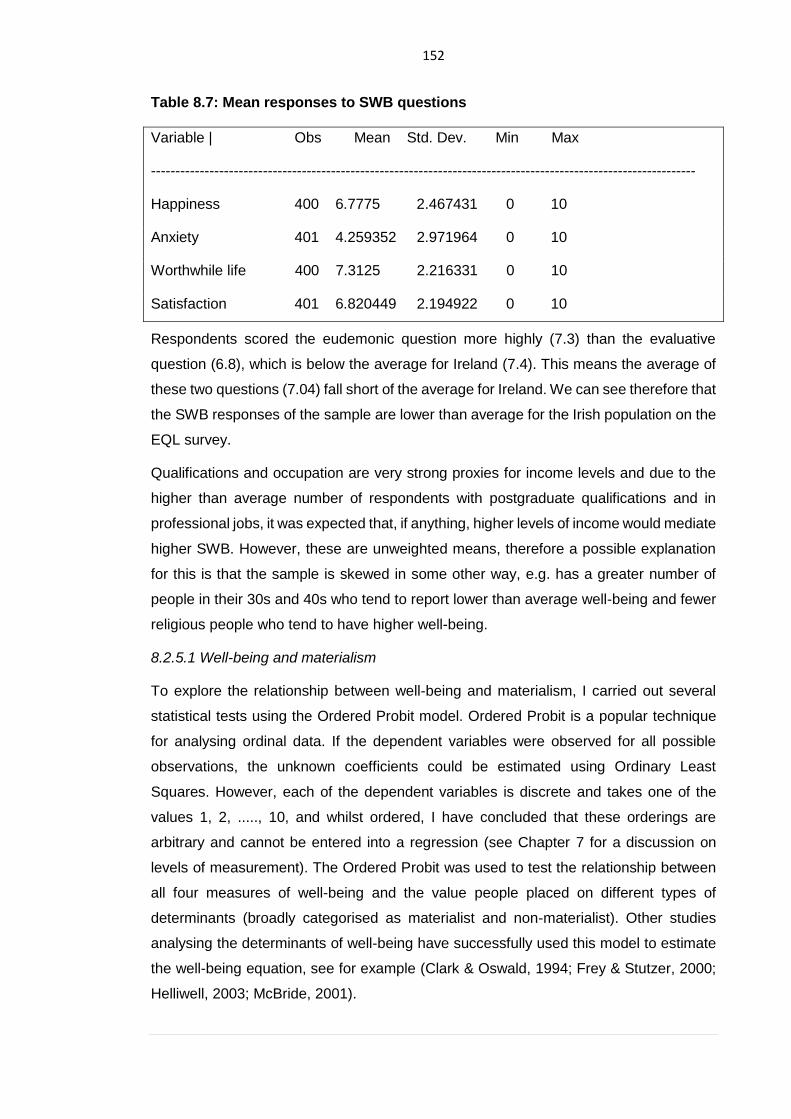
152
Table 8.7: Mean responses to SWB questions
Variable | Obs Mean Std. Dev. Min Max
----------------------------------------------------------------------------------------------------------------
Happiness 400 6.7775 2.467431 0 10
Anxiety 401 4.259352 2.971964 0 10
Worthwhile life 400 7.3125 2.216331 0 10
Satisfaction 401 6.820449 2.194922 0 10
Respondents scored the eudemonic question more highly (7.3) than the evaluative
question (6.8), which is below the average for Ireland (7.4). This means the average of
these two questions (7.04) fall short of the average for Ireland. We can see therefore that
the SWB responses of the sample are lower than average for the Irish population on the
EQL survey.
Qualifications and occupation are very strong proxies for income levels and due to the
higher than average number of respondents with postgraduate qualifications and in
professional jobs, it was expected that, if anything, higher levels of income would mediate
higher SWB. However, these are unweighted means, therefore a possible explanation
for this is that the sample is skewed in some other way, e.g. has a greater number of
people in their 30s and 40s who tend to report lower than average well-being and fewer
religious people who tend to have higher well-being.
8.2.5.1 Well-being and materialism
To explore the relationship between well-being and materialism, I carried out several
statistical tests using the Ordered Probit model. Ordered Probit is a popular technique
for analysing ordinal data. If the dependent variables were observed for all possible
observations, the unknown coefficients could be estimated using Ordinary Least
Squares. However, each of the dependent variables is discrete and takes one of the
values 1, 2, ....., 10, and whilst ordered, I have concluded that these orderings are
arbitrary and cannot be entered into a regression (see Chapter 7 for a discussion on
levels of measurement). The Ordered Probit was used to test the relationship between
all four measures of well-being and the value people placed on different types of
determinants (broadly categorised as materialist and non-materialist). Other studies
analysing the determinants of well-being have successfully used this model to estimate
the well-being equation, see for example (Clark & Oswald, 1994; Frey & Stutzer, 2000;
Helliwell, 2003; McBride, 2001).
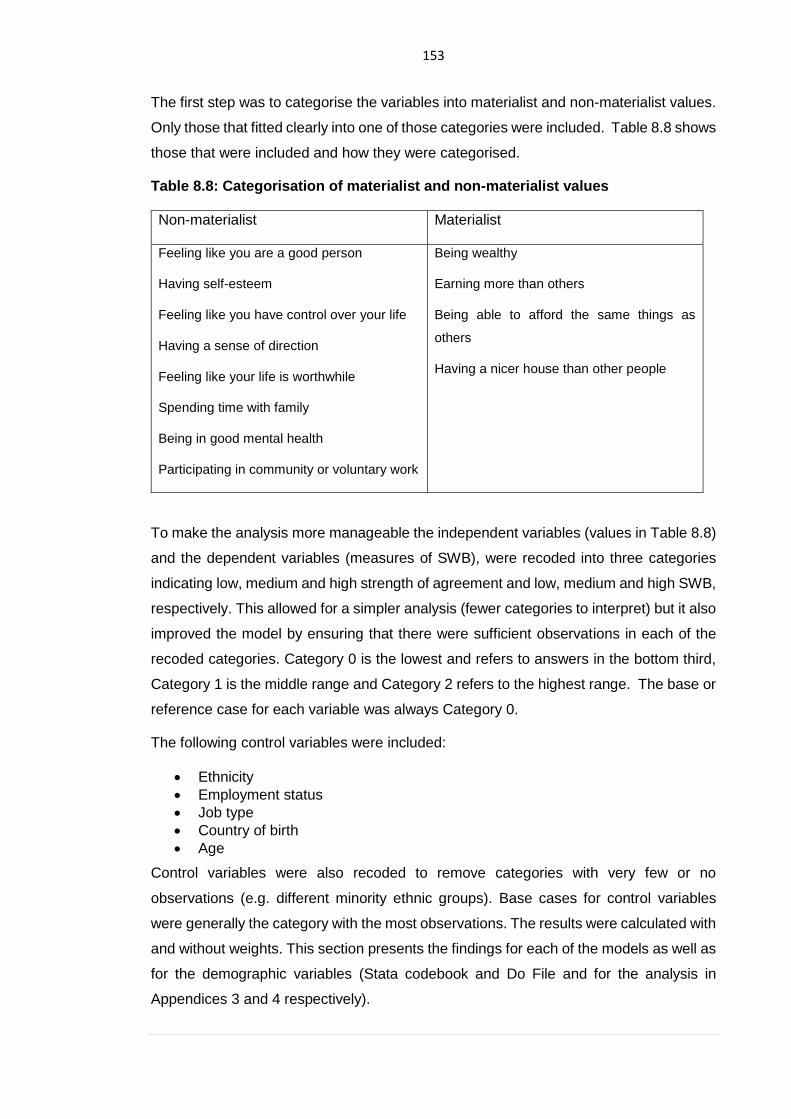
153
The first step was to categorise the variables into materialist and non-materialist values.
Only those that fitted clearly into one of those categories were included. Table 8.8 shows
those that were included and how they were categorised.
Table 8.8: Categorisation of materialist and non-materialist values
Non-materialist Materialist
Feeling like you are a good person
Having self-esteem
Feeling like you have control over your life
Having a sense of direction
Feeling like your life is worthwhile
Spending time with family
Being in good mental health
Participating in community or voluntary work
Being wealthy
Earning more than others
Being able to afford the same things as
others
Having a nicer house than other people
To make the analysis more manageable the independent variables (values in Table 8.8)
and the dependent variables (measures of SWB), were recoded into three categories
indicating low, medium and high strength of agreement and low, medium and high SWB,
respectively. This allowed for a simpler analysis (fewer categories to interpret) but it also
improved the model by ensuring that there were sufficient observations in each of the
recoded categories. Category 0 is the lowest and refers to answers in the bottom third,
Category 1 is the middle range and Category 2 refers to the highest range. The base or
reference case for each variable was always Category 0.
The following control variables were included:
• Ethnicity
• Employment status
• Job type
• Country of birth
• Age
Control variables were also recoded to remove categories with very few or no
observations (e.g. different minority ethnic groups). Base cases for control variables
were generally the category with the most observations. The results were calculated with
and without weights. This section presents the findings for each of the models as well as
for the demographic variables (Stata codebook and Do File and for the analysis in
Appendices 3 and 4 respectively).
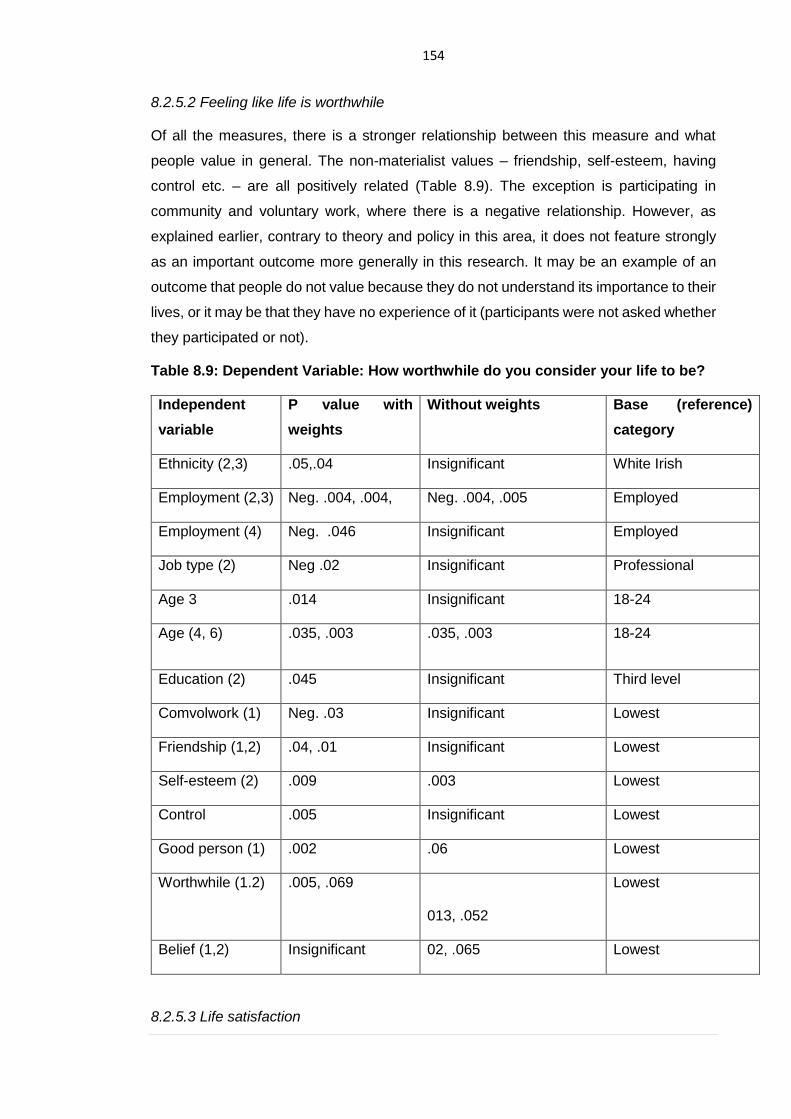
154
8.2.5.2 Feeling like life is worthwhile
Of all the measures, there is a stronger relationship between this measure and what
people value in general. The non-materialist values – friendship, self-esteem, having
control etc. – are all positively related (Table 8.9). The exception is participating in
community and voluntary work, where there is a negative relationship. However, as
explained earlier, contrary to theory and policy in this area, it does not feature strongly
as an important outcome more generally in this research. It may be an example of an
outcome that people do not value because they do not understand its importance to their
lives, or it may be that they have no experience of it (participants were not asked whether
they participated or not).
Table 8.9: Dependent Variable: How worthwhile do you consider your life to be?
Independent
variable
P value with
weights
Without weights Base (reference)
category
Ethnicity (2,3) .05,.04 Insignificant White Irish
Employment (2,3) Neg. .004, .004, Neg. .004, .005 Employed
Employment (4) Neg. .046 Insignificant Employed
Job type (2) Neg .02 Insignificant Professional
Age 3 .014 Insignificant 18-24
Age (4, 6) .035, .003 .035, .003 18-24
Education (2) .045 Insignificant Third level
Comvolwork (1) Neg. .03 Insignificant Lowest
Friendship (1,2) .04, .01 Insignificant Lowest
Self-esteem (2) .009 .003 Lowest
Control .005 Insignificant Lowest
Good person (1) .002 .06 Lowest
Worthwhile (1.2) .005, .069
013, .052
Lowest
Belief (1,2) Insignificant 02, .065 Lowest
8.2.5.3 Life satisfaction
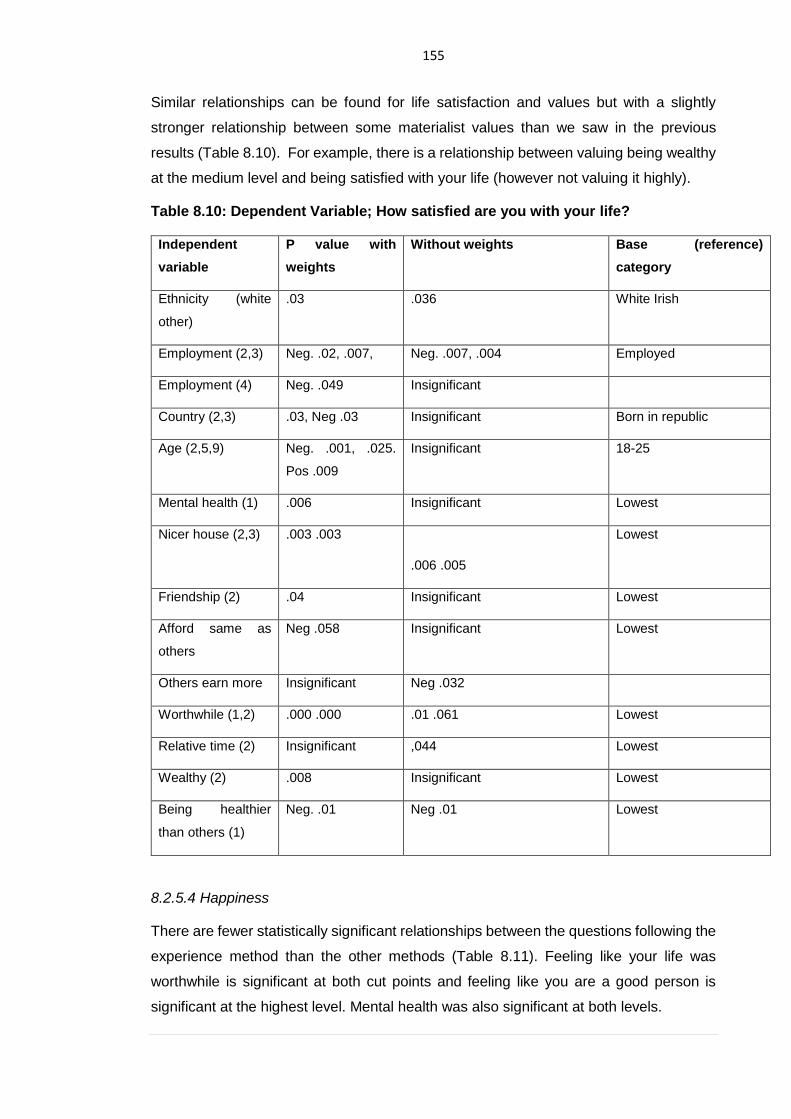
155
Similar relationships can be found for life satisfaction and values but with a slightly
stronger relationship between some materialist values than we saw in the previous
results (Table 8.10). For example, there is a relationship between valuing being wealthy
at the medium level and being satisfied with your life (however not valuing it highly).
Table 8.10: Dependent Variable; How satisfied are you with your life?
Independent
variable
P value with
weights
Without weights Base (reference)
category
Ethnicity (white
other)
.03 .036 White Irish
Employment (2,3) Neg. .02, .007, Neg. .007, .004 Employed
Employment (4) Neg. .049 Insignificant
Country (2,3) .03, Neg .03 Insignificant Born in republic
Age (2,5,9) Neg. .001, .025.
Pos .009
Insignificant 18-25
Mental health (1) .006 Insignificant Lowest
Nicer house (2,3) .003 .003
.006 .005
Lowest
Friendship (2) .04 Insignificant Lowest
Afford same as
others
Neg .058 Insignificant Lowest
Others earn more Insignificant Neg .032
Worthwhile (1,2) .000 .000 .01 .061 Lowest
Relative time (2) Insignificant ,044 Lowest
Wealthy (2) .008 Insignificant Lowest
Being healthier
than others (1)
Neg. .01 Neg .01 Lowest
8.2.5.4 Happiness
There are fewer statistically significant relationships between the questions following the
experience method than the other methods (Table 8.11). Feeling like your life was
worthwhile is significant at both cut points and feeling like you are a good person is
significant at the highest level. Mental health was also significant at both levels.
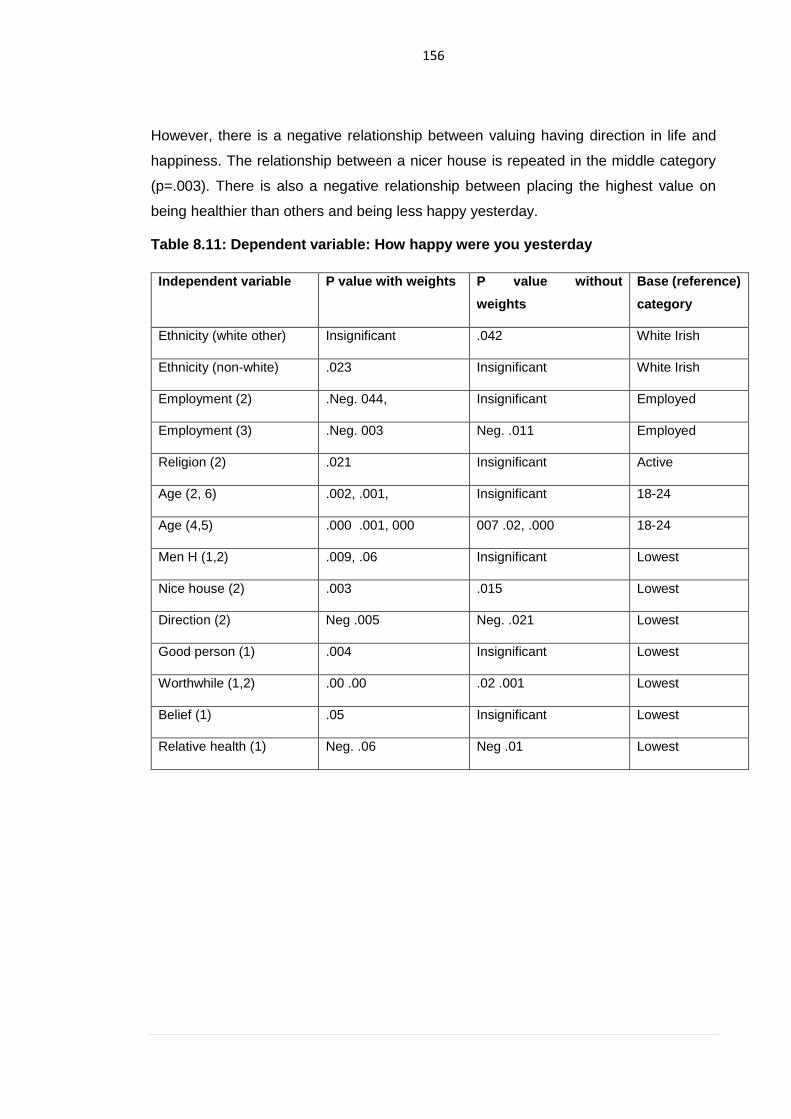
156
However, there is a negative relationship between valuing having direction in life and
happiness. The relationship between a nicer house is repeated in the middle category
(p=.003). There is also a negative relationship between placing the highest value on
being healthier than others and being less happy yesterday.
Table 8.11: Dependent variable: How happy were you yesterday
Independent variable P value with weights P value without
weights
Base (reference)
category
Ethnicity (white other) Insignificant .042 White Irish
Ethnicity (non-white) .023 Insignificant White Irish
Employment (2) .Neg. 044, Insignificant Employed
Employment (3) .Neg. 003 Neg. .011 Employed
Religion (2) .021 Insignificant Active
Age (2, 6) .002, .001, Insignificant 18-24
Age (4,5) .000 .001, 000 007 .02, .000 18-24
Men H (1,2) .009, .06 Insignificant Lowest
Nice house (2) .003 .015 Lowest
Direction (2) Neg .005 Neg. .021 Lowest
Good person (1) .004 Insignificant Lowest
Worthwhile (1,2) .00 .00 .02 .001 Lowest
Belief (1) .05 Insignificant Lowest
Relative health (1) Neg. .06 Neg .01 Lowest
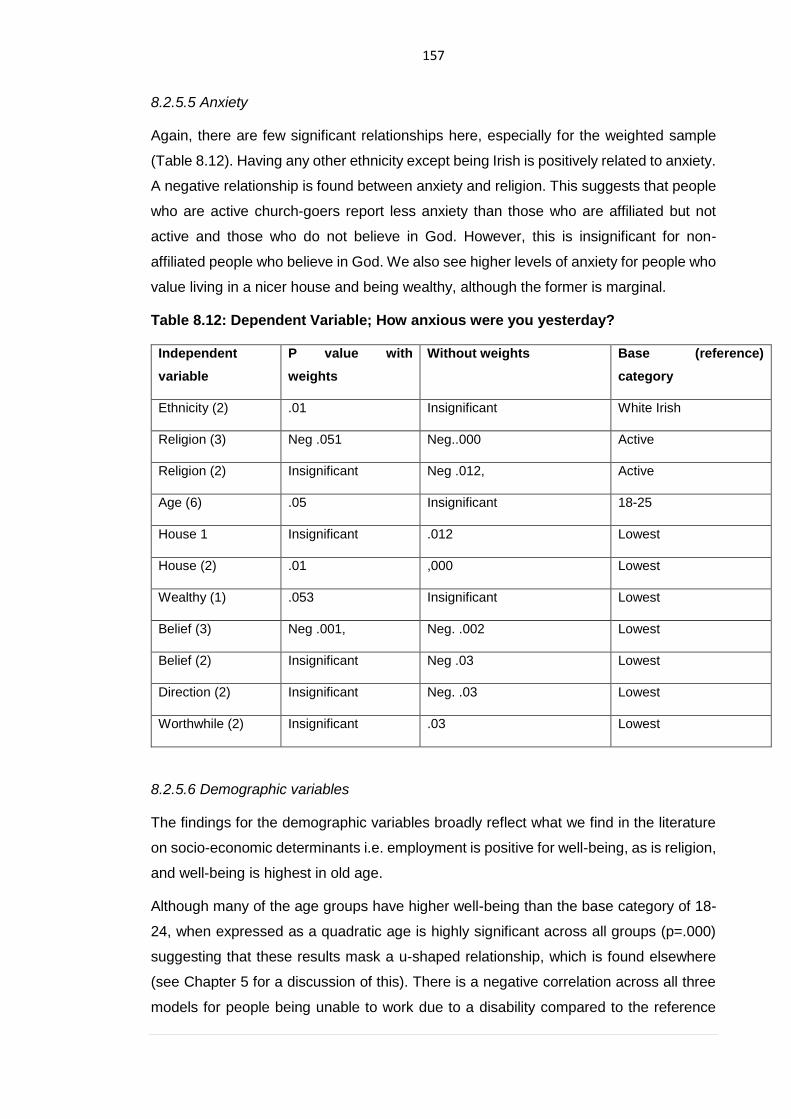
157
8.2.5.5 Anxiety
Again, there are few significant relationships here, especially for the weighted sample
(Table 8.12). Having any other ethnicity except being Irish is positively related to anxiety.
A negative relationship is found between anxiety and religion. This suggests that people
who are active church-goers report less anxiety than those who are affiliated but not
active and those who do not believe in God. However, this is insignificant for non-
affiliated people who believe in God. We also see higher levels of anxiety for people who
value living in a nicer house and being wealthy, although the former is marginal.
Table 8.12: Dependent Variable; How anxious were you yesterday?
Independent
variable
P value with
weights
Without weights Base (reference)
category
Ethnicity (2) .01 Insignificant White Irish
Religion (3) Neg .051 Neg..000 Active
Religion (2) Insignificant Neg .012, Active
Age (6) .05 Insignificant 18-25
House 1 Insignificant .012 Lowest
House (2) .01 ,000 Lowest
Wealthy (1) .053 Insignificant Lowest
Belief (3) Neg .001, Neg. .002 Lowest
Belief (2) Insignificant Neg .03 Lowest
Direction (2) Insignificant Neg. .03 Lowest
Worthwhile (2) Insignificant .03 Lowest
8.2.5.6 Demographic variables
The findings for the demographic variables broadly reflect what we find in the literature
on socio-economic determinants i.e. employment is positive for well-being, as is religion,
and well-being is highest in old age.
Although many of the age groups have higher well-being than the base category of 18-
24, when expressed as a quadratic age is highly significant across all groups (p=.000)
suggesting that these results mask a u-shaped relationship, which is found elsewhere
(see Chapter 5 for a discussion of this). There is a negative correlation across all three
models for people being unable to work due to a disability compared to the reference
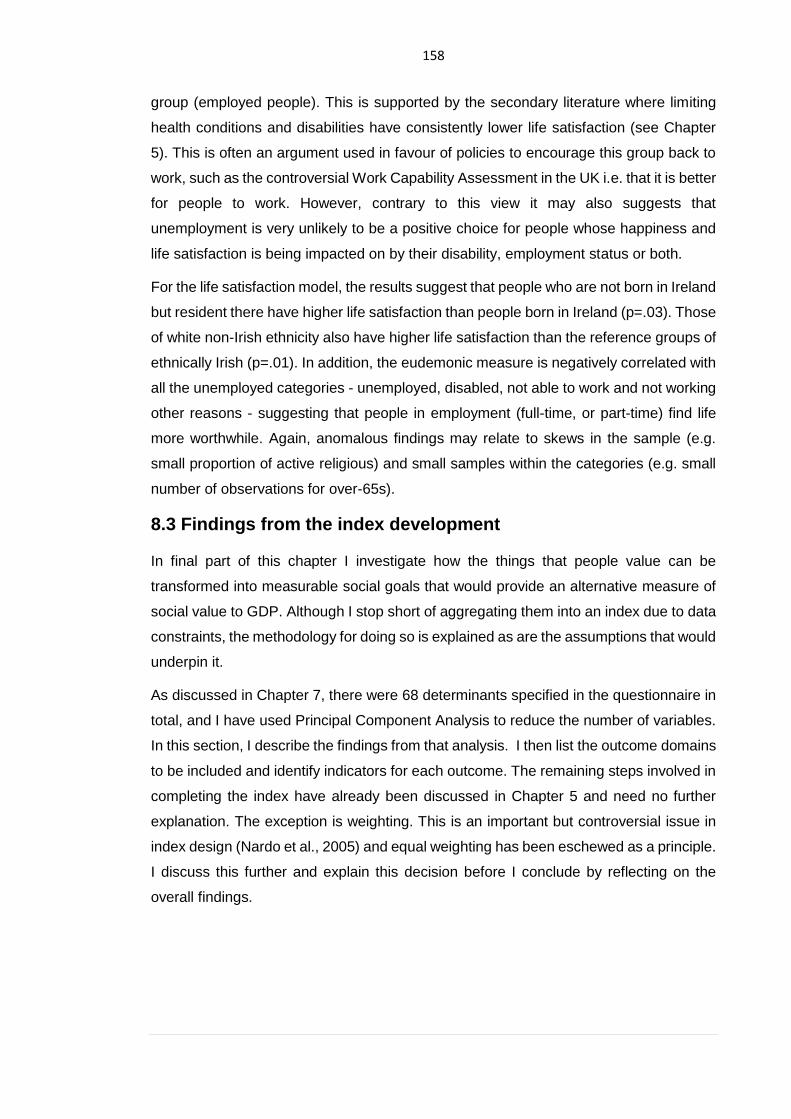
158
group (employed people). This is supported by the secondary literature where limiting
health conditions and disabilities have consistently lower life satisfaction (see Chapter
5). This is often an argument used in favour of policies to encourage this group back to
work, such as the controversial Work Capability Assessment in the UK i.e. that it is better
for people to work. However, contrary to this view it may also suggests that
unemployment is very unlikely to be a positive choice for people whose happiness and
life satisfaction is being impacted on by their disability, employment status or both.
For the life satisfaction model, the results suggest that people who are not born in Ireland
but resident there have higher life satisfaction than people born in Ireland (p=.03). Those
of white non-Irish ethnicity also have higher life satisfaction than the reference groups of
ethnically Irish (p=.01). In addition, the eudemonic measure is negatively correlated with
all the unemployed categories - unemployed, disabled, not able to work and not working
other reasons - suggesting that people in employment (full-time, or part-time) find life
more worthwhile. Again, anomalous findings may relate to skews in the sample (e.g.
small proportion of active religious) and small samples within the categories (e.g. small
number of observations for over-65s).
8.3 Findings from the index development
In final part of this chapter I investigate how the things that people value can be
transformed into measurable social goals that would provide an alternative measure of
social value to GDP. Although I stop short of aggregating them into an index due to data
constraints, the methodology for doing so is explained as are the assumptions that would
underpin it.
As discussed in Chapter 7, there were 68 determinants specified in the questionnaire in
total, and I have used Principal Component Analysis to reduce the number of variables.
In this section, I describe the findings from that analysis. I then list the outcome domains
to be included and identify indicators for each outcome. The remaining steps involved in
completing the index have already been discussed in Chapter 5 and need no further
explanation. The exception is weighting. This is an important but controversial issue in
index design (Nardo et al., 2005) and equal weighting has been eschewed as a principle.
I discuss this further and explain this decision before I conclude by reflecting on the
overall findings.
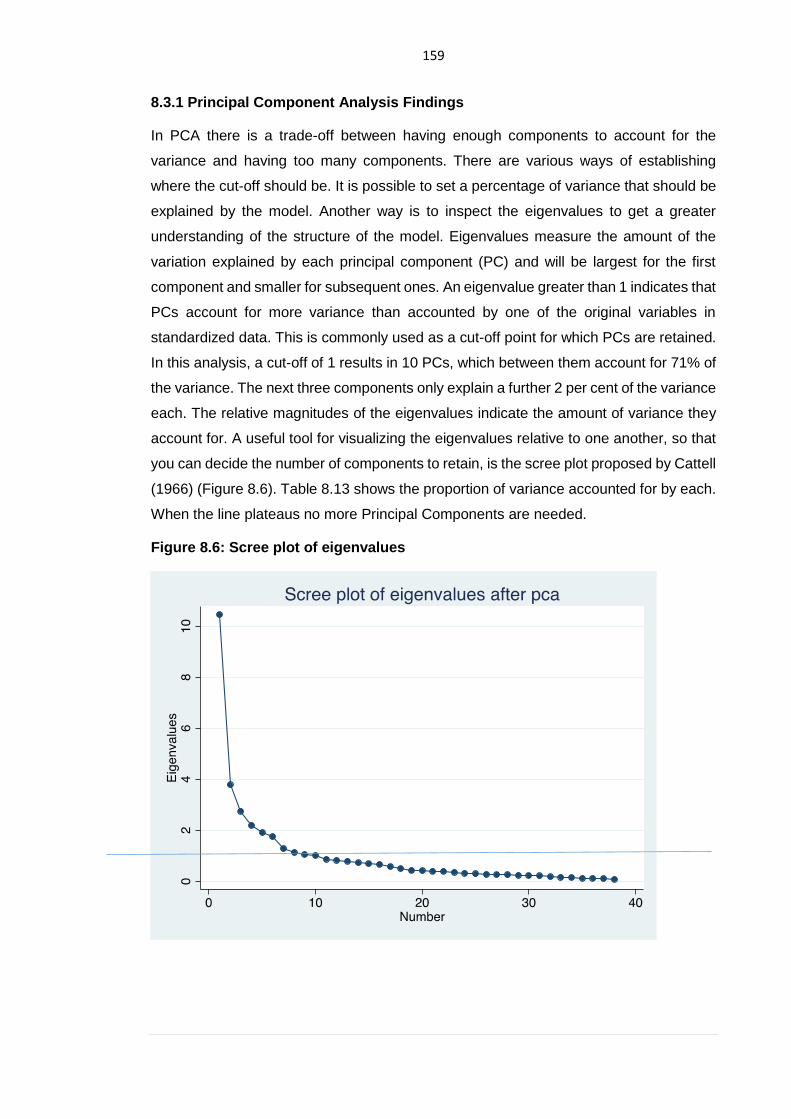
159
8.3.1 Principal Component Analysis Findings
In PCA there is a trade-off between having enough components to account for the
variance and having too many components. There are various ways of establishing
where the cut-off should be. It is possible to set a percentage of variance that should be
explained by the model. Another way is to inspect the eigenvalues to get a greater
understanding of the structure of the model. Eigenvalues measure the amount of the
variation explained by each principal component (PC) and will be largest for the first
component and smaller for subsequent ones. An eigenvalue greater than 1 indicates that
PCs account for more variance than accounted by one of the original variables in
standardized data. This is commonly used as a cut-off point for which PCs are retained.
In this analysis, a cut-off of 1 results in 10 PCs, which between them account for 71% of
the variance. The next three components only explain a further 2 per cent of the variance
each. The relative magnitudes of the eigenvalues indicate the amount of variance they
account for. A useful tool for visualizing the eigenvalues relative to one another, so that
you can decide the number of components to retain, is the scree plot proposed by Cattell
(1966) (Figure 8.6). Table 8.13 shows the proportion of variance accounted for by each.
When the line plateaus no more Principal Components are needed.
Figure 8.6: Scree plot of eigenvalues
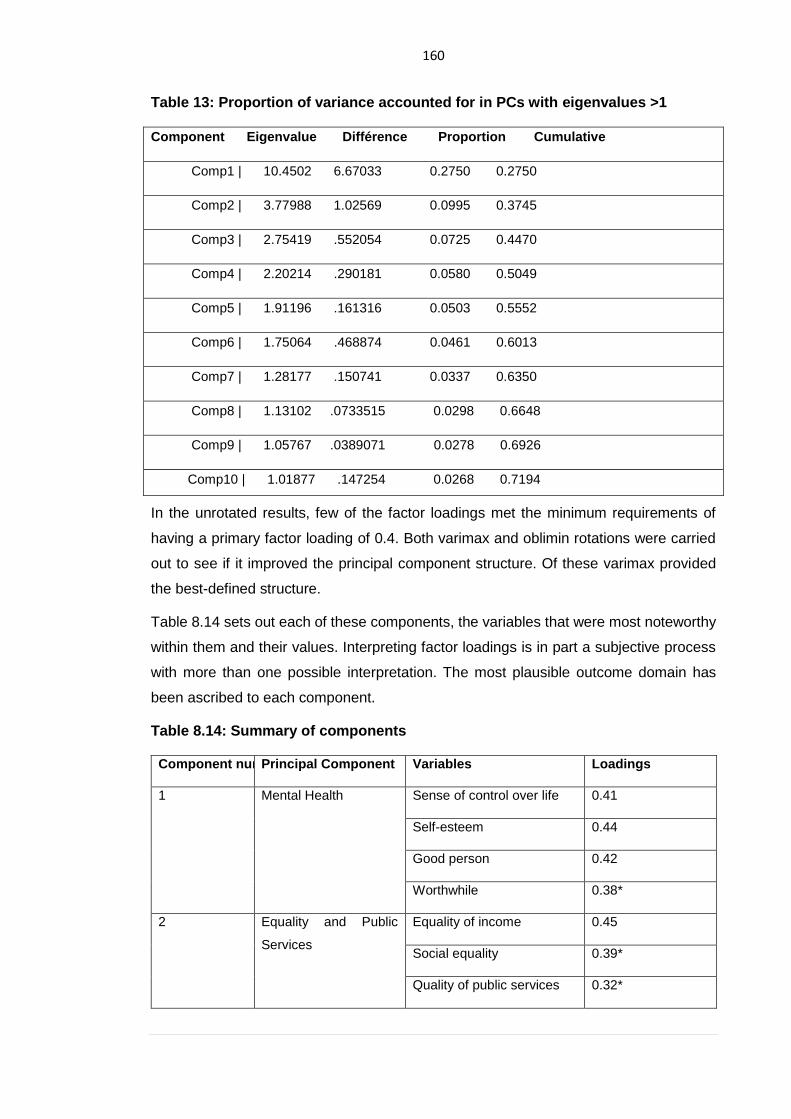
160
Table 13: Proportion of variance accounted for in PCs with eigenvalues >1
Component Eigenvalue Différence Proportion Cumulative
Comp1 | 10.4502 6.67033 0.2750 0.2750
Comp2 | 3.77988 1.02569 0.0995 0.3745
Comp3 | 2.75419 .552054 0.0725 0.4470
Comp4 | 2.20214 .290181 0.0580 0.5049
Comp5 | 1.91196 .161316 0.0503 0.5552
Comp6 | 1.75064 .468874 0.0461 0.6013
Comp7 | 1.28177 .150741 0.0337 0.6350
Comp8 | 1.13102 .0733515 0.0298 0.6648
Comp9 | 1.05767 .0389071 0.0278 0.6926
Comp10 | 1.01877 .147254 0.0268 0.7194
In the unrotated results, few of the factor loadings met the minimum requirements of
having a primary factor loading of 0.4. Both varimax and oblimin rotations were carried
out to see if it improved the principal component structure. Of these varimax provided
the best-defined structure.
Table 8.14 sets out each of these components, the variables that were most noteworthy
within them and their values. Interpreting factor loadings is in part a subjective process
with more than one possible interpretation. The most plausible outcome domain has
been ascribed to each component.
Table 8.14: Summary of components
Component number Principal Component Variables Loadings
1 Mental Health Sense of control over life 0.41
Self-esteem 0.44
Good person 0.42
Worthwhile 0.38*
2 Equality and Public
Services
Equality of income 0.45
Social equality 0.39*
Quality of public services 0.32*
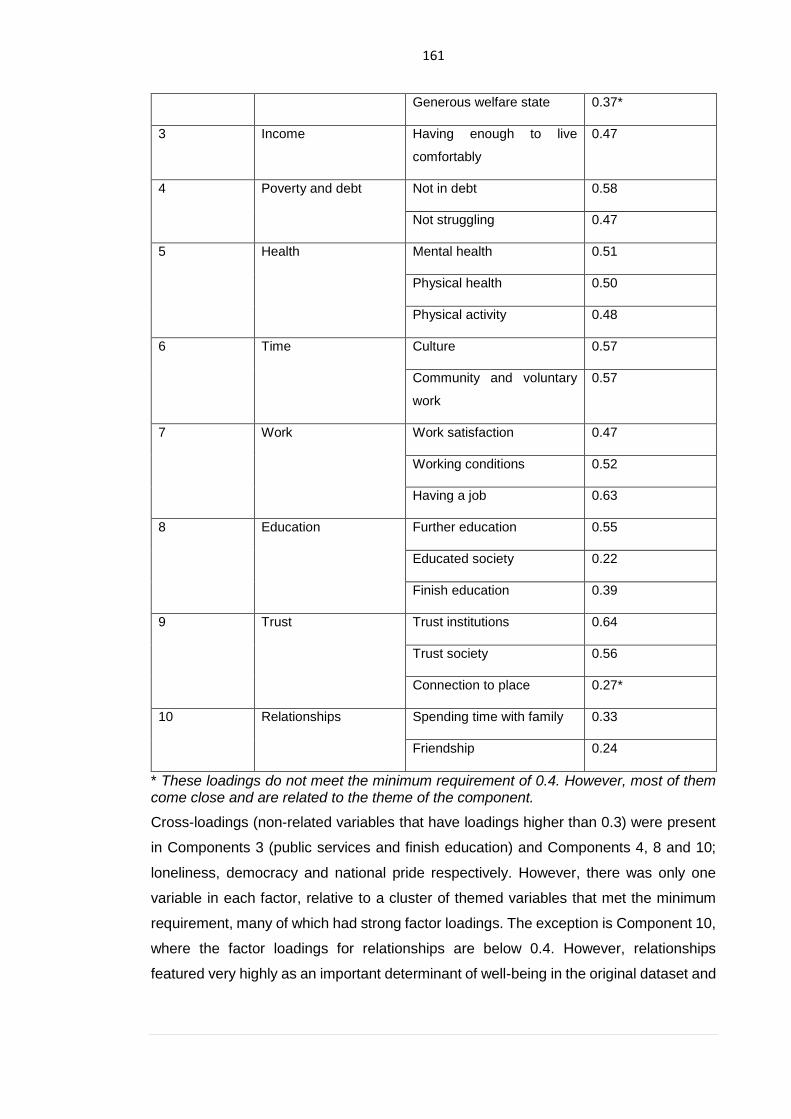
161
Generous welfare state 0.37*
3 Income Having enough to live
comfortably
0.47
4 Poverty and debt Not in debt 0.58
Not struggling 0.47
5 Health Mental health 0.51
Physical health 0.50
Physical activity 0.48
6 Time Culture 0.57
Community and voluntary
work
0.57
7 Work Work satisfaction 0.47
Working conditions 0.52
Having a job 0.63
8 Education Further education 0.55
Educated society 0.22
Finish education 0.39
9 Trust Trust institutions 0.64
Trust society 0.56
Connection to place 0.27*
10 Relationships Spending time with family 0.33
Friendship 0.24
* These loadings do not meet the minimum requirement of 0.4. However, most of them come close and are related to the theme of the component.
Cross-loadings (non-related variables that have loadings higher than 0.3) were present
in Components 3 (public services and finish education) and Components 4, 8 and 10;
loneliness, democracy and national pride respectively. However, there was only one
variable in each factor, relative to a cluster of themed variables that met the minimum
requirement, many of which had strong factor loadings. The exception is Component 10,
where the factor loadings for relationships are below 0.4. However, relationships
featured very highly as an important determinant of well-being in the original dataset and
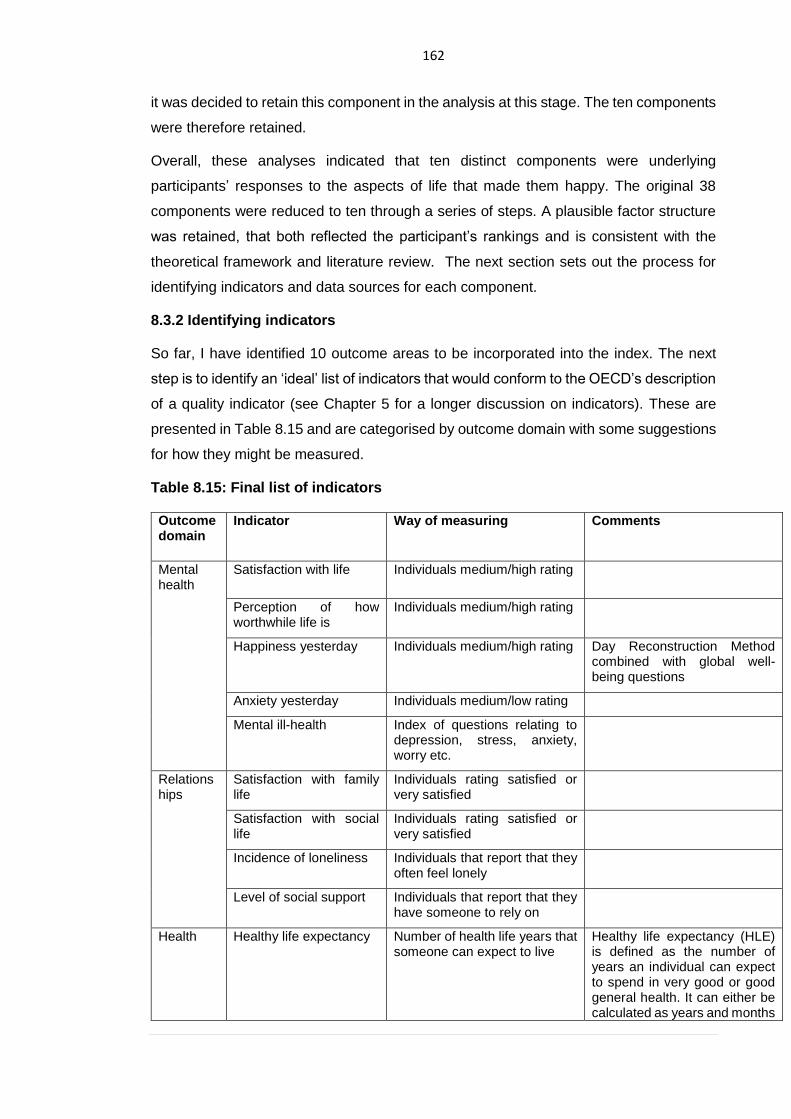
162
it was decided to retain this component in the analysis at this stage. The ten components
were therefore retained.
Overall, these analyses indicated that ten distinct components were underlying
participants’ responses to the aspects of life that made them happy. The original 38
components were reduced to ten through a series of steps. A plausible factor structure
was retained, that both reflected the participant’s rankings and is consistent with the
theoretical framework and literature review. The next section sets out the process for
identifying indicators and data sources for each component.
8.3.2 Identifying indicators
So far, I have identified 10 outcome areas to be incorporated into the index. The next
step is to identify an ‘ideal’ list of indicators that would conform to the OECD’s description
of a quality indicator (see Chapter 5 for a longer discussion on indicators). These are
presented in Table 8.15 and are categorised by outcome domain with some suggestions
for how they might be measured.
Table 8.15: Final list of indicators
Outcome domain
Indicator Way of measuring Comments
Mental health
Satisfaction with life Individuals medium/high rating
Perception of how worthwhile life is
Individuals medium/high rating
Happiness yesterday Individuals medium/high rating Day Reconstruction Method combined with global well-being questions
Anxiety yesterday Individuals medium/low rating
Mental ill-health Index of questions relating to depression, stress, anxiety, worry etc.
Relationships
Satisfaction with family life
Individuals rating satisfied or very satisfied
Satisfaction with social life
Individuals rating satisfied or very satisfied
Incidence of loneliness Individuals that report that they often feel lonely
Level of social support Individuals that report that they have someone to rely on
Health Healthy life expectancy Number of health life years that someone can expect to live
Healthy life expectancy (HLE) is defined as the number of years an individual can expect to spend in very good or good general health. It can either be calculated as years and months
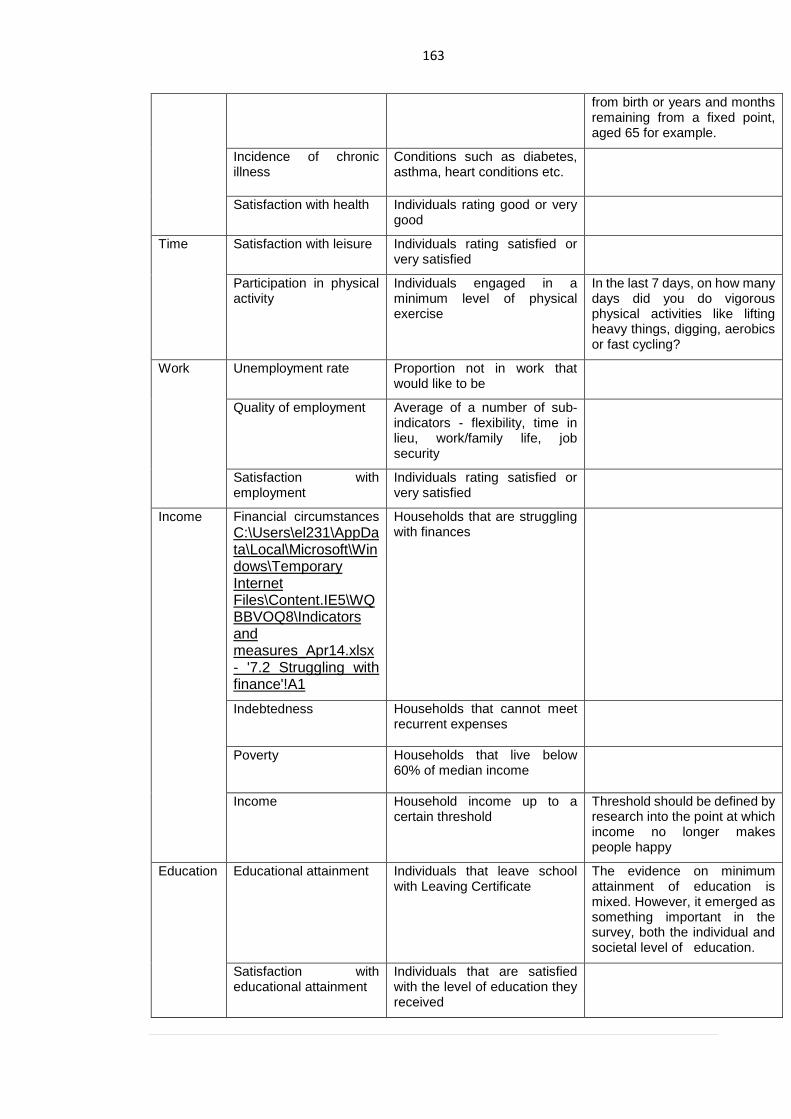
163
from birth or years and months remaining from a fixed point, aged 65 for example.
Incidence of chronic illness
Conditions such as diabetes, asthma, heart conditions etc.
Satisfaction with health Individuals rating good or very good
Time Satisfaction with leisure Individuals rating satisfied or very satisfied
Participation in physical activity
Individuals engaged in a minimum level of physical exercise
In the last 7 days, on how many days did you do vigorous physical activities like lifting heavy things, digging, aerobics or fast cycling?
Work Unemployment rate Proportion not in work that would like to be
Quality of employment Average of a number of sub-indicators - flexibility, time in lieu, work/family life, job security
Satisfaction with employment
Individuals rating satisfied or very satisfied
Income Financial circumstances
C:\Users\el231\AppData\Local\Microsoft\Windows\Temporary Internet Files\Content.IE5\WQBBVOQ8\Indicators and measures_Apr14.xlsx - '7.2 Struggling with finance'!A1
Households that are struggling with finances
Indebtedness Households that cannot meet recurrent expenses
Poverty Households that live below 60% of median income
Income Household income up to a certain threshold
Threshold should be defined by research into the point at which income no longer makes people happy
Education Educational attainment Individuals that leave school with Leaving Certificate
The evidence on minimum attainment of education is mixed. However, it emerged as something important in the survey, both the individual and societal level of education.
Satisfaction with educational attainment
Individuals that are satisfied with the level of education they received
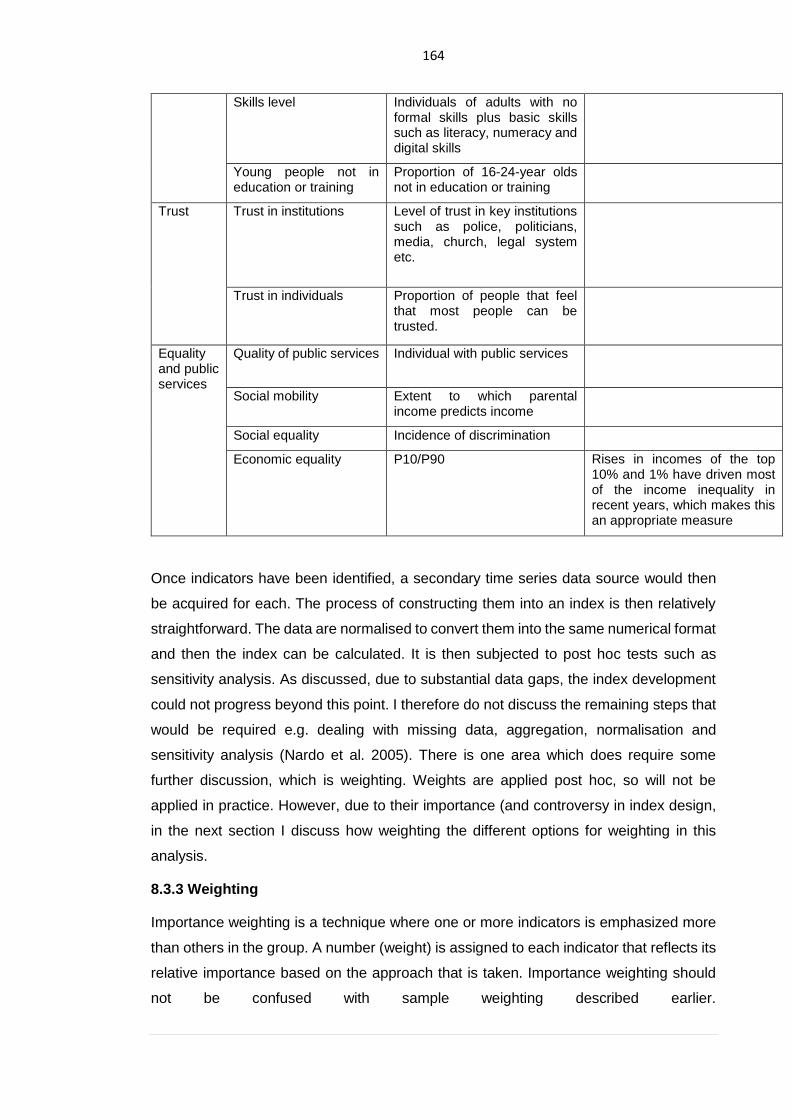
164
Skills level Individuals of adults with no formal skills plus basic skills such as literacy, numeracy and digital skills
Young people not in education or training
Proportion of 16-24-year olds not in education or training
Trust Trust in institutions Level of trust in key institutions such as police, politicians, media, church, legal system etc.
Trust in individuals Proportion of people that feel that most people can be trusted.
Equality and public services
Quality of public services Individual with public services
Social mobility Extent to which parental income predicts income
Social equality Incidence of discrimination
Economic equality P10/P90 Rises in incomes of the top 10% and 1% have driven most of the income inequality in recent years, which makes this an appropriate measure
Once indicators have been identified, a secondary time series data source would then
be acquired for each. The process of constructing them into an index is then relatively
straightforward. The data are normalised to convert them into the same numerical format
and then the index can be calculated. It is then subjected to post hoc tests such as
sensitivity analysis. As discussed, due to substantial data gaps, the index development
could not progress beyond this point. I therefore do not discuss the remaining steps that
would be required e.g. dealing with missing data, aggregation, normalisation and
sensitivity analysis (Nardo et al. 2005). There is one area which does require some
further discussion, which is weighting. Weights are applied post hoc, so will not be
applied in practice. However, due to their importance (and controversy in index design,
in the next section I discuss how weighting the different options for weighting in this
analysis.
8.3.3 Weighting
Importance weighting is a technique where one or more indicators is emphasized more
than others in the group. A number (weight) is assigned to each indicator that reflects its
relative importance based on the approach that is taken. Importance weighting should
not be confused with sample weighting described earlier.
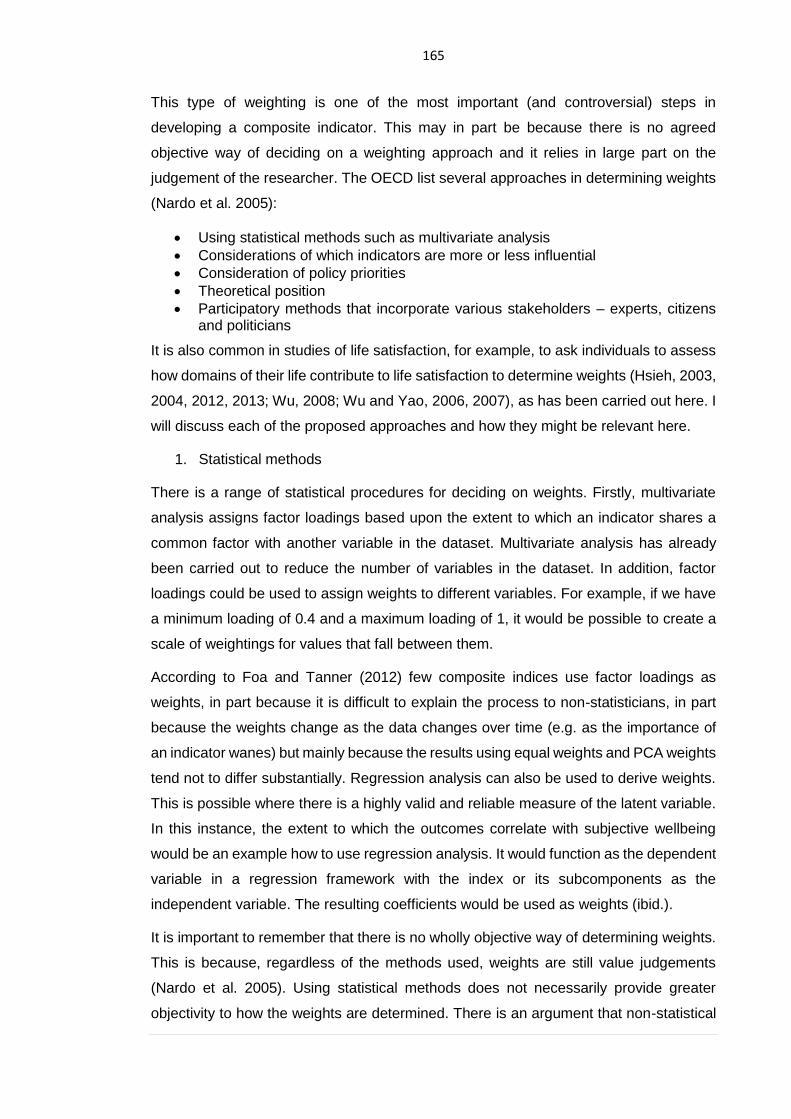
165
This type of weighting is one of the most important (and controversial) steps in
developing a composite indicator. This may in part be because there is no agreed
objective way of deciding on a weighting approach and it relies in large part on the
judgement of the researcher. The OECD list several approaches in determining weights
(Nardo et al. 2005):
• Using statistical methods such as multivariate analysis
• Considerations of which indicators are more or less influential
• Consideration of policy priorities
• Theoretical position
• Participatory methods that incorporate various stakeholders – experts, citizens and politicians
It is also common in studies of life satisfaction, for example, to ask individuals to assess
how domains of their life contribute to life satisfaction to determine weights (Hsieh, 2003,
2004, 2012, 2013; Wu, 2008; Wu and Yao, 2006, 2007), as has been carried out here. I
will discuss each of the proposed approaches and how they might be relevant here.
1. Statistical methods
There is a range of statistical procedures for deciding on weights. Firstly, multivariate
analysis assigns factor loadings based upon the extent to which an indicator shares a
common factor with another variable in the dataset. Multivariate analysis has already
been carried out to reduce the number of variables in the dataset. In addition, factor
loadings could be used to assign weights to different variables. For example, if we have
a minimum loading of 0.4 and a maximum loading of 1, it would be possible to create a
scale of weightings for values that fall between them.
According to Foa and Tanner (2012) few composite indices use factor loadings as
weights, in part because it is difficult to explain the process to non-statisticians, in part
because the weights change as the data changes over time (e.g. as the importance of
an indicator wanes) but mainly because the results using equal weights and PCA weights
tend not to differ substantially. Regression analysis can also be used to derive weights.
This is possible where there is a highly valid and reliable measure of the latent variable.
In this instance, the extent to which the outcomes correlate with subjective wellbeing
would be an example how to use regression analysis. It would function as the dependent
variable in a regression framework with the index or its subcomponents as the
independent variable. The resulting coefficients would be used as weights (ibid.).
It is important to remember that there is no wholly objective way of determining weights.
This is because, regardless of the methods used, weights are still value judgements
(Nardo et al. 2005). Using statistical methods does not necessarily provide greater
objectivity to how the weights are determined. There is an argument that non-statistical
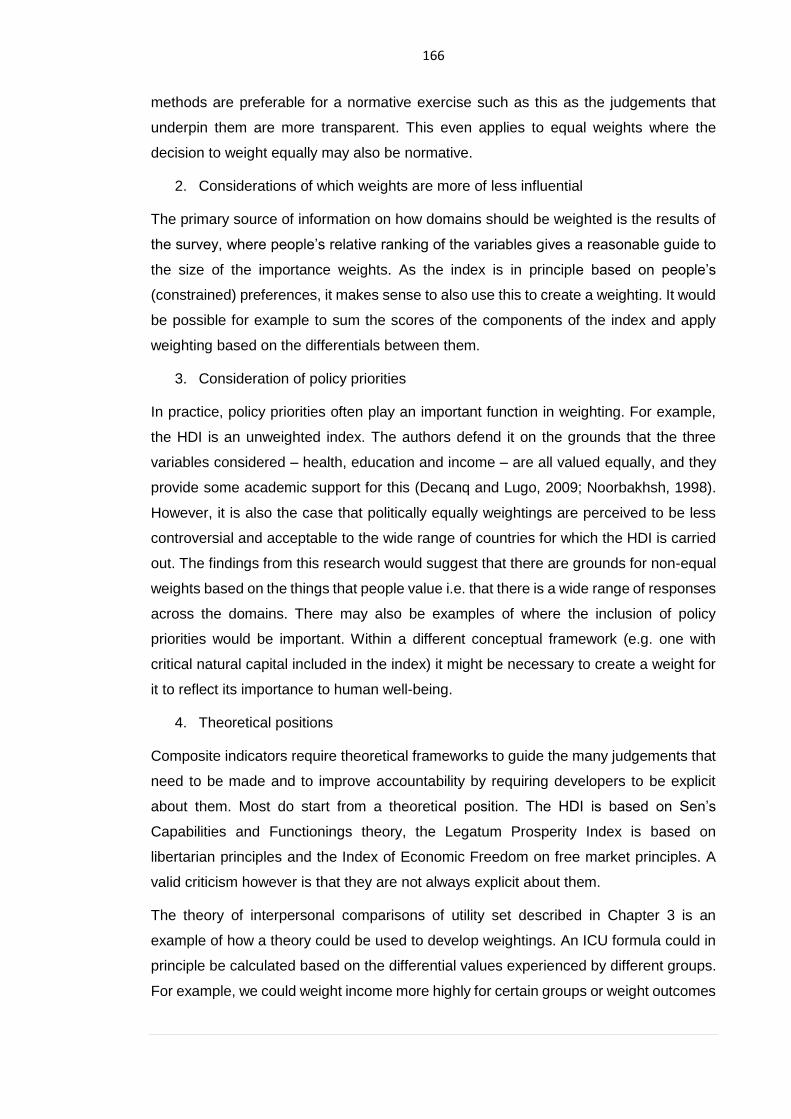
166
methods are preferable for a normative exercise such as this as the judgements that
underpin them are more transparent. This even applies to equal weights where the
decision to weight equally may also be normative.
2. Considerations of which weights are more of less influential
The primary source of information on how domains should be weighted is the results of
the survey, where people’s relative ranking of the variables gives a reasonable guide to
the size of the importance weights. As the index is in principle based on people’s
(constrained) preferences, it makes sense to also use this to create a weighting. It would
be possible for example to sum the scores of the components of the index and apply
weighting based on the differentials between them.
3. Consideration of policy priorities
In practice, policy priorities often play an important function in weighting. For example,
the HDI is an unweighted index. The authors defend it on the grounds that the three
variables considered – health, education and income – are all valued equally, and they
provide some academic support for this (Decanq and Lugo, 2009; Noorbakhsh, 1998).
However, it is also the case that politically equally weightings are perceived to be less
controversial and acceptable to the wide range of countries for which the HDI is carried
out. The findings from this research would suggest that there are grounds for non-equal
weights based on the things that people value i.e. that there is a wide range of responses
across the domains. There may also be examples of where the inclusion of policy
priorities would be important. Within a different conceptual framework (e.g. one with
critical natural capital included in the index) it might be necessary to create a weight for
it to reflect its importance to human well-being.
4. Theoretical positions
Composite indicators require theoretical frameworks to guide the many judgements that
need to be made and to improve accountability by requiring developers to be explicit
about them. Most do start from a theoretical position. The HDI is based on Sen’s
Capabilities and Functionings theory, the Legatum Prosperity Index is based on
libertarian principles and the Index of Economic Freedom on free market principles. A
valid criticism however is that they are not always explicit about them.
The theory of interpersonal comparisons of utility set described in Chapter 3 is an
example of how a theory could be used to develop weightings. An ICU formula could in
principle be calculated based on the differential values experienced by different groups.
For example, we could weight income more highly for certain groups or weight outcomes
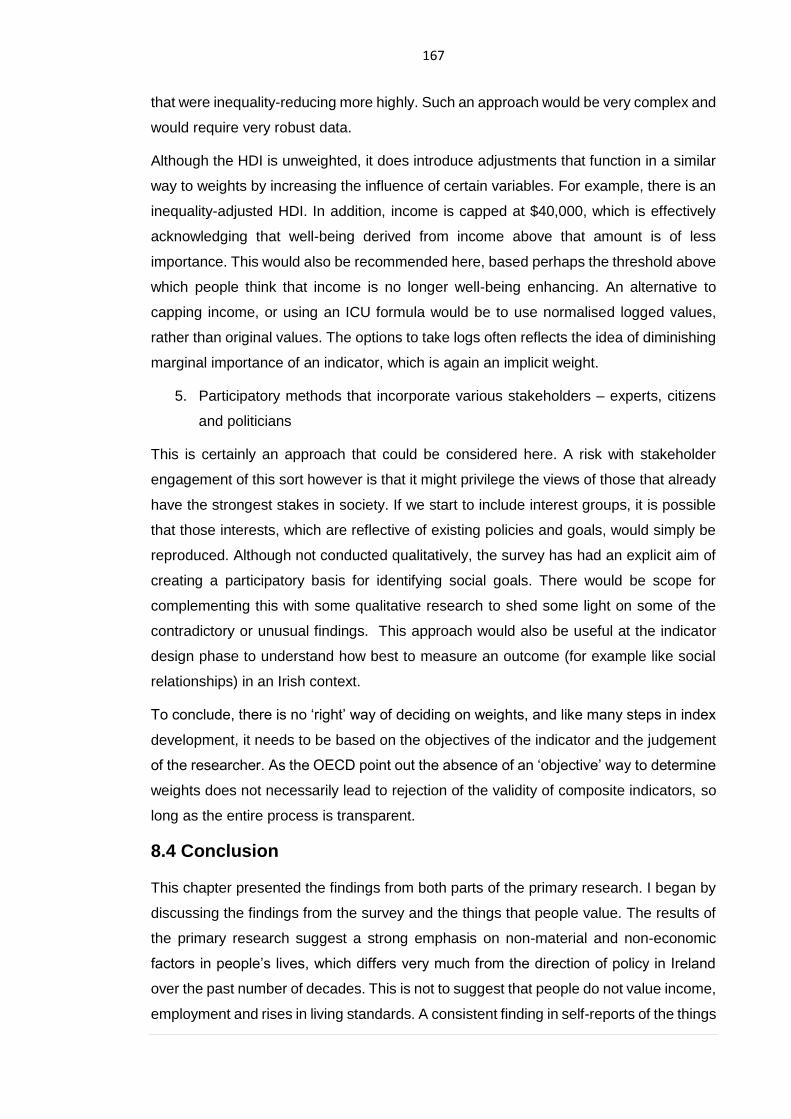
167
that were inequality-reducing more highly. Such an approach would be very complex and
would require very robust data.
Although the HDI is unweighted, it does introduce adjustments that function in a similar
way to weights by increasing the influence of certain variables. For example, there is an
inequality-adjusted HDI. In addition, income is capped at $40,000, which is effectively
acknowledging that well-being derived from income above that amount is of less
importance. This would also be recommended here, based perhaps the threshold above
which people think that income is no longer well-being enhancing. An alternative to
capping income, or using an ICU formula would be to use normalised logged values,
rather than original values. The options to take logs often reflects the idea of diminishing
marginal importance of an indicator, which is again an implicit weight.
5. Participatory methods that incorporate various stakeholders – experts, citizens
and politicians
This is certainly an approach that could be considered here. A risk with stakeholder
engagement of this sort however is that it might privilege the views of those that already
have the strongest stakes in society. If we start to include interest groups, it is possible
that those interests, which are reflective of existing policies and goals, would simply be
reproduced. Although not conducted qualitatively, the survey has had an explicit aim of
creating a participatory basis for identifying social goals. There would be scope for
complementing this with some qualitative research to shed some light on some of the
contradictory or unusual findings. This approach would also be useful at the indicator
design phase to understand how best to measure an outcome (for example like social
relationships) in an Irish context.
To conclude, there is no ‘right’ way of deciding on weights, and like many steps in index
development, it needs to be based on the objectives of the indicator and the judgement
of the researcher. As the OECD point out the absence of an ‘objective’ way to determine
weights does not necessarily lead to rejection of the validity of composite indicators, so
long as the entire process is transparent.
8.4 Conclusion
This chapter presented the findings from both parts of the primary research. I began by
discussing the findings from the survey and the things that people value. The results of
the primary research suggest a strong emphasis on non-material and non-economic
factors in people’s lives, which differs very much from the direction of policy in Ireland
over the past number of decades. This is not to suggest that people do not value income,
employment and rises in living standards. A consistent finding in self-reports of the things
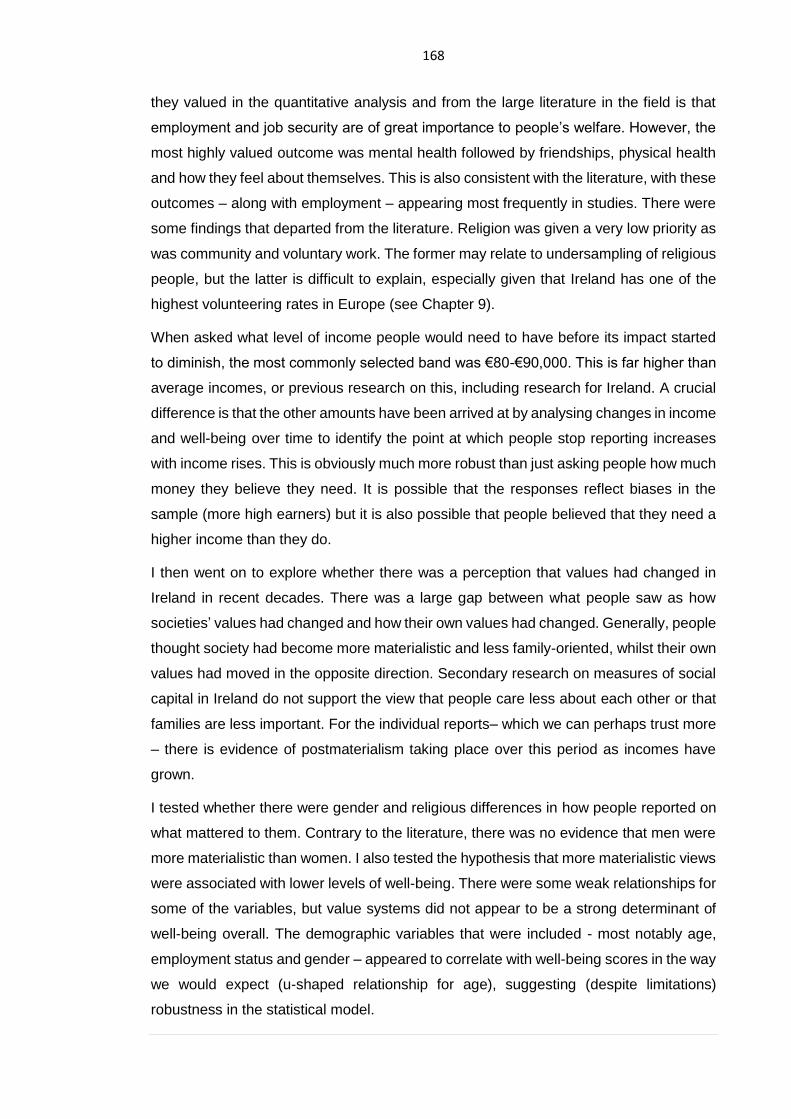
168
they valued in the quantitative analysis and from the large literature in the field is that
employment and job security are of great importance to people’s welfare. However, the
most highly valued outcome was mental health followed by friendships, physical health
and how they feel about themselves. This is also consistent with the literature, with these
outcomes – along with employment – appearing most frequently in studies. There were
some findings that departed from the literature. Religion was given a very low priority as
was community and voluntary work. The former may relate to undersampling of religious
people, but the latter is difficult to explain, especially given that Ireland has one of the
highest volunteering rates in Europe (see Chapter 9).
When asked what level of income people would need to have before its impact started
to diminish, the most commonly selected band was €80-€90,000. This is far higher than
average incomes, or previous research on this, including research for Ireland. A crucial
difference is that the other amounts have been arrived at by analysing changes in income
and well-being over time to identify the point at which people stop reporting increases
with income rises. This is obviously much more robust than just asking people how much
money they believe they need. It is possible that the responses reflect biases in the
sample (more high earners) but it is also possible that people believed that they need a
higher income than they do.
I then went on to explore whether there was a perception that values had changed in
Ireland in recent decades. There was a large gap between what people saw as how
societies’ values had changed and how their own values had changed. Generally, people
thought society had become more materialistic and less family-oriented, whilst their own
values had moved in the opposite direction. Secondary research on measures of social
capital in Ireland do not support the view that people care less about each other or that
families are less important. For the individual reports– which we can perhaps trust more
– there is evidence of postmaterialism taking place over this period as incomes have
grown.
I tested whether there were gender and religious differences in how people reported on
what mattered to them. Contrary to the literature, there was no evidence that men were
more materialistic than women. I also tested the hypothesis that more materialistic views
were associated with lower levels of well-being. There were some weak relationships for
some of the variables, but value systems did not appear to be a strong determinant of
well-being overall. The demographic variables that were included - most notably age,
employment status and gender – appeared to correlate with well-being scores in the way
we would expect (u-shaped relationship for age), suggesting (despite limitations)
robustness in the statistical model.

169
Finally, I discuss the findings from the Principal Component Analysis. 10 outcome areas
had sufficient factor loadings to merit inclusion in the index. Indicators for these outcomes
were then identified. Due to data limitations, it has not been possible to complete the
final steps in the construction of the index. However, I provide some discussion on the
issues related to weighting. I conclude that there is no ‘right’ or ‘objective’ way of
weighting but offer some suggestions for how this might be done in line with the
conceptual framework. In the next chapter I look at the extent to which improvements in
these outcome areas could be identified in Ireland during the Celtic Tiger period from the
available data.
170
Chapter 9 Testing the index: a focus on the Celtic Tiger
9.0 Introduction
In 2007, the Economic and Social Research Council (ESRC) published a collection of
papers called Best of Times? which aimed to provide an assessment of the social impact
of the Celtic Tiger years (Fahey et al., 2007). Best of Times? has been described by
some commentators as uncritical (Ó Gráda, 2008). It aimed to amass a wealth of data
highlighting the success of the project and supporting the idea that the Irish people “never
had it so good” (p.2). It was also published at a time when the government sought to
undermine voices that were critical of the status quo (O’Callaghan et al. 2014). The most
famous example of this was An Taoiseach Bertie Ahern’s suggestion that the naysayers
should just commit suicide if they have so little belief in the economy (ibid.). Much of Best
of Times? reads hubristically now52. Although ‘soft landings’ were predicted, the authors
in those papers appeared unaware of the imminent economic collapse. An assumption
underpinning the analysis therefore was that the economic landscape had been
permanently changed, and that there was no going back to the high unemployment and
emigration of the 1980s.
One potential critique of the way in which these policy evaluations such as that
undertaken in Best of Times? is that that choice of social outcomes, or indicators is
somewhat arbitrary. In this research, I have sought to address this by describing a
process through which a list of measures could be identified for Ireland (see Chapter 8).
In this chapter I will review the evidence - such that it exists - for each outcome area
during the Celtic Tiger period. A second (and rather obvious) issue with the Best of
Times? analysis is that it was premature. However, at the time of writing, a decade later,
it may still be too early to carry out such as assessment. A further caveat is that the
picture is distorted by the exogenous shock caused by the global financial crisis. It is
impossible to separate out the success of the policies of the previous two decades from
the deep recession that was to follow them.
Despite these limitations, it is still worth asking whether the social and economic
transformation was net positive for social value. This also provides an opportunity to test
out the framework that has been developed as part of this thesis. In this chapter, I
systematically analyse the data for each outcome area recommended for inclusion in the
index. Where microdata is available, I also test whether changes in these indicators
52 Such hubris is a common feature of economic bubbles. This has been demonstrated
convincingly by Reinhart and Rogoff’s in their analysis over eight centuries of 65 economies across five continents (Reinhart and Rogoff, 2009).
171
correlate with changes in GDP. I begin with mental health and well-being and progress
through employment, education, physical health, social capital, income and poverty. No
data were available on public service quality, use of time, or relationships and these have
been excluded from this chapter as a result. As well as data gaps on specific outcomes,
there were issues with data quality across the board and I begin the chapter with a
discussion of the caveats relating to this.
9.1 Data quality
Historically, the quality of data in Ireland is poor, and this limits the ability to carry out
retrospective analyses such as this. Of the full indicator set listed in the previous chapter,
very few have been measured consistently over the time period of interest. Ideally, this
research would require a dataset to span the 16 years from 1994-2010 to cover the
different stages of boom and bust. Even this time period is short, as it does not allow
comparisons with the recession of the 1980s, or a long enough time lag to say anything
meaningful about the impact of the most recent recession.
Most of the datasets discussed below are drawn from European and international
institutions such as the OECD, the World Bank and the ILO. Microdata was also acquired
from the EU-SILC (Survey on Income and Living Conditions). As mentioned, this enabled
some correlations to be carried out with GDP and these are reported where appropriate.
However, EU-SILC only began in 2003 and is only therefore relevant to the 2003-2007
period. Some datasets such as Eurobarometer or EQLS have a longer time series and
these have been referred to for some of the outcomes. The Irish government is very
dependent on sources of data from these institutions and few of the indictors are being
measured systematically by the State itself. This has implications for the approach to
national measurement being discussed here and will be discussed in Chapter 10. I begin
the analysis by looking at the available data on the most valued outcomes: mental health
and well-being.
9.2 Mental health and well-being
As we have seen, mental health emerged as the outcome that mattered most to people
in the survey. It would follow therefore that data on mental health would be the strongest
predictor of social value for Ireland. Before assessing this, let us remind ourselves about
what was happening to GDP during this time period. Figure 9.1 shows the annual
percentage change in per capita GDP between 1994 and 2013 for Ireland and the EU.
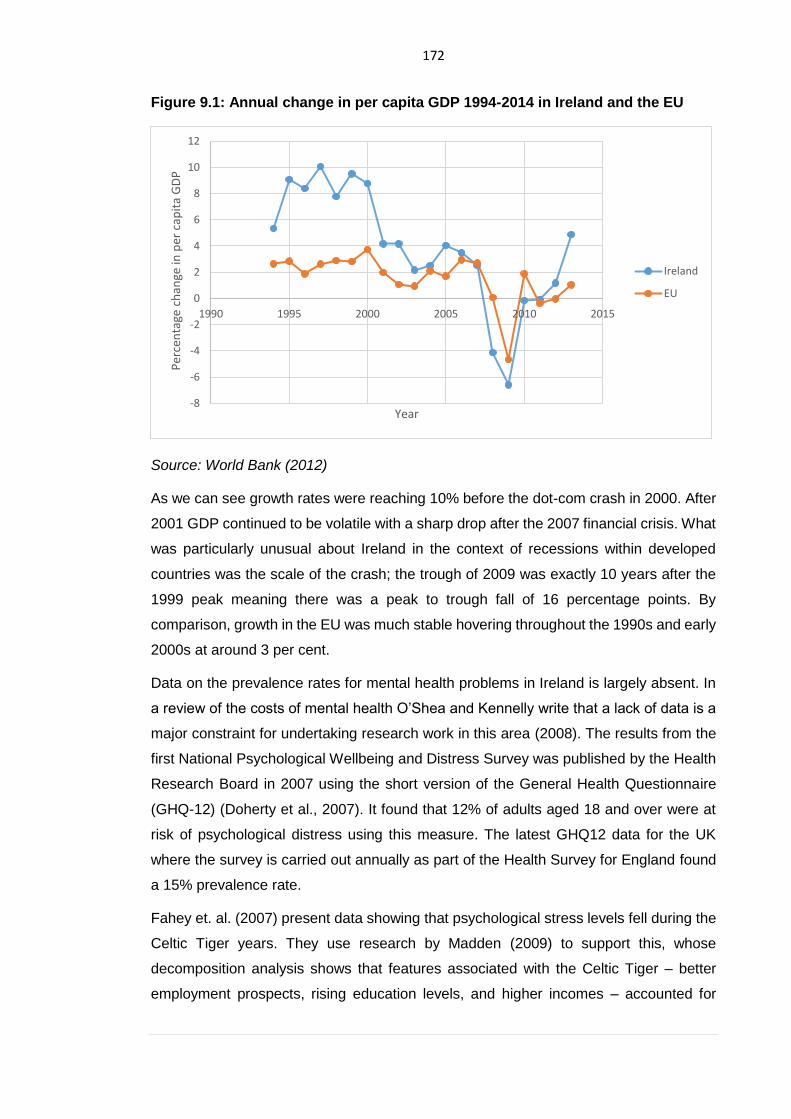
172
Figure 9.1: Annual change in per capita GDP 1994-2014 in Ireland and the EU
Source: World Bank (2012)
As we can see growth rates were reaching 10% before the dot-com crash in 2000. After
2001 GDP continued to be volatile with a sharp drop after the 2007 financial crisis. What
was particularly unusual about Ireland in the context of recessions within developed
countries was the scale of the crash; the trough of 2009 was exactly 10 years after the
1999 peak meaning there was a peak to trough fall of 16 percentage points. By
comparison, growth in the EU was much stable hovering throughout the 1990s and early
2000s at around 3 per cent.
Data on the prevalence rates for mental health problems in Ireland is largely absent. In
a review of the costs of mental health O’Shea and Kennelly write that a lack of data is a
major constraint for undertaking research work in this area (2008). The results from the
first National Psychological Wellbeing and Distress Survey was published by the Health
Research Board in 2007 using the short version of the General Health Questionnaire
(GHQ-12) (Doherty et al., 2007). It found that 12% of adults aged 18 and over were at
risk of psychological distress using this measure. The latest GHQ12 data for the UK
where the survey is carried out annually as part of the Health Survey for England found
a 15% prevalence rate.
Fahey et. al. (2007) present data showing that psychological stress levels fell during the
Celtic Tiger years. They use research by Madden (2009) to support this, whose
decomposition analysis shows that features associated with the Celtic Tiger – better
employment prospects, rising education levels, and higher incomes – accounted for
-8
-6
-4
-2
0
2
4
6
8
10
12
1990 1995 2000 2005 2010 2015
Per
cen
tage
ch
ange
in p
er c
apit
a G
DP
Year
Ireland
EU
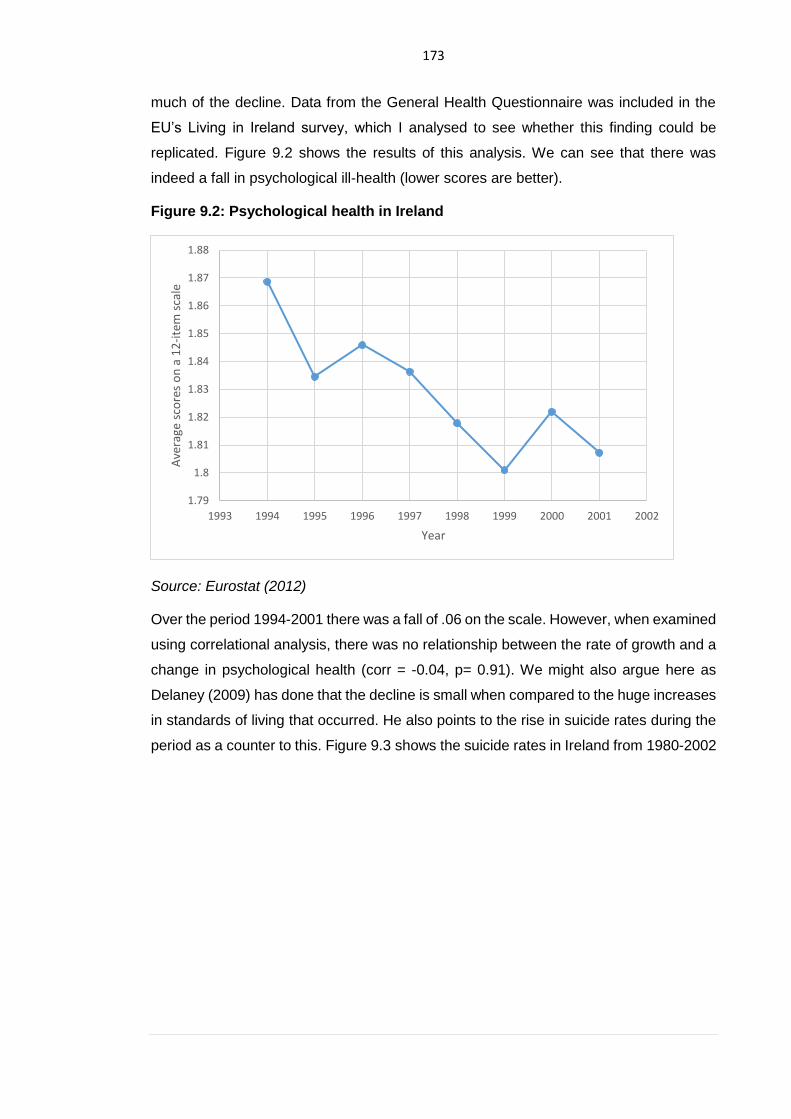
173
much of the decline. Data from the General Health Questionnaire was included in the
EU’s Living in Ireland survey, which I analysed to see whether this finding could be
replicated. Figure 9.2 shows the results of this analysis. We can see that there was
indeed a fall in psychological ill-health (lower scores are better).
Figure 9.2: Psychological health in Ireland
Source: Eurostat (2012)
Over the period 1994-2001 there was a fall of .06 on the scale. However, when examined
using correlational analysis, there was no relationship between the rate of growth and a
change in psychological health (corr = -0.04, p= 0.91). We might also argue here as
Delaney (2009) has done that the decline is small when compared to the huge increases
in standards of living that occurred. He also points to the rise in suicide rates during the
period as a counter to this. Figure 9.3 shows the suicide rates in Ireland from 1980-2002
1.79
1.8
1.81
1.82
1.83
1.84
1.85
1.86
1.87
1.88
1993 1994 1995 1996 1997 1998 1999 2000 2001 2002
Ave
rage
sco
res
on
a 1
2-i
tem
sca
le
Year
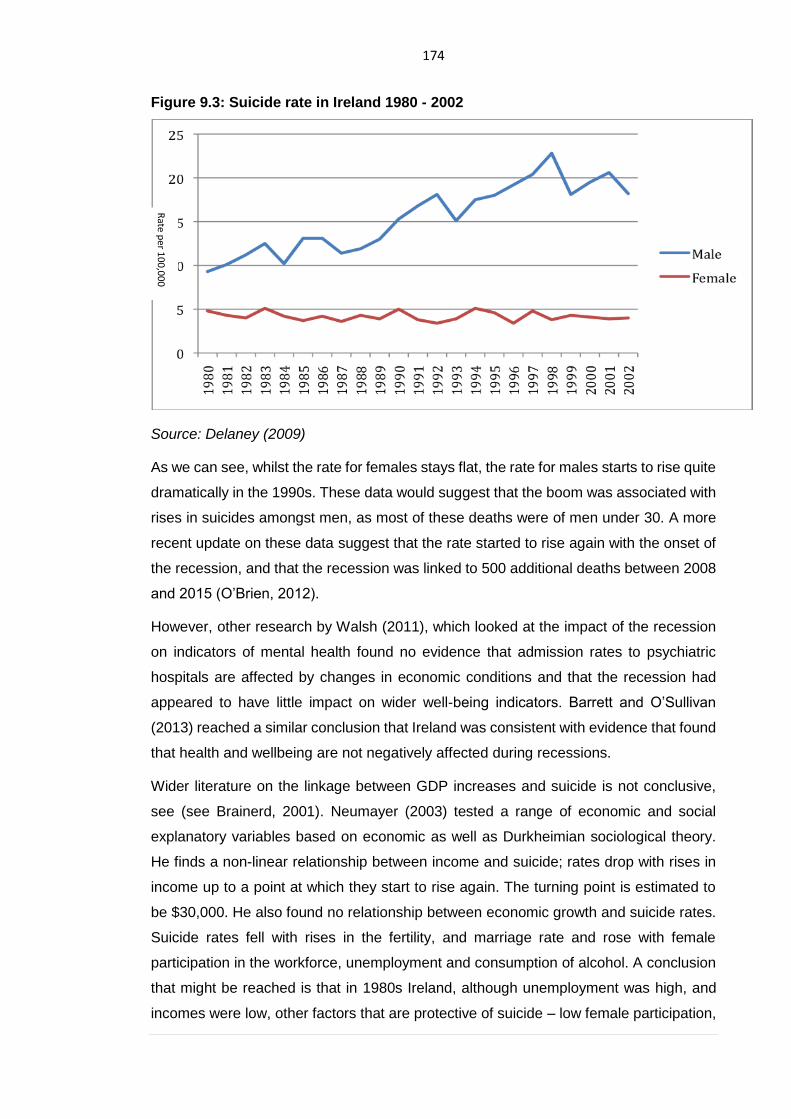
174
Figure 9.3: Suicide rate in Ireland 1980 - 2002
Source: Delaney (2009)
As we can see, whilst the rate for females stays flat, the rate for males starts to rise quite
dramatically in the 1990s. These data would suggest that the boom was associated with
rises in suicides amongst men, as most of these deaths were of men under 30. A more
recent update on these data suggest that the rate started to rise again with the onset of
the recession, and that the recession was linked to 500 additional deaths between 2008
and 2015 (O’Brien, 2012).
However, other research by Walsh (2011), which looked at the impact of the recession
on indicators of mental health found no evidence that admission rates to psychiatric
hospitals are affected by changes in economic conditions and that the recession had
appeared to have little impact on wider well-being indicators. Barrett and O’Sullivan
(2013) reached a similar conclusion that Ireland was consistent with evidence that found
that health and wellbeing are not negatively affected during recessions.
Wider literature on the linkage between GDP increases and suicide is not conclusive,
see (see Brainerd, 2001). Neumayer (2003) tested a range of economic and social
explanatory variables based on economic as well as Durkheimian sociological theory.
He finds a non-linear relationship between income and suicide; rates drop with rises in
income up to a point at which they start to rise again. The turning point is estimated to
be $30,000. He also found no relationship between economic growth and suicide rates.
Suicide rates fell with rises in the fertility, and marriage rate and rose with female
participation in the workforce, unemployment and consumption of alcohol. A conclusion
that might be reached is that in 1980s Ireland, although unemployment was high, and
incomes were low, other factors that are protective of suicide – low female participation,
Rate p
er 10
0,0
00
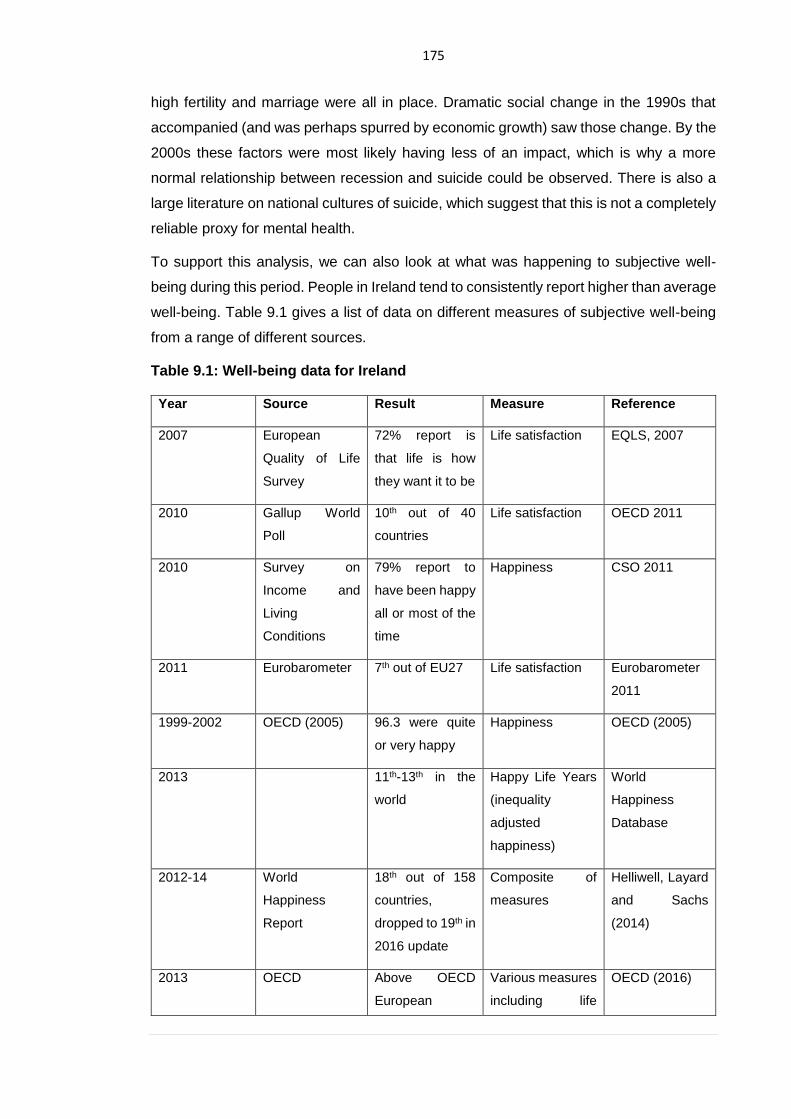
175
high fertility and marriage were all in place. Dramatic social change in the 1990s that
accompanied (and was perhaps spurred by economic growth) saw those change. By the
2000s these factors were most likely having less of an impact, which is why a more
normal relationship between recession and suicide could be observed. There is also a
large literature on national cultures of suicide, which suggest that this is not a completely
reliable proxy for mental health.
To support this analysis, we can also look at what was happening to subjective well-
being during this period. People in Ireland tend to consistently report higher than average
well-being. Table 9.1 gives a list of data on different measures of subjective well-being
from a range of different sources.
Table 9.1: Well-being data for Ireland
Year Source Result Measure Reference
2007 European
Quality of Life
Survey
72% report is
that life is how
they want it to be
Life satisfaction EQLS, 2007
2010 Gallup World
Poll
10th out of 40
countries
Life satisfaction OECD 2011
2010 Survey on
Income and
Living
Conditions
79% report to
have been happy
all or most of the
time
Happiness CSO 2011
2011 Eurobarometer 7th out of EU27 Life satisfaction Eurobarometer
2011
1999-2002 OECD (2005) 96.3 were quite
or very happy
Happiness OECD (2005)
2013 11th-13th in the
world
Happy Life Years
(inequality
adjusted
happiness)
World
Happiness
Database
2012-14 World
Happiness
Report
18th out of 158
countries,
dropped to 19th in
2016 update
Composite of
measures
Helliwell, Layard
and Sachs
(2014)
2013 OECD Above OECD
European
Various measures
including life
OECD (2016)
176
average (gap
higher for rural
areas)
satisfaction and
meaning of life
As described in Chapter 2, longitudinal measures of well-being have been robust to
changes in economic circumstances in most developed countries, including Ireland.
Whilst there was a fall in life satisfaction during the recession of the 1980s, it rose again
quite sharply recovering ground lost by 1991. There were only small fluctuations during
the 1990s and 2000s, and by 2010, life satisfaction was at the same level that it had
been in 1975. As with other economies, this suggests limited improvements in life
satisfaction despite dramatic improvements in living standards (the economy in 2011
was three times larger than in 1975).
These data are difficult to explain. It is certainly would seem supportive of the Easterlin
paradox and the process of habituation described in Chapter 2. With the example of
Ireland however, the variation in incomes, growth and employment throughout the period
were much more volatile than other countries and the rises in living standards more
dramatic. Although we can see some response in the data to the recession of the 1980s,
this breaks down completely in the 1990s.
Microdata from the Living in Ireland Survey provides a more detailed look at satisfaction
with domains of life – work, housing, leisure and finance - during the Celtic Tiger period
(see Figure 9.4). Again, correlational analysis was used to test whether there was any
relationship between changes in these variables and changes in GDP. No relationship
was found (corr=-0.66, p= .07), providing some further evidence that these variables are
not associated with changes in GDP.
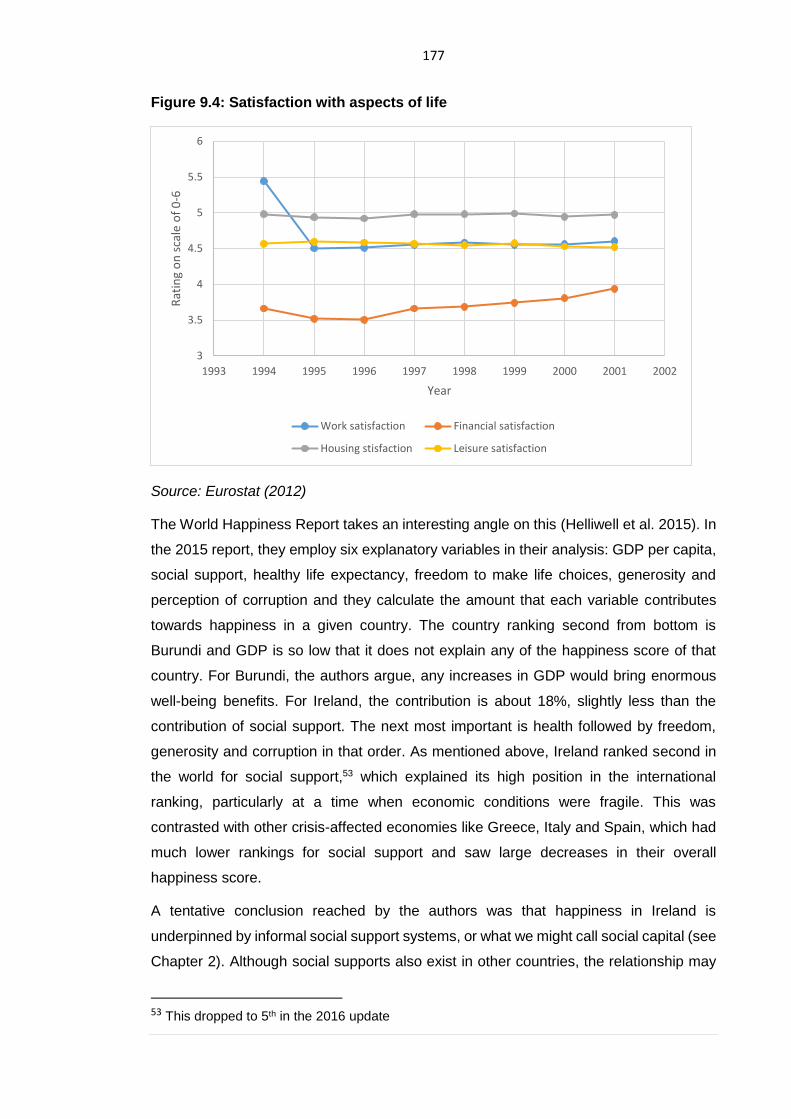
177
Figure 9.4: Satisfaction with aspects of life
Source: Eurostat (2012)
The World Happiness Report takes an interesting angle on this (Helliwell et al. 2015). In
the 2015 report, they employ six explanatory variables in their analysis: GDP per capita,
social support, healthy life expectancy, freedom to make life choices, generosity and
perception of corruption and they calculate the amount that each variable contributes
towards happiness in a given country. The country ranking second from bottom is
Burundi and GDP is so low that it does not explain any of the happiness score of that
country. For Burundi, the authors argue, any increases in GDP would bring enormous
well-being benefits. For Ireland, the contribution is about 18%, slightly less than the
contribution of social support. The next most important is health followed by freedom,
generosity and corruption in that order. As mentioned above, Ireland ranked second in
the world for social support,53 which explained its high position in the international
ranking, particularly at a time when economic conditions were fragile. This was
contrasted with other crisis-affected economies like Greece, Italy and Spain, which had
much lower rankings for social support and saw large decreases in their overall
happiness score.
A tentative conclusion reached by the authors was that happiness in Ireland is
underpinned by informal social support systems, or what we might call social capital (see
Chapter 2). Although social supports also exist in other countries, the relationship may
53 This dropped to 5th in the 2016 update
3
3.5
4
4.5
5
5.5
6
1993 1994 1995 1996 1997 1998 1999 2000 2001 2002
Rat
ing
on
sca
le o
f 0
-6
Year
Work satisfaction Financial satisfaction
Housing stisfaction Leisure satisfaction
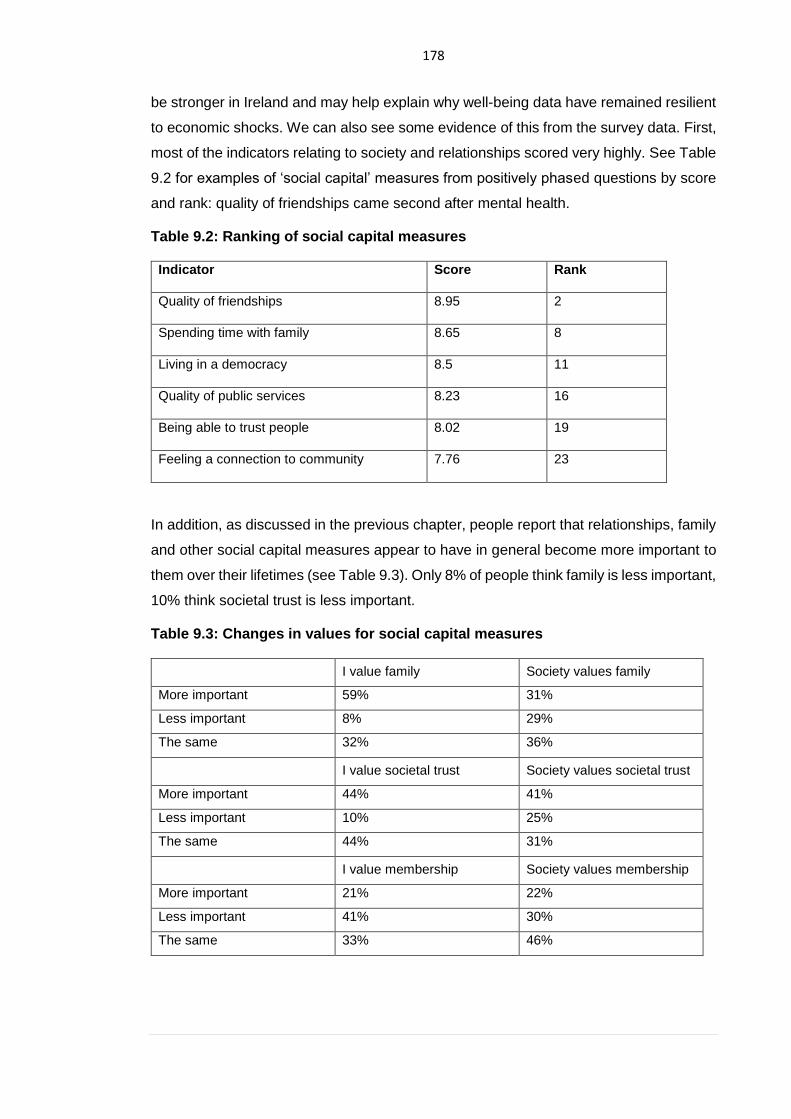
178
be stronger in Ireland and may help explain why well-being data have remained resilient
to economic shocks. We can also see some evidence of this from the survey data. First,
most of the indicators relating to society and relationships scored very highly. See Table
9.2 for examples of ‘social capital’ measures from positively phased questions by score
and rank: quality of friendships came second after mental health.
Table 9.2: Ranking of social capital measures
Indicator Score Rank
Quality of friendships 8.95 2
Spending time with family 8.65 8
Living in a democracy 8.5 11
Quality of public services 8.23 16
Being able to trust people 8.02 19
Feeling a connection to community 7.76 23
In addition, as discussed in the previous chapter, people report that relationships, family
and other social capital measures appear to have in general become more important to
them over their lifetimes (see Table 9.3). Only 8% of people think family is less important,
10% think societal trust is less important.
Table 9.3: Changes in values for social capital measures
I value family Society values family
More important 59% 31%
Less important 8% 29%
The same 32% 36%
I value societal trust Society values societal trust
More important 44% 41%
Less important 10% 25%
The same 44% 31%
I value membership Society values membership
More important 21% 22%
Less important 41% 30%
The same 33% 46%
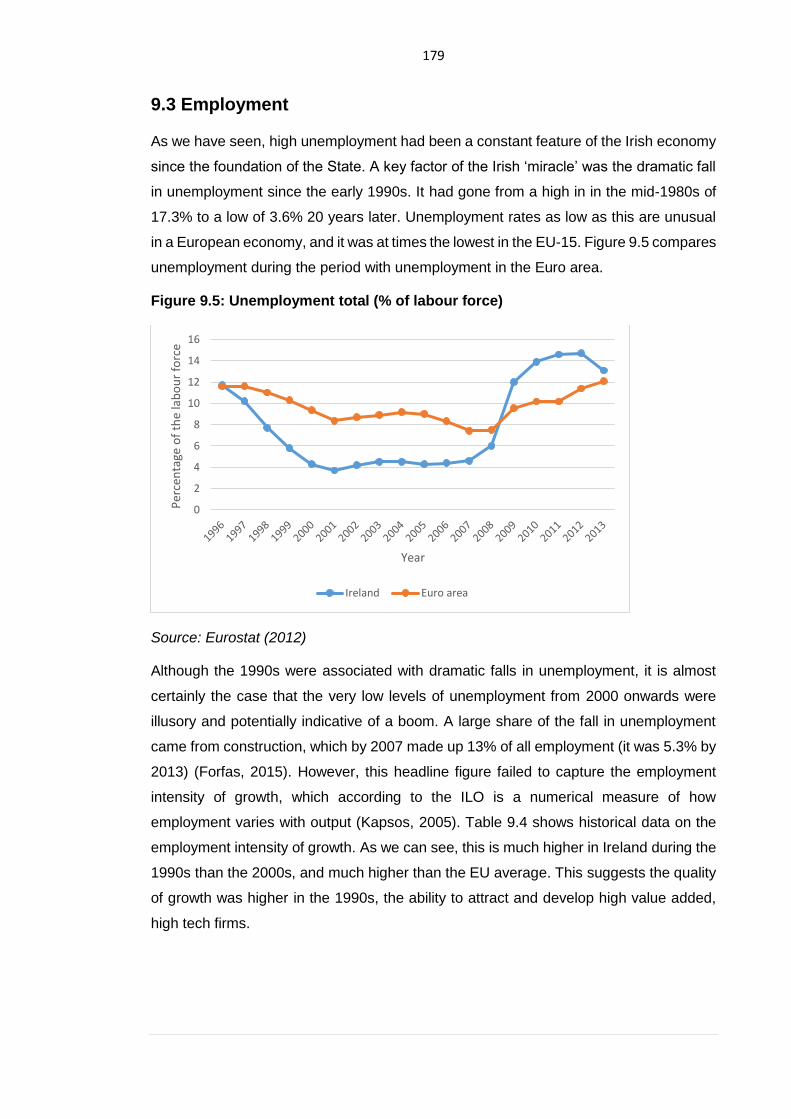
179
9.3 Employment
As we have seen, high unemployment had been a constant feature of the Irish economy
since the foundation of the State. A key factor of the Irish ‘miracle’ was the dramatic fall
in unemployment since the early 1990s. It had gone from a high in in the mid-1980s of
17.3% to a low of 3.6% 20 years later. Unemployment rates as low as this are unusual
in a European economy, and it was at times the lowest in the EU-15. Figure 9.5 compares
unemployment during the period with unemployment in the Euro area.
Figure 9.5: Unemployment total (% of labour force)
Source: Eurostat (2012)
Although the 1990s were associated with dramatic falls in unemployment, it is almost
certainly the case that the very low levels of unemployment from 2000 onwards were
illusory and potentially indicative of a boom. A large share of the fall in unemployment
came from construction, which by 2007 made up 13% of all employment (it was 5.3% by
2013) (Forfas, 2015). However, this headline figure failed to capture the employment
intensity of growth, which according to the ILO is a numerical measure of how
employment varies with output (Kapsos, 2005). Table 9.4 shows historical data on the
employment intensity of growth. As we can see, this is much higher in Ireland during the
1990s than the 2000s, and much higher than the EU average. This suggests the quality
of growth was higher in the 1990s, the ability to attract and develop high value added,
high tech firms.
0
2
4
6
8
10
12
14
16
Per
cen
tage
of
the
lab
ou
r fo
rce
Year
Ireland Euro area
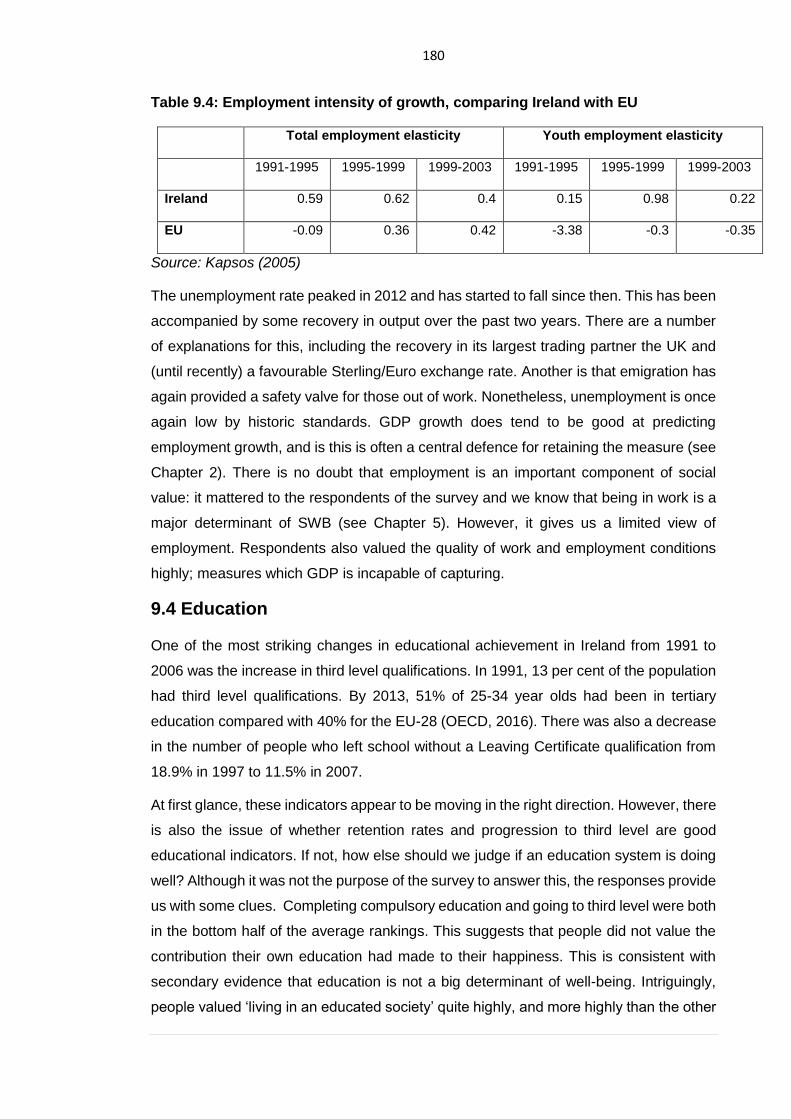
180
Table 9.4: Employment intensity of growth, comparing Ireland with EU
Total employment elasticity Youth employment elasticity
1991-1995 1995-1999 1999-2003 1991-1995 1995-1999 1999-2003
Ireland 0.59 0.62 0.4 0.15 0.98 0.22
EU -0.09 0.36 0.42 -3.38 -0.3 -0.35
Source: Kapsos (2005)
The unemployment rate peaked in 2012 and has started to fall since then. This has been
accompanied by some recovery in output over the past two years. There are a number
of explanations for this, including the recovery in its largest trading partner the UK and
(until recently) a favourable Sterling/Euro exchange rate. Another is that emigration has
again provided a safety valve for those out of work. Nonetheless, unemployment is once
again low by historic standards. GDP growth does tend to be good at predicting
employment growth, and is this is often a central defence for retaining the measure (see
Chapter 2). There is no doubt that employment is an important component of social
value: it mattered to the respondents of the survey and we know that being in work is a
major determinant of SWB (see Chapter 5). However, it gives us a limited view of
employment. Respondents also valued the quality of work and employment conditions
highly; measures which GDP is incapable of capturing.
9.4 Education
One of the most striking changes in educational achievement in Ireland from 1991 to
2006 was the increase in third level qualifications. In 1991, 13 per cent of the population
had third level qualifications. By 2013, 51% of 25-34 year olds had been in tertiary
education compared with 40% for the EU-28 (OECD, 2016). There was also a decrease
in the number of people who left school without a Leaving Certificate qualification from
18.9% in 1997 to 11.5% in 2007.
At first glance, these indicators appear to be moving in the right direction. However, there
is also the issue of whether retention rates and progression to third level are good
educational indicators. If not, how else should we judge if an education system is doing
well? Although it was not the purpose of the survey to answer this, the responses provide
us with some clues. Completing compulsory education and going to third level were both
in the bottom half of the average rankings. This suggests that people did not value the
contribution their own education had made to their happiness. This is consistent with
secondary evidence that education is not a big determinant of well-being. Intriguingly,
people valued ‘living in an educated society’ quite highly, and more highly than the other
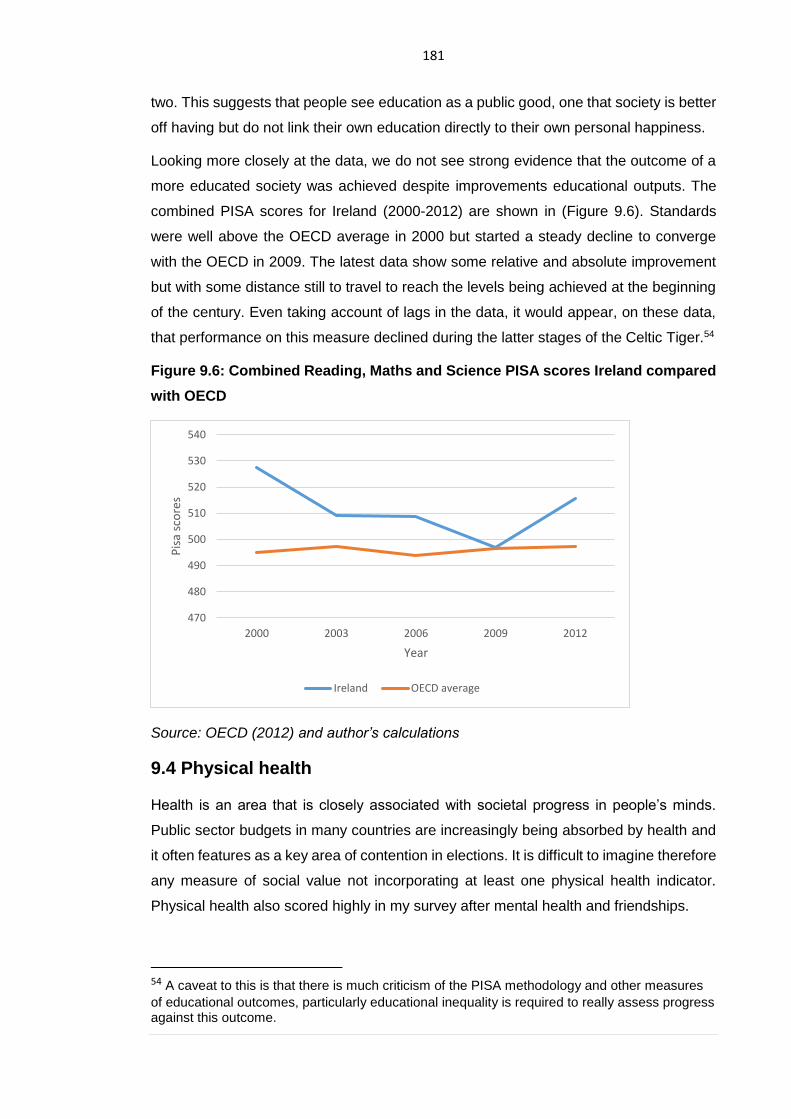
181
two. This suggests that people see education as a public good, one that society is better
off having but do not link their own education directly to their own personal happiness.
Looking more closely at the data, we do not see strong evidence that the outcome of a
more educated society was achieved despite improvements educational outputs. The
combined PISA scores for Ireland (2000-2012) are shown in (Figure 9.6). Standards
were well above the OECD average in 2000 but started a steady decline to converge
with the OECD in 2009. The latest data show some relative and absolute improvement
but with some distance still to travel to reach the levels being achieved at the beginning
of the century. Even taking account of lags in the data, it would appear, on these data,
that performance on this measure declined during the latter stages of the Celtic Tiger.54
Figure 9.6: Combined Reading, Maths and Science PISA scores Ireland compared
with OECD
Source: OECD (2012) and author’s calculations
9.4 Physical health
Health is an area that is closely associated with societal progress in people’s minds.
Public sector budgets in many countries are increasingly being absorbed by health and
it often features as a key area of contention in elections. It is difficult to imagine therefore
any measure of social value not incorporating at least one physical health indicator.
Physical health also scored highly in my survey after mental health and friendships.
54 A caveat to this is that there is much criticism of the PISA methodology and other measures
of educational outcomes, particularly educational inequality is required to really assess progress against this outcome.
470
480
490
500
510
520
530
540
2000 2003 2006 2009 2012
Pis
a sc
ore
s
Year
Ireland OECD average
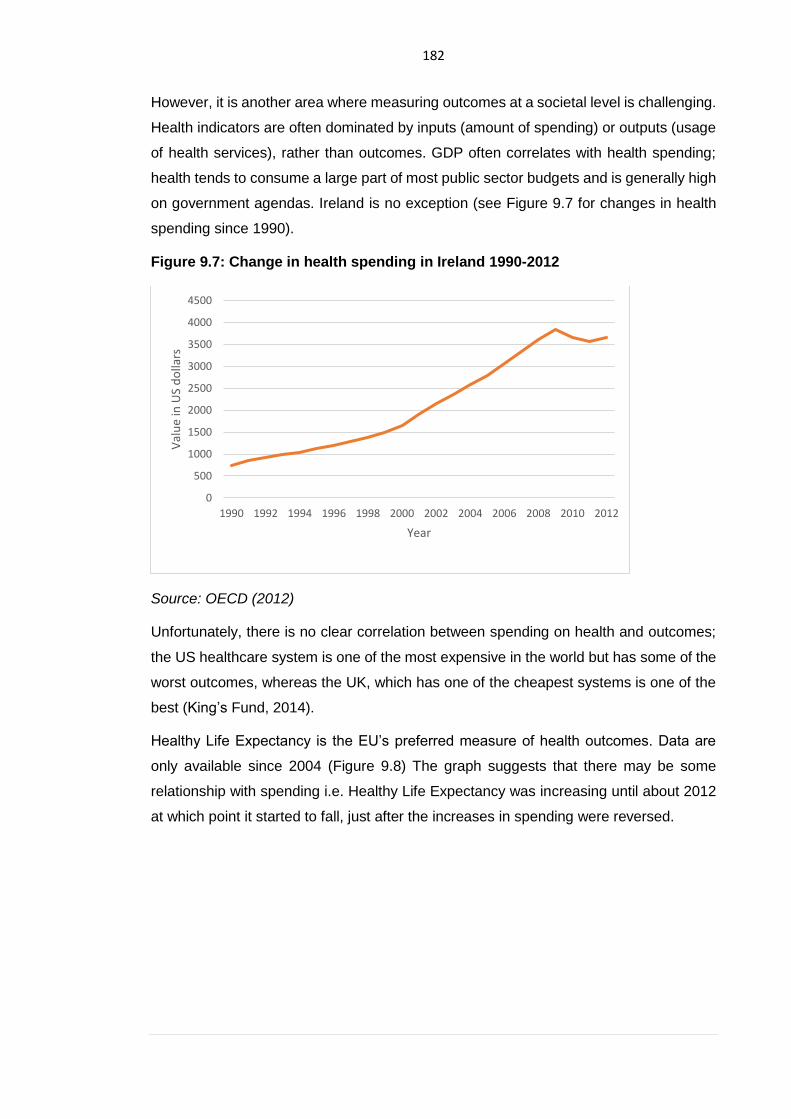
182
However, it is another area where measuring outcomes at a societal level is challenging.
Health indicators are often dominated by inputs (amount of spending) or outputs (usage
of health services), rather than outcomes. GDP often correlates with health spending;
health tends to consume a large part of most public sector budgets and is generally high
on government agendas. Ireland is no exception (see Figure 9.7 for changes in health
spending since 1990).
Figure 9.7: Change in health spending in Ireland 1990-2012
Source: OECD (2012)
Unfortunately, there is no clear correlation between spending on health and outcomes;
the US healthcare system is one of the most expensive in the world but has some of the
worst outcomes, whereas the UK, which has one of the cheapest systems is one of the
best (King’s Fund, 2014).
Healthy Life Expectancy is the EU’s preferred measure of health outcomes. Data are
only available since 2004 (Figure 9.8) The graph suggests that there may be some
relationship with spending i.e. Healthy Life Expectancy was increasing until about 2012
at which point it started to fall, just after the increases in spending were reversed.
0
500
1000
1500
2000
2500
3000
3500
4000
4500
1990 1992 1994 1996 1998 2000 2002 2004 2006 2008 2010 2012
Val
ue
in U
S d
olla
rs
Year
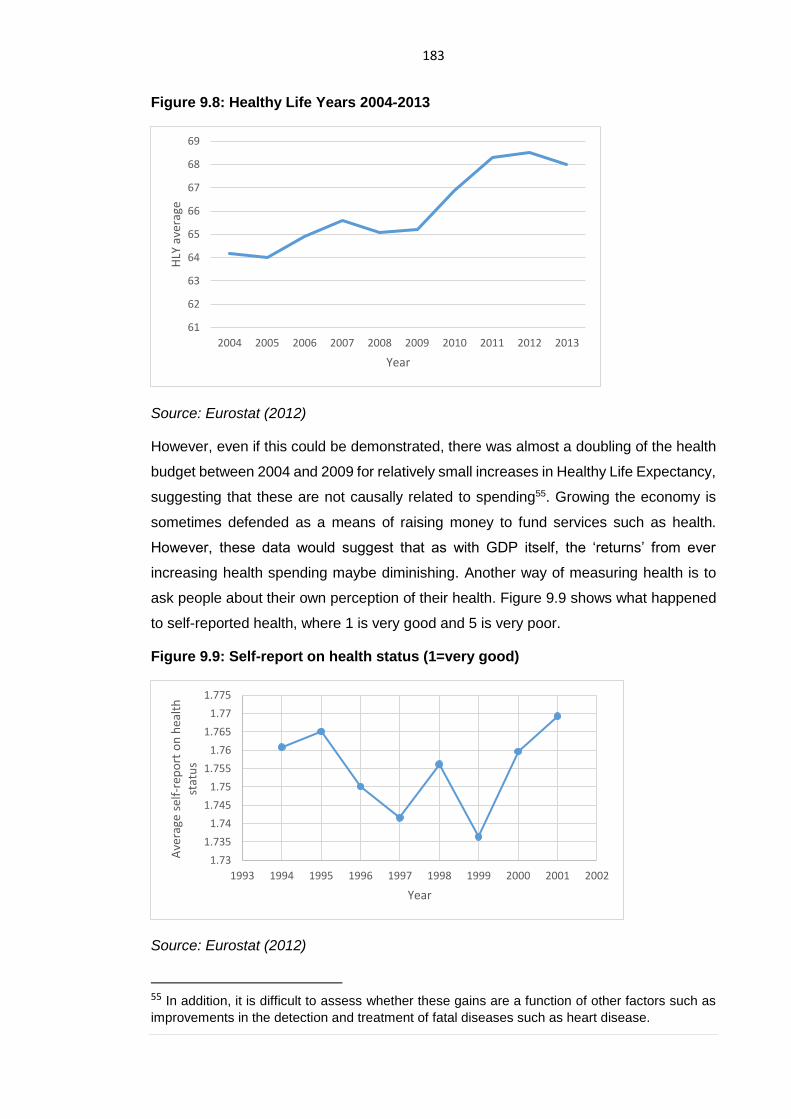
183
Figure 9.8: Healthy Life Years 2004-2013
Source: Eurostat (2012)
However, even if this could be demonstrated, there was almost a doubling of the health
budget between 2004 and 2009 for relatively small increases in Healthy Life Expectancy,
suggesting that these are not causally related to spending55. Growing the economy is
sometimes defended as a means of raising money to fund services such as health.
However, these data would suggest that as with GDP itself, the ‘returns’ from ever
increasing health spending maybe diminishing. Another way of measuring health is to
ask people about their own perception of their health. Figure 9.9 shows what happened
to self-reported health, where 1 is very good and 5 is very poor.
Figure 9.9: Self-report on health status (1=very good)
Source: Eurostat (2012)
55 In addition, it is difficult to assess whether these gains are a function of other factors such as
improvements in the detection and treatment of fatal diseases such as heart disease.
61
62
63
64
65
66
67
68
69
2004 2005 2006 2007 2008 2009 2010 2011 2012 2013
HLY
ave
rage
Year
1.73
1.735
1.74
1.745
1.75
1.755
1.76
1.765
1.77
1.775
1993 1994 1995 1996 1997 1998 1999 2000 2001 2002
Ave
rage
sel
f-re
po
rt o
n h
ealt
h
stat
us
Year
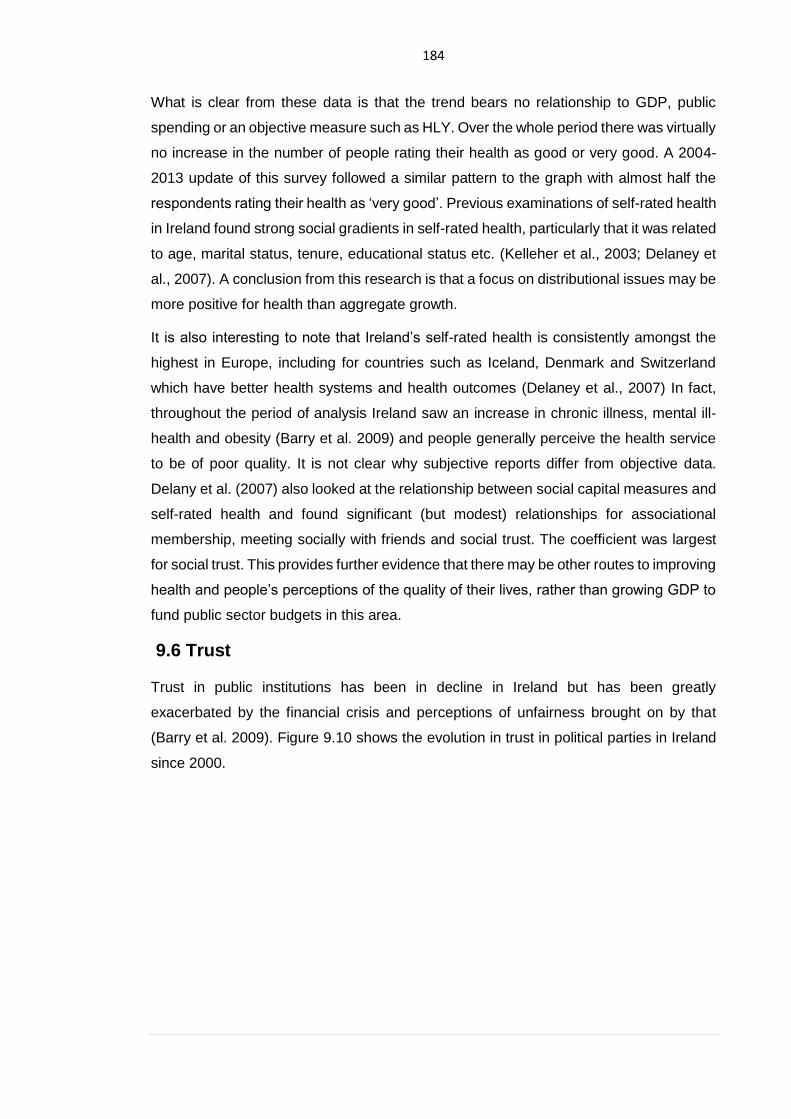
184
What is clear from these data is that the trend bears no relationship to GDP, public
spending or an objective measure such as HLY. Over the whole period there was virtually
no increase in the number of people rating their health as good or very good. A 2004-
2013 update of this survey followed a similar pattern to the graph with almost half the
respondents rating their health as ‘very good’. Previous examinations of self-rated health
in Ireland found strong social gradients in self-rated health, particularly that it was related
to age, marital status, tenure, educational status etc. (Kelleher et al., 2003; Delaney et
al., 2007). A conclusion from this research is that a focus on distributional issues may be
more positive for health than aggregate growth.
It is also interesting to note that Ireland’s self-rated health is consistently amongst the
highest in Europe, including for countries such as Iceland, Denmark and Switzerland
which have better health systems and health outcomes (Delaney et al., 2007) In fact,
throughout the period of analysis Ireland saw an increase in chronic illness, mental ill-
health and obesity (Barry et al. 2009) and people generally perceive the health service
to be of poor quality. It is not clear why subjective reports differ from objective data.
Delany et al. (2007) also looked at the relationship between social capital measures and
self-rated health and found significant (but modest) relationships for associational
membership, meeting socially with friends and social trust. The coefficient was largest
for social trust. This provides further evidence that there may be other routes to improving
health and people’s perceptions of the quality of their lives, rather than growing GDP to
fund public sector budgets in this area.
9.6 Trust
Trust in public institutions has been in decline in Ireland but has been greatly
exacerbated by the financial crisis and perceptions of unfairness brought on by that
(Barry et al. 2009). Figure 9.10 shows the evolution in trust in political parties in Ireland
since 2000.
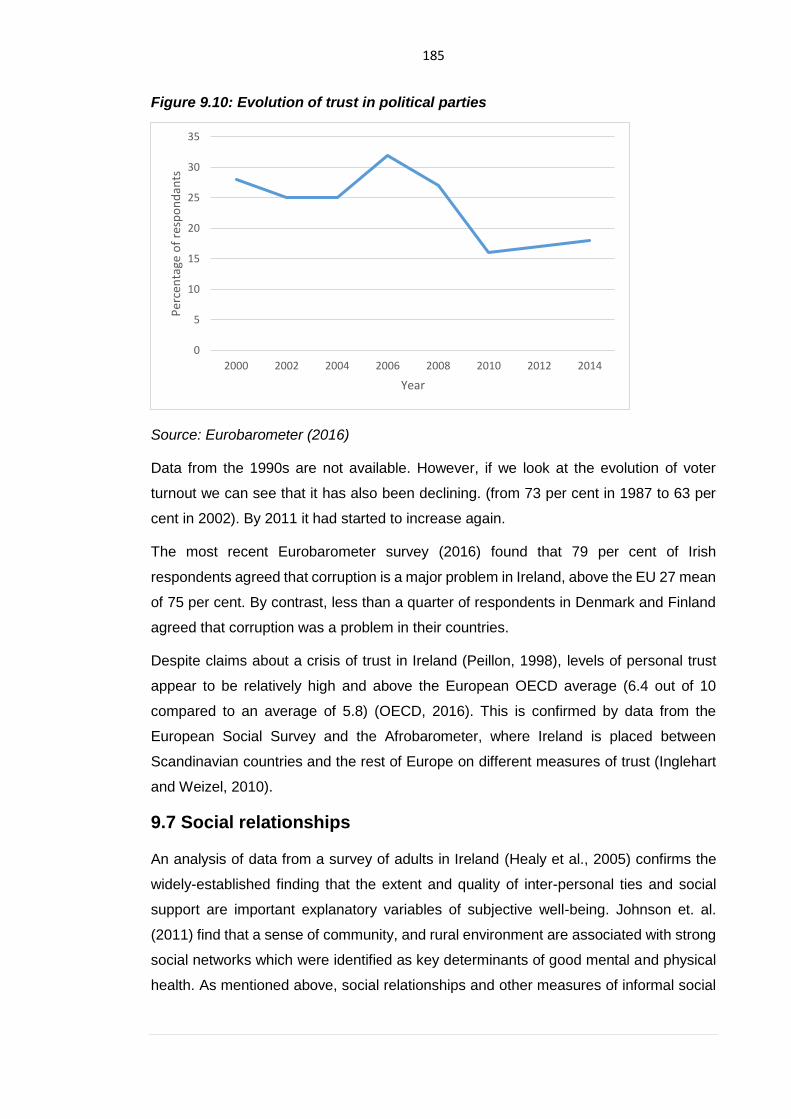
185
Figure 9.10: Evolution of trust in political parties
Source: Eurobarometer (2016)
Data from the 1990s are not available. However, if we look at the evolution of voter
turnout we can see that it has also been declining. (from 73 per cent in 1987 to 63 per
cent in 2002). By 2011 it had started to increase again.
The most recent Eurobarometer survey (2016) found that 79 per cent of Irish
respondents agreed that corruption is a major problem in Ireland, above the EU 27 mean
of 75 per cent. By contrast, less than a quarter of respondents in Denmark and Finland
agreed that corruption was a problem in their countries.
Despite claims about a crisis of trust in Ireland (Peillon, 1998), levels of personal trust
appear to be relatively high and above the European OECD average (6.4 out of 10
compared to an average of 5.8) (OECD, 2016). This is confirmed by data from the
European Social Survey and the Afrobarometer, where Ireland is placed between
Scandinavian countries and the rest of Europe on different measures of trust (Inglehart
and Weizel, 2010).
9.7 Social relationships
An analysis of data from a survey of adults in Ireland (Healy et al., 2005) confirms the
widely-established finding that the extent and quality of inter-personal ties and social
support are important explanatory variables of subjective well-being. Johnson et. al.
(2011) find that a sense of community, and rural environment are associated with strong
social networks which were identified as key determinants of good mental and physical
health. As mentioned above, social relationships and other measures of informal social
0
5
10
15
20
25
30
35
2000 2002 2004 2006 2008 2010 2012 2014
Per
cen
tage
of
resp
on
dan
ts
Year
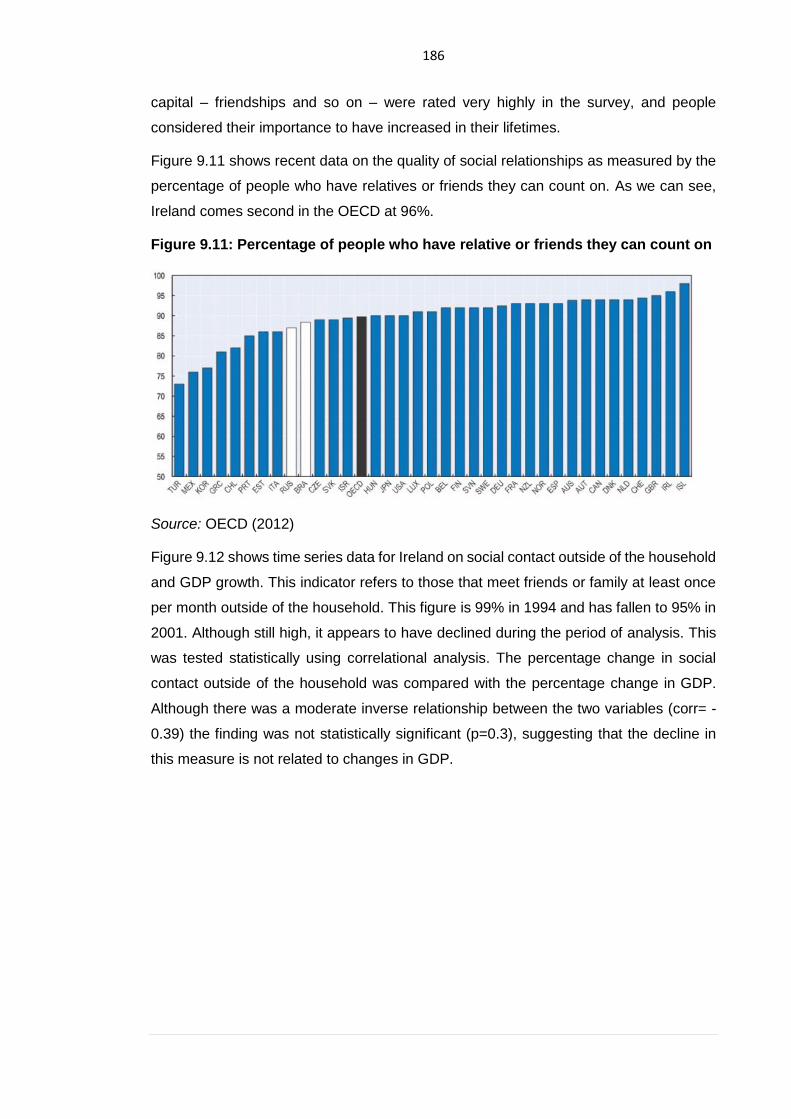
186
capital – friendships and so on – were rated very highly in the survey, and people
considered their importance to have increased in their lifetimes.
Figure 9.11 shows recent data on the quality of social relationships as measured by the
percentage of people who have relatives or friends they can count on. As we can see,
Ireland comes second in the OECD at 96%.
Figure 9.11: Percentage of people who have relative or friends they can count on
Source: OECD (2012)
Figure 9.12 shows time series data for Ireland on social contact outside of the household
and GDP growth. This indicator refers to those that meet friends or family at least once
per month outside of the household. This figure is 99% in 1994 and has fallen to 95% in
2001. Although still high, it appears to have declined during the period of analysis. This
was tested statistically using correlational analysis. The percentage change in social
contact outside of the household was compared with the percentage change in GDP.
Although there was a moderate inverse relationship between the two variables (corr= -
0.39) the finding was not statistically significant (p=0.3), suggesting that the decline in
this measure is not related to changes in GDP.
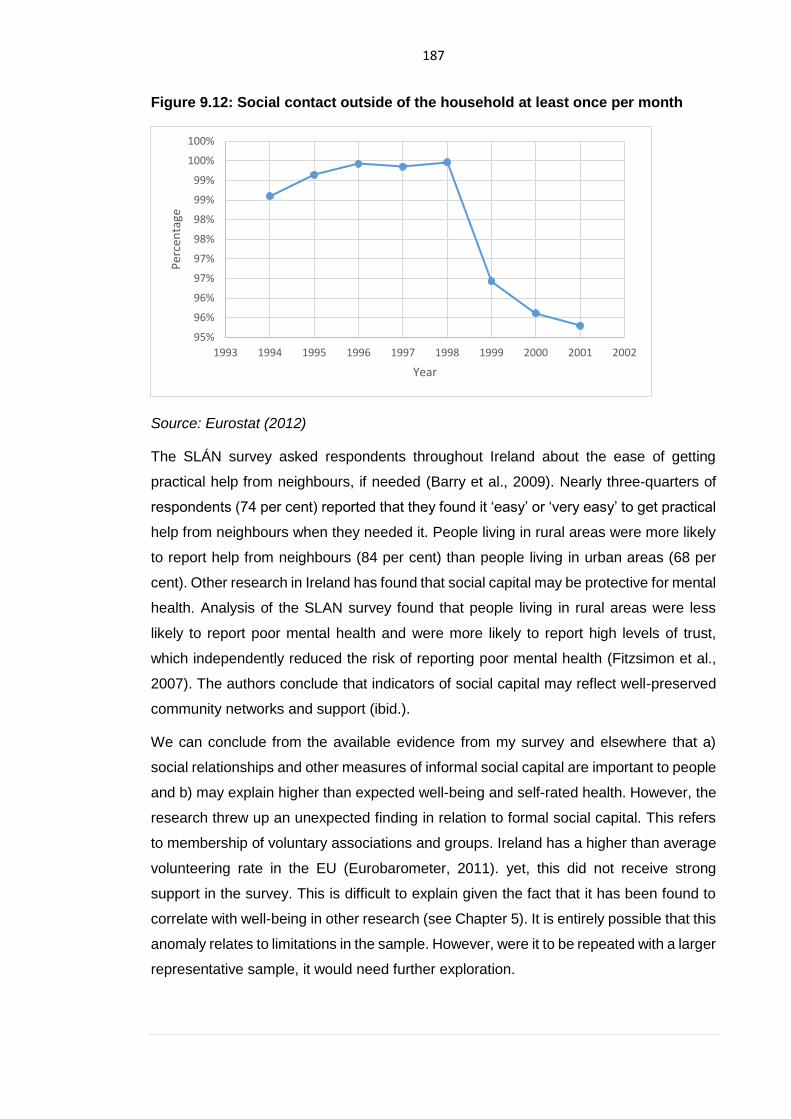
187
Figure 9.12: Social contact outside of the household at least once per month
Source: Eurostat (2012)
The SLÁN survey asked respondents throughout Ireland about the ease of getting
practical help from neighbours, if needed (Barry et al., 2009). Nearly three-quarters of
respondents (74 per cent) reported that they found it ‘easy’ or ‘very easy’ to get practical
help from neighbours when they needed it. People living in rural areas were more likely
to report help from neighbours (84 per cent) than people living in urban areas (68 per
cent). Other research in Ireland has found that social capital may be protective for mental
health. Analysis of the SLAN survey found that people living in rural areas were less
likely to report poor mental health and were more likely to report high levels of trust,
which independently reduced the risk of reporting poor mental health (Fitzsimon et al.,
2007). The authors conclude that indicators of social capital may reflect well-preserved
community networks and support (ibid.).
We can conclude from the available evidence from my survey and elsewhere that a)
social relationships and other measures of informal social capital are important to people
and b) may explain higher than expected well-being and self-rated health. However, the
research threw up an unexpected finding in relation to formal social capital. This refers
to membership of voluntary associations and groups. Ireland has a higher than average
volunteering rate in the EU (Eurobarometer, 2011). yet, this did not receive strong
support in the survey. This is difficult to explain given the fact that it has been found to
correlate with well-being in other research (see Chapter 5). It is entirely possible that this
anomaly relates to limitations in the sample. However, were it to be repeated with a larger
representative sample, it would need further exploration.
95%
96%
96%
97%
97%
98%
98%
99%
99%
100%
100%
1993 1994 1995 1996 1997 1998 1999 2000 2001 2002
Per
cen
tage
Year
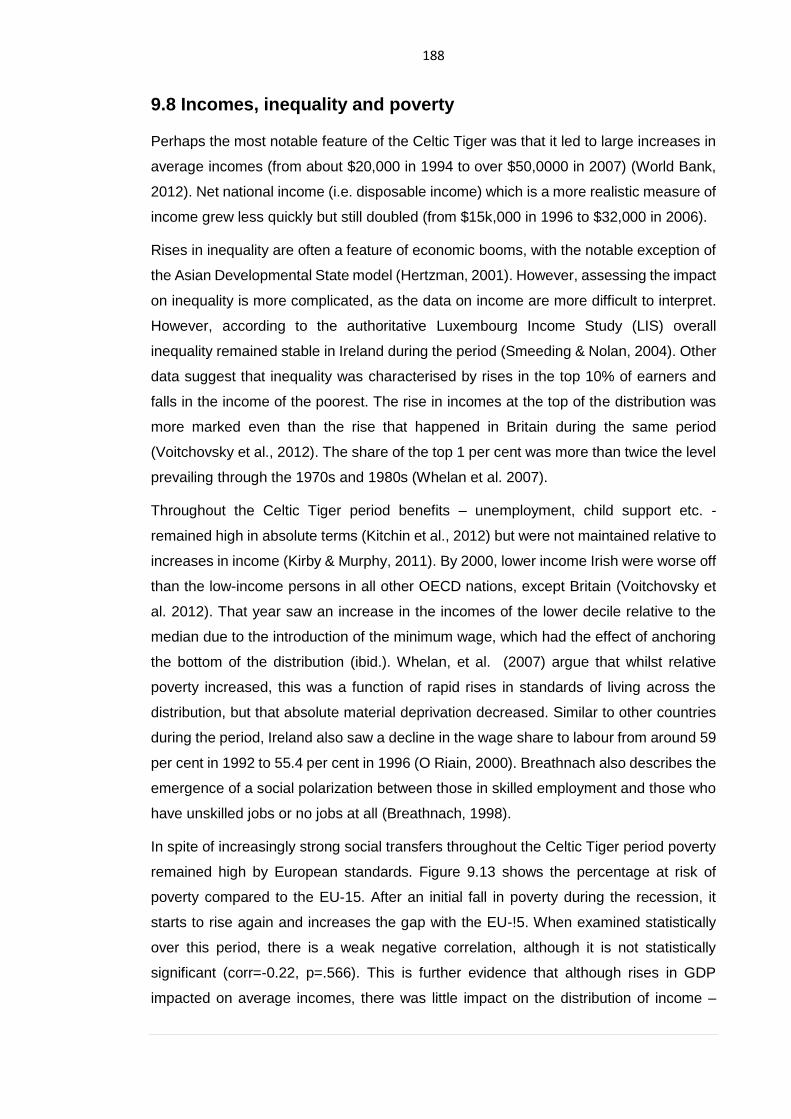
188
9.8 Incomes, inequality and poverty
Perhaps the most notable feature of the Celtic Tiger was that it led to large increases in
average incomes (from about $20,000 in 1994 to over $50,0000 in 2007) (World Bank,
2012). Net national income (i.e. disposable income) which is a more realistic measure of
income grew less quickly but still doubled (from $15k,000 in 1996 to $32,000 in 2006).
Rises in inequality are often a feature of economic booms, with the notable exception of
the Asian Developmental State model (Hertzman, 2001). However, assessing the impact
on inequality is more complicated, as the data on income are more difficult to interpret.
However, according to the authoritative Luxembourg Income Study (LIS) overall
inequality remained stable in Ireland during the period (Smeeding & Nolan, 2004). Other
data suggest that inequality was characterised by rises in the top 10% of earners and
falls in the income of the poorest. The rise in incomes at the top of the distribution was
more marked even than the rise that happened in Britain during the same period
(Voitchovsky et al., 2012). The share of the top 1 per cent was more than twice the level
prevailing through the 1970s and 1980s (Whelan et al. 2007).
Throughout the Celtic Tiger period benefits – unemployment, child support etc. -
remained high in absolute terms (Kitchin et al., 2012) but were not maintained relative to
increases in income (Kirby & Murphy, 2011). By 2000, lower income Irish were worse off
than the low-income persons in all other OECD nations, except Britain (Voitchovsky et
al. 2012). That year saw an increase in the incomes of the lower decile relative to the
median due to the introduction of the minimum wage, which had the effect of anchoring
the bottom of the distribution (ibid.). Whelan, et al. (2007) argue that whilst relative
poverty increased, this was a function of rapid rises in standards of living across the
distribution, but that absolute material deprivation decreased. Similar to other countries
during the period, Ireland also saw a decline in the wage share to labour from around 59
per cent in 1992 to 55.4 per cent in 1996 (O Riain, 2000). Breathnach also describes the
emergence of a social polarization between those in skilled employment and those who
have unskilled jobs or no jobs at all (Breathnach, 1998).
In spite of increasingly strong social transfers throughout the Celtic Tiger period poverty
remained high by European standards. Figure 9.13 shows the percentage at risk of
poverty compared to the EU-15. After an initial fall in poverty during the recession, it
starts to rise again and increases the gap with the EU-!5. When examined statistically
over this period, there is a weak negative correlation, although it is not statistically
significant (corr=-0.22, p=.566). This is further evidence that although rises in GDP
impacted on average incomes, there was little impact on the distribution of income –
189
either relative poverty or inequality.
Figure 9.13: Percentage of people at risk of poverty or social exclusion
Source: Eurostat (2012)
9.9 The environment
The 20th century was the warmest of the last millennium in the Northern Hemisphere
(Sweeney et al., 2003) and six of the ten warmest years in Ireland have occurred since
1990. The implications of a warming climate vary for different parts of the world.
However, it seems likely, in general, that there will be an increase in rainfall and extreme
weather events (Charlton et al., 2006). These environmental changes will have
implications for the social and economic indicators that I have been discussing in this
chapter. For example, a recent study on the economic impact of climate found that if
climate change is not addressed, 77% of countries in the world would see a drop in per
capita incomes relative to current levels, with global incomes falling 23% by 2100
(Seaman, 2015). Once we start to factor in the non-economic costs to human and natural
life, the situation is even more critical.
In 2008 the Environmental Protection Agency commissioned a new set of accounts for
the period 1990-2005 that incorporated some new data on emissions and pollutants. The
researchers encountered major challenges in terms of data limitations (Lyons et al.,
2008). The accounts concluded that several emissions have grown very fast over the
period. Ireland’s Greenhouse Gas Emissions peaked in 2001 and have decreased by
17.4% to 2012 on 1990 levels. However, under best-case scenarios, assuming the full
implementation of government policy it is expected that there will be overall rises in some
sectors such as agriculture and transport by 2020 (EPA, 2017). Whilst Ireland met its
2012 Kyoto target to reduce emissions by 13% on its 1990 target, it is believed that this
0
5
10
15
20
25
30
35
2003 2004 2005 2006 2007 2008 2009 2010 2011 2012 2013 2014
Per
cen
age
of
the
po
pu
lati
on
Year
European Union (15 countries) Ireland
190
was primarily caused by a fall in demand because of the recession (Environet, 2017)
during which Ireland experienced the biggest drop in energy consumption in the EU
outside Lithuania (Eurostat, 2013). The next milestone is the 2020 targets set by the EU.
Since the country started to grow again it looks unlikely that it will achieve them (EEA,
2014). Further analysis of the carbon intensity of growth from the period finds that
although there was a drop in the amount of CO2 for each unit of output (Breakthrough
Institute, 2012), this was due to a process of deindustrialisation, rather than as a result
of a decarbonisation of the economy. Some countries such as Sweden and France have
managed to achieve rapid decarbonisation by pursuing a state-led strategy to
decarbonise their energy supply and deploy scalable zero-carbon technologies.
Further evidence of why this is not a proactive strategy comes from the fact that much of
Ireland’s remaining sources of emissions are highly energy intensive. Agriculture is a
major contributing factor (about three times that of the EU-27). This also provides an
interesting example of how economic development and environmental policy can clash.
Ireland is the 4th biggest beef producer in the EU and the beef industry is worth €1.8
billion. Although emissions had been falling from agriculture, in line with its share of GDP,
the latest policy departure to promote the beef industry (Food Wise, 2025), will almost
certainly lead to an increase. Maintaining (and indeed expanding) this agricultural base
poses a significant barrier to achieving the reductions that are required.
The lack of action on the environment, and the inability to use the proceeds of growth to
meet emissions targets (itself a weak form of sustainability) suggests a bad
environmental record, particularly as it left the country open to large costs. These will be
felt directly in terms of fines and the cost of climate credits from the EU but also indirectly
from failure to invest in mitigation measures e.g. flood defences. During the growth years,
concerns were often voiced about environmental impacts: "While incomes have risen,
urban dwellers face increased road congestion, longer commuting distances, housing
shortages, increased noise etc." (Clinch et al., 2006, p. 166). These issues were often
raised in the media: this from a popular economics book at the time: "every morning and
every evening, traffic snakes around the arteries of this country, bumper to bumper,
snarling, fuming crashing and maiming," (McWilliams, 2007 p45.). The ‘spiritual’ impacts
were also of concern:
growth that is squalid and blighted, a liberal culture that is shallow and vulgar, a new emancipated subjectivity that is aimless and listless, a promiscuous and indiscriminate “openness” to the new, ... a derision of past beliefs and ideals, softened by a note of nostalgia and wistful romance for their passing ...’
(Keohane and Kuhling, 2006, p. 40).
191
The dystopian vision of endless commuting, pollution, never-ending sprawl and moral
and spiritual decline never materialised, and we know with hindsight that these
observations were consistent with the late stages of a bubble. Nonetheless, it is certainly
the case that few notable environmental policies were pursued during the Celtic Tiger
period, and perhaps the most damaging legacy was not the inaction during that time but
the fact that the subsequent recession seriously arrested environmental policy.
Opposition politicians failed to link the unsustainability of policy in relation to banking,
housing and employment with environmental sustainability by identifying short-termism
as a common failure across these areas of policy.
9.10 Conclusion
Ireland experienced rapid and unprecedented GDP growth between 1994 and 2007,
which culminated in a collapse in key sectors and led to a deep and protracted recession.
In chapter 6, I argued that the aggregate nature of the GDP statistic failed to differentiate
between the quality of different forms of growth in Ireland and masked dependence on
sectors sensitive to bubbles such as housing. It also failed to provide any early warning
system that such a collapse was imminent, Instead, it contributed to procyclical decision-
making by suggesting that existing policy was working and should be maintained.
In this chapter, I have widened the analysis out to include additional economic and social
outcomes that were identified as important in my survey. From the data that have been
presented here, there is limited evidence that GDP has directed policy to improve
societal outcomes, or that growth has translated into positive improvements in the things
that people value. Growth may well play some positive role, but except for employment,
no other statistically significant relationships were observed. However, the analysis was
severely hampered by data quality and it is difficult to reach any firm conclusions.
Nonetheless, given the methodological nature of this thesis and its contribution, this does
not undermine the contribution that the research makes. Indeed, the systematic
approach that has been taken to identifying the things people value and exposing data
gaps in areas of major importance to human happiness is itself a contribution. I will return
to this again in 10.3 when I discuss the role of data in politics.
In the next chapter I will reflect on the success of the measure, especially as a guide to
policy and explore the policy implications from this analysis
192
Chapter 10 Conclusion
10.0 Introduction
This thesis aimed to develop a measure of social value that is sensitive enough to reflect
the impacts of economic and social change but robust enough to be used to develop
policies, and to function as an evaluative measure of the success of those policies.
Existing approaches to capturing social value are either conceptually and
methodologically flawed (GDP), or too stable to be policy relevant (SWB). Throughout
this this thesis I have highlighted the shortcomings of these approaches and made a
case for the development of a new approach that reflects the things that matters to
people, and provides a process through which goals can be collectively set and policy-
makers can be held to account. A contribution of the thesis is the development a
conceptual framework for designing the measure and its application to the example of
Ireland. In this final chapter, I reflect on the success of the measure by assessing its
relevance to policy that is the extent to which it identifies a different set of policy
proposals to the ones currently being pursued.
I begin with a summary of the findings summarising each chapter in turn. I then go on to
discuss the measure with reference to two worked examples: mental health – a highly
valued outcome - and the environment – which is the archetypal constraint within the
framework. As such they ‘represent’ the things that people subjectively care about and
objectively ought to care about in line with the theoretical arguments set out in Chapter
3. Policy implications within these two areas are discussed. A final policy conclusion to
emerge relates to the management, use and ownership of data by the Irish government
and governments more generally. Data has been described as the ‘oil’ of the Information
Age (Chazan, 2016), yet the public sector is in many areas withdrawing from the
collection and ownership of data. I recommend a new information strategy for Ireland
and make an argument for data as a public good, and the need for collective ownership
of certain types of data. I conclude by reflecting on the contribution of the thesis, the
lessons learned and identify some future research questions that it raises.
10.1 Chapter summary
I opened in Chapter 1 with a discussion of the idea of progress, how it has developed
since ancient times and the problems that have become associated with it. I describe the
optimism placed in data and measurement to improve societies that emerged during the
Enlightenment how it reached a high point in the late 19th/early 20th century before going
into decline. Despite many positive contributions that can be linked to the reforming zeal
193
of earlier progressives, I explain why I am eschewing the term progress and offer an
alternative term ‘social value’ to describe the end goal of a collective system of
measurement. Due to the controversy surrounding the whole idea of measurement, I
make a case for why I think it is important. I argue that we need a basis for collectively
deciding goals and being able to hold policy-makers to account and that some form of
aggregate measurement is necessary to achieve this. To date, national measurement
has been dominated by economic measures – exemplified by GDP - and disciplines such
as sociology have taken a back seat. I conclude the chapter by setting out the research
questions and overall design.
Chapter 2 begins by describing how GDP was developed and rose to dominance in most
developed countries. It then goes on to document the reactions against this. Although
criticisms came from many quarters, in this chapter I focus on four influential
developments from across the social sciences, which all began in the 1970s: The Limits
of Growth, the Easterlin Paradox, postmaterialism and the multiple capitals approach. I
then go on to discuss the alternatives to GDP that have been influenced by these
critiques, focusing on three categories: adjusted GDP, composite indicators and
dashboard approaches. Following a discussion of the attributes of each, I make a case
for composite indices. The chapter concludes with a brief discussion of the political
issues that have enabled GDP to remain dominant in the face of overwhelming criticism.
A central critique of alternatives is that they are often not based on clear theoretical
foundations, especially those that take GDP as a starting point and add or subtract from
it. In Chapter 3 I begin to develop the conceptual framework that will inform the primary
data collection for the research. It starts with a discussion of the history of value theory
beginning with Socrates. I describe how ancient philosophers - Aristotle, Seneca,
Epicurius and Pyrrho - all prefigured the modern theories of value: objectivism,
hedonism, desire theory as well as neo-Aristotelianism. I describe how desire theory as
measured by revealed preference has influenced economics and the use of GDP as a
proxy for welfare. This discussion led to a hybrid theory, which draws mainly on objective
list and desire theory, and combines subjective and objective perceptions of value. This
forms the basis of the conceptual framework -‘constrained utilitarianism’ - which takes
account of subjective perceptions of value but applies a constraint to those preferences.
A paradigmatic constraint which I return to throughout the thesis is the environment.
Evidence tells us that the environment is vital to the maintenance of our well-being even
though it tends not to be highly valued. Chapter 4 discusses the environment in more
detail and why it should qualify as a constraint. Arguably, it is an interesting case because
it is a flashpoint for the tension between subjective and objective data. I advocate
194
Neumayer’s (2004) definition of sustainability - bequeathing the conditions of non-
declining welfare - as it does not hold us directly responsible for maintaining welfare after
we die so long as the conditions for welfare generation are present. This definition allows
for the exploitation of environmental capital as long as it is not critical natural capital i.e.
natural capital that cannot be substituted and which excessive consumption of which is
irreversible. Due to the non-substitutability of some forms of capital, I recommend
keeping a separate environmental account that must maintain the stocks of critical
natural capital above zero. This functions as a constraint within which people can choose
different priorities so long as they do not deplete the stock of natural capital in an
unsustainable way.
In Chapter 5 I described the methodology for the primary research and the empirical
analysis for selecting indicators. The chapter returns to the issue of subjective and
objective data and the epistemological challenges of combining them. I make a case for
case study research, discuss reflexivity and describe the research design including
survey design, data selection and analysis. A key argument that I develop is to question
the requirement that data in national indices are comparable. I make the case that
comparability reduces the specificity of indicators and their relevance to the national
context and therefore policy. The second part of the chapter reviews the determinants of
well-being. The aim of this section is to identify from this literature a ‘long list’ of indicators
that would inform the design of the survey. In this way, subjective and objective
perceptions of value are combined in line with the conceptual framework.
In the second part of the thesis, I apply the framework to the example of the Republic of
Ireland. In Chapter 6 I describe the history of Irish economic development. I briefly
discuss the long period of economic underperformance from the foundation of the State
in the 1920s to the end of the 1980s. I then describe the domestic and external policies
that led to the ‘Irish Model’ better known as the Celtic Tiger. The strengths and
weaknesses of the model are discussed, as are the reasons for its eventual collapse. I
conclude the chapter with further discussion of the reasons why Ireland makes an
interesting case study for this research.
In Chapter 7 I describe and operationalise the conceptual framework. I begin by
presenting it in diagrammatic form and discussing the principles that underpin it. These
include, transparency, focusing on ends, rather than means, combining subjective and
objective data and cultural specificity. The measurement of attitudes and values are then
discussed. I introduce the Kahneman’s idea of fast and slow thinking and argue that a
consultation such as this should allow people to conduct slower, more deliberative
thinking, which may depart from their everyday behaviour. This index should therefore
195
reflect the way we would like society to be, rather than the way it is. I then go on to
describe the type of multivariate analysis that was applied to the dataset.
Chapter 8 presents the findings from the survey. I begin by reporting on the things that
people value, this includes evidence of changes in valuations over time, the amount of
income people believe they would need to make them happy and their own subjective
well-being. The results of the primary research suggest a strong emphasis on non-
material and non-economic factors in people’s lives, which differs very much from the
direction of policy in Ireland over the past number of decades. The income threshold that
was most commonly selected was far higher than average incomes - or previous
research on this question - including research for Ireland. I discuss issues with the way
these data were captured and suggest explanations for the discrepancy. I conclude the
chapter with some additional statistical analysis of the dataset. Using Chi Squares, I test
two null hypotheses 1) that there is no relationship between gender and overall
valuations and 2) that there is no relationship between religion and overall valuations. In
both cases I reject the null. Although, there is no evidence that men are more materialistic
than women, women tend to value all of the outcomes more highly than men. It is difficult
to interpret why this is the case. There is a significant relationship between religious
affiliation and certain groups of values, although the interpretation of these is not always
straightforward. Then, using Ordered Probit I test the null hypothesis that there is no
relationship between material goals and self-reported subjective well-being. The findings
are mixed. There are some weak relationships that would support the hypothesis but as
with other areas it is undermined by the size of the sample and data quality. Demographic
variables such as age and employment status were found to correlate with life
satisfaction in a way that is consistent with the literature, however, there is no strong
evidence of a relationship between materialism and lower SWB. The findings from the
PCA are then presented along with the final list of indicators for inclusion in the index.
Drawing mainly on international data sources such as Eurobarometer and the OECD I
suggest indicators for the outcome areas. However, due to a lack of time series data it
is not possible to complete the final steps for index construction. The outcomes are
instead presented in dashboard form for the remainder of the analysis.
In Chapter 9, I discussed the secondary data and literature that exists on the successes
of failures of the Celtic Tiger in generating social value in Ireland. This assessment is
based on the 10 outcome areas that have been identified in the primary research.
Although data gaps prevented these from being constructed into an index, it is possible
using the data that are available to look at relationships to GDP during some or all of the
Celtic Tiger period. Partial data are available for the following:
196
• Mental health
• Income inequality
• Poverty and debt
• Physical Health
• Employment
• Education
• Social capital/trust
No data were available on:
• Public service quality
• Use of time
• Relationships
Changes in SWB and the environment are also discussed in light of their importance to
this research. This section is severely hampered by lack of adequate data, both in terms
of time series and range of indicators measured. Working with the best available data, I
review trends and calculate correlations with GDP where possible. The analysis found
little change in most social indicators and, excepting employment few have correlated
with changes in GDP during that period. Instead most indicators throughout periods
appear resilient to rises and falls in economic fortunes.
This chapter concludes the thesis by reflecting on the usefulness of measure, specifically
its application to policy. I also reflect on the primary research and lessons that were
learned. I discuss the contribution of the thesis and describe the need for a new data
strategy for Ireland and set out new areas of research in this field.
10.2 Reflecting on the ‘use’ of the framework
The influence of utilitarianism not just on moral and political philosophy but also on social
policy has been profound. The guiding question that Bentham asked, “What use is it?,”
has been described as the ‘cornerstone’ of policy making in the 21st century (Driver,
2014). Bentham thought that this question was the test of any instrument of the state. It
is therefore appropriate to conclude this thesis with a discussion of the practical
application of the measure and its usefulness as a guide to policy.
Ten outcome areas emerged as being the most important to people in this research. In
the previous chapter I gave an overview of each of these. A discussion of the policy
response in each outcome area is outside the scope of this thesis. Instead, I will focus
on two ‘worked examples’: mental health and the environment. Mental health was
selected because it received the highest scores in the survey. The environment was
chosen because it was an example of a constraint, and as discussed in Chapter 8, it is
an area that does not receive a lot of public support. As discussed in Chapters 4 and 9,
it is also an area where we know that there is sometimes a direct trade-off between
197
environmental goals and growth. The question to be addressed in this section is how we
would organise a society where a) good mental health was a central goal and b) we
aimed to bequeath the conditions of non-declining welfare to future generations.
10.2.1 Mental health – a worked example
One of the strongest findings to emerge from the primary research was the value that
people place on good mental health all things considered. The survey distinguished
between mental health as a specific construct separate from measures of positive well-
being (self-esteem, control over one’s life, feeling like life is worthwhile etc.). It is perhaps
unsurprising that mental health and the positive measures of well-being were ranked
highly. Of course, positive psychological states are important to feelings of happiness.
On the other hand, the extent to which people recognised this was notable; as well as
being the only outcome to score above 9/10, across the whole ranking there was the
largest distance between it and the next determinant (0.34).
Although it is widely hypothesised (e.g. Hochschild, 1989; 1997; Schor, 1998), there
have been few attempts to establish causal relationships between economic and social
systems and mental health outcomes. Whilst the socio-economic determinants of mental
health are well understood these are rarely discussed from a structural or macro
perspective i.e. what type of society is likely to produce the conditions under which
mental illness thrives and what type is not. Prevention is usually understood at the
individual level i.e. what behavioural changes can people take to reduce risks and
stressors, although many of the most well-documented stressors such as poverty are
not things that people necessarily have control over. One strong piece of evidence for
environmental determinants comes from the international prevalence data where we see
major differences between developed countries (WHO) - with the US having three times
the prevalence rate of countries like Italy and Spain – this gap is still sizeable when
cultural differences are considered (Bromet et al., 2011). In addition, the countries with
the lowest prevalence rates in the World Mental Health survey also report the lowest
levels of impairment associated with those disorders, suggesting that the variation is not
just a function of differences in diagnostic thresholds (Andrade et al. 2003). Furthermore,
there is evidence that immigrants in the US quickly increase their risk of mental health
problems, especially if they do not live in native ethnic communities (Weiss, 2005). These
data suggest that the way societies are organised, at least in part, impacts on our mental
health.
The focus on prevention has taken on greater importance in recent years, partly because
of the failure of rehabilitative measures to reduce the demand for treatment. On many
198
measures, mental illness appears to be on the rise in developed countries: in all
European countries for which data are available, the consumption of antidepressants
has increased over the past decade (by over 80% on average across EU member states)
(OECD 2012). Governments are increasingly concerned about the costs of depression,
not just the costs of treatment but its impact on wider health, social and economic
outcomes (Cyhlarova et al. 2010). A recent study by the World Health Organisation
(2011) has reviewed the evidence on the relationship between recessions and mental ill-
health. This is the first international report of its kind to take an almost entirely structural
approach to the issues. Factors that were found to be detrimental to mental health are:
poverty, poor education, debt, negative early childhood experiences, unemployment, job
stress and insecurity and alcohol/drug use. Protective factors include social capital,
welfare provision, positive early childhood experiences and healthy lifestyles (World
Health Organisation, 2011). In a statement that points explicitly to the limitations of a
treatment-based approach, the report states that: “the health sector cannot achieve good
mental health alone. The determinants of mental health are often outside the remit of the
health system, and all government sectors have to be involved in promoting mental
health” (WHO, p.4). The report is also the first of its kind to link economic crises to mental
health outcomes56 and argues that certain types of economic systems are better placed
to weather them than others.
These are interesting questions to discuss with respect to Ireland. Although it is not
possible to cover each risk and protective factor for mental health, I will focus on two:
welfare spending and alcohol policy. In 2014 Ireland introduced its eighth austerity
budget since the financial crisis. Over €30bn in austerity measures have been introduced
equating to over 15% of GDP. Most of this has been in spending cuts (roughly two thirds)
and only one third through revenue increases (Nevin Institute, 2013). Supporters of
austerity point to improvements in other economic data: Ireland moved out of recession
in 2013, there has been a recovery in the property market and unemployment has
peaked and begun to fall. The pain, such or so the argument goes, was worth it. As I
have been arguing throughout this thesis, the problem with this is that short-term
changes in GDP only give a partial picture. Not only does this not take account of what
impact the removal of social supports have on people or the environment, it may also
mislead us to the health of economic fundamentals i.e. to what extent is the recovery
based on solid and sustainable sources of employment and growth? It is not clear how
resilient the economy will be to further exogenous shocks. Neither is it a guide to the
56 This report was followed in 2014 by an international report on the social determinants of
mental disorders (World Health Organisation, 2014).
199
quality of that growth in terms of how equitably it is distributed, how employment intensive
it is or how environmentally sustainable it is. Social safety nets are thought to be
protective of mental health by providing a buffer against the impact of other risk factors
such as indebtedness.
Alcohol consumption is negatively associated with population mental health in most parts
of the EU, especially suicide amongst men (World Health Organisation, 2011). Though
this is often framed as a matter of individual behaviour, the WHO report describes alcohol
policy that controls the price and availability of alcohol as the most effective and cost-
effective way of reducing death from alcohol use. Alcohol consumption increased by 41%
during the 1990s in line with liberalisation of the licencing laws in Ireland. As discussed
in the previous chapter, Walsh and Walsh (2011) attribute this policy change at least in
part to the very rapid increase in suicide mortality among young Irish males during the
1990s. Although the 2015 Alcohol Bill proposed strong measures to limit the availability
and increase the price in alcohol it has been criticised for not going far enough, for
example by allowing drinks companies to continue to advertise at sporting occasions.
This is a further example of where GDP (or government revenues) are dependent on an
area that may, at least in part, be destructive of social value.
Responding to these data, and the findings from the WHO study quoted earlier, would
imply more robust and preventative policy. Tackling the root causes of mental ill-health
and protecting societies from them would have far reaching implications. Family support
measures relating to childcare, maternity/paternity care and flexible working
arrangements, this would include informal parent support systems to build social capital
and provide peer support networks aimed at families such as parenting and
psychological support. More effective ways to deal with personal debt would also be
required, including access to finance strategies with ministerial oversight, tougher
controls on predatory lending and gambling and more proactive debt relief programmes.
In light of the evidence linking alcohol to mental ill-health, more robust, evidence-based
policies are required to limit availability and reduce demand through pricing. Employment
is a strong predictor of well-being in and of itself and also protects against poverty, which
is another major determinant of mental ill-health. Although active labour market policies
have been pursued for years, these are very supply-side; over-focused on skills rather
than job creation. A job guarantee is a simple idea that would guarantee everyone a job
by the state. Employment could be created that was aligned to social value creation
e.g. jobs in community organisations or the public sector. Recipients would be allowed
to phase out their benefits over time as well as earn skills and experience to enable them
to move on from the scheme. A final area that would require a new policy direction is
200
social capital. Like employment, it was shown to very socially valuable in and of itself,
but it is also an important determinant of mental health. More could be done to ‘design
in’ social capital to the planning of towns and village by increasing the availability of good
quality homes and creating social opportunities and walkable neighbourhoods. In
Ireland, the policy of promoting rurality appears to be positive for social capital and
communities need to be supported to remain there through more flexible working
arrangements and better local infrastructure. Alongside this government should
commission research to build the evidence base on policies that enhance and limit social
capital.
10.2.2 The environment – a worked example
In Chapter 9, I discussed Ireland’s progress on environmental outcomes and the need
for urgent action to reduce emissions if Ireland is to have any chance of meeting EU
targets. Decarbonising the energy supply is one way to reduce emissions without
harming growth, so-called clean growth. However, this is a major task and one where
Ireland has been making slow progress. Although the impacts of these policy failures are
experienced internationally, Ireland is facing punitive EU fines in 2020 for failing to make
its contribution towards EU-wide emissions reductions.
Ireland has abundant renewable energy resources including wind, water, tidal, and
biomass with some of the highest average wind speeds and the largest wave energy
resource in Europe along its west coast. North and south of the border both governments
have set targets of 40% for renewable electricity generation by 2020. As wind is the
most mature of the renewable technologies it is expected to be the biggest contributor
to fulfilling these targets (McGarrigle et al 2013). This means that 37% of the target is
expected to be met by wind with other forms of renewables expected to make up the rest
(ibid.). By contrast wave energy is in its infancy and is not yet commercially viable.
However, it is estimated that a very large global resource for wave energy exists if the
challenge of integrating it into electrical grids could be met (Deane et. al. 2012). The
Sustainable Energy Authority of Ireland estimates that Ireland has a wave energy
resource of as much as 525Twh, compared to the roughly 30Twh needed in Ireland per
year (SEAI, 2016). The Irish Government has set a goal to make Ireland a world leader
for research and development of ocean energy technologies and an ambition to achieve
at least 500 MW installed generating capacity from ocean energy by 2020 (Deane et al,
2012). The problem with these source of energy is that we do not currently have the
technology to store the energy produced. In general, the more fluctuating energy
sources, such as sun and wind power, are connected to the grid, the more difficult it is
to ensure grid stability. Supply and demand must be balanced always. If they are not,
201
the resulting fluctuations in voltage and frequency can disrupt or even destroy electronic
equipment. What these resources need is a means of storing energy at large scale and
low cost that can be adapted anywhere.
Nonetheless, even if policies to produce and store renewable energy were available, this
is only one part of the solution. If we accept that the carbon intensity of growth cannot
be reduced at a fast-enough rate to achieve the required emissions reductions described
in previous chapters, it may be necessary to think about how best to reduce emissions
without directly manipulating growth rates to that end. Measures to curb certain types of
consumption and to regulate polluting industries are also required. The range of policy
instruments to assess environmental impacts is very limited and tends to focus on
regulation and (in the case of agriculture) on subsidies. Relying too heavily on regulation
and confiscation risks alienating an already sceptical public. There is a limited use of
pricing to promote certain kinds of behaviours and economic activity and to signal
scarcity. The recommendation here is to make much greater use of this by reforming
the tax system to promote social value creation as described in this thesis.
A more comprehensive form of environmental taxation is known as Environmental Fiscal
Reform (EFR). Environmental Fiscal Reform involves shifting revenue‐raising
instruments from labour and capital to resource use and pollution. Policy instruments
include taxes; charges; or auctioned permits in an emissions trading scheme. The reform
could be designed to be revenue neutral or revenue raising (EEB, 2016). In 2010, the
European Environment Agency prepared a paper on EFR in Ireland (Andersen et al
2010). The paper argues that EFR could be positive for other areas of social need:
productivity, employment, innovation, health and equality. It is possible to envisage how
EFR could be designed to promote objectives like rural development for example. A risk
with EFR is that the burden of taxation falls on the poor and careful design of policy is a
necessary requirement. It should also be remembered that poorer sections of the
community already suffer most from poor environmental quality and access to green
space, EFR should improve this as well as reduce more regressive taxes such as VAT
and labour tax with a greater focus on young and unskilled workers (see Blobel et al,
2009).
The EEA report estimated that such reforms could generate up to €5 billion in extra
revenues by 2021, which could be used to promote things like investment in mental
health. Drawing on a wealth of research into barriers to initiating EFR the authors argue
that the main barriers are political i.e. a low level of acceptability of such taxes. It is well-
established that for taxes to work they need to have a high degree of acceptability
(Cherry, 2014). This was underlined by the recent protracted controversy in Ireland on
202
the introduction of water charges, which have now been abandoned (O’Halloran, 2016).
This was partly due to the perception that water charges were ‘imposed’ as part of a
series of stringent austerity cuts agreed with the troika. The details of the water debate
are outside of the scope of this thesis, suffice to say that the mishandling of the approach
reduces the likelihood that ‘polluter pays’ taxes will have further traction in the short-term.
Throughout this thesis, I have argued for a balance between the views of the public on
what matters in a society with what policy makers may objectively think is in the public
interest. One of the purposes of this thesis was to develop a framework that would
provide guidance as to the ‘settlement’ between public and expert opinion. The
environment is a key flashpoint where these views diverge. Even in the face of opposition
to environmentalism, governments could do more to use instruments such as fiscal policy
to promote pro-environmental behaviour by compensating people for losses elsewhere
in the taxation system. The intention is that this would ‘join up’ thinking on environmental,
social and economic policy, and make visible the trade-offs between them including
where the gains and losses fall for different communities. Drawing on these two worked
examples, I conclude in the next section on how successful the approach has been at
achieving this objective.
10.2.4 Reflecting on the success of the framework
A key question for the research relates to how successful the final indicator set is at
measuring things that people value. The first point to make is that it is an uncontroversial
list. We can see all the elements there that we would expect to see, and it shares
similarities with other kinds of indices such as the OECD Better Life Index. It is also
similar to the things that have emerged from qualitative studies of the things that matter
to people (e.g. Hyman, 2014). This is reassuring, as it does not require me to provide
external validation for aspects of the selection. Of course, it has not been possible to
apply the approach in a real-life situation, which is a true test of how successful it is.
What I have done is reflect on how it would translate into policy e.g. if we were to design
an economic system that minimised mental health problems and maximised
environmental protection. It is in this way that it also differs from other approaches. For
example, the OECD dashboard approach is simply a list of OECD-selected indicators
that are used for comparing country performance. Not only have I argued against this
comparability objective but by asking people to score items in relation to how valuable
they are, we can see a clear prioritisation of what matters in the data These findings
suggest that a world that pursued goals over and above GDP would indeed pursue
different policies, and that these may result in different societal outcomes. In addition,
the OECD approach ignores any trade-offs between different areas of policy, and
203
assumes therefore that different forms of capital are substitutable. As outlined in Chapter
4, this could result in an overestimation of the social value created by a country.
In addition to this, the process of how decisions/policies are arrived at also matters. The
most notable feature of the political landscape in the 21st century in Europe and America
in recent years has been the rise in populist parties, and dissatisfaction with the political
‘system’. We could go so far to say that there is a something of a crisis in traditional,
representative democracy where people don’t feel represented but instead feel alienated
from a political class that does not look and speak like them, nor share their concerns. It
is into this vacuum that populist candidates of all political stripes have stepped.
Nonetheless, whoever is in power still faces the challenge of balancing competing
interests: present and future generations, local, domestic and international, short and
long run. As well as responding to people’s concerns they will also need to find new ways
to bring the electorate with them. A more participatory system where clear collective
goals are enunciated and where evidence is used carefully to promote policymaking may
have a role to play. There is also some evidence that participatory political regimes
deliver high quality growth in terms of jobs and job quality. Rodrik argues that this
approach leads to superior institutions that respond better to local need (Rodrik, 2000).
He argues that it is possible to create a virtuous circle where participatory system creates
higher quality growth which strengthens institutions further.
A final reflection on the framework, is the observation that very little change took place
across any of the indicators that I analysed in Chapter 9. This may have been a limitation
with the data or time period over which it was being assessed. However, we cannot rule
out that very little changed socially during the Celtic Tiger period. Contrary to the idea
that it was a period of huge upheaval, perhaps there was much more continuity than we
have been led to believe. On the other hand, considering other long run data on well-
being, little or no movement in social indicators is perhaps not as much of a surprise as
it should be. The findings from the happiness literature clearly show that welfare can
reach a maximum, or that growth of welfare will tend to zero (van den Bergh, 2010). It is
entirely possibly that Ireland was already achieving diminishing returns to well-being from
income before the Celtic Tiger even got underway. Van den Bergh (ibid.) argues that if
this is the case, this would make additional efforts to discover welfare improvements
futile. I would counter this by saying that we do not yet know. Many of the things that
matter to people have not been measured robustly over a long enough time period. It is
also the case that whilst macro indicators may be tending towards zero improvement,
there are still severe inequalities of wealth, income and well-being that can be improved
upon even if these impacts are not being picked up in aggregate data, indeed it makes
204
a focus on distributional issues even more pressing. However, without more data it will
be difficult to make the case to abandon aggregate measures entirely. Finally, it is
possible that although the example of the Celtic Tiger might show that rapid growth does
not necessarily have a major social impact, this does not mean that policy-making is a
futile exercise. As I have shown in the worked examples, there appears to be much
scope to impact on some areas such as mental health and the environment. However, it
might well be that the kinds of policymaking that is taking place in many contexts –
including Ireland – is ineffectual. Much of it revolves around minor changes to taxation,
or small increases in public spending, which may not be radical enough to have an
impact that can be seen in the aggregate data. In the next section, I discuss the lack of
diversity in policy-making and how it relates to data management.
10.3 The politics of data and accounting in national policymaking
The need for better data in Ireland has in part been recognised by the government. In
2015, the National Statistics Board published a new strategy to 2020. The vision for the
strategy was to create: “A world-class system of official statistics using the best available
data to provide high-quality, independent and accessible information for Ireland” (NSB,
2015 p3.). This data agenda has been spurred on by two things 1) requirements from
the EU to comply with the wider EU strategy and 2) the emphasis on accountability and
transparency in public service following the financial crisis and mistrust caused by a
series of expenses scandals involving senior politicians.57
The stated objectives of the data strategy are:
1. The need to collect internationally comparable economic data to inform credit
ratings and to furnish the OECD with statistics for its economic growth outlooks
and debt ratios
2. The need to meet comply with Eurostat and the requirements of the European
Statistical Systems, which frames EU policy. As such, the programme is ‘largely
prescribed’ by regulation to meet the need of institutions such as the European
Commissions, the European Central Bank and the European Council (NCB,
2015, p7). The EU has also given Eurostat the power to adjust nationally
produced statistics if it considers that the figures look implausible or has doubts
about the methodology used to produce them. It has been estimated that 90% of
57 In response to this, a department of Public Expenditure and Reform was established to deliver
on a commitment to more accountable government. The department has piloted an interactive statistics site, published datasets from across the public sector and developed guidance for evaluation and value for money assessments.
205
the work of the Central Statistics Office is taken up with meeting EU data
demands.
As we can see, the emphasis is on harmonisation at the EU level, and to enable
international comparability. For certain kinds of policy areas where policy is being set at
the supranational level, or where economic data are required by international lenders
this may make sense but not to the exclusion of other kinds of important indicators. The
majority of outcome areas that have emerged as important in this research are controlled
by domestic governments and we could go far as to say that for the purposes of national
policy, comparability is irrelevant. This means that there is a disconnection between the
level at which data is being gathered and at which policy is being formulated.
Furthermore, there are clear sovereignty issues where governments do not ‘own’ the
data, nor do they necessarily have a say in what is being measured. Although there is
nothing stopping governments from ‘complementing’ EU datasets, the resources of
national governments are being exhausted gathering data that is being decided centrally.
Whilst there may well be a good fit between what matters to people in Ireland and what
the EU decides to collect, this is not guaranteed and the mechanism for governments to
control this is being eroded. This is a process which runs counter to the conceptual
framework for measuring social value set out here.
For global public goods - e.g. finance and climate change - the need for international and
European datasets are certainly important. But the principle of subsidiarity should apply.
As I have discussed, Ireland appears to be rich in some forms of social capital, and this
may be protective against economic shocks and so on. It is then eminently sensible for
this to be defined and measured in a way that is specific to how it is being experienced,
irrespective of how it plays out in other countries. This also has implications for policy
autonomy. One of the rationales for an EU-level statistical strategy is to further the
convergence between countries, which implies convergence in policy as much as socio-
economic circumstances. Policy diffusion theory – which explains why policy choices are
affected by the prior choices of other countries – has been observing a process of
convergence in policy formation for some time (Shipan and Volden 2008). For example,
Dobbins et al. (2007) have used it to explain the worldwide spread of economic and
political liberalism in the 20th century. Although there are some positive aspects to policy
diffusion, such as learning, there are also negative aspects such as some forms of
competition and coercion (e.g. Shipan and Volden 2008; Gilardi 2012). EU convergence
and associated data management is consistent with the coercive aspects of this theory,
which should lead to less innovation at the national level. The underlying logic of coercion
involves power asymmetries that strong actors exploit to impose their preferences for
206
policy change on the weak. Dobbins et al. have described it as the most ‘illiberal’ of ways
in which policy diffuses (ibid. P14). Coercion theorists suggest that policies diffuse from
the ‘centre’ both actively through ‘‘conditionality’’ and passively through ‘‘unilateralism’’
by more powerful actors (Dobbins et al., 2007). Those organisations that are requiring
data – the EU, the OECD and the IMF – are also constraining the policy environment
and we could argue that data is being used to further that coercive process. We can think
for example of borrowing costs or debt ratios required by the OECD, or public sector pay,
and minimum wage levels required by the IMF/ECB as part of the bailout programme.
As described in Chapter 6, the constraints of Eurozone membership led directly to Ireland
needing to seek a bailout programme. The method of collective goal setting described in
this research seeks to work against the trend for policy diffusion and the interdependence
of policymaking that may not be in the interests of small economies. To counter policy
diffusion or the adoption of sub-optimal policies the way in which policies have diffused
requires further research. Ireland would again make an interesting country to study as it
is often held up as an example of the benefits that liberalisation can bring to small
countries.
There are wider issues about who accesses, owns and stores data that are also of
relevance here. The scale and speed at which data is being produced, stored and
analysed in the private sector is at a level that would have been unimaginable just a few
years ago (Spratt and Baker, 2015). Ninety per cent of data in existence were created
in the past two years and this is doubling every two years (ibid.). The potential of Big
Data to change the landscape of official statistics is of huge importance. The National
Statistics Board highlight the potential for reducing dependence on traditional survey
methodologies, thereby reducing the cost and increasingly the timeliness of data
availability (e.g. the use of mobile phone data to monitor tourism) Kitchen and Lauriault
(2014), caution against conflating volume with insight, utility and value and argue that
established methodologies that have been developed over years should not be
discarded (see also Harford, 2014 for a discussion of the methodological limitations of
Big Data). One source of potential value in traditional methods is that they capture lots
of different kinds of information, spanning both subjective and objective. Big Data
techniques tend to monitor behaviour and infer preferences from that behaviour. This is
similar to the inferences that economists have drawn from preferences revealed in
markets about what people value. With Big Data these inferences can be extended
beyond markets to ‘reveal’ what people value in the non-market and personal sphere.
However, this suffers from some of the same limitations as preferences revealed in a
market context. In Chapter 7, I discussed Daniel Kahneman’s work on decision-making
207
and problems associated with it. This is especially the case for what he calls System 1
thinking, which is fast, instinctive and emotional. I also present evidence of a
value/action gap; a gap between how we behave and the values that the hold. I argue
that the social value index should be appealing to System 2 thinking, which is slower,
more deliberate and logical. A major risk with revealed preference, and Big Data
techniques is that they fall into the System 1 definition. Neither allow space for aspiration,
or appealing to our better instinct; they assume how we behave is rational and reflects
our values. Traditional methods of social science may be expensive, less timely and
sometimes less accurate but they may still hold more promise for answering the question
of what kind of society we want, and monitoring our progress towards it.
That is not to say that governments should retreat from the collection and analysis of Big
Data. The private sector certainly sees a value in this kind of data and continues to find
ways to improve their marketing and production by obtaining even larger, more accurate
and timely data (Spratt and Baker, 2015). Greater investment by the private sector in
data collection and analysis will lead to superior datasets being privately owned and the
further privatisation of information. There are of course risks with public ownership of
data too and data as a public good is not the same as using data for surveillance, or as
a revenue stream. Most data in the public sector should be open and owned collectively
but not all of it (Tennison, 2014). The ‘mosaic effect’ (Mazmanian, 2014) describes the
way in which governments can synthesise data, which would allow them to piece
together information about an individual and ‘see’ them in real time. This has implications
for privacy and, in the wrong hands, political freedom. The Estonian model counters this
risk by only allowing the individual access to all of the information that is being held on
them. 58 This has been held up as best practice (Spratt and Baker, 2015). This is an
increasingly important issue that is highly relevant to the debates set out here. Needless
to say, it is one that requires a substantial amount of further research.
10.4 Caveats and lessons learned
This thesis has sought to ask a very simple yet ambitious question. What would a world
designed around the things we value in life look like and what would we need to do
differently to get there? This is a deliberately utilitarian exercise. I have sought to find out
what people value and to use that information to construct a way of mapping and
measuring progress towards that. The most obvious limitation is therefore a
philosophical one and rests with the key problem with utilitarianism, or an evidence-
58 Estonian citizens can see the information that the state holds on them but state agencies can
only see data relevant to them and no agency can see all of the information, so the mosaic can never be completed except by the ‘owner’ of that data.
208
based approach to making policy. In practice, the evidence that underpins such a model
can be weak or inconclusive. Second, such an approach assumes that certainty is
possible where there is often huge uncertainty even in areas with a strong scientific
tradition such as climate change. Third, this appearance of certainty assumes that
intractable issues can be answered scientifically when this is often not the case. Even
where it could play a greater role this often comes second to what is politically expedient.
These limitations are not insurmountable. A risk with the current approach is that it lacks
accountability for how decisions are made. For all its limitations, it is difficult to see how
anything other than some form of a utilitarian approach with appropriate constraints,
check and balances can be avoided. There may be scope to complement it with a more
deliberative approach to deciding on outcomes and indicators. Talpin (2004) argues that
this should lead to better governance and social capital but should also produce ‘better
citizens’ (Talpin, 2004 p.1). However, Chapell (2008) in a critique of deliberative
approaches argues that such approaches are replete with weaknesses such as
instrumental rationality, cognitive limitations, self-interested behaviour and a lack of
motivation to participate in highly resource intensive activities. The role of deliberative
approaches in any future development would therefore require further research.
The second major caveat relates to data quality. This applies both to limitations with the
survey and secondary data. This has been discussed at length above and does not need
further discussion suffice to say that generalisations for the whole economy cannot be
made based solely on the data presented here.
The final caveat is that I did not complete the process of developing an actual index.
Although correlations between indicators of interest and GDP were carried out, these
are only simple comparisons and their robustness has not been tested. The lack of data
prevented this final step from being completed. On the other hand, based on the data
that were available, and with the exception of employment, few promising relationships
between GDP and other social, economic and environmental indicators could be seen,
suggesting that an index would have yielded similar results.
An important reflection, which I have mentioned throughout the thesis is that there is no
perfect alternative to GDP. Van den Bergh (2015) recommends taking an approach that
starts with the findings of happiness research as I have done here. However, he admits
that this is unlikely to deliver the holy grail of a perfect indicator. What I have attempted
to do is to provide something that is a better approximation of social value than we
already have: one that contains more useful information than GDP and less misleading
information (Van den Berg, 2015).
209
The biggest learning point relates to the survey design. Most notably, the survey was too
long, and this appears to have discouraged people from completing it: although 502
people attempted the survey, only about 350 completed it. This meant 150 responses
were not included in the analysis, reducing the reliability of my results. Although this is a
common mistake with surveys, it was one that I did not pay sufficient attention to. Were
the research to be repeated, the survey would benefit from being harmonised more
closely with the research questions to ensure that unnecessary questions were not being
asked.
The second lesson relates to the usefulness of focusing the research on Ireland.
Although I was initially sceptical about the value of focusing on a single country, the
process has proved very useful, both in terms of learning about one country in detail but
also about the wider lessons that can be learned about the methodological approach.
Having more than one country would have enabled comparison; however, it would have
reduced the depth of the analysis and the richness of the findings.
There are three areas that I have identified where further research is required. The first
relates to politics. To better understand the politics of this, research with policymakers
who were responsible for making policies during these decades of extraordinary change
would contribute to knowledge in this area. Just how in control were domestic policy
makers? What kinds of pressures (implicit and explicit) were they under? Why, given the
limitations of certain kinds of policies, are they still being pursued? How can space be
opened up (if at all) for alternative policymaking and what might be implications of that
be? These are all interesting questions for future research that lead on from this thesis
and which could provide a better understanding of the issues raised here. A second
area of future research relates to social capital, which has emerged as something that is
highly valued in and of itself as well as being an enabler of better societal outcomes.
However, little is known about how social capital is ‘created’. Although much is written
about it, there are fewer practical policy responses. The final area of future potential
research relates to data and the trends that have been identified above. Alongside the
growing arsenal of private data available to companies, we can observe a withdrawal
from data collection by national governments and a convergence on indicators of
importance at the EU level. This requires some critical attention by the academic
community, and the social value of data is a fruitful area of potential research.
210
10.5 Conclusion
Following the 2008 financial crisis economists issued warnings to countries of the risk of
becoming like Japan, of having a so-called ‘lost decade’59. The lost decade is a term,
which simply means low growth. In the aggregate, Japan's economy grew at half the
pace of America's between 2001 and 2010 (The Economist, 2011). And yet, Japan
performs much better on many economic measures than the US: incomes have been
rising, the unemployment rate is low, it has low levels of inequality and productivity is
high. Furthermore, it also performs better on many quality of life measures. OECD data
show that it is above average on educational achievement, crime levels, security, and
social connections and it has the longest life expectancy in the world. There is no
suggestion life is perfect, it has below average life satisfaction for example, but after 20
years of low or no growth, it is still one of the most desirable places to live in the world.
For many countries in the world, particularly in Sub-Saharan Africa, low growth does
matter; it can have major impacts on livelihoods, unemployment and numbers of people
living in poverty. The Japan example shows us that for developed economies the rate of
growth may not mean much in and of itself. Throughout this thesis, I have argued that
not all growth is of equal value. ‘Quality’ growth is a term that is sometimes used to
describe growth that is broad based and efficient in fostering socially desirable
outcomes. We can contrast the growth that underpinned Japan’s growth in the 1970s
and 1980s with that which took place in Ireland in the early 2000s to see how the
outcomes from growth can differ. Although Ireland’s economy is again growing faster
than Japan’s, it tells us very little about the quality of lives lived in those countries.
It may well be an accident of history that GDP has become so privileged over all other
pieces of social, economic and environmental data but it has become so closely
associated with notions of success, progress and standing in the world, that this appears
very difficult to undo. I have argued that a new system of national accounts could both
improve the accountability of policymakers and engage people with the challenges and
trade-offs inherent in making policy. It gives the impression that this information matters
more than it does by obscuring, or crowding out things that do matter.
In this chapter, I have concluded the thesis by reflecting on how well the index has
performed at providing practical policy solutions. I did this by focusing on two worked
examples: mental health and the environment. I have concluded that putting these
outcomes at the heart of policy-making would indeed lead to a different direction for
59 See for example Paul Krugman in the following article:
https://www.theguardian.com/business/2009/jun/14/economics-globalrecession
211
policy in Ireland. I have also discussed the implications of this research for data collection
and the ways in which national and international trends are evolving in this fast-
developing and increasingly important area. Finally, I have reflected on the strengths and
weaknesses of the research and suggested three potential areas for further research:
the politics of measurement, social capital and the politics of data.
A conclusion from the Commission for the Measurement of Economic Performance and
Social Progress was that despite the plethora of efforts to develop alternatives there is
still a need for indicators that are salient for rich industrialised countries (Stiglitz et al.,
2009). There are technical challenges to be overcome but they pale in significance
relative to the challenge of getting all sections of society to coalesce around an
alternative. This will require an acceptance of the fact that the way we value things, as
defined by the measures and goals we pursue, are flawed. Even achieving this first step
seems like a sizeable political economy challenge. The contribution of this thesis has
been to set out conceptually how we might do this by developing a framework for how
public opinion could be incorporated into policymaking in a way that increases social
value.
212
Bibliography
Aalen, F. H. A. 2010. Atlas of the Irish Rural Landscape. Edited by F. H. A. Aalen, Kevin Whelan, and Matthew Stout. 2nd Revised edition. Cork University Press.
Abendschön, S. and Steinmetz, S., 2014. The gender gap in voting revisited: women's party preferences in a European context. Social Politics: International Studies in Gender, State & Society, p.jxu009.
Abraham, A., K. Sommerhalder, and T. Abel. 2010. “Landscape and Well-Being: A Scoping Study on the Health-Promoting Impact of Outdoor Environments.” International Journal of Public Health 55 (1): 59–69.
Ahmed, S., 2010. The promise of happiness. Duke University Press.
Alesina, A., R. Di Tella, and R. MacCulloch. 2004a. “Inequality and Happiness: Are Europeans and Americans Different?” Journal of Public Economics 88 (9–10): 2009–42.
Alkire, Sabina. 2005. Valuing Freedoms: Sen’s Capability Approach and Poverty Reduction. Oxford University Press.
Alksnis, Christine, Serge Desmarais, and James Curtis. 2008. “Workforce Segregation and the Gender Wage Gap: Is ‘Women’s’ Work Valued as Highly as ‘Men’s’? 1.” Journal of Applied Social Psychology 38 (6): 1416–1441.
Allen, Kieran. 2000. The Celtic Tiger: The Myth of Social Partnership in Ireland. Manchester University Press.
Alvesson, Mats, and Kaj Sköldberg. 2009. Reflexive Methodology: New Vistas for Qualitative Research. Sage. https://books.google.co.uk/books?hl=en&lr=&id=32G4M7-20xgC&oi=fnd&pg=PP2&dq=Alvesson+and+Sk%C3%B6ldberg,+2009&ots=G2QiofVvSE&sig=3VfCbC0ChsmJFjjZNUYtUe2uxgk.
Alwin, Duane F. 1984. “Trends in Parental Socialization Values: Detroit, 1958-1983.” American Journal of Sociology, 359–382.
Andrade, Laura, Jorge J. Caraveo-anduaga, Patricia Berglund, Rob V. Bijl, Ron De Graaf, Wilma Vollebergh, Eva Dragomirecka, et al. 2003. “The Epidemiology of Major Depressive Episodes: Results from the International Consortium of Psychiatric Epidemiology (ICPE) Surveys.” International Journal of Methods in Psychiatric Research 12 (1): 3–21.
Andreoni, James, and Lise Vesterlund. 2001. “Which Is the Fair Sex? Gender Differences in Altruism.” Quarterly Journal of Economics, 293–312.
Andrews, Frank M. 1989. “The Evolution of a Movement.” Journal of Public Policy 9 (4): 401–405.
Angner, Erik. 2011. “The Evolution of Eupathics: The Historical Roots of Subjective Measures of Wellbeing.” International Journal of Wellbeing 1 (1). doi:10.5502/ijw.v1i1.14.
Aristotle. 1962. Nicomachean Ethics. Bobbs-Merrill Indianapolis.
Arnold, L. M., K. A. Witzeman, M. L. Swank, S. L. McElroy, and P. E. Keck Jr. 2000. “Health-Related Quality of Life Using the SF-36 in Patients with Bipolar Disorder Compared with Patients with Chronic Back Pain and the General Population.” Journal of Affective Disorders 57 (1–3): 235–239.
Ayres, R. U., J. C. J. M. Van Den Bergh, J. M. Gowdy, and Tinbergen Institute. 1998. Viewpoint: Weak versus Strong Sustainability. Tinbergen Institute. http://people.deu.edu.tr/sedef.akgungor/ayres.pdf.
213
Baber, Harriet. 2008. “The Experience Machine Deconstructed.” Philosophy in the Contemporary World 15 (1): 133–138.
Babones, Salvatore. 2015. “Modeling Error in Quantitative Macro-Comparative Research.” Journal of World-Systems Research 15 (1): 86–114.
Bacon, N., M. Brophy, N. Mguni, G. Mulgan, and A. Shandro. 2010. “The State of Happiness: Can Public Policy Shape People’s Wellbeing and Resilience.” London: Young Foundation.
Baker, L. A., L. P. Cahalin, K. Gerst, and J. A. Burr. 2005. “Productive Activities and Subjective Well-Being among Older Adults: The Influence of Number of Activities and Time Commitment.” Social Indicators Research 73 (3): 431–458.
Ball, Richard, and Kateryna Chernova. 2008. “Absolute Income, Relative Income, and Happiness.” Social Indicators Research 88 (3): 497–529.
Bandura, Romina. 2008. “A Survey of Composite Indices Measuring Country Performance: 2008 Update.” New York: United Nations Development Programme, Office of Development Studies (UNDP/ODS Working Paper). http://usc.ac.ir/IPPWebV1C035/TemplateFileFolder/10-8-2013/OriginalFolder/0a6e29c4-1fa6-4496-a362-000f0851d4fc_indices_2008_bandura.pdf.
Banerjee, Abhijit, Shawn Cole, Esther Duflo, and Leigh Linden. 2005. “Remedying Education: Evidence from Two Randomized Experiments in India.” National Bureau of Economic Research. http://www.nber.org/papers/w11904.
Barker, Paul. 1984. Founders of the Welfare State: A Series from New Society. Heinemann Educational Books.
Barrett, Alan, and Vincent O’Sullivan. 2013. “A Short Note on the Wealth, Health and Wellbeing of Ireland’s Older People before and during the Economic Crisis.” In SHARE Working Paper (15-2013). Economic and Social Research Institute. http://www.share-project.org/uploads/tx_sharepublications/WP_Series_15_2013_Barrett_OSullivan.pdf
Barrett, Sean. 2004. “Privatisation in Ireland.” CESifo Working Paper Series No. 1170, Trinity College Dublin.
Barrington-Leigh, C. P., and J. F. Helliwell. 2008. “Empathy and Emulation: Life Satisfaction and the Urban Geography of Comparison Groups.”
Barry, Frank. 2003. “Irish Economic Development over Three Decades of EU Membership.” Published in the Czech Journal Finance a Uver, Special Issue on National Experiences within the EU.
Barry, Frank. 2009. “Some Political Economy Lessons from Ireland’s Boom and Bust.” Journal of Irish and Scottish Studies 2 (2): 25–39.
Barry, Margaret, Eric van Lente, Michal Molcho, Karen Morgan, Hannah McGee, Ronan Conroy, Dorothy Watson, Emer Shelley, and Ivan Perry. 2009. “SLAN 2007: Survey of Lifestyle, Attitudes and Nutrition in Ireland Mental Health and Social Well-Being Report.” Psychology Reports, 11.
Bartolini, S., and E. Bilancini. 2010. “If Not Only GDP, What Else? Using Relational Goods to Predict the Trends of Subjective Well-Being.” International Review of Economics 57 (2): 199–213.
Bartram, D., 2012. Elements of a sociological contribution to happiness studies. Sociology Compass, 6(8), pp.644-656.
214
Beckerman, Wilfred. 1992. “Economic Growth and the Environment: Whose Growth? Whose Environment?” World Development 20 (4): 481–96. doi:10.1016/0305-750X(92)90038-W.
Beckerman, Wilfred. 1994. “‘Sustainable Development’: Is It a Useful Concept?” Environmental Values 3 (3): 191–209.
Bentham, J., Burns, J.H. and Hart, H.L.A., 1776. A fragment on government (p. 108).
Cambridge: Cambridge University Press.
Bentham, J., 1972. An Introduction to the Principles of Morals and Legislation
(Chapters I–V) (pp. 17-51). Blackwell Publishing Ltd.
Berg, B. van den, and A. Ferrer-i-Carbonell. 2007. “Monetary Valuation of Informal Care: The Well-Being Valuation Method.” Health Economics 16 (11): 1227–44.
Berg, J. C. J. M. van Den. 2009. “The GDP Paradox.” Journal of Economic Psychology 30 (2): 117–135.
Berg, M. C., and R. Veenhoven. 2010. “Income Inequality and Happiness in 119 Nations.”
Bergman, Manfred Max. 1998. “A Theoretical Note on the Differences between Attitudes, Opinions, and Values.” Swiss Political Science Review 4 (2): 81–93.
Bergold, J. and Thomas, S., 2012. Participatory research methods: A methodological approach in motion. Historical Social Research/Historische Sozialforschung, pp.191-222.
Bernstam, M. S. 1990. “The Wealth of Nations and the Environment.” Population and Development Review 16: 333–373.
Bertrand, M. and Mullainathan, S., 2001. Do people mean what they say? Implications
for subjective survey data.
Betz, Michael, Lenahan O’Connell, and Jon M. Shepard. 1989. “Gender Differences in Proclivity for Unethical Behavior.” Journal of Business Ethics 8 (5): 321–324.
Beutel, Ann M., and Margaret Mooney Marini. 1995. “Gender and Values.” American Sociological Review, 436–448.
Bickman, Leonard, and Debra J. Rog. 2008. The SAGE Handbook of Applied Social Research Methods. SAGE Publications.
Biddle, S. J. H., K. R. Fox, S. H. Boutcher, and others. 2001. “Emotion, Mood and Physical Activity.” Physical Activity and Psychological Well-Being, 63–87.
Binmore, K. G. 2009. “Interpersonal Comparison of Utility.” http://eprints.ucl.ac.uk/15679/.
Bishop, George F., Alfred J. Tuchfarber, and Robert W. Oldendick. 1986. “Opinions on Fictitious Issues: The Pressure to Answer Survey Questions.” Public Opinion Quarterly 50 (2): 240–250.
Bjørnskov, C. 2003. “The Happy Few: Cross–Country Evidence on Social Capital and Life Satisfaction.” Kyklos 56 (1): 3–16.
Bjornskov, Christian. 2008. “On Decentralization and Life Satisfaction.” Economics Letters 99 (1): 147.
Blake, James. 1999. “Overcoming the ‘value-Action Gap’in Environmental Policy: Tensions between National Policy and Local Experience.” Local Environment 4 (3): 257–278.
215
Blanchflower, D.G., 2007. Is unemployment more costly than inflation? (No. w13505). National Bureau of Economic Research. Blanchflower, D. G., and A. J. Oswald. 2004. “Money, Sex and Happiness.” The Scandinavian Journal of Economics 106 (3): 393–415.
Blanchflower, D. G., and A. J. Oswald. 2008. “Hypertension and Happiness across Nations.” Journal of Health Economics 27 (2): 218–233.
Blanchflower, D. G., and A. J. Oswald. 2011. “International Happiness.”
Blanchflower, David G, and Andrew J Oswald. 2000. “Well-Being over Time in Britain and the USA.” Journal of Public Economics 88 (7–8): 1359–86.
Blanchflower, David G., and Andrew Oswald. 2007. “Is Well-Being U-Shaped over the Life Cycle?”
Blanchflower, David G., David NF Bell, Alberto Montagnoli, and Mirko Moro. 2013. “The Effects of Macroeconomic Shocks on Well-Being.” Manuscript, University of Stirling. http://www.dartmouth.edu/~blnchflr/papers/inflation_unemployment_trade-off%20_14.docx.
Boarini, Romina, \AAsa Johansson, and Marco Mira d’Ercole. 2006. “Alternative Measures of Well-Being.”
Boitier, Baptiste. 2012. “CO2 Emissions Production-Based Accounting vs. Consumption: Insights from the WIOD Databases.” In WIOD Conference Paper, April. http://www.wiod.org/conferences/groningen/paper_Boitier.pdf.
Bok, D., 2010. The politics of happiness: What government can learn from the new research on well-being. Princeton University Press.
Bonhomme, S., and G. Jolivet. 2009. “The Pervasive Absence of Compensating Differentials.” Journal of Applied Econometrics 24 (5): 763–795.
Boots, Denise Paquette, and John K. Cochran. 2011. “The Gender Gap in Support for Capital Punishment: A Test of Attribution Theory.” Women & Criminal Justice 21 (3): 171–197.
Booysen, Frederik. 2002. “An Overview and Evaluation of Composite Indices of Development.” Social Indicators Research 59 (2): 115–151.
Bord, Richard J., and Robert E. O’Connor. 1997. “The Gender Gap in Environmental Attitudes: The Case of Perceived Vulnerability to Risk.” Social Science Quarterly, 830–840.
Borooah, V. K. 2005. “How to Assess Happiness? A Tale of Three Measures.” Applied Economics Letters 12 (3): 191–194.
Borooah, V. K. 2006. “How Much Happiness Is There in the World? A Cross-Country Study.” Applied Economics Letters 13 (8): 483–88.
Boulanger, Paul-Marie. 2008. “Sustainable Development Indicators: A Scientific Challenge, a Democratic Issue.” S.A.P.I.EN.S. Surveys and Perspectives Integrating Environment and Society, no. 1.1 (November). http://sapiens.revues.org/166.
Bowling, N. A., and K. J. Eschleman. 2010. “A Meta-Analytic Examination of the Relationship between Job Satisfaction and Subjective Well-Being.” Journal of Occupational and Organizational Psychology 83 (4): 915–34. doi:10.1348/096317909X478557.
Boyle, Mark. 2002. “Cleaning up after the Celtic Tiger: Scalar ‘fixes’ in the Political Ecology of Tiger Economies.” Transactions of the Institute of British Geographers 27 (2): 172–194.
216
Boyne, Roy, and Ali Rattansi. 1990. “Postmodernism and Society.” http://philpapers.org/rec/BOYPAS.
Bradley, John, and Karl Whelan. 1997. “The Irish Expansionary Fiscal Contraction: A
Tale from One Small European Economy.” Economic Modelling 14 (2): 175–201.
Bradshaw, J., P. Hoelscher, and D. Richardson. 2007. “An Index of Child Well-Being in
the European Union.” Social Indicators Research 80 (1): 133–177.
Bradshaw, W., and J. S. Brekke. 1999. “SUBJECTIVE EXPERIENCE IN
SCHIZOPHRENIA: Factors Influencing Self-Esteem, Satisfaction With Life, and
Subjective Distress.” American Journal of Orthopsychiatry 69 (2): 254–260.
Brainerd, Elizabeth. 2001. “Economic Reform and Mortality in the Former Soviet Union:
A Study of the Suicide Epidemic in the 1990s.” European Economic Review 45 (4):
1007–1019.
Bramston, P. 2002. “Unravelling Subjective Quality of Life: An Investigation of
Individual and Community Determinants.” Social Indicators Research 59 (3): 261.
Brandt, Richard B. 1998. “A Theory of the Good and the Right.”
Brautigam, Deborah, Odd-Helge Fjeldstad, and Mick Moore. 2008. Taxation and State-
Building in Developing Countries: Capacity and Consent. Cambridge University Press.
Breathnach, Proinnsias. 1998. “Exploring the’Celtic Tiger’Phenomenon Causes and
Consequences of Ireland’S Economic Miracle.” European Urban and Regional Studies
5 (4): 305–316.
Breen, Michael J., and Caillin Reynolds. 2011. “The Rise of Secularism and the Decline
of Religiosity in Ireland: The Pattern of Religious Change in Europe.”
https://dspace.mic.ul.ie/handle/10395/1800.
Brekke, Kjell Arne, and Olof Johansson-Stenman. 2008. “The Behavioural Economics
of Climate Change.” Oxford Review of Economic Policy 24 (2): 280–97.
doi:10.1093/oxrep/grn012.
Brereton, F., C. Bullock, J. P. Clinch, and M. Scott. 2011. “Rural Change and Individual
Well-Being.” European Urban and Regional Studies 18 (2): 203–227.
Brereton, Finbarr, J. Peter Clinch, and Susana Ferreira. 2008. “Employment and Life-
Satisfaction: Insights from Ireland.” The Economic and Social Review 39: 207–34.
Brickman, P, D Coates, and R Janoff-Bulman. 1978. “Lottery Winners and Accident
Victims: Is Happiness Relative?” Journal of Personality and Social Psychology 36 (8):
917–27.
Brizius, Jack A., and Michael D. Campbell. 1991. Getting Results: A Guide for
Government Accountabiblity. Council of Governors Policy Adivisors.
Bromet, Evelyn, Laura H. Andrade, Irving Hwang, Nancy A. Sampson, Jordi Alonso,
Giovanni de Girolamo, Ron de Graaf, et al. 2011. “Cross-National Epidemiology of
DSM-IV Major Depressive Episode.” BMC Medicine 9 (1): 90. doi:10.1186/1741-7015-
9-90.
Brown, S., K. Taylor, and S. Wheatley Price. 2005. “Debt and Distress: Evaluating the
Psychological Cost of Credit.” Journal of Economic Psychology 26 (5): 642–63.
217
Brundtland, G. H. 1987. “Our Common Future.” Oxford Paperbacks, no. A/42/427.
Bryman, Alan. 1984. “The Debate about Quantitative and Qualitative Research: A
Question of Method or Epistemology?” British Journal of Sociology, 75–92.
Bukenya, James O, Tesfa G Gebremedhin, and Peter V Schaeffer. 2003a. “Analysis of
Rural Quality of Life and Health: A Spatial Approach.” Economic Development
Quarterly 17 (3): 280–93. doi:10.1177/0891242403255325.
Bury, J.B., 1923. HISTORY AND PROGRESS. History.
Byrnes, James P., David C. Miller, and William D. Schafer. 1999. “Gender Differences
in Risk Taking: A Meta-Analysis.” Psychological Bulletin 125 (3): 367.
Cahill, Miles B. 2005. “Is the Human Development Index Redundant?” Eastern
Economic Journal 31 (1): 1–5.
Cameron, Sarah M. 2013. “Postmaterialism in Times of Crisis.” In Prepared for the
Panel S09 P290 “Resisting the Markets. Economic Actors and Issues in Global
Uprisings from the Middle-East to North-America”, European Consortium for Political
Research General Conference, Bordeaux, 4–7.
https://ecpr.eu/Filestore/PaperProposal/82449099-9a96-4739-a2ab-
7d665b6c4b10.pdf.
Campbell, Angus. 1976. “Subjective Measures of Well-Being.” American Psychologist
31 (2): 117.
Campbell, S.B., D.S. Shaw, and M. Gilliom. 2000. “Early Externalizing Behavior
Problems: Toddlers and Preschoolers at Risk for Later Maladjustment.” Development
and Psychopathology 12 (3): 467–488.
Carlyle, Thomas. 1993. On Heroes, Hero-Worship, and the Heroic in History. University
of California Press.
Carroll, N. 2007a. “Unemployment and Psychological Well-Being*.” Economic Record
83 (262): 287–302.
Carson, Thomas L. 2000. Value and the Good Life. University of Notre Dame Press.
Cassidy, Eoin G. 2002. “Measuring Ireland: Discerning Values and Beliefs.” Dublin:
Veritas.
Catholic Priests Association, (2012). [online] Available at:
https://www.associationofcatholicpriests.ie/wp-content/uploads/2012/04/Contemporary-
Catholic-Perspectives.pdf [Accessed 10 Jan. 2017].
Cattell, Raymond B. 1966. “The Scree Test for the Number of Factors.” Multivariate
Behavioral Research 1 (2): 245–276.
Central Statistics Office, (2011). Census 2011 Ireland and Northern Ireland - CSO -
Central Statistics Office. [online] Available at:
http://www.cso.ie/en/census/census2011irelandandnorthernireland/ [Accessed 10 Jan.
2017].
Central Statistics Office. (2012). Seasonally Adjusted Standardised Unemployment
Rates (SUR) - CSO - Central Statistics Office. [online] Available at:
218
http://www.cso.ie/en/statistics/labourmarket/principalstatistics/seasonallyadjustedstand
ardisedunemploymentratessur/ [Accessed 30 Mar. 2012].
Cerny, Philip G., and Mark Evans. 2004. “Globalisation and Public Policy under New
Labour.” Policy Studies 25 (1): 51–65.
Chappell. 2008. " Deliberation Disputed: A Critique Of Deliberative Democracy. - LSE
Theses Online". 2017. Etheses.Lse.Ac.Uk. Accessed March 30 2017.
http://etheses.lse.ac.uk/2340/.
Charlton, Rosemary, Rowan Fealy, Sonja Moore, John Sweeney, and Conor Murphy.
2006. “Assessing the Impact of Climate Change on Water Supply and Flood Hazard in
Ireland Using Statistical Downscaling and Hydrological Modelling Techniques.” Climatic
Change 74 (4): 475–91. doi:10.1007/s10584-006-0472-x.
Cherchye, Laurens, CA Knox Lovell, Wim Moesen, and Tom Van Puyenbroeck. 2007.
“One Market, One Number? A Composite Indicator Assessment of EU Internal Market
Dynamics.” European Economic Review 51 (3): 749–779.
Christopher, Andrew N., Liliane Saliba, and Erik J. Deadmarsh. 2009. “Materialism and
Well-Being: The Mediating Effect of Locus of Control.” Personality and Individual
Differences 46 (7): 682–686.
Cieslik, M., 2015. Not smiling but frowning’: Sociology and the ‘problem of
happiness. Sociology, 49(3), pp.422-437.
Cinamon, Rachel Gali, and Yisrael Rich. 2002. “Gender Differences in the Importance
of Work and Family Roles: Implications for Work–family Conflict.” Sex Roles 47 (11–
12): 531–541.
Clark, A. E. 2003. “Unemployment as Social Norm: Psychological Evidence from Panel
Data.” Journal of Labor Economics 21 (2): 289–322.
Clark, A. E., P. Frijters, and M. A. Shields. 2008. “Relative Income, Happiness, and
Utility: An Explanation for the Easterlin Paradox and Other Puzzles.” Journal of
Economic Literature 46 (1): 95–144.
Clark, A., and Delta. 2003. Inequality-Aversion and Income Mobility: A Direct Test.
Delta.
Clark, A., and O. Lelkes. 2005. “Deliver Us from Evil: Religion as Insurance.”
Clark, Andrew E, and Andrew J Oswald. 1994. “Unhappiness and Unemployment.”
Economic Journal 104 (424): 648–59.
Clark, Andrew, Andrew Oswald, and Peter Warr. 1996. “Is Job Satisfaction U‐shaped in
Age?” Journal of Occupational and Organizational Psychology 69 (1): 57–81.
doi:10.1111/j.2044-8325.1996.tb00600.x.
Cleary, and R Rhead. 2013. “Education and Attitudes towards the Environment.” Paper
cpmmissioned for the EFA Global M onitoring R e port 2013/4, Teaching and
learning: Achieving quality for al. UNESCO.
Clements, Ben, and Nick Spencer. 2014. Voting and Values in Britain: Does Religion
Count. London: Theos.
https://www.theosthinktank.co.uk/files/files/Reports/Voting%20and%20Values%20in%2
0Britain%20executve%20summary%20FINAL%20revised%201.pdf.
219
Climate Policy Initiative (2016). Global Climate Finance Flows. [online] Available at:
http://www.climatefinancelandscape.org/ [Accessed 30 Nov. 2016].
Clinch, J. P., S. Ferreira, F. Brereton, M. Moro, and C. Bullock. 2006. “Understanding
and Measuring Quality of Life in Ireland: Sustainability, Happiness and Well-Being.”
Clinch, J. P., S. Ferreira, F. Brereton, M. Moro, and C. Bullock. 2006. “Understanding
and Measuring Quality of Life in Ireland: Sustainability, Happiness and Well-Being.”
Clinch, J. Peter, Louise Dunne, and Simon Dresner. 2006. “Environmental and Wider
Implications of Political Impediments to Environmental Tax Reform.” Energy Policy 34
(8): 960–970.
Cobb, Clifford W., and H. Daly. 1989. “The Index for Sustainable Economic Welfare.”
Daly, HE, Cobb, JB (Eds).
Cobb, Clifford W., and John B. Cobb. 1994. “The Green National Product: A Proposed
Index of Sustainable Economic Welfare.” http://agris.fao.org/agris-
search/search.do?recordID=US9519422.
Cohen, A. B. 2002. “The Importance of Spirituality in Well-Being for Jews and
Christians.” Journal of Happiness Studies 3 (3): 287–310.
Cole, M. A. 2004. “Trade, the Pollution Haven Hypothesis and the Environmental
Kuznets Curve: Examining the Linkages.” Ecological Economics 48 (1): 71–81.
Coleman, James S. 1988. “Social Capital in the Creation of Human Capital.” American
Journal of Sociology, S95–S120.
Collins, M. (2013). Column: What is a ‘high earner’ in Ireland today?. [online]
TheJournal.ie. Available at: http://www.thejournal.ie/readme/high-earner-ireland-
755580-Jan2013/ [Accessed 11 Jan. 2017].
Colman, Andrew M. 2003. “Cooperation, Psychological Game Theory, and Limitations
of Rationality in Social Interaction.” Behavioral and Brain Sciences 26 (2): 139–153.
Common, M., and C. Perrings. 1992. “Towards an Ecological Economics of
Sustainability.” Ecological Economics 6 (1): 7–34.
Commoner, Barry. 2014. The Closing Circle: Nature, Man, and Technology. Knopf.
Comrey, A. L., and H. B. Lee. 1992. “Afirst Course Infactor Analysis.” Hillsdale, NJ:
Erlbaum.
Connolly, E. 2007. “The Institutionalisation of Anti-Poverty and Social Exclusion Policy
in Irish Social Partnership.”
Conroy, Charles, Patrick Honohan, and Bertrand Maître. 1998. “Invisible Entrepot
Activity in Irish Manufacturing.” Irish Banking Review, 22–38.
Coombs, Robert H. 1991. “Marital Status and Personal Well-Being: A Literature
Review.” Family Relations: An Interdisciplinary Journal of Applied Family Studies 40
(1): 97–102. doi:10.2307/585665.
Cooney, Thomas M. 2008. “Celtic Tiger Found in Education Jungle.” Education +
Training 50 (1): 64–66. doi:10.1108/00400910810855531.
220
OECD. 2016. “Who Are the Bachelor’s and Master’s Graduates?”
http://www.voced.edu.au/content/ngv:72812.
Corcoran, Mary P., Jane Gray, and Michel Peillon. 2010. Suburban Affiliations: Social
Relations in the Greater Dublin Area. Syracuse University Press.
https://books.google.co.uk/books?hl=en&lr=&id=gOIe_VOUHL8C&oi=fnd&pg=PP1&dq
=corcoran+grey+and+peillon+2007+well-
being+celtic+tiger&ots=FAt1haUKJM&sig=naxfsIH2sU1S_eXH5Safpi2BqpI.
Costanza, Robert, Maureen Hart, John Talberth, and Stephen Posner. 2009. “Beyond
GDP: The Need for New Measures of Progress.”
Costanza, Robert, Ralph d’Arge, Rudolf De Groot, S. Faber, Monica Grasso, Bruce
Hannon, Karin Limburg, et al. 1997. “The Value of the World’s Ecosystem Services and
Natural Capital.” http://mro.massey.ac.nz/handle/10179/5983.
Coulter, Colin, and Steve Coleman. 2003. The End of Irish History?: Critical Reflections
on the Celtic Tiger. Manchester Univ Pr.
Coyle, Diane. 2015. GDP: A Brief but Affectionate History. Princeton University Press.
Crisp, Roger. 2013. “Well-Being.” In The Stanford Encyclopedia of Philosophy, edited
by Edward N. Zalta, Summer 2013.
http://plato.stanford.edu/archives/sum2013/entries/well-being/.
Croson, Rachel, and Uri Gneezy. 2009. “Gender Differences in Preferences.” Journal
of Economic Literature 47 (2): 448–474.
Cummins, R. A., R. Eckersley, S. K. Lo, E. Okerstrom, J. Woerner, and M. Davern.
2005. “Australian Unity Wellbeing Index Survey 10.” Australian Centre on Quality of
Life, Deakin University, Melbourne, Http://acqol. Deakin. Edu. Au.
Cyhlarova, Eva, Andrew McCulloch, Peter McGuffin, and Til Wykes. 2010. “Economic
Burden of Mental Illness Cannot Be Tackled without Research Investment.” London:
Mental Health Foundation.
D’Agostino, Antonello, Kieran McQuinn, and Gerard O’Reilly. 2008. “Identifying and
Forecasting House Price Dynamics in Ireland.” Available at SSRN 1243386.
Daly, Herman E., John B. Cobb, and Clifford W. Cobb. 1994. For the Common Good:
Redirecting the Economy toward Community, the Environment, and a Sustainable
Future. 73. Beacon Press.
https://books.google.co.uk/books?hl=en&lr=&id=TZAIU1yqyRkC&oi=fnd&pg=PR7&dq=
Cobb+and+Cobb+(1994&ots=oBwaEFKiQ1&sig=EFKuJM_9dVdnDMZPjZZafKr4oVM.
Daly, Herman. 1977. “Steady State Economy.” San Francisco.
https://books.google.co.uk/books?hl=en&lr=&id=OmWvBAAAQBAJ&oi=fnd&pg=PA55
&dq=daly+1977&ots=vmkE07Z7uO&sig=EQlLH0YeIQzXkjkIIHx2_agUXlE.
Daly, M. C., A. J. Oswald, D. Wilson, and S. Wu. 2011. “Dark Contrasts: The Paradox
of High Rates of Suicide in Happy Places.” Journal of Economic Behavior &
Organization.
Damjanovic, A. K., Y. Yang, R. Glaser, J. K. Kiecolt-Glaser, H. Nguyen, B. Laskowski,
Y. Zou, D. Q. Beversdorf, and N. Weng. 2007. “Accelerated Telomere Erosion Is
Associated with a Declining Immune Function of Caregivers of Alzheimer’s Disease
Patients.” The Journal of Immunology 179 (6): 4249–4254.
221
Dasgupta, P. 2007. “The Stern Review’s Economics of Climate Change.” NATIONAL INSTITUTE ECONOMIC REVIEW-LONDON- 199: 4.
Dasgupta, Partha, and Karl-Göran Mäler. 2000. “Net National Product, Wealth, and Social Well-Being.” Environment and Development Economics 5 (1): 69–93.
Dasgupta, Partha. 1990. “Well-Being in Poor Countries.” Economic and Political Weekly, 1713–1720.
Dasgupta, Partha. 2001. Human Well-Being and the Natural Environment. Oxford University Press. https://books.google.co.uk/books?hl=en&lr=&id=OuMTDAAAQBAJ&oi=fnd&pg=PR13&dq=dasgupta+2001&ots=mmRNT_nquk&sig=L1AJ-HO44-1u5Ol9ng0dfewKhpo.
Davidson, Debra J., and Wiluam R. Freudenburg. 1996. “Gender and Environmental Risk Concerns a Review and Analysis of Available Research.” Environment and Behavior 28 (3): 302–339.
Davidson, R.J., 2004. Well-being and affective style: neural substrates and
biobehavioural correlates. Philosophical Transactions of the Royal Society B: Biological
Sciences, 359(1449), p.1395.
Davie, Grace. 1990. “Believing without Belonging: Is This the Future of Religion in Britain? In Implicit Religion/Le Religieux Implicite.” Social Compass 37 (4): 455–469.
Deaton, A. 2010. Income, Aging, Health and Well-Being around the World: Evidence from the Gallup World Poll. University of Chicago Press.
Deaton, A., J. Fortson, and R. Tortora. 2009. “Life (Evaluation), HIV/AIDS, and Death in Africa.” National Bureau of Economic Research. http://www.nber.org/papers/w14637.
Decanq, K., and M. A. Lugo. 2009. “Setting Weights in Multidimensional Indices of Well-Being and Deprivation.” Document de Travail de l’OPHI, no. 18.
Deci, Edward L., and Richard M. Ryan. 1985. “The General Causality Orientations Scale: Self-Determination in Personality.” Journal of Research in Personality 19 (2): 109–134.
Delaney, Liam, Patrick Wall, and Fearghal O’hAodha. 2007. “Social Capital and Self-Rated Health in the Republic of Ireland: Evidence from the European Social Survey.” Irish Medical Journal 100 (8): 52–56.
Delaney, Liam. 2009. “The Distribution of Wellbeing in Ireland.” Irish Journal of Psychological Medicine 26 (3): 119.
Delhey, Jan. 2010. “From Materialist to Post-Materialist Happiness? National Affluence and Determinants of Life Satisfaction in Cross-National Perspective.” Social Indicators Research 97 (1): 65.
DeNeve, K. M., and H. Cooper. 1998. “The Happy Personality: A Meta-Analysis of 137 Personality Traits and Subjective Well-Being.” Psychological Bulletin 124 (2): 197.
Diamond, J., 2005. Collapse: How societies choose to fail or succeed. Penguin.
Diener, E., Suh, E.M., Smith, H. and Shao, L., 1995. National differences in reported
subjective well-being: Why do they occur?. Social indicators research, 34(1), pp.7-32.
Diener, E. 1996. “Traits Can Be Powerful, but Are Not Enough: Lessons from Subjective Well-Being.” Journal of Research in Personality 30 (3): 389–99.
Diener, E. 2000. “Subjective Well-Being: The Science of Happiness and a Proposal for a National Index.” American Psychologist 55 (1): 34.
Diener, E., and M. E. P. Seligman. 2004. “Beyond Money.” Psychological Science in the Public Interest 5 (1): 1–31.
222
Diener, E., and M. E. Suh. 1998. “Subjective Well-Being and Age: An International Analysis.” Annual Review of Gerontology 17 (Focus on emotion and adult development): 304–24.
Diener, E., and M. Y. Chan. 2011. “Happy People Live Longer: Subjective Well-Being Contributes to Health and Longevity.” Applied Psychology: Health and Well-Being 3 (1): 1–43.
Diener, E., C. L. Gohm, E. Suh, and S. Oishi. 2000. “Similarity of the Relations between Marital Status and Subjective Well-Being Across Cultures.” Journal of Cross-Cultural Psychology 31 (4): 419–36.
Diener, E., E. M. Suh, R. E. Lucas, and H. L. Smith. 1999. “Subjective Well-Being: Three Decades of Progress.” Psychological Bulletin 125 (2): 276.
Diener, E., E. Sandvik, L. Seidlitz, and M. Diener. 1995. “The Relationship between Income and Subjective Well-Being: Relative or Absolute?” Social Indicators Research 28 (3).
Diener, E., R. E. Lucas, S. Oishi, and E. M. Suh. 2002. “Looking Up and Looking Down: Weighting Good and Bad Information in Life Satisfaction Judgments.” Personality and Social Psychology Bulletin 28 (4): 437–45.
Diener, Ed, and Robert Biswas-Diener. 2002. “Will Money Increase Subjective Well-Being?” Social Indicators Research 57 (2): 119–69. doi:10.1023/A:1014411319119.
Diener, E., Lucas, R.E. and Scollon, C.N., 2006. Beyond the hedonic treadmill: revising
the adaptation theory of well-being. American psychologist, 61(4), p.305.
Dietz, S., and N. Stern. 2008. “Why Economic Analysis Supports Strong Action on Climate Change: A Response to the Stern Review’s Critics.” Review of Environmental Economics and Policy 2 (1): 94–113.
Dijkstra, A. Geske, and Lucia C. Hanmer. 2000. “Measuring Socio-Economic Gender Inequality: Toward an Alternative to the UNDP Gender-Related Development Index.” Feminist Economics 6 (2): 41–75.
Di Tella, R. and MacCulloch, R., 2008. Gross national happiness as an answer to the
Easterlin Paradox?. Journal of Development Economics, 86(1), pp.22-42.
Dobbin, Frank, Beth Simmons, and Geoffrey Garrett. 2007. "The global diffusion of public
policies: Social construction, coercion, competition, or learning?" Annual. Review of.
Sociology. 33: 449-472.
Doherty, Donna Tedstone, R. Moran, Yulia Kartalova-O’Doherty, and D. Walsh. 2007. HRB National Psychological Wellbeing and Distress Survey: Baseline Results. Health Research Board. http://www.mentalhealthpromotion.net/resources/npwds-3.pdf.
Dolan, P., T. Peasgood, and M. White. 2008. “Do We Really Know What Makes Us Happy A Review of the Economic Literature on the Factors Associated with Subjective Well-Being.” Journal of Economic Psychology 29 (1): 94–122.
Dolan, Paul, and Robert Metcalfe. 2011. “Measuring Subjective Wellbeing for Public Policy: Recommendations on Measures.” http://eprints.lse.ac.uk/47518/.
Donner, Wendy. 1991. The Liberal Self: John Stuart Mill’s Moral and Political Philosophy. Cornell University Press.
Dorn, D., J. A. V. Fischer, G. Kirchgässner, and A. Sousa-Poza. 2007. “Is It Culture or Democracy? The Impact of Democracy and Culture on Happiness.” Social Indicators Research 82 (3): 505–26.
223
Driver, Julia, "The History of Utilitarianism", The Stanford Encyclopedia of Philosophy (Winter 2014 Edition), Edward N. Zalta (ed.), URL = <https://plato.stanford.edu/archives/win2014/entries/utilitarianism-history/>.
Duesenberry, James Stemble. 1949. Income, Saving, and the Theory of Consumer Behavior. Harvard University Press.
Dukelow, Fiona. 2005. “A Path towards a more 'employment Friendly’ liberal Regime? Globalisation and the Irish Social Security System.” International Co-Operation in Social Security: How to Cope with Globalisation, Antwerp: Intersentia, 125–54.
Dupont, D. 2004. “Do Children Matter? An Examination of Gender Differences in Environmental Valuation.” Ecological Economics 49 (3): 273–86.
Dutton, William H., and Grant Blank. 2014. “Cultures on the Internet.” Dutton, William H., and Blank, G.(2015),’Cultures on the Internet’, InterMedia, Winter 15: 55–57.
Eagleton, Terry. 1996. Literary Theory: An Introduction. U of Minnesota Press.
Eagly, Alice H., Amanda B. Diekman, Mary C. Johannesen-Schmidt, and Anne M. Koenig. 2004. “Gender Gaps in Sociopolitical Attitudes: A Social Psychological Analysis.” Journal of Personality and Social Psychology 87 (6): 796.
Easterlin, R. 1974. “Does Economic Growth Improve the Human Lot? Some Empirical Evidence.” P. A. David 8.
Easterlin, R. A. 1995. “Will Raising the Incomes of All Increase the Happiness of All?” Journal of Economic Behavior & Organization 27 (1): 35–47.
Easterlin, R. A., and O. Sawangfa. 2009. “Happiness and Economic Growth: Does the Cross Section Predict Time Trends? Evidence from Developing Countries.”
Easterlin, R.A. 2005. “Feeding the Illusion of Growth and Happiness: A Reply to Hagerty and Veenhoven.” Social Indicators Research 74 (3): 429–443.
Easterlin, Richard A. 2004. “Explaining Happiness.” Proceedings of the National Academy of Sciences of the United States of America 100 (19): 1176–83.
Easterlin, Richard A. 2006. “Life Cycle Happiness and Its Sources: Intersections of Psychology, Economics, and Demography.” Journal of Economic Psychology 27 (4): 463–82. doi:10.1016/j.joep.2006.05.002.
Easterlin, Richard A. 2013. “Happiness, Growth, and Public Policy†.” Economic Inquiry 51 (1): 1–15.
Eccles, Jacquelynne S. 1994. “Understanding Women’s Educational and Occupational Choices.” Psychology of Women Quarterly 18 (4): 585–609.
Eckel, Catherine C., and Philip J. Grossman. 2002. “Sex Differences and Statistical Stereotyping in Attitudes toward Financial Risk.” Evolution and Human Behavior 23 (4): 281–295.
Edlund, Lena, and Rohini Pande. 2002. “Why Have Women Become Left-Wing? The Political Gender Gap and the Decline in Marriage.” Quarterly Journal of Economics, 917–961.
EEB. 2016. EFR (Environmental Fiscal Reform). [online] Available at: http://www.eeb.org/index.cfm/activities/sustainability/efr-environmental-fiscal-reform/ [Accessed 9 Nov. 2016].
Eggleston, Ben, and Dale Miller. 2014. The Cambridge Companion to Utilitarianism. Cambridge University Press.
224
Eichenberg, Richard C. 2002. “The Gender Gap and National Security in the United States: Dynamics and Correlates of Public Opinion on Defense Spending and the Use of Military Force.” In Annual Convention of the International Studies Association, New Orleans, Louisiana. Citeseer. http://citeseerx.ist.psu.edu/viewdoc/download?doi=10.1.1.723.9041&rep=rep1&type=pdf.
Elliott, L. 2016. Up to 70% of people in developed countries 'have seen incomes stagnate'. [online] the Guardian. Available at: https://www.theguardian.com/business/2016/jul/14/up-to-70-per-cent-people-developed-countries-seen-income-stagnate [Accessed 7 Feb. 2017].
England, Richard W. 1998. “Measurement of Social Well-Being: Alternatives to Gross Domestic Product.” Ecological Economics 25 (1): 89–103.
Environet, 2017. Ireland's Climate Change Targets | Environet Solutions. [online] Available at: http://www.environet.ie/news/irelands-climate-change-targets [Accessed 13 Jan. 2017].
EPA 2017. [online] Available at: https://www.epa.ie/irelandsenvironment/ [Accessed 13 Jan. 2017].
Eurobarometer 2017. Public Opinion Analysis - Standard Eurobarometer 83 - European Commission. [online] Available at: http://ec.europa.eu/public_opinion/archives/eb/eb83/eb83_en.htm [Accessed 7 Jan. 2017].
Eurostat (2013). Greenhouse gas emission statistics - Statistics Explained. [online] Available at: http://ec.europa.eu/eurostat/statistics-explained/index.php/Greenhouse_gas_emission_statistics [Accessed 13 Jan. 2017].
Evans, G. W. 2003. “The Built Environment and Mental Health.” Journal of Urban Health 80 (4): 536–555.
Evans, Joanne. 2011. “Findings from the National Well-Being Debate.” London: Office for National Statistics.
Everett, Glyn, and Alex Wilks. 1999. “The World Bank ’ S Genuine Savings Indicator : A Useful Measure of Sustainability ?” Bretton Woods Project, no. October: 1–10.
Fahey, T., and E. Smyth. 2004. “Do Subjective Indicators Measure Welfare?” European Societies 6 (1): 5–27.
Fahey, Tony, Bernadette C. Hayes, and Richard Sinnott. 2005. Conflict and Consensus: A Study of Values and Attitudes in the Republic of Ireland and Northern Ireland. Institute of public administration. https://books.google.co.uk/books?hl=en&lr=&id=AVoxwn9fdOYC&oi=fnd&pg=PR9&dq=Fahey,+Hayes+and+Sinnott+2005&ots=GUWR4GpgMb&sig=UPhDczTdtrMJdHYPtEZp-SI1pmM.
Fahey, Tony, Helen Russell, and Christopher T. Whelan. 2007. Best of Times?: The Social Impact of the CelticTiger. Institute of Public Administration.
Falconi, Cesar. 1999. “Measuring Agricultural Biotechnology Research Capacity in Four Developing Countries.” http://www.agbioforum.missouri.edu/v2n34/v2n34a06-Falconi.htm. https://mospace.umsystem.edu/xmlui/handle/10355/1184.
Fehling, Maya, Brett D. Nelson, and Sridhar Venkatapuram. 2013. “Limitations of the Millennium Development Goals: A Literature Review.” Global Public Health 8 (10): 1109–22. doi:10.1080/17441692.2013.845676.
Feldman, Fred. 2012. What Is This Thing Called Happiness? Oxford; New York: OUP Oxford.
225
Fender, V., Joseph, H. and Richard, J. (2011). Measuring Economic Wellbeing [online] Available at: http://file:///C:/Users/eilis/Downloads/speconomic_tcm77-230285.pdf [Accessed 30 Jan. 2017].
Ferber, Marianne A., and Julie A. Nelson. 2003. Feminist Economics Today: Beyond Economic Man. University of Chicago Press. https://books.google.co.uk/books?hl=en&lr=&id=ziv8m0ihvYAC&oi=fnd&pg=PT14&dq=Ferber+and+Nelson+2003&ots=ElKVJ3cXWl&sig=rpjcdrM_QICyYB4ZKZgYarbTL9Q.
Fernández-Dols, J.M. and Ruiz-Belda, M.A., 1995. Are smiles a sign of happiness? Gold
medal winners at the Olympic Games. Journal of personality and social
psychology, 69(6), p.1113.
Ferreira, Susana, and Mirko Moro. 2011. “Constructing Genuine Savings Indicators for Ireland, 1995–2005.” Journal of Environmental Management 92 (3): 542–553.
Ferrer-i-Carbonell, A., and J. M. Gowdy. 2005. “Environmental Awareness and Happiness.”
Ferrer-i-Carbonell, Ada, and John M Gowdy. 2007. “Environmental Degradation and Happiness.” Ecological Economics 60 (3): 509–16.
Ferrer-i-Carbonell, Ada. 2005. “Income and Well-Being: An Empirical Analysis of the Comparison Income Effect.” Journal of Public Economics 89 (5–6): 997–1019.
Ferriss, A. L. 2002. “Religion and the Quality of Life.” Journal of Happiness Studies 3 (3): 199–215.
Finucane, Melissa L., Paul Slovic, Chris K. Mertz, James Flynn, and Theresa A. Satterfield. 2000. “Gender, Race, and Perceived Risk: The’white Male’effect.” Health, Risk & Society 2 (2): 159–172.
Firestone, Joseph M. 2003. “The New Knowledge Management: A Paradigm and Its Problems.” KT Web. Connecting Knowledge Technology Communities, 1–8.
Fitzsimon, N., F. Shiely, D. Corradino, S. Friel, and C. C. Kelleher. 2007. “Predictors of Self-Reported Poor Mental Health at Area Level in Ireland: A Multilevel Analysis of Deprivation and Social Capital Indicators.” Irish Medical Journal 100 (8): suppl–49.
Flavin, P., A. C. Pacek, and B. Radcliff. 2011. “State Intervention and Subjective Well-Being in Advanced Industrial Democracies.” Politics & Policy 39 (2): 251–269.
Fletcher, Guy. 2013. “A Fresh Start for the Objective-List Theory of Well-Being.” Utilitas 25 (2): 206–20. doi:10.1017/S0953820812000453.
Fleurbaey, Marc. 2009. “Beyond GDP: The Quest for a Measure of Social Welfare.” Journal of Economic Literature 47 (4): 1029–1075.
Flouri, E. 2004. “Subjective Well-Being in Midlife: The Role of Involvement of and Closeness to Parents in Childhood.” Journal of Happiness Studies 5 (4): 335–58.
Flyvbjerg, Bent. 2006. “Five Misunderstandings about Case-Study Research.” Qualitative Inquiry 12 (2): 219–245.
Foa, Roberto, and Jeffery Tanner. 2012. “Methodology of the Indices of Social Development.” http://repub.eur.nl/pub/50510/.
Focus Ireland. (2016). About Homelessness - Focus Ireland. [online] Available at: https://www.focusireland.ie/resource-hub/about-homelessness/ [Accessed 9 Nov. 2016].
Fogarty, Michael Patrick, Liam Ryan, and Joseph J. Lee. 1984. Irish Values & Attitudes. Dominican.
226
Forfas, 2015 Ireland’s Construction Sector Outlook and Strategic Plan to 2015 [accessed online 7th January 2017] https://djei.ie/en/Publications/Publication-files/Forfás/Ireland-s-Construction-Sector-Outlook-and-Strategic-Plan-to-2015.pdf
Fowler Jr, Floyd J., and Carol Cosenza. 2009. “Design and Evaluation of Survey Questions.” The SAGE Handbook of Applied Social Research Methods, 375–412.
Fox, Mary F., and Glenn Firebaugh. 1992. “Confidence in Science: The Gender Gap.” Social Science Quarterly. http://psycnet.apa.org/psycinfo/1993-25549-001.
Francis, L. J., and D. Lester. 1997. “Religion, Personality and Happiness.” Journal of Contemporary Religion 12 (1): 81–86.
Fre, B. S. 2005. “Happiness Research: State and Prospects.” Review of Social Economy 63 (2): 207–228.
Frederick, Shane, George Loewenstein, and Ted O’donoghue. 2002. “Time Discounting and Time Preference: A Critical Review.” Journal of Economic Literature 40 (2): 351–401. doi:10.1257/002205102320161311.
Freese, Jeremy. 2004. “Risk Preferences and Gender Differences in Religiousness: Evidence from the World Values Survey.” Review of Religious Research, 88–91.
Frey Bruno S. 2002b. “What Can Economists Learn from Happiness Research?” Journal of Economic Literature 40 (2): 402–35.
Frey, B. S., and A. Stutzer. 2000. “Happiness, Economy and Institution.” The Economic Journal 110 (466): 918–38.
Frey, B., S. Luechinger, and A. Stutzer. 2009. “The Life Satisfaction Approach to Environmental Valuation.”
Frey, Bruno S., and A. Stutzer. 2002a. “The Economics of Happiness.” World Economics 3 (1): 25–41.
Frijters, P., J. P. Haisken-DeNew, and M. A. Shields. 2004. “Money Does Matter! Evidence from Increasing Real Income and Life Satisfaction in East Germany Following Reunification.” The American Economic Review 94 (3): 730–740.
Fund, Commonwealth. 2014. “Mirror, Mirror on the Wall, 2014 Update: How the US Health Care System Compares Internationally.” Commonwealth Fund Pub, no. 1755.
Füredi, F., 2004. Therapy culture: Cultivating vulnerability in an uncertain age. Psychology Press.
Garvin, T., 2004. Preventing the Future: Why was Ireland so poor for so long? Gill & Macmillan Ltd.
Gerdtham, Ulf-G, and Magnus Johannesson. 2001. “The Relationship between Happiness, Health, and Socio-Economic Factors: Results Based on Swedish Microdata.” Journal of Socio-Economics 30 (6): 553–57. doi:10.1016/S1053-5357(01)00118-4.
Gerlach, K., and G. Stephan. 1996. “A Paper on Unhappiness and Unemployment in Germany.” Economics Letters 52 (3): 325–30.
Gilardi, Fabrizio. 2012. "Policy interdependence: transfer, diffusion,
convergence." Comparative Policy Studies: Conceptual and Methodological Challenges,
New York: Palgrave MacMillan
Girvin, B. 2010. “Before the Celtic Tiger: Change without Modernisation in Ireland 1959-1989.” The Economic and Social Review 41 (3): 349–365.
Glassman, A. H., and P. A. Shapiro. 1998. “Depression and the Course of Coronary Artery Disease.” American Journal of Psychiatry 155 (1): 4–11.
227
Gleeson-White, J., 2015. Six Capitals, Or Can Accountants Save the Planet? Rethinking Capitalism for the Twenty-first Century. WW Norton & Company.
Glennerster, H., Hills, J., Piachaud, D. and Webb, J., 2004. One hundred years of poverty and policy. Joseph Rowntree Foundation.
Goetschel, L. ed., 2013. Small states inside and outside the European Union: interests and policies. Springer Science & Business Media.
Goffman, E. 2005. “Defining Sustainability, Defining the Future.” CSA Discovery Guides.
Goldin, Ian, and A. Winters. 1995. “Economic Policies for Sustainable Development.” The Economics of Sustainable Development, Cambridge University Press, Cambridge, 1–15.
Goldthorpe, John H. 1997. “Current Issues in Comparative Macrosociology: A Debate on Methodological Issues.” Comparative Social Research 16: 1–26.
Goss, Kristin A. 2010. Disarmed: The Missing Movement for Gun Control in America. Princeton University Press. https://books.google.co.uk/books?hl=en&lr=&id=FFgQC1hZnpoC&oi=fnd&pg=PP2&dq=goss+2010+gun+control+women&ots=eQtYu0YVS8&sig=n6Y6C1PE9h_Y2H9ujuMGzrOfb9I.
Gowdy, J. 2005. “Toward a New Welfare Economics for Sustainability.” Ecological Economics 53 (2): 211–222.
Gowdy, J. M., and C. N. McDaniel. 1999. “The Physical Destruction of Nauru: An Example of Weak Sustainability.” Land Economics 75 (2): 333–338.
Gowdy. 2004. “The Revolution in Welfare Economics and Its Implications for Environmental Valuation and Policy.” Land Economics 80 (2): 239–257.
Gráda, Cormac Ó. 2008. “School of Economics University College Dublin.” http://citeseerx.ist.psu.edu/viewdoc/download?doi=10.1.1.729.4443&rep=rep1&type=pdf.
Graham, C. 2010. Happiness around the World: The Paradox of Happy Peasants and Miserable Millionaires. Oxford Univ Pr.
Graham, C., and A. Felton. 2006. “Inequality and Happiness: Insights from Latin America.” Journal of Economic Inequality 4 (1): 107–122.
Graham, C., and S. Pettinato. 2001. “Happiness, Markets, and Democracy: Latin America in Comparative Perspective.” Journal of Happiness Studies 2 (3): 237–68.
Gray, R. H. 1990. The Greening of Accountancy: The Profession after Pearce. Vol. 17. Certified Accountants Publications.
Greve, B., 2016. How to Measure Social Progress?. Social Policy & Administration.
Grossman, G. M., and A. B. Krueger. 1994. “Economic Growth and the Environment.”
Gutman, L. M., J. Brown, R. Akerman, and P. Obolenskaya. 2010. “Change in Wellbeing from Childhood to Adolescence: Risk and Resilience.” Change.
Hagerty M.R. 2000. “Social Comparisons of Income in One’s Community: Evidence from National Surveys of Income and Happiness.” Journal of Personality and Social Psychology 78 (4): 764–71.
Hagerty, M. R., and R. Veenhoven. 2003. “Wealth and Happiness Revisited–growing National Income Does Go with Greater Happiness.” Social Indicators Research 64 (1): 1–27.
228
Haggard, Robert F. 2001. The Persistence of Victorian Liberalism: The Politics of Social Reform in Britain, 1870-1900. Greenwood Publishing Group.
Hall, Jon, E Giovanni, Morrone, and Ranuzzi. 2011. “A Framework to Measure the Progress of Societies - Google Search.”
Haller, M., and M. Hadler. 2006. “How Social Relations and Structures Can Produce Happiness and Unhappiness: An International Comparative Analysis.” Social Indicators Research 75 (2): 169–216.
Halpern, David. 1999. “Social Capital: The New Golden Goose.” London: Institute for Public Policy Research.
Halstead, Diane, Edward A. Morash, and John Ozment. 1996. “Comparing Objective Service Failures and Subjective Complaints.” Journal of Business Research 36 (2): 107–15. doi:10.1016/0148-2963(95)00170-0.
Hardiman, N. 2000. “The Political Economy of Growth: Economic Governance and Political Innovation in Ireland.” London, Society for the Advancement of Socio-Economics (SASE).
Harford, T. 2014 “Big Data: are we making a big mistake” Financial Times, [online]
https://www.ft.com/content/21a6e7d8-b479-11e3-a09a-00144feabdc0 [Accessed 13
Jan. 2017].
Harris, Jonathon M. 1997. “Critiques of National Income Accounting and GNP.” Human Well-Being and Economic Goals. Island Press, Washington, DC.
Hartman, Robert. 1967. The Structure of Value. Southern Illinois University Press.
Hartwick, J. M. 1977. “Intergenerational Equity and the Investing of Rents from Exhaustible Resources.” The American Economic Review 67 (5): 972–974.
Hartwick, John M. 1990. “Natural Resources, National Accounting and Economic Depreciation.” Journal of Public Economics 43 (3): 291–304.
Harvey, D., 1990. The condition of postmodernity: An enquiry into the conditions of cultural change.
Hausman, Daniel M., "Philosophy of Economics", The Stanford Encyclopedia of Philosophy (Winter 2013 Edition), Edward N. Zalta (ed.), URL = <https://plato.stanford.edu/archives/win2013/entries/economics/>.
Hayes, Bernadette C. 2001. “Gender, Scientific Knowledge, and Attitudes toward the Environment: A Cross-National Analysis.” Political Research Quarterly 54 (3): 657–671.
Hayo, B. 2004. “Happiness in Eastern Europe.”
Headey, B., and M. Wooden. 2004. “The Effects of Wealth and Income on Subjective Well-Being and Ill-Being*.” Economic Record 80: S24–S33.
Headey, B., R. Muffels, and M. Wooden. 2008. “Money Does Not Buy Happiness: Or Does It? A Reassessment Based on the Combined Effects of Wealth, Income and Consumption.” Social Indicators Research 87 (1): 65–82.
Heal, G. 2008. “Climate Economics: A Meta-Review and Some Suggestions.”
Healy, T. (2016). Some dirty secrets abour income and earnings. [Blog] Available at: http://www.nerinstitute.net/blog/2016/12/02/some-dirty-secrets-about-income-and-earnings/ [Accessed 11 Jan. 2017].
Healy, T., B. Reynolds, and S. Healy. 2005a. “Social Capital and Well-Being in Ireland.” Securing Fairness and Wellbeing in a Land of Plenty, Dublin: CORI Justice Commission, 50–65.
229
Heathwood, Chris. 2010. “Welfare.” In , edited by John Skorupski. Routledge.
Heathwood. 2012. “Monism and Pluralism about Value.”
Heathwood. 2014. “Subjective Theories of Well-Being.” In , edited by Ben Eggleston and Dale Miller, 199–219. Cambridge University Press.
Hediger, Werner. 2006. “Weak and Strong Sustainability, Environmental Conservation and Economic Growth.” Natural Resource Modeling 19 (3): 359–394.
Heede, Richard. 2014. “Tracing Anthropogenic Carbon Dioxide and Methane Emissions to Fossil Fuel and Cement Producers, 1854–2010.” Climatic Change 122 (1–2): 229–241.
Heliwell, J. F., and H. Huang. 2005. “How’s the Job? Well-Being and Social Capital in the Workplace.”
Helliwell J. F.. 2006b. “How’s Your Government? International Evidence Linking Good Government and Well-Being.” NBER Working Paper 11988. The National Bureau of Economic Research. http://www.nber.org/papers/w11988.
Helliwell, J. F. 2003. “How’s Life? Combining Individual and National Variables to Explain Subjective Well-Being.” Economic Modelling 20 (2): 331–360.
Helliwell, J. F., and H. Huang. 2006a. “How’s Your Government? International Evidence Linking Good Government and Well-Being.”
Helliwell, J. F., and R. D. Putnam. 2004. “The Social Context of Well-Being.” Philosophical Transactions of the Royal Society B 359: 1435–46.
Helliwell, J.F. and Wang, S., 2010. Trust and well-being (No. w15911). National Bureau
of Economic Research.
Helliwell, J., 2001. Social capital, the economy and well-being. The review of economic
performance and social progress.
Hertzman, Arjumand Siddiqi and Clyde. 2001. “Economic Growth, Income Equality, and Population Health among the Asian Tigers.” International Journal of Health Services 31 (2): 323–33. doi:10.2190/YFXB-E27P-HQDQ-04AM.
Hirsch, Fred. 1976. “Social Limits to.” Growth, 101.
Hirst, M. 2003. “Caring-Related Inequalities in Psychological Distress in Britain during the 1990s.” Journal of Public Health Medicine 25 (4): 336–43.
Hirst, M. 2005. “Carer Distress: A Prospective, Population-Based Study.” Social Science & Medicine 61 (3): 697–708.
Hiscock, Keith, Alan Southward, Ian Tittley, and Stephen Hawkins. 2004. “Effects of Changing Temperature on Benthic Marine Life in Britain and Ireland.” Aquatic Conservation: Marine and Freshwater Ecosystems 14 (4): 333–362.
Hitlin, Steven, and Jane Allyn Piliavin. 2004. “Values: Reviving a Dormant Concept.” Annual Review of Sociology, 359–393.
Honohan, Patrick, and Brendan Walsh. 2002. “Catching up with the Leaders: The Irish Hare.” Brookings Papers on Economic Activity 2002 (1): 1–77.
Hooghe, M., and B. Vanhoutte. 2010. “Subjective Well-Being and Social Capital in Belgian Communities. The Impact of Community Characteristics on Subjective Well-Being Indicators in Belgium.” Social Indicators Research 100 (1): 17–36.
Hopkins, E. 2008. “Inequality, Happiness and Relative Concerns: What Actually Is Their Relationship?” Journal of Economic Inequality 6 (4): 351–372.
230
Horkheimer, M., Adorno, T.W. and Noeri, G., 2002. Dialectic of enlightenment. Stanford University Press.
Horsch, Karen. 1997. “Indicators: Definition and Use in a Results-Based Accountability System.” Harvard Family Research Project. Available at: Http://www. Hfrp. Org/publicationsresources/browse-Our-Publications/indicators-Definition-and-Use-in-a-Results-Basedaccountability-System (29/03/09).
Howell, R. T., M. L. Kern, and S. Lyubomirsky. 2007. “Health Benefits: Meta-Analytically Determining the Impact of Well-Being on Objective Health Outcomes.” Health Psychology Review 1 (1): 83–136.
Hsieh, Chang-ming. 2003. “Counting Importance: The Case of Life Satisfaction and Relative Domain Importance.” Social Indicators Research 61 (2): 227–240.
Hsieh, Chang-ming. 2004. “To Weight or Not to Weight: The Role of Domain Importance in Quality of Life Measurement.” Social Indicators Research 68 (2): 163–174.
Hsieh, Chang-Ming. 2012. “Importance Is Not Unimportant: The Role of Importance Weighting in QoL Measures.” Social Indicators Research 109 (2): 267–278.
Hsieh, Chang-ming. 2013. “Issues in Evaluating Importance Weighting in Quality of Life Measures.” Social Indicators Research 110 (2): 681–693.
http://oecdinsights.org/2016/06/27/did-the-oecd-composite-leading-indicators-see-it-coming/ for chapter 9
Hudders, Liselot, and Mario Pandelaere. 2012. “The Silver Lining of Materialism: The Impact of Luxury Consumption on Subjective Well-Being.” Journal of Happiness Studies 13 (3): 411–437.
Hudson, J. 2006. “Institutional Trust and Subjective Well-Being across the EU.” Kyklos 59 (1): 43–62.
Hueting, Roefie. 1980. “New Scarcity and Economic Growth; More Welfare through Less Production?” http://agris.fao.org/agris-search/search.do?recordID=XF2015029320.
Hyman, L., 2014. Happiness: Understandings, narratives and discourses. Springer.
IMF (2016), Statistical Database, available at http://www.imf.org/external/pubs/ft/weo/2009/01/weodata/index.aspx, (accessed 30th December 2016).
Immerzeel T, Coffé H, Van der Lippe T. Explaining the gender gap in radical right voting: A cross-national investigation in 12 Western European countries. Comparative European Politics. 2015 Feb 1;13(2):263-86.
Inglehart, 1981. “Post-Materialism in an Environment of Insecurity.” American Political Science Review 75 (4): 880–900.
Inglehart, 1990. Culture Shift in Advanced Industrial Society. Princeton University Press. https://books.google.co.uk/books?hl=en&lr=&id=ztYnOnSgs1EC&oi=fnd&pg=PR9&dq=inglehart+1990&ots=vHS5ctvWWW&sig=IuyfXEnnAQQAxWmQxiF9AhLDwg4.
Inglehart, 1997. Modernization and Postmodernization: Cultural, Economic, and Political Change in 43 Societies. Vol. 19. Cambridge Univ Press. http://journals.cambridge.org/production/action/cjoGetFulltext?fulltextid=6296904.
Inglehart, R., and H. D. Klingemann. 2000. “Genes, Culture, Democracy, and Happiness.” Culture and Subjective Well-Being, 165–183.
Inglehart, R., and H. D. Klingemann. 2000. “Genes, Culture, Democracy, and Happiness.” Culture and Subjective Well-Being, 165–183.
231
Inglehart, Ronald F. 1977. “The Silent Revolution: Changing Values and Political Styles among Western Publics.”
Inglehart, Ronald, and Christian Welzel. 2010. “Changing Mass Priorities: The Link between Modernization and Democracy.” Perspectives on Politics 8 (2): 551–567.
Inglehart, Ronald, and Pippa Norris. 2000. “The Developmental Theory of the Gender Gap: Women’s and Men’s Voting Behavior in Global Perspective.” International Political Science Review 21 (4): 441–463.
Inglehart, Ronald. 1971. “The Silent Revolution in Europe: Intergenerational Change in Post-Industrial Societies.” American Political Science Review 65 (4): 991–1017.
Inglis, Tom. 2007. “Catholic Identity in Contemporary Ireland: Belief and Belonging to Tradition 1.” Journal of Contemporary Religion 22 (2): 205–220.
International energy agency, (2015). Co2 Emissions from Fuel Combustion: Highlights, IEA Statistics
International Monetary Fund. 2005. “IMF Country Report Ireland.”
Jackson, T. 2009. “Prosperity without Growth? The Transition to a Sustainable Economy.” Sustainable Development.
Jackson, Tim, and Nic Marks. 1999. “Consumption, Sustainable Welfare and Human Needs—with Reference to UK Expenditure Patterns between 1954 and 1994.” Ecological Economics 28 (3): 421–41. doi:10.1016/S0921-8009(98)00108-6.
Jahedi, Salar, and Fabio Méndez. 2014. “On the Advantages and Disadvantages of Subjective Measures.” Journal of Economic Behavior & Organization 98: 97–114.
Jameson, F., 1984. The politics of theory: ideological positions in the postmodernism debate. New German Critique, (33), pp.53-65.
Jamieson, Susan, and others. 2004. “Likert Scales: How to (Ab) Use Them.” Medical Education 38 (12): 1217–1218.
Jardine, N., 2004. Etics and emics (not to mention anemics and emetics) in the history
of the sciences. History of science, 42(3), pp.261-278.
Jenkins, J. (2012). Historic Paths to Decarbonization. [online] Thebreakthrough.org. Available at: http://thebreakthrough.org/archive/which_nations_have_reduced_car [Accessed 13 Jan. 2017].
Jenkins, R., D. Bhugra, P. Bebbington, T. Brugha, M. Farrell, J. Coid, T. Fryers, S. Weich, N. Singleton, and H. Meltzer. 2008. “Debt, Income and Mental Disorder in the General Population.” Psychological Medicine 38 (10): 1485–1493.
Johnson, IR. 2011. “Patient Perspectives on Health, Health Needs, and Health Care Services in a Rural Irish Community: A Qualitative Study.” RURAL AND REMOTE HEALTH 11 (3).
Johnson, Monica Kirkpatrick. 2001. “Change in Job Values during the Transition to Adulthood.” Work and Occupations 28 (3): 315–345.
Johnson, Monica Kirkpatrick. 2002. “Social Origins, Adolescent Experiences, and Work Value Trajectories during the Transition to Adulthood.” Social Forces 80 (4): 1307–1340.
Johnson, R. Burke, Anthony J. Onwuegbuzie, and Lisa A. Turner. 2007. “Toward a Definition of Mixed Methods Research.” Journal of Mixed Methods Research 1 (2): 112–133.
Joliffe, I. and Morgan, B. (1992). Principal component analysis and exploratory factor analysis. Statistical Methods in Medical Research, 1(1), pp.69-95.
232
Kacapyr, E. 2008. “Cross-Country Determinants of Satisfaction with Life.” International Journal of Social Economics 35 (6): 400–416.
Kahneman, D., and A.B. Krueger. 2006. “Developments in the Measurement of Subjective Well-Being.” The Journal of Economic Perspectives 20 (1): 3–24.
Kahneman, Daniel, Alan B. Krueger, David Schkade, Norbert Schwarz, and Arthur Stone. 2004. “Toward National Well-Being Accounts.” American Economic Review 94 (2): 429–34.
Kahneman, Daniel, and Angus Deaton. 2010. “High Income Improves Evaluation of Life but Not Emotional Well-Being.” Proceedings of the National Academy of Sciences 107 (38): 16489–93. doi:10.1073/pnas.1011492107.
Kahneman, Daniel, Ed Diener, and Norbert Schwarz. 2003. Well-Being: Foundations of Hedonic Psychology. New York: Russell Sage Foundation.
Kahneman, Daniel. 2011. Thinking, Fast and Slow. Macmillan.
Kaiser, Henry F. 1974. “An Index of Factorial Simplicity.” Psychometrika 39 (1): 31–36.
Kapsos, S. (2005) The employment intensity of growth: Trends and macroeconomic determinants, International Labour Organisation.
Karabarbounis, Loukas, and Brent Neiman. 2014. "The global decline of the labor share." The Quarterly Journal of Economics 129, no. 1: 61-103.
Kashdan, Todd B., and William E. Breen. 2007. “Materialism and Diminished Well-Being: Experiential Avoidance as a Mediating Mechanism.” Journal of Social and Clinical Psychology 26 (5): 521–539.
Kasperson, Roger E., Gerald Berk, David Pijawka, Alan B. Sharaf, and James Wood. 1980. “Public Opposition to Nuclear Energy: Retrospect and Prospect.” Science, Technology, & Human Values 5 (31): 11–23.
Kasser, Tim, and Richard M. Ryan. 1993. “A Dark Side of the American Dream: Correlates of Financial Success as a Central Life Aspiration.” Journal of Personality and Social Psychology 65 (2): 410.
Kasser, Tim, and Richard M. Ryan. 2001 "Be careful what you wish for: Optimal
functioning and the relative attainment of intrinsic and extrinsic goals." Life goals and
well-being: Towards a positive psychology of human striving 116-131
Kaufmann, Daniel, Aart Kraay, and Massimo Mastruzzi. 2007. “Governance Matters VI: Governance Indicators for 1996-2006.” World Bank Policy Research Working Paper, no. 4280. http://papers.ssrn.com/sol3/Papers.cfm?abstract_id=999979.
Kelleher, C. C., Sharon Friel, S. Nic Gabhainn, and Joseph B. Tay. 2003. “Socio-Demographic Predictors of Self-Rated Health in the Republic of Ireland: Findings from the National Survey on Lifestyle, Attitudes and Nutrition, SLAN.” Social Science & Medicine 57 (3): 477–486.
Kenna, Padraic. 2011. Housing Law, Rights and Policy. Dublin: Clarus Press Ltd.
Kennedy, G erard, and Tara McIndoe-Calder. 2011."The Irish mortgage market:
Stylised facts, negative equity and arrears." In Central Bank of Ireland Conference
Paper, October.
Kenny, A. 1992. Aristotle on the Perfect Life. Clarendon press Oxford. http://www.getcited.org/pub/102976952.
Keyes, C. L. M. 1998. “Social Well-Being.” Social Psychology Quarterly, 121–140.
233
Keynes, J.M., 1937. The general theory of employment. The quarterly journal of economics, pp.209-223.Kharecha, Pushker A., and James E. Hansen. 2013. “Prevented Mortality and Greenhouse Gas Emissions from Historical and Projected Nuclear Power.” Environmental Science & Technology 47 (9): 4889–95. doi:10.1021/es3051197.
King, Gary, Robert O. Keohane, and Sidney Verba. 1994. Designing Social Inquiry: Scientific Inference in Qualitative Research. Princeton university press. https://books.google.co.uk/books?hl=en&lr=&id=A7VFF-JR3b8C&oi=fnd&pg=PP1&dq=King,+Keohane+and+Verba,+1994+small+n+problem&ots=f1lpOeFV_Q&sig=Q58GXUSVc3OZFR1UyHjbnUwPEN8.
Kinsella, Stephen. 2012. “Is Ireland Really the Role Model for Austerity?” Cambridge Journal of Economics 36 (1): 223–235.
Kirby, Peadar, and Mary Murphy. 2011. “Globalisation and Models of State: Debates and Evidence from Ireland.” New Political Economy 16 (1): 19–39. doi:10.1080/13563461003789795.
Kirby, Peadar. 2005. “The Irish State and the Celtic Tiger: A ‘flexible Developmental State’or a Competition State?” Global Encounters: International Political Economy, Development and Globalisation, 74–94.
Kirby. Peadar, 2010. “Lessons from the Irish Collapse: Taking an International Political Economy Approach.” Irish Studies in International Affairs 21 (1): 43–55.
Kitayama, S., Markus, H.R. and Kurokawa, M., 2000. Culture, emotion, and well-being:
Good feelings in Japan and the United States. Cognition & Emotion, 14(1), pp.93-124.
Kitchin, R., and Brendan Bartley. 2007. “Ireland in the Twenty First Century.” 2007) Understanding Contemporary Ireland. Pluto Press, London, 1–26.
Kitchin, Rob, Cian O’Callaghan, Mark Boyle, Justin Gleeson, and Karen Keaveney. 2012. “Placing Neoliberalism: The Rise and Fall of Ireland’s Celtic Tiger.” Environment and Planning A 44 (6): 1302–1326.
Kitchin, Rob, and Tracey P. Lauriault. 2014. "Towards critical data studies: Charting
and unpacking data assemblages and their work."
Kittel, Bernhard. 2006. “A Crazy Methodology? On the Limits of Macro-Quantitative Social Science Research.” International Sociology 21 (5): 647–677.
Knight, J., L. Song, and R. Gunatilaka. 2009. “Subjective Well-Being and Its Determinants in Rural China.” China Economic Review 20 (4): 635–649.
Koivumaa-Honkanen, H., Honkanen, R., Viinamaeki, H., Heikkilae, K., Kaprio, J. and
Koskenvuo, M., 2001. Life satisfaction and suicide: a 20-year follow-up study. American
Journal of Psychiatry, 158(3), pp.433-439.
Konrad, Alison M., J. Edgar Ritchie Jr, Pamela Lieb, and Elizabeth Corrigall. 2000. “Sex Differences and Similarities in Job Attribute Preferences: A Meta-Analysis.” Psychological Bulletin 126 (4): 593.
Korpela, K. M., T. Klemettilä, and J. K. Hietanen. 2002. “Evidence for Rapid Affective Evaluation of Environmental Scenes.” Environment and Behavior 34 (5): 634–650.
Korpi, T. 1997. “Is Utility Related to Employment Status? Employment, Unemployment, Labor Market Policies and Subjective Well-Being among Swedish Youth.” Labour Economics 4 (2): 125–147.
Kotakorpi, K., and J. P. LAAMANEN. 2010. “Welfare State and Life Satisfaction: Evidence from Public Health Care.” Economica 77 (307): 565–583.
Kottak, Conrad (2006), Mirror for Humanity, New York: McGraw Hill
234
Kristiansen, Connie M., and Mark P. Zanna. 1991. “Value Relevance and the Value-Attitude Relation: Value Expressiveness versus Halo Effects.” Basic and Applied Social Psychology 12 (4): 471–483.
Kuznar, Lawrence A. 2008. Reclaiming a Scientific Anthropology. Rowman Altamira.
Kuznets, Simon, Lillian Epstein, and Elizabeth Jenks. 1946. “National Income and Its Composition, 1919-1938, Volume II.” http://econpapers.repec.org/RePEc:nbr:nberbk:kuzn41-3.
Kuznets, Simon. 1962. “How to Judge Quality.” The New Republic 20: 1962–10.
Lafferty, Rich. 2001. “Lámh Dearg, Lámh Dofheicthe: Economic Growth and Persistent Unemployment in Ireland.”
Layard, R. (2003). HAPPINESS: HAS SOCIAL SCIENCE A CLUE?.
Layard, Richard. 2005. “Happiness: Lessons Form a New Science.” London: Allen Lane.
Layard, Richard. 2006. “Happiness and Public Policy: A Challenge to the Profession*.” The Economic Journal 116 (510): C24–33. doi:10.1111/j.1468-0297.2006.01073.x.
Lélé, Sharachchandra M. 1991. “Sustainable Development: A Critical Review.” World Development 19 (6): 607–21. doi:10.1016/0305-750X(91)90197-P.
Lelkes, O. 2006. “Knowing What Is Good for You: Empirical Analysis of Personal Preferences and The ‘objective Good.’” The Journal of Socio-Economics 35 (2): 285–307.
Lincoln, Yvonna S., and Egon G. Guba. 2000. “The Only Generalization Is: There Is No Generalization.” Case Study Method, 27–44.
Lipset, Seymour M., and Stein Rokkan. 1967. “Cleavage Structures, Party Systems, and Voter Alignments: An Introduction.” http://www.citeulike.org/group/1922/article/928870.
Liu, M. (2016). How China Buried the Green GDP. [online] Newsweek. Available at: http://europe.newsweek.com/how-china-buried-green-gdp-91049?rm=eu [Accessed 30 Nov. 2016].
Locke, John. 1677. “Knowledge, Its Extent and Measure.”
Lomborg, B. 2001. “The Skeptical Environmentalist: Measuring the Real State of the World.” Cambridge (UK), 165–172.
Longhi, Simonetta, Peter Nijkamp, and Jacques Poot. 2008. “Meta-Analysis of Empirical Evidence on the Labour Market Impacts of Immigration.” Available at SSRN 1136223. http://papers.ssrn.com/sol3/papers.cfm?abstract_id=1136223.
Lorenzoni, Irene, and Nick F. Pidgeon. 2006. “Public Views on Climate Change: European and USA Perspectives.” Climatic Change 77 (1–2): 73–95. doi:10.1007/s10584-006-9072-z.
Lorenzoni, Irene, Sophie Nicholson-Cole, and Lorraine Whitmarsh. 2007. “Barriers Perceived to Engaging with Climate Change among the UK Public and Their Policy Implications.” Global Environmental Change 17 (3): 445–459.
Louis, V. V., and S. Zhao. 2002. “Effects of Family Structure, Family SES, and Adulthood Experiences on Life Satisfaction.” Journal of Family Issues 23 (8): 986–1005.
Loyal, Steve. 2003. “Welcome to the Celtic Tiger: Racism, Immigration and the State.” The End of Irish History, 74–94.
235
Lubke, Gitta H., and Bengt O. Muthén. 2004. “Applying Multigroup Confirmatory Factor Models for Continuous Outcomes to Likert Scale Data Complicates Meaningful Group Comparisons.” Structural Equation Modeling 11 (4): 514–534.
Lucas, R. E., A. E. Clark, Y. Georgellis, and E. Diener. 2004. “Unemployment Alters the Set Point for Life Satisfaction.” Psychological Science 15 (1): 8–13.
Luechinger, S., S. Meier, and A. Stutzer. 2008. “Why Does Unemployment Hurt the Employed?: Evidence from the Life Satisfaction Gap between the Public and Private Sectors.”
Luttmer, Erzo F. P. 2005. “Neighbors as Negatives: Relative Earnings and Well-Being.” The Quarterly Journal of Economics 120 (3): 963–1002.
Lykken, David, and Auke Tellegen. 1996. “Happiness Is a Stochastic Phenomenon.” Psychological Science 7 (3): 186–189.
Lyons, Séan, Karen Mayor, Richard SJ Tol, and others. 2008. “Environmental Accounts for the Republic of Ireland: 1990-2005.” Journal of the Statistical and Social Inquiry Society of Ireland 37: 190–216.
MacKerron, G. 2011. “Happiness Economics from 35 000 Feet.” Journal of Economic Surveys.
Madden, David. 2009. “Mental Stress in Ireland, 1994–2000: A Stochastic Dominance Approach.” Health Economics 18 (10): 1202–1217.
Maguire, Martin. 2002. “‘Our People’the Church of Ireland and the Culture of Community in Dublin since Disestablishment.” http://eprints.dkit.ie/75/.
McGillivray, M. and Clarke, M., 2006. Human well-being: Concepts and
measures. Understanding human well-being, pp.3-16.
Maio, Gregory R., and James M. Olson. 2000. “What Is a ‘value-Expressive’ Attitude.” Why We Evaluate: Functions of Attitudes, 249–269.
Maio, Gregory R., Neal J. Roese, Clive Seligman, and Albert Katz. 1996. “Rankings, Ratings, and the Measurement of Values: Evidence for the Superior Validity of Ratings.” Basic and Applied Social Psychology 18 (2): 171–181.
Marini, Margaret Mooney, Pi-Ling Fan, Erica Finley, and Ann M. Beutel. 1996. “Gender and Job Values.” Sociology of Education, 49–65.
Marks, Nadine F, James David Lambert, and Heejeong Choi. 2002. “Transitions to Caregiving, Gender, and Psychological Well‐Being: A Prospective U.S. National Study.” Journal of Marriage and Family 64 (3): 657–67. doi:10.1111/j.1741-3737.2002.00657.x.
Marmot, M. 2003. “Self Esteem and Health.” BMJ 327 (7415): 574–75. doi:10.1136/bmj.327.7415.574.
Martinez Allier. 1995. “Distributional Issues in Ecological Economics.” Review of Social Economy 53 (4): 511–528.
Martinoia, Rozenn. 2003. “That Which Is Desired, Which Pleases, and Which Satisfies: Utility according to Alfred Marshall.” Journal of the History of Economic Thought 25 (3): 349–364.
Marx, Karl. 1867. “Das Kapital, Vol. 1.” Marx/Engels: Werke 23. Mazmanian, A. 2014 "The Mosaic Effect and Big Data."
236
Matell, Michael S., and Jacob Jacoby. 1972. “Is There an Optimal Number of Alternatives for Likert-Scale Items? Effects of Testing Time and Scale Properties.” Journal of Applied Psychology 56 (6): 506–9. doi:10.1037/h0033601. Mavisakalyan, A. (2014). Women in cabinet and public health spending: evidence across countries. Economics of Governance, 15(3), pp.281-304.
Max-Neef, Manfred, Antonio Elizalde, Martin Hopenhayn, Joey Edwardh, and Manfred Max-Neef. 1990. Human Scale Development: An Option for the Future. Dag Hammarskjold Foundation.
McBride, M. 2001. “Relative-Income Effects on Subjective Well-Being in the Cross-Section.” Journal of Economic Behavior & Organization 45 (3): 251–278.
McCarthy, Yvonne, Kieran McQuinn, and others. 2013. “Credit Conditions in a Boom and Bust Property Market.” Central Bank of Ireland Research Technical Paper 8. https://www.financialregulator.ie/publications/Documents/08RT13.pdf.
McCarthy, Yvonne, Kieran McQuinn, and others. 2013. “Credit Conditions in a Boom
McGillivray, Mark, and Farhad Noorbakhsh. 2004. “Composite Indices of Human Well Being Past.” Present, and Future, $ IDER, Research Paper, no. 2004/63.
McGillivray, Mark, and Howard White. 1993. “Measuring Development? The UNDP’s Human Development Index.” Journal of International Development 5 (2): 183–192.
McGillivray, Mark. 1991. “The Human Development Index: Yet Another Redundant Composite Development Indicator?” World Development 19 (10): 1461–1468.
McMahon, Darrin M. 2006. Happiness: A History. Grove Press. https://books.google.co.uk/books?hl=en&lr=&id=WDbOfcnXp-AC&oi=fnd&pg=PR11&dq=mcmahon+2006+happiness&ots=UmZg0KrLyX&sig=pnvRBViejyfeGRXMu_SWKEwDqa8.
McWilliams, D., 2007. The pope's children: Ireland's new elite. Pan Macmillan.
Meadows, Donella H., Dennis L. Meadows, Jorgen Randers, and William W. Behrens. 1972. “The Limits to Growth.” New York 102.
Meek Lange, Margaret, "Progress", The Stanford Encyclopedia of Philosophy (Spring
2011 Edition), Edward N. Zalta (ed.), URL =
<https://plato.stanford.edu/archives/spr2011/entries/progress/>.
Meier, S., and A. Stutzer. 2008. “Is Volunteering Rewarding in Itself?” Economica 75
(297): 39–59.
Memery, Clodagh. 2001. “THE HOUSING SYSTEM AND THE CELTIC TIGER: THE
STATE RESPONSE TO A HOUSING CRISIS OF AFFORDABILITY AND ACCESS.”
European Journal of Housing Policy 1 (1): 79–104. doi:10.1080/14616710110036445.
Memery, Clodagh. 2001. “THE HOUSING SYSTEM AND THE CELTIC TIGER: THE
Mendelsohn, Robert, Thomas Sterner, U. Martin Persson, and John P. Weyant. 2008.
“Comments on Simon Dietz and Nicholas Stern’s Why Economic Analysis Supports
Strong Action on Climate Change: A Response to the Stern Review’s Critics.” Review
of Environmental Economics and Policy 2 (2): 309–13. doi:10.1093/reep/ren012.
Michalos, Alex C. 2011. “What Did Stiglitz, Sen and Fitoussi Get Right and What Did
They Get Wrong?” Social Indicators Research 102 (1): 117–129.
237
Miesen, HWJM. 2009. “‘Love Is All You Need’: Social Relatedness Needs, Materialism,
and Subjective Well-Being.” Happiness and Relational Goods: Well-Being and
Interpersonal Relations in the Economic Sphere.
Mill, J. S. 1863. Utilitarianism. Wiley Online Library.
Miller, Alan S., and John P. Hoffmann. 1995. “Risk and Religion: An Explanation of
Gender Differences in Religiosity.” Journal for the Scientific Study of Religion, 63–75.
Miller, Alan S., and Rodney Stark. 2002. “Gender and Religiousness: Can Socialization
Explanations Be Saved? 1.” American Journal of Sociology 107 (6): 1399–1423.
Mishan, Edward Joshua, and Ezra J. Mishan. 1967. The Costs of Economic Growth.
Staples Press London. http://www.thesocialcontract.com/pdf/seventeen-
one/tsc_17_1_mishan.pdf.
Montani, G. 2007. “The Ecocentric Approach to Sustainable Development. Ecology,
Economics and Politics.” FEDERALIST-PAVIA- 49 (1): 25.
Moore, George Edward. 1993. Principia Ethica. Cambridge University Press.
Morgenroth, Edgar LW, and others. 2002. Commuting in Ireland: An Analysis of Inter-
County Commuting Flows. Economic and Social Research Institute Dublin.
https://www.esri.ie/pubs/WP0144%20Commuting%20in%20Ireland.pdf.
Murphy, Mary. 2002. “Social Partnership–is It ‘the Only Game in Town’?” Community
Development Journal 37 (1): 80–90.
Music, Graham. 2014. The Good Life: Wellbeing and the New Science of Altruism,
Selfishness and Immorality. Routledge.
https://books.google.co.uk/books?hl=en&lr=&id=GxdgAwAAQBAJ&oi=fnd&pg=PP1
Myers, D. G. 2001. The American Paradox: Spiritual Hunger in an Age of Plenty. Yale
Univ Pr.
Nardo, Michela, Michaela Saisana, Andrea Saltelli, Stefano Tarantola, Anders
Hoffman, and Enrico Giovannini. 2005. “Handbook on Constructing Composite
Indicators.” http://www.oecd-ilibrary.org/economics/handbook-on-constructing-
composite-indicators_533411815016.
Naturalcapitalforum.com. (2017). What is natural capital?. [online] Available at:
http://naturalcapitalforum.com/about/ [Accessed 8 Feb. 2017].
Neumayer, E. 1999. “The ISEW–not an Index of Sustainable Economic Welfare.”
Social Indicators Research 48 (1): 77–101.
Neumayer, Eric. 2000. “On the Methodology of ISEW, GPI and Related Measures:
Some Constructive Suggestions and Some Doubt on the ‘threshold’hypothesis.”
Ecological Economics 34 (3): 347–361.
Neumayer, Eric. 2005. “4. Indicators of Sustainability.” The International Yearbook of
Environmental and Resource Economics 2004/2005, 139.
Neumayer. E. 2004. Weak versus Strong Sustainability: Exploring the Limits of Two
Opposing Paradigms. Edward Elgar Publishing.
238
Neumayer. E. 2007. “A Missed Opportunity: The Stern Review on Climate Change Fails to Tackle the Issue of Non-Substitutable Loss of Natural Capital.” Global Environmental Change 17 (3–4): 297–301.
Nieva, Veronica F., and Barbara A. Gutek. 1981. Women and Work: A Psychological Perspective. Praeger Publishers.
Nolan, Brian, Philip J. O’Connell, and Christopher T. Whelan. 2000. Bust to Boom?: The Irish Experience of Growth and Inequality. Institute of Public Administration.
Noorbakhsh, Farhad. 1998. “A Modified Human Development Index.” World Development 26 (3): 517–528.
Norberg, Johan. 2010. “GDP and Its Enemies: The Questionable Search for a Happiness Index.” European View 9 (2): 281–282.
Nordhaus, W. D. 2007. “A Review of the‘ Stern Review on the Economics of Climate Change.’” Journal of Economic Literature, 686–702.
Nordhaus, William D. 2006. “After Kyoto: Alternative Mechanisms to Control Global Warming.” The American Economic Review 96 (2): 31–34.
Nordhaus, William D., and James Tobin. 1972. “Is Growth Obsolete?” In Economic Research: Retrospect and Prospect, Volume 5, Economic Growth, 1–80. Nber. http://www.nber.org/chapters/c7620.pdf.
Nordhaus, William D., Robert N. Stavins, and Martin L. Weitzman. 1992. “Lethal Model 2: The Limits to Growth Revisited.” Brookings Papers on Economic Activity 1992 (2): 1–59.
Norris, Michelle, and Nessa Winston. 2011. “Transforming Irish Home Ownership through Credit Deregulation, Boom and Crunch.” International Journal of Housing Policy 11 (1): 1–21. doi:10.1080/14616718.2011.548584.
Nozick, Robert. 1977. Anarchy, State and Utopia. New York: Basic Books.
O'Brien, C. (2017). Almost 500 additional suicides linked to recession. [online] The Irish
Times. Available at: http://www.irishtimes.com/news/social-affairs/almost-500-
additional-suicides-linked-to-recession-1.2140862 [Accessed 22 May 2017].
O'Callaghan, C, Mark Boyle, and Rob Kitchin. 2004. "Post-politics, crisis, and Ireland's ‘ghost estates’." Political Geography 42: 121-133.
O Riain, S. 2000. “The Flexible Developmental State: Globalization, Information Technology and the ‘Celtic Tiger.’” Politics and Society 28 (2): 157–193.
O Riain, Sean. 2004. “Falling over the Competitive Edge.” In , 19–29. Dublin: Institute of Public Administration.
O’Gráda, Cormac. 1997. Rocky Road: The Irish Economy Since the 1920s. Manchester University Press.
Ó Gráda, Cormac. 2008. “Éirvana.” Working Paper Series, UCD Centre for Economics Research http://irserver.ucd.ie/handle/10197/480.
O’Hearn, Denis. 2000. “Globalization,’New Tigers,’and the End of the Developmental State.” Politics and Society 28 (1): 67.
O’Higgins, Eleanor R. E. 2002. “Government and the Creation of the Celtic Tiger: Can Management Maintain the Momentum?” The Academy of Management Executive (1993-2005) 16 (3): 104–20. doi:10.2307/4165872.
O’Neill, J., 2006. Citizenship, well-being and sustainability: Epicurus or Aristotle?. Analyse & Kritik, 28(2), pp.158-172.
239
O’Shea, Eamon, and Brendan Kennelly. 2008. “THE ECONOMICS OF.” http://www.mhcirl.ie/documents/publications/The_Economics_of_Mental_Health_Care_in_Ireland%202008.pdf.
O’Sullivan, K. P. V., and Tom Kennedy. 2010. “What Caused the Irish Banking Crisis?” Journal of Financial Regulation and Compliance 18 (3): 224–42. doi:10.1108/13581981011060808.
O’Toole, Fintan. 2009. Ship of Fools: How Stupidity and Corruption Sank the Celtic Tiger. Faber & Faber.
Oakley, Ann. 2000. “Experiments in Knowing: Gender and Method in the Social Sciences.” http://philpapers.org/rec/OAKEIK.
OECD, 2008. “Measuring Social Dimensions of Sustainable Production.” In , 39–47. OECD Publishing.
OECD, 2008. Growing Unequal?: Income Distribution and Poverty in OECD Countries. OECD.
OECD, 2009. “OECD Statistical Profile of Ireland”, OECD, Paris, available at: http://stats.oecd.org/wbos/viewhtml.aspx?queryname=468&querytype=view&lang=en (accessed 5 August 2015).
OECD, 2009. “OECD Statistical Profile of Ireland”, OECD, Paris, available at: http://stats.oecd.org/wbos/viewhtml.aspx?queryname=468&querytype=view&lang=en (accessed 5 August 2015).
OECD, 2011. "Health outcomes and expenditures", in Government at a Glance 2011, OECD Publishing, Paris. DOI: http://dx.doi.org/10.1787/gov_glance-2011-63-en
OECD, 2012. “Health at a Glance: Europe 2012.” Text. http://www.oecd-ilibrary.org/sites/9789264183896-en/03/11/index.html?itemId=/content/chapter/9789264183896-38-en&_csp_=45f4df11dc99cd2019aa9aa30865f74f.
OECD, 2013. OECD Skills Outlook 2013: First Results from the Survey of Adult Skills. OECD Publishing.
OECD, 2016. OECD Better Life Index. [online] Available at: http://www.oecdbetterlifeindex.org/about/better-life-initiative/ [Accessed 25 Nov. 2016].
Oishi, S., E. F. Diener, R. E. Lucas, and E. M. Suh. 1999. “Cross-Cultural Variations in Predictors of Life Satisfaction: Perspectives from Needs and Values.” Personality and Social Psychology Bulletin 25 (8): 980–990.
Oishi, S., S. Kesebir, and E. Diener. 2011. “Income Inequality and Happiness.” Psychological Science 22 (9): 1095–1100.
Okun, A.M., 1962. ‘Potential GNP: its measurement and significance’, American Statistical Association, Proceedings of the Business and Economics Section.
Olken, Benjamin A. 2009. “Corruption Perceptions vs. Corruption Reality.” Journal of Public Economics 93 (7): 950–964.
O'Mahony, E. (2011). Census 2011: Religion and belief. [online] Ireland after NAMA. Available at: https://irelandafternama.wordpress.com/2012/03/29/census-2011-religion-and-belief/ [Accessed 10 Jan. 2017].
Oosterlynck, S. and Bouchaute, B.V., 2013. Social solidarities: the search for solidarity in sociology. OASeS Research Centre.
240
Oswald, A. J. 1997. “Happiness and Economics Performance.” The Economic Journal 107 (445): 1815–31.
Oswald, Andrew J., and Nattavudh Powdthavee. 2006. “Does Happiness Adapt? A Longitudinal Study of Disability with Implications for Economists and Judges.”
Oulton, Nicholas. 2012. “Hooray for GDP!”
Ouweneel, P. 2002. “Social Security and Well-Being of the Unemployed in 42 Nations.” Journal of Happiness Studies 3 (2): 167–192.
Pacek, A. C., and B. Radcliff. 2008. “Welfare Policy and Subjective Well-Being across Nations: An Individual-Level Assessment.” Social Indicators Research 89 (1): 179–191.
Parfit, Derek. 1986. Reasons and Persons. New Ed edi. Oxford Oxfordshire: Oxford Paperbacks.
Paulden, M. 2010. “Some Problems with the UK Treasury’s Discount Rate.”
Pearce, D. W., and G. D. Atkinson. 1993. “Capital Theory and the Measurement of Sustainable Development: An Indicator of.” Ecological Economics 8 (2): 103–108.
Pearce, D. W., and R. K. Turner. 1990. Economics of Natural Resources and the Environment. Johns Hopkins Univ Pr.
Peillon, Michel. 1998. “Community of Distrust.” Encounters with Modern Ireland, 117–124.
Pelham, Brett (22 Apr 2009). "Awareness, Opinions About Global Warming Vary Worldwide". Gallup. Retrieved 22 Dec 2009.
Perry, I. (2009)
Peters, B. Guy. 1998. “The Case Study.” In Comparative Politics, 137–155. Springer. http://link.springer.com/chapter/10.1007/978-1-349-26926-6_6.
Peterson, C., N. Park, and M. E. P. Seligman. 2005. “Orientations to Happiness and Life Satisfaction: The Full Life versus the Empty Life.” Journal of Happiness Studies 6 (1): 25–41.
Petrol Strategies (2016). Are we running out of oil and gas. [online] Available at: http://www.petrostrategies.org/Learning_Center/are_we_running_out_of_oil_and_gas.htm [Accessed 30 Nov. 2016].
Pew Research Centre. 2015. “Major Agreement Gaps Between Scientists and the Public on Key Issues.” http://www.pewinternet.org/interactives/public-scientists-opinion-gap/.
Pezzey, J. C. V. 1997. “Sustainability Constraints Versus‘ optimality’ versus Intertemporal Concern, and Axioms versus Data.” Land Economics, 448–466.
Pichler, F. 2006. “Subjective Quality of Life of Young Europeans. Feeling Happy but Who Knows Why?” Social Indicators Research 75 (3): 419–44.
Pickett, K. E., and R. G. Wilkinson. 2007. “Child Wellbeing and Income Inequality in Rich Societies: Ecological Cross Sectional Study.” Bmj 335 (7629): 1080.
Pike, K.L., 1967. Etic and emic standpoints for the description of behavior. 2nd rev. ed.,
(pp. 37-72). The Hague, Netherlands: Mouton & Co pp.http://dx.doi.org/10.1037/14786-
002
Plato, and Benjamin Jowett. 1937. The Dialogues of Plato. New York: Random House.
Plato. 2007. The Republic. ePenguin.
Plato. 2009. Protagoras. Oxford ; New York: OUP Oxford.
241
Polanyi, Karl. 1944. The Great Transformation: The Political and Economic Origins of Our Time. Beacon Press.
Poortinga, Wouter, and Nick F. Pidgeon. 2003. “Exploring the Dimensionality of Trust in Risk Regulation.” Risk Analysis 23 (5): 961–972.
Posner, R. 2009. “Should We Jettison GDP As an Economic Measure? Posner.”
Posner, Stephen M., and Robert Costanza. 2011. “A Summary of ISEW and GPI Studies at Multiple Scales and New Estimates for Baltimore City, Baltimore County, and the State of Maryland.” Ecological Economics 70 (11): 1972–1980.
Powdthavee, N. 2010. The Happiness Equation. Duxford: Icon Books.
Praag, B. M. S. van, P. Frijters, and A. Ferrer-i-Carbonell. 2001. “The Anatomy of Subjective Well-Being.” DIW Berlin, German Institute for Economic Research.
Praag, B. Van, and B. E. Baarsma. 2005. “Using Happiness Surveys to Value Intangibles: The Case of Airport Noise*.” The Economic Journal 115 (500): 224–246.
Praag, Bernard M. S. Van Van, and Ada Ferrer-i-Carbonell. 2011. Happiness Economics. Now Publishers Inc.
Preston, S.H., 1975. The changing relation between mortality and level of economic
development. Population studies, 29(2), pp.231-248.
Prince-Gibson, Eetta, and Shalom H. Schwartz. 1998. “Value Priorities and Gender.” Social Psychology Quarterly, 49–67.
Propper, Carol, and Deborah Wilson. 2003. “The Use and Usefulness of Performance Measures in the Public Sector.” Oxford Review of Economic Policy 19 (2): 250–267.
Putnam, Robert D. 2000. “Bowling Alone: America’s Declining Social Capital.” In Culture and Politics, 223–234. Springer. http://link.springer.com/chapter/10.1007/978-1-349-62397-6_12.
Ragin, Charles C. 1991. “Introduction: The Problem of Balancing Discourse on Cases and Variables in Comparative Social Science.” International Journal of Comparative Sociology 32 (1): 1–8.
Ragin, Charles C. 1992. "Introduction: Cases of “What is a case?”." What is a Case: 1-
17.
Ragin, Charles. 1987. “The Comparative Method: Moving beyond Qualitative and Quantitative Methods.” Berkeley: University of California.
Ravallion, Martin. 2011. “Mashup Indices of Development.” The World Bank Research Observer, lkr009.
Rawls, John. 1999. A Theory of Justice Rev. Revised ed. Cambridge, Mass: Harvard University Press.
Rees, G., J. Bradshaw, H. Goswami, and A. Keung. 2010. “Understanding Children’s Well-Being.” Links between Family Economic Factors and Children’s Subjective Well-Being: Initial Findings from Wave 2.
Rehdanz, K., and D. Maddison. 2005. “Climate and Happiness.” Ecological Economics 52 (1): 111–125.
Robbins, L. 1935. An Essay on the Nature and Significance of Economic Science. 2nd ed. London: Macmillan.
Roberts, Andy. 2002. “A Principled Complementarity of Method: In Defence of Methodological Eclecticism and the Qualitative-Quantitative Debate.” The Qualitative Report 7 (3): 1–18.
242
Roberts, Robert EL, Vern L. Bengtson, and T. J. Biblarz. 1999. “The Social Psychology of Values: Effects of Individual Development, Social Change, and Family Transmission over the Life Span.” The Self and Social Processes in Aging, 453–482.
Robinson, E., R. M. Adams, A. F. R. Clearinghouse, and Australian Institute of Family Studies. 2008. Housing Stress and the Mental Health and Wellbeing of Families. Australian Institute of Family Studies.
Roccas, Sonia, Lilach Sagiv, Shalom H. Schwartz, and Ariel Knafo. 2002. “The Big Five Personality Factors and Personal Values.” Personality and Social Psychology Bulletin 28 (6): 789–801.
Rohe, W. M., and V. Basolo. 1997. “Long-Term Effects of Homeownership on the Self-Perceptions and Social Interaction of Low-Income Persons.” Environment and Behavior 29 (6): 793–819.
Rokeach, Milton, and others. 1973. The Nature of Human Values. Vol. 438. Free press New York. https://www.uzh.ch/cmsssl/suz/albert/lehre/wertewandel2011/B01_Rokeach1973.pdf.
Rønsen, Marit, and Marianne Sundström. 1996. “Maternal Employment in Scandinavia: A Comparison of the after-Birth Employment Activity of Norwegian and Swedish Women.” Journal of Population Economics 9 (3): 267–285.
Rothstein, Bo, and Daniel Eek. 2009. “Political Corruption and Social Trust An Experimental Approach.” Rationality and Society 21 (1): 81–112. doi:10.1177/1043463108099349.
Røysamb, Espen, Jennifer R. Harris, Per Magnus, Joar Vittersø, and Kristian Tambs. 2002. “Subjective Well-Being. Sex-Specific Effects of Genetic and Environmental Factors.” Personality and Individual Differences 32 (2): 211–223.
Ruhm, Christopher J. 2000. “Are Recessions Good for Your Health?” The Quarterly Journal of Economics 115 (2): 617–50. doi:10.1162/003355300554872.
Russell, Helen, Philip J. O’Connell, and Frances McGinnity. 2009. “The Impact of Flexible Working Arrangements on Work–life Conflict and Work Pressure in Ireland.” Gender, Work & Organization 16 (1): 73–97.
Ryan, Louise, and Anne Golden. 2006. “‘Tick the Box Please’: A Reflexive Approach to Doing Quantitative Social Research.” Sociology 40 (6): 1191–1200.
Ryan, Richard M., and Edward L. Deci. 2000. “Self-Determination Theory and the Facilitation of Intrinsic Motivation, Social Development, and Well-Being.” American Psychologist 55 (1): 68.
Sacks, D. W., B. Stevenson, and J. Wolfers. 2010. “Subjective Well-Being, Income, Economic Development and Growth.”
Sacks, Daniel W., Betsey Stevenson, and Justin Wolfers. 2012. “The New Stylized Facts about Income and Subjective Well-Being.” Emotion 12 (6): 1181.
Samuelson, Paul A. 1961. “The Evaluation of ‘Social Income’: Capital Formation and Wealth.” In The Theory of Capital, 32–57. Springer. http://link.springer.com/chapter/10.1007/978-1-349-08452-4_3.
Sandel, Michael J. 2012. What Money Can’t Buy: The Moral Limits of Markets. Macmillan.
Sargisson, Lucy. 2012. Fool’s Gold?: Utopianism in the Twenty-First Century. Palgrave Macmillan. https://books.google.co.uk/books?hl=en&lr=&id=H9s_JX1GX3YC&oi=fnd&pg=PP2&dq=sargisson+2012&ots=jJ4VY3nTF_&sig=fU0o4ZOUXJ1z2BameVZefKa01_4.
243
Saroglou, Vassilis, Vanessa Delpierre, and Rebecca Dernelle. 2004. “Values and Religiosity: A Meta-Analysis of Studies Using Schwartz’s Model.” Personality and Individual Differences 37 (4): 721–734.
Schelling, T. C. 1995. “Intergenerational Discounting.” Energy Policy 23 (4): 395–401.
Schimmack, U., P. Radhakrishnan, S. Oishi, and S. Ahadi. 2002. “Culture, Personality, and Subjective Well-Being: Integrating Process Models of Life Satisfaction.” Journal of Personality and Social Psychology 82 (4): 582–93.
Schoon, I., L. Hansson, and K. Salmela-Aro. 2005. “Combining Work and Family Life: Life Satisfaction among Married and Divorced Men and Women in Estonia, Finland, and the UK.” European Psychologist 10 (4): 309.
Schroeder, Mark. 2013. “‘Value Theory’, URL = <http://plato.stanford.edu/archives/sum2012/entries/value-Theory/>.” The Stanford Encyclopedia of Philosophy, no. Summer 2012.
Schuman, Howard. 1995. “Attitudes, Beliefs, and Behavior.” Sociological Perspectives on Social Psychology 72.
Schwartz, Eduardo S. 1997. “The Stochastic Behavior of Commodity Prices: Implications for Valuation and Hedging.” The Journal of Finance 52 (3): 923–973.
Schwartz, Shalom H. 1992. “Universals in the Content and Structure of Values: Theoretical Advances and Empirical Tests in 20 Countries.” Advances in Experimental Social Psychology 25: 1–65.
Schwartz, Shalom H., and Tammy Rubel. 2005. “Sex Differences in Value Priorities: Cross-Cultural and Multimethod Studies.” Journal of Personality and Social Psychology 89 (6): 1010.
Schwartz, Shalom H., and Wolfgang Bilsky. 1990. “Toward a Theory of the Universal Content and Structure of Values: Extensions and Cross-Cultural Replications.” Journal of Personality and Social Psychology 58 (5): 878.
Schwarze, J., and M. Härpfer. 2004. “Are People Inequality Averse, and Do They Prefer Redistribution by the State? A Revised Version.”
Scitovsky, Tibor. 1976. “The Joyless Economy: An Inquiry into Human Satisfaction and Consumer Dissatisfaction.” http://psycnet.apa.org/psycinfo/1977-04600-000.
Seai.ie. (2016). SEAI - Ocean Energy Explained. [online] Available at: http://www.seai.ie/Renewables/Ocean_Energy/Ocean_Energy_Information_Research/Irelands_Wave_and_Tidal_Energy_Resources/ [Accessed 9 Nov. 2016].
Seaman, L. (2015). Researchers reveal higher than expected costs of climate change. [online] Available at: http://emiguel.econ.berkeley.edu/assets/miguel_media/638/R_D_Magazine_Researchers____calculations_reveal_higher-than-expected_global_economic_cost_of_climate_change.pdf [Accessed 13 Jan. 2017].
Seligman, Clive, and Albert N. Katz. 1996. “The Dynamics of Value Systems.” In The Psychology of Values: The Ontario Symposium, 8:53–75. Lawrence Erlbaum Associates, Inc. Hillsdale, NJ. https://books.google.co.uk/books?hl=en&lr=&id=DACsdMk7qqoC&oi=fnd&pg=PA53&dq=Seligman+and+katz+1996&ots=u2uywsKsu7&sig=6sUbq2bTpVRLS5mx1KoTqbMNPTo.
Seligman, Martin EP, and Mihaly Csikszentmihalyi. 2000. “Special Issue on Happiness, Excellence, and Optimal Human Functioning.” American Psychologist 55 (1): 5–183.
244
Sen, A. 1991. Poverty and Famines. An Essay on Entitlement and Deprivation. Oxford: Clarendon Press. Oxford: Clarendon Press.
Sen, A. K. 1979. “Interpersonal Comparisons of Welfare.” Economics and Human Welfare: Essays in Honor of Tibor Scitovsky. Academic Press, New York.
Sen, Amartya. 1976. “Real National Income.” The Review of Economic Studies 43 (1): 19–39.
Sen, Amartya. 1999. “The Possibility of Social Choice.” The American Economic Review 89 (3): 349–378.
Sen. Amartya 2001. Development as Freedom. Oxford Paperbacks. https://books.google.co.uk/books?hl=en&lr=&id=Qm8HtpFHYecC&oi=fnd&pg=PR9&dq=devleopment+as+freedom&ots=81emH6a3D1&sig=5_OQ-5qpgiAfka1ypW86TcShSik.
Senik, C. 2005. “Income Distribution and Well-Being: What Can We Learn from Subjective Data?” Journal of Economic Surveys 19 (1): 43–63.
Sharry, Ray Mac, Padraic A. White, and Joseph J. O’Malley. 2000. The Making of the Celtic Tiger: The inside Story of Ireland’s Boom Economy. Mercier Press.
Shields, Christopher, "Aristotle", The Stanford Encyclopedia of Philosophy (Winter 2016 Edition), Edward N. Zalta (ed.), URL = <https://plato.stanford.edu/archives/win2016/entries/aristotle/>.
Shields, M. A., and S. W. Price. 2005. “Exploring the Economic and Social Determinants of Psychological Well-Being and Perceived Social Support in England.” Journal of the Royal Statistical Society: Series A (Statistics in Society) 168 (3): 513–537.
Shields, Todd, and Ka Zeng. 2012. “The Reverse Environmental Gender Gap in China: Evidence from ‘the China Survey.’” Social Science Quarterly 93 (1): 1–20.
Shipan, Charles R., and Craig Volden. 2008. "The mechanisms of policy
diffusion." American journal of political science 52, no. 4: 840-857.
Sidgwick, Henry. 1981. The Methods of Ethics. Hackett Publishing.
Silver, R. L. 1982. “Coping with an Undesirable Life Event: A Study of Early Reactions to Physical Disability.” Evanston, Illinois.
Simmons, Walter O., and Rosemarie Emanuele. 2007. “Male-Female Giving Differentials: Are Women More Altruistic?” Journal of Economic Studies 34 (6): 534–550.
Simon, Herbert A. 1972. “Theories of Bounded Rationality.” Decision and Organization 1 (1): 161–176.
Skapinakis, P., S. Weich, G. Lewis, N. Singleton, and R. Araya. 2006. “Socio-Economic Position and Common Mental Disorders.” The British Journal of Psychiatry 189 (2): 109–117.
SLÁN 2007: Survey of Lifestyle, Attitudes and Nutrition in Ireland. Mental Health and Social Well-being Report, Department of Health and Children. Dublin: The Stationery Office
Smeeding, Timothy, and Brian Nolan. 2004. “Ireland’s Income Distribution in Comparative Perspective.” Available at SSRN 646024.
Smith, Adam. 1776. “An Inquiry into the Nature and Causes of the Wealth of Nations: Volume One.”
Smith, Nicola Jo-Anne. 2004. “Deconstructing’globalisation’in Ireland.” Policy & Politics
Smyth, J. (2011). Fewer than one in five attend Sunday Mass in Dublin. [online] The Irish Times. Available at:
245
http://www.irishtimes.com/premium/loginpage?destination=http://www.irishtimes.com/news/fewer-than-one-in-five-attend-sunday-mass-in-dublin-1.585731 [Accessed 10 Jan. 2017].
Snyder, C R, and Erik Wright. 2001. Handbook of Positive Psychology. Oxford University Press.
So, Alvin Y., and Stephen WK Chiu. 1996. “Modern East Asia in World-Systems Analysis*.” Sociological Inquiry 66 (4): 471–485.
Solomon, Lawrence S., Donald Tomaskovic-Devey, and Barbara J. Risman. 1989. “The Gender Gap and Nuclear Power: Attitudes in a Politicized Environment.” Sex Roles 21 (5–6): 401–414.
Solow, R. 1993. “Assigning Economic Value to Natural Resources.” In Proceedings of the Workshop on Valuing Natural Capital for Sustainable Development, Woods Hole, MA, 1994:19–30.
Solow, R. M. 1974. “Intergenerational Equity and Exhaustible Resources.” The Review of Economic Studies 41: 29–45.
Solow, Robert M. 1974. “The Economics of Resources or the Resources of Economics.” In Classic Papers in Natural Resource Economics, 257–276. Springer. http://link.springer.com/chapter/10.1057/9780230523210_13.
Sørensen, Morten. 2007. “How Smart Is Smart Money? A Two-Sided Matching Model of Venture Capital.” The Journal of Finance 62 (6): 2725–2762.
Spratt, Stephen, and Justin Baker. 2015 Big Data and International Development:
Impacts, Scenarios and Policy Options. No. IDS Evidence Report; 163. IDS.
Staats, H., and T. Hartig. 2004. “Alone or with a Friend: A Social Context for Psychological Restoration and Environmental Preferences.” Journal of Environmental Psychology 24 (2): 199–211.
Stack, Steven, and J. Ross Eshleman. 1998. “Marital Status and Happiness: A 17-Nation Study.” Journal of Marriage and the Family, 527–536.
Stark, R., and J. Maier. 2008. “Faith and Happiness.” Review of Religious Research 50 (1): 120–25.
Stark, Rodney. 2002. “Physiology and Faith: Addressing the ‘universal’ Gender Difference in Religious Commitment.” Journal for the Scientific Study of Religion 41 (3): 495–507.
Statham, J., and E. Chase. 2010. “Childhood Wellbeing: A Brief Overview.” Loughborough: Childhood Wellbeing Research Centre.
Steptoe, A., J. Wardle, and M. Marmot. 2005. “Positive Affect and Health-Related Neuroendocrine, Cardiovascular, and Inflammatory Processes.” Proceedings of the National Academy of Sciences of the United States of America 102 (18): 6508.
Stern, Nicholas H., Siobhan Peters, Vicki Bakhshi, Alex Bowen, Catherine Cameron, Sebastian Catovsky, Di Crane, et al. 2006. Stern Review: The Economics of Climate Change. Vol. 30. Cambridge University Press Cambridge.
Stern, Paul C., Thomas Dietz, and Linda Kalof. 1993. “Value Orientations, Gender, and Environmental Concern.” Environment and Behavior 25 (5): 322–348.
Sterner, Thomas, and U. Martin Persson. 2008. “An Even Sterner Review: Introducing Relative Prices into the Discounting Debate.” Review of Environmental Economics and Policy 2 (1): 61–76. doi:10.1093/reep/rem024.
246
Stevenson, Betsey, and Justin Wolfers. 2008. “Economic Growth and Subjective Well-Being: Reassessing the Easterlin Paradox.” National Bureau of Economic Research Working Paper Series No. 14282.
Stiglitz, J. E., A. Sen, and J. P. Fitoussi. 2009. “Report by the Commission on the Measurement of Economic Performance and Social Progress.”
Stoll, L., J. Michaelson, and C. Seaford. 2012. “Well-Being Evidence for Policy: A Review.” London.
Struch, Naomi, Shalom H. Schwartz, and Willem A. Van Der Kloot. 2002. “Meanings of Basic Values for Women and Men: A Cross-Cultural Analysis.” Personality and Social Psychology Bulletin 28 (1): 16–28.
Stutzer, A., and B. S. Frey. 2008. “Stress That Doesn’t Pay: The Commuting Paradox.” Scandinavian Journal of Economics 110 (2): 339–66.
Stutzer, A., and B.S. Frey. 2006. “Does Marriage Make People Happy, or Do Happy People Get Married?” Journal of Socio-Economics 35 (2): 326–347.
Stutzer, Alois. 2004. “The Role of Income Aspirations in Individual Happiness.” Journal of Economic Behavior & Organization 54 (1): 89–109. doi:10.1016/j.jebo.2003.04.003.
Sumner, Leonard W. 1996. Welfare, Happiness, and Ethics. Oxford University Press.
Susen, Simon. 2015. The’Postmodern Turn’in the Social Sciences. Springer. https://books.google.co.uk/books?hl=en&lr=&id=hL6hCgAAQBAJ&oi=fnd&pg=PP9&dq=susen+2015+postmodern&ots=mSR5W5J8tc&sig=hmccgBHy-oVqnq6fvZceVZxhpD8.
Suslow, T., C. Roestel, and P. Ohrmannand Volker. 2003. “The Experience of Basic Emotions in Schizophrenia with and without Affective Negative Symptoms.” Comprehensive Psychiatry 44 (4): 303–310.
Swamy, A., Lee, Y., Azfar, O. and Knack, S. (n.d.). Gender and Corruption. SSRN Electronic Journal.
Sweeney, John, Tony Brereton, Clare Byrne, Rosemary Charlton, Chris Emblow, Rowan Fealy, Nicholas Holden, et al. 2003. “Climate Change: Scenarios & Impacts for Ireland (2000-LS-5.2.1-M1) ISBN:1-84095-115-X.” http://eprints.maynoothuniversity.ie/2684/.
Tabachnick, Barbara G., Linda S. Fidell, and Steven J. Osterlind. 2001. “Using Multivariate Statistics.” https://www.ulb.tu-darmstadt.de/tocs/135813948.pdf.
Tabata, Shinichiro. 2009. “The Influence of High Oil Prices on the Russian Economy: A Comparison with Saudi Arabia.” Eurasian Geography and Economics 50 (1): 75–92. doi:10.2747/1539-7216.50.1.75.
Talberth, John. 2008. “A New Bottom Line for Progress.” State of the World, 18–31.
Tansey, Paul. 1998. Ireland at Work: Economic Growth and the Labour Market, 1987-1997. Oak Tree Press Dublin.
Taylor, Charles. 1995. “Irreducibly Social Goods.” Philosophical Arguments, 127–145.
Taylor, M. P., D. J. Pevalin, J. Todd, University of Essex Institute for Social, and Economic Research. 2007. “The Psychological Costs of Unsustainable Housing Commitments.” Psychological Medicine 37 (7): 1027–1036.
Tella, R. Di, and R. MacCulloch. 2008. “Gross National Happiness as an Answer to the Easterlin Paradox?” Journal of Development Economics 86 (1): 22–42.
Tella, R. Di, R. J. MacCulloch, and A. J. Oswald. 2003. “The Macroeconomics of Happiness.” Review of Economics and Statistics 85 (4): 809–27.
247
Tella, R. Di, R. MacCulloch, and A. J. Oswald. 2001. “Preferences over Inflation and Unemployment: Evidence from Surveys of Happiness.” American Economic Review 91 (1): 335–41.
The Economist. (2016). Dawn in the west. [online] Available at: http://www.economist.com/news/leaders/21569034-why-irish-deserve-helping-hand-leave-their-bail-out-programme-dawn-west [Accessed 30 Dec. 2016].
Theodossiou, I. 1998. “The Effects of Low-Pay and Unemployment on Psychological Well-Being: A Logistic Regression Approach.” Journal of Health Economics 17 (1): 85–104.
Thiry, Géraldine, Isabelle Cassiers, and others. 2010. “Alternative Indicators to GDP: Values behind Numbers Adjusted Net Savings in Question.” UCL. http://dial.uclouvain.be/handle/boreal:36183.
Thoits, P. A., and L. N. Hewitt. 2001. “Volunteer Work and Well-Being.” Journal of Health and Social Behavior 42 (2): 115–31.
Thomson, H., M. Petticrew, and D. Morrison. 2002. “Housing Improvement and Health Gain: A Summary and Systematic Review.” Glasgow: Medical Research Council.
Thorhallsson and Kirby 2011, p.5/6) https://ams.hi.is/wp-content/uploads/old/Iceland-Ireland-Report%20final%20version_Kirby_Baldur_0.pdf
Tiberius, Valerie. 2004. “Cultural Differences and Philosophical Accounts of Well-Being.” Journal of Happiness Studies 5 (3): 293–314. doi:10.1007/s10902-004-8791-y.
Timmons, Mark. 2013. Disputed Moral Issues: A Reader. Third Edit. New York: OUP USA.
Tinbergen, Jan, and Roefie Hueting. 1992. “GNP and Market Prices: Wrong Signals for Sustainable Economic Success That Mask Environmental Destruction.” http://www.popline.org/node/324067.
Tol, R. S. J., and G. W. Yohe. 2007. “A Stern Reply to the Reply to the Review of the Stern Review.” WORLD ECONOMICS-HENLEY ON THAMES- 8 (2): 153.
Tonry, M., 2014. Why crime rates are falling throughout the Western world. Crime and Justice, 43(1), pp.1-63.
Turner, Graham M. 2008. “A Comparison of The Limits to Growth with 30 Years of Reality.” Global Environmental Change 18 (3): 397–411.
Twitchell, James B. 2000. Lead Us into Temptation: The Triumph of American Materialism. New Ed edi. New York: Columbia University Press.
Uchida, Y., Norasakkunkit, V. and Kitayama, S., 2004. Cultural constructions of
happiness: theory and emprical evidence. Journal of happiness studies, 5(3), pp.223-
239.
Van den Bergh, Jeroen, Miklós Antal, and others. 2014. “Evaluating Alternatives to GDP as Measures of Social Welfare/progress.” Work. Pap 56. http://www.foreurope.eu/fileadmin/documents/pdf/Workingpapers/WWWforEurope_WPS_no056_MS211.pdf.
Vanderleeuw, James M., Maria E. Sandovici, and Christopher A. Jarmon. 2011. “Women City Leaders and Postmaterialist Values: Gender Differences in Economic Development Priorities.” Journal of Women, Politics & Policy 32 (3): 211–236.
Veenhoven, R. 2000. “The Four Qualities of Life.” Journal of Happiness Studies 1 (1): 1–39.
248
Veenhoven, R., 2000. Freedom and happiness: A comparative study in forty-four
nations in the early 1990s. Culture and subjective well-being, pp.257-288
Veenhoven, R. 2012. “Average Happiness in 149 Nations 2000-2009.” World Database on Happiness. The Netherlands: Erasmus University Rotterdam. http://www1.eur.nl/fsw/happiness/hap_nat/nat_fp.php?mode=6&ranks=1.
Veenhoven, R. 1993. “Happiness in Nations.” Subjective Appreciation of Life in 56: 1946–1992.
Veenhoven, R. 1996. “Happy Life-Expectancy.” Social Indicators Research 39 (1): 1–58.
Veenstra, Gerry. 2002. “Social Capital and Health (plus Wealth, Income Inequality and Regional Health Governance).” Social Science & Medicine 54 (6): 849–868.
Vellinga, Nico, and Cees Withagen. 1996. “On the Concept of Green National Income.” Oxford Economic Papers 48 (4): 499–514.
Vemuri, A. W., and R. Costanza. 2006. “The Role of Human, Social, Built, and Natural Capital in Explaining Life Satisfaction at the Country Level: Toward a National Well-Being Index (NWI).” Ecological Economics 58 (1): 119–133.
Vera-Toscano, E., and V. Ateca-Amestoy. 2008. “The Relevance of Social Interactions on Housing Satisfaction.” Social Indicators Research 86 (2): 257–274.
Verenigde Naties, UNDP. 2007. Human Development Report 2007: Fighting Climate
Change: Human Solidarity in a Divided World. Palgrave.
Victor, Peter. 2010. “Questioning Economic Growth.” Nature 468 (7322): 370–371.
Vliet, B. V., Heather Chappels, and Elizabeth Shove. 2005. Infrastructures of
Consumption. Earthscan.
VOA (2013). WHO: Immunizations Save 2-3 Million Lives Each Year [online] Available
at: http://www.voanews.com/a/immunizations-save-2-3-million-lives-each-year-says-
who/1643924.html [Accessed 30 Jan. 2017].
Voitchovsky, S., B. Maitre, and B. Nolan. 2012. “Wage Inequality in Ireland’s ‘Celtic
Tiger’ Boom.” The Economic and Social Review 43 (1): 99–133.
Wade, Robert. 1990. Governing the Market: Economic Theory and the Role of
Government in East Asian Industrialization. Princeton University Press.
Wagner, P. ed., 2003. The prison index: Taking the pulse of the crime control industry. Prison Policy Initiative.
Waldfogel, Jane. 1998. "Understanding the" family gap" in pay for women with children." The Journal of Economic Perspectives 12, no. 1: 137-156.
Walsh, Brendan, Dermot Walsh, and others. 2011. “Suicide in Ireland: The Influence of Alcohol and Unemployment.” The Economic and Social Review 42 (1): 27–47.
Walsh, Edel. 2012. “An Examination of the Factors Affecting Subjective Well-Being in Ireland,” UCC,
Waring, Marilyn, 1988. If Women Counted: A New Feminist Economics. Harper & Row San Francisco. http://www.roiw.org/1992/237.pdf.
Waterman, Alan S. 1993. “Two Conceptions of Happiness: Contrasts of Personal Expressiveness (Eudaimonia) and Hedonic Enjoyment.” Journal of Personality and Social Psychology 64 (4): 678.
249
Weich, S., M. Blanchard, M. Prince, E. Burton, B. O. B. Erens, and K. Sproston. 2002. “Mental Health and the Built Environment: Cross-Sectional Survey of Individual and Contextual Risk Factors for Depression.” The British Journal of Psychiatry 180 (5): 428–433.
Weinzierl, M. 2005. “Estimating a Relative Utility Function.” Harvard University.
Weitzman, Martin L. 1976. “On the Welfare Significance of National Product in a Dynamic Economy.” The Quarterly Journal of Economics, 156–162.
Weitzman, Martin L. 1997. “Sustainability and Technical Progress.” The Scandinavian Journal of Economics 99 (1): 1–13.
Weitzman, Martin L. 2007. “A Review of the Stern Review on the Economics of Climate Change.” Journal of Economic Literature 45 (3): 703–24. doi:10.1257/jel.45.3.703.
Weitzman, Martin L., and Karl-Gustaf Löfgren. 1997. “On the Welfare Significance of Green Accounting as Taught by Parable.” Journal of Environmental Economics and Management 32 (2): 139–153.
Welsch, H. 2006. “Environment and Happiness: Valuation of Air Pollution Using Life Satisfaction Data.” Ecological Economics 58 (4): 801–813.
Whelan, K. 2009. “Policy Lessons from Ireland’s Latest Depression.” The Economic and Social Review 41: 225–54.
Wiggins, R. D., P. F. D. Higgs, M. Hyde, and D. B. Blane. 2004. “Quality of Life in the Third Age: Key Predictors of the CASP-19 Measure.” Ageing and Society 24 (5): 693–708.
Wildman, J., and A. Jones. 2002. “Is It Absolute Income or Relative Deprivation That Leads to Poor Psychological Well Being? A Test Based on Individual Level Longitudinal Data. YSHE, University of York.”
Wilkinson Richard, G. 1996. Unhealthy Societies: The Afflictions of Inequality. London: Routledge.
Wilkinson, Richard, and Kate Pickett. 2010. The Spirit Level: Why Equality Is Better for Everyone. Penguin.
Winkelmann, L., and R. Winkelmann. 2010. “Does Inequality Harm the Middle Class?” Kyklos 63 (2): 301–316.
Winkelmann, Liliana, and Rainer Winkelmann. 1998. “Why Are the Unemployed So Unhappy? Evidence from Panel Data.” Economica 65 (257): 1–15.
Winkelmann, R. 2004. “Health Care Reform and the Number of Doctor Visits—an Econometric Analysis.” Journal of Applied Econometrics 19 (4): 455–472.
Wolbring, T., M. Keuschnigg, and E. Negele. 2011. “Needs, Comparisons, and Adaptation: The Importance of Relative Income for Life Satisfaction.” European Sociological Review.
Wolfers, Justin. 2003. “Is Business Cycle Volatility Costly? Evidence from Surveys of Subjective Wellbeing.” National Bureau of Economic Research Working Paper Series No. 9619.
Woolcock, Michael. 2001. “The Place of Social Capital in Understanding Social and Economic Outcomes.” Canadian Journal of Policy Research 2 (1): 11–17.
World Bank. 2012. “World Development Indicators.” http://databank.worldbank.org/ddp/home.do?Step=3&id=4.
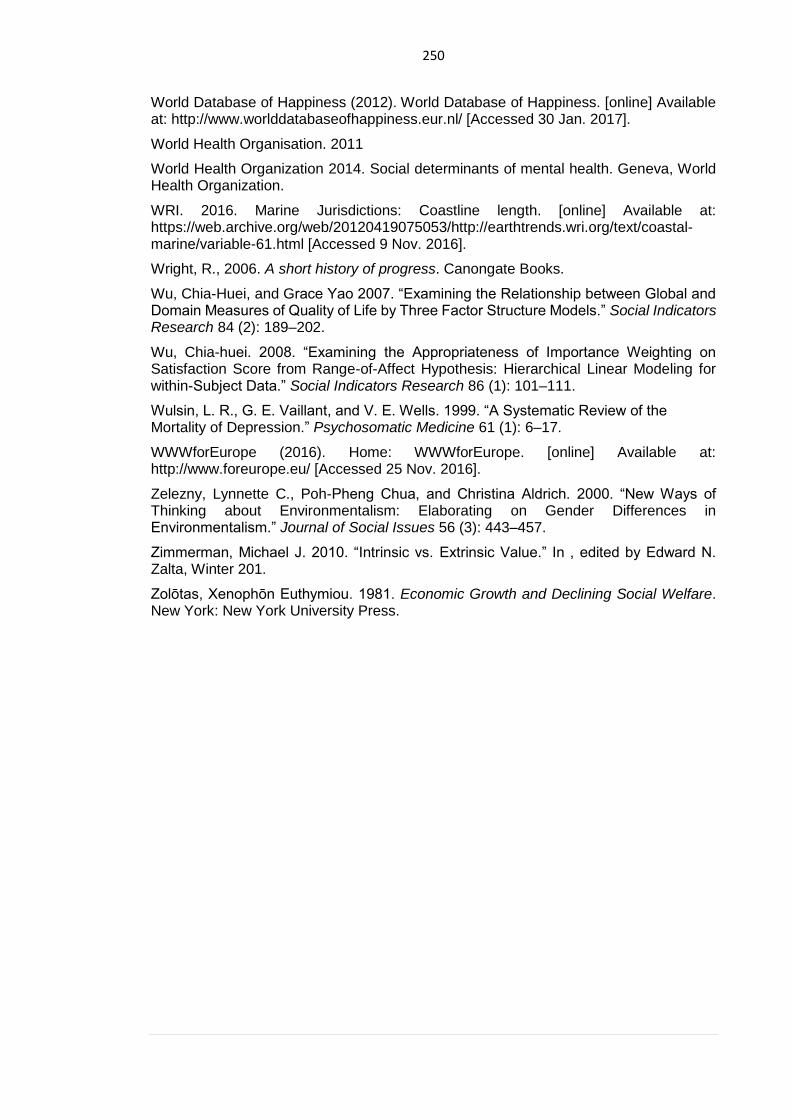
250
World Database of Happiness (2012). World Database of Happiness. [online] Available at: http://www.worlddatabaseofhappiness.eur.nl/ [Accessed 30 Jan. 2017].
World Health Organisation. 2011
World Health Organization 2014. Social determinants of mental health. Geneva, World Health Organization.
WRI. 2016. Marine Jurisdictions: Coastline length. [online] Available at: https://web.archive.org/web/20120419075053/http://earthtrends.wri.org/text/coastal-marine/variable-61.html [Accessed 9 Nov. 2016].
Wright, R., 2006. A short history of progress. Canongate Books.
Wu, Chia-Huei, and Grace Yao 2007. “Examining the Relationship between Global and Domain Measures of Quality of Life by Three Factor Structure Models.” Social Indicators Research 84 (2): 189–202.
Wu, Chia-huei. 2008. “Examining the Appropriateness of Importance Weighting on Satisfaction Score from Range-of-Affect Hypothesis: Hierarchical Linear Modeling for within-Subject Data.” Social Indicators Research 86 (1): 101–111.
Wulsin, L. R., G. E. Vaillant, and V. E. Wells. 1999. “A Systematic Review of the Mortality of Depression.” Psychosomatic Medicine 61 (1): 6–17.
WWWforEurope (2016). Home: WWWforEurope. [online] Available at: http://www.foreurope.eu/ [Accessed 25 Nov. 2016].
Zelezny, Lynnette C., Poh-Pheng Chua, and Christina Aldrich. 2000. “New Ways of Thinking about Environmentalism: Elaborating on Gender Differences in Environmentalism.” Journal of Social Issues 56 (3): 443–457.
Zimmerman, Michael J. 2010. “Intrinsic vs. Extrinsic Value.” In , edited by Edward N. Zalta, Winter 201.
Zolōtas, Xenophōn Euthymiou. 1981. Economic Growth and Declining Social Welfare. New York: New York University Press.
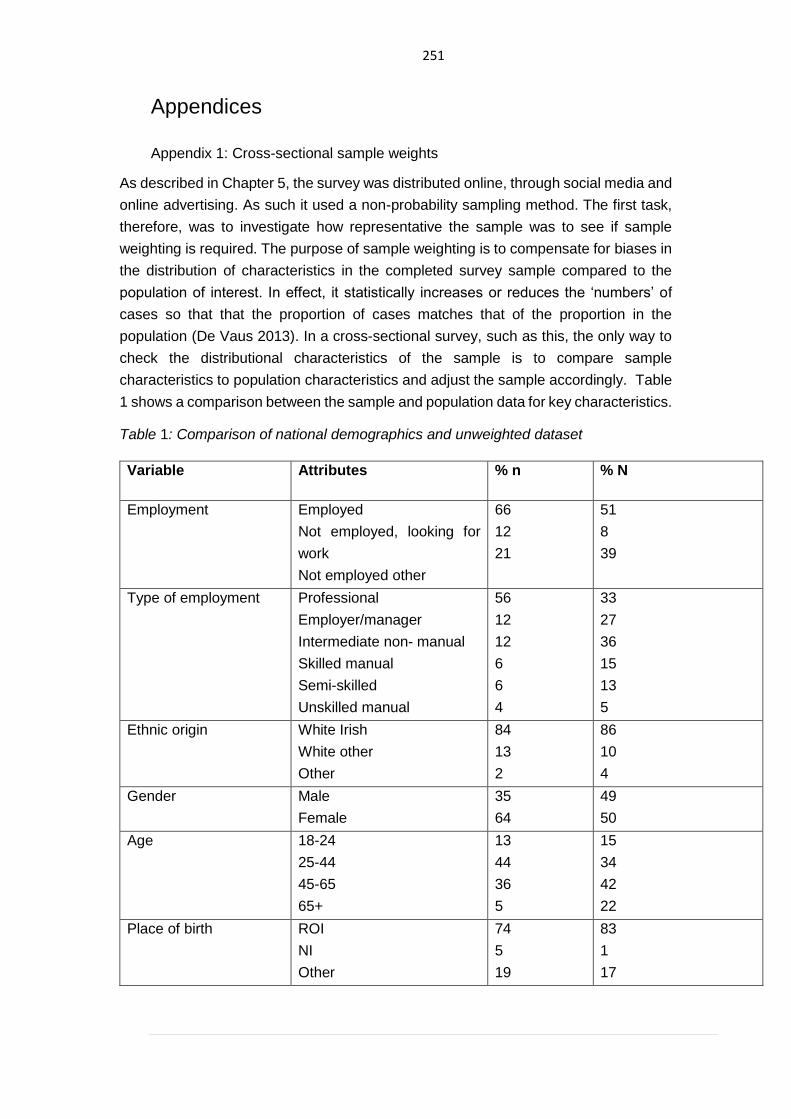
251
Appendices
Appendix 1: Cross-sectional sample weights
As described in Chapter 5, the survey was distributed online, through social media and
online advertising. As such it used a non-probability sampling method. The first task,
therefore, was to investigate how representative the sample was to see if sample
weighting is required. The purpose of sample weighting is to compensate for biases in
the distribution of characteristics in the completed survey sample compared to the
population of interest. In effect, it statistically increases or reduces the ‘numbers’ of
cases so that that the proportion of cases matches that of the proportion in the
population (De Vaus 2013). In a cross-sectional survey, such as this, the only way to
check the distributional characteristics of the sample is to compare sample
characteristics to population characteristics and adjust the sample accordingly. Table
1 shows a comparison between the sample and population data for key characteristics.
Table 1: Comparison of national demographics and unweighted dataset
Variable Attributes % n % N
Employment Employed
Not employed, looking for
work
Not employed other
66
12
21
51
8
39
Type of employment Professional
Employer/manager
Intermediate non- manual
Skilled manual
Semi-skilled
Unskilled manual
56
12
12
6
6
4
33
27
36
15
13
5
Ethnic origin White Irish
White other
Other
84
13
2
86
10
4
Gender Male
Female
35
64
49
50
Age 18-24
25-44
45-65
65+
13
44
36
5
15
34
42
22
Place of birth ROI
NI
Other
74
5
19
83
1
17
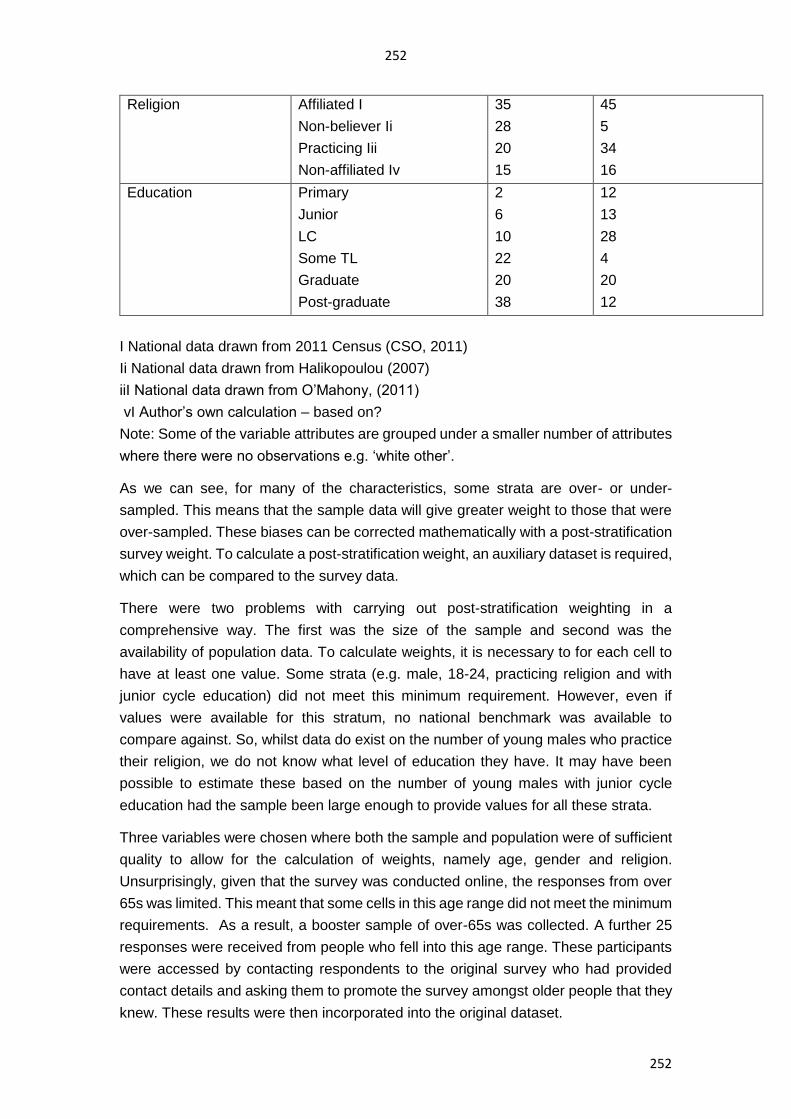
252
252
Religion Affiliated I
Non-believer Ii
Practicing Iii
Non-affiliated Iv
35
28
20
15
45
5
34
16
Education Primary
Junior
LC
Some TL
Graduate
Post-graduate
2
6
10
22
20
38
12
13
28
4
20
12
I National data drawn from 2011 Census (CSO, 2011)
Ii National data drawn from Halikopoulou (2007)
iiI National data drawn from O’Mahony, (2011)
vI Author’s own calculation – based on?
Note: Some of the variable attributes are grouped under a smaller number of attributes
where there were no observations e.g. ‘white other’.
As we can see, for many of the characteristics, some strata are over- or under-
sampled. This means that the sample data will give greater weight to those that were
over-sampled. These biases can be corrected mathematically with a post-stratification
survey weight. To calculate a post-stratification weight, an auxiliary dataset is required,
which can be compared to the survey data.
There were two problems with carrying out post-stratification weighting in a
comprehensive way. The first was the size of the sample and second was the
availability of population data. To calculate weights, it is necessary to for each cell to
have at least one value. Some strata (e.g. male, 18-24, practicing religion and with
junior cycle education) did not meet this minimum requirement. However, even if
values were available for this stratum, no national benchmark was available to
compare against. So, whilst data do exist on the number of young males who practice
their religion, we do not know what level of education they have. It may have been
possible to estimate these based on the number of young males with junior cycle
education had the sample been large enough to provide values for all these strata.
Three variables were chosen where both the sample and population were of sufficient
quality to allow for the calculation of weights, namely age, gender and religion.
Unsurprisingly, given that the survey was conducted online, the responses from over
65s was limited. This meant that some cells in this age range did not meet the minimum
requirements. As a result, a booster sample of over-65s was collected. A further 25
responses were received from people who fell into this age range. These participants
were accessed by contacting respondents to the original survey who had provided
contact details and asking them to promote the survey amongst older people that they
knew. These results were then incorporated into the original dataset.
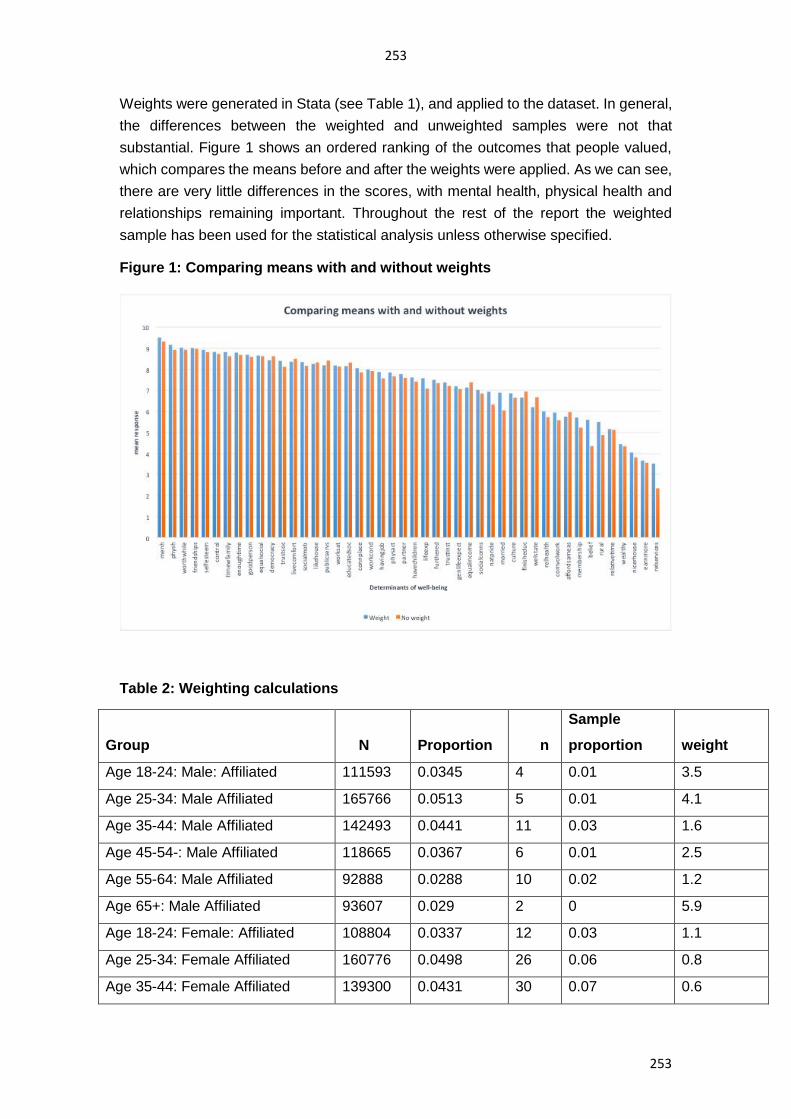
253
253
Weights were generated in Stata (see Table 1), and applied to the dataset. In general,
the differences between the weighted and unweighted samples were not that
substantial. Figure 1 shows an ordered ranking of the outcomes that people valued,
which compares the means before and after the weights were applied. As we can see,
there are very little differences in the scores, with mental health, physical health and
relationships remaining important. Throughout the rest of the report the weighted
sample has been used for the statistical analysis unless otherwise specified.
Figure 1: Comparing means with and without weights
Table 2: Weighting calculations
Group N Proportion n
Sample
proportion weight
Age 18-24: Male: Affiliated 111593 0.0345 4 0.01 3.5
Age 25-34: Male Affiliated 165766 0.0513 5 0.01 4.1
Age 35-44: Male Affiliated 142493 0.0441 11 0.03 1.6
Age 45-54-: Male Affiliated 118665 0.0367 6 0.01 2.5
Age 55-64: Male Affiliated 92888 0.0288 10 0.02 1.2
Age 65+: Male Affiliated 93607 0.029 2 0 5.9
Age 18-24: Female: Affiliated 108804 0.0337 12 0.03 1.1
Age 25-34: Female Affiliated 160776 0.0498 26 0.06 0.8
Age 35-44: Female Affiliated 139300 0.0431 30 0.07 0.6
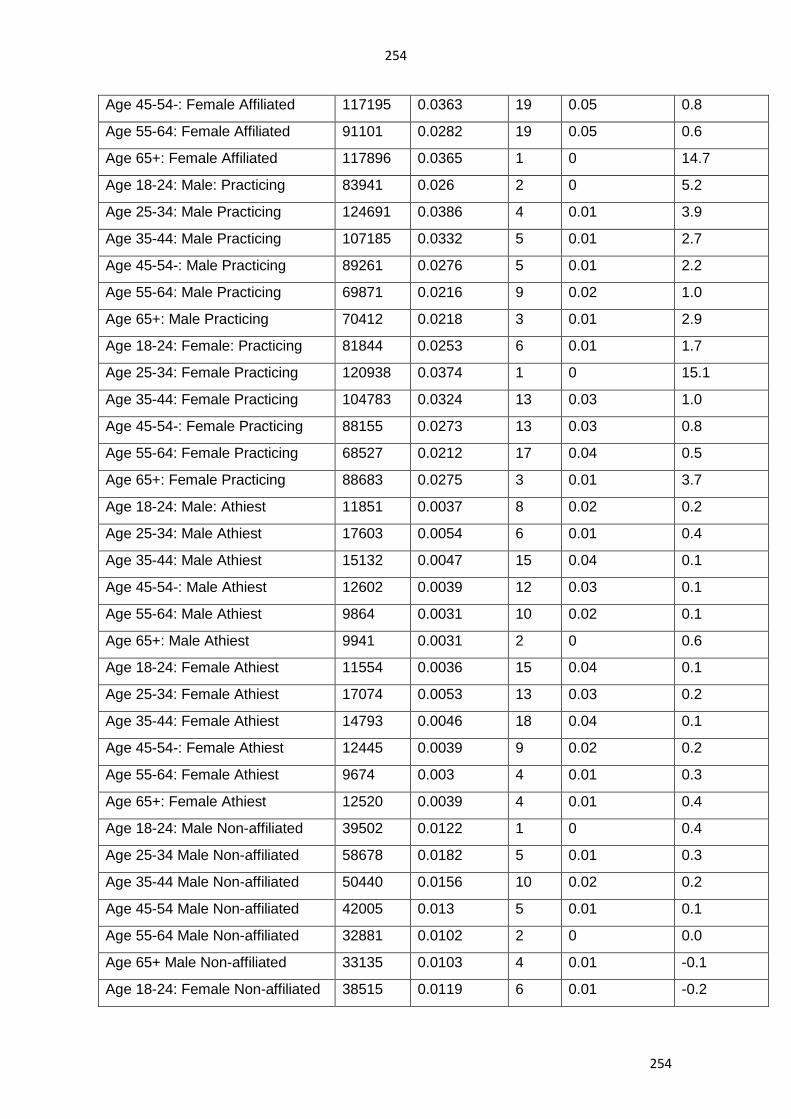
254
254
Age 45-54-: Female Affiliated 117195 0.0363 19 0.05 0.8
Age 55-64: Female Affiliated 91101 0.0282 19 0.05 0.6
Age 65+: Female Affiliated 117896 0.0365 1 0 14.7
Age 18-24: Male: Practicing 83941 0.026 2 0 5.2
Age 25-34: Male Practicing 124691 0.0386 4 0.01 3.9
Age 35-44: Male Practicing 107185 0.0332 5 0.01 2.7
Age 45-54-: Male Practicing 89261 0.0276 5 0.01 2.2
Age 55-64: Male Practicing 69871 0.0216 9 0.02 1.0
Age 65+: Male Practicing 70412 0.0218 3 0.01 2.9
Age 18-24: Female: Practicing 81844 0.0253 6 0.01 1.7
Age 25-34: Female Practicing 120938 0.0374 1 0 15.1
Age 35-44: Female Practicing 104783 0.0324 13 0.03 1.0
Age 45-54-: Female Practicing 88155 0.0273 13 0.03 0.8
Age 55-64: Female Practicing 68527 0.0212 17 0.04 0.5
Age 65+: Female Practicing 88683 0.0275 3 0.01 3.7
Age 18-24: Male: Athiest 11851 0.0037 8 0.02 0.2
Age 25-34: Male Athiest 17603 0.0054 6 0.01 0.4
Age 35-44: Male Athiest 15132 0.0047 15 0.04 0.1
Age 45-54-: Male Athiest 12602 0.0039 12 0.03 0.1
Age 55-64: Male Athiest 9864 0.0031 10 0.02 0.1
Age 65+: Male Athiest 9941 0.0031 2 0 0.6
Age 18-24: Female Athiest 11554 0.0036 15 0.04 0.1
Age 25-34: Female Athiest 17074 0.0053 13 0.03 0.2
Age 35-44: Female Athiest 14793 0.0046 18 0.04 0.1
Age 45-54-: Female Athiest 12445 0.0039 9 0.02 0.2
Age 55-64: Female Athiest 9674 0.003 4 0.01 0.3
Age 65+: Female Athiest 12520 0.0039 4 0.01 0.4
Age 18-24: Male Non-affiliated 39502 0.0122 1 0 0.4
Age 25-34 Male Non-affiliated 58678 0.0182 5 0.01 0.3
Age 35-44 Male Non-affiliated 50440 0.0156 10 0.02 0.2
Age 45-54 Male Non-affiliated 42005 0.013 5 0.01 0.1
Age 55-64 Male Non-affiliated 32881 0.0102 2 0 0.0
Age 65+ Male Non-affiliated 33135 0.0103 4 0.01 -0.1
Age 18-24: Female Non-affiliated 38515 0.0119 6 0.01 -0.2
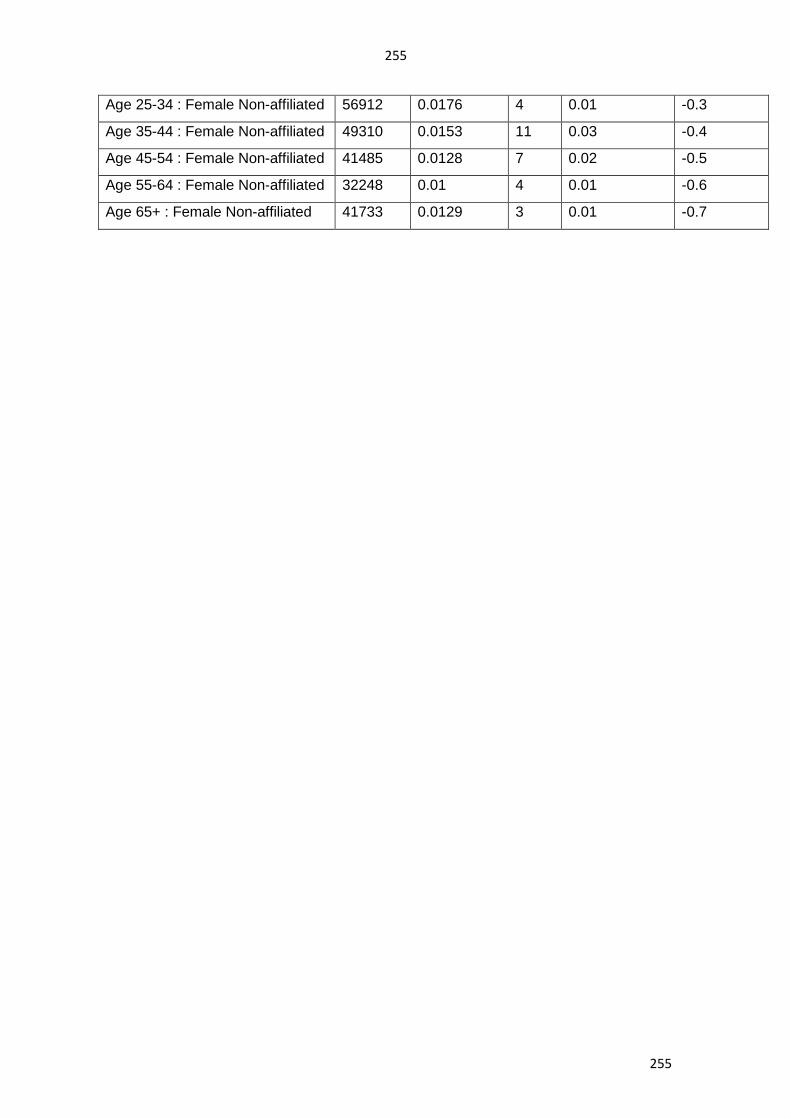
255
255
Age 25-34 : Female Non-affiliated 56912 0.0176 4 0.01 -0.3
Age 35-44 : Female Non-affiliated 49310 0.0153 11 0.03 -0.4
Age 45-54 : Female Non-affiliated 41485 0.0128 7 0.02 -0.5
Age 55-64 : Female Non-affiliated 32248 0.01 4 0.01 -0.6
Age 65+ : Female Non-affiliated 41733 0.0129 3 0.01 -0.7
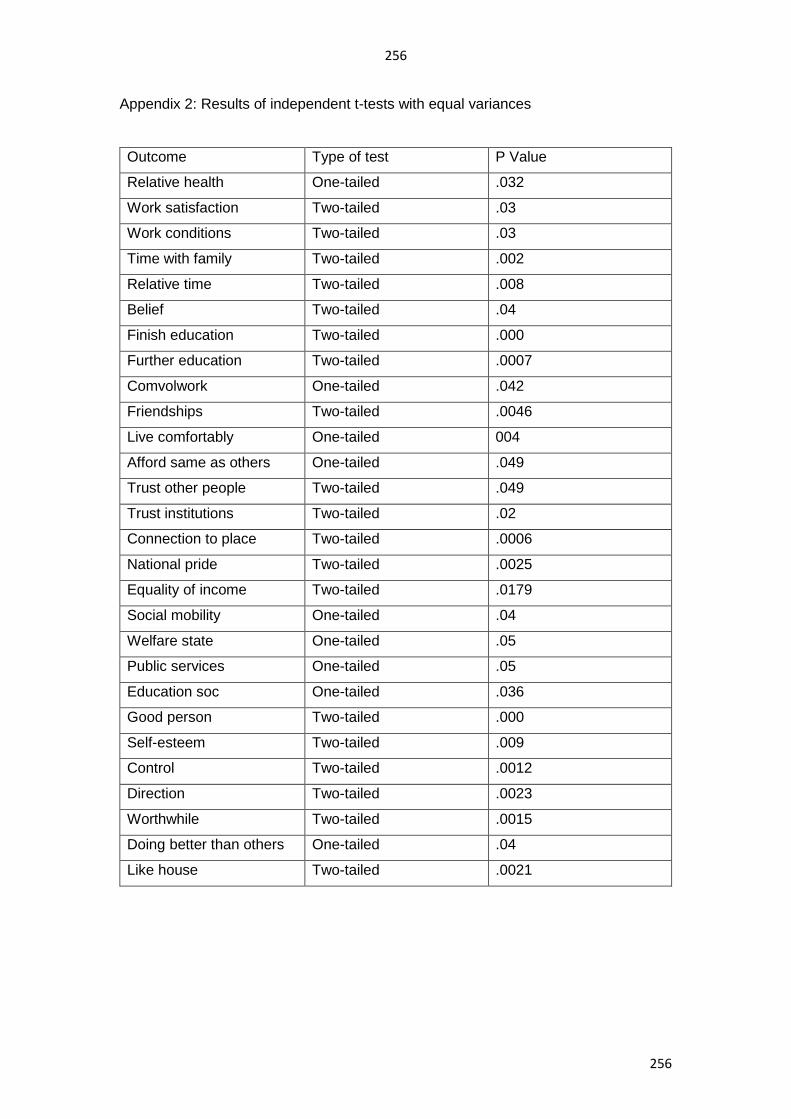
256
256
Appendix 2: Results of independent t-tests with equal variances
Outcome Type of test P Value
Relative health One-tailed .032
Work satisfaction Two-tailed .03
Work conditions Two-tailed .03
Time with family Two-tailed .002
Relative time Two-tailed .008
Belief Two-tailed .04
Finish education Two-tailed .000
Further education Two-tailed .0007
Comvolwork One-tailed .042
Friendships Two-tailed .0046
Live comfortably One-tailed 004
Afford same as others One-tailed .049
Trust other people Two-tailed .049
Trust institutions Two-tailed .02
Connection to place Two-tailed .0006
National pride Two-tailed .0025
Equality of income Two-tailed .0179
Social mobility One-tailed .04
Welfare state One-tailed .05
Public services One-tailed .05
Education soc One-tailed .036
Good person Two-tailed .000
Self-esteem Two-tailed .009
Control Two-tailed .0012
Direction Two-tailed .0023
Worthwhile Two-tailed .0015
Doing better than others One-tailed .04
Like house Two-tailed .0021

257
257
Appendix 3: Codebook
Age:
1:18-24
2 25-34
3 35-44
4 45-54
5 55-64
6: 65+
Job type
1: Professional
2: Non-manual
3: Manual
Religion
1: Active
2: Affiliated
3: Atheist
4: Non-affiliated
Ethnicity
1: White Irish
2: White Other
3: Non-white
Education:
1: Primary
2: Secondary
3: Third level
Employment status
1: Full-time
2: Unemployed
3: Disabled, not able to work
4: Not working
5: Part time
Country
1: Born in the republic
2: Northern Ireland
3: Resident in Ireland
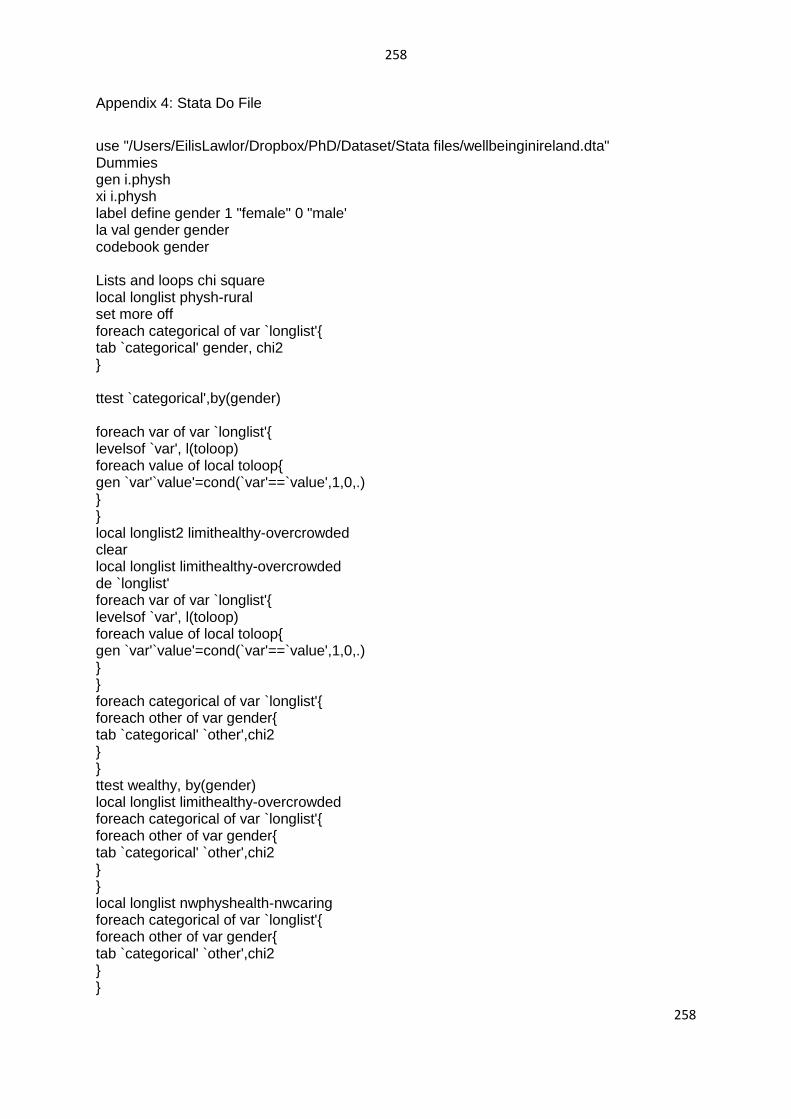
258
258
Appendix 4: Stata Do File
use "/Users/EilisLawlor/Dropbox/PhD/Dataset/Stata files/wellbeinginireland.dta" Dummies gen i.physh xi i.physh label define gender 1 "female" 0 "male' la val gender gender codebook gender Lists and loops chi square local longlist physh-rural set more off foreach categorical of var `longlist'{ tab `categorical' gender, chi2 } ttest `categorical',by(gender) foreach var of var `longlist'{ levelsof `var', l(toloop) foreach value of local toloop{ gen `var'`value'=cond(`var'==`value',1,0,.) } } local longlist2 limithealthy-overcrowded clear local longlist limithealthy-overcrowded de `longlist' foreach var of var `longlist'{ levelsof `var', l(toloop) foreach value of local toloop{ gen `var'`value'=cond(`var'==`value',1,0,.) } } foreach categorical of var `longlist'{ foreach other of var gender{ tab `categorical' `other',chi2 } } ttest wealthy, by(gender) local longlist limithealthy-overcrowded foreach categorical of var `longlist'{ foreach other of var gender{ tab `categorical' `other',chi2 } } local longlist nwphyshealth-nwcaring foreach categorical of var `longlist'{ foreach other of var gender{ tab `categorical' `other',chi2 } }
259
259
local longlist howsatisfied-howhappy foreach categorical of var `longlist'{ foreach other of var gender{ tab `categorical' `other',chi2 } } Rank correlations spearman physh nwphyshealth, stats(rho p) ktau physh nwphyshealth, stats(taua taub p) pwcorr physh nwphyshealth, sig spearman nwincome wealthy, stats(rho p) spearman nwincome livecomfort, stats(rho p) Recoding ranks local longlist nwphyshealth-nwcaring de `longlist' recode `longlist' (1 = 5) recode `longlist' (2 = 4) recode `longlist' (4 = 2) recode `longlist' (5 = 1) oprobit howhappy earningslevel local longlist nwphyshealth-nwcaring de `longlist' recode `longlist' (1 = 5) use wellbeinginireland, clear set more 1 foreach var of var goodperson selfesteem howanxious howworthwhile howsatisfied control direction worthwhile affordsameas /// howhappy wealthy belief earnmore furthered othersearnmore finisheduc nicerhouse timewfamily menh comvolwork doingbetter /// friendships relhealth relativetime livecomfort{ cap drop `var'c egen `var'c=cut(`var'), group(3) } gen double age2=age^2 recode ethnicity (1=0) (2=1) (3/9=3) recode jobtype (5 6 7=3) (2 3 4=2) recode employstatus (1 =1) (4=2) (6=3) (5 7 8=4) (2 3=5) la def employ 1 "Full time" 2 "Unemployed" 3 "Disabled Not able to work" 4 "Not Working" 5 "Part time" la val employstatus employ egen educ1group=cut(educ1), group(3) oprobit howhappyc gender ib0.ethnicity ib1.employstatus ib1.jobtype /// ib1.country age age2 ib1.religion ib0.menhc ib2.educ1group forv i=0/2{ margins, dydx(*) predict(outcome(`i')) } oprobit howworthwhilec gender ib0.ethnicity ib1.employstatus ib1.jobtype /// ib1.country age age2 ib1.religion ib0.menhc ib2.educ1group
260
260
forv i=0/2{ margins, dydx(*) predict(outcome(`i')) } oprobit howsatisfiedc gender ib0.ethnicity ib1.employstatus ib1.jobtype /// ib1.country age age2 ib1.religion ib0.menhc ib2.educ1group forv i=0/2{ margins, dydx(*) predict(outcome(`i')) } oprobit howanxiousc gender ib0.ethnicity ib1.employstatus ib1.jobtype /// ib1.country age age2 ib1.religion ib0.menhc ib2.educ1group forv i=0/2{ margins, dydx(*) predict(outcome(`i')) } oprobit menhc gender ib0.ethnicity ib1.employstatus ib1.jobtype /// ib1.country age age2 ib1.religion ib1.howsatisfiedc ib1.howanxiousc ib2.educ1group forv i=0/2{ margins, dydx(*) predict(outcome(`i')) } oprobit howhappyc ib0.gender ib1.ethnicity ib1.employstatus ib1.jobtype /// ib1.country ageg age2 ib3.religion ib0.menhc ib2.educ1 ib0.comvolworkc ib0.doingbetterc ib0.nicerhousec ib0.friendshipsc ib0.othersearnmorec /// ib0.goodpersonc ib0.selfesteemc ib0.controlc ib0.directionc ib0.worthwhilec ib0.affordsameasc ib0.wealthyc ib0.beliefc ib0.earnmorec ib0.timewfamilyc /// ib0.relhealthc ib0.relativetimec ib0.livecomfortc oprobit howworthwhilec ib0.gender ib1.ethnicity ib1.employstatus ib1.jobtype /// ib1.country ageg age2 ib3.religion2 ib0.menhc ib2.educ1 ib0.comvolworkc ib0.doingbetterc ib0.nicerhousec ib0.friendshipsc ib0.othersearnmorec /// ib0.goodpersonc ib0.selfesteemc ib0.controlc ib0.directionc ib0.worthwhilec ib0.affordsameasc ib0.wealthyc ib0.beliefc ib0.earnmorec ib0.timewfamilyc /// ib0.relhealthc ib0.relativetimec ib0.livecomfortc oprobit howsatisfiedc ib0.gender ib1.ethnicity ib1.employstatus ib1.jobtype /// ib1.country ageg age2 ib3.religion ib0.menhc ib2.educ1group ib0.comvolworkc ib0.doingbetterc ib0.nicerhousec ib0.friendshipsc ib0.othersearnmorec /// ib0.goodpersonc ib0.selfesteemc ib0.controlc ib0.directionc ib0.worthwhilec ib0.affordsameasc ib0.wealthyc ib0.beliefc ib0.earnmorec ib0.timewfamilyc /// ib0.relhealthc ib0.relativetimec ib0.livecomfortc oprobit howanxiousc ib0.gender ib1.ethnicity ib1.employstatus ib1.jobtype /// ib1.country age ib3.religion ib0.menhc ib0.comvolworkc ib0.doingbetterc ib0.nicerhousec ib0.friendshipsc ib0.othersearnmorec /// ib0.goodpersonc ib0.selfesteemc ib0.controlc ib0.directionc ib0.worthwhilec ib0.affordsameasc ib0.wealthyc ib0.beliefc ib0.earnmorec ib0.timewfamilyc /// ib0.relhealthc ib0.relativetimec ib0.livecomfortc
261
261
use wellbeinginireland, clear set more 1 foreach var of var notanxious goodperson selfesteem howanxious howworthwhile howsatisfied control direction worthwhile affordsameas howhappy wealthy belief earnmore furthered finisheduc timewfamily menh friendships livecomfort{ cap drop `var'c egen `var'c=cut(`var'), group(3) } gen double age2=age^2 recode ethnicity (1=0) (2=1) (3/9=3) recode jobtype (5 6 7=3) (2 3 4=2) recode employstatus (1 =1) (4=2) (6=3) (5 7 8=4) (2 3=5) la def employ 1 "Full time" 2 "Unemployed" 3 "Disabled Not able to work" 4 "Not Working" 5 "Part time" la val employstatus employ egen educ1group=cut(educ1), group(3) oprobit howhappyc gender ib0.ethnicity ib1.employstatus ib1.jobtype /// ib1.country age age2 ib1.religion ib0.menhc ib2.educ1group forv i=0/2{ margins, dydx(*) predict(outcome(`i')) } oprobit howworthwhilec gender ib0.ethnicity ib1.employstatus ib1.jobtype /// ib1.country age age2 ib1.religion ib0.menhc ib2.educ1group forv i=0/2{ margins, dydx(*) predict(outcome(`i')) } oprobit howsatisfiedc gender ib0.ethnicity ib1.employstatus ib1.jobtype /// ib1.country age age2 ib1.religion ib0.menhc ib2.educ1group forv i=0/2{ margins, dydx(*) predict(outcome(`i')) } oprobit howanxiousc gender ib0.ethnicity ib1.employstatus ib1.jobtype /// ib1.country age age2 ib1.religion ib0.menhc ib2.educ1group forv i=0/2{ margins, dydx(*) predict(outcome(`i')) } oprobit menhc gender ib0.ethnicity ib1.employstatus ib1.jobtype /// ib1.country age age2 ib1.religion ib1.howsatisfiedc ib1.howanxiousc ib2.educ1group forv i=0/2{ margins, dydx(*) predict(outcome(`i')) }
262
262
fac physh-rural, mine(1) rotate, varimax fac menh friendships physh worthwhile selfesteem control goodperson timewfamily likearea enoughtime livecomfort wealthy earnmore, mine(1) rotate, varimax fac menh friendships physh worthwhile selfesteem control goodperson timewfamily likearea enoughtime livecomfort wealthy earnmore, mine(1) pcf rotate, varimax fac menh friendships physh worthwhile selfesteem control goodperson timewfamily likearea enoughtime livecomfort fac /// menh control selfesteem goodperson worthwhile /// physh physact lifeexp familysick /// friendships timewfamily trustsoc lonely /// enoughtime culture /// havingjob dislikejob worksat workcond /// livecomfort debt stugglefinances /// furthered finisheduc educatedsoc /// trustinst equalsocial equalincome democracy publicservs /// likehouse connplace, mine(1) recode dislikejob(10=0) (9=1) (8=2) (7=3) (6=4) (0=10) (1=9) (2=8) (3=7) (4=6), gen(likejob) recode lonely (10=0) (9=1) (8=2) (7=3) (6=4) (0=10) (1=9) (2=8) (3=7) (4=6), gen(notlonely) recode debt (10=0) (9=1) (8=2) (7=3) (6=4) (0=10) (1=9) (2=8) (3=7) (4=6), gen(notdebt) recode stuggle (10=0) (9=1) (8=2) (7=3) (6=4) (0=10) (1=9) (2=8) (3=7) (4=6), gen(notstruggle) recode familysick (10=0) (9=1) (8=2) (7=3) (6=4) (0=10) (1=9) (2=8) (3=7) (4=6), gen(famhealthy) recode howanxious (10=0) (9=1) (8=2) (7=3) (6=4) (0=10) (1=9) (2=8) (3=7) (4=6), gen(notanxious) corr menh control selfesteem goodperson worthwhile /// physh physact lifeexp famhealthy /// friendships timewfamily trustsoc notlonely /// enoughtime culture /// havingjob likejob worksat workcond /// livecomfort notdebt notstruggle /// furthered finisheduc educatedsoc /// trustinst equalsocial equalincome democracy publicservs /// likehouse connplace fac /// menh control selfesteem goodperson worthwhile /// physh physact lifeexp famhealthy /// friendships timewfamily trustsoc notlonely /// enoughtime culture /// havingjob likejob worksat workcond /// livecomfort notdebt notstruggle /// furthered finisheduc educatedsoc /// trustinst equalsocial equalincome democracy publicservs /// likehouse connplace, mine(1) pcf predict f1 f2 f3 f4 f5 f6 f7
263
263
reg howhappy f1-f7 reg howworthwhile f1-f7 reg howsatisfied f1-f7 pca menh control selfesteem goodperson worthwhile /// physh physact lifeexp famhealthy /// friendships timewfamily trustsoc notlonely /// enoughtime culture /// havingjob likejob worksat workcond /// livecomfort notdebt notstruggle /// furthered finisheduc educatedsoc /// trustinst equalsocial equalincome democracy publicservs /// likehouse connplace, mine(1) *read this on post stratification: *http://www.atlas.illinois.edu/support/stats/resources/spss/create-post-stratification-weights-for-survery-analysis.pdf *http://www.stata.com/manuals13/svypoststratification.pdf replace age = 6 if age==65 count if age==1 table age religion gender, contents(freq) table age religion, by (gender) contents (freq) la def age 1 "18-24" 2 "25-34" 3 "35-44" 4 "45-54" 5 "55-64" 6 "65+" la val age age la def country 1 "born republic" 2 "NI" 3 "resident" la val country country la def ethnicity 0 "White Irish" 1 "White Other" 2 "Non-white" la val ethnicity ethnicity recode jobtype (5 6 7=3) (2 3 4=2) la def jobtype 1 "Professional" 2 "Non-manual" 3 "Manual" la val jobtype jobtype recode educ1 (2 3=2) (4 5 6=3) la def educ1 1 "Primary" 2 "Secondary" 3 "Third-level" la val educ1 educ1 table age gender religion recode unemployed (10=0) (9=1) (8=2) (7=3) (6=4) (0=10) (1=9) (2=8) (3=7) (4=6), gen(employed) fac /// menh control selfesteem goodperson worthwhile /// likearea direction unpolluted havechildren partner genlifeexpect/// physh physact lifeexp famhealthy /// friendships timewfamily trustsoc notlonely /// enoughtime employed /// havingjob likejob worksat workcond ///
264
264
livecomfort notdebt notstruggle /// furthered finisheduc educatedsoc /// trustinst equalsocial equalincome democracy publicservs /// likehouse connplace, mine(1) pcf fac /// menh control worthwhile selfesteem /// physh physact lifeexp famhealthy /// friendships timewfamily trustsoc notlonely /// enoughtime /// havingjob likejob employed worksat workcond /// livecomfort notdebt notstruggle /// furthered finisheduc educatedsoc /// trustinst equalsocial equalincome democracy publicservs /// likehouse like area connplace, mine(1) pcf local longlist physh-rural mean `longlist [aweight=weight] outreg2 using outtab1, see mean `longlist outreg2 using outtab1, see local longlist limithealthy-overcrowded mean `longlist [aweight=weight] outreg2 using outtab1, see mean `longlist outreg2 using outtab2, see set more off mprobit howhappyc ib0.gender ib1.ethnicity ib1.employstatus ib1.jobtype /// ib1.country ib1.religion2 age2 ib0.menhc ib3.educ1 ib0.comvolworkc ib0.doingbetterc ib0.nicerhousec ib0.friendshipsc ib0.othersearnmorec /// ib0.goodpersonc ib0.selfesteemc ib0.controlc ib0.directionc ib0.worthwhilec ib0.affordsameasc ib0.wealthyc ib0.beliefc ib0.earnmorec ib0.timewfamilyc /// ib0.relhealthc ib0.relativetimec ib0.livecomfortc [iweight=weight] forv i=0/2{ margins, dydx(*) predict(outcome(`i')) } oprobit howworthwhilec ib0.gender ib1.ethnicity ib1.employstatus ib1.jobtype /// ib1.country ib1.religion2 age2 ib0.menhc ib3.educ1 ib0.comvolworkc ib0.doingbetterc ib0.nicerhousec ib0.friendshipsc ib0.othersearnmorec /// ib0.goodpersonc ib0.selfesteemc ib0.controlc ib0.directionc ib0.worthwhilec ib0.affordsameasc ib0.wealthyc ib0.beliefc ib0.earnmorec ib0.timewfamilyc /// ib0.relhealthc ib0.relativetimec ib0.livecomfortc [aweight=weight] forv i=0/2{ margins, dydx(*) predict(outcome(`i')) } oprobit howsatisfiedc ib0.gender ib1.ethnicity ib1.employstatus ib1.jobtype /// ib1.country ib1.religion2 age2 ib0.menhc ib3.educ1 ib0.comvolworkc ib0.doingbetterc

265
265
ib0.nicerhousec ib0.friendshipsc ib0.othersearnmorec /// ib0.goodpersonc ib0.selfesteemc ib0.controlc ib0.directionc ib0.worthwhilec ib0.affordsameasc ib0.wealthyc ib0.beliefc ib0.earnmorec ib0.timewfamilyc /// ib0.relhealthc ib0.relativetimec ib0.livecomfortc [aweight=weight] forv i=0/2{ margins, dydx(*) predict(outcome(`i')) } oprobit notanxiousc ib0.gender ib1.ethnicity ib1.employstatus ib1.jobtype /// ib1.country ib1.religion2 age2 ib0.menhc ib3.educ1 ib0.comvolworkc ib0.doingbetterc ib0.nicerhousec ib0.friendshipsc ib0.othersearnmorec /// ib0.goodpersonc ib0.selfesteemc ib0.controlc ib0.directionc ib0.worthwhilec ib0.affordsameasc ib0.wealthyc ib0.beliefc ib0.earnmorec ib0.timewfamilyc /// ib0.relhealthc ib0.relativetimec ib0.livecomfortc [aweight=weight] forv i=0/2{ margins, dydx(*) predict(outcome(`i')) } encode religion,gen(religion2) drop in 503/516 xi i.religion2 la define religion2 1 "." 2 "Active" 3 "Affiliated" 4 "Atheist" 5 "Non-affiliated", replace recode ethnicity (9=3) (6=3) (8=3) (4=3) recode religion2 (2=1) (3=1) (4=2) (4=2) egen `notanxious'c=cut(`notanxiousc'), group(3) } foreach var of varlist `longlist' { ttest `var', by(gender) } [aweight=weight] (weights not possible) sdtest physh, by(gender) - test of equal variances set more off pca menh control selfesteem goodperson worthwhile /// physh physact lifeexp famhealthy /// friendships timewfamily notlonely /// enoughtime comvolwork culture /// havingjob worksat likejob workcond /// notdebt notstruggle /// furthered educatedsoc finisheduc /// trustinst equalsocial equalincome socialmob democracy publicservs trustsoc welstate /// likehouse connplace likearea natpride unpolluted [aweight=weight], mine(1) varimax set more off fac menh control selfesteem goodperson worthwhile ///
266
266
physh physact lifeexp famhealthy /// friendships timewfamily notlonely /// enoughtime comvolwork culture /// havingjob worksat likejob workcond /// livecomfort notdebt notstruggle /// furthered educatedsoc finisheduc /// trustinst equalsocial equalincome socialmob democracy publicservs trustsoc welstate /// likehouse connplace likearea natpride unpolluted [aweight=weight], mine(1) pcf estat kmo screeplot SSC install factortest factortest predict menh control selfesteem goodperson worthwhile /// physh physact lifeexp famhealthy /// friendships timewfamily notlonely /// enoughtime comvolwork culture /// havingjob worksat likejob workcond /// livecomfort notdebt notstruggle /// furthered educatedsoc finisheduc /// trustinst equalsocial equalincome socialmob democracy publicservs trustsoc welstate /// likehouse connplace likearea natpride unpolluted, bartlett tabout gender using gender.xls tabout gender [aweight=weight] using gender.xls, append tabout religion using gender.xls, append tabout religion [aweight=weight] using gender.xls, append tabout age2 using gender.xls, append tabout age2 [aweight=weight] using gender.xls, append set more off corr menh control selfesteem goodperson worthwhile /// physh physact lifeexp famhealthy /// friendships timewfamily notlonely /// enoughtime comvolwork culture /// havingjob worksat likejob workcond /// livecomfort notdebt notstruggle /// furthered educatedsoc finisheduc /// trustinst equalsocial equalincome socialmob democracy publicservs trustsoc welstate /// likehouse connplace likearea natpride unpolluted [aweight=weight] set more off factortest menh control selfesteem goodperson worthwhile /// physh physact lifeexp famhealthy /// friendships timewfamily notlonely /// enoughtime comvolwork culture /// havingjob worksat likejob workcond /// livecomfort notdebt notstruggle /// furthered educatedsoc finisheduc /// trustinst equalsocial equalincome socialmob democracy publicservs trustsoc welstate /// likehouse connplace likearea natpride unpolluted
267
267
set more off bacon menh control selfesteem goodperson worthwhile /// physh physact lifeexp famhealthy /// friendships timewfamily notlonely /// enoughtime comvolwork culture /// havingjob worksat likejob workcond /// livecomfort notdebt notstruggle /// furthered educatedsoc finisheduc /// trustinst equalsocial equalincome socialmob democracy publicservs trustsoc welstate /// likehouse connplace likearea natpride unpolluted, gen (tag) percentile (0.05) set more off oprobit howhappyc ib0.gender ib1.ethnicity ib1.employstatus ib1.jobtype /// ib1.country ib1.religion2 age2 ib0.menhc ib3.educ1 ib0.comvolworkc ib0.doingbetterc ib0.nicerhousec ib0.friendshipsc ib0.othersearnmorec /// ib0.goodpersonc ib0.selfesteemc ib0.controlc ib0.directionc ib0.worthwhilec ib0.affordsameasc ib0.wealthyc ib0.beliefc ib0.earnmorec ib0.timewfamilyc /// ib0.relhealthc ib0.relativetimec ib0.livecomfortc [iweight=weight] estimate store oprobit mprobit howhappyc ib0.gender ib1.ethnicity ib1.employstatus ib1.jobtype /// ib1.country ib1.religion2 age2 ib0.menhc ib3.educ1 ib0.comvolworkc ib0.doingbetterc ib0.nicerhousec ib0.friendshipsc ib0.othersearnmorec /// ib0.goodpersonc ib0.selfesteemc ib0.controlc ib0.directionc ib0.worthwhilec ib0.affordsameasc ib0.wealthyc ib0.beliefc ib0.earnmorec ib0.timewfamilyc /// ib0.relhealthc ib0.relativetimec ib0.livecomfortc [iweight=weight] lrtest oprobit . foreach var of var notanxious{ cap drop `var'c egen `var'c=cut(`var'), group(3) } set more off pca physh-rural likejob-famhealthy employed [aweight=weight], mine(1)

268
268
Appendix 5 - Survey