measuring higher education services using the servqual
TRANSCRIPT
Revija za univerzalno odličnost / Journal of Universal Excellence, Članek / Article
November 2018, leto / year 2018, številka / number 4, str. / pp. 160–179.
* Korespondenčni avtor / Correspondence author 160
Prejeto: 4. september 2018; revidirano: 12. september 2018; sprejeto: 12. november 2018. /
Received: 4th September 2018; revised: 12th September 20XX; accepted: 12th November 2018.
Measuring Higher Education Services Using the SERVQUAL
Model
Katia Saliba
Faculty of Public Health Branch IV, Lebanese University, Karak, P.O. Box 8443, Zahle, Lebanon,
Faculty of Organisation Studies Novo mesto, Ulica talcev 3, 8000 Novo mesto, Slovenia
Annmarie Gorenc Zoran*
Faculty of Organisation Studies Novo mesto, Ulica talcev 3, 8000 Novo mesto, Slovenia
Abstract: Research Question (RQ): In this research analysis, SERVQUAL tool was used with higher
education institutions (HEIs) to measure service quality as well as to compare them. HEIs were
compared to see the service quality dimensions that need improvements in public HEI verses
private HEIs. More specifically, to examine if there is a common trend with public universities in
specific quality service dimensions that were not expected and less perceived by students.
Purpose: Quality of service in a higher education institution is an essential aspect to ensure
competency and attractiveness in the marketplace. Students are the primary stakeholders. Students
expectations from an HEI and their perception of quality of service needs to be a strategic
objective of an HEI. Public HEIs have a different strategy from private ones. In this research
study, such a difference was examined to determine if it is reflected in a specific service quality
dimension.
Method: The study is based on a comparative literature review of SERVQUAL instrument used in
measuring service quality in HEIs. Results obtained from the review of literature were triangulated
and examined for specific quality dimensions that were common in public HEIs that need
improvement.
Results: Students’ perception was less than expected in the quality of service provided. Public
HEIs should consider reliability and responsiveness as a priority and along with other dimensions
to improve service quality. SERVQUAL could be used to examine and measure students’
perspective and measure periodical and implemented strategic objectives of higher education.
Organization and Society: The research impact is mainly on HEIs, their managers, and their
plans for quality improvements.
Originality: The findings of the measuring tool SERVQUAL was compared among different
HEIs from the review of literature using triangulation techniques.
Limitations / Further research: Limitations of the study are concerned mostly with the different
data collected among different HEIs in different geographical regions. Triangulation of the same
scale excluded many related studies which used different scale measures or further specified
quality dimensions yielding fewer studies that could be triangulated. Further research could be
conducted by collecting data on public and private HEIs in the same region and time and then
repeated at different time intervals to examine any progress.
Keywords: SERVQUAL, Higher education, Public HEI, Triangulation, Service Quality, strategic
objectives, students’ perceptions, students’ expectations.
Revija za univerzalno odličnost / Journal of Universal Excellence, Članek / Article
November 2018, leto / year 2018, številka / number 4, str. / pp. 160–179.
161
1 Introduction
Quality in service is as vital as quality in products in the industrial sector. Service quality as a
sector by its own entity was not regarded as such until recently. Service assessed by itself was
not a primary focus even in research till the late 1970s. However, since then, the service
sector has demonstrated its significant effect on the economy. It had become a vital topic for
study, and thus its measurement becomes imperative. However, the measurement of service
quality is not straightforward, and often it is done indirectly by measuring a byproduct or
tangible output. Therefore, it is essential to study the assessment and measurement of service
quality (Abdullah, 2006).
Higher education is regarded as a service sector and an indispensable part of the commercial
service sector. Its quality is a primary concern for its competitiveness and effectiveness. To
maintain and ensure its quality, government requirements and accreditation standards were
assigned to higher education. The assessments of these requirements and standards have
placed more attention on curricula or tangible aspects than directly assessing service quality.
The direct measurement of service quality will fill this gap of ensuring quality in service
institutions. The assessment of quality service has to be done continuously for continuous
improvement (Çerri, 2014). Assessment and measurement of service quality need to be
executed from the perspective of primary stakeholders. As discussed in Douglas, McClelland,
and Davies (2008) the primary stakeholders in higher education are the students.
Having the above in mind, in this study, Higher Education Institutions (HEIs) were compared
to see the service quality dimensions that need improvements in public HEIs verses private
HEIs. More specifically, for this paper to examine if there is a common trend with public
universities in specific quality service dimensions that were not expected and less perceived
by students.
SERVQUAL is a research instrument that measures customers’ perception of service quality
and their expectation of the service. It then measures the difference between the expectation
and perception to see if the perception is higher or lower than the expected. When it is lower,
improvements need to be conducted in that quality dimension. In the case of higher education,
it measures the perception of students with regards to the quality of service of higher
education institutions. This research aims to do a comparative literature review of several
higher education institutions that had used the SERVQUAL research instrument to determine
if there is consistency in the findings regarding which dimension of service is lacking in
public institutions in general. The method to be used is the triangulation of results from
different public institutions of the data collected by SERVQUAL in several public and private
higher education institutions.
Leisyte and Westerheijden (2014) state that students who are regarded as equal partners, i.e.,
as stakeholders, are more involved in determining the institution’s strategy. Through
measurement of student’s perception and expectation of quality service, the obtained results
Revija za univerzalno odličnost / Journal of Universal Excellence, Članek / Article
November 2018, leto / year 2018, številka / number 4, str. / pp. 160–179.
162
can then be included in the strategic objectives of the institution. The purpose of quality
assurance is to ensure that higher education institution meets its strategic objectives. They
need to have input for internal and external evaluations, quality assurance, curriculum, and
other factors (Kettunen, 2012). Therefore, the measurement of student’s perception of quality
service, and their involvement in strategic management completes the circle in the
institution’s back and forth measurement and input of quality.
2 Theoretical framework
2.1 Definition of Service Quality
From a theoretical standpoint, there is no universal definition of quality - it may be defined as
the conformance of a requirement, being fit to use (Parasuraman, Zeithaml, & Berry, 1985;
Zeithaml, 1988). Moreover, measuring the quality of a service can be a challenging exercise.
Unlike products where there are specific specifications such as length, depth, width, weight,
color, and so on, a service has many intangible or qualitative specifications. Also, there is an
expectation of the customer with regards to the service, which can vary considerably based on
a range of factors such as prior experience, personal needs, and what other people may have
told them (Grönroos, 1984).
Quality service is defined as the customers' perceptions of service performance that meets or
exceeds their expectations of what the service organization provides. Thus, the service quality
is to fulfill customer expectations (Pariseau & McDaniel, 1997).
Castleberry and McIntyre (2011) define the perceived quality of service as the belief about the
excellence level of the service (p. 75). According to Zeithaml (1998), perceived quality of
service is “the judgment of consumer on the superiority or the excellence of a product or
service” (p. 3). Perceived quality of service differs from objective quality. Perceived quality
of service is the consumers’ perception, which is unequal to satisfaction obtained by
comparing consumers’ expectations from service and performance of the received service
(Zeithaml, 1988). Perceived quality of service is an attitude that is related to but different than
contentment, and it is attained by comparing the expectations with perceived performance
(Parasuraman, Zeithaml, & Berry, 2002).
Parasuraman, Zeithaml, and Berry (1985, 1991) and Parasuraman, Berry, and Zeithaml (1991)
developed a measurement tool entitled SERVQUAL, to be used in a variety of service
industries. SERVQUAL has been tested in a number of service settings (Buttle, 1996;
Ladhari, 2009; Lam & Woo, 1997). The SERVQUAL scale was developed to provide an
instrument for measuring service quality to be applied to a broad range of services with minor
modifications in the scale. There are five dimensions of service quality that apply to service-
providing organizations in general.
Revija za univerzalno odličnost / Journal of Universal Excellence, Članek / Article
November 2018, leto / year 2018, številka / number 4, str. / pp. 160–179.
163
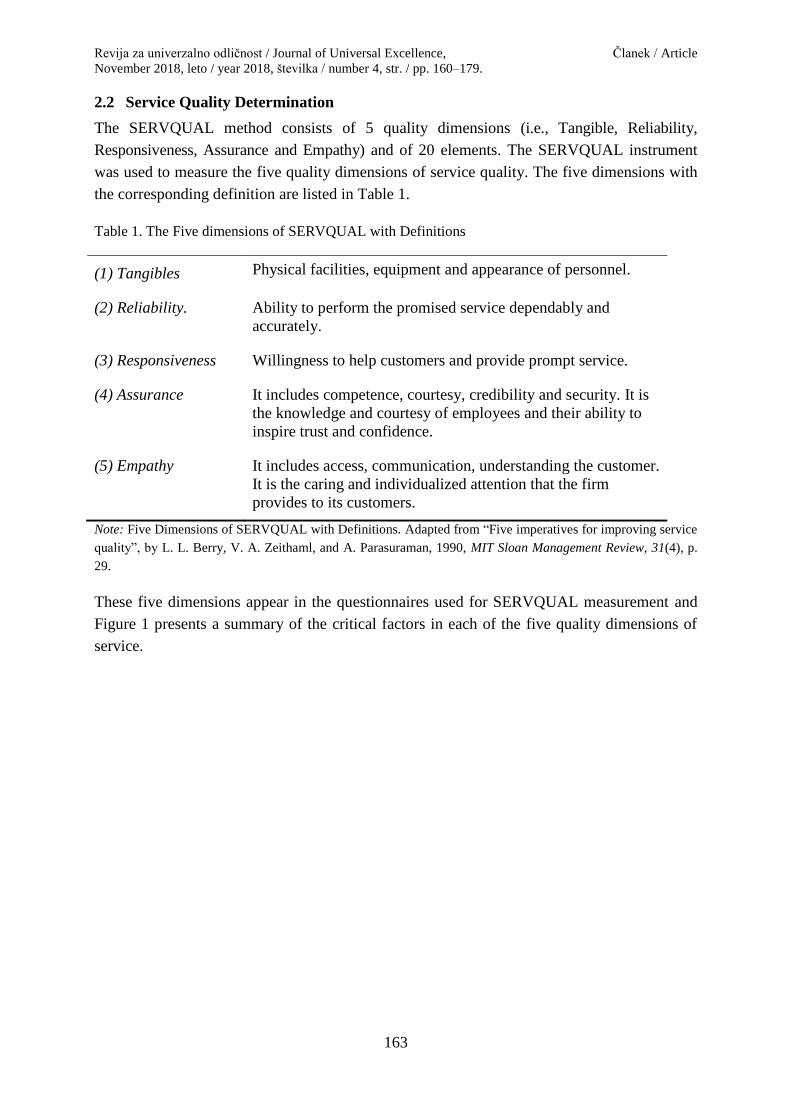
2.2 Service Quality Determination
The SERVQUAL method consists of 5 quality dimensions (i.e., Tangible, Reliability,
Responsiveness, Assurance and Empathy) and of 20 elements. The SERVQUAL instrument
was used to measure the five quality dimensions of service quality. The five dimensions with
the corresponding definition are listed in Table 1.
Table 1. The Five dimensions of SERVQUAL with Definitions
(1) Tangibles Physical facilities, equipment and appearance of personnel.
(2) Reliability. Ability to perform the promised service dependably and
accurately.
(3) Responsiveness Willingness to help customers and provide prompt service.
(4) Assurance It includes competence, courtesy, credibility and security. It is
the knowledge and courtesy of employees and their ability to
inspire trust and confidence.
(5) Empathy It includes access, communication, understanding the customer.
It is the caring and individualized attention that the firm
provides to its customers.
Note: Five Dimensions of SERVQUAL with Definitions. Adapted from “Five imperatives for improving service
quality”, by L. L. Berry, V. A. Zeithaml, and A. Parasuraman, 1990, MIT Sloan Management Review, 31(4), p.
29.
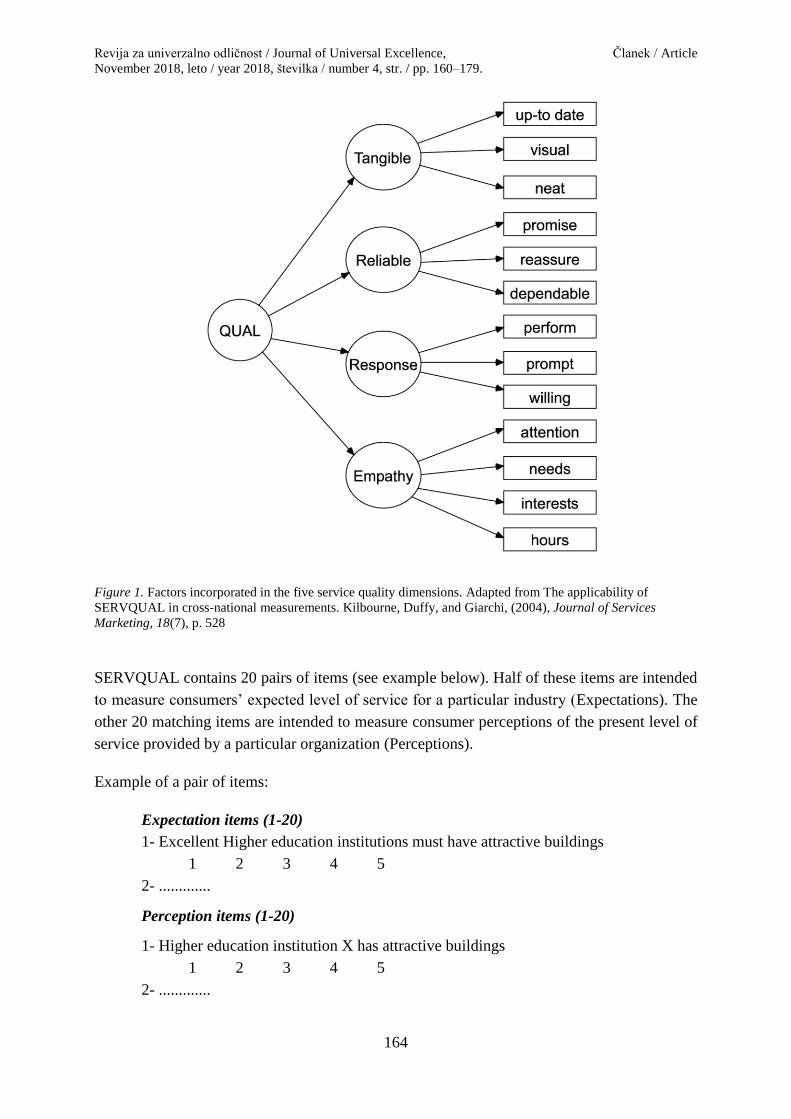
These five dimensions appear in the questionnaires used for SERVQUAL measurement and
Figure 1 presents a summary of the critical factors in each of the five quality dimensions of
service.
Revija za univerzalno odličnost / Journal of Universal Excellence, Članek / Article
November 2018, leto / year 2018, številka / number 4, str. / pp. 160–179.
164
Figure 1. Factors incorporated in the five service quality dimensions. Adapted from The applicability of
SERVQUAL in cross-national measurements. Kilbourne, Duffy, and Giarchi, (2004), Journal of Services
Marketing, 18(7), p. 528
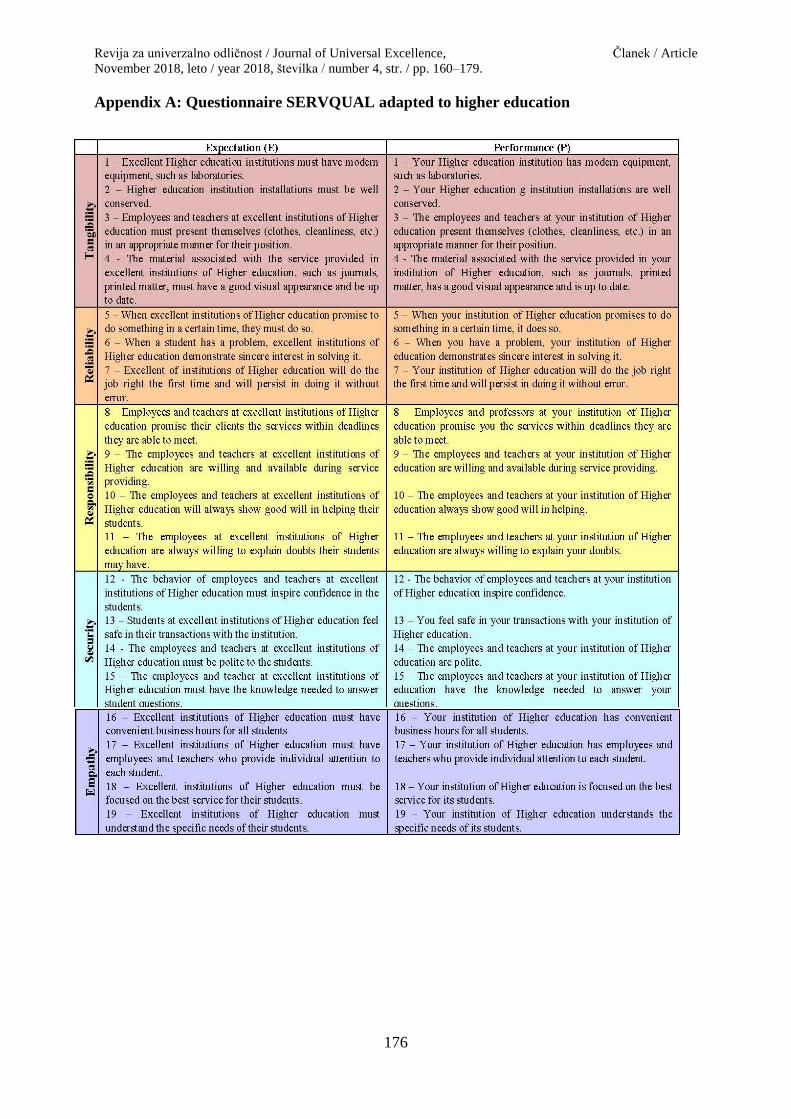
SERVQUAL contains 20 pairs of items (see example below). Half of these items are intended
to measure consumers’ expected level of service for a particular industry (Expectations). The
other 20 matching items are intended to measure consumer perceptions of the present level of
service provided by a particular organization (Perceptions).
Example of a pair of items:
Expectation items (1-20)
1- Excellent Higher education institutions must have attractive buildings
1 2 3 4 5
2- .............
Perception items (1-20)
1- Higher education institution X has attractive buildings
1 2 3 4 5
2- .............
Revija za univerzalno odličnost / Journal of Universal Excellence, Članek / Article
November 2018, leto / year 2018, številka / number 4, str. / pp. 160–179.
165
Both sets of items are presented in five-point Likert response format, with the range between
5 as ‘strongly agree,’ and 1 as ‘strongly disagree’. Service quality is measured on the basis of
the different scores by subtracting Expectation scores from the corresponding Perception
scores.
Putting service quality into operation as a difference or ‘gap’ score is a consistent extension of
the theoretical work of Parasuraman and his colleagues (1985, 1988) on the determinants of
service quality. It is unique in the sense that the definition of the construct is based on the
difference between expectations and perceptions. The construct is differentiated from
consumer satisfaction in a way that defines the expectations/ perceptions ‘gap’ as an enduring
perception of the overall excellence of a particular firm.
A structured survey questionnaire was developed according to SERVQUAL scale. It consists
of 20 statements with two columns.
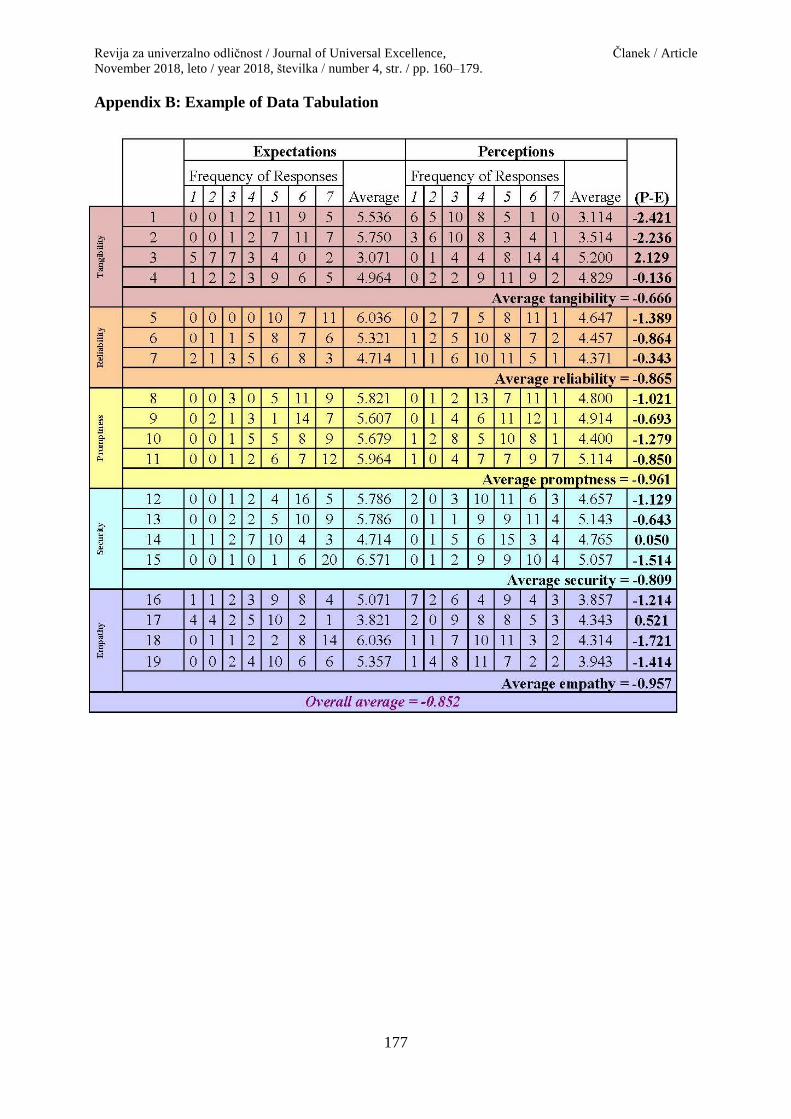
For each pair of statements listed in the SERVQUAL instrument, a score was computed as
follows: Service quality (SQ) = Perception (P) –Expectation (E). For example, if a perception
of a statement on Empathy scored a 3 and the corresponding statement for expectation scored
a 5 then, SQ = P (3)-E (5) = -2. The service quality of the higher education institution is
assessed along each of the five dimensions by averaging the SERVQUAL scores on the
statements making up the dimension measures.
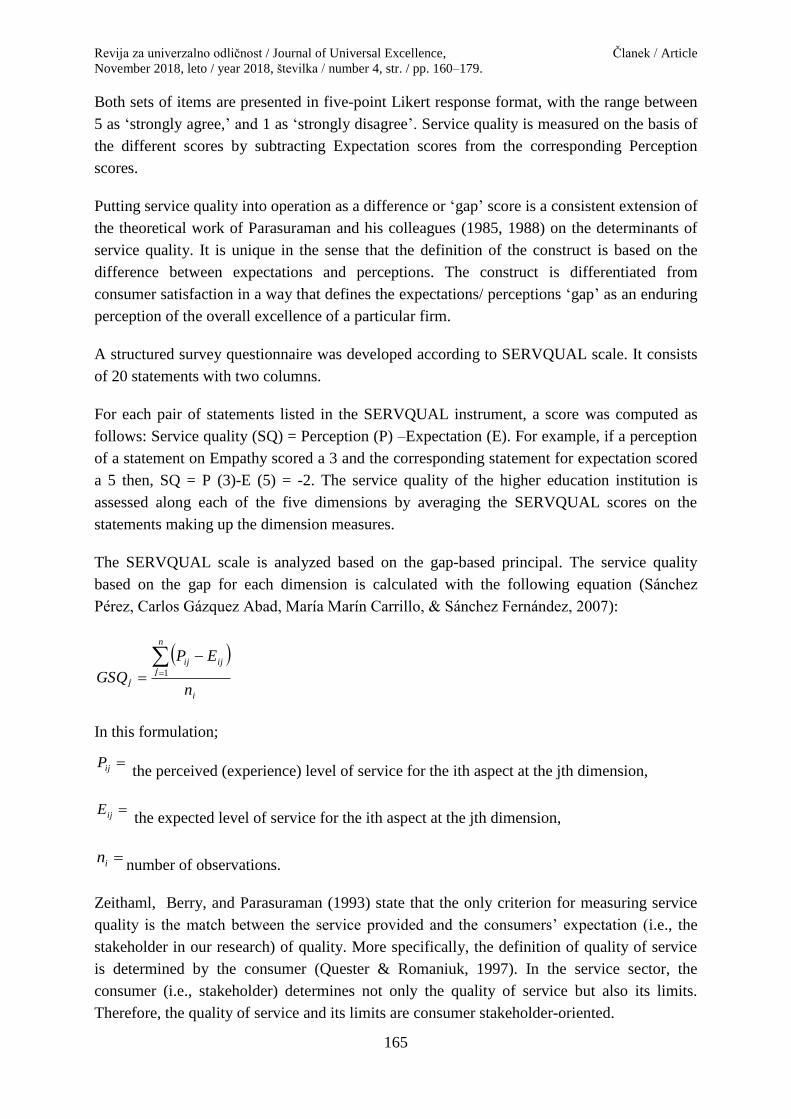
The SERVQUAL scale is analyzed based on the gap-based principal. The service quality
based on the gap for each dimension is calculated with the following equation (Sánchez
Pérez, Carlos Gázquez Abad, María Marín Carrillo, & Sánchez Fernández, 2007):
i
n
İ
ijij
İn
EP
GSQ
1
In this formulation;
ijP the perceived (experience) level of service for the ith aspect at the jth dimension,
ijE the expected level of service for the ith aspect at the jth dimension,
innumber of observations.
Zeithaml, Berry, and Parasuraman (1993) state that the only criterion for measuring service
quality is the match between the service provided and the consumers’ expectation (i.e., the
stakeholder in our research) of quality. More specifically, the definition of quality of service
is determined by the consumer (Quester & Romaniuk, 1997). In the service sector, the
consumer (i.e., stakeholder) determines not only the quality of service but also its limits.
Therefore, the quality of service and its limits are consumer stakeholder-oriented.
Revija za univerzalno odličnost / Journal of Universal Excellence, Članek / Article
November 2018, leto / year 2018, številka / number 4, str. / pp. 160–179.
166
3 Method
3.1 Data Collection
The study is based on the comparative literature review of the SERVQUAL instrument
used in measuring service quality in higher education institutions (HEI). Results
obtained in the literature were triangulated and examined for specific quality
dimensions that were common in public HEIs that need improvement.
Data collected was through the review of literature. Articles were selected using the
following criteria:
SERVQUAL instrument is used in a higher education institution,
It is evident that the institution is a public or private institution,
The quality dimensions used are the five original dimensions with no further
elaborated dimension,
The measurement is the original measurement: Gap = Expectation – Perception,
The findings in the article are actual numbers which can be used and calculated in a
way that suits our study.
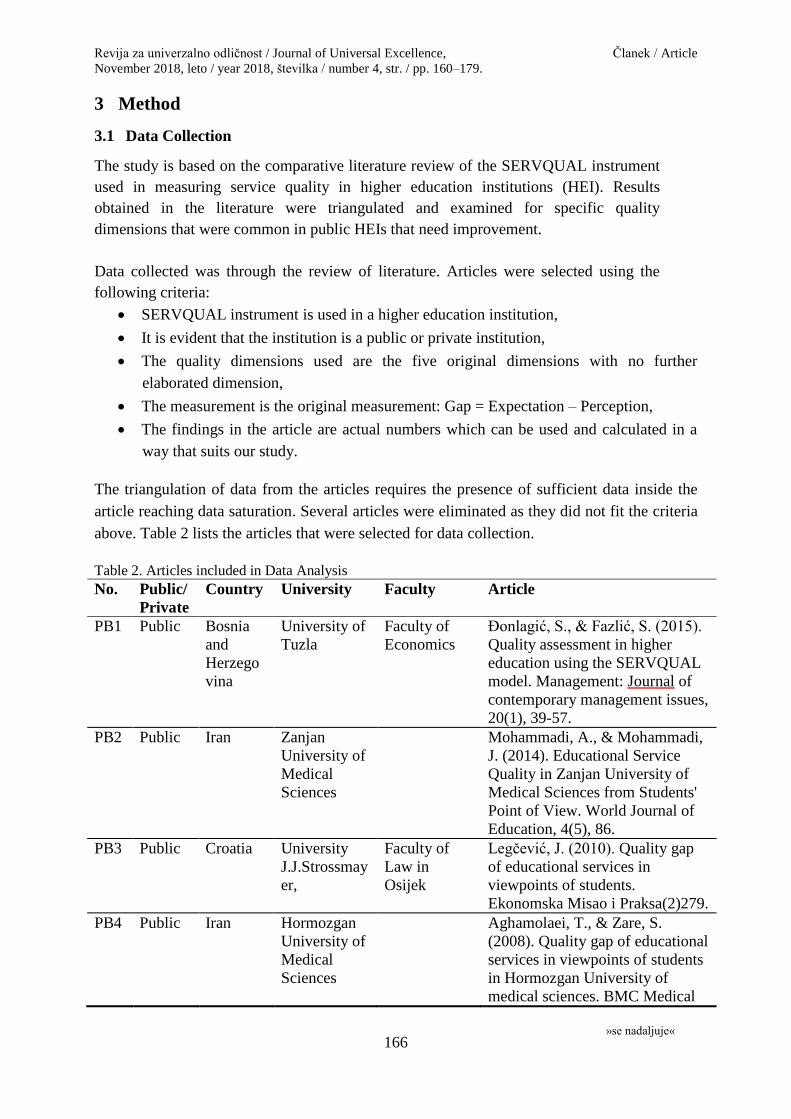
The triangulation of data from the articles requires the presence of sufficient data inside the
article reaching data saturation. Several articles were eliminated as they did not fit the criteria
above. Table 2 lists the articles that were selected for data collection.
Table 2. Articles included in Data Analysis
No. Public/
Private
Country University Faculty Article
PB1 Public Bosnia
and
Herzego
vina
University of
Tuzla
Faculty of
Economics
Đonlagić, S., & Fazlić, S. (2015).
Quality assessment in higher
education using the SERVQUAL
model. Management: Journal of
contemporary management issues,
20(1), 39-57.
PB2 Public Iran
Zanjan
University of
Medical
Sciences
Mohammadi, A., & Mohammadi,
J. (2014). Educational Service
Quality in Zanjan University of
Medical Sciences from Students'
Point of View. World Journal of
Education, 4(5), 86.
PB3 Public Croatia University
J.J.Strossmay
er,
Faculty of
Law in
Osijek
Legčević, J. (2010). Quality gap
of educational services in
viewpoints of students.
Ekonomska Misao i Praksa(2)279.
PB4 Public Iran Hormozgan
University of
Medical
Sciences
Aghamolaei, T., & Zare, S.
(2008). Quality gap of educational
services in viewpoints of students
in Hormozgan University of
medical sciences. BMC Medical
»se nadaljuje«
Revija za univerzalno odličnost / Journal of Universal Excellence, Članek / Article
November 2018, leto / year 2018, številka / number 4, str. / pp. 160–179.
167
Education, 8(1), 34.
PB5 Public Brazil São Paulo
State
University
(UNESP)
Production
Engineer
program
De Oliveira, O. J., & Ferreira, E.
C. (2009). Adaptation and
application of the SERVQUAL
scale in higher education. Paper
presented at the Proceedings of
POMS 20th Annual Conference
Orlando, Florida USA.
PB6 Public Albania Aleksandër
Xhuvani
University
(UNIEL)
Çerri, S. (2012). Assessing the
quality of higher education
services using a modified
SERVQUAL scale. Annales
Universitatis Apulensis: Series
Oeconomica, 14(2), 664.
PB7 Public Poland
Czestochowa
University of
Technology
Faculty of
Management
Ulewicz, R. (2014). Application
of Servqual method for evaluation
of quality of educational services
at the university of higher
education. Polish Journal of
Management Studies, 9, 254--264.
PR1 Private Iran Islamic
Azad
University-
Khorasgan
Branch
Abari, A. A. F.,
Yarmohammadian, M. H., &
Esteki, M. (2011). Assessment of
quality of education a non-
governmental university via
SERVQUAL model. Procedia-
Social and Behavioral Sciences,
15, 2299-2304.
PR2 Private Thailand Khon Kaen
University
Yousapronpaiboon, K. (2014).
SERVQUAL: Measuring higher
education service quality in
Thailand. Procedia-Social and
Behavioral Sciences, 116, 1088.
PR3 Private Dubai Manipal
University
Dubai
Campus
Datta, K. S., & Vardhan, J.
(2017). A SERVQUAL-Based
Framework for Assessing Quality
of International Branch Campuses
in UAE: A Management Students’
Perspective. SAGE Open, 7(1).
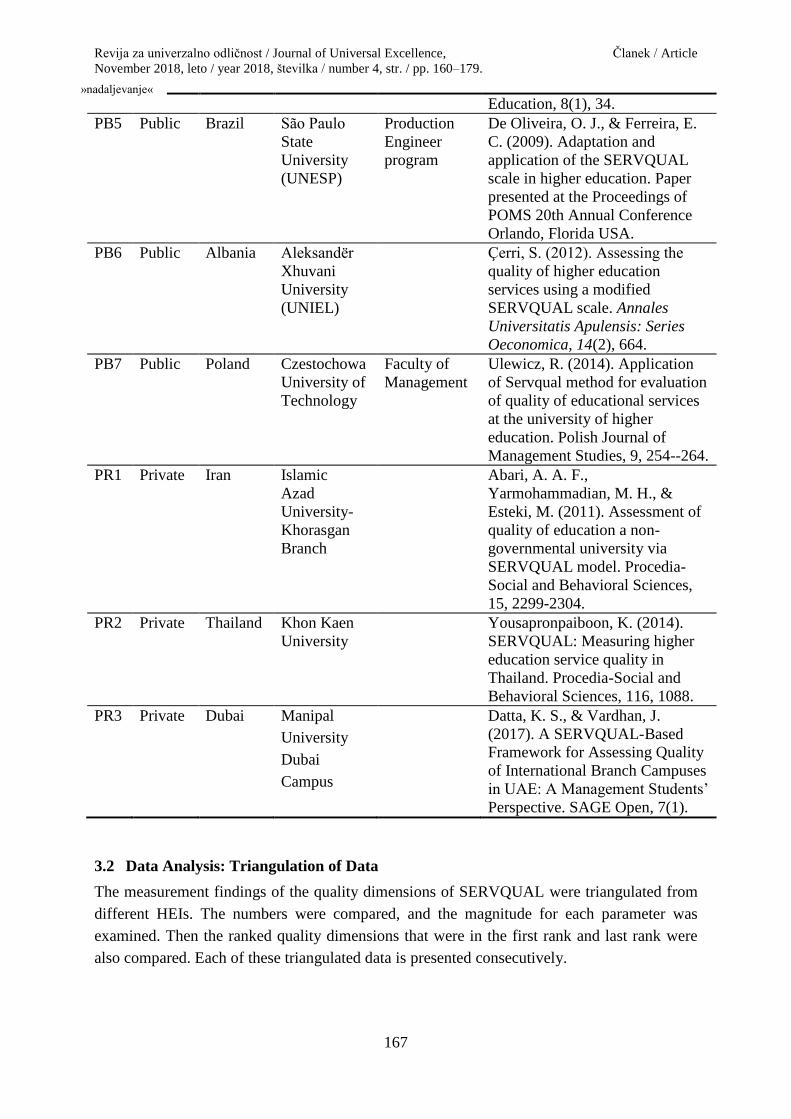
3.2 Data Analysis: Triangulation of Data
The measurement findings of the quality dimensions of SERVQUAL were triangulated from
different HEIs. The numbers were compared, and the magnitude for each parameter was
examined. Then the ranked quality dimensions that were in the first rank and last rank were
also compared. Each of these triangulated data is presented consecutively.
»nadaljevanje«
Revija za univerzalno odličnost / Journal of Universal Excellence, Članek / Article
November 2018, leto / year 2018, številka / number 4, str. / pp. 160–179.
168
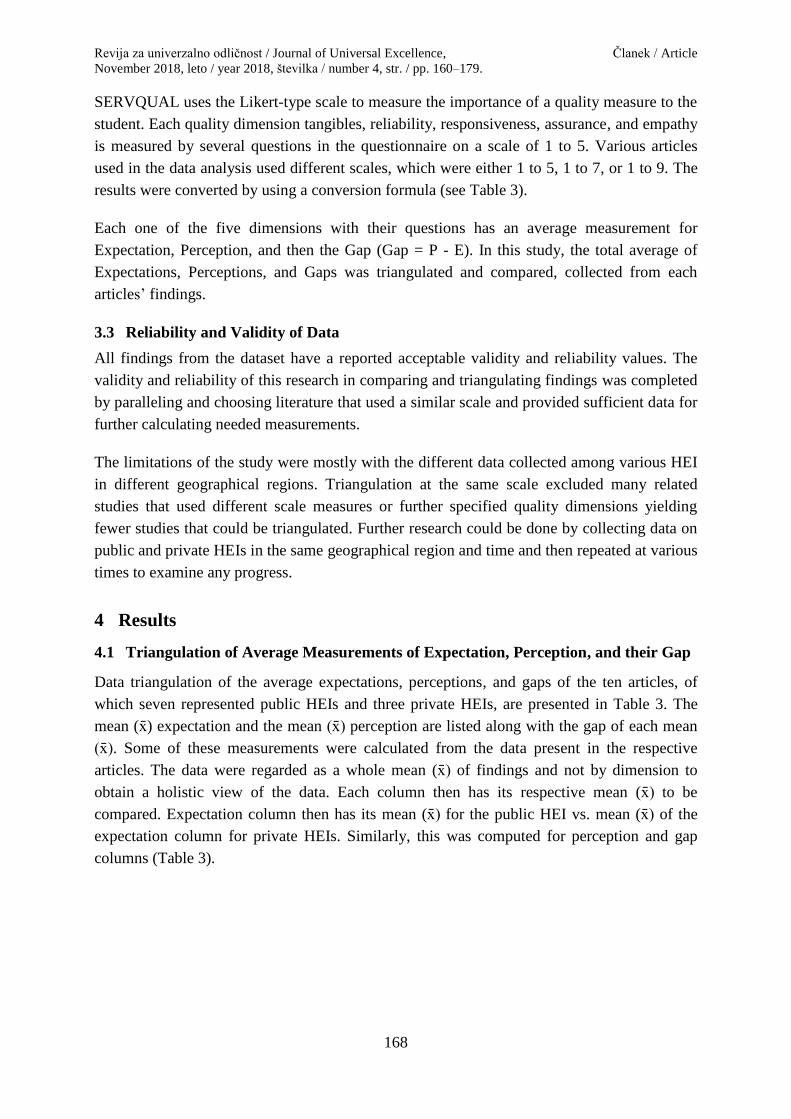
SERVQUAL uses the Likert-type scale to measure the importance of a quality measure to the
student. Each quality dimension tangibles, reliability, responsiveness, assurance, and empathy
is measured by several questions in the questionnaire on a scale of 1 to 5. Various articles
used in the data analysis used different scales, which were either 1 to 5, 1 to 7, or 1 to 9. The
results were converted by using a conversion formula (see Table 3).
Each one of the five dimensions with their questions has an average measurement for
Expectation, Perception, and then the Gap (Gap = P - E). In this study, the total average of
Expectations, Perceptions, and Gaps was triangulated and compared, collected from each
articles’ findings.
3.3 Reliability and Validity of Data
All findings from the dataset have a reported acceptable validity and reliability values. The
validity and reliability of this research in comparing and triangulating findings was completed
by paralleling and choosing literature that used a similar scale and provided sufficient data for
further calculating needed measurements.
The limitations of the study were mostly with the different data collected among various HEI
in different geographical regions. Triangulation at the same scale excluded many related
studies that used different scale measures or further specified quality dimensions yielding
fewer studies that could be triangulated. Further research could be done by collecting data on
public and private HEIs in the same geographical region and time and then repeated at various
times to examine any progress.
4 Results
4.1 Triangulation of Average Measurements of Expectation, Perception, and their Gap
Data triangulation of the average expectations, perceptions, and gaps of the ten articles, of
which seven represented public HEIs and three private HEIs, are presented in Table 3. The
mean (x̄) expectation and the mean (x̄) perception are listed along with the gap of each mean
(x̄). Some of these measurements were calculated from the data present in the respective
articles. The data were regarded as a whole mean (x̄) of findings and not by dimension to
obtain a holistic view of the data. Each column then has its respective mean (x̄) to be
compared. Expectation column then has its mean (x̄) for the public HEI vs. mean (x̄) of the
expectation column for private HEIs. Similarly, this was computed for perception and gap
columns (Table 3).
Revija za univerzalno odličnost / Journal of Universal Excellence, Članek / Article
November 2018, leto / year 2018, številka / number 4, str. / pp. 160–179.
169
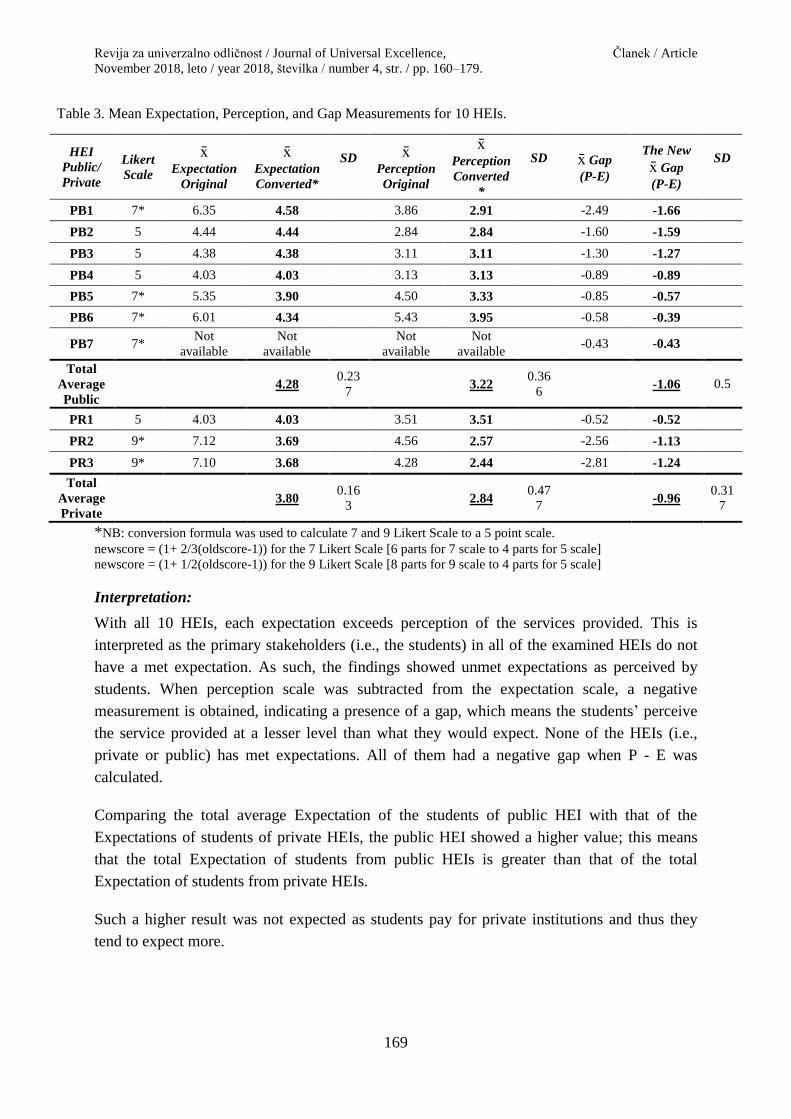
Table 3. Mean Expectation, Perception, and Gap Measurements for 10 HEIs.
HEI
Public/
Private
Likert
Scale
x̄
Expectation
Original
x̄
Expectation
Converted*
SD x̄
Perception
Original
x̄
Perception
Converted
*
SD x̄ Gap
(P-E)
The New
x̄ Gap
(P-E)
SD
PB1 7* 6.35 4.58 3.86 2.91 -2.49 -1.66
PB2 5 4.44 4.44 2.84 2.84 -1.60 -1.59
PB3 5 4.38 4.38 3.11 3.11 -1.30 -1.27
PB4 5 4.03 4.03 3.13 3.13 -0.89 -0.89
PB5 7* 5.35 3.90 4.50 3.33 -0.85 -0.57
PB6 7* 6.01 4.34 5.43 3.95 -0.58 -0.39
PB7 7* Not
available
Not
available
Not
available
Not
available
-0.43 -0.43
Total
Average
Public
4.28 0.23
7 3.22
0.36
6 -1.06 0.5
PR1 5 4.03 4.03 3.51 3.51 -0.52 -0.52
PR2 9* 7.12 3.69 4.56 2.57 -2.56 -1.13
PR3 9* 7.10 3.68 4.28 2.44 -2.81 -1.24
Total
Average
Private
3.80 0.16
3 2.84
0.47
7 -0.96
0.31
7
*NB: conversion formula was used to calculate 7 and 9 Likert Scale to a 5 point scale.
newscore = (1+ 2/3(oldscore-1)) for the 7 Likert Scale [6 parts for 7 scale to 4 parts for 5 scale]
newscore = (1+ 1/2(oldscore-1)) for the 9 Likert Scale [8 parts for 9 scale to 4 parts for 5 scale]
Interpretation:
With all 10 HEIs, each expectation exceeds perception of the services provided. This is
interpreted as the primary stakeholders (i.e., the students) in all of the examined HEIs do not
have a met expectation. As such, the findings showed unmet expectations as perceived by
students. When perception scale was subtracted from the expectation scale, a negative
measurement is obtained, indicating a presence of a gap, which means the students’ perceive
the service provided at a lesser level than what they would expect. None of the HEIs (i.e.,
private or public) has met expectations. All of them had a negative gap when P - E was
calculated.
Comparing the total average Expectation of the students of public HEI with that of the
Expectations of students of private HEIs, the public HEI showed a higher value; this means
that the total Expectation of students from public HEIs is greater than that of the total
Expectation of students from private HEIs.
Such a higher result was not expected as students pay for private institutions and thus they
tend to expect more.
Revija za univerzalno odličnost / Journal of Universal Excellence, Članek / Article
November 2018, leto / year 2018, številka / number 4, str. / pp. 160–179.
170
4.2 Triangulation of the Highest and Lowest Rank for Expectations
Another triangulation comparison was conducted regarding the highest and lowest rank for
expectation. The ranking of the five-quality dimension: tangibles, reliability, responsiveness,
assurance, and empathy are a finding in each of the studies. In each study, the findings
included the quality dimension of one or more of the five that needed prioritized
improvement. The quality dimension that had the most significant negative gap number was
the one selected in ranking as number one, then followed by a list of five that were ranked,
consecutively for the remaining quality dimensions. The same was completed for the
expectation and perception measurements. In this research, the results for each HEI was
collected and tabulated. It was also triangulated and compared in each aspect of expectation,
perception, and gap. Table 4, 5, and 6 presented the comparison of all 10 HEIs.
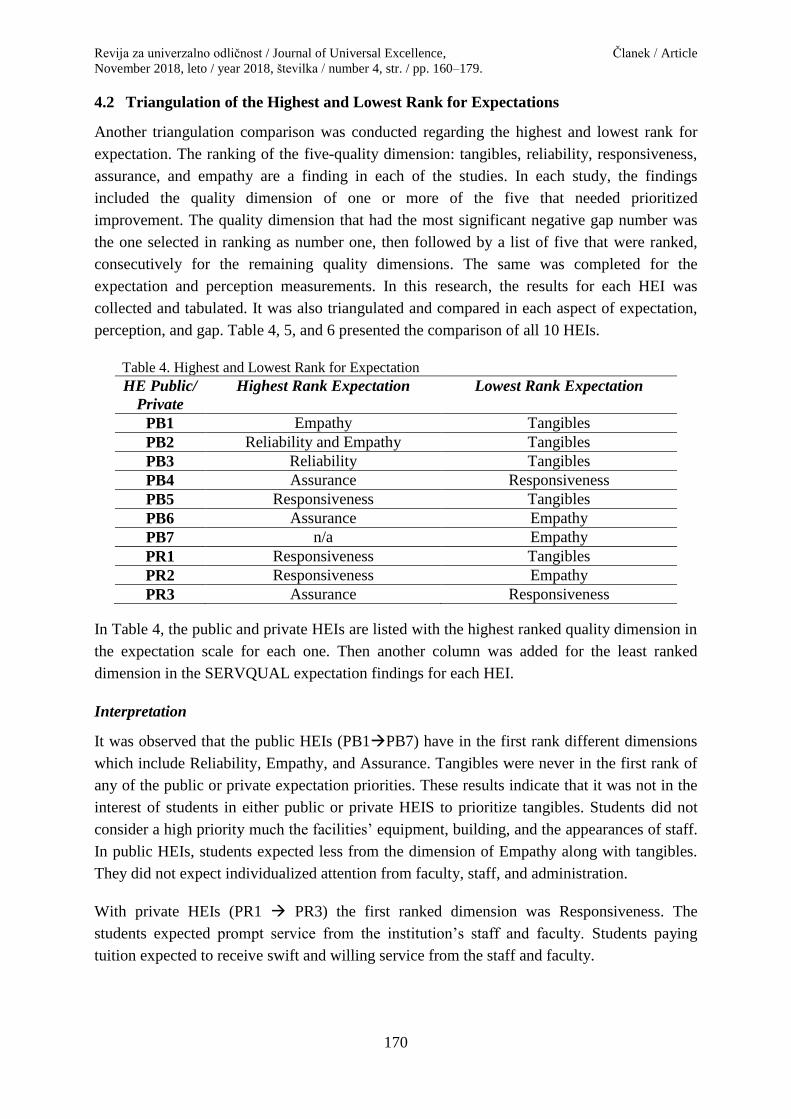
Table 4. Highest and Lowest Rank for Expectation
HE Public/
Private
Highest Rank Expectation Lowest Rank Expectation
PB1 Empathy Tangibles
PB2 Reliability and Empathy Tangibles
PB3 Reliability Tangibles
PB4 Assurance Responsiveness
PB5 Responsiveness Tangibles
PB6 Assurance Empathy
PB7 n/a Empathy
PR1 Responsiveness Tangibles
PR2 Responsiveness Empathy
PR3 Assurance Responsiveness
In Table 4, the public and private HEIs are listed with the highest ranked quality dimension in
the expectation scale for each one. Then another column was added for the least ranked
dimension in the SERVQUAL expectation findings for each HEI.
Interpretation
It was observed that the public HEIs (PB1PB7) have in the first rank different dimensions
which include Reliability, Empathy, and Assurance. Tangibles were never in the first rank of
any of the public or private expectation priorities. These results indicate that it was not in the
interest of students in either public or private HEIS to prioritize tangibles. Students did not
consider a high priority much the facilities’ equipment, building, and the appearances of staff.
In public HEIs, students expected less from the dimension of Empathy along with tangibles.
They did not expect individualized attention from faculty, staff, and administration.
With private HEIs (PR1 PR3) the first ranked dimension was Responsiveness. The
students expected prompt service from the institution’s staff and faculty. Students paying
tuition expected to receive swift and willing service from the staff and faculty.
Revija za univerzalno odličnost / Journal of Universal Excellence, Članek / Article
November 2018, leto / year 2018, številka / number 4, str. / pp. 160–179.
171
4.3 Triangulation of the Highest and Lowest Rank for Perception
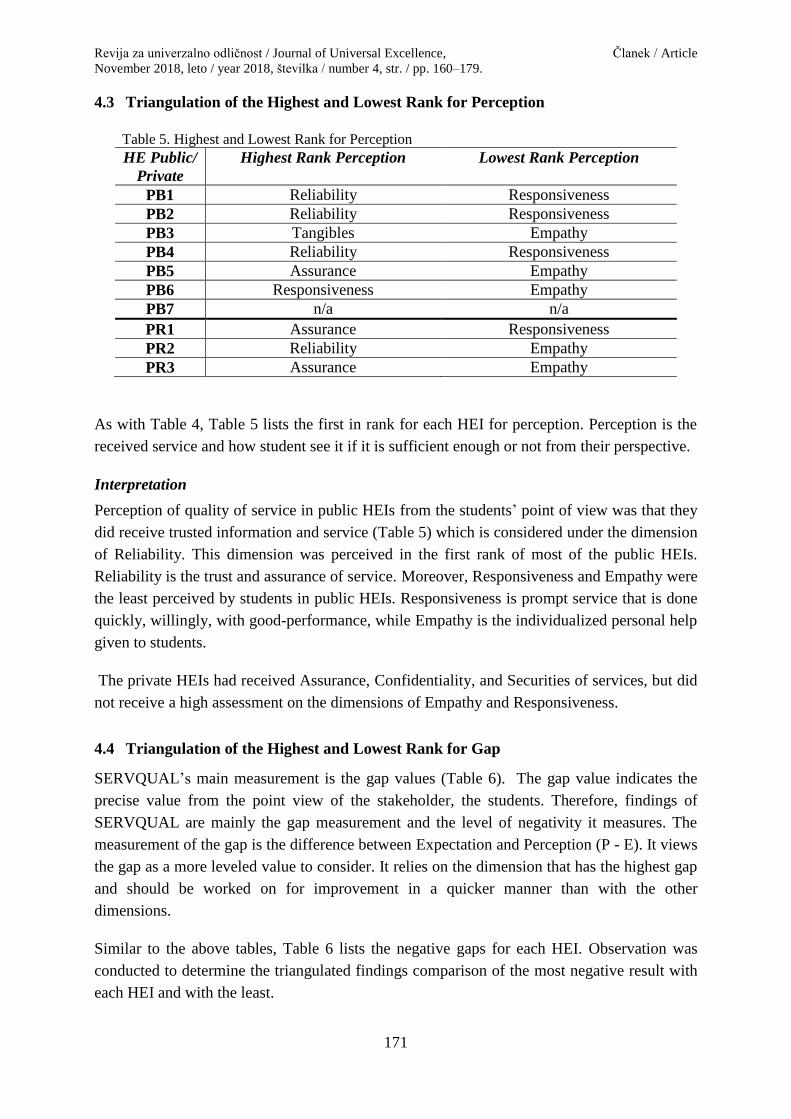
Table 5. Highest and Lowest Rank for Perception
HE Public/
Private
Highest Rank Perception Lowest Rank Perception
PB1 Reliability Responsiveness
PB2 Reliability Responsiveness
PB3 Tangibles Empathy
PB4 Reliability Responsiveness
PB5 Assurance Empathy
PB6 Responsiveness Empathy
PB7 n/a n/a
PR1 Assurance Responsiveness
PR2 Reliability Empathy
PR3 Assurance Empathy
As with Table 4, Table 5 lists the first in rank for each HEI for perception. Perception is the
received service and how student see it if it is sufficient enough or not from their perspective.
Interpretation
Perception of quality of service in public HEIs from the students’ point of view was that they
did receive trusted information and service (Table 5) which is considered under the dimension
of Reliability. This dimension was perceived in the first rank of most of the public HEIs.
Reliability is the trust and assurance of service. Moreover, Responsiveness and Empathy were
the least perceived by students in public HEIs. Responsiveness is prompt service that is done
quickly, willingly, with good-performance, while Empathy is the individualized personal help
given to students.
The private HEIs had received Assurance, Confidentiality, and Securities of services, but did
not receive a high assessment on the dimensions of Empathy and Responsiveness.
4.4 Triangulation of the Highest and Lowest Rank for Gap
SERVQUAL’s main measurement is the gap values (Table 6). The gap value indicates the
precise value from the point view of the stakeholder, the students. Therefore, findings of
SERVQUAL are mainly the gap measurement and the level of negativity it measures. The
measurement of the gap is the difference between Expectation and Perception (P - E). It views
the gap as a more leveled value to consider. It relies on the dimension that has the highest gap
and should be worked on for improvement in a quicker manner than with the other
dimensions.
Similar to the above tables, Table 6 lists the negative gaps for each HEI. Observation was
conducted to determine the triangulated findings comparison of the most negative result with
each HEI and with the least.
Revija za univerzalno odličnost / Journal of Universal Excellence, Članek / Article
November 2018, leto / year 2018, številka / number 4, str. / pp. 160–179.
172
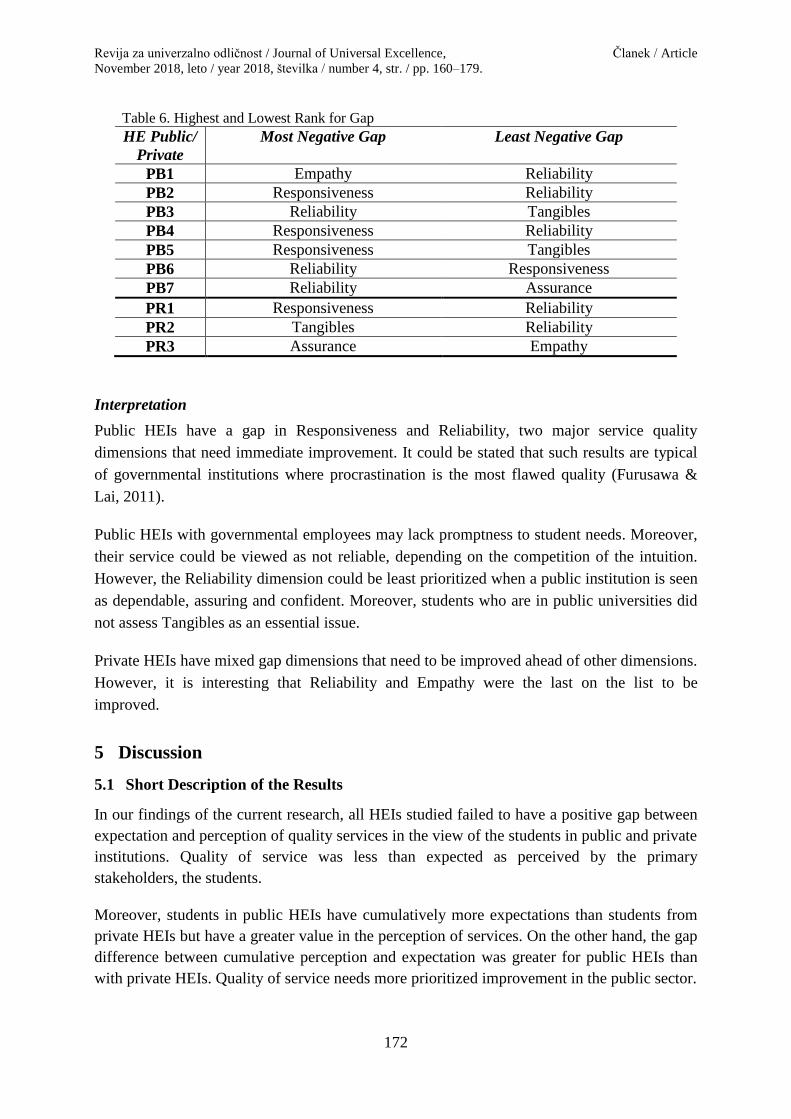
Table 6. Highest and Lowest Rank for Gap
HE Public/
Private
Most Negative Gap Least Negative Gap
PB1 Empathy Reliability
PB2 Responsiveness Reliability
PB3 Reliability Tangibles
PB4 Responsiveness Reliability
PB5 Responsiveness Tangibles
PB6 Reliability Responsiveness
PB7 Reliability Assurance
PR1 Responsiveness Reliability
PR2 Tangibles Reliability
PR3 Assurance Empathy
Interpretation
Public HEIs have a gap in Responsiveness and Reliability, two major service quality
dimensions that need immediate improvement. It could be stated that such results are typical
of governmental institutions where procrastination is the most flawed quality (Furusawa &
Lai, 2011).
Public HEIs with governmental employees may lack promptness to student needs. Moreover,
their service could be viewed as not reliable, depending on the competition of the intuition.
However, the Reliability dimension could be least prioritized when a public institution is seen
as dependable, assuring and confident. Moreover, students who are in public universities did
not assess Tangibles as an essential issue.
Private HEIs have mixed gap dimensions that need to be improved ahead of other dimensions.
However, it is interesting that Reliability and Empathy were the last on the list to be
improved.
5 Discussion
5.1 Short Description of the Results
In our findings of the current research, all HEIs studied failed to have a positive gap between
expectation and perception of quality services in the view of the students in public and private
institutions. Quality of service was less than expected as perceived by the primary
stakeholders, the students.
Moreover, students in public HEIs have cumulatively more expectations than students from
private HEIs but have a greater value in the perception of services. On the other hand, the gap
difference between cumulative perception and expectation was greater for public HEIs than
with private HEIs. Quality of service needs more prioritized improvement in the public sector.
Revija za univerzalno odličnost / Journal of Universal Excellence, Članek / Article
November 2018, leto / year 2018, številka / number 4, str. / pp. 160–179.
173
The dimensions of quality of service: Tangibles, Reliability, Responsiveness, Assurance, and
Empathy were ranked for each HEI in the studies examined. Findings of the first in rank of
quality dimension in each institution revealed that the expectation of students in public HEIs
constitutes mainly with Reliability, Empathy, and Assurance. Tangibility is a dimension both
in private and public sector that had no priority. Private institutions’ first in rank was the
Responsiveness dimension.
5.2 Discussing the Results & Research Question
The perception first in rank in public HEIs was Reliability. Students at public HEIs receive a
better reliability quality of service in their perception, but less quality in Responsiveness and
Empathy. Private HEI students, on the other hand, had perceived Assurance as number one
for service and Empathy as the last ranking.
Reliability and Responsiveness have the highest ranking in the gap of service in public
institutions. Both of these quality dimensions are needed to be improved and prioritized. Gap
of service is the difference between perception and expectation of quality of service from the
main stakeholders of the HEIs, the students. At the same time, Reliability was the least ranked
dimension in certain public and private HEIs. As such, based on the findings from this study,
public HEIs have shown a trend in specific dimensions that commonly needs improvement.
5.3 Authors’ Opinion
Outside features of private and public institutions can be easily spotted; however service
quality is not as easy to determine. The dimension of service quality remains questionable
with the lack of proof to whether service is provided as expected from its customers.
SERVQUAL helps in providing additional evidence with indications of which dimension of
quality to improve.
6 Conclusion
6.1 Summary of the Results
In conclusion, findings from the dataset revealed that students’ Perception was less than the
Expectation in the quality of service provided. Public HEIs need to consider Reliability and
Responsiveness as a priority and along with the other dimensions to improve service quality.
SERVQUAL could be used to examine and measure students’ perspective, measure it
periodically, and the findings into the strategic objectives of higher education.
6.2 Contribution to the Profession
Service quality in higher education is a valuable competitive asset. As public and private
HEIs are flourishing in numbers, their quality has to be in perspective to enhance and
maintain competitiveness. Students’ point of view has to be considered in the strategic plan of
higher education institutions as quality is defined in achieving strategic goals and
incorporated stakeholders’ perspective in the strategic management of an organization.
Revija za univerzalno odličnost / Journal of Universal Excellence, Članek / Article
November 2018, leto / year 2018, številka / number 4, str. / pp. 160–179.
174
6.3 Influence on Managers, Management and Organizations
Public HEIs have a shared context that differs from private HEIs. In this research, an attempt
was made to see which quality dimensions are in priority to be improved by public HEIs.
These results help the government and management of these institutions to make more
educated choices of incorporating these dimensions in their strategic planning. Moreover,
students always want reliable and responsive services from HEIs. Other quality service
dimensions are needed as well. Student perception of quality service means incorporating all
dimensions of service quality with the prominence of reliability and responsiveness in their
strategic objectives.
6.4 Research Limitations
Limitations of the study are concerned mostly with the different data collected among
different HEIs in different geographical regions. Triangulation of the same scale excluded
many related studies which used different scale measures or further specified quality
dimensions yielding fewer studies that could be triangulated.
6.5 Suggestions for Further Research
Further research considering SERVQUAL needs to be conducted in the same country with
identical questionnaires for both public and private HEIs. Namely to parallel the findings as
well as to conduct the study intermittently to measure the progress and change, which
occurred overtime with HEIs.
References
1. Abari, A. A. F., Yarmohammadian, M. H., & Esteki, M. (2011). Assessment of quality of
education a non-governmental university via SERVQUAL model. Procedia-Social and
Behavioral Sciences, 15, 2299-2304. doi:10.1016/j.sbspro.2011.04.097
2. Abdullah, F. (2006). Measuring service quality in higher education: HEdPERF versus
SERVPERF. Marketing Intelligence & Planning, 24(1), 31–47. doi: 10.1108/026345
00610641543
3. Aghamolaei, T., & Zare, S. (2008). Quality gap of educational services in viewpoints of students
in Hormozgan University of medical sciences. BMC Medical Education, 8(1), 34.
doi:10.1186/1472-6920-8-34
4. Berry, L. L., Zeithaml, V. A., & Parasuraman, A. (1990). Five imperatives for improving service
quality. MIT Sloan Management Review, 31(4), 29–38.
5. Buttle, F. (1996). SERVQUAL: review, critique, research agenda. European Journal of
marketing, 30(1), 8–32.
6. Castleberry, S. B., & McIntyre, F. S. (2011). Consumers quality evaluation process. Journal of
Applied Business Research (JABR), 8(3), 74–82.
7. Çerri, S. (2012). Assessing the quality of higher education services using a modified SERVQUAL
scale. Annales Universitatis Apulensis: Series Oeconomica, 14(2), 664–679.
8. Çerri, S. (2014). Service Quality in Higher Education a Students’ perspective. In ICRAE2014
Conference- Paper Proceedings. Paper presented at the The 2 nd International Conference on
Research and Educatıon - “Challenges Toward the Future” (ICRAE2014). Shkodra,, Albania:
University of Shkodra “Luigj Gurakuqi”. Retrieved from
http://konferenca.unishk.edu.al/icrae2014/cd/pdfdoc/333.pdf
Revija za univerzalno odličnost / Journal of Universal Excellence, Članek / Article
November 2018, leto / year 2018, številka / number 4, str. / pp. 160–179.
175
9. De Oliveira, O. J., & Ferreira, E. C. (2009, May). Adaptation and application of the SERVQUAL
scale in higher education. In Proceedings of POMS 20th Annual Conference Orlando, Florida
USA. Paper presented at the Proceedings of POMS 20th Annual Conference Orlando, Florida
USA.
10. Đonlagić, S., & Fazlić, S. (2015). Quality assessment in higher education using the SERVQUAL
model. Management: journal of contemporary management issues, 20(1), 39–57.
11. Furusawa, T., & Lai, E. (2011). A theory of government procrastination. CESifo Working Paper
Series No. 3680. Available at SSRN: https://ssrn.com/abstract=1975750
12. Grönroos, C. (1984). A service quality model and its marketing implications. European Journal of
marketing, 18(4), 36–44. doi:10.1108/EUM0000000004784
13. Kettunen, J. (2012). Integrated Higher Education Management: Summary of Management
Approaches, In Quality Assurance and Management, Prof. Mehmet Savsar (Ed.), ISBN: 978-953-
51-0378-3, InTech, Available from: http://www.intechopen.com/books/quality-assurance-and-
management/integrated-higher-educationmanagement-summary-of-management-approaches
14. Kilbourne, W. E., Duffy, J. A., Duffy, M., & Giarchi, G. (2004). The applicability of SERVQUAL
in cross-national measurements of health-care quality. Journal of Services Marketing, 18(7), 524–
533. doi:10.1108/08876040410561857
15. Ladhari, R. (2009). A review of twenty years of SERVQUAL research. International journal of
quality and service sciences, 1(2), 172–198.
16. Lam, S. S., & Woo, K. S. (1997). Measuring service quality: a test-retest reliability investigation
of SERVQUAL. International Journal of Market Research, 39(2), 381–396.
17. Legčević, J. (2010). Quality gap of educational services in viewpoints of students. Ekonomska
Misao i Praksa(2), 279–298.
18. Mohammadi, A., & Mohammadi, J. (2014). Educational Service Quality in Zanjan University of
Medical Sciences from Students' Point of View. World Journal of Education, 4(5), 86–93.
19. Parasuraman, A., Berry, L. L., & Zeithaml, V. A. (1991). Refinement and reassessment of the
SERVQUAL scale. Journal of retailing, 67(4), 420–450.
20. Parasuraman, A., Zeithaml, V. A., & Berry, L. L. (1985). A conceptual model of service quality
and its implications for future research. Journal of Marketing, 49(4), 41–50. doi 10.2307/1251430
21. Parasuraman, A., Zeithaml, V. A., & Berry, L. L. (1988). SERVQUAL-A multiple-item scale for
measuring consumer perceptions of service quality. Journal of retailing, 64(1), 12–40.
22. Pariseau, S. E., & McDaniel, J. (1997). Assessing service quality in schools of business.
International Journal of Quality & Reliability Management, 14(3), 204–218.
doi:10.1108/02656719710165455
23. Quester, P., & Romaniuk, S. (1997). Service quality in the Australian advertising industry: a
methodological study. Journal of Services Marketing, 11(3), 180–192.
doi:10.1108/08876049710168672
24. Sánchez Pérez, M., Carlos Gázquez Abad, J., María Marín Carrillo, G., & Sánchez Fernández, R.
(2007). Effects of service quality dimensions on behavioural purchase intentions: A study in
public-sector transport. Managing Service Quality: An International Journal, 17(2), 134–151.
doi:10.1108/09604520710735164
25. Ulewicz, R. (2014). Application of Servqual method for evaluation of quality of educational
services at the university of higher education. Polish Journal of Management Studies, 9, 254–264.
26. Yousapronpaiboon, K. (2014). SERVQUAL: Measuring higher education service quality in
Thailand. Procedia-Social and Behavioral Sciences, 116, 1088–1095.
27. Zeithaml, V. A. (1988). Consumer perceptions of price, quality, and value: a means-end model
and synthesis of evidence. the Journal of Marketing, 2–22.
28. Zeithaml, V. A., Berry, L. L., & Parasuraman, A. (1993). The nature and determinants of customer
expectations of service. Journal of the academy of Marketing Science, 21(1), 1–12.
Revija za univerzalno odličnost / Journal of Universal Excellence, Članek / Article
November 2018, leto / year 2018, številka / number 4, str. / pp. 160–179.
176
Appendix A: Questionnaire SERVQUAL adapted to higher education
Revija za univerzalno odličnost / Journal of Universal Excellence, Članek / Article
November 2018, leto / year 2018, številka / number 4, str. / pp. 160–179.
177
Appendix B: Example of Data Tabulation
Revija za univerzalno odličnost / Journal of Universal Excellence, Članek / Article
November 2018, leto / year 2018, številka / number 4, str. / pp. 160–179.
178
Povzetek:
Merjenje kakovosti storitev visokošolskih zavodov z modelom SERVQUAL
Raziskovalno vprašanje (RV): V tej raziskovalni analizi smo uporabili orodje SERVQUAL za merjenje
kakovosti storitev visokošolskih zavodov (HEIs). Visokošolske zavode smo primerjali z namenom, da
ugotovimo, katere so tiste dimenzije kakovosti storitev, ki so potrebne izboljšav v javnih visokošolskih
zavodih ter pri zasebnih visokošolskih zavodih. Natančneje smo preučili ali obstajajo skupni trendi pri
določeni dimenziji kakovosti storitev, ki jih študentje niso pričakovali in jih tudi manj zaznali.
Namen: Kakovost storitev visokošolskih zavodov je pomemben vidik, ki zagotavlja konkurenčnost in
privlačnost na trgu. Študenti so primarni deležniki, zato morajo biti njihova pričakovanja in zaznavanje
kakovosti storitev strateški cilj visokošolskega zavoda. Javni visokošolski zavodi imajo drugačno
strategijo od zasebnih visokošolskih zavodov. V tej raziskavi smo preučevali to razliko z namenom
ugotoviti ali se odraža v določeni dimenziji kakovosti storitev.
Metoda: Raziskava temelji na primerjalnem pregledu raziskovalnih študij, kjer se je uporabljal
instrument SERVQUAL za merjenje kakovosti storitev v visokošolskih zavodih. Rezultati, pridobljeni s
pregledom literature, so bili triangulirani in analizirani za dimenzije kakovosti storitev, ki so bile skupne
pri javnih visokošolskih zavodih in so potrebni izboljšav.
Rezultati: Percepcija študentov pri zagotavljanju kakovosti storitev je bila nižja od pričakovanega. Javni
visokošolski zavodi bi morali prednostno obravnavati zanesljivost in odzivnost ter skupaj z drugimi
dimenzijami izboljšati kakovosti storitev. SERVQUAL se lahko uporablja za preučevanje in merjenje
perspektive študentov, periodično merjenje ter za uresničitev strateških ciljev visokošolskega
izobraževanja.
Organizacija in družba: Vpliv raziskave na organizacije in družbo je predvsem pri visokošolskih
zavodih, njihovih vodstvenih delavcih ter njihovih načrtih in ciljih za izboljšanje kakovosti.
Originalnost: Ugotovitve na podlagi merilnega orodja SERVQUAL smo primerjali med
različnimi visokošolskimi zavodi s pregledom literature s triangulacijskimi tehnikami.
Omejitve/nadaljnje raziskovanje: Omejitve raziskave se nanašajo predvsem na različne podatke, zbrane
med različnimi visokošolskimi ustanovami, v različnih geografskih regijah. Triangulacija istega obsega je
izključila številne povezane študije, ki so uporabile drugačna merilna orodja oz. dodatne dimenzije
kakovosti, kar je onemogočalo vključevanje več raziskav, ki bi se lahko triangulirale. Nadaljnje raziskave
bi lahko potekale z zbiranjem podatkov o javnih in zasebnih visokošolskih zavodih v isti regiji in času ter
nato ponovitev v različnih časovnih presledkih, z namenom preučevanja napredka oz. spremembe.
Ključne besede: SERVQUAL, visoko šolstvo, javne visokošolske ustanove, triangulacija, kakovost
storitev, strateški cilji, percepcije študentov, pričakovanja študentov.
***
Katia Saliba (Katia Saliba is a Registered Medical Laboratory Technologist who lives currently in Beirut,
Lebanon and works as an instructor in the Lebanese University at the Faculty of Public Health. She is a Quality
Auditor with the Ministry of Public Health of Lebanon for Hospitals and Pharmaceutical warehouses as an
independent assessor. Katia is a member of the Canadian IQMH Institute for Quality Management in Healthcare
and had participated in the updating of the Lebanese accreditation standards for Hospitals as an expert. She is an
active part of the quality team for the accreditation of the Lebanese University. Katia is currently following her
studies in PhD of Science in the field of Quality Management at the Faculty of Organisation Studies in Novo
mesto, Slovenia.)
***
Annmarie Gorenc Zoran (Annmarie Gorenc Zoran, PhD is an Associate Professor at the Faculty of
Organisation Studies in Novo mesto as well as teaches distance learning courses at the University of South
Florida. She has published book chapters, numerous articles, and presented at international, national, and
regional conferences. Her research interests are interdisciplinary in quality education, knowledge transfer,
language learners in the classroom, competences, research methodology, teaching methods, and distance
learning). ***
Revija za univerzalno odličnost / Journal of Universal Excellence, Članek / Article
November 2018, leto / year 2018, številka / number 4, str. / pp. 160–179.
179
Copyright (c) Katia SALIBA, Annmarie GORENC ZORAN
Creative Commons License This work is licensed under a Creative Commons Attribution-ShareAlike 4.0 International License.