measuring flow in gamification: dispositional flow scale-2
TRANSCRIPT
Computers in Human Behavior 40 (2014) 133–143
Contents lists available at ScienceDirect
Computers in Human Behavior
journal homepage: www.elsevier .com/locate /comphumbeh
Measuring flow in gamification: Dispositional Flow Scale-2
http://dx.doi.org/10.1016/j.chb.2014.07.0480747-5632/� 2014 Elsevier Ltd. All rights reserved.
⇑ Corresponding author at: Game Research Lab, School of Information Sciences,FIN-33014 University of Tampere, Finland. Tel.: +358 50 318 6861.
E-mail addresses: [email protected] (J. Hamari), [email protected](J. Koivisto).
1 Tel.: +358 45 126 5525.
Juho Hamari a,b,⇑, Jonna Koivisto a,1
a Game Research Lab, School of Information Sciences, FIN-33014 University of Tampere, Finlandb Department of Information and Service Economy, Aalto University School of Business, P.O. Box 21220, 00076 Aalto, Finland
a r t i c l e i n f o
Article history:
Keywords:FlowDFS-2GamificationGames for healthExergamesPersuasive technology
a b s t r a c t
This paper measures flow in the context of gamification and investigates the psychometric properties ofthe Dispositional Flow Scale-2 (DFS-2). We employ data gathered from users of an exercise gamificationservice (N = 200). The results show that the original DFS-2 factorial structure does result in a similarmodel fit as the original work. However, we also present a factorial respecification that satisfies morerecent model fit thresholds. Beyond validating the original DFS-2 instrument in the context of gamifica-tion, the psychometric analysis and the respecifications suggest that the components of flow divide intohighly correlated conditions of flow (which were also found to be more salient in the context ofgamification: autotelic experience, balance of skill and challenge, control, clear goals, and feedback) andinto possible outcomes (merging action-awareness, concentration, loss of sense of time, and loss of self-consciousness) from achieving flow.
� 2014 Elsevier Ltd. All rights reserved.
1. Introduction
The flow state has been widely used to describe an optimal expe-rience characterized as a state of being fully focused and engaged inan activity (Csíkszentmihályi, 1975, 1990). Csíkszentmihályi (1990)initially defined flow as an experience, which is likely to occurwhen the demands of the task and the abilities of the performerare balanced. In other words, the individual performs at the heightof their skills, and the task is optimally challenging (Nakamura &Csíkszentmihályi, 2002). Since then, the theoretical constitutesand measurement instruments for flow have become more refined.Current factorial structures for flow measurement have convergedto contain nine dimensions (Csíkszentmihályi, 1990; Fu, Su, & Yu,2009; Jackson & Eklund, 2002), although the constructs mightslightly differ qualitatively between models. Flow is regarded asan especially pertinent experience for challenging activities whereindividual skill and concentration are important, such as in sports(Csíkszentmihályi, 1990; Jackson & Eklund, 2002) and in games(Hsu & Lu, 2004). The Dispositional Flow Scale-2 (Jackson &Eklund, 2002) is currently one of the most used measurementinstruments for flow. Thus far, the psychometric properties of theDispositional Flow Scale-2 (DFS-2) have been investigated in both
the context of exercise (Jackson & Eklund, 2002; Kimiecik &Jackson, 2002) as well as in video gaming (Procci, Singer, Levy, &Bowers, 2012; Wang, Liu, & Khoo, 2009). The psychometric proper-ties of DFS-2 have been found to be acceptable in both contexts;albeit more varied in the context of video gaming.
Recently, the contexts of exercise and video gaming have beenincreasingly converging through introduction of game design intoa variety of exercise and health related activities. In general terms,this development is referred to as ‘‘gamification’’ (Deterding,Dixon, Khaled, & Nacke, 2011; Hamari, 2013; Hamari, Huotari, &Tolvanen, 2014; Hamari & Lehdonvirta, 2010; Huotari & Hamari,2012; McGonigal, 2011), which refers to computers/technologybeing used to affect people’s motivations and behavior throughgame-like systems. Due to gamification and the general prolifera-tion of video games in contemporary society, people are believedto be increasingly engaging in activities that are more likely toinduce the flow state. Therefore, through gamification of commonactivities, being in a flow state could be increasingly relevant withrespect to everyday experiences. Especially, activities requiringperseverance and commitment from the individual, such as exer-cise, ecological consumption and education have widely been thetargets of using computer technologies in changing human behav-ior (e.g. gamification and persuasive technologies – Hamari,Koivisto & Sarsa, 2014; Hamari, Koivisto & Pakkanen, 2014). Com-puter-supported gamified services such as Nike+, Zombies, Run!,Fitocracy, and Runkeeper all aim at structuring, supporting andmotivating the exercise activities (see Hamari & Koivisto, 2013;Koivisto & Hamari, 2014) through the provision of optimally

134 J. Hamari, J. Koivisto / Computers in Human Behavior 40 (2014) 133–143
difficult challenges and feedback. Therefore, gamified exercise is aninteresting avenue for further flow research in addition to the sep-arate contexts of exercise and gaming which both have been dom-inant veins of flow research. However, currently there are nostudies investigating flow in the aforementioned computer-sup-ported gamified exercise and examining the applicability of cur-rent measurement instruments in this setting. Furthermore, forthe purposes of study of flow in gamification, validation of mea-surements instruments for furthering this vein of study is required.
This paper seeks to contribute to the vein of literature examin-ing the psychometric properties of flow measurement instruments(Jackson & Eklund, 2002; Procci et al., 2012; Wang et al., 2009). Inthis paper particularly, we investigate the psychometric propertiesof the Dispositional Flow Scale 2 (henceforth DFS-2) in the contextof the computer-supported gamification. We test model fit indices,validity and reliability of the original DFS-2 model by Jackson andEklund (2002) and the respecification made by Procci et al. (2012).Furthermore, we present our respecification of the scale in thestudied context. Findings of the study regarding the validity ofthe DFS-2 model in gamification of exercise are discussed.
2. Background
2.1. Flow
In his seminal work, Csíkszentmihályi (1990) studied athletes,artists and professionals in various fields in order to understandthe flow experience and its antecedents. Based on his findings, hedefined the following conditions for flow: (1) Perceived challengesof the activity match and stretch the capabilities of the individual,thus producing an experience of being fully engaged in the taskand acting on the height of his/her skills (Csíkszentmihályi, 1990;Nakamura & Csíkszentmihályi, 2002). (2) The goals of the activityare explicit and reachable, and one receives instant feedback forhis/her progress on the activity (Nakamura & Csíkszentmihályi,2002). To further describe the state of flow, Csíkszentmihályi(1990) defined the nine dimensions of flow which are commonto the experience: (1) a balance between the challenge of the taskand skills of the individual, (2) a merging of action and awareness,i.e. one performs the activity almost ‘‘automatically’’, (3) clear per-ceived goals, (4) unambiguous feedback, (5) focusing on the task athand, (6) a sense of control of the activity, (7) a loss of self-con-sciousness or a reduced awareness of self, (8) time transformation,i.e. sense of time becomes distorted, and (9) an autotelic, intrinsi-cally rewarding experience, implying that the activity in itself is areason for performing it instead of any external objectives(Csíkszentmihályi, 1990; Nakamura & Csíkszentmihályi, 2002).These nine dimensions have served as a basis for several measure-ment instruments (e.g. Fu et al., 2009; Jackson & Eklund, 2002) forcapturing the flow state and the conditions for experiencing it.
In contexts related to human behavior and computers, flow hasmost notably been studied in human–computer interaction(Webster, Trevino, & Ryan, 1994), video games (Hsu & Lu, 2004;Procci et al., 2012; Wang et al., 2009; Weibel, Wissmath,Habegger, Steiner, & Groner, 2008), instant messaging (Lu, Zhou,& Wang, 2009), mobile technologies (Chen, 2006), web sites in gen-eral (Skadberg & Kimmel, 2004), and game-based learning(Admiraal, Huizenga, Akkerman, & Dam, 2011; Fu et al., 2009).
2.2. DFS-2
Some of the most widely used measurement instruments forflow have been developed by Jackson and colleagues (Jackson &Eklund, 2002; Jackson & Marsh, 1996; Jackson, Martin, & Eklund,2008). The Flow State Scale (Jackson & Marsh, 1996) was designed
to examine the flow experience in a given situation, while the Dis-positional Flow Scale (DFS) (Jackson et al., 2008) assesses the ten-dency of experiencing flow (Jackson & Eklund, 2002). Both of themodels build on the nine dimensions of flow by Csíkszentmihályi(1990). Jackson and Eklund (2002) further refined the modelsand replaced some of the initial items of the DFS. The resulting ver-sion was titled DFS-2.
Since then, the DFS-2 has been widely applied especially to thestudy of various physical activities, education, arts and digital gam-ing. In the context of physical activity, the scale has been employedfor study of flow in, for example, recreational outdoor activities(Whitmore & Borrie, 2005), physical education (González-Cutre,Sicilia, Moreno, & Fernández-Balboa, 2009), among elite athletes(Hodge, Lonsdale, & Jackson, 2009), and various sports (Crust &Swann, 2013; Gucciardi, Gordon, & Dimmock, 2009; Jackson &Eklund, 2002; Jackson et al., 2008; Koehn, Morris, & Watt, 2013;Nicholls, Polman, & Holt, 2005). In other settings, the DFS-2 hasbeen applied for study of flow, for example, among musiciansand music students (Fritz & Avsec, 2007; Sinnamon, Moran &O’Connell, 2012) and in studying (Cermakova, Moneta, & Spada,2010).
Most pertinently to the scope of this paper, the model fit of theDFS-2 has been investigated in the contexts of online games (Wanget al., 2009) and video gaming (Procci et al., 2012). In their study,Wang et al. attempted to validate the adequacy of the instrumentin internet gaming. However, the DFS-2 did not provide an appro-priate model fit (Wang et al., 2009). Procci et al. (2012) sought tovalidate the scale in a video gaming setting. The hierarchical modeldid not yield sufficient model fit in their study either. Therefore,Procci et al. (2012) attempted to respecify the model, but the res-pecification also failed to meet the set standards for acceptablegoodness-of-fit. See Table 1 for the fit indices of the studies byWang et al. (2009) and Procci et al. (2012).
It should be noted, however, that both Wang et al. (2009) andProcci et al. (2012) had set the thresholds for Comparative Fit Index(henceforth CFI) and Non-Normed Fit Index (henceforth NNFI) at0.95, which is considered an excellent level for the index (Hu &Bentler, 1999). The thresholds are higher than the one used byJackson and Eklund (2002) in their validation of the instrument(see Table 1).
Currently, the research in the context of computer-supportedgamification is scarce. Both, the context of games and exercise havebeen regarded as one of the most likely contexts for people toexperience flow. Therefore, we believe that also the context ofgamified exercise affords an interesting area for studying it. Fur-thermore, flow is often discussed to be an important psychologicaltarget state pursued by gamification efforts (Huotari & Hamari,2012; McGonigal, 2011). However, as with all psychometric mea-surement, the validity of the instrument is of crucial importance(Jackson & Eklund, 2002; Procci et al., 2012) in capturing theresearched phenomenon. Thus, as the first step in conductingresearch on flow in gamification, the psychometric properties ofthe DFS-2 in a gamified setting will be examined.
3. The empirical study
3.1. Data
The data was gathered via an online questionnaire from theusers of a service called Fitocracy that gamifies exercise. At its core,Fitocracy enables their users to track exercise. The system does notcontain automatic tracking. Instead, the users enter the details oftheir activities into the service. The service contains a database ofexercises ranging from, for example, various physical outdoorand recreational activities to gym activities and sports. Depending

Table 1Goodness-of-fit indices of the DFS-2 validation studies.
Paper Context CFI/NNFI threshold foracceptable fit usedin the study
Specification N v2 df CFI NNFI RMSEA CI90 lo –hi/PCLOSE
Fit?*
Jackson & Eklund (2002) Physical activity* 0.90 First-order 574 1427.219 558 0.912 0.901 0.052 0.049, 0.055 YesSecond-order 574 1606.487 585 0.897 0.889 0.055 0.052, 0.058 Yes
Wang et al. (2009) Online gaming* 0.95 First-order 1578 1925.49 558 0.936 0.927 0.047 0.045, 0.049 NoSecond-order 1578 1522.58 548 0.954 0.947 0.040 0.038, 0.042 Yes
Procci et al. (2012) Video games* 0.95 Hierarchical(second-order)
314 1351.995 558 0.906 n/a 0.067 0.063, 0.072 No
Respecified 314 1348.158 539 0.901 n/a 0.069 0.065, 0.074 No
Indices: v2 = Chi Square, CFI = Comparative Fit Index, NNFI = Non-Normed Fit Index, RMSEA = Root Mean Square Error of Approximation, PCLOSE = p of close fit.* As reported in the original work.
J. Hamari, J. Koivisto / Computers in Human Behavior 40 (2014) 133–143 135
on the type of the activity, the user may enter the length, the inten-sity, the distance or the weights used in each exercise. As a gami-fying feature, the service calculates a point value which is based onan amount of points allocated to the given exercise and furtheradjusted according to the details of the user’s activity. For example,lifting heavier weights gives more points than lifting lighterweights, or swimming for 30 min gives more points than swim-ming for 20 min. Thus, the users gain points for each exercise theytrack in the service.
Table 2Length of experience, age, gender and exercise information of the respondent data.
Frequency PercentGender Len
Female 102 51 LesMale 98 49 1–Age (mean = 29.5, median = 27.5) 3–
Less than 20 9 4.5 6–20–24 51 25.5 9–25–29 54 27 1230–34 41 20.5 1535–39 22 11 Mo40–44 16 8 Exe
45–49 3 1.5 1–50 or more 4 2 5–
1015Exe
1–5–1015
Table 3The used thresholds for goodness-of-fit indices.
Indicator Excellent A
Model fit measureCFI >0.95 >NNFI >0.95 >RMSEA Good < 0.5, passable 0.5–1Validity & Reliability*
Square root of the AVEs Square root of the AVE of each construct < all correlationInter-correlations* No inter-correlations are higher than 0.9Item loadings Items are most highly loaded with the intended construc
CR > AVE > MSV > ASVAVE >0.5CR >0.7
Indices: CFI = Comparative Fit Index, NNFI = Non-Normed Fit Index, RMSEA = Root MeanExtracted, MSV = Maximum Shared Variance, ASV = Average Shared Variance.
* It should be noted that high inter-correlations between constructs might not in realtherefore are expected to be highly correlated.
Furthermore, users gain level-ups and unlock achievements (ongame achievements, see Hamari & Eranti, 2011) based on thepoints gained. Users can also perform quests by tracking an exer-cise that corresponds to a given set of conditions, or challengeother users into duels. In addition to the system giving feedbackto the users on their progress, the community members may pro-vide feedback to one another and communicate with each other.With features such as group-forming, profile-building, and contentsharing the service holds similarities with many social networking
Frequency Percentgth of experience
s than 1 month 24 123 months 38 196 months 29 14.5
9 months 26 1312 months 33 16.5–15 months 38 19–18 months 7 3.5re than 18 months 5 2.5rcise sessions per week (mean = 5.3, median = 5.0)
4 83 41.59 106 53.0–14 6 3.0or more 5 2.5rcise hours per week (mean = 7.2, median = 6.0)
4 51 25.59 99 49.5–14 40 20.0or more 10 5.0
cceptable Source
0.90 Hair et al. (2010), Hu and Bentler (1999)0.90
s between it and other constructs Fornell and Larcker (1981)Pavlou, Liang, and Xue (2007)
t Chin (1998)Hair et al. (2010)
Square Error of Approximation, CR = Composite Reliability, AVE = Average Variance
ity pose a problem since all the constructs are regarded as components of flow and

Challenge / Skill balance
Concentration
1 10 19 28
5 14 23 32
Merging action -
awareness
2 11 20 29
Clear goals
3 12 21 30
Feedback
4 13 22 31
Control
6 15 24 33
Loss of self- conciousness
7 16 25 34
Time
8 17 26 35
Autotelic experience
9 18 27 36
Deleted association Association Item Deleted itemConstruct Deleted construct (Arrows representing correlations between constructs are not featured in the figure)
Fig. 1. Original DFS-2 factorial structure.
136 J. Hamari, J. Koivisto / Computers in Human Behavior 40 (2014) 133–143
services (Baker & White, 2010; Boyd & Ellison, 2008; Lin & Lu,2011; Ellison, Steinfeld & Lampe, 2007; Pfeil, Arjan & Zaphiris,2009).
Table 4Step 1a: correlation table.
CR AVE MSV ASV T CSB
T 0.914 0.726 0.152 0.081 0.852CSB 0.841 0.573 0.762 0.476 0.266 0.757MAA 0.845 0.579 0.434 0.285 0.383 0.659G 0.847 0.583 0.805 0.515 0.233 0.873F 0.883 0.654 0.767 0.397 0.290 0.674C 0.902 0.699 0.677 0.404 0.290 0.750CTRL 0.886 0.660 0.805 0.499 0.230 0.860LSC 0.956 0.843 0.170 0.102 0.072 0.412A 0.884 0.659 0.637 0.389 0.390 0.786
The bolded figures represent the square roots of the AVE of the corresponding construcIndices: CR = Composite Reliability, AVE = Average Variance Extracted, MSV = MaximumConstructs: T = Time transformation, CSB = Challenge-Skill Balance, MAA = Merging ActLSC = Loss of Self Consciousness, A = Autotelic experience.
Challenge / Skill balance
Concentration
1 10 19 28
5 14 23 32
Merging action -
awareness
2 11 20 29
Control
6 15 24 33
Loss of sconciousn
7 16
Flow
Deleted association Association Item Deleted itConstruct Deleted construct
Fig. 2. Original DFS-2 s-ord
The data gathering was executed by posting a description of thestudy and the survey link to the discussion forum and groupswithin the service. Only registered users of the service were able
MAA G F C CTRL LSC A
0.7610.597 0.7630.494 0.876 0.8090.621 0.774 0.676 0.8360.584 0.897 0.802 0.823 0.8130.374 0.377 0.168 0.362 0.377 0.9180.481 0.798 0.705 0.577 0.767 0.232 0.812
ts.Shared Variance, ASV = Average Shared Variance.ion & Awareness, G = clear Goals, F = Feedback, C = Concentration, CTRL = Control,
Clear goals
3 12 21 30
Feedback
4 13 22 31
elf- ess
25 34
Time
8 17 26 35
Autotelic experience
9 18 27 36
em (Arrows representing correlations between constructs are not featured in the figure)
er factorial structure.
Challenge / Skill balance
Concentration
1 10 19 28
5 14 23 32
Merging action -
awareness
2 11 20 29
Clear goals
3 12 21 30
Feedback
4 13 22 31
Control
6 15 24 33
Loss of self- conciousness
7 16 25 34
Time
8 17 26 35
Autotelic experience
9 18 27 36
Mastery
Deleted association Association Item Deleted itemConstruct Deleted construct (Arrows representing correlations between constructs are not featured in the figure)
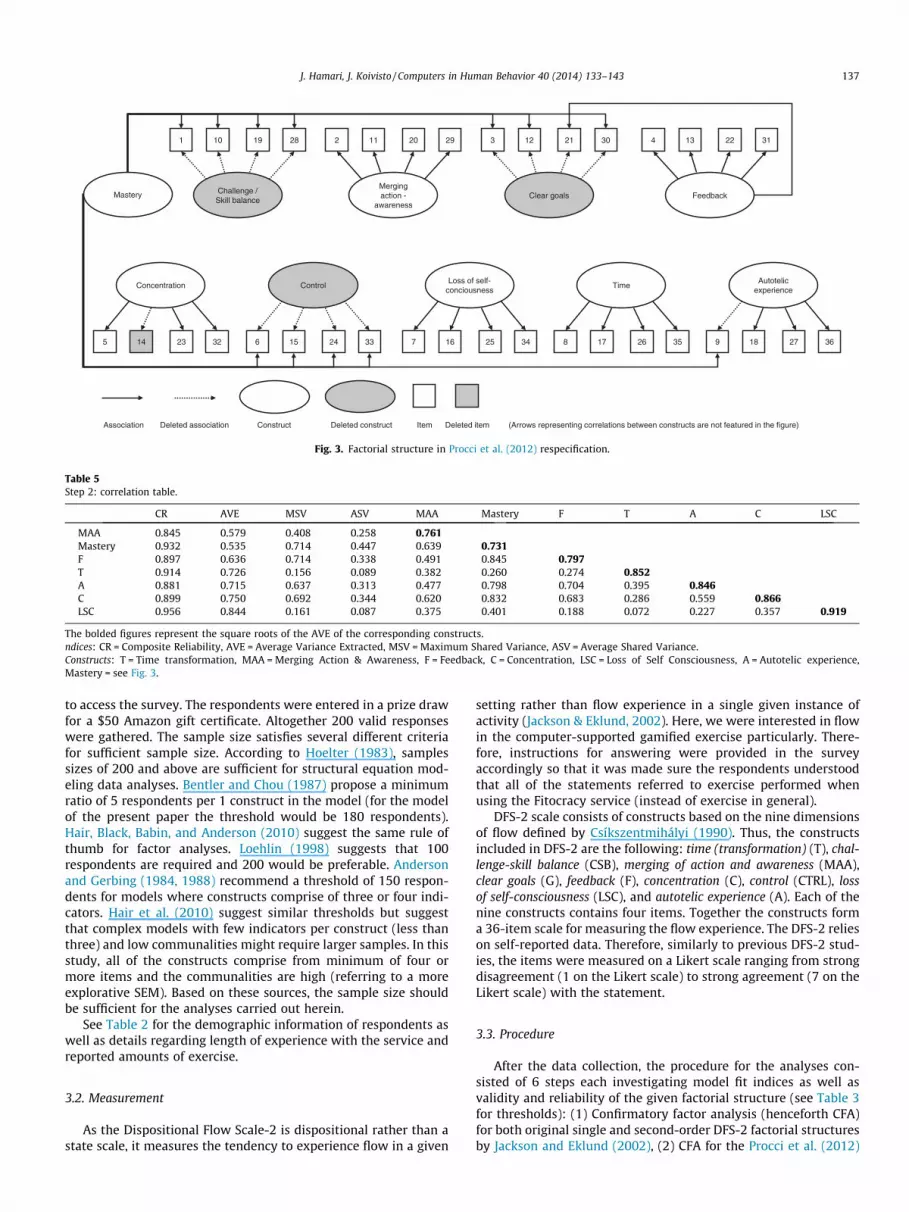
Fig. 3. Factorial structure in Procci et al. (2012) respecification.
Table 5Step 2: correlation table.
CR AVE MSV ASV MAA Mastery F T A C LSC
MAA 0.845 0.579 0.408 0.258 0.761Mastery 0.932 0.535 0.714 0.447 0.639 0.731F 0.897 0.636 0.714 0.338 0.491 0.845 0.797T 0.914 0.726 0.156 0.089 0.382 0.260 0.274 0.852A 0.881 0.715 0.637 0.313 0.477 0.798 0.704 0.395 0.846C 0.899 0.750 0.692 0.344 0.620 0.832 0.683 0.286 0.559 0.866LSC 0.956 0.844 0.161 0.087 0.375 0.401 0.188 0.072 0.227 0.357 0.919
The bolded figures represent the square roots of the AVE of the corresponding constructs.ndices: CR = Composite Reliability, AVE = Average Variance Extracted, MSV = Maximum Shared Variance, ASV = Average Shared Variance.Constructs: T = Time transformation, MAA = Merging Action & Awareness, F = Feedback, C = Concentration, LSC = Loss of Self Consciousness, A = Autotelic experience,Mastery = see Fig. 3.
J. Hamari, J. Koivisto / Computers in Human Behavior 40 (2014) 133–143 137
to access the survey. The respondents were entered in a prize drawfor a $50 Amazon gift certificate. Altogether 200 valid responseswere gathered. The sample size satisfies several different criteriafor sufficient sample size. According to Hoelter (1983), samplessizes of 200 and above are sufficient for structural equation mod-eling data analyses. Bentler and Chou (1987) propose a minimumratio of 5 respondents per 1 construct in the model (for the modelof the present paper the threshold would be 180 respondents).Hair, Black, Babin, and Anderson (2010) suggest the same rule ofthumb for factor analyses. Loehlin (1998) suggests that 100respondents are required and 200 would be preferable. Andersonand Gerbing (1984, 1988) recommend a threshold of 150 respon-dents for models where constructs comprise of three or four indi-cators. Hair et al. (2010) suggest similar thresholds but suggestthat complex models with few indicators per construct (less thanthree) and low communalities might require larger samples. In thisstudy, all of the constructs comprise from minimum of four ormore items and the communalities are high (referring to a moreexplorative SEM). Based on these sources, the sample size shouldbe sufficient for the analyses carried out herein.
See Table 2 for the demographic information of respondents aswell as details regarding length of experience with the service andreported amounts of exercise.
3.2. Measurement
As the Dispositional Flow Scale-2 is dispositional rather than astate scale, it measures the tendency to experience flow in a given
setting rather than flow experience in a single given instance ofactivity (Jackson & Eklund, 2002). Here, we were interested in flowin the computer-supported gamified exercise particularly. There-fore, instructions for answering were provided in the surveyaccordingly so that it was made sure the respondents understoodthat all of the statements referred to exercise performed whenusing the Fitocracy service (instead of exercise in general).
DFS-2 scale consists of constructs based on the nine dimensionsof flow defined by Csíkszentmihályi (1990). Thus, the constructsincluded in DFS-2 are the following: time (transformation) (T), chal-lenge-skill balance (CSB), merging of action and awareness (MAA),clear goals (G), feedback (F), concentration (C), control (CTRL), lossof self-consciousness (LSC), and autotelic experience (A). Each of thenine constructs contains four items. Together the constructs forma 36-item scale for measuring the flow experience. The DFS-2 relieson self-reported data. Therefore, similarly to previous DFS-2 stud-ies, the items were measured on a Likert scale ranging from strongdisagreement (1 on the Likert scale) to strong agreement (7 on theLikert scale) with the statement.
3.3. Procedure
After the data collection, the procedure for the analyses con-sisted of 6 steps each investigating model fit indices as well asvalidity and reliability of the given factorial structure (see Table 3for thresholds): (1) Confirmatory factor analysis (henceforth CFA)for both original single and second-order DFS-2 factorial structuresby Jackson and Eklund (2002), (2) CFA for the Procci et al. (2012)
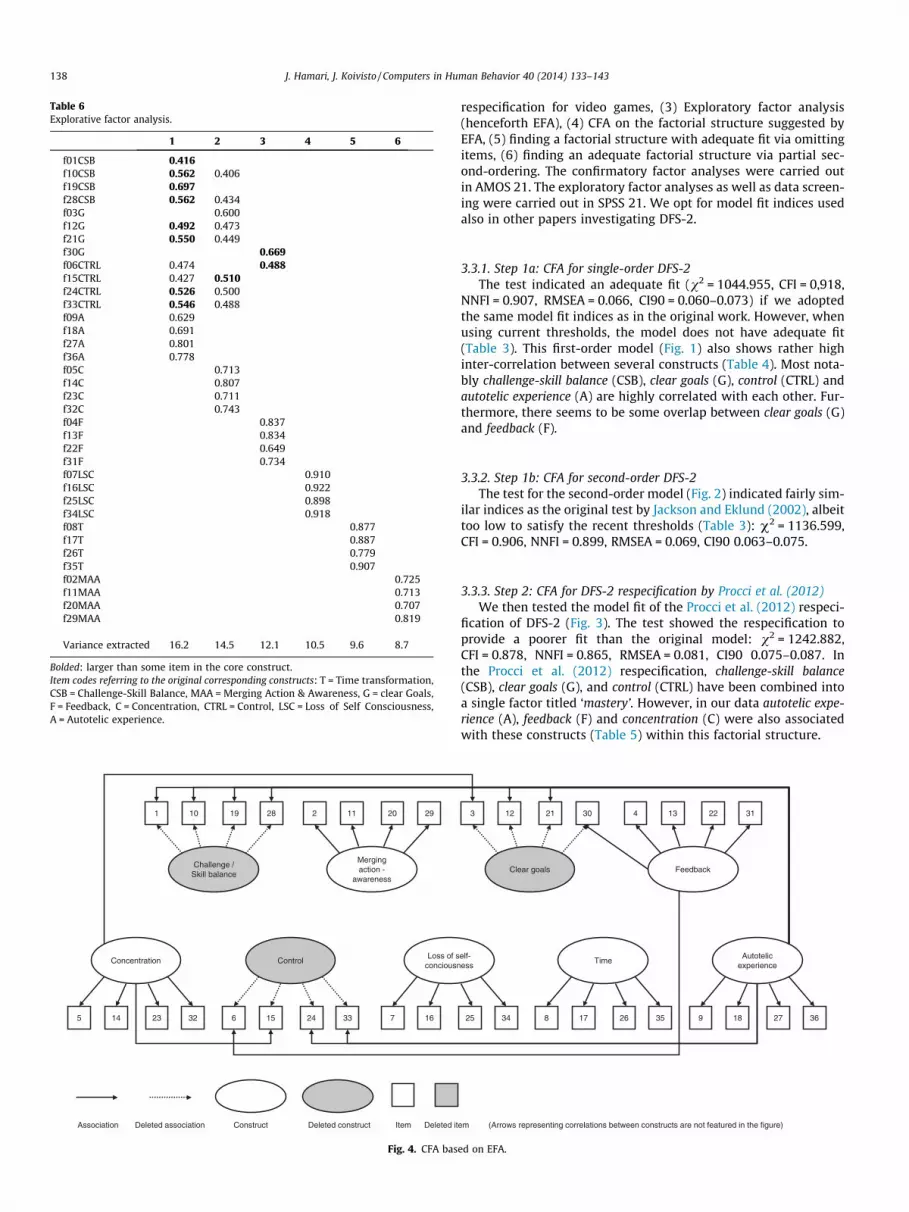
Table 6Explorative factor analysis.
1 2 3 4 5 6
f01CSB 0.416f10CSB 0.562 0.406f19CSB 0.697f28CSB 0.562 0.434f03G 0.600f12G 0.492 0.473f21G 0.550 0.449f30G 0.669f06CTRL 0.474 0.488f15CTRL 0.427 0.510f24CTRL 0.526 0.500f33CTRL 0.546 0.488f09A 0.629f18A 0.691f27A 0.801f36A 0.778f05C 0.713f14C 0.807f23C 0.711f32C 0.743f04F 0.837f13F 0.834f22F 0.649f31F 0.734f07LSC 0.910f16LSC 0.922f25LSC 0.898f34LSC 0.918f08T 0.877f17T 0.887f26T 0.779f35T 0.907f02MAA 0.725f11MAA 0.713f20MAA 0.707f29MAA 0.819
Variance extracted 16.2 14.5 12.1 10.5 9.6 8.7
Bolded: larger than some item in the core construct.Item codes referring to the original corresponding constructs: T = Time transformation,CSB = Challenge-Skill Balance, MAA = Merging Action & Awareness, G = clear Goals,F = Feedback, C = Concentration, CTRL = Control, LSC = Loss of Self Consciousness,A = Autotelic experience.
Challenge / Skill balance
Concentration
1 10 19 28
5 14 23 32
Merging action -
awareness
2 11 20 29
Control
6 15 24 33
Loss of sconciousn
7 16
Deleted association Association Item Deleted itConstruct Deleted construct
Fig. 4. CFA bas
138 J. Hamari, J. Koivisto / Computers in Human Behavior 40 (2014) 133–143
respecification for video games, (3) Exploratory factor analysis(henceforth EFA), (4) CFA on the factorial structure suggested byEFA, (5) finding a factorial structure with adequate fit via omittingitems, (6) finding an adequate factorial structure via partial sec-ond-ordering. The confirmatory factor analyses were carried outin AMOS 21. The exploratory factor analyses as well as data screen-ing were carried out in SPSS 21. We opt for model fit indices usedalso in other papers investigating DFS-2.
3.3.1. Step 1a: CFA for single-order DFS-2The test indicated an adequate fit (v2 = 1044.955, CFI = 0,918,
NNFI = 0.907, RMSEA = 0.066, CI90 = 0.060–0.073) if we adoptedthe same model fit indices as in the original work. However, whenusing current thresholds, the model does not have adequate fit(Table 3). This first-order model (Fig. 1) also shows rather highinter-correlation between several constructs (Table 4). Most nota-bly challenge-skill balance (CSB), clear goals (G), control (CTRL) andautotelic experience (A) are highly correlated with each other. Fur-thermore, there seems to be some overlap between clear goals (G)and feedback (F).
3.3.2. Step 1b: CFA for second-order DFS-2The test for the second-order model (Fig. 2) indicated fairly sim-
ilar indices as the original test by Jackson and Eklund (2002), albeittoo low to satisfy the recent thresholds (Table 3): v2 = 1136.599,CFI = 0.906, NNFI = 0.899, RMSEA = 0.069, CI90 0.063–0.075.
3.3.3. Step 2: CFA for DFS-2 respecification by Procci et al. (2012)We then tested the model fit of the Procci et al. (2012) respeci-
fication of DFS-2 (Fig. 3). The test showed the respecification toprovide a poorer fit than the original model: v2 = 1242.882,CFI = 0.878, NNFI = 0.865, RMSEA = 0.081, CI90 0.075–0.087. Inthe Procci et al. (2012) respecification, challenge-skill balance(CSB), clear goals (G), and control (CTRL) have been combined intoa single factor titled ‘mastery’. However, in our data autotelic expe-rience (A), feedback (F) and concentration (C) were also associatedwith these constructs (Table 5) within this factorial structure.
Clear goals
3 12 21 30
Feedback
4 13 22 31
elf- ess
25 34
Time
8 17 26 35
Autotelic experience
9 18 27 36
em (Arrows representing correlations between constructs are not featured in the figure)
ed on EFA.

Table 7Step 4: correlation table.
CR AVE MSV ASV T A C F LSC MAA
T 0.907 0.710 0.158 0.077 0.843A 0.935 0.548 0.731 0.412 0.287 0.740C 0.900 0.604 0.731 0.382 0.267 0.855 0.777F 0.906 0.617 0.689 0.325 0.258 0.830 0.738 0.785LSC 0.959 0.853 0.154 0.098 0.074 0.375 0.392 0.222 0.924MAA 0.834 0.560 0.416 0.279 0.398 0.645 0.638 0.526 0.373 0.749
The bolded figures represent the square roots of the AVE of the corresponding constructs.Indices: CR = Composite Reliability, AVE = Average Variance Extracted, MSV = Maximum Shared Variance, ASV = Average Shared Variance.Constructs: T = Time transformation, MAA = Merging Action & Awareness, F = Feedback, C = Concentration, LSC = Loss of Self Consciousness, A = Autotelic experience.
Challenge / Skill balance
Concentration
1 10 19 28
5 14 23 32
Merging action -
awareness
2 11 20 29
Clear goals
3 12 21 30
Feedback
4 13 22 31
Control
6 15 24 33
Loss of self- conciousness
7 16 25 34
Time
8 17 26 35
Autotelic experience
9 18 27 36
Deleted association Association Item Deleted itemConstruct Deleted construct (Arrows representing correlations between constructs are not featured in the figure)
Fig. 5. Respecification via omitting items.
Table 8Step 5: correlation table.
CR AVE MSV ASV T A C F LSC MAA
T 0.907 0.711 0.160 0.090 0.843A 0.895 0.635 0.508 0.263 0.362 0.797C 0.901 0.697 0.466 0.287 0.283 0.595 0.835F 0.902 0.649 0.508 0.274 0.270 0.713 0.683 0.806LSC 0.959 0.854 0.139 0.077 0.074 0.252 0.365 0.206 0.924MAA 0.833 0.558 0.403 0.248 0.400 0.506 0.635 0.529 0.373 0.747
The bolded figures represent the square roots of the AVE of the corresponding constructs.Indices: CR = Composite Reliability, AVE = Average Variance Extracted, MSV = Maximum Shared Variance, ASV = Average Shared Variance.Constructs: T = Time transformation, MAA = Merging Action & Awareness, F = Feedback, C = Concentration, LSC = Loss of Self Consciousness, A = Autotelic experience.
J. Hamari, J. Koivisto / Computers in Human Behavior 40 (2014) 133–143 139
3.3.4. Step 3: Exploratory Factor Analysis (EFA)Although the original model met the thresholds of the original
work of Jackson and Eklund (2002), we wanted to proceed furtherwith the tests. We moved to run an exploratory factor analysis inorder to investigate, which kind of factorial structure the data willconverge in. We used principal component analysis with varimaxrotation for the exploratory factor analysis.
The resulting factorial structure explained 71.7% of the variance(Table 6). As already suggested by the previous inter-correlationanalyses, and as was also partly confirmed by Procci et al. (2012),the items of challenge-skill balance (CSB), clear goals (G), and control(CTRL) seem to mostly load on the same factor. However, in thisdata also autotelic experience (A) is strongly associated with theseconstructs. All other constructs, however, behave well loadinghighly only with their expected factors.
3.3.5. Step 4: Confirmatory Factor Analysis (CFA) for the respecifiedmodel
Based on the EFA, the constructs challenge-skill balance, cleargoals and control did not form their own factors. Instead, all ofthe items of these constructs loaded mostly with autotelic experi-ence, one item with concentration and two items with feedback(see Table 6). We then ran a CFA based on the results of the EFA(Fig. 4). The model fit was inadequate: v2 = 1208.778, CFI = 0.893,NNFI = 0.882, RMSEA = 0.075, CI90 0.069–0.081. Overall, it seemsthat challenge/skill, clear goals and control form a rather uniformconstruct with autotelic experience. However, in CFA concentrationand feedback also seemed to correlate with this dimension to theextent that it would not pass the discriminant validity thresholds(Table 7).

Table 9EFA after omitted items.
1 2 3 4 5 6
f04F 0.871f13F 0.856f31F 0.740f22F 0.697f30G 0.680f16LSC 0.927f34LSC 0.927f07LSC 0.912f25LSC 0.907f27A 0.810f36A 0.802f18A 0.720f09A 0.657f19CSB 0.638f35T 0.904f08T 0.892f17T 0.885f26T 0.774f14C 0.786f32C 0.784f23C 0.751f05C 0.729f29MAA 0.825f02MAA 0.755f11MAA 0.722f20MAA 0.708
Variance extracted 14.3 14.2 13.1 12.9 11.9 10.9
Item codes referring to the original corresponding constructs: T = Time transformation,CSB = Challenge-Skill Balance, MAA = Merging Action & Awareness, G = clear Goals,F = Feedback, C = Concentration, CTRL = Control, LSC = Loss of Self Consciousness,A = Autotelic experience.
Challenge / Skill balance
Concentration
1 10 19 28
5 14 23 32
Merging action -
awareness
2 11 20 29
Control
6 15 24 33
Loss of sconciousn
7 16
Maste
Deleted association Association Item Deleted itConstruct Deleted construct
Fig. 6. Respecification via s
Table 10Step 6: correlation table.
CR AVE MSV ASV
T 0.913 0.726 0.147 0.080MAA 0.845 0.579 0.394 0.267C 0.902 0.698 0.666 0.317LSC 0.956 0.844 0.141 0.103MASTERY 0.953 0.804 0.666 0.320
The bolded figures represent the square roots of the AVE of the corresponding construcIndices: CR = Composite Reliability, AVE = Average Variance Extracted, MSV = MaximumConstructs: T = Time transformation, MAA = Merging Action & Awareness, C = Concentrat
140 J. Hamari, J. Koivisto / Computers in Human Behavior 40 (2014) 133–143
3.3.6. Step 5: Adequately fitting model via omitting itemsFollowing the results of the EFA (Step 3), we omitted all items
that had a poorer loading than the items of the core construct ofeach factor. Resulting in a factorial structure depicted in Fig. 5. Inother words, omitting these items effectively omits the threehighly inter-correlating constructs almost entirely with the excep-tion of items csb01 and g30. This solution represents the cleanestfactorial structure based on the EFA.
With this remaining factorial structure both convergent anddiscriminant validities were acceptable (Table 8) and model fitadequate: v2 = 461.259, CFI = 0.955, NNFI = 0.948, RMSEA = 0.067,CI90 0.048–0.066. Further, the EFA also showed that the remainingmodel still converged into the same exact factorial solution(Table 9).
3.3.7. Step 6: Adequately fitting model without omitting itemsIn step 5, we could find a factorial structure that had an ade-
quate model fit even when using the tighter thresholds. However,we wanted to find a factorial structure that would have decentmodel fit with the entire instrument.
As noted, CSB, G, F, and A are strongly correlated. Qualitatively,all these constructs can be considered as pertaining to experienceof mastery, i.e. having clear goals and feedback as an indicator ofchallenge-skill balance, which further associated autotelic experi-ences. These aspects of flow are often regarded as conditions offlow (Csíkszentmihályi, 1990; Nakamura & Csíkszentmihályi,2002), whereas, for example, loosing track of time or self-con-sciousness as well as merging action-awareness can be consideredmore as outcomes from reaching flow. Therefore, we modeled ahigher-order construct for the four highly correlated constructs,and named it mastery (or conditions of flow) similarly to Procciet al. (2012). This structure (Fig. 6) has an adequate model fit if
Clear goals
3 12 21 30
Feedback
4 13 22 31
elf- ess
25 34
Time
8 17 26 35
Autotelic experience
9 18 27 36
ry
em (Arrows representing correlations between constructs are not featured in the figure)
econd-order construct.
T MAA C LSC MASTERY
0.8520.383 0.7610.289 0.621 0.8350.072 0.375 0.362 0.9190.289 0.628 0.816 0.368 0.897
ts.Shared Variance, ASV = Average Shared Variance.ion, LSC = Loss of Self Consciousness, Mastery = see Fig. 6.

TMAALSCCCSBCTRLFGA
7
6
5
4
3
Constructs: T = Time transformation, CSB = Challenge-Skill Balance, MAA = Merging Action & Awareness, G = clear Goals, F = Feedback, C = Concentration, CTRL = Control, LSC = Loss of Self Consciousness, A = Autotelic experience
Fig. 7. Means of the responses on the components of flow.
J. Hamari, J. Koivisto / Computers in Human Behavior 40 (2014) 133–143 141
we use the same threshold as Jackson and Eklund (2002) origi-nally: v2 = 1120.066, CFI = 0,907, NNFI = 0.900, RMSEA = 0.069,CI90 0.063–0.075. Furthermore, the mastery second-order con-struct had discriminant validity (Table 10).
We further analyzed the means and deviations of the responsesregarding the (original) components of flow in order to seewhether the ratings of the different components would providesupport for the notion of ‘conditions’ and ‘outcomes’ as well as togenerally gauge which flow experiences were most prominent.The data shows that, indeed, in the gamification context, the expe-riences most commonly linked to gamification in popular discus-sions were reported to occur more: autotelic experience (self-purposefulness/intrinsically motivated experience are oftenreferred to in the discussions on gamification), having clear goalsand feedback. On the contrary, for example time transformation aswell as merging action and awareness were clearly reported to occurless (See Table 12 and Fig. 7).
4. Discussion and conclusions
In this paper we investigated the psychometric properties of theDFS-2 flow measurement instrument in the context of technology-
Table 11Goodness-of-fit indices for different factorial structures studied in this paper.
Specification N v
Step 1a: Original first-order model by Jackson and Eklund (2002) 200 1Step 1b: Original second-order model by Jackson and Eklund (2002) 200 1Step 2: Respecification by Procci et al. (2012) 200 1Step 3: EFA n/a nStep 4: Respecification based on EFA 200 1Step 5: Respecification with omitted items 200 4Step 6: Respecification without omitted items 200 1
Indices: v2 = Chi Square, CFI = Comparative Fit Index, NNFI = Non-Normed Fit Index, RMS
Table 12Means and standard deviation of the components of flow (in descending order).
A G F CTRL
Means 5.810 5.715 5.685 5.495SD 1.018 1.025 1.112 1.106
T = Time transformation, CSB = Challenge-Skill Balance, MAA = Merging Action & AwareneConsciousness, A = Autotelic experience.
supported gamified physical exercise (Table 11). The results indi-cate that the original factorial structure by Jackson and Eklund(2002) does provide an adequate fit when same lower thresholdsfor goodness-of-fit indices are used. However, we wanted to optfor currently favored higher thresholds (Hu & Bentler, 1999; Pfeilet al., 2009). We then moved onto testing a respecification of themodel by Procci et al. (2012) of which the factorial structureresulted in a poorer fit. In order to find a suitable factorial struc-ture, as the third step, we conducted an explorative factor analysis.In the fourth step, we conducted a confirmatory factor analysis fora model that was respecified in accordance to the EFA. This methoddid not yield significantly better results, since it seemed that a fewconstructs formed combined factors. In the fifth step, we took thefactors created by EFA, but omitted items that loaded below 0.6.This model reached the higher thresholds of model fit as well asgood convergent and discriminant validity. However, we stillwanted to find a factorial structure that reached model fit andvalidity without omitting any items. Therefore, in the sixth step,we created a second-order construct that contained the constructswith high inter-correlations (CSB, A, G, F, CTRL) as reflective indica-tors. This model reached good validity and the lower thresholds formodel fit.
In their DFS-2 model, Jackson and Eklund (2002) did not con-sider the causality or relationships between the dimensions offlow. However, theorizations regarding the flow dimensions haveconsidered the challenge-skill-balance, clear goals, control, and feed-back as conditions required for reaching flow (Csíkszentmihályi,1990; Nakamura & Csíkszentmihályi, 2002), whereas loss of self-consciousness, time, concentration, and merging action-awarenesshave been considered outcomes from reaching flow. The final res-pecification created in this study also suggests that the constructsdivide into two different categories; the conditional aspects andoutcome experiences from reaching the flow state, which are inline with some of the previous considerations (see also Table 12and Fig. 7 for differences in means). The final respecification pre-sented in this paper is thus also theoretically feasible in additionto presenting good model fit and validity indices.
Furthermore, in our study autotelic experience seemed to corre-late strongly with other conditions of flow which might pose adeviation from earlier theorizations. This finding would suggestthat, at least in the context of computer-supported gamified exer-cise, the autotelic experience, that is, finding the activity intrinsi-cally motivating, is also a condition for reaching the flow staterather than being an outcome from reaching flow. In a video gam-
2 df CFI NNFI RMSEA CI90 lo – hi/PCLOSE
044.955 558 0,918 0.907 0.066 0.060, 0.073136.599 585 0.906 0.899 0.069 0.063, 0.075242.882 539 0.878 0.865 0.081 0.075, 0.087/a n/a n/a n/a n/a n/a208.778 572 0.893 0.882 0.075 0.069, 0.08161.259 279 0.955 0.948 0.057 0.048, 0.066120.066 577 0,907 0.900 0.069 0.063, 0.075
EA = Root Mean Square Error of Approximation, PCLOSE = p of close fit.
CSB C LSC MAA T
5.298 5.063 4.831 4.259 3.5351.013 1.174 1.631 1.168 1.492
ss, G = clear Goals, F = Feedback, C = Concentration, CTRL = Control, LSC = Loss of Self

142 J. Hamari, J. Koivisto / Computers in Human Behavior 40 (2014) 133–143
ing environment, Procci et al. (2012) also found that challenge-skillbalance, clear goals and control have a strong inter-correlation.However, autotelic experience did not load as strongly with this fac-tor in their study. This could suggest that in gamified exercise,autotelic experience is potentially more closely associated withthe optimal challenge-skill experience than in pure gaming. Whereas in games, the autotelic experience might also be caused by otherfactors that are missing from the common gamification implemen-tation. Other appeals of video games (see e.g. Hamari & Tuunanen,2014; Yee, 2006 on gaming motivations), such as audiovisualimmersion and stimuli that are commonly missing in the gamifica-tion context but often are an elemental aspect of video games. Inother words, video game players can potentially reach an autotelicexperience even without actual goal-oriented play/mastery whichmost gamification implementations seem strive for. The data fur-ther shows that indeed, in the gamification context, those experi-ence most commonly linked to gamification in populardiscussions had been rated to occur more (autotelic experience(self-purposefulness/intrinsically motivated experience are oftenreferred in the discussion on gamification), having clear goals andfeedback. Whereas for example time transformation as well as merg-ing action and awareness, which are also commonly connected withaudiovisual immersion, were clearly rated to occur less (SeeTable 12 and Fig. 7).
Beyond the contributions related to the psychometric proper-ties of the DFS-2 scale, this study also suggests that flow shouldrather be seen as divided between the collection of conditions forreaching flow state and the psychological outcomes that followfrom reaching the flow state instead of merely seeing all of the ninedimensions as reflective indicators of the entirety of flow. Previousstudies might not have been able to make a distinction along theselines, since, naturally, both the conditions and outcomes are highlycorrelated as is to be expected. Therefore, we suggest that furtherstudies could conduct experiments which would specifically focuson finding evidence pertaining to causal relationships between thecomponents of the general flow.
Disclosure statement
No competing financial interests exist.
Acknowledgements
This research has been partially supported by individual studygrants for both authors from the Finnish Cultural Foundation aswell as carried out as part of research projects (40311/12, 40134/13, 40111/14) funded by the Finnish Funding Agency for Technol-ogy and Innovation (TEKES).
References
Admiraal, W., Huizenga, J., Akkerman, S., & Dam, G. T. (2011). The concept of flow incollaborative game-based learning. Computers in Human Behavior, 27(3),1185–1194.
Anderson, J. C., & Gerbing, D. W. (1984). The effect of sampling error onconvergence, improper solutions, and goodness-of-fit indices for maximumlikelihood confirmatory factor analysis. Psychometrika, 49(2), 155–173.
Anderson, J. C., & Gerbing, D. W. (1988). Structural equation modeling in practice: Areview and recommended two-step approach. Psychological Bulletin, 103(3),411–423.
Baker, R. K., & White, K. M. (2010). Predicting adolescents’ use of social networkingsites from an extended theory of planned behaviour perspective. Computers inHuman Behavior, 26(6), 1591–1597.
Bentler, P. M., & Chou, C. P. (1987). Practical issues in structural modeling.Sociological Methods & Research, 16(1), 78–117.
Boyd, D. M., & Ellison, N. B. (2008). Social network sites: Definition, history, andscholarship. Journal of Computer-Mediated Communication, 13(1), 210–230.
Cermakova, L., Moneta, G. B., & Spada, M. M. (2010). Dispositional flow as amediator of the relationships between attentional control and approaches to
studying during academic examination preparation. Educational Psychology: AnInternational Journal of Experimental Educational Psychology, 30(5), 495–511.
Chen, H. (2006). Flow on the net–detecting Web users’ positive affects and theirflow states. Computers in Human Behavior, 22(2), 221–233.
Chin, W. W. (1998). The partial least squares approach for structural equationmodeling. In G. A. Marcoulides (Ed.), Modern methods for business research(pp. 295–336). London: Lawrence Erlbaum Associates.
Crust, L., & Swann, C. (2013). The relationship between mental toughness anddispositional flow. European Journal of Sport Science, 13(2), 215–220.
Csíkszentmihályi, M. (1975). Beyond boredom and anxiety: Experiencing flow in workand play. San Francisco: Jossey-Bass.
Csíkszentmihályi, M. (1990). Flow: The psychology of optimal experience. New York:Harper and Row.
Deterding, S., Dixon, D., Khaled, R., & Nacke, L. (2011). From game design elementsto gamefulness: Defining gamification. In Proceedings of the 15th internationalAcademic MindTrek Conference: Envisioning Future Media Environments,Tampere, Finland, September 28–30, pp. 9–15.
Ellison, N. B., Steinfield, C., & Lampe, C. (2007). The benefits of Facebook ‘friends:’Social capital and college students’ use of online social network sites. Journal ofComputer-Mediated Communication, 12(4), 1143–1168.
Fornell, C., & Larcker, D. (1981). Structural equation models with unobservablevariables and measurement error. Journal of Marketing Research, 18(1), 39–50.
Fritz, B. S., & Avsec, A. (2007). The experience of flow and subjective well-being ofmusic students. Horizons of Psychology, 16(2), 5–17.
Fu, F.-L., Su, R.-C., & Yu, S.-C. (2009). EGameFlow: A scale to measure learners’enjoyment of e-learning games. Computers & Education, 52(1), 101–112.
González-Cutre, D., Sicilia, Á., Moreno, J. A., & Fernández-Balboa, J. M. (2009).Dispositional flow in physical education: Relationships with motivationalclimate, social goals, and perceived competence. Journal of Teaching in PhysicalEducation, 28(4), 422–440.
Gucciardi, D. F., Gordon, S., & Dimmock, J. A. (2009). Evaluation of a mentaltoughness training program for youth-aged Australian footballers: I. Aquantitative analysis. Journal of Applied Sport Psychology, 21(3), 307–323.
Hair, J. F., Black, W. C., Babin, B. J., & Anderson, R. E. (2010). Multivariate data analysis.Englewood Cliffs, NJ: Prentice Hall.
Hamari, J. (2013). Transforming Homo economicus into Homo ludens: A fieldexperiment on gamification in a utilitarian peer-to-peer trading service.Electronic Commerce Research and Applications, 12(4), 236–245.
Hamari, J., & Eranti, V. (2011). Framework for designing and evaluating gameachievements. In Proceedings of the DiGRA 2011 conference: Think design play,Hilversum, The Netherlands, September 14–17, 2011.
Hamari, J., & Koivisto, J. (2013). Social motivations to use gamification: An empiricalstudy of gamifying exercise. In Proceedings of the 21st European conference oninformation systems, Utrecht, The Netherlands, June 5–8, 2013.
Hamari, J., Koivisto, J., & Sarsa, H. (2014). Does gamification work? – A literaturereview of empirical studies on gamification. In Proceedings of the 47th Hawaiiinternational conference on system sciences, Hawaii, USA, January 6–9,2014.
Hamari, J., Huotari, K., & Tolvanen, J. (2014). Gamification and economics. In S. P.Walz & S. Deterding (Eds.), The Gameful World: Approaches, issues, applications.Cambridge, MA: MIT Press.
Hamari, J., Koivisto, J., & Pakkanen, T. (2014). Do persuasive technologies persuade?– A review of empirical studies. In A. Spagnolli, L. Chittaro, & L. Gamberini (Eds.),Persuasive technology, LNCS 8462 (pp. 118–136). Switzerland: SpringerInternational Publishing.
Hamari, J., & Lehdonvirta, V. (2010). Game design as marketing: How gamemechanics create demand for virtual goods. International Journal of BusinessScience & Applied Management, 5(1), 14–29.
Hamari, J., & Tuunanen, J. (2014). Player types: A meta-synthesis. Transactions of theDigital Games Research Association, 1(2), 29–53.
Hodge, K., Lonsdale, C., & Jackson, S. A. (2009). Athlete engagement in elite sport: Anexploratory investigation of antecedents and consequences. The SportPsychologist, 23(2), 186–202.
Hoelter, J. W. (1983). The analysis of covariance structures goodness-of-fit indices.Sociological Methods & Research, 11(3), 325–344.
Hsu, C.-L., & Lu, H.-P. (2004). Why do people play on-line games? An extended TAMwith social influences and flow experience. Information & Management, 41(7),853–868.
Hu, L., & Bentler, P. M. (1999). Cutoff criteria for fit indexes in covariance structureanalysis: Conventional criteria versus new alternatives. Structural EquationModeling, 6(1), 1–55.
Huotari, K., & Hamari, J. (2012). Defining gamification – A service marketingperspective. In Proceedings of the 16th international academic MindTrekconference, Tampere, Finland, 3–5 October 2012, pp. 17–22.
Jackson, S. A., & Eklund, R. C. (2002). Assessing flow in physical activity: The flowstate scale-2 and dispositional flow scale-2. Journal of Sport & ExercisePsychology, 24(2), 133–150.
Jackson, S. A., & Marsh, H. W. (1996). Development and validation of a scale tomeasure optimal experience: The Flow State Scale. Journal of Sport & ExercisePsychology, 18(1), 17–35.
Jackson, S. A., Martin, A. J., & Eklund, R. C. (2008). Long and short measures of flow:The construct validity of the FSS-2, DFS-2, and new brief counterparts. Journal ofSport and Exercise Psychology, 30(5), 561–587.
Kimiecik, J. C., & Jackson, S. A. (2002). Optimal experience in sport: A flowperspective. In T. S. Horn (Ed.), Advances in sport psychology (pp. 501–527).Champaign, IL, US: Human Kinetics.

J. Hamari, J. Koivisto / Computers in Human Behavior 40 (2014) 133–143 143
Koehn, S., Morris, T., & Watt, A. P. (2013). Correlates of dispositional and state flowin tennis competition. Journal of Applied Sport Psychology, 25(3), 354–369.
Koivisto, J., & Hamari, J. (2014). Demographic differences in perceived benefits fromgamification. Computers in Human Behavior, 35, 179–188.
Lin, K.-Y., & Lu, H.-P. (2011). Why people use social networking sites: An empiricalstudy integrating network externalities and motivation theory. Computers inHuman Behavior, 27(3), 1152–1161.
Loehlin, J. C. (1998). Latent variable models: An introduction to factor, path, andstructural analysis. Lawrence Erlbaum Associates Publishers.
Lu, Y., Zhou, T., & Wang, B. (2009). Exploring Chinese users’ acceptance of instantmessaging using the theory of planned behavior, the technology acceptancemodel, and the flow theory. Computers in Human Behavior, 25(1), 29–39.
McGonigal, J. (2011). Reality is broken: Why games make us better and how they canchange the world. London: Jonathan Cape.
Nakamura, J., & Csíkszentmihályi, M. (2002). The concept of flow. In C. R. Snyder & S.J. Lopez (Eds.), Handbook of positive psychology (pp. 89–105). New York: OxfordUniversity Press.
Nicholls, R., Polman, R. C. J., & Holt, N. L. (2005). The effects of individualizedimagery interventions on golf performance and flow states. Athletic Insight: TheOnline Journal of Sport Psychology, 7(1), 43–66.
Pavlou, P. A., Liang, H. G., & Xue, Y. J. (2007). Understanding and mitigatinguncertainty in online exchange relationships: A principal-agent perspective.MIS Quarterly, 31(1), 105–136.
Pfeil, U., Arjan, R., & Zaphiris, P. (2009). Age differences in online social networking:A study of user profiles and the social capital divide among teenagers and olderusers in MySpace. Computers in Human Behavior, 25(3), 643–654.
Procci, K., Singer, A. R., Levy, K. R., & Bowers, C. (2012). Measuring the flowexperience of gamers: An evaluation of the DFS-2. Computers in HumanBehavior, 28(6), 2306–2312.
Sinnamon, S., Moran, A., & O’Connell, M. (2012). Flow among musicians: Measuringpeak experiences of student performers. Journal of Research in Music Education,60(1), 6–25.
Skadberg, Y. X., & Kimmel, J. R. (2004). Visitors’ flow experience while browsing aWeb site: Its measurement, contributing factors and consequences. Computersin Human Behavior, 20(3), 403–422.
Wang, C. K. J., Liu, W. C., & Khoo, A. (2009). The psychometric properties ofdispositional flow scale-2 in internet gaming. Current Psychology, 28(3),194–201.
Webster, J., Trevino, L. K., & Ryan, L. (1994). The dimensionality and correlates offlow in human–computer interactions. Computers in Human Behavior, 9(4),411–426.
Weibel, D., Wissmath, B., Habegger, S., Steiner, Y., & Groner, R. (2008). Playing onlinegames against computer- vs. human-controlled opponents: Effects on presence,flow, and enjoyment. Computers in Human Behavior, 24(5), 2274–2291.
Whitmore, J. G., Borrie, W. T. (2005). Exploring the usefulness of the dispositionalflow scale for outdoor recreation activities. In The Proceedings of the 2005Northeastern recreation research symposium, Bolton Landing, New York, USA,April 10–12, 2005, pp. 371–378.
Yee, N. (2006). Motivations for play in online games. CyberPsychology & Behavior,9(6), 772–775.