measuring and improving telephone interviewer performance and productivity
TRANSCRIPT

1 TSMII Tarnai & Moore 5-31-06
MEASURING AND IMPROVING TELEPHONE INTERVIEWER PERFORMANCE
AND PRODUCTIVITY
John Tarnai Washington State University
Danna L. Moore
Washington State University
17.1 INTRODUCTION
Trained and hard working telephone interviewers are critical to the success of telephone
surveys which is why survey organizations spend significant amounts of time training new
interviewers, retraining experienced interviewers, and monitoring and supervising the
performance of interviewers. In this chapter we describe how the performance of telephone
interviewers is measured, how the performance of telephone interviewers can be improved with
appropriate training, how performance information is communicated, and what kinds of
performance can be expected from telephone interviewers.
Measuring interviewer productivity is important to the management of telephone surveys
for several reasons. First, interviewer wages are often the single largest expense in a telephone
survey budget; therefore anything that affects interviewer productivity will also have an impact
on the survey budget. Second, productivity benchmarks are essential to survey cost estimating.
Developing a realistic estimate of survey costs requires making realistic assumptions about how
many completed interviews, refusals, non-contacts, ineligibles, and call-backs are to be expected.
The consequences of incorrectly estimating interviewer productivity can be quite serious.
Inaccurate estimates of interviewer productivity can produce survey budgets that are too low or
too high, creating financial problems for the survey center. They can also lead to missing project

2 TSMII Tarnai & Moore 5-31-06 deadlines and survey goals for completed interviews. Third, interviewer productivity may be
used as a basis for merit pay that is given to the most productive interviewers in an organization.
Interviewer productivity is often the basis for rewarding interviewers if they are performing
well, or sending them to retraining or letting them go, if they are performing poorly.
Interviewers are typically evaluated on their performance on a survey. Those performing below
average or below some standard are then sent for further training in interviewing or persuasion
techniques. Interviewers who cannot perform at some minimum standard are either reassigned
to other work, or their employment is terminated and they are let go. Fourth, knowledge of
interviewer productivity is helpful for training and retraining of interviewers, and for
communicating performance expectations that are grounded in reality. Last, information about
the productivity of telephone interviewers is essential for planning and scheduling the number of
interviewers needed for fielding a telephone survey.
In this chapter we first review the current state of the field in terms of interviewer
performance and training, and describe the kinds of productivity measurements that are used to
evaluate and improve interviewer performance. Next, we describe how interviewer training is
used to communicate performance and productivity expectations to telephone interviewers, and
outline a technique for rapid interviewer training to quickly bring interviewers in line with
performance expectations. This is followed by a summary of the results of a survey of
organizations that conduct telephone interviews and the kinds of productivity measures they
collect to evaluate their interviewers and use in interviewer training and retraining. The paper
concludes with some recommendations for measuring the performance of telephone
interviewers, and improving training of telephone interviewers.

3 TSMII Tarnai & Moore 5-31-06 17.2 MEASURING INTERVIEWER PRODUCTIVITY
There is relatively little in the survey research literature about how to manage telephone
interviewers for productivity, or about the kinds of performance measures that are collected on
interviewer performance. However, an awareness of the importance of managing interviewer
productivity is apparent in the literature. More than 25 years ago, Dillman (1978) noted the
importance of interviewer productivity in describing how to plan for the number of interviewers
that would be needed to field a survey, based on how quickly interviews were being completed,
and how many refusals and no answers were being produced (Pp 278). Interviewer productivity
tends to be mentioned, if it is at all, in discussions of the most productive times to conduct
interviews. For example, Frey (1983) suggests that the most productive calling time is between
6 and 7PM (Pp 164), that interviewers should be scheduled for times when the probability of
nonresponse is small and the likelihood of completion great (Pp 161), and that the most
productive interviewers should be given the most work (Pp 164). Lavrakas (1987, 1993)
proposed that a basic measure of interviewer productivity be the ratio of the number of properly
completed interviews attained per interviewing session to the number of refusals (and partials)
for each interviewer (Pp 137). He suggested that a reasonable goal for which interviewers
should be trained is to achieve at least four completions for every one refusal or partial.
Lavrakas (1993) also suggested incorporating productivity measures into interviewer pay rates,
such that one third of their hourly rate be based on their productivity. These and similar
statements suggest that survey researchers are aware that interviewer productivity varies
depending on a variety of survey factors, and that productivity is important to measure for the
successful implementation of a survey..

4 TSMII Tarnai & Moore 5-31-06 17.2.1 Interviewer Productivity
In the research literature, there has been greater emphasis on evaluating the effects of
interviewers on response bias and measurement error, which, while not the focus of this chapter,
also suggests a need for measuring interviewer productivity. Interviewers who are more
productive will have a greater influence on the survey data collected than less productive
interviewers. Groves, Fowler, Couper, Lepkowski, Singer, and Tourangeau (2004) describe how
estimates of the standard errors in a survey are directly related to the average number of
interviews per interviewer. This literature shows the quite substantial effects that interviewers
have in influencing survey outcomes, and thus the importance of properly managing telephone
interviewers. We do need to be concerned about the size of interviewer workloads.
In discussing the management of data collection (mainly for face-to-face interviews),
Weinberg (1983) suggests a supervisor to staff ratio of about 1:10 and says that “the
interpersonal interaction between supervisor and interviewer can affect survey production, data
quality, and costs.” She also notes that the management of data collection should include
monitoring both the quality and quantity of the work. Lavrakas (1987; 1993) similarly
recommends a ratio of about 1:10 for supervisors to telephone interviewers. Another element of
interviewer productivity for Lavrakas is the speed at which sample call records are processed,
but he does not propose a standard.
For Fowler (1984; 1993) interviewer productivity is primarily the number of interviews
completed. The number of completed interviews obtained by an interviewer is frequently used
as the main measure of productivity, since survey goals often emphasize achieving a certain
number of completed interviews. Link (in press) defines the production efficiency of telephone

5 TSMII Tarnai & Moore 5-31-06 interviewers as the ratio of hours worked to completed interviews obtained. Link (in press) also
describes a measure of interviewer effectiveness as the ratio of the number of refusals obtained
divided by the sum of refusals plus completed interviews.
We found one study in the literature (Thurkow, Bailey, & Stamper, 2000) which
compared the effects of group and individual monetary incentives on the productivity of
telephone interviewers. In this study, call-completions was the main measure of interviewer
productivity, although the study also looked at call attempts per hour. The study found that
individual incentives were more effective at increasing productivity than either group or
competitive incentives.
The literature on call centers, much of which deals with direct marketing, sales, and
support and not research, includes articles concerned with management of telephone staff,
however, much of this literature is not relevant to telephone interviewing because so much of
their focus is on selling and marketing of products and services, and deals with incoming call as
well as outgoing calls. Anton (1977) and Waite (2001) describe some typical call center metrics
for measuring the productivity and performance of call center staff.
Several authors indicate the importance of communicating productivity expectations with
telephone interviewers. Lavrakas (1987; 1993) indicates that it is important to communicate
productivity expectations to interviewers so they know how to perform adequately. Weinberg
(1983) also indicates that supervisors should reinforce any expectations stated in the interviewer
manual. Morganstein and Marker (1997) make a case for the importance of collecting process
data and communicating it to identify and control processes that produce statistical products.
It would be difficult to develop standards of interviewer productivity that can be applied

6 TSMII Tarnai & Moore 5-31-06 to all telephone surveys, or even to a single survey because of differences in sample populations,
interviewers, survey requirements, and which phase of a survey is being measured. However,
the International Standards Organization (ISO) is developing a set of standards for market,
opinion, and social research, which will help to ensure that survey research is “undertaken to an
appropriate standard and in a verifiable and consistent manner (International Standards
Organization, 2005).” The most recent draft of the ISO standards for survey research does not
have a standard for telephone interviewing productivity, but it does have one for interviewer
training, which includes a six-hour minimum for training new telephone interviewers (p.18-19).
Interviewer productivity is important for identifying staffing needs to ensure that survey
projects are worked adequately and efficiently. Current computer assisted telephone interview
(CATI) systems can help by providing basic performance and productivity data on telephone
interviewers (Parsley Edwards, Suresh & Weeks, 1998). Most telephone survey research is now
carried out with CATI systems, and the detailed performance and productivity data that CATI
systems provide, make it possible for better and more efficient management of telephone
interviewers.
17.2.2 Productivity Metrics
There are several different productivity measures in a telephone survey, and modern
computer assisted telephone interview (CATI) systems facilitate the collection of many of these
measures. Commonly used productivity measures include the following: number of call
attempts made; number of completed interviews obtained; number of refusals; number of
ineligibles; total number of minutes worked; average length of completed interviews; quality of
interviews completed; monitoring scores; attendance and tardiness.

7 TSMII Tarnai & Moore 5-31-06
Derivatives of these measures are sometimes more useful as measures of productivity,
usually calculated on a per hour or minute basis, such as number of call attempts per hour, or
minutes per completed interview. Some frequently used metrics include:
• Call attempts per hour which is calculated as the average number of calls made by
interviewers per hour, or the total number of call attempts made during a work shift,
divided by the total number of hours in the work shift. This is a baseline measure of time
on the telephone, and is useful in ensuring that interviewers stay on task.
• Hours per complete is calculated as the average number of hours required to get a
completed interview, and is determined by dividing the total number of interviewer hours
worked by the total number of completed interviews obtained during a shift. This
measure generally correlates positively with days in the field, since easier to reach
respondents are typically disposed of early on, and the more difficult to reach
respondents that require more call attempts occur later in the field period.
• Refusals per hour which is calculated as the average number of refusals obtained per
hour, or the total number of refusals made during a work shift, divided by the total
number of hours in the work shift. This measure is generally negatively correlated with
days in the field. A related metric is the ratio of refusals to refusals plus completes as
described by Link (in press).
• Ineligibles per hour which is calculated as the average number of ineligible respondents
per hour, or the total number of ineligible respondents obtained during a work shift,
divided by the total number of hours in the work shift. Like refusals per hour, this
measure is negatively correlated with days in the field. This metric is not used very

8 TSMII Tarnai & Moore 5-31-06
often, but is important for surveys that screen out a high percentage of cases, because the
rate of ineligibles will affect the rate of completions and refusals in a survey.
All of these data and more can generally be obtained from a CATI or CAI system used
for conducting telephone surveys, and the data are generally continuously available and by
interviewer as well (Berry & O’Rourke, 1988). When plotted against project timelines these
metrics are useful for assessing what adjustments if any need to be made to workloads or
timelines. These metrics can be used by themselves or combined with other factors to create
composite indicators. Other productivity measures researchers have suggested for comparing
interviewers before and after training include: the ratio of completed interviews to the number of
non-immediate hang-up first refusals (CFR), and cooperation rate (contacted eligible sample
units that cooperate with a survey request). More sophisticated call center telephony systems
can actually calculate time “off hook” and time “on hook” and can parse the time interviewers
spend dialing the telephone, connected with a respondent, and time they are not on the telephone.
17.2.3 Using and Communicating Productivity Information
Productivity information is often used in (1) forecasting hours and days required to
achieve project goals; (2) forecasting staffing levels needed; and (3) communicating with
interviewers about performance on a survey project. One of the most useful aspects of
productivity information is its use in estimating staffing levels needed for a survey, or the
number of hours/days required to reach project goals. A three-part equation relating staffing
levels needed (number of interviewer hours) to productivity (hours per complete times number of
completes) can be developed as follows.
# of Interviewer Hours = Hours per Complete x # of Completes

9 TSMII Tarnai & Moore 5-31-06 The productivity measure (hours per complete) is estimated based on the result of calls over
some period of time, such as the first few hours or days of a survey. Since hours per complete
tends to increase while a project is in the field (shown in Figure 17.2), it is useful to calculate
this information daily, put it in a spreadsheet, and re-estimate the number of interviewer hours
needed.
Using this productivity information is invaluable in forecasting interviewing needs, since
the forecast is based on actual trends instead of hypothetical or past estimates. The forecast can
be further improved by linear regression, since as we show in Figure 17.2, productivity changes
as more of a sample is worked and the composition of the remaining sample changes from
unworked cases to no answers, answering machine cases, and refusal conversions. With each
successive day that a telephone survey is in the field, a new regression equation can be
developed to predict the remaining hours/days required to complete the survey, becoming
increasingly accurate as the survey nears its end.
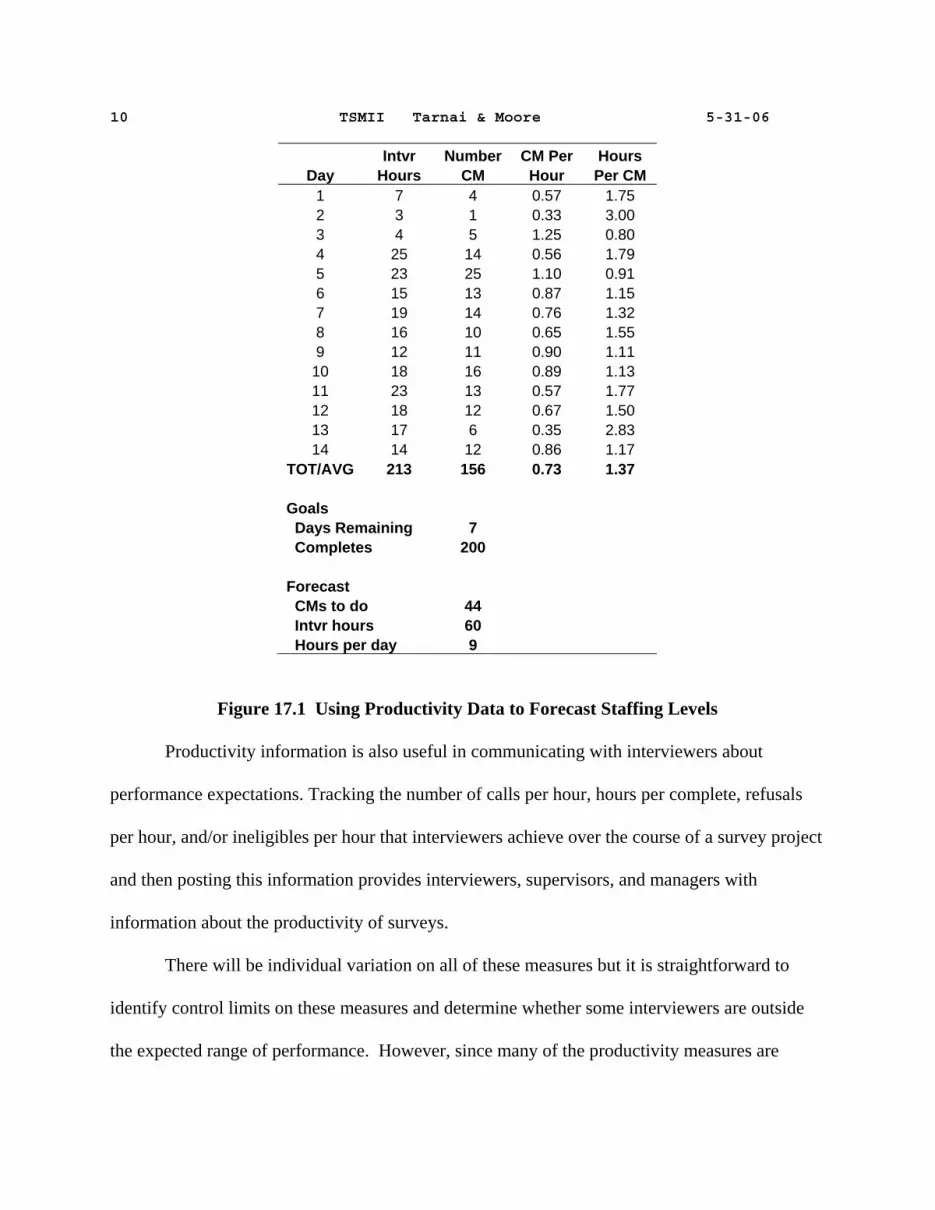
Parsley Edwards, et al, (1998) in a review of automated call scheduling features in
computer assisted interview (CAI) systems suggest that the area most sorely in need of future
work is the interaction between the autoscheduling system and interviewer staffing (Pp 306) and
that the ability to predict staffing needs for interviewing shifts is a particularly useful feature
which is not currently available in any CAI system. Thus, survey organizations either do this
manually, haphazardly, or in a limited way. Figure 17.1 displays an excel sheet that uses daily
productivity data to forecast the number of interviewer hours and the number of days required to
obtain 200 completed interviews over 21 days.
10 TSMII Tarnai & Moore 5-31-06
Intvr Number CM Per Hours Day Hours CM Hour Per CM
1 7 4 0.57 1.75 2 3 1 0.33 3.00 3 4 5 1.25 0.80 4 25 14 0.56 1.79 5 23 25 1.10 0.91 6 15 13 0.87 1.15 7 19 14 0.76 1.32 8 16 10 0.65 1.55 9 12 11 0.90 1.11 10 18 16 0.89 1.13 11 23 13 0.57 1.77 12 18 12 0.67 1.50 13 17 6 0.35 2.83 14 14 12 0.86 1.17
TOT/AVG 213 156 0.73 1.37 Goals Days Remaining 7 Completes 200 Forecast CMs to do 44 Intvr hours 60 Hours per day 9
Figure 17.1 Using Productivity Data to Forecast Staffing Levels
Productivity information is also useful in communicating with interviewers about
performance expectations. Tracking the number of calls per hour, hours per complete, refusals
per hour, and/or ineligibles per hour that interviewers achieve over the course of a survey project
and then posting this information provides interviewers, supervisors, and managers with
information about the productivity of surveys.
There will be individual variation on all of these measures but it is straightforward to
identify control limits on these measures and determine whether some interviewers are outside
the expected range of performance. However, since many of the productivity measures are

11 TSMII Tarnai & Moore 5-31-06 interrelated, they must be used prudently so that interviewers are never penalized for good
behavior. For example, interviewers who achieve a high number of completes (or ineligibles in
screening interviews), will generally see their calls per hour decrease because their time is
occupied in talking with respondents, which takes more time than making call attempts.
Interviewers who consistently exceed the averages for productivity measures are good
candidates for becoming monitors, interviewer leads, or supervisors. Interviewers who
consistently perform below average, and particularly those that are outside the control limits on
any of the productivity measures should be assigned to retraining sessions. Productivity
measures and the expected normal range should be presented to all telephone interviewers,
especially new interviewers, so that performance expectations are clearly communicated. If
interviewers are rewarded for their performance, care must be taken to ensure that this is done in
a way that does not encourage inappropriate behavior, such as faking completed interviews.
Good CATI managers generally view results which appear consistently too high with some
suspicion, as an indication of potential interviewer fraud. This is another reason that monitoring
of telephone interviewers is an essential part of the survey process (see Chapter 16).
To demonstrate how productivity metrics can be used, we have collected data from six
recent telephone survey projects conducted by the authors involving both listed and RDD
samples, and summarized the results in Figure 17.2. We present averaged results, rather than
present individual survey results to simplify the presentation and discussion.
Figure 17.2 shows productivity data averaged over six telephone surveys conducted by
the authors (each survey averaged 15 to 16 minutes in length). The chart at the top shows the
average number of calls per hour for each of 37 days that these surveys were in the field.

12 TSMII Tarnai & Moore 5-31-06
Average Calls Per Hour
0
10
20
30
40
50
1 3 5 7 9 11 13 15 17 19 21 23 25 27 29 31 33 35 37
Num
ber o
f Cal
ls
Average Hours Per Com plete
0.0
0.5
1.0
1.5
2.0
2.5
1 3 5 7 9 11 13 15 17 19 21 23 25 27 29 31 33 35 37
Num
ber o
f Hou
rs
Average Refusals Per Hour
0.0
0.5
1.0
1.5
2.0
2.5
3.0
3.5
1 3 5 7 9 11 13 15 17 19 21 23 25 27 29 31 33 35 37
Day
Num
ber o
f Ref
usal
s
Average = 36 Std Dev = 4.7 Regression Coefficients Intercept = 33 Slope = 0.14
Average = 1.28 Std Dev = 0.26 Regression Coefficients Intercept = 1.11 Slope = 0.01
Average = 2.2 Std Dev = 0.58 Regression Coefficients Intercept = 2.6 Slope = -0.04
Figure 17.2 Three Productivity Metrics Over Time

13 TSMII Tarnai & Moore 5-31-06
The trendline shows a slight increase in call attempts with each succeeding day in the
field. This slight increase is due mainly to the increase in unproductive calling (no answers,
answering machines) the longer a survey stays in the field. The chart in the center, shows the
average number of hours per completed interview for each of 37 days in the field. The trendline
also shows an increase with each successive day of calling. This reflects the increasing difficulty
of achieving completed interviews from the remaining active sample in the field. The chart at
the bottom shows the average number of refusals per hour for each of the 37 days in the field.
The trendline shows a slight decrease, which reflects the increasing difficulty of reaching
respondents from the remaining active sample, with more no answers and answering machines
reached than respondents. Comparing the three figures, interviewer productivity as measured in
these three ways, is not static but changes throughout the course of a telephone survey. Some
surveys may emphasize these trends more than others, but all telephone surveys probably follow
a similar pattern. This makes it important to consider which phase a survey is in, when using
productivity information to forecast interviewing needs, and when using this to assess
interviewer performance.
17.3 HOW INTERVIEWER TRAINING AFFECTS PRODUCTIVITY
Most studies of interviewer training seem to focus on the effects of training on one aspect
of interviewing, such as avoiding refusals (Shuttles, et al. 2002; 2003), or increasing the rate of
completions (Groves & McGonagle, 2001). Link, Armsby, Hubal, & Guinn (2004) describe a
virtual environment to teach telephone interviewers interaction skills with a goal of developing
refusal avoidance skills. Productivity plays an important part in interviewer training, as
increasing productivity, through more completions, fewer refusals, fewer missing items, more

14 TSMII Tarnai & Moore 5-31-06 call attempts, is generally the goal of training.
17.3.1 Training Protocols Designed to Improve Cooperation
Groves and McGonagle (2001) suggest that interviewer training may be under utilized as
a way to influence survey participation and that most past research on interviewer trainings has
primarily focused on question delivery and measurement error. In their study they show that
training regimens directed at changing the behavior of interviewers, especially during survey
introductions and at sample recruitment, can significantly influence sampled individuals’
decisions to participate in surveys. Training regimens that taught interviewers to diagnose and
provide counter statements to respondents’ concerns and to maintain interaction, in authors’
experiments, out performed and had lower rates of refusals than interviewers who did not receive
this type of training. These authors point out that standardized interviewing that promotes set
scripts and a “one size fits all” approach to survey introductions, has failed to make significant
improvements in survey cooperation over the last two decades. As a result, surveyors are
seeking other avenues for improving first contact rates, and are testing the requirement and “long
standing practice” in many organizations for interviewers to deliver standardized scripted
introductions. In our research we are specifically interested in training protocols that enhance
interviewer effectiveness as measured by their productivity.
Tailoring what is said to respondents and maintaining interaction are two interviewer
behaviors that are used in training protocols to address sample person participation (see Groves
and Couper, 1998). Maintaining interaction is a fundamental element of tailoring, and
prolonging the interaction with the respondent promotes more commitment by both interviewers
and respondents. As the interview and interaction progresses, the interviewer and the respondent

15 TSMII Tarnai & Moore 5-31-06 are each less likely to dismiss one another. The concept of tailoring promotes interviewers
evaluating reactions of respondents and seeking cues to prolong the interaction and using
successful arguments that increase respondent receptivity towards the interview request.
Inexperienced interviewers and interviewers with high refusal rates are often evaluated as
creating soft refusals (respondents who mildly refuse and might be persuaded to participate with
more effort) by having too few counter statements to use and having to resort too quickly to
making the interview request. We suspect that new interviewers and those that are less
productive are virtually unaware of what they need to do and how to go about making
connection with respondents. On the other hand more experienced interviewers and those
showing higher cooperation rates engage in more dialogue at first contact and actively
communicate with respondents. The main attributes of experienced interviewers that influences
survey participation is more confidence and a larger combination of behaviors proven to be
effective in persuading sample persons (Groves, Cialdini, and Couper, 1992).
Mayer and O’Brien (2001) conducted tests with 24 Census Bureau interviewers allocated
to 3 experimental groups to specifically evaluate the effects of their Refusal Aversion Training
(RAT) on First Contact Cooperation Rates. Interviewers in the RAT received 8 hours of
training. First Contact Cooperation rates were used as metrics to simplify analysis. All
interviewers showed a natural increase in first contact cooperation rates with interviewing
experience (two data collection periods for this study) without specialized training. The results
of the experiments showed that first contact cooperation rates increased 3-7 percentage points
and as much as 14 percentage points over time for interviewers who participated in Refusal
Aversion Training. While this study focused on only two consecutive data collection periods it

16 TSMII Tarnai & Moore 5-31-06 showed that it took time for the effects of training to show and authors report that interviewers
admitted that it took time to become comfortable with strategies taught in the training and to put
them to use. What is not evident from any of these studies is whether training stays with
interviewers over time, and whether or not they need refresher trainings to reactivate skills
taught in specialized trainings. Does specialized training apply across different kinds of
surveys? Shuttles et. al (2003) conducted a series of three studies that randomly assigned 282
interviewers to a treatment or a control group with regards to participating in a specialized
averting refusals training (ART). Unlike the previous two studies, these authors’ results showed
no significant differences between interviewers as a result of whether or not interviewers
attended specialized ART training. The measure used to compare interviewers was Completes to
First Refusals Ratio (CFR) and is the number of completed interviews to the number of non-
immediate hang-up first refusals. As an example of what this measures a CFR of .33 is two first
refusals to one accept. The CFR measure for interviewers in this study ranged from .58 to .66
over the three experiments. The authors attributed the lack of a significant quantitative
difference in interview performance between experimental treatment and control to several
factors including, selection of experienced interviewers only, the call center environment,
integrity of the experiment, and the changing nature of refusals. In this call center interviewers
receive an ongoing array of training and coaching on an on-going basis so that elements of the
training program may be picked up in the informal environment of the center.
One problem with the practice of using only response rate type metrics to evaluate
interviewers is the implicit assumption that high cooperation at sample recruitment translates to
effectiveness in the interview. Steinkamp (1964) provided empirical evidence that suggests that

17 TSMII Tarnai & Moore 5-31-06 interviewer productivity should be about more than just sample recruitment. By measuring other
metrics (e.g. percent of ambiguous answers, average length of interview, variability in length of
interview, item refusals on financial holdings, percent of respondents using records for financial
reporting, and interviewer evaluation of questionnaires as complete) his results show that
interviewers with high cooperation did not directly lead to a high rate of data capture on
variables important to the study. He suggested that productivity measures which only evaluate
respondent cooperation (response rate measures) may not be adequate when this is compared
with the rate at which interviewers pick up key quantitative study information. His results failed
to find a significant relationship between higher response rates and measures of in-interview
effectiveness. He suggests that the most likely means of identifying effective interviewers is in
analyzing patterns of performance (considering more than one measure) rather than in terms of
performance in a single area.
17.3.2 Focused Training Designed to Improve Productivity
How do survey researchers build survey skill among their interviewing staff and how do
they know their training activities make a difference in survey outcomes? More importantly how
do surveyors identify interviewers who are assets and contributing to production from those they
need to quickly identify as liabilities or as having deficiencies? What particular strategies are
consistently used to identify training needs and to increase interview skills.
The kind of training interviewers need depends upon the type of respondent role to be
addressed. Some respondent interactions require more active participation and reaction by the
interviewer. To prolong an interaction, whether at the time of introduction or during the
interview at time of an indication of abandonment, requires the interviewer to constantly

18 TSMII Tarnai & Moore 5-31-06 stimulate respondents and build rapport. Our observation is that most new inexperienced
interviewers do not do this naturally and need training in this area. If a particular survey proves
to have difficulty in recruitment, is lengthy, has sensitive subject matter, and/or is otherwise
unappealing to respondents then there is greater demand on interviewers for having skills and
tools to prolong interaction and persuade respondents to stay with the interview. The more
difficult the survey, because of a sensitive topic or difficult respondents, the more training
interviewers need to perform effectively in a given survey.
One method for practicing interviewing and learning survey content that has been around
for a long time (Stanton, Back, & Litwak, 1956) is role playing, in which one interviewer
participates as a respondent, and another interviewer participates as an interviewer. But when is
role playing most beneficial and when is it least beneficial? Role playing is least beneficial, and
is deemed to be not very effective when: 1) interviewers are left on their own to carry out the
task without first learning what they are to practice, 2) role playing is unguided, and 3) role
playing is not assessed for changes in interviewer behavior or knowledge. It may be difficult for
an individual interviewer to accurately recall, discuss, and act out with another interviewer how
survey introductions actually play out or to accurately describe how they maintain rapport with
respondents. Even more difficult, is for new interviewers to fully comprehend the nuances of the
respondent interviewer interaction and to know what they can do or say to respondents. In a
training setting it may be more beneficial and valid for interviewers to first “see” or “hear” actual
interviews and witness interviewer behaviors and interactions that were successful and
unsuccessful in gaining respondent cooperation. Group discussion about the progress of an
interview is helpful after interviewers can hear live examples of both successful and
19 TSMII Tarnai & Moore 5-31-06 unsuccessful introductions. In this way interviewers learn to recognize differences in interview
behavior, tie it to outcomes, and start to understand what they themselves are doing when they
are in an interview.
Role playing is most beneficial and effective when it is necessary for interviewers to
know how they and respondents might act under the stress of a given situation. Respondent
stresses can be related to: timing, attitudes about surveys or sponsorship, rights as a respondent,
and confidentiality to name a few. Interviewer stresses may be related to lack of experience or
ability, lack of knowledge, lack of confidence, and low expectations about the interaction. To
role play effectively requires training tools and training methods - for interviewees (acting as
respondents) to test their partner on recognizing the full range of respondent themes and to
recognize and respond appropriately to each theme.
Role playing can be helpful to teaching and testing interviewers for respondent theme
recognition, the practice of listening, and response skills. Role playing gives interviewers an
opportunity to practice their skills with stressful and/or negative respondent interactions in a safe
environment. We believe many small to medium survey centers rely on ad hoc role playing as a
training method. Current practice suggests that role playing is used more as a method to
familiarize interviewers with a new questionnaire rather than a way of testing for knowledge or
recognition of themes. Ad hoc role playing as part of interviewer training may not constitute
thorough enough interaction training and may have a high degree of performance variability
between interview partners. It is highly likely in ad hoc role playing that interviewers are
practicing only a small set of the types of respondent interactions. More formalized teaching of
respondent themes and role playing with instructional materials and formalized objectives for

20 TSMII Tarnai & Moore 5-31-06 themes has been suggested and shown by some researchers in large survey facilities such as the
U.S. Census Bureau (Mayer and O’Brien) as a way to improve interviewer performance.
Role playing during training by an “interviewer” and an “interviewee” partnering also
permits observation. Not only can the interviewee assess the quality of the interviewer’s
interactions and instincts, they can immediately provide feedback on correct recognition of
respondent themes (Fellows & Mawhinney, 1997). Basically, good scene construction for
interviewer training materials requires well articulated respondent problems, practical solutions,
and thorough testing. It is best if role play sessions can occur as part of regular training sessions,
remedial trainings, and also as part of project based training sessions.
Another type of interviewer training that is useful in improving interviewer productivity
is sometimes called “rapid response training” to denote a brief, quick training session. This
training is designed to address a particular interviewer skill or productivity problem, such as one
of the following: 1. refusal aversion; 2. non-specific respondent concerns; 3. time and burden
concerns, 4. government concerns, 5. dealing with hostile respondents, 6. company or sample
member “no survey” policy concerns, 7. confidentiality concerns, 8. pass off to another contact
in sample unit, 9. active listening, 10. persuasion techniques, 11. taking the easy way out—
avoiding self selection bias, 12. survey content concerns, 13. selection/sampled concerns.
Shuttles and his colleagues (2002; 2003) provide an example of this kind of training to
help telephone interviewers avoid refusals and increase their overall productivity. This training
teaches interviewers to focus their efforts on five specific interviewing skills: (1) recognition:
learning the themes of respondents concerns; (2) diagnosing: learning to classify respondent’s
actual wordings into themes; (3.) modification: learning desirable interview behaviors to address

21 TSMII Tarnai & Moore 5-31-06 concerns; (4) delivery: learning to deliver a set of statements relevant to the respondent’s
concerns; and (5) rapid response - increasing the speed of response performance through
practice. Their training incorporates many elements of successful training programs carried out
by the Bureau of Labor Statistics, the Department of Agriculture, and the Bureau of the Census.
17.4 RESULTS OF A SURVEY OF TELEPHONE INTERVIEW ORGANIZATIONS
We wanted to know how other survey research centers that conduct telephone interviews
measure interviewer productivity and performance, and how they use this information to
manager interviewers, meet project goals, and staff the telephone facility. To accomplish this we
designed an Internet questionnaire for survey research organizations. The sample consisted of all
survey organizations listed in the 2005-2006 AAPOR Blue Book supplemented by the listing of
organizations in attendance at the 2005 International Field Directors Technology conference,
including those with international addresses. Questions for the survey were developed from the
questions and issues identified in this paper.
The sample frame consisted of a total of 488 organizations, all of which were mailed a
letter inviting them to participate in the Internet survey. Those for whom email addresses were
available, were also sent an email message requesting their participation in the survey. A total of
178 organizations participated in the Internet survey, for a response rate of 38%. Of those
responding, about 7.8% were ineligible because they did not conduct telephone interviews in-
house. This left 150 organizations that completed the entire survey. Responding organizations
are characterized in Table 17.1. The majority of organizations, 87%, are U.S. based
organizations and 13% are international organizations that are primarily government statistical
services. These can be classified further as: Academic (39.6%), government (3.7%), non-profit

22 TSMII Tarnai & Moore 5-31-06 (10.4%), and commercial (46.3%). The largest sector accounted for in our responses is
commercial. Better than two-thirds of the organizations have 50 or fewer CATI stations at their
main interviewing locations. Less than a fourth of the organizations reported having additional
CATI locations beyond their main location. Only 10% of organizations have 50 or more CATI
stations at locations beyond their main location.
Most organizations rely primarily on part-time interviewers supplemented with a few full
time interviewers, for their telephone interviewing workforce. The average number of part time
interviewers currently on staff was reported as 86 and the median number of part time
interviewers on staff was 29. The average number of interviewers hired annually was reported
as 176 and the median number of interviewers on staff was 37. Over half (54%) of the
organizations reported having 45 or fewer part time interviewers currently on staff.
Organizations have few full-time interviewers. From the survey, over half of all organizations
reported having three or fewer full time interviewers currently on staff. On average, pay for
entry level interviewers is reported as $8.40 dollars per hour and average hourly pay for all
interviewers at the organizations responding to the survey was $9.40.
The majority of survey respondents are personally “somewhat or very involved” in the
design and administration of telephone surveys (50.3%) and the majority are “somewhat or very
involved” in supervision and training of interviewers (51.2%). These results suggest that the
survey was answered by the appropriate respondents and that survey respondents are well
qualified to provide organizational level interviewer productivity and training information.
While interviewer performance data is important to most organizations (70% say it is very
important, and 26% say it is somewhat important), a handful of organizations (4%) think it is

23 TSMII Tarnai & Moore 5-31-06 unimportant. Over three-quarters of organizations are satisfied with the way their organization
uses data on interviewer performance, but over 20% are dissatisfied.
Table 17.1 Characteristics of Survey Organizations Responding to the Survey
Type of Organization: Academic Government Commercial Non-profit
39.63% 3.07% 46.03% 10.4%
Location: International United States
13.1% 86.9%
CATI locations: Single main location Other additional locations
80.7% 19.3%
Number CATI stations at main location: None 1-20 21-50 51-100 100+
8.1% 31.5% 32.2% 14.8% 13.4%
Number of Part- time interviewers currently on staff: <25 26-50 51-150 >150
38.7% 32.0% 17.3% 12.0%
Number of Full-time interviewers: <3 3-10 11-30 >30
52.4% 15.9% 14.3% 17.5%
Number of telephone interviewers hired in 2005: Range Mean Median
0-5000 176 37
17.4.1 Measuring and Evaluating Interviewer Productivity
The majority of survey organizations that conduct telephone interviews (95.2%)
say that their organization measures the performance of their telephone interviewers. Many

24 TSMII Tarnai & Moore 5-31-06 (54%) indicate that interviewer performance data is available continually, and others collect it by
shift (8.6%), per day (14.4%), per week (12.2%), or less often (10%). Over 81% of respondents
said that interviewer productivity data is available through their CATI system. Despite the
widespread availability of performance data on interviewers, only 54.4% of respondents said that
their organization has standard productivity requirements that interviewers are expected to meet
in order to keep their jobs, get promoted, or receive raises.
Table 17.2 Percent of Survey Organizations with Interviewer Performance Measures
Performance Measure
Percent of Organizations
Producing
CATI system produces:
Number of call attempts 92.4%
Number of interviews completed 97.0%
Number of refusals 87.0%
Number of ineligibles 70.5%
Number of minutes/hours worked 93.1%
Length of completed interviews 89.9%
Attendance and tardiness 74.6%
Cooperation rate 60.3%
Quality measures collected: Supervisor ratings of interviewers
80.9%
Monitoring scores 65.6%
Number of questionnaire items with missing values
33.6%
Number of organizations 130

25 TSMII Tarnai & Moore 5-31-06 Most response rate productivity measures, (completes, refusals, hours interviewing,
length of interviews) are available through organizations’ CATI systems for better than 92% of
organizations. Measurement of ineligibles is somewhat available, with 86.2% of organizations
saying this is available through their CATI. Attendance and tardiness measures are not readily
available for most organizations (63.2%) since these measures are not available from their CATI
system. However, 29.6% say attendance and tardiness measures are available through their
CATI system. Table 17.2 displays the percent of survey organizations that produce and collect
each kind of interviewer performance measure.
The majority of survey organizations collect all of these performance measures, but
surprisingly about 25% do not collect data on attendance or tardiness, and about 40% do not
collect interviewer cooperation rates. Survey respondents were asked to indicate the three most
important measures of interviewer efficiency in their organization. The most frequently reported
measures included: calls per hour, completes per hour, rate of refusals, and general survey
quality measures such as supervisory evaluations and monitoring scores.
When asked specifically about quality measures collected on interviewers the most
frequently reported measure was supervisor ratings (81%) and monitoring scores (65.6%). Less
than 34% of respondents indicated they collected information on missing values on questionnaire
items as a measure of quality of interviewing.
Organizations reported they emphasize and use multiple measures as part of their
standards to evaluate interviewers. A few organizations indicated having thresholds for
performance, with the lowest 20% of interviewers advised to improve their performance or face
termination. For the most part, evaluation scorings are comparative. Interviewers are compared

26 TSMII Tarnai & Moore 5-31-06 to others working on the same survey or survey project and across all studies worked.
Interviewers are compared to their own performance over time or on other studies. Another
frequently mentioned performance standard was the result of regular monitoring assessments
based on specific aspects of acceptable interviewing practice including: asking questions
correctly and as worded, nonbiased probing, appropriate interaction with respondents, refusal
avoidance, and ability to convert previous refusals, demeanor, and voice quality. Measures that
look at basic work performance and work place ethics were also mentioned such as number of
absences, tardiness, regular availability for work, adhering to schedule, following supervisor
instructions, ability to handle technology such as CATI use, and longevity and tenure as an
employee. Some organizations reported they have unionized interviewers and must comply with
union reporting for layoffs.
A number of organization’s report setting productivity thresholds and establishing
benchmarks for decision making. The most frequently mentioned threshold for individual
interviewer statistics was for comparisons to a group mean or average. Some organizations
reported using information about the available interviewing budget to set interviewing
performance thresholds on key measures. Some organizations indicated that they set quotas, pay
incentives and pay on a per completed interview basis. Decision makers in organizations
actively use productivity measures to establish levels of interviewer pay, to promote and reward
interviewers, and to terminate interviewers who are not meeting the organization’s standards of
performance. Some of the threshold levels of performance mentioned included: lowest 20%
advised to improve performance; lowest 33%; minimum of 56 dials/calls per interviewer hour;
completed interviews per hour for an individual is expected to approach the 50% group mean;

27 TSMII Tarnai & Moore 5-31-06 individual’s measures must be at average or above average compared to peers to stay employed;
individual’s measures must be at average or above average compared to peers to receive pay
raises; individual’s average across all projects worked must be at average or above average
compared to group mean for 12 months to receive pay increases; and productivity bonuses
awarded to the top 50% of productivity performers.
To better understand how organizations measure productivity the survey asked several
questions about how many calls per hour, completes per hour, and refusals per hour,
organizations expected for a 10-minute and a 20-minute RDD telephone survey. Table 17.3
displays respondents’ expectations about the number of call attempts that telephone interviewers
should be able to produce hourly for an RDD survey of the general public. The results show a
lack of consensus about the number of call attempts to be expected, although just more than half
(57.7%) of respondents suggest the number should be between 21 and 50 calls per hour. About
13% expected more than 50 call attempts per hour. Fewer than 10% expect less than 20 calls per
hour, and about 20% of respondents don’t know. Commercial organizations, in general, had
higher expectations than academic organizations.
Table 17.3 Telephone Interviewer Productivity Expected – Number of Call Attempts
Number of Call Attempts Percent Less than 20 9.2%21 to 30 18.5%31 to 40 21.5%41 to 50 17.7%51 to 60 6.2%61 to 70 3.8%71 to 80 0%More than 80 3.1%Don’t Know 20.0%Total 100%

28 TSMII Tarnai & Moore 5-31-06 Table 17.4 displays respondents’ expectations about the number of refusals that would be
expected from a telephone interviewer every hour from RDD surveys of the general public, of 10
minutes and 20 minutes in length. Again, there is no clear consensus on what should be
expected, with over 37% of organizations expecting fewer than three refusals per hour,
regardless of the length of the interview, and about the same percent expecting four or more
refusals per hour. Commercial organizations tended to expect a higher number of refusals than
academic or government organizations.
Table 17.4 Telephone Interviewer Productivity Expected – Number of Refusals
Number of Refusals
10-Minute RDD Survey
20-Minute RDD Survey
Less than one 4.6% 6.2% One 8.4% 8.5% Two 11.5% 10.0% Three 13.0% 12.3% Four 6.1% 8.5% Five 10.7% 9.2% More than Five 18.3% 20.0% Don’t Know 27.4% 25.3% Total 100% 100%
Table 17.5 displays respondents’ expectations about the number of completed interviews
that would be expected from a telephone interviewer every hour from RDD surveys of the
general public, of 10 minutes and 20 minutes in length. About 20% of all organizations would
expect no more than one 10-minute interview per interviewer hour. Another 50% of
organizations would expect between one and two 10-minute interviews per hour. In comparison,
about 65% of organizations would expect no more than one 20-minute interview per hour for a
20-minute telephone interview. Commercial organizations again tended to expect a higher
number of completed interviews per hour than academic or government organizations.

29 TSMII Tarnai & Moore 5-31-06
Table 17.5 Telephone Interviewer Productivity Expected – Number of Completions
Number of Completed Interviews per Hour
10-Minute RDD Survey
20-Minute RDD Survey
About half an interview 0% 9.8% More than half but less than one 2.3% 22.7% About one 17.3% 32.6% Up to one and a half 21.1% 18.9% About two 29.3% 3.8% More than two 18.8% 0.8% Don’t Know 11.2% 11.4% Total 100% 100%
17.4.2 Using Interviewer Performance Information
Next we describe how survey research organizations use the data they collect on
interviewer performance, including whether they use it to forecast the progress of a survey, or
interviewing needs, and in particular whether they use it for improving their training of
telephone interviewers. The survey results also describe how survey organizations deal with the
issue of productivity in training interviewers.
Most organizations, 69.9% indicate that interviewer performance is very important to
their organization but only 26.5% of organizations say they are very satisfied with the way their
organization uses interviewer performance data and this exemplifies the challenge organizations
face in trying to change their business operations and to estimate their costs of production. Table
17.6 displays the percent of organizations that say they use productivity measures in each of
several ways. The majority of organizations said they used productivity to accomplish all but
one of the goals listed in the table. Almost 96% of organizations said they used performance
measures to communicate expectations to interviewers, but only 62.7% of organizations said

30 TSMII Tarnai & Moore 5-31-06 they used them to recalibrate their interviewing standards. The least use of performance
interview information is in making adjustments to fielded sample. While almost 86.7% of
organizations used performance measures to terminate poor or excessively unproductive
interviewers, only 68.2% use them to reward highly productive interviewers. Performance
measures are important to interviewer training, since almost 82.8% of organizations say they use
them to retrain unproductive interviewers, and 87.5% say they use them to train new
interviewers.
Table 17.6 How Survey Organizations Use Interviewer Performance Measures
Performance Measure Used for
Percent of Organizations
Forecasting the number of interviewers needed 83.6%
Forecasting the number of days required to reach survey goals 86.0%
Rewarding highly productive interviewers 68.2%
Terminating poor or excessively unproductive interviewers 86.7%
Reassigning interviewers based on their productivity 76.6%
Making adjustments in fielded sample replicates 39.4%
Communicating expectations to interviewers 96.1%
Retraining unproductive interviewers 82.8%
Training new interviewers on productivity issues 87.5%
Resetting or calibrating standards of interviewer performance 62.7%
17.4.3 Training and Retraining Telephone Interviewers
This section describes the telephone interviewing skills that survey organizations indicate

31 TSMII Tarnai & Moore 5-31-06 are important to being a productive telephone interviewer. We also discuss how survey
organizations train and retrain telephone interviewers to improve their performance and
productivity.
The basic skills required of interviewers include interacting with a computer through a
keyboard and/or mouse, and sufficient typing ability to enter respondent comments and other
text into a computer. All of these skills are trainable, although it is generally easier to find
people who already have typing skills than to train people in this skill. Average time reported
for training the basics of interviewing in the survey was 6.5 hours or less for 65.8% of centers.
Only about one third of organizations reported more than 6 hours of basic training for
interviewers. Longer trainings for basic interviewing was associated with organizations that
annually hire larger numbers (151-200+ annually) of part time interviewers.
The vast majority (99.3%) of the survey research organizations conduct trainings for all
new telephone interviewers before they can begin interviewing on a study. Better than 96%
reported holding at least two types of regular trainings---interviewing basics and project level
trainings. More than 91.7% of these organizations report following written standardized basic
training procedures for developing the skills of newly hired telephone interviewers (Table 17.7).
Supervisors in more than 88% of the organizations follow a standardized basic training system.
There is large variation in the reported average training times per interviewer devoted to specific
trainings. For instance, training the basics of interviewing for organizations ranged from a low
of 30 minutes to a high of 30 hours, with the average training time for basic interviewing at 6.6
hours, with four hours as the most frequently reported duration of training. Of the types offered,
the most intensive trainings (as measured by average training hours per interviewer) were

32 TSMII Tarnai & Moore 5-31-06 interviewing basics, computer based individual trainings (73.4%, with an average of 3.8
hours/interviewer) , and advanced interviewer trainings (56%, with an average of 3.3
hours/interviewer), respectively. Almost three fourths of all organizations (74%) answering the
survey indicated they conducted remedial or performance improvement trainings. Of the 84
organizations that conduct remedial trainings, 54.1% spend one hour or less for this type of
training.
Table 17.7 Types of Interviewer Training and Average Number of Training Hours
Percent of Organizations
Average Number
Types of Trainings N No Yes of Hours
Training the basics of interviewing 130 1.5 98.5 6.5
Specific project training 129 3.9 96.1 3.0
Computer based individual interviewer training
128 26.6 73.4 3.9
Remedial or performance improvement training
123 26.0 74.0 1.8
Advanced interviewer training 128 45.3 54.7 3.3
Table 17.8 shows the results of asking organizations to rate the extent to which they
included each of 22 separate topics in basic interviewer trainings. Organizations report they
included most of these topics or activities “always” into their basic training with the exception of
“pre-testing with actual respondents.” Only three activities were described as not always
included by 60% or more of organizations, including: explanation of survey and interviewer
error; how to tailor survey introductions; and pre-testing with actual respondents. The top
twelve ranked training topics are essential elements to performing interviewing and
understanding how to recruit and talk with respondents and code their responses into a database.

33 TSMII Tarnai & Moore 5-31-06 The remaining ten topics and activities are associated with understanding how to do particular
aspects of interviewing better. These latter topics are somewhat more complex and theoretical in
nature. If we assume that organizations included most of these topics in their interviewer
training, and we assume an average length of basic interviewer training of about seven hours,
then on average, less than 20 minutes is available for each topic or activity in basic interviewing
training.
Advanced interviewer trainings are conducted by about half (54.7%), of the organizations
with the average advanced training time reported for an individual interviewer as 3.25 hours.
There are at least two reasons why organizations conduct advanced training for interviewers.
The first is to train experienced interviewers for supervisory and other kinds of positions (e.g.
monitoring). The goal of advanced training is to prepare them to evaluate other interviewers in
their job function and to provide specific feedback to rectify identified problems and to maintain
or improve quality of interviewing of the group or pool of interviewers.
A second purpose of advanced training is to train specific interviewers more in-depth,
providing them with more background, tools, and theoretical information with the specific intent
to keep them interviewing. This second group of interviewers may be asked to do recontacts of
refusals or to do more difficult interviewing. Interviewers identified for advanced training are
counted on for high performance interviewing. Table 17.9 provides a list of topics included in
advanced interviewer training, and shows the frequencies with which organizations cover
various topics.
Table 17.8 Topics and Activities Included in Basic Telephone Interviewer Training

34 TSMII Tarnai & Moore 5-31-06 Percent
Topics and Activities
N
Always
Sometimes
Rarely/ Never
Don’t know
Rules for standardized interviewing 124 95.2 4.0 0.8 0 Explanation and examples of probing and feedback
122 95.1 3.3 1.6 0
Demonstration of how to use CATI system 124 90.4 4.8 4.8 0
Explanation of types of questions (categorical vs. open ended)
122 90.2 5.7 4.1 0
Explanation of respondent reluctance and cooperation
121 90.1 8.3 1.6 0
Proper interaction with respondents 124 88.7 8.9 2.4 0
Addressing respondent concerns 122 87.7 9.8 2.5 0
Explanation of survey introductions 123 86.2 12.2 1.6 0
Practice and role play by interviewers 124 86.3 9.7 4.0 0
Explanation of refusal behavior and interactions 122 84.5 11.5 3.2 0.8
Explanation/use of case disposition codes 121 82.6 10.7 4.1 2.6
Practice and role playing mock interviews 124 82.3 11.3 6.4 0
Data entry errors and ways to make corrections 122 81.1 10.7 8.2 0
Explanation of research ethics 122 79.6 13.9 5.7 0.8
How to control making interviewer errors 124 75.8 13.7 8.0 2.5
Expectations of interview performance and how performance is measured
121
73.6
14.0
9.9
2.5
Explanation and practice of dialing 124 72.6 11.3 15.3 0.8
Human subjects research and confidentiality 121 67.8 17.4 12.4 2.4
Special emergency situations and what to do 121 66.9 21.5 10.8 0.8
Scenario testing of questionnaire branching 123 62.6 13.0 20.3 4.1
Explanation of survey and interviewer error 124 57.3 15.3 22.6 4.8
How to tailor survey introductions 123 54.5 20.3 25.2 0
Pretest with actual respondents 121 28.1 34.7 36.4 0.8
For advanced interviewer trainings the focus of topics is more towards improving an
individual interviewer’s skill for increasing survey participation and countering non-response

35 TSMII Tarnai & Moore 5-31-06 rather than training about overall performance issues, performance measurement, or rating other
interviewers’ for performance.
Table 17.9 Advance Interviewer Training Topics and Activities
Percent of Organizations Topics and Activities
N
Always
Sometimes
Rarely/ Never
Don’t know
Recognition of respondent concerns 115 60.9 19.1 15.6 4.4 Recognition of improper interactions 114 53.5 22.8 18.4 5.3 Refusal conversion techniques 114 57.9 25.4 12.3 4.4 Diagnosing poor interactions or introductions
115
47.8
26.1
20.8
5.3
Monitoring and scoring interviewer performance
113
46.9
25.7
21.2
6.2
Expectations of performance measurement system
112
43.8
25.9
24.1
6.1
Recognition of errors 114 43.0 28.1 21.9 7.0 How to provide feedback on performance
115 40.9 24.3 26.1 8.7
Table 17.10 Methods Organizations Use to Train Interviewers
Percentage N Always Sometimes Rarely/
Never Don’t Know
Project specific training at the beginning of all new telephone projects
122 90.2 9.0 0.8 0
Basic interviewing skills training 124 86.3 10.5 3.2 0 Scenario testing of specific questionnaire skip patterns for projects
123 75.6 13.8 10.6 0
Practice mock interviews 123 64.3 24.4 10.5 0.8 Pretest with actual respondents 123 22.8 32.5 43.9 0.8 Interviewer knowledge test to certify onto a project
122 19.7 23.0 56.6 0.7
Audio sample of interview 123 8.9 22.0 69.1 0
Table 17.11 Use of Specialized Training for Improving Interviewer Performance.
Percentage

36 TSMII Tarnai & Moore 5-31-06
N Always Sometimes Rarely/Never
Don’t Know
Actual audio samples of survey introductions
122 5.7 20.5 71.3 2.5
Audio samples of effective interviewing interactions
122 4.1 24.6 68.8 2.5
Audio examples of respondent – interviewer interactions
121 4.1 26.4 67.0 2.5
Practice drills to increase recognition and rapid response to respondent concerns
122 18.9 29.5 47.5 4.1
Practice or role play mock interviews 120 54.2 23.3 19.2 3.3
17.5 DISCUSSION AND CONCLUSIONS
A common concern of all survey organizations is how to prepare a telephone interviewer
workforce for conducting telephone interviews in the most efficient and cost effective manner
possible. While a large percentage of survey centers (95.2%) regularly collect productivity
information on interviewers and it is readily available to them for decision making, only 54.4%
use this information as a way analyze and to make decisions about interviewers. The main
differences we find between survey organizations is in the average number of hours per
interviewer they devote to trainings, inclusion of training topics, use of specialized training
activities, and the ways they monitor and evaluate interviewer productivity. We found very few
organizations consistently using specialized training tools and activities that look at effectiveness
of interviewing techniques such as analyzing and demonstrating audio samples of introductions
or in-interview interactions, rapid response drills to respondent concerns, and knowledge
certification. However, some organizations are beginning to venture into regularly using these
tools as a way to improve surveying.

37 TSMII Tarnai & Moore 5-31-06 17.5.1 Measuring Interviewer Productivity
Survey organizations that conduct telephone interviews are concerned about productivity,
they collect a variety of productivity data, and some use these data to identify interviewers to
receive further training or to be let go. The majority of organizations use productivity measures
based on interview completions, such as number of completed interviews or completion rate,
although many also look at measures such as number of calls per hour, rate of refusals, and
simple attendance. As our analysis of some of these measures demonstrates, the absolute levels
of these measures changes during the course of a survey so that organizations need to take into
account at what stage of a survey productivity is measured.
The most frequently used productivity measures for telephone interviewing are call
attempts per hour, and completes per hour. The majority of survey organizations collect this
information routinely, and it is available to most through their CATI system continuously while
a survey is in the field. There is not a clear consensus on the number of call attempts, refusals,
or the number of completed interviews a telephone interviewer should be able to produce in one
hour. The major differences seem to be between commercial survey organizations and the non
commercial organizations. Commercial organizations expect a higher number of completed
interviews per hour from their telephone interviewers, and they also tolerate a higher number of
refusals per hour, than the noncommercial organizations. For a 10-minute RDD survey, 68% of
commercial organizations expect two or more completed interviews per hour, in comparison to
only 31% of non-commercial organizations that expect this. For a 10-minute RDD survey, 56%
of commercial organizations expect five or more refusals per hour, in comparison to only 13% of
non-commercial organizations that expect this.

38 TSMII Tarnai & Moore 5-31-06 The results for a 20-minute RDD survey similarly reveal differences between the
commercial survey organizations and the non-commercial survey organizations. Over 75% of
commercial organizations would expect one or more completed interviews per hour, in
comparison to only 39% of non-commercial organizations. Over 47% of commercial
organizations would expect five or more refusals per hour, from a 20-minute RDD survey, in
comparison to fewer than 13% of non-commercial organizations. Clearly standards of
interviewer productivity differ among survey research organizations, and are dependent on the
specific goals of each organization.
These differences between commercial and non-commercial survey organizations are
also apparent in how productivity information is used. A higher percentage of commercial
organizations (45%) use performance measures to make adjustments in fielded sample, than non-
commercial organizations (32%). And, a higher percentage of commercial organizations (84%)
than non-commercial organizations (65%) use performance measures to reassign interviewers
based on their productivity and performance.
17.5.2 Training, Evaluating, and Rewarding Telephone Interviewers
This paper presents the results of a survey of telephone interview organizations and their
practices with respect to managing and training interviewers, and measuring productivity. From
these data, we suggest a number of themes regarding what measures of productivity are most
useful, and how to use this information to train interviewers.
Evidence from the survey of survey research organizations suggests that best practice for
managing interviewers must be continual evaluation of their most important activity -
interviewing. The majority of organizations depend on systems for developing interviewing

39 TSMII Tarnai & Moore 5-31-06 skills through on-going assessment of individuals and providing them with routine feedback on
interviewing behaviors. These systems in terms of best practices include having written training
protocols, experienced trainers, and a well-trained supervisory and monitoring force.
Organizations offering the most innovation in training are focusing on productivity measures and
using this system to decide on training issues and establish reinforcements for improving
interviewer behavior. Other signs of innovation are the use of measures other than response
rates that extend productivity to also encompass interviewer effectiveness such as the variability
of average interview length, use of audio recordings, analyses of survey content variables for
outliers, and interviewer knowledge certification. Assessing the rate of data capture for specific
variables is another area important for improving quality of statistics yet not typically measured
by organizations for evaluating interviewer effectiveness.
The survey results demonstrate how different survey organizations vary in their
expectations of interviewer productivity, and how this translates into differences in interviewer
training. Ultimately, survey error may be significantly impacted by these types of interviewer
management decisions and goals. We believe that there is much more that survey organizations
can do with the productivity data that they routinely collect, and that these data will become
increasingly important as a way to control survey costs and improve the management and
training of telephone interviewers.

40 TSMII Tarnai & Moore 5-31-06 ACKNOWLEDGMENTS
Opinions expressed in this chapter are those of the authors and do not represent those of
Washington State University. We would like to thank all of the people who participated in the
Internet survey of organizations, and all those who willingly provided us with copies of their
training materials. We also want to thank Jim Lepkowski and Clyde Tucker for writing the
cover letter and endorsing the survey.
REFERENCES
Anton, J. (1997) Call Center Management, West Lafayett, IN: Purdue University Press.
Berry, S. H. & O'Rourke, D. (1988). Administrative designs for centralized telephone survey
centers: Implications of the transition to CATI. In: R. M. Groves, P. Biemer, L. Lyberg,
J. Massey, W. L. Nicholls, J. Waksberg (Eds.) Telephone Survey Methodology. New
York: Wiley.
Dillman, D. A. (1978). Mail and Telephone Surveys: The Total Design Method. New York:
Wiley.
Fellows, C. & Mawhinney, T.C. (1997). Improving telemarketers’ performance in the short-run
using operant concepts. Journal of Business and Psychology, 11(4), 411-424.
Fowler, F. J., Jr. (1984) Survey Research Methods. (Applied Social Research Methods Series,
Volume 1.) Newbury Park, CA: Sage.
Frey, J. H. (1983) Survey Research by Telephone. (Sage Library of Social Research, Volume
150.) Beverly Hills, CA: Sage.
Groves, R. M., Fowler, F. J., Couper, M. P., Lepkowski, J. M, Singer, E., and Tourangeau, R.
(2004) Survey Methodology. New York: Wiley.

41 TSMII Tarnai & Moore 5-31-06 Groves, R.M., and Couper, M. (1998) Nonresponse in Household Surveys, New York: John
Wiley.
Groves, R. M. and McGonagle, K.A. (2001) “A Theory-Guided Interviewer Training Protocol
Regarding Survey Participation” Journal of Official Statistics, vol. 17, No. 2. 249-265.
Groves, R. M., Cialdini, R.B., and Couper, M.P. (1992) Understanding the Decision to
Participate in a Survey” Public Opinion Quarterly, Vol. 56, no. 4 475-495.
International Standards Organization (2005) Market, Opinion and Social Research – Service
Requirements, ISO/DIS 20252, Secretariat: AENOR: Spain.
Lavrakas, P. J. (1987) Telephone Survey Methods. (Applied Social Research Methods Series,
Volume 7.) Newbury Park, CA: Sage.
Lavrakas, P. J. (1993) Telephone Survey Methods. 2nd Ed.(Applied Social Research Methods
Series) Newbury Park, CA: Sage.
Link, M., P. Armsby, R. Hubal, and C. Guinn. (2004). “Accessibility and Acceptance of
Responsive Virtual Human Technology as a Telephone Interviewer Training Tool.”
Computers in Human Behavior 22:412-426.
Link, M. (In Press). “Predicting Persistence and Performance among Newly Recruited
Telephone Interviewers.” Field Methods.
Mayer, T. S. and O’Brien, E. (2001) Interviewer Refusal Aversion Training to Increase Survey
Participation. Presented at the Joint Statistical Meetings of the American Statistical
Association, Atlanta, GA, August 2001.
Morganstein, D. & Marker, D. A. (1997). Continuous Quality Improvement in Statistical
Agencies. In: L. Lyberg, P. Biemer, M. Collins, E. de Leeuw, C. Dippo, N. Schwarz, D.

42 TSMII Tarnai & Moore 5-31-06
Trewin (Eds.) Survey Measurement and Process Quality. New York: Wiley.
Parsley Edwards, T., Suresh, R., & Weeks, M. F. (1998) Automated Call Scheduling: Current
Systems and Practices. In: M. P. Couper, R. P. Baker, J. Bethlehem, C. Z. F. Clark, J.
Martin, W. L. Nicholls II, & J. M. O’Reilly (Eds.) Computer Assisted Survey
Information Collection. New York: Wiley.
Shuttles, C. D., Welch, J. S., Hoover, J. B., & Lavrakas, P. J. (2003) Countering Nonresponse
Through Interviewer: Avoiding Refusals Training, Presented at the 58th Annual
Conference of the American Association for Public Opinion Research, May 18,
Nashville, TN.
Shuttles, C. D., Welch, J. S., Hoover, J. B., & Lavrakas, P. J. (2002) The Development and
Experimental Testing of an Innovative Approach to Training Telephone Interviewers to
Avoid Refusals, Presented at the 57th Annual Conference of the American Association
for Public Opinion Research, May 17, St. Petersburg Beach, FL.
Stanton, H., Back, K.W., and Litwak, E. (1956) “ Role Playing in Survey Research” Journal of
the American Statistical Association, Vol. 62, no. 2, Pp. 172-176.
Steinkamp, S. (1964) “The Identification of Effective Interviewers” Journal of the American
Statistical Association, vol. 59, no. 308, Pp. 1165-1174.
Thurkow, N. M., Bailey, J. S., & Stamper, M. R. (2000) “The effects of group and individual
monetary incentives on productivity of telephone interviewers” Journal of Organizational
Behavior Management, vol. 20, no. 2, Pp. 3-
Waite, A. J. (2001) A Practical Guide to Call Center Technology. New York: CMP Books.
Weinberg, E. (1983). Data Collection: Planning and Management. In P. H. Rossi, J. D.

43 TSMII Tarnai & Moore 5-31-06
Wright, A. B. Anderson (Eds.) Handbook of Survey Research. New York: Academic
Press.