measurement of the residual stress field in mig-welded al-2024 and al-7150 aluminium alloy compact...
TRANSCRIPT

A
(iwa©
K
1
wscapldtPtcccmOb
cH
0d
Materials Science and Engineering A 437 (2006) 46–53
Measurement of the residual stress field in MIG-welded Al-2024 andAl-7150 aluminium alloy compact tension specimens
S. Pratihar a, V. Stelmukh a, M.T. Hutchings a, M.E. Fitzpatrick a, U. Stuhr b, L. Edwards a,∗a Department of Materials Engineering, The Open University, Milton Keynes MK7 6AA, UK
b Paul Scherrer Institut, CH-5232 Villigen PSI, Switzerland
Received 12 September 2005; accepted 15 April 2006
bstract
Neutron diffraction has been used to measure the residual-stress field in MIG-welded Al-2024 and Al-7150 aluminium alloy compact-tensionCT) specimens. The measurements were made on the POLDI time-of-flight diffractometer, which uses a multiple frame overlap method. Strains
n the three principal directions of each specimen were determined from the measured lattice plane spacing as a function of position through theeld relative to stress-free reference lattice plane spacings obtained from a comb-like reference sample. The resultant calculated residual stressesre compared to those existing in the original welded plate from which the specimens were machined.2006 Elsevier B.V. All rights reserved.
ess; M
dguitcStfassasawitm
eywords: Aluminium alloys; Neutron diffraction; Time-of-flight; Residual str
. Introduction
In recent years neutron diffraction has become a reliable andell-used technique to determine residual strains, and hence
tresses, in crystalline materials. It remains the only techniqueapable of determining the residual stress field deep insidepolycrystalline material non-destructively. The basic princi-
le of neutron-diffraction-strain measurement lies in Bragg’saw, which enables the average inter-planar lattice spacing of aefined volume of the specimen to be determined from the neu-ron wavelength, and the angular position of a diffraction peak.rovided that a reference unstressed lattice spacing is known
he strain can then be calculated. When a material or specimenontains variations in the unstressed lattice spacing owing tohanges in local composition or microstructure, as in the presentase, the variation in reference lattice spacing must be deter-ined from an identical unstressed specimen of the material.nce the principal strains have been determined, the stress cane calculated using Hooke’s law.
Welding is a potentially beneficial fastening process for air-raft construction as it reduces weight as well as lowers cost [1].owever, during welding, a substantial residual stress field may
∗ Corresponding author. Tel.: +44 1908 653255; fax: +44 1908 653858.E-mail address: [email protected] (L. Edwards).
swaPicw
921-5093/$ – see front matter © 2006 Elsevier B.V. All rights reserved.oi:10.1016/j.msea.2006.04.061
IG welding
evelop as the process necessarily involves large temperatureradients from weld metal to bulk material. Since this resid-al stress affects the fatigue life of a welded component [2,3],t is essential to have precise knowledge of its variation acrosshe weld. Fatigue and fracture properties are most easily andommonly measured on standard laboratory sized specimens.imilarly, most work on the effects of residual stresses on frac-
ure and fatigue uses these standard specimens. Traditionally,racture mechanics assumes that the properties measured onlaboratory-sized specimen are applicable to a component or
tructure as long as the two conditions of similitude and smallcale yielding hold true. Whilst the introduction of a weld intolaboratory specimen may not change its conditions regarding
mall scale yielding, no assumption of similitude can be mades there is no “a priori’ reason why the residual stresses in aelded component or structure and a laboratory fracture spec-
men should be the same. To gain experimental evidence as tohe extent of similitude in such circumstances here, we report
easurements of the residual stress field in compact-tensionpecimens machined from high quality metal inert gas (MIG)elded Al-2024 and Al-7150 plates, typifying welds used in the
ircraft industry, using the POLDI neutron diffractometer at the
aul Scherrer Institute (PSI) SINQ neutron source [4]. This works part of a large integrated program on the determination andonsequences of residual stresses on the fatigue performance ofelded aircraft structures [5].

S. Pratihar et al. / Materials Science and Engineering A 437 (2006) 46–53 47
of th
1
flvr
λ
wtpa
d
wdtb
ε
w
tstsPimoerdaoptfsr
Titts(rm
gifimIaAbs1
1
AmtpGeT
iwfiller wire of composition 6.2% Cu, 0.17% Fe and 0.32% Mn.There was no post-weld heat treatment other than natural ageing.
The pre-welded Al-7150 alloy plates were W51 treated: thatis solution treated, quenched and stress-relieved by stretching in
Table 1The typical chemical composition of the alloys, weight percent (wt.%) [8]
Fig. 1. Schematic diagram
.1. Basic concept of the POLDI diffractometer
A conventional time-of-flight (TOF) diffractometer uses theight time, t, of a neutron over a fixed path, L, to determine itselocity, v, and, hence, its wavelength, λ, from the de Broglieelation:
= h
mnv= ht
mnL(1)
here h is the Planck’s constant, and mn is the neutron mass. Ifhe scattering angle at the specimen, φs, is known, the h k l latticelanes with lattice spacing, dh k l, give rise to Bragg diffractiont this angle if:
h k l = λ
2sin
(φs
2
)= hth k l
2mnL sin(φs/2)(2)
here th k l is the flight time of the h k l diffraction peak in theiffraction pattern of intensity versus time-of-flight to the detec-or. In general, the lattice strain for the h k l reflection is giveny
h k l = dh k l − d0h k l
d0h k l
(3)
here d0h k l is the stress-free lattice parameter.
Using a conventional TOF instrument on a continuous neu-ron source, the need to determine t accurately necessitates ahort time pulse and long flight path, L. The incident beam onhe sample is defined in time by a rotating ‘chopper’ giving ahort pulse with a short duty cycle of useful beam time. TheOLDI instrument at SINQ uses a method of frame overlap to
ncrease the duty cycle over that of a conventional TOF instru-ent on a continuous flux neutron source to 5.8% [6]. The layout
f the instrument is shown in Fig. 1. A neutron mirror with anlliptical surface defines the polychromatic incident beam andeduces the background. The beam is modulated in time using aisc chopper with eight apertures cut at random angular spacinground the edge over a 90◦ sector. These are accurately repeatedver the other quadrants, to give a known sequence of shortulses. At the highest chopper speed of 15,000 rpm the length of
he pulses is 8 �s. The neutron count from the eight overlappingrames are collected from a time-focused He3 PSD (position sen-itive detector) at about 2 m distance from the sample over a 30◦ange of scattering angle. The total flight path is nearly 14 m.A
AA
e POLDI instrument [4].
he overlapping TOF diffraction patterns are deconvolved bydentifying their time origin from their time intervals, and fromhe slope of peak intensity contours in a plot of intensity versusime of arrival, t, and scattering angle, φs. The instrument alsouppresses the neutrons below a well-defined cut-off wavelength1.1 A) by using neutron optics to define the incident beam. Aesolution of �d/d ∼ 2 × 10⁻³ FWHM (full width half maxi-um) can be attained.The instrumental gauge volume (IGV) defines the sampled
auge volume (SGV) over which the measured strain is averagedn a diffraction experiment. Provided the specimen completelylls the IGV, and has a low absorption, the position of straineasurement in the sample will be essentially at the centre of the
GV. The IGV is defined by slit apertures in the incoming beamnd by a focussing soller slit assembly in the scattered beam.lthough the angle between the incoming beam and diffractedeam is usually chosen to be close to 90◦ so as to optimise thepatial resolution of the measurements, an additional option of05◦ is also available.
.2. Sample description
The specimens investigated were MIG-welded Al-2024 andl-7150 welded plates in the form of compact-tension speci-ens used in the determination of the fatigue and fracture proper-
ies of materials. In each case, two 500 mm × 186 mm × 12 mmlates were joined by double-pass MIG-welding by the Weldingroup at Cranfield University using optimised welding param-
ters [7]. The nominal compositions of the alloys are given inable 1.
The pre-welded Al-2024 alloy plates were T351 treated: thats solution treated, cold worked, and naturally aged. The platesere double vee prepared and two-pass MIG welded with 2319
lloy Cu Mg Mn Zn Si Fe Al
l-2024 4.00 1.20 0.5 <0.25 <0.15 <0.20 Ball-7150 1.9–2.5 2.0–2.7 – 5.9–6.9 0.12 1.5 Bal

48 S. Pratihar et al. / Materials Science and Engineering A 437 (2006) 46–53
Fo
ttow
ncs
2
umAgrrrowspspdcwsc
coFwisf
tinonwt
2
pictlun(
stv9at2
2.2. Data analysis
The overlapping diffraction patterns were deconvolved togive the variation of intensity versus lattice spacing, dh k l, in
ig. 2. Schematic diagram of the geometry of the two samples, with the locationf points at which the strain was measured.
he rolling direction. These plates were double vee prepared andwo-pass MIG welded with 5039 wire, which has a compositionf 3.3–4.3% Mg; 2.4–3.2% Zn. After welding the specimensere post-weld heat-treated (PWHT) to the T651 condition.Finally, each 12 mm thick welded plate was reduced in thick-
ess to 7 mm following a procedure that could be adopted in air-raft manufacture before being machined into compact-tensionpecimens of dimensions shown in Fig. 2.
. Experimental details
All measurements on the Al-2024 specimen were undertakensing a mean scattering angle of 2θ = 90◦. However, previouseasurements had shown the presence of strong texture in thel-7150 specimen [9,10]. Thus, the strain component in the lon-itudinal direction (LD) was measured using only the (4 2 2)eflection, in the transverse direction (TD) using only the (2 2 2)eflection and in the normal direction (ND) using only the (2 2 0)eflection. Since at a scattering angle, φs = 2θ = 90◦, observationf the (4 2 2) peak requires neutrons of wavelength of λ = 1.17 A,hich is close to POLDI’s cut-off wavelength of 1.1 A [4], the
cattering angle was increased to φs = 2θ = 105◦. The diffractionattern from a standard Si sample with accurately known latticepacing was used to calibrate the wavelength range, the flightath, L, and the zero of the scattering angle. In addition, a stan-ard Al powder sample was also measured in order to be able toompare the d-spacing obtained from the present measurementsith those from previous experiments made using other neutron
ources and the synchrotron X-ray technique. Recalibration wasarried out after the scattering angle, φs, was changed to 105◦.
The specimens were mounted, in turn, on the computer-ontrolled stage, which enabled them to be translated in threerthogonal directions through the instrumental gauge volume.or both specimens scans were made across the weld, co-planar
ith the crack direction, along the mid thickness of the spec-men, as shown in Fig. 2. By re-orientating of the sample, thetrain component in three orthogonal directions was determinedor each sample position. The specimen, mounted on the sample
Fd
Fig. 3. Experimental setup in POLDI.
able for the measurement of strain in the LD direction, is shownn Fig. 3. For the measurement of the longitudinal strain compo-ent, a gauge volume of 2 mm × 2.5 mm × 1.5 mm was used. Inrder to optimise the measurement time for the transverse andormal directions, a gauge volume of 2 mm × 10 mm × 1.5 mmas used, averaging the strain along the weld longitudinal direc-
ion where it was not expected to vary significantly (Fig. 4).
.1. Stress-free reference lattice spacing
In a welded sample, it is critically important to measure theoint-to-point variation of the stress-free reference lattice spac-ng, d0, since this value can vary significantly due to changes inhemical or structural composition, both in the weld itself and inhe heat-affected zone (HAZ) [11,12]. The stress-free referenceattice parameters across the weld were, therefore, determinedsing comb specimens, obtained from sections across the origi-al 12 mm thick weld (Fig. 5) using electro-discharge machiningEDM).
The resulting comb contained teeth centred at points corre-ponding to each position of strain measurement small enougho be essentially stress-free [10]: the dimensions of each indi-idual tooth were 2.4 mm × 2.7 mm on the LD–TD plane, andmm along the ND. The strain components were measuredlong the three principal directions at the positions within eachooth, corresponding to those in the original specimens, using amm × 2.5 mm × 1.5 mm gauge volume.
ig. 4. A comb specimen from which the stress-free lattice parameters wereetermined.

S. Pratihar et al. / Materials Science and
Ftd
twlpitaluct
t
〈
w
s
t
ε
Stattso[ttmtTsoa
mdfe
wmcl
σ
Eused.
In the case of the strongly textured MIG-welded Al-7150specimen, different reflections were used to measure the straincomponents in the three principal directions. The (4 2 2), (2 2 2),
ig. 5. (a) De-convolved diffraction spectrum and (b) the fitted diffraction spec-rum of the Al-2024 specimen measured with the scattering vector in the LDirection.
he range sampled by the instrument. The profile of each peakas fitted using a Levenberg–Marquardt routine [4] to give the
attice spacing of individual peaks. Although as many as 10eaks were observed in the diffraction spectra of the Al powder,n the case of the Al-2024 specimen, although there was littleexture present, the collection of statistically significant data forll 10 peaks was prohibitively time consuming, so data was col-ected to allow only the strongest 4–5 peaks to be ‘fitted’ andsed to calculate an average lattice parameter 〈a〉. A typical de-onvolved diffraction spectrum from the Al-2024 specimen andhe final fitted spectrum are shown in Fig. 5.
The weighted average lattice parameter value 〈a〉 of the fouro five individual peaks h k l used in the analysis is given by
a〉 =∑
h k l(dh k l
√h2 + k2 + l2/|�dh k l|)∑ (4)
h k l(1/�dh k l)
here �dh k l is the uncertainty in the measured dh k l.This average lattice spacing, and that from each point in the
tress-free comb specimen, 〈a0〉, were used to calculate the strainFc
Engineering A 437 (2006) 46–53 49
hus:
= 〈a〉 − 〈a0〉〈a0〉 (5)
ince extensive data for 〈a0〉 had been previously obtained forhe Al-2024 comb using the ENGIN [15] instrument at ISIS, onlyrelatively small number of measurements were performed on
his comb specimen using POLDI: principally components inhe longitudinal and transverse directions. In the previous mea-urements, data obtained for the strain-free lattice parametersf many reflections were averaged using a Rietveld refinement16] to give an representative average lattice parameter. Usinghe standard Al powder sample to normalise the data from thewo sets of measurements, a comparison of the present measure-
ents of the longitudinal direction in the same comb sample withhat of the more accurate data from ENGIN, is shown in Fig. 6.he trends and values are very similar, and so for the Al-2024pecimen, the more accurate stress-free lattice parameter valuesbtained using ENGIN were, therefore, used as references at theppropriate positions to calculate the strain.
As different reflections were used for each strain measure-ent direction in the Al-7150 sample, a comprehensive set of
0 measurements along each of the strain directions were per-ormed on the Al-7150 comb using the relevant reflection inach case.
It is assumed that the symmetry directions in which the strainas measured are in fact principal directions. The strains, εii,easured in these three principal directions, i = 1, 2, 3, were
ombined and, with appropriate elastic constants, used to calcu-ate the stress, σii, in each direction from Hooke’s Law. Thus:
ii = E
1 + νεii + νE
(1 + ν)(1 − 2ν)Σεjj (6)
lastic constants, E = 72 MPa and Poisson’s ratio ν = 0.34 were
ig. 6. Comparison of values of stress-free lattice parameters from the Al-2024omb specimen obtained at ENGIN and POLDI.
5 e and
at
spte
ε
ε
ε
Turc
p∼o2isa
3
3
nlt
Fw
0 S. Pratihar et al. / Materials Scienc
nd (2 2 0) peaks were used as described in the previous sectionso determine the strain components.
The strain in each direction was calculated from the latticepacing, dh k l, of the individual reflections. The stress-free latticearameter values obtained from the corresponding positions inhe Al-7150 comb were used to calculate the strain, using thexpressions:
LD = ε4 2 2 = d4 2 2 − d04 2 2
d04 2 2
(7a)
TD = ε2 2 2 = d2 2 2 − d02 2 2
d02 2 2
(7b)
ND = ε2 2 0 = d2 2 0 − d02 2 0
d02 2 0
(7c)
he stress components were calculated from these strain valuessing Fig. 6. The same elastic constants were used for all threeeflections since the degree of elastic anisotropy is small in thease of aluminium alloys, with the maximum deviation of any
mlwt
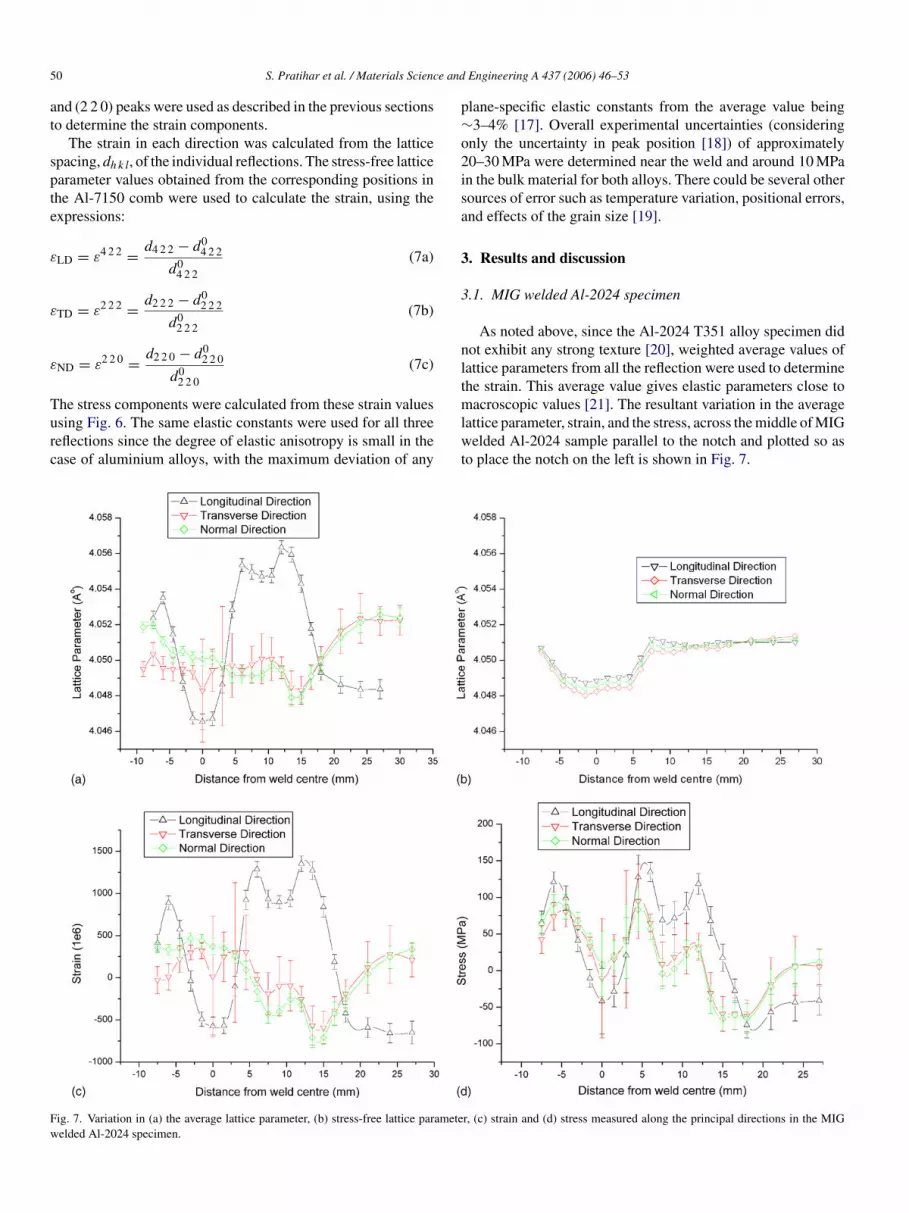
ig. 7. Variation in (a) the average lattice parameter, (b) stress-free lattice parameteelded Al-2024 specimen.
Engineering A 437 (2006) 46–53
lane-specific elastic constants from the average value being3–4% [17]. Overall experimental uncertainties (considering
nly the uncertainty in peak position [18]) of approximately0–30 MPa were determined near the weld and around 10 MPan the bulk material for both alloys. There could be several otherources of error such as temperature variation, positional errors,nd effects of the grain size [19].
. Results and discussion
.1. MIG welded Al-2024 specimen
As noted above, since the Al-2024 T351 alloy specimen didot exhibit any strong texture [20], weighted average values ofattice parameters from all the reflection were used to determinehe strain. This average value gives elastic parameters close to
acroscopic values [21]. The resultant variation in the averageattice parameter, strain, and the stress, across the middle of MIGelded Al-2024 sample parallel to the notch and plotted so as
o place the notch on the left is shown in Fig. 7.
r, (c) strain and (d) stress measured along the principal directions in the MIG
S. Pratihar et al. / Materials Science and
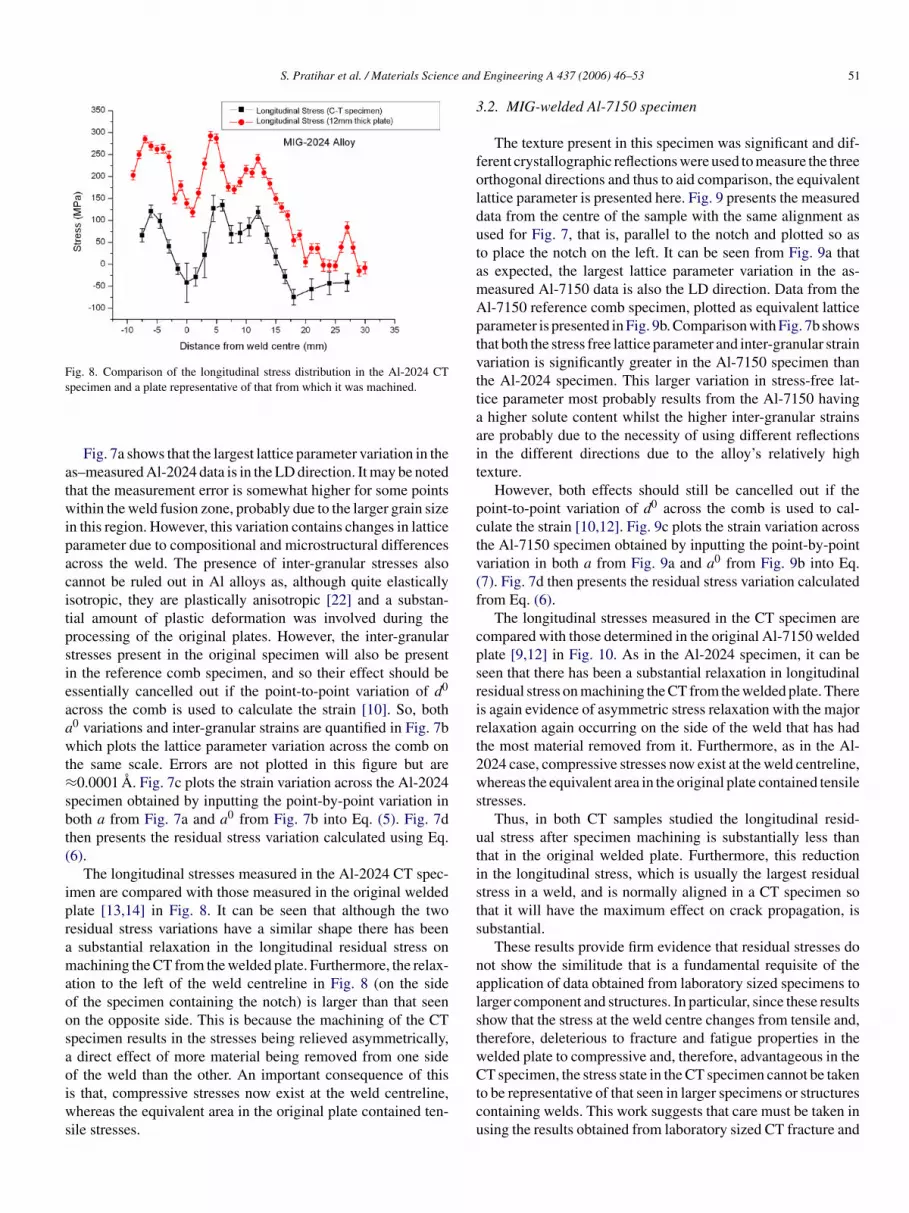
Fig. 8. Comparison of the longitudinal stress distribution in the Al-2024 CTs
atwipacitpsieaawt≈sbt(
ipramaoosaoiws
3
foldutamAptvttaait
pctv(f
cpsrirt2ws
utists
nalstw
pecimen and a plate representative of that from which it was machined.
Fig. 7a shows that the largest lattice parameter variation in thes–measured Al-2024 data is in the LD direction. It may be notedhat the measurement error is somewhat higher for some pointsithin the weld fusion zone, probably due to the larger grain size
n this region. However, this variation contains changes in latticearameter due to compositional and microstructural differencescross the weld. The presence of inter-granular stresses alsoannot be ruled out in Al alloys as, although quite elasticallysotropic, they are plastically anisotropic [22] and a substan-ial amount of plastic deformation was involved during therocessing of the original plates. However, the inter-granulartresses present in the original specimen will also be presentn the reference comb specimen, and so their effect should bessentially cancelled out if the point-to-point variation of d0
cross the comb is used to calculate the strain [10]. So, both0 variations and inter-granular strains are quantified in Fig. 7bhich plots the lattice parameter variation across the comb on
he same scale. Errors are not plotted in this figure but are0.0001 A. Fig. 7c plots the strain variation across the Al-2024
pecimen obtained by inputting the point-by-point variation inoth a from Fig. 7a and a0 from Fig. 7b into Eq. (5). Fig. 7dhen presents the residual stress variation calculated using Eq.6).
The longitudinal stresses measured in the Al-2024 CT spec-men are compared with those measured in the original weldedlate [13,14] in Fig. 8. It can be seen that although the twoesidual stress variations have a similar shape there has been
substantial relaxation in the longitudinal residual stress onachining the CT from the welded plate. Furthermore, the relax-
tion to the left of the weld centreline in Fig. 8 (on the sidef the specimen containing the notch) is larger than that seenn the opposite side. This is because the machining of the CTpecimen results in the stresses being relieved asymmetrically,direct effect of more material being removed from one side
f the weld than the other. An important consequence of thiss that, compressive stresses now exist at the weld centreline,hereas the equivalent area in the original plate contained ten-
ile stresses.
Ctcu
Engineering A 437 (2006) 46–53 51
.2. MIG-welded Al-7150 specimen
The texture present in this specimen was significant and dif-erent crystallographic reflections were used to measure the threerthogonal directions and thus to aid comparison, the equivalentattice parameter is presented here. Fig. 9 presents the measuredata from the centre of the sample with the same alignment assed for Fig. 7, that is, parallel to the notch and plotted so aso place the notch on the left. It can be seen from Fig. 9a thats expected, the largest lattice parameter variation in the as-easured Al-7150 data is also the LD direction. Data from thel-7150 reference comb specimen, plotted as equivalent latticearameter is presented in Fig. 9b. Comparison with Fig. 7b showshat both the stress free lattice parameter and inter-granular strainariation is significantly greater in the Al-7150 specimen thanhe Al-2024 specimen. This larger variation in stress-free lat-ice parameter most probably results from the Al-7150 havinghigher solute content whilst the higher inter-granular strains
re probably due to the necessity of using different reflectionsn the different directions due to the alloy’s relatively highexture.
However, both effects should still be cancelled out if theoint-to-point variation of d0 across the comb is used to cal-ulate the strain [10,12]. Fig. 9c plots the strain variation acrosshe Al-7150 specimen obtained by inputting the point-by-pointariation in both a from Fig. 9a and a0 from Fig. 9b into Eq.7). Fig. 7d then presents the residual stress variation calculatedrom Eq. (6).
The longitudinal stresses measured in the CT specimen areompared with those determined in the original Al-7150 weldedlate [9,12] in Fig. 10. As in the Al-2024 specimen, it can beeen that there has been a substantial relaxation in longitudinalesidual stress on machining the CT from the welded plate. Theres again evidence of asymmetric stress relaxation with the majorelaxation again occurring on the side of the weld that has hadhe most material removed from it. Furthermore, as in the Al-024 case, compressive stresses now exist at the weld centreline,hereas the equivalent area in the original plate contained tensile
tresses.Thus, in both CT samples studied the longitudinal resid-
al stress after specimen machining is substantially less thanhat in the original welded plate. Furthermore, this reductionn the longitudinal stress, which is usually the largest residualtress in a weld, and is normally aligned in a CT specimen sohat it will have the maximum effect on crack propagation, isubstantial.
These results provide firm evidence that residual stresses doot show the similitude that is a fundamental requisite of thepplication of data obtained from laboratory sized specimens toarger component and structures. In particular, since these resultshow that the stress at the weld centre changes from tensile and,herefore, deleterious to fracture and fatigue properties in theelded plate to compressive and, therefore, advantageous in the
T specimen, the stress state in the CT specimen cannot be takeno be representative of that seen in larger specimens or structuresontaining welds. This work suggests that care must be taken insing the results obtained from laboratory sized CT fracture and

52 S. Pratihar et al. / Materials Science and Engineering A 437 (2006) 46–53
Fig. 9. Variation in (a) the average lattice parameter, (b) stress-free lattice parametewelded Al 7150 specimen.
Fig. 10. Comparison of the longitudinal stress distribution in the Al-7150 CTspecimen and a plate representative of that from which it was machined.
fc
4
1
2
3
4
5
r, (c) strain and (d) stress measured along the principal directions in the MIG
atigue specimens that have been machined from larger weldedomponents or structures.
. Conclusions
. The residual-stress distribution in MIG welded Al-2024 andAl-7150 alloy compact tension specimens have been deter-mined, using the time-of-flight diffractometer, POLDI at PSI.
. Near the weld centre, the stresses are found to be compressivein both the specimens, but this compressive region is narrowerin the case of the Al-7150 specimen compared to the Al-2024specimen.
. In both cases, there is a substantial relaxation in longitudinalstresses, when compared to the original welded plate.
. This relaxation is asymmetric, in that the slot machined inthe CT specimen causes more relaxation on one side of theweld resulting in the residual stress at the crack tip beingsubstantially different to that seen in the original weld.
. This work suggests that care must be taken in using theresults obtained from laboratory sized fracture and fatiguespecimens that have been machined from larger welded com-ponents or structures.
e and
A
TETiaDE
R
[
[[
[
[
[
[[
[
[
[(4) (2003) 225.
S. Pratihar et al. / Materials Scienc
cknowledgements
This work was funded by EPSRC under grant GR/N14293.he authors would like to thank the Cranfield University Weldngineering Group for providing the welded specimens andim Gough and Peter Ledgard of the Open University for help-
ng in the comb sample preparation. The authors also wish tocknowledge useful discussions with Dr. Javier Santisteban andr. Supriyo Ganguly and finally would like to thank PSI and theU for provision of the neutron beam time.
eferences
[1] A. Heinz, A. Haszler, C. Keidel, S. Moldenhauer, W.S. Miller, Mater. Sci.Eng. A 280 (2000) 102.
[2] F.V. Lawrence, J.D. Burk, J.Y. Yung, ASTM STP 776 (1982) 33.[3] J. Lin, S. Ganguly, L. Edwards, P.E. Irving, in: M.R. Bache, P.A. Blackmore,
J. Draper, J.H. Edwards, S.P. Roberts, J.R. Yates (Eds.), Proc Fatigue 2003:Fatigue & Durability Assessment of Materials, Components and StructuresEngineering Integrity Society, Sheffield, UK, 2003, pp. 65–72.
[4] U. Stuhr, H. Spitzer, J. Egger, A. Hofer, P. Rasmussen, D. Graf, A. Boll-halder, M. Schild, G. Bauer, G. Wagner, W. Nuclear Instruments & Methodsin Physics Research Section A-Accelerators Spectrometers Detectors andAssociated Equipment 545 (1–2) (2005) 330.
[5] L. Edwards, M.E. Fitzpatrick, P.E. Irving, I. Sinclair, X. Zhang, D. Yapp,Journal of ASTM International, February 2006, Vol. 3, No. 2 Paper IDJAI12547 Available online at www.astm.org.
[6] U. Stuhr, H. Spitzer, J. Eggar, A. Hofer, P. Rassmussen, D. Graf, A. Boll-hader, M. Schild, G. Bauer, W. Wagner, Nucl. Instrum. Methods Phys. A545 (2005) 330.
[7] Angus W. Thomas, PhD Thesis: Parameter Development for theMiG Welding of High Strength Aerospace Aluminium Alloys, School
[
[
Engineering A 437 (2006) 46–53 53
of Industrial and Manufacturing Science, Cranfield University, UK,2000.
[8] J.R. Davis, Aluminium and Aluminium alloys, vol. 2, ASM HandbookASM International, 1998, p. 20.
[9] V. Stelmukh, L. Edwards, J.R. Santisteban, S. Ganguly, M.E. Fitzpatrick,Mater. Sci. Forum 404–407 (2002) 599.
10] V. Stelmukh, L. Edwards, S. Ganguly, Textures Microstruct. 35 (3–4)(2003) 175.
11] A.D. Krawitz, R.A. Winholtz, Mater. Sci. Eng. A 185 (1994) 123.12] V. Stelmukh, PhD Thesis, Neutron and Synchrotron X-ray Residual Stress
Mapping of 7XXX Aluminium, in Materials Engineering Department,Open University, Milton Keynes, 2003.
13] Y. Zhang, S. Ganguly, M.E. Fitzpatrick, L. Edwards, J. Neutr. Res. 11(2004) 181.
14] S. Ganguly, PhD Thesis, Non-Destructive Measurement of ResidualStresses in Welded Aluminium Alloy 2024 Airframe Alloy, Open Uni-versity, Milton Keynes, UK, 2004.
15] M.W. Johnson, L. Edwards, P.J. Withers, Phys. B: Condensed Mat. 234–236(1997) 1141.
16] H.M. Rietveld, J. Appl. Cryst. 2 (1969) 65.17] V. Hauk, Structural and Residual Stress Analysis by Nondestructive Meth-
ods, Elsevier, 1977.18] J.R. Taylor, An Introduction to Error Analysis, Oxford University Press,
England, 1982.19] A.J. Allen, in: M.T. Hutchings, A.D. Krawitz (Eds.), Measurement of
Residual and Applied Stress Using Neutron Diffraction, NATO ASI SeriesE Applied Science, vol. 216, Kluwer Academic Publishers, Dordrecht,1992, p. 297.
20] S. Ganguly, V. Stelmukh, M.E. Fitzpatrick, L. Edwards, J. Neutr. Res. 11
21] J.D. Kamminga, T.H.D. Kejser, E.J. Mittemeijer, R. Delhez, J. Appl. Cryst33 (2000) 1059.
22] J.W.L. Pang, T.M. Holden, T.E. Mason, Acta Metall. Inc. 46 (1998)1503.