measurement and measurement-related competences of five
TRANSCRIPT

Measurement and measurement-related
competences of five to eight-year-old children
in a British primary school
By
Yvonne Margaret Reynolds
Institute of Education
University of London
2011
PhD
This thesis is available to scholars for reference and
photocopying in connection with their studies and is not for
publication or other commercial use
1
Abstract
Measuring with units requires underlying conceptual competences as well as practical
and numerical abilities. The social context, notably in relation to language, undoubtedly
plays its part in their acquisition. Existing research had investigated conceptual,
practical, numerical and social aspects of the acquisition of measurement, but rarely
together, or by the same group of children. The present research united both in a
conceptually coherent structure, enabling a picture to be presented that was both broad
and detailed. There was a specific focus on conceptual difficulties children may face
that are identified in the psychological and educational literature.
Eighty-three five- to eight-year-old children were interviewed about their knowledge of
measurement and participated in a comprehensive set of tasks designed to test their
understanding of its language and concepts, their accuracy in making visual estimates,
and their ability to measure length.
Results showed the children to have a lively appreciation of the importance of
measurement, good understanding of its everyday language and concepts, and good
ability to estimate length. Yet they were poor measurers. This unevenness in their
accomplishments indicated underlying conceptual insecurity that was manifested in
ineffective deployment of measurement instruments, but went beyond it. There was
some evidence that ability in language and estimation were associated for the younger
children, while estimation and measurement ability were associated for the older. An
agenda for further investigation of the disjunctions identified by this research was
outlined.
2

Declaration:
The work presented in this thesis is my own work
Y. M. Reynolds
Word length:
Abstract : 233 words.
Thesis (including abstract): 83,619 words
(Calculated using Microsoft Word® for Mac 2011 word count)
3

Acknowledgements
I offer my thanks to Professors Andrew Tolmie and Richard Cowan for their
supervision of my work, to the school community in whose life I participated for a year
while doing this research, and to my husband Dr. Andy Lilley for his unstinting support
throughout.
I am grateful to my examiners, Professors Christine Howe and Philip Adey, for a
challenging and enjoyable viva that gave me scope to expand on the ideas in this thesis
in the company of experienced and engaged colleagues.
Whoever limiting his worldly ambition finds satisfaction in the speculative life, has in
the approval of an enlightened and competent judge a powerful incentive to labours.
Emmanuel Kant, 1781, Dedication of the Critique of Pure Reason.
Nobody thinks clearly, no matter what they pretend. Thinking's a dizzy business, a
matter of catching as many of those foggy glimpses as you can and fitting them together
the best you can.
Dashiell Hammet, 1929, The Damn Curse.
4

Contents
Title Page 1
Abstract 2
Declaration and word count 3
Acknowledgements 4
Contents 5
Chapter 1 General Introduction and Review of the literature
1.1 Introduction 17
Numerical and non-numerical measurement 17
Survey evidence of children's difficulties with measurement 18
Measurement in the Primary Mathematics Framework 20
1.2 Review of the literature 21
1.2.1 The Piagetian framework: fundamental conceptual components 21
of measurement
1.2.1.1 Development of Euclidean spatial concepts 23
Object concept 23
Conceptual development of uniformity of space 24
Topological spatial concepts 26
Horizontal and vertical axes; perspective-taking; 26
constructing a straight line
Development of geographical understanding 28
1.2.1.2 Development of logical and mathematical concepts 28
Conservation of length 28
Continuity and subdivision 30
Ordination 30
Transitive inference: the `towers' study 33
Subdivision and change of position 37
1.2.1.3 Order of acquisition of components of measurement 37
1.2.1.4 The Piagetian framework: summary 38
1.2.1.5 Later development of the notion of mental representation: 40
Representational Redescription
1.2.1.6 Piagetian individual constructivism and the socio-cultural 42
perspective
5

1.2.2 Non-numerical components of measurement 43
1.2.2.1 Ratio discrimination in infancy 43
1.2.2.2 Relative versus absolute judgements of size 44
1.2.2.3 Transitive inference 45
Early studies 46
The middle term 46
Memory demands 47
Representation in memory 47
Transitive inference as analogical reasoning 48
Appraisal of the literature on transitive inference 49
1.2.2.4 Protoquantities 50
Resnick's stages of mathematical reasoning in relation to 5 1
measurement
Protoquantitative ratio reasoning 52
Implications for measurement of the notion of protoquantities 53
1.2.2.5 How measurement procedures as 'tools of thought' may affect 53
judgements of quantity: Miller's (1989) study
1.2.2.6 Classroom development of 'tools of thought': an example 55
1.2.3 Numerical components of measurement: units 56
1.2.3.1 Partitioning and unitising 56
1.2.3.2 Petitto's numberline estimation study 58
1.2.3.3 Equality of standard units: testing understanding of equal 60
intervals
1.2.3.4 Conversion of units 62
1.2.3.5 Conventional versus non-conventional measuring instruments 64
1.2.3.6 Cultural tools 66
1.2.3.7 Ratio 66
The inverse relation in the concept of division 67
Limits of children's ratio reasoning 68
1.2.4 Procedural and conceptual knowledge 69
1.2.5 The present research 71
1.2.5.1 Key themes that provide the rationale 71
Conservation of length 72
Absolute versus relative judgements 72
The paradox of continuity and subdivision 73
6

Ratio and proportion 74
Mapping number on to quantity 75
Tools, procedures and principles 75
Influence of social context 76
1.2.5.2 Overview of the research 76
1.2.5.3 Research questions 76
Chapter 2 General Method
2.1 Sampling rationale 78
2.2 Design 78
2.3 Participants 78
2.4 Materials 79
Interviews 79
Tasks 79
2.5 Procedure 80
Setting 80
Pattern and organization of sessions 80
General characteristics of the tasks and interviews. 81
2.6 Conduct of the researcher 82
2.7 Ethical considerations 82
2.8 Piloting 83
2.9 Analysis of the data 83
Chapter 3 General knowledge and experience of measurement
3.1 Introduction 84
3.2 The first interview 84
3.2.1 Method 85
Participants 85
Materials and procedure 86
Schedule 86
Classification of responses 87
3.2.2 Results 89
Van you tell me what 'measure' means?' 89
Measurement at home 92
Measurement at school 96
7

Comparison of responses according to gender 101
Comparing length and height 101
3.2.3 Discussion 104
3.3 The second interview 107
3.3.1 Method 108
Participants 108
Materials, schedule and procedure 108
Ruler 110
Tape measure 111
Kitchen weighing machine 11 1
Measuring jug 112
Clock 113
Wall thermometer 113
3.3.2 Results 114
Can this device measure? What can we measure with it? 114
How does it work? 118
What do the numbers tell us? 120
What do the letters stand for? 121
3.3.3 Discussion 126
3.4 General discussion 127
Reflection on the character of the interviews 128
General knowledge about features of measurement 129
Measurement at home and at school 130
The conceptual and the social 130
Understanding of the inverse relation between size and number of units 132
Chapter 4 The language and concepts of ordinal length
4.1 Introduction 135
4.2 Ordinal length comparisons 135
4.3 The language of length 136
The language of ordinal comparison 137
Bias in favour of terms that express greater quantity 137
The language of height, length and width in everyday life 137
Understanding the difference between height from 138
head to feet and height above ground
8

4.4 Conceptual ability 140
4.5 Separation of language and conceptual ability 140
4.6 Factors investigated 141
4.7 Method 141
4.7.1 Sample 141
4.7.2 Summary of materials and procedure 141
4.7.3 Details of materials 143
Height from head to feet 143
Length 143
Width 143
Height above ground 143
Presentation of experimental displays 144
4.7.4 Details of procedure 145
4.7.5 Scoring 145
4.8 Results 145
Main series of displays: height from head to feet; length; width 146
Second series of displays: height above ground 149
The three types of height display compared 152
Complex height comparisons involving human figures 152
Further investigation of performance with a) complex height 153
displays; b) displays of height above ground
4.9 Discussion 155
Main findings 155
Poorer performance in relation to aspects of height 157
Chapter 5 Visual Estimation of Ordinal Length
5.1 Introduction 161
Estimating and measuring 161
Outline and rationale 162
The features of the comparators 163
Comparing estimation and measurement 164
5.2 Method 165
5.2.1 Sample 165
5.2.2 Materials 165
Lines 165
9

Comparators 166
5.2.3 Procedure 167
5.2.4 Criteria used for assessing children's judgements 168
5.3 Results 169
Missing data 169
Analysis of accuracy 170
Dealing with the latitude allowed in criteria for correctness 173
5.4 Discussion 173
Chapter 6 Measurement
6.1 Introduction 177
6.2 Method 179
6.2.1 Sample 179
6.2.2 Materials 180
6.2.3 Procedure 180
6.2.4 Analysis of results 181
Positioning the measuring device 181
Comparisons 182
Numerical measurement 182
An example 182
Factor structure 182
Additional data collected:• acknowledgement of fractional units 183
6.3 Results 183
6.3.1 Missing data 183
6.3.2 Understanding of the term 'measure' 183
6.3.3 Preliminary analyses 183
6.3.4 Positioning the device 184
6.3.4.1 Consistency of use of correct starting points 187
6.3.4.2 Predominant starting points 187
Ruler 188
Tape measure 188
6.3.4.3 Measuring with cubes: other adjustments 189
6.3.4.4 Obscuring the line 190
6.3.5 The comparisons 191
6.3.5.1 Analysis of accuracy of comparisons 191
10

6.3.6 Numerical measurement 193
6.3.6.1 Analysis of correctness 193
6.3.6.2 Failure to report a numerical measurement 194
6.3.6.3 Response to lines that embodied fractional units 195
Evidence of adjustment of starting point 195
Other evidence 196
6.4 Discussion 197
6.4.1 Main finding 197
6.4.2 Understanding of the term 'measurement' 197
6.4.2 Declining to report a numerical measurement 197
6.4.3 Success in measuring lines of differing lengths 198
6.4.4 Measuring with cubes 198
6.4.5 Measuring with the ruler 199
6.4.6 Measuring with the tape 202
Chapter 7 Associations between measurement and measurement-related abilities
7.1 Introduction 205
7.2 Method 206
7.2.1 Internal reliability testing 206
7.2.2 Correlations 207
7.3 Results 207
7.3.1 Age 207
7.3.2 Language/ Estimation 207
7.3.3 Language/ Numerical measurement 208
7.3.4 Measurement/ Estimation 210
7.3.5 Complex language tasks/numerical measurement 210
7.4 Discussion 210
7.4.1 Correlations with age 211
7.4.2 Correlations among language, estimation and measurement 211
scores
Chapter 8 Discussion
8.1 Introduction 214
8.2 Main findings 215
8.2.1 Children as measurers 215
11

8.2.2 Competences underpinning measurement 218
Language 218
Conservation of length 218
Visual estimation of length 219
Lack of influence of the materials used 219
8.2.3 Age 220
8.2.4 The social and the conceptual 222
8.2.5 Reflections on earlier research 227
The paradoxical role of a logico-mathematical framework 227
The value of surveys 228
Cultural tools 229
Learning in informal contexts 229
Relative judgements 229
Units 230
Principles and procedures 230
8.2.6 The developmental and the instructional: summary 230
8.2.7 Directions for future research 232
Non-numerical problems of measurement 233
Numerical problems of measurement 234
8.2.8 Concluding remarks 235
References 236
Appendices 248
Appendix 1 248
Appendix 2 266
Appendix 3 268
12

List of Tables
Chapter 2
2.01 Age and gender of the participants 78
2.02 Phases of the research with number of children participating
79
in each phase, according to year-group and gender
2.03 Phases of the research, number of responses required, 8 I
number of sessions, and allocated time per session. All
year-groups were similar.
Chapter 3
3.01 Categories of response to the question: Can you tell me what 88
`measure' means?
3.02 Can you tell me what 'measure' means? In each year-group, the 90
number of children responding according to the categories in Table 3.01.
3.03 Number of children in each year-group mentioning a given 91
number of features (0-5).
3.04 Have you ever seen someone measuring at home? The number 93
in each year-group mentioning the listed type of activity, device,
dimension, and unit.
3.05 Measurement at home: the number of children in each year- 94
group mentioning activities, items, and devices, according
to the number of types mentioned.
3.06 Examples of measuring activity at home as described by the children. 95
3.07 Have you done any measuring at school? The number in each 97
year-group mentioning the listed purpose, items measured,
device, dimensions, and units.
3.08 Measurement at school: Number of children in each year-group 99
recalling the listed number of purposes, types of item,
and types of device.
3.09 Examples of measuring activity at school as described by 100
the children.
3.10 Comparing lengths of pencils and heights of participant and 103
experimenter. Number of children responding as indicated.
3.11 Can this device measure? What could we measure with it? 114
13

Number of children in each year-group who named the device
shown, affirmed that it was a measuring device, and identified
entities that could be measured with it.
3.12 Number of children in each year-group affirming the ruler or tape 118
could not measure items longer than itself, and responses at follow-up.
3.13 How does it work? Number of children in each year-group 118
mentioning the given features of the weighing machine,
measuring jug, clock and thermometer.
3.14 What do the numbers tell us? Number of children in each 120
year-group responding according to the categories listed.
3.15 What do the letters stand for? Number of children in each year- 122
group responding to unit names abbreviated on the measuring devices.
3.16 Children's judgements about the greater unit shown on each 123
measuring device and their justifications, according to year-group.
Chapter 4
4.01 Summary of materials used to make comparisons of height from 141
head to feet, of length, of width, and of height above ground.
4.02 Questions inviting comparisons of height from head to feet, of 142
length, of width, and of height above ground, according
to type of comparison.
4.03 Number of comparisons made by each child in relation to 144
attribute and type of display.
4.04 Mean (SD) percentage of correct comparisons in the main series 147
of displays according to year-group, type of comparison,
attribute, complexity and format.
4.05 Analysis of variance for correct comparisons according to a) type 147
of comparison, attribute and complexity and b) year-group and format.
4.06 Mean (SD) percentage of correct judgements in the three tests of 150
height above ground according to year-group and type of comparison.
4.07 Analysis of variance of the three tests of comparison of height 150
above ground.
4.08 Mean (SD) percentage of correct judgements in all height 152
displays, according to year-group.
4.09 The number of children in each year-group whose judgements of 155
14

height conformed to categories as stated.
Chapter 5
5.01 Comparators in relation to which the lengths of line 167
were estimated.
5.02 Lines whose lengths were estimated. 169
5.03 Mean (SD) percentage of correct estimates according to year- 170
group, comparator, line set, and line length.
Chapter 6
6.01 The lines within each set used for the measurement tasks. 179
6.02 Mean (SD) proportion (%) of measurements where children used 185
the correct starting point on the measuring device.
6.03 Number of children in each year-group making all necessary 189
adjustments when measuring with cubes.
6.04 Number of children obscuring the line with the measuring 191
device: incidence in each year-group.
6.05 Mean (SD) proportion (%) of correct comparisons made by 192
children according to year-group, device and set.
6.06 Mean (SD) proportion (%) of correct numerical measurements 194
made by children according to year-group, device and set.
6.07 Number of children in each year-group acknowledging fractional 195
units.
Chapter 7
7.01 Pearson's coefficients for zero order and partial correlations
209
among a) language of ordinal length, b) visual estimation of
ordinal length and c) numerical measurement.
15

List of Figures
Chapter 4
4.01 Mean correct responses for (A) attributes of length according to
149
type of comparison; (B) level of complexity according to attribute.
4.02 Mean correct responses for type of comparison according to
151
display.
Chapter 5
5.01 Mean proportion (%) of estimates correct according to (a) line
172
length and set; (b) line length and comparator.
Chapter 6
6.01 Mean proportion (%) of measurements where children used the
185
correct starting point on the measuring device.
6.02 Correct comparisons: interaction between device and year-group
192
Chapter 7
7.01 Scatterplots of children's scores for language against
208
estimation; for language against measurement; and
for estimation against measurement.
16

Chapter 1
General introduction and review of the literature
1.1 Introduction
Measurement is inseparable from activities that between them support the bulk of
human achievement. Agriculture, industry and trade, as well as pure and applied
science, from molecular biology to astronomy, and from medicine to engineering all
incorporate measurement. Across cultures, education systems recognize the central
importance of measurement by prescribing it to be taught at an early stage of school
mathematics curricula. However, learning to measure is not straightforward. The
present research investigates the experience of measurement, the understanding of its
language and concepts, and the estimation and measuring ability of primary-school-
aged children.
Among measurement domains, length has a prototypical role. On scaled measuring
instruments, for example, measurement is embodied as length irrespective of domain.
Brown, Blondel, Simon & Black (1995: 145) argue that "length has a pre-eminent
position among measures" because it matches the linearity of the number system itself
This prototypical character of length measurement recommended it as the central focus
in the present research.
While length (including height and width) was the central focus, other measurement
domains, such as weight and capacity, received a minor focus for the following reasons.
Firstly, fundamental underpinning concepts are common to all measurement domains,
and it was useful to test the generality of children's understanding of these concepts.
Secondly, everyday experience of measurement spans various domains, and
understanding of the breadth of children's knowledge was sought. Lastly, it was
important to know whether children distinguished attributes specific to length from
those appropriate to other measurement domains.
Numerical and non-numerical measurement
In the mathematics literature, measurement has not always been considered exclusively
or even primarily numerical. Nagel (1930) cites pre-Cartesian geometry and arts such as
cookery as domains in which "disciplined judgments" (Nagel, 1930: 313) may be made
about quantities without the use of number. He conceptualises measurement very
broadly, ranging from classification (because it requires evaluative comparisons
17

between objects) to the scaling of extensive properties of matter. Here, "The raison
d'être of numbers in measurement is the elimination of ambiguity in classification, and
the achievement of uniformity in practice" (Nagel, 1930: 314). In contrast, Bergmann &
Spence (1944) construe measurement more narrowly in terms of the "basic observations
and measurements of the scientist". In their view, "physical measurement consists of the
assignment of numbers to the objects or events of a physical dimension in accordance
with certain rules" (1944: 1-2). Here, measurement is seen as a specifically numerical
way of recording observed facts. This recalls the treatment of measurement in
educational surveys: "an understanding of ... the use of numbers and measures to
describe and compare mathematical and real-world objects" (IES National Centre for
Statistics: National Assessment of Educational Progress, 2003) and in curricula such as
the National Numeracy Strategy (Department for Education and Employment, 1999).
In the developmental literature, both aspects of measurement find their place. In
Piaget's seminal account, for example, numerical and non-numerical measurement
share underlying principles that are acquired before the ability to calculate numbers of
standard units. (Piaget, Inhelder & Szeminska, 1960). Non-numerical as well as
numerical measurement is therefore investigated in the present research.
Among aspects of length considered in the present research, units of length are the
conceptual centre. The standard unit is the conventional expression of the conjunction
of the numerical with the logical in measurement. "With a stable idea that a given length
can be generated through unit iteration, an object being measured and the measuring
device need not even look alike, but need only share a common internal unit" (Youniss,
1975: 235). While such a statement conveys the logical simplicity of the idea of the
standard unit, the present research explores what psychological difficulties there might
be in establishing this "stable idea".
Socio-cultural influences on the development of measurement concepts (Resnick &
Singer, 1993) are also a strong theme in the research, in which children's experiences of
measurement at home and at school, as well as characteristics of the everyday language
of measurement, are examined.
Survey evidence of children's difficulties with measurement
National and international surveys of mathematics achievement, using samples of up to
10,000 or more, suggest that measurement skills, knowledge and understanding of up to
one-third of seven to 16-year-old students are limited (Hart, 2004; Thompson &
Preston, 2004; Brown et al., 1995; Kouba, Brown, Carpenter, Lindquist, Silver &
18

Swafford, 1988; Hiebert, 1981). In particular, a surprisingly large proportion seem to
lack fundamental measurement concepts that developmental research suggests are
established, in some contexts, well in advance of secondary school age, such as
conservation of length, transitivity, and measurement as iteration of a unit.
For example, asked which was the longer of two parallel lines whose ends were offset
in the Piagetian paradigm and presented on squared paper, the responses of over ten
percent of a large sample of students did not reflect the number of squares covered by
each line, and suggested that they did not conserve length in this task (Hart, 2004).
Similarly (in a smaller-scale study) a quarter of 11 to 15-year-olds failed to mark the
start point of a clockwork toy when measuring the distance it travelled (Department of
Education and Science, 1981). In a version of Piaget's 'towers' task one-third even of
10-to-13-year-olds failed to show understanding of transitivity (Brown et al., 1995); and
a minority in this small study did not iterate a 30-cm ruler when asked to measure a
length in excess of 30 cm. Failure to apply the principle of the inverse relation between
size and number of units occurred in some tasks (Brown et al., 1995; Kouba, 1988). In
another survey (Hiebert, 1981), difficulties in understanding that units can be
subdivided were suggested by tasks where students apparently ignored the fact that one
item, such as a 'stick' person, stood for several, or that one division stood for two
degrees on a thermometer scale, and where part squares were counted as wholes, or
ignored, in calculations of area. Difficulty in interpreting numbers in relation to quantity
was exemplified by children who counted lines or spaces on a ruler rather than using the
numbers (Brown et al., 1995). There are many examples of poor estimation and
inaccuracy of measurement (Hart, 2004; Hiebert, 1981).
While limited knowledge of standard units and their relationships, and limited ability to
use measurement instruments (found in most surveys) seem readily remediable in
school, failure to conserve length, to use an intermediate measure (showing
understanding of transitivity) or to know that the smaller the unit used, the more of them
are needed to measure a given quantity must, if interpretations of the results are valid,
be a real cause for concern.
Such surveys are not without their critics (Silver & Kenney, 1993; Kamii & Lewis,
1991), and it is likely that some of the tests employed were not the best instruments for
assessing mathematical understanding. Nevertheless, survey results in conjunction with
the developmental literature can usefully indicate underlying conceptual difficulties in
measurement, and can suggest useful smaller-scale in-depth investigations, of which the
19

present research is an example. For instance, in addressing Research Question 6: How
well do children measure? (see page 77) the present work investigated children's ability
to conserve length when measuring, and it sought also to assess their understanding of
transitivity as applied to measurement by observing their deployment of measuring
instruments.
Measurement in the Primary Mathematics Framework
Mathematics in the UK National Curriculum for the first years of primary education
has, for each year-group, expected learning outcomes for measurement. These are
indicated in the Primary Mathematics Framework (PMF) (Department of Education,
2010; Department for Children, Schools and Families, 2006), are framed as the
outcomes of problem-solving 'enquiries', and are typically integrated with other
mathematics. As with the earlier National Numeracy Strategy (Department of Education
and Skills, 1999), the objectives to which measurement activities contribute sometimes
fail to acknowledge specific understanding required for the measurement component.
Taking as examples the three school years from which children are drawn for the
present research: one PMF objective for Year 1 is to "count reliably at least 20 objects,
recognising that when rearranged the number of objects stays the same; estimate a
number of objects that can be checked by counting". One corresponding learning
outcome is: I can find out how long a room is by counting the paces I take to cross it.
Here the specific understanding and potential for error involved in iterating a unit are
unacknowledged; measurement is presented as a counting activity, perhaps preceded by
estimation (Department for Children, Schools and Families, 2006: Year 1 Block D.
Assessment focus: Ma3, Measures). The present research pursued the potential
difficulty, overlooked here, of mapping number on to length, asking, in Research
Question 5, How well do children understand that a number may express length?
In Year 2 an objective that specifically concerns measurement instruments runs: "Read
the numbered divisions on a scale and interpret the divisions between them (e.g. on a
scale from 0 to 25 with intervals of 1 shown but only the divisions 0, 5, 10, 15 and 20
numbered); use a ruler to draw and measure lines to the nearest centimetre". The
corresponding "children's learning outcomes" are: I can use a ruler or metre stick to
measure how long something is. I can read numbers on a scale and work out the
numbers between them. (Year 2 Block C. Assessment focus: Ma 3, Measures).
Conceptual understanding involved in reading and interpreting a scale in measurement
is, if not taken for granted, at least unacknowledged here. To investigate this
20

understanding, the present research asked, in Research Question 9b), Do children
understand that larger units may 'contain' smaller ones? and in Research Question 10,
How well do children cope with fractional units?
Choice of appropriate units and relationships between units are the main themes for
Year 3: the latter was a major stumbling-block in at least one survey (Hart, 2004). The
documents associated with the forthcoming new National Curriculum do not suggest
there will be major changes (Department of Education, 2011). In asking: Do children
understand that there is an inverse relation between size and number of units?
(Research Question 9a) the present research identified perhaps the most fundamental
relationship between units.
The concerns arising from the surveys suggest that the kinds of curricular objectives
outlined above will not be achieved by children without conceptual understanding. The
project Supporting Students' Development of Measuring Conceptions: Analysing
Students' Learning in Social Context, undertaken by the National Council of Teachers
of Mathematics (Gravemeijer, Bowers & Stephan, 2003) provides a research paradigm
in this respect. The project had a solid base in developmental and semiotic theory. Like
the PMF, it took classroom 'enquiry' as the pedagogic paradigm, and it systematically
designed and tested a process by which children began to construct a principled
understanding of units, using versions of the ruler as both instrument and concept.
While psychological studies specifically of measurement are few, concepts underlying
measurement are powerful, apply well beyond the measurement domain, and have been
thoroughly investigated in the developmental literature. The range of literature of
relevance to measurement is therefore very broad. Selected for review are a number of
substantial studies representing themes that are central to measurement and that
suggested the investigations that follow. These themes are summarised at the end of the
literature review, and are followed by twelve research questions to whose formulation
they contributed. The research questions are set out on page 76. Throughout Chapter 1,
the research questions are indicated (as they are above) wherever surveys, mathematical
curricula, or research literature demonstrate the need to address them.
1.2 Review of the literature
This research investigates measurement-related skills, knowledge and understanding of
children in the three years of English primary school that follow the reception year. The
21

literature reviewed begins with the pioneering work of Piaget, and then focuses on the
developmental and mathematics education literature that followed it.
First, the Piagetian framework in relation to measurement is described. Conceptual
components of Piaget's framework, the methodology used to investigate their
development, and the overall developmental structure to which they belong are
evaluated. This framework provided the source of two lines of enquiry distinguishable
in later work and pursued in the present research.
The first concerns non-numerical aspects of measurement, including underlying logical
components such as transitivity. Non-numerical aspects of Piaget's work on
measurement that retained value for researchers are discussed, and some theoretical
developments from these. Developments that oppose the Piagetian account are also
considered.
The second line of enquiry concerns numerical measurement, that is, measurement
involving units. Studies of the development of numerical measurement are next
considered, including research on children's ratio reasoning, since ratio reasoning is
essential to understanding units.
Finally, the rationale for the present research is set out.
1.2.1 The Piagetian framework: fundamental conceptual components of
measurement
Still the most substantial and important treatment of the development of measurement
concepts, Piaget's account (Piaget, 1970; Piaget et al., 1960; Piaget & Inhelder, 1954;
1956) provides an underpinning spatial and logical framework set in a context of broad
intellectual development. His view of the essential components of measurement has
continued to be used in the education literature, in the assessment of measurement
competence (Hart, 2004; Brown et al., 1995), to guide the teaching of measurement
(Kamii & Clark, 1997; Steffe, 1971) and as underpinning for measurement (as well as
other topics) in mathematics curricula (Department for Education and Employment,
1999; Williams & Shuard, 1982). The Piagetian framework is therefore reviewed in
some detail.
In The Child's Conception of Geometry Piaget defines measurement as follows:
To measure is to take out of a whole one element, taken as a unit, and to transpose this unit on the remainder of a whole: measurement is therefore a synthesis of subdivision and change of position. (Piaget et al., 1960: 3)
22

While iteration of a unit is common to all numerical measurement, the "change of
position" involved here defines measurement of length. The key logical prerequisite is a
co-ordinated system of reference points in space and, for Piaget, mental representation
of such a system is the key developmental prerequisite, so that "subdivision and change
of position" can be successfully deployed.
This Euclidean conception of space presupposes a number of spatial and logico-
mathematical concepts that are theoretically separable, although they sometimes overlap
when operationalised in Piaget's studies. The spatial concepts are: object concept; a
group considered here under the label 'uniformity of space'; and conservation of length.
The logico-mathematical concepts (more specific to measurement) are: continuity and
subdivision; ordination; transitivity; and subdivision and change of position. Together
with the associated studies, these concepts are now outlined, broadly in order (according
to Piaget) of logical complexity and of development. They are then evaluated in the
light of later research. Finally Piaget's overall theoretical and methodological
contribution to the study of measurement is summarised. The development of transitive
inference is considered through Piaget's 'towers' study; fuller treatment of transitivity,
which underpins the role of units in measurement, is reserved for later in the chapter.
1.2.1.1 Development of Euclidean spatial concepts
A conception of space that is stable because unified by co-ordinates affording fixed
locations - a Euclidean conception of space - is identified by Piaget as the overarching
precondition for measurement, which requires that objects are moved (whether set side
by side for direct comparison, or compared indirectly using a third object as a
measuring instrument). Objects cannot be measured if their size may change when they
move; a Euclidean framework guarantees constancy of size. Piaget identified
components of measurement logically implied by a Euclidean conception of space and
argued that until seven or eight years of age, children cannot measure because their
mental representations of space are not Euclidean but conform to the categories of
topology.
Object concept
Euclidean space is independent of the perceptual frame of the individual. Objects seem
to disappear when out of our line of vision, and to understand that they do not, we must
conceive of space as independent of our own body (Piaget, 1954). This conception must
be sustained despite the fact that we always perceive objects as relative to our own
body, because always viewed from its standpoint.
23

Piaget noted (1954) that until about 9 months old, if a desired object was removed from
an infant's visual field, there was no attempt to bring it into view. Older infants who
searched successfully in the place where an object had been hidden still made the 'A not
B error': if they first saw an object hidden in place A and subsequently in place B, they
would persistently search at A. Piaget argued from such phenomena that until about
eighteen months old, infants do not conceive of objects as moveable, independent
entities in space. Even when this conception is achieved, objects are not entirely
detached from their location, but continue to be associated with the position in which
they were first placed, as a single entity.
...without being truly conceived as having several copies, the object may manifest itself to the child as assuming a limited number of distinct forms of a nature intermediate between unity and plurality. (Piaget, 1954: 63).
Without a notion of space as governed by fixed co-ordinates, it is argued, the infant
cannot draw on such ideas as an object being behind a screen or underneath a pillow;
hence when an object is occluded by another, it ceases to exist.
Subsequent research focused on infants tracking moving objects (e.g. Bower &
Paterson, 1973; Bower, Broughton & Moore, 1971). Bower (1974) concluded that at
issue was not object permanence, but object identity. Infants up to about five months
old appeared to conceive an object occupying the same place, or continuing a path in the
same direction, as the same object, despite several changes in appearance. Some
transformations in appearance made in these experiments were transformations of size,
substantiating Piaget's contention that for young children, objects may indeed change
size when they move. However he did not consider perception of object boundaries,
which also play a role (Spelke, 1990; de Schoenen and Bower, 1978; Neilson, 1977).
Investigation of the object concept continues apace: (Hespos & Baillargeon, 2001;
Houde, 2000; Aguiar & Baillargeon, 1999; Behr Moore & Meltzoff, 1999; Meltzoff &
Moore, 1998; Wynn & Chiang, 1998; Munakata, McClelland, Johnson & Siegler,
1997). Piaget's overarching claim is actually substantiated by much of this later work:
that is, the conception of space governed by fixed co-ordinates, required for
measurement, is absent in infancy. His claim that this conception is not established till
middle childhood, examined next, is not, however, similarly substantiated.
Conceptual development of uniformity of space
We need, if we are to measure, a mental representation of space as uniform, as a
"common medium" (Piaget et al., 1960: 70). We experience space, however, as
24

differentiated — either as occupied by objects or merely as 'distance'.
Exploring children's conception of space, Piaget et al. (1960) placed two model trees or
people about 50 cm apart on a table and asked whether they were close together or far
apart. Until about seven years old, children changed their initial judgement of the
distance between the two objects A and B when a screen or block was interposed
between them, generally saying they were closer together. Distance between them was
thought to be greater when the 'people' were of different heights, or on different levels.
Distance was generally conserved, ignoring changes, at about seven years old.
Piaget had two interrelated explanations of these phenomena (Piaget et al., 1960). First,
space occupied by an object and 'unoccupied' space (distance) were different in kind
for young children; hence following the interposition of a third object, the width of that
object must be subtracted from the distance between the first two. The second
concerned inability to represent linear order mentally as " a series of nesting intervals"
(Piaget et al. 1960: 86)
He reasons about AB if there is nothing between them, but if S is interposed, he thinks only on the new intervals AS and SB, while completely losing sight of the overall interval AB. (Piaget et al., 1960:86)
By about seven years old, children are able to compare the length of an object with that
of another, such as the edge of a table on which it lies (Piaget et al., 1960). Now objects
are conceived as contained by space and independent of it: whether 'filled' or 'empty',
space is conceived as a homogeneous 'container' (Piaget & Inhelder, 1956).
If space is not apprehended as homogeneous by young children, who instead make a
fundamental distinction between 'filled' and 'empty' space, then measurement of length
as such will be impossible for them. A plausible alternative framework, however, that
could account for findings such as Piaget's is provided by Gibson's (1979) theory of
affordances. Gibson argued that perceptual information is processed functionally in
terms of situational needs, and not in terms of separable, classifiable properties.
If a terrestrial surface is nearly horizontal...nearly flat... sufficiently extended...and rigid...then the surface affords support for quadrupeds and bipeds....Note that the four properties listed - horizontal, flat, extended and rigid - would be physical properties of a surface if they were measured with the scales and standard units used in physics. As an affordance of support for a species of animal, however, they have to be measured relative to the animal. (Gibson, 1979: 127. Italics in the original.)
Such judgements of affordance can account, Gibson argued, for the posing and solving
of measurement problems such as 'Will this stick fit across here?' without the use of
25

number. Objects and the spaces available for occupation by them are perceived as a
functional whole when a spatial judgement is demanded as a practical decision.
Perceived changes in the affordances of a situation could underlie the type of response
to interposed objects noted by Piaget and Inhelder. Gibson and Piaget agree, however,
that early spatial judgements are perceptually bound, and made within an 'egocentric'
framework
Topological spatial concepts
Until a fully Euclidean conception of space is established at about eight years old,
Piaget argued, children's mental representations of objects in space conform to the
categories of topology, a type of geometry that makes no use of size, distance and fixed
position, but instead features relations of proximity, separation, enclosure and
continuity, applied only to individual objects or shapes and their immediate
relationships to each other. The claim is not that perceptions are topological in character
(children easily navigate their spatial world as if Euclidean) but that their mental
representations are. No a priori arguments are offered for this proposed difference.
To test the 'topological' thesis, Piaget and Inhelder (1956: 17-42) asked children to feel
items behind a screen and then match them to real or pictured items they could see.
They reasoned that to identify visually an item known only by touch, a match with some
mental representation of the item must be made. (Thus, contradicting the rationale for
the study, haptic perception of 'topological' shapes was taken as evidence of
topological mental representation). Progressive differentiation of shapes with age was
found, 'everyday' shapes being matched first, then 'topological' shapes, and lastly
regular shapes. It is not clear, however, that specifically topological characteristics
accounted for these differences, and there was no adult control group. Tasks closely
resembling those of Piaget (e.g. Laurendeau & Pinard, 1970), claimed evidence of a
similar progression, but investigations using different tasks have not found evidence
that topological concepts consistently develop earlier (Kato, 1984; Martin, 1976b).
Horizontal and vertical axes; perspective-taking; constructing a straight line
A number of well-known studies were also offered as evidence of the late development
of Euclidean spatial concepts. Investigating children's understanding of horizontal and
vertical axes, Piaget and Inhelder (1956) asked children to describe or draw the level of
the water in bottles tilted at various angles. Before about eight years old, children
indicated various 'impossible' angles of the surface of the liquid to the container, in
contrast to the plane surface they must often have observed. They drew objects or
26

people on a hillside at right angles to the slope of the hill. Piaget and Inhelder argued
that these children did not yet mentally represent a spatial frame of reference structured
by horizontal and vertical axes, and their drawings reflected this. However, children's
spontaneous drawings may not be good evidence for their mental representations. They
may not intend their drawings to be fully representational (Freeman, 1980) and some
young autistic children show early, skilful use of perspective in drawing (Wales, 1990).
In perspective-taking experiments (Piaget & Inhelder, 1956), children were shown a
model village with a doll placed somewhere in it, then a duplicate village, rotated at
some angle to the original. They were asked to place the doll correctly in the rotated
model. Until seven or eight years old, children placed the doll more or less in
accordance with their own perspective on the original model, showing, it was argued,
inability to detach themselves from a spatial framework centred on the position of their
own bodies and line of vision. Children's success on perspective-taking tasks, however,
has been shown to depend on the type of task, with three to four-year-olds being
successful with some (Spencer, Blades & Morsley, 1989).
Ability to construct a straight line (essential to Euclidean space with its fixed co-
ordinates) is the final example considered. Consistently with his previous reasoning,
Piaget distinguished between early ability to recognize a line as straight, and mental
representation of a straight line. The task was to link "distant points by the interpolation
of a series of points along a straight path" (Piaget & Inhelder, 1956: 155). Children were
required to insert telegraph poles (matchsticks) along a straight highway with one pole
already placed at each end. They also had to straighten curved or zigzag lines of 'poles'.
Children under four years old were unable to construct the straight line requested, or to
straighten a line. Between about four and seven years, they succeeded by making the
line parallel to the straight edge of a table (showing physical capability of the task), but
where this was not available, matchsticks were interpolated as close together as
possible, the lines undulating. Finally, from about 7 years old, the children put
themselves in a straight path with the two sticks, 'sighted' along the path and correctly
interpolated the rest.
Laurendeau and Pinard (1970) replicated this task with children 2 to 10 years old. They
found that even pre-schoolers could construct a straight row of objects parallel with a
visible straight edge, but (like Piaget) not otherwise.
Piaget referred several times to children appearing not to know what the word 'straight'
meant, but appeared to interpret this as symptomatic of their logical stage, rather than an
27

independent factor in their performance. In many studies, in fact, Piaget left possible
linguistic explanations of conceptual difficulties unexplored. The present research
addressed this gap, investigating understanding of the language of length in some detail,
asking, in Research Question 2, Does the everyday language of length present any
difficulties to children? There was a special focus on language associated with the
dimension of height, particularly in relation to the human figure. This was suggested by
Piaget's study of distance disrupted by interposed blocks, described above.
Overall, the phenomena reviewed in the section above are not convincing as evidence of
children's mental representation of space.
Development of geographical understanding
The literature on children's understanding and representation of their physical
environment does not support Piaget's view of rather late development of the ability to
use a Euclidean spatial framework, nor does it suggest a single frame of reference for all
mature spatial reasoning. Rather, individuals' mental representations of spatial
relationships seem to depend on their experience of spaces and on situational demands
(Pick & Lockman, 1981). Hart (1981) found that pre-schoolers were able to make
simple maps, with Euclidean characteristics, of the immediate environment of their
homes and beyond. The character of these maps seemed to vary with the amount of
experience children had had in moving around their locality. Darvizeh & Spencer,
(1984) found that in route-learning studies using landmarks, three-year-olds were able
to represent positions of objects in relation to each other along a route they had
travelled, using symbols for buildings, trees and vehicles and connecting them with
strips symbolising roads. Recent research shows four-year-olds spontaneously using
angle and distance information from simple maps to locate real objects in three-
dimensional space (Shusterman, Lee & Spelke 2008). Overall, evidence does not
suggest late development of the conception of three-dimensional space, and this was not
pursued in the present research. More specific pre-requisites for measurement are now
considered.
1.2.1.2 Development of logical and mathematical concepts
Conservation of length
In the context of measurement of length, conservation of length within a Euclidean
spatial framework is clearly essential, since "we cannot measure the length of one object
without moving another, the length of which we know will not be altered by its
28

movement." (Piaget et al., 1960: 69). If we conserve length we also understand distance
as reversible: the distance AB is equal to the distance BA, even though we may
experience a given distance as 'longer' in one direction, for example because it is uphill
(Piaget, 1970).
The principle tested in all Piaget's conservation studies is that quantities that are in fact
equal retain their equality when appearances seem to challenge it. The studies were
designed to investigate the extent to which children are able to ignore irrelevant aspects
of the appearance of materials when judging quantity, or to take simultaneously into
account more than one relevant perceptual aspect so as to arrive at a correct judgement.
Piaget et al., (1960) investigated conservation of length when lengths of two items are
not equal, but, misleadingly, end points coincide; and conversely, when length is equal,
but end points do not coincide. In the first case, the children were shown a straight stick,
and a curving plasticine 'snake' of greater length, but whose ends were made to coincide
with those of the stick. In the second, ends of two parallel sticks of equal length at first
coincided; then children saw one stick moved so that ends were offset. In both cases
children younger than about seven judged lengths to be equal when end-points
coincided. Even though they agreed that the straightened snake was longer than the
stick, when the snake resumed its curves and its end points again coincided with those
of the stick, younger children judged the lengths to be equal: the curves were not taken
into account. When the endpoints of two parallel sticks were offset, the children judged
a stick whose end protruded to be longer: the compensating retraction of the other
endpoint was overlooked.
A further study implicated subdivision as a factor in conservation. Two equally long
strips of paper were aligned with their endpoints coinciding, the children agreeing that
they were equal in length. One strip was then cut into segments arranged in a line
containing curves or angles. Children younger than about seven and a half said that the
'distance an ant would have to travel' had now changed. As before, younger children
mentioned positions of the extremities of the lines as justification for non-conserving
judgments. If there were curves or angles in the line, younger children pronounced the
line longer than the straight version when the question was about 'distance to go', but
not when the question was simply about length. Some counted the cut segments of the
line, pronouncing some lines equal in length if they consisted of the same number of
segments, although the size of the segments differed between the two lines. If one
segment in a given line was markedly longer than all other segments, then that line was
29

said to be longer overall than any line whose segments were closer in length. Older
children made correct judgments of equality of length irrespective of the
transformations and explained that what was essential had not changed.
Explanation of errors in these tasks due to deformation of lengths (zigzagging a strip)
should be the familiar one of failure to compensate across positions of all endpoints, but
deformation is confounded here with unequal segmentation, and in the attempt to
explain errors due to both features, the account became rather obscure. Piaget stated that
children failed to "[integrate] notions of intervals (parts of objects) with those relating to
order and change of position" (Piaget et al., 1960: 110). Two notions of length were
used here: a) a series of nested parts, each containing all preceding parts and being
contained in the next part in the succession (synonymous with 'subdivision': 116); and
b) "a set of intervals between ordered points" (111). These two aspects must be
integrated, he argued, for length to be conserved. Thus younger children are influenced
by the ordinal aspects of the series of segments, and ignore inequalities of subdivision,
or they are influenced by salient aspects of subdivision (such as an extra-long segment)
because they do not fully understand subdivision as a synthesis of "order and change of
position" (111). Although the explanation is rather obscure, difficulties regarding
subdivision, as well as conservation, are clearly revealed by these tasks.
Piaget's tasks provided the basis of all later investigations of conservation; and because
conservation of length is a logical pre-requisite of measurement, conservation tasks
have been carried out alongside measurement tasks (Hart 2004; Petitto 1990; Boulton-
Lewis 1987; Carpenter & Lewis 1976). In general, however, specific ways in which
conservation ability may be bound up with measurement ability have not been
examined. In the present study, conservation tasks were embedded in investigation of
children's understanding of the language of length. Thus Research Questions 3a) and
3b) ask: In the context of everyday length comparisons, do children conserve length?
and If not, does this make any difference to their measurement ability?
Piaget's focus on ordination is further considered below.
Continuity and subdivision
Piaget identified the paradox of continuity and subdivision - that a length or surface
conserves its length or area, when subdivided — as a key conceptual element in the
construction of Euclidean space. Here, understanding of continuity is defined as the
ability to conceive a line or surface as composed of extensionless points (Piaget &
30

Inhelder, 1956). While reconciling continuity with subdivision mathematically, this idea
is unhelpful as an account of how children may reconcile them.
A more persuasive account is given in the context specifically of measurement (Piaget
et al., 1960: 62). "Qualitative measuring" is distinguished from "a true metrical system"
because in the former one entire object is compared with another, while in true
measuring one subdivision of an object is abstracted as a unit and applied to the length
of the object (creating further subdivisions). In the construction of number, Piaget
argued, both cardination and ordination deal with discrete units, so the necessary
synthesis is more easily achieved. In measurement like is not being synthesised with
like in this way, and greater psychological difficulty can be expected.
... in the realm of measurement ...there is no automatic synthesis [of subdivision and change of position]. This is because length is continuous and not composed of discrete units. It can indeed be subdivided as we have seen... but the portions arrived at are immobile because they are connected so that it is difficult to compare them. The realisation that successive segments of a straight line are congruent therefore demands a greater degree of abstraction than the establishment of congruence between two separate moveable objects.
(Piaget et al., 1960: 60-61)
In addressing Research Question 6: How well do children measure? the present research tested the claim that children would find "qualitative measuring" (where the lengths of two whole entities are compared) (Piaget et al., 1960: 62) more difficult than using "a true metrical system" embodied in scaled measuring instruments.
Ordination
Piaget noted that ordination is logically presupposed in any comparison of quantities
and hence in any form of measurement.
If A, B and C are known to be successive points on a straight line, then, without measuring, we may deduce that the distance AB is shorter than the distance AC. This deduction follows from a knowledge of the order of points ABC and an understanding of the distances AB and AC which, being intervals, are symmetrical relations, but which correspond to the order of points, an asymmetrical relation. (Piaget et al., 1960: 70)
Even with purely qualitative judgements of the form x is bigger than/longer than/deeper
than... y, it must be understood a) that each item in a series differs in amount from
earlier and later items, b) that judgements made in ordering them are relative: any item
in a series (except the first and last) is simultaneously (for example) longer than the
previous item and shorter than the succeeding one; and c) reversing a move in either
31

direction in the series results in a return to the original position. Considerable
intellectual demands on the child are, therefore, involved (although Piaget found
children ordering items qualitatively, to correspond to those in an ordered display, by 5-
6 years old.) (Piaget & Inhelder, 1956). Spatial and number concepts each contribute to
concepts of measurement, and ordination was considered in Piaget's study both of space
(Piaget & Inhelder, 1956; Piaget et al., 1960) and of number (Piaget 1965).
In The Child's Conception of Number (Piaget 1965) the development of ordination and
of cardination were dealt with together. Here, the focus was not on the spatial, but on
the numeric properties of a series. Piaget considered that ordination and cardination
(though logically interdependent) developed independently as they jointly apply to
series. In one study, children were first shown (Piaget 1965: 97) a number of dolls and
sticks that varied in length and asked to find the stick that belonged to each doll. To
achieve this, the dolls had to be put in order of length and the sticks matched to them for
length (or vice versa); or dolls and sticks ordered separately, the two lines afterwards
being put in one-to-one correspondence. Only at about seven years old did children
achieve complete success, carefully looking for the 'next largest/smallest' before laying
an item and checking the whole length of each series for correctness with each addition.
In one version of the task, there was a consistent error of particular interest. The order of
one of the rows was reversed, a doll was indicated and the child was asked which stick
belonged to it. Children would identify a stick just before the one that correctly
corresponded with the indicated doll. Piaget argued that they could not co-ordinate their
knowledge that each item must have a unique ordinal position with their knowledge that
the set of all items that preceded it in the series plus the focus item had a cardinal value.
Hence they would count the set of items that preceded the focus item, and then number
its ordinal position as a conceptually distinct operation, resulting in a difference of one.
By about 7 years old, children counted the item whose position they were finding
together with those before (or after) it in the series. For Piaget, this uniting of the
cardinal and the ordinal represented a major step in the development of number
operations including the ability to measure.
The present research, too, Research Question 4 asked How well do children make
ordinal comparisons of length? but confined itself to eliciting qualitative judgements of
shorter, longer and the same. This was because these particular kinds of ordinal
judgements logically underpin numerical measurement, the central focus of the
research.
32

Transitive inference: the 'towers' study
In measurement, transitivity is the fundamental logical principle underlying the use of
the standard unit (Piaget, 1970). It is regarded by logicians as an axiom of measurement
(Nagel 1930). If A and C are two objects whose length, say, is to be compared,
transitive reasoning produces a deductive inference such as: If A > B and B > C, then
A > C, where comparing B with C is logically equivalent to comparing A with C
directly. B is the common or middle term through which the comparison is made. The
required understanding is that B can represent the length of A for comparison with the
length of C, removing the need for direct comparison between A and C. The role of B
is what makes the inference transitive.
The 'towers' task (Piaget et al., 1960) provides Piaget's most complete description of the
psychological construction of measurement, shown as the construction of transitivity.
Here the focus of interest is not direct comparison of the lengths of objects, but the
middle term employed to compare lengths. The most familiar example of such a middle
term is the ruler with its inscribed units, but in this study Piaget avoided conventional
associations with measurement, using an unmarked stick and excluding, in the initial
instructions, the word 'measure' itself, so as to investigate spontaneous measuring
behaviour. The transitivity investigated was concrete and not formal (Smedslund,
1963): children's spontaneous behaviour and utterances were observed for evidence that
implicit transitive inferences were being made.
The child was shown a tower of blocks of assorted sizes standing on a table, and was
asked to build a second tower of the same height on a table two metres away and 90 cm
lower than the first table. The assorted blocks he was given differed from those used in
the first tower, so as to prevent equality being achieved through one-to-one matching of
sizes. The child was given a supply of sticks and strips of paper which could serve as
measuring devices, but was not told their purpose.
Piaget argued that subdivision and change of position (defining features of length
measurement) were present at some level in every attempt to compare the heights of the
two towers. For example, in visual comparison, actually looking from one tower to the
other constitutes a virtual bringing together of the two towers (change of position),
while the observation that one tower appears to be taller than the other is followed by
visually referencing the shorter against the taller, decomposing the taller into the part
estimated to be equal in height to the shorter and the remaining portion, so as to
estimate by how much it is taller (subdivision).
33

Until the age of about 4 1/2, children relied exclusively on visual comparison of the
towers and showed no awareness of its fallibility, or of the possibility of using any other
method of comparing their heights. Judgements were typically justified by saying
simply 'I can see that it is so'. Visual comparison continued to be used thereafter, even
as a check on later-developing strategies, but with some awareness of its limitations.
The observation that a strategy is not discarded when a more sophisticated one is
acquired is common in developmental studies (e.g. Siegler, 1996), and seemed also to
apply to later strategies reported in the 'towers' study. In measurement, however, Piaget
argued that strategies are not simply retained side by side, but that there is a retroactive
effect. The child's gradual development of a co-ordinate system causes the perceptions
and physical movements which gave rise to it to become better co-ordinated and more
accurate; children become more aware of accuracy, and of the limitations and proneness
to error of visual comparison. Thus older children are satisfied with visual comparison
until they are asked to verify their judgment, when they notice that the bases of the
towers are not in the same plane. This line of argument arises from Piaget's view that
mature spatial concepts develop from a complex interplay between perception and
movement; however the finding is also consistent with the view that children already
possess the necessary understanding, but do not spontaneously recognize when they
need to apply it (Bryant & Kopytinska 1976).
Piaget also gives a higher-level explanation in terms of childhood egocentrism, in
relation to spatial concepts:
They are supremely confident because they are supremely unaware of the empty space which separates the two objects. It is the subject who, by the mere act of seeing, furnishes the only link between the objects so that one is directly assimilated to the other. He therefore dispenses with the use of an objective measuring rule and with the structuration of space. (Piaget et al.,1960: 40. Italics added.)
In the study, if the use of the stick was suggested to the children, they might point it at
their structure, or lay it across the top of a tower, but they did not attempt to use it as a
measure. These children judged the comparative height of the two towers by reference
to their tops only, and did not take into account the differing positions of their bases,
exactly as the children in the studies of conservation of horizontal length took into
account only the protrusion of the end of one stick in a pair, ignoring the compensating
retraction of its other extremity. Children next attempted 'manual transfer' when they
became aware that the bases of the towers were in different planes, and that visual
comparison was untrustworthy. Now the children tried to move one tower across to
34

stand by the other, to place the towers physically in the same plane, interpreted as a
further stage in understanding space as a unity with fixed co-ordinates.
A child's use of his hands, leg or trunk to mark the height of one tower and then 'carry' it
across to the other for comparison was seen as a further development. This 'body
transfer', in Piaget's view well on the way to constituting a middle term by which the
heights are compared, does not achieve this status because its function is still to
preserve the height of the first tower, not yet understood as embodied in an independent
measure. The cause of transition to true measuring is the child's dissatisfaction with the
accuracy of his use of body transfer. Piaget argues that the effortful gestures involved
require constant monitoring and adjustment so that, for example, the hands remain in
the same plane while the height is 'carried' to the second tower. This increases
awareness of horizontality and verticality and continues the work of the mental
construction of Euclidean space. (Piaget et al., 1960: 55).
What happens next, according to Piaget, is that the gesture of body transfer is mentally
represented as "interiorised imitation" (Piaget et al., 1960: 50). This representation is
then projected on to a symbolic object, which finally becomes the independent
intermediate term or measuring instrument. (Before this, children may accept a strip of
paper or a stick as a measure, but may merely place it against the first tower and ask
what to do next, or place it only against the second tower and say, 'Yes, that's right'.
There is no concept of its function as a middle term). When the term is accepted as
intermediate, there are at first limitations on its perceived usefulness: only if it proves to
be exactly equal in height to that of the first tower do children accept it as a measure.
Children's judgements are still "semi-perceptual" (Piaget et al., 1960: 54). This
phenomenon also reflects the absence of fully-developed ordination: the children are
unable to understand length as a succession of intervals between points in an ordered
series; their attention remains confined to the end-points of the whole length. Later,
children are able to use the stick or strip of paper as a measure if it is longer than the
first tower, marking off the height of the tower on the measure, but not if the measure is
shorter than the tower. Later still they do accept the use of a shorter measure, but try to
make up the full length required in makeshift fashion with another object. In both cases
transitive inferences are being made in the form of "transitive congruence" (Piaget et
al., 1960: 60) It does not occur to the children to use a short length repeatedly as an
iterated unit, or to mark equal divisions on their measure for the purpose of adding extra
such units. Hence their understanding, Piaget says, is still qualitative.
35

In the present research, children were invited to say what they understood by
`measuring' and their descriptions of specific measuring experiences were elicited. By
these means it was possible to look for evidence of the staged understanding pictured
here by Piaget, and this was one objective of Research Question la): What do children
learn about measurement in their everyday social context, and lb) How might this affect
their conceptual understanding of measurement?
Why should the final transition to quantitative measuring, as illustrated in the 'towers'
study, and involving the iteration of a unit, prove so difficult, since the prerequisites of
cardination and ordination are established? Piaget's view is that they are established for
discrete units, not continuous quantities, and that continuous length is experienced by
children as a different kind of thing from the units they are used to counting and
ordering and hence not susceptible to the same treatment (Piaget et al., 1960: 61). The
present research investigated this claim by asking in Research Question 8: Is there
evidence that children conceptualise in different ways, units that are physically separate
and units that form a scale?
Finally, children do grasp and confidently iterate a unit such as one of the small bricks
they have used to build their tower, to compare its height with that of the first tower, as
a fully-developed middle term. Piaget is silent about the mechanism for this transition.
As an account of the way transitivity might typically develop, this is highly plausible. It
incorporates at its explanatory best the Piagetian paradigm of physical activity working
to expand childhood egocentrism. Change of position, and later subdivision, as key
features of measurement, are strikingly present. However, as with other processes
reviewed above, no psychological mechanism is offered for the decisive conceptual
changes with which the account culminates, and the notion of mental representation
involved, that of the schema, is left vague.
Bryant & Kopytinska (1976) tested the hypothesis that in the 'towers' study children
failed to measure not because they did not understand that the height of the two towers
could be compared through a middle term, but because they were satisfied with visual
comparison. They predicted that children would measure (and hence show an
understanding of transitivity) if the possibility of visual comparison were removed.
Sixty five-year-olds and sixty six-year-olds who had all failed to measure in the
`towers' task were asked to determine the comparative depth of holes bored in wooden
blocks. A stick of suitable length that would fit into the holes was provided. Most
children used the stick as a measure without prompting, and most were correct in their
36

judgments. However in another condition using transparent blocks, so that the depth of
the holes could be seen, most children still measured. These blocks were, though, placed
on different tables to discourage visual comparison, so it could still be argued that it is
dissatisfaction with the quality of specific visual comparisons that leads to an increase
in measurement. The perceived affordances of the situation (and the intrinsic interest of
inserting sticks into holes) provides an equally plausible explanation. What this study
does illustrate is that whether or not children will use an intervening measure varies
with context and type of task. In the present work, contextual information was sought
through Research Question 1 a): What do children learn about measurement in their
everyday social context? The effect of varying the type of task was examined by the
combination of differing measuring devices and lengths of line used in answering
Research Question 6: How well do children measure?
Subdivision and change of position
Piaget had formulated his definition of measuring in terms of subdivision and change of
position (Piaget et al., 1960), and in the 'towers' study, each developmental step
embodied these ideas. In the studies of length conservation, various ways of subdividing
length are shown to mislead children as to actual length. The idea of subdivision is thus
central to Piaget's treatment of measurement, both as fundamental concept and as
stumbling-block. It is indeed clear that inability to deal with subdivision must
compromise a child's ability to compare lengths or to deploy units, but the nature of the
psychological difficulties is not explored by Piaget. The present research explored
important aspects of the subdivision of units by means of Research Questions 9b): Do
children understand that larger units may 'contain' smaller ones? and 10: How well do
they cope with fractional units? Research on subdivision of units is further considered
later in this review.
1.2.1.3 Order of acquisition of components of measurement
An invariant order of acquisition of concepts underpinning measurement was proposed
by Piaget governed by what he viewed as their increasing logical complexity. This order
was repeatedly challenged (e.g. by Petitto, 1990; Boulton- Lewis, 1987; Braine, 1959)
on the grounds that performance of a task at any level may reflect the state of other
cognitive capacities that develop with age but are non-logical, such as working memory.
Boulton-Lewis (1987) tested length-measuring knowledge in 3-7 year-old children
using three possible developmental sequences. The first was a purely logico-
mathematical sequence based on Nagel's (1930) axioms of quantity. The second, an
37

age-related sequence drawn from the literature on the development of logical reasoning
that largely followed Piaget. The third classified the concepts in the Nagel sequence
according to the information-processing and central processing requirements (M-space)
of the types of task involved (Halford 1982; Halford & Wilson, 1980).
Children from 4 to 8 years old were tested individually on M-space and short-term
memory measures and on tasks producing measures of all the variables in the identified
sequences. Using a scalogram analysis, the results were put into a developmental
sequence of length and number knowledge for the 80 participants, afterwards
statistically tested to confirm sequence or co-occurrence of variables.
Four sets of associated variables emerged by age. The first set included ability to copy a
horizontal line constructed with counters; recognition of equality or inequality of
lengths of lines and ability to use the associated language; seriation by length (all from
the literature sequence); subitising, and naming numbers 1 to 5. The second set
consisted of recognition of length invariance, conservation of length, recognition of
transitivity (from the literature sequence), simple number operations to 10 and knowing
numbers greater than 10, and construction of a diagonal line. The third set to emerge
included, surprisingly, recognition of one-to-one correspondence. This basic schema for
counting thus emerged much later than was proposed in the logico-mathematical
sequence. Using a ruler to compare the length of two pieces of ribbon also emerged at
this point. Transitive reasoning occurred last, with no co-occurring variables.
The developmental sequence that emerged from this study bore little relationship to the
Piagetian sequence, or to that derived from Nagel. It most resembled that predicted by
the information-processing demands of the tasks. The study posed therefore a
significant challenge to Piaget's account of the construction of measurement, which
presupposed a straightforward relationship between logical simplicity or complexity and
psychological ease or difficulty.
1.2.1.4 The Piagetian framework: summary
Because the components of measurement are logically mutually entailed, full co-
ordination of these as a mental schema for measurement was seen by Piaget as both a
necessary and sufficient condition for fully-developed understanding; there was no
account of additional psychological factors. Development was conceived as a process of
internalising physical actions: almost all the Piagetian studies reviewed above described
understanding as arrived at in this way. When a schema was complete, it was said to be
38
`operational'. This term retained the notion of activity on the mental level; knowledge
was not merely passive, but available for use in many contexts.
Piagetian methodology typically involved close observation and questioning of eight to
ten individual children engaged in the tasks set. These were designed to help the
experimenter to infer a child's thinking in respect of some component, or co-ordination
of components, of measurement. Piaget would first give a theoretical interpretation of
the meaning of children's typical actions (and sometimes justifications) in a given task.
Illustrative details of specific actions of individual children within a given age-range
were then reported, together with verbatim excerpts from the researcher's questioning
about their actions, and of the children's responses and sometimes justifications for
them. Finally the theoretical account was reiterated, and the detailed findings located
precisely within it. This methodology resulted in uniquely detailed and rounded
descriptions of aspects of the development of measurement, but their coherence
depended on acceptance of the entire Piagetian logical framework. Outside this
framework, later research used much larger samples, had more regard for issues of
validity and reliability, but investigated narrower aspects of measurement. The
framework indeed did not survive later empirical tests. Neither the general thesis that
the construction of Euclidean space is a late accomplishment, nor the development of
many of its component concepts, turned out to be as Piaget described. Nevertheless, the
work continues, obliquely, to suggest fruitful lines of enquiry, as the following two
examples show.
First, as underpinning for understanding continuous length, the concept of a line as a
series of extensionless points (Piaget et al., 1960) was surely unnecessary; nevertheless,
this formulation drew attention to the paradox of continuity in the face of subdivision,
and this represents a persistent difficulty for children learning to measure (Lamon 1996;
Brown et al., 1995). Second, errors children made when establishing a series (Piaget
1965) were ascribed to their incomplete integration of ordinal with cardinal number.
Over-elaborate for its immediate purpose, this explanation nevertheless suggested a
broad area of potential difficulty: understanding how a numbered sequence of units
marks amount on a measuring device.
The opposing poles of Piaget's theory were perception and mental representation, but
their roles in explanation lacked consistency. In conservation studies, perceptual
features of displays were held responsible for obstructing the conception of invariance.
In developing conceptions of space, children were said to perceive space three-
39

dimensionally, but represent it mentally as topological. In the development of
transitivity, children abandoned exclusive reliance on perceptual methods of length
comparison, to conceive length as invested in the middle term in transitive inference.
Piaget offered no mechanism for transition to mental representations, or account of how
these differed from perceptions. Moreover conscious awareness of mental
representations varied in importance in his account. The development of transitive
inference was described as spontaneous and unselfconscious. In other research, where
children were asked to justify their judgements, not only conscious awareness but the
ability to articulate it were considered a necessary part of understanding.
It has long been recognised that notions of perception and mental representation cannot
in fact be separated and that unprocessed sensation is a myth (Russell, 1987).
Conversely, some types of inference, long conceived as a characteristically mental
activity, have been shown to be part and parcel of perception (Resnick, 1992; Spelke,
1990; Gibson, 1979; Bryant 1974). The notion of inference has been extended to the
perceptual-mental activities of infants (Feigenson, Dehaene & Spelke, 2004).
Meanwhile, research in the Piagetian developmental tradition has taken up the challenge
of giving a theoretical account of mental representation including the role of conscious
awareness. The work of Karmiloff-Smith (1992) is particularly relevant to the present
research for the prominence it gives to procedural knowledge.
1.2.1.5 Later development of the notion of mental representation: Representational
Redescription
Karmiloff-Smith's theory of representational redescription (RR) addressed the same
phenomena as Piaget: the increasing breadth and general applicability of children's
logical resources, of which the development of measurement is a paradigm, but focused
on the mechanism for the changes in mental representation involved. It sought to
"account for the way in which children's representations become progressively more
manipulable and flexible [and] for the emergence of conscious access to knowledge"
(1992: 17). In the model, procedural competence, conscious awareness of knowledge,
and its accessibility to verbal report are all accounted for in the developmental process.
A four-phase cycle is proposed that recurs within domains during adulthood as well as
childhood. In the first phase, data from the external environment are stored additively,
with little processing (Implicit level), and drawn on to execute simple behavioural
procedures, guided by immediate environmental feedback. By trial and error, for
example, four-year-olds successfully balanced, on a fulcrum, blocks containing weights
40
in different locations. (Karmiloff-Smith, 1984). In the second phase some implicit,
procedural knowledge is mentally 're-described' independently of further environmental
input. Some details are lost and the rest become permeable by similar features of other
such stored knowledge to form the beginnings of cross-domain concepts at Explicit-1
level (E-1). In the third phase, E-2 level, 're-described' knowledge is available to
conscious awareness but not to verbal formulation as a principle. Evidence for an E-2
level comes from the 'U-shaped curve', characteristic of knowledge acquisition in many
domains, where the bottom of the curve reflects failures in a task previously correctly
performed. Here, environmental feedback temporarily loses its influence during mental
simplification and generalisation of previously-stored data. The resulting 'theory' (for
example 'a block always balances at its geometrical centre') is then consciously applied
and dominates behaviour, so that no adjustment is made to procedures that produce
errors.
At phase four (E-3 level) types of encoding become capable of inter-relating, providing
a basis that is sufficiently rich to allow linguistic expression. Now specific procedures
may be verbally justified by reference to a principle. Increased conceptual flexibility
permits new data from the external environment to be used to amend a theory.
Two departures from the Piagetian account are of particular note. Firstly, mental
representations characteristic of any phase may co-exist and be cognitively available
within their limits. Thus cognitive development is shorn of the rigidity of Piagetian
structuralism. Secondly, at level E-2, children may be aware of a principle that they
cannot yet explain; the status given by Piaget to correct justification is thereby removed
as a hallmark of understanding. The RR theory has been extended, notably by Pine &
Messer (2003; 1993) who confirmed Karmiloff-Smith's levels and identified additional,
transitional levels, noting a complex role for language. As confirmation that complex
representations may be present at different times in different domains, they also found
five-year-olds to be capable of taking account of both weight and distance in the balance
beam task. The role of language in conceptual advance on that task was also established,
within the RR framework, by Philips & Tolmie (2007), who explored parents' verbal
contributions to children's success. For Karmiloff-Smith, mastery of the relevant
procedures is a pre-condition for initiation of level E-1 in any domain. This retains the
Piagetian idea that physical activity is at the root of cognitive development
41

1.2.1.6 Piagetian individual constructivism and the socio-cultural perspective
Children construct their conceptual understanding of measurement within a specific
socio-cultural environment that must influence the process, perhaps profoundly.
Authors considered later in this review have attached considerable weight to socio-
cultural influences (Miller, 1989; Resnick, 1992; Nunes, Light & Mason, 1993). For
example, Resnick (1992: 107-108, italics in the original) characterises mathematical
development as "both situation-specific and situation-inclusive": what is learned is
attuned to the social demands of a specific situation, and to all its demands, not merely
the mathematical aspects. For the educator who values the learning done by children in
everyday life, the problem then becomes one of identifying reliable theoretical
continuities between that learning and more formal mathematics instruction.
Aspects of the children's socio-cultural environment in relation to measurement,
including the classroom environment, were investigated in the present research by
means of Research Questions la): What do children learn about measurement in their
everyday social context, and lb) How might this affect their conceptual understanding
of measurement? The expectation was that "a constitutive role in learning for...emergent
processes which cannot be reduced to generalised structures" (Lave & Wenger 1991:
16) might well be revealed. However, the more thoroughgoing theoretical stance of
these authors (Lave & Wenger 1991:17 Foreword) was resisted:
In a classical structural analysis...understanding is seen to arise out of the mental operations of a subject on objective structures. Lave and Wenger reject this view of understanding insofar as they locate learning not in the acquisition of structure, but in the increased access of learners to participating roles in expert performances.
This perspective does not exclude unassisted individual learning, where required by the
social (for example, the classroom) context, but apprenticeship is the favoured model.
The present writer's perspective remains, however, in the individual constructivist
tradition, and retains structuralist features. This is because where mathematical
understanding is concerned, "participating roles in expert performances" do not seem
equal to the task of overcoming the conceptual difficulties often involved; and also
because the understanding of fundamental principles is to be contrasted with the
mastery of procedures, however acquired, and however expertly performed. The
perspective of Lave & Wenger does not seem to give adequate weight to these
considerations.
42

1.2.2 Non-numerical components of measurement
Measuring using standard units is numerical, producing absolute judgements of length.
Underlying numerical measurement, however, are perceptual judgements of amount,
and fundamental, non-numerical kinds of reasoning about amounts. Theory and
research relevant to these aspects are now reviewed. They include infants' responses to
ratio characteristics of displayed amounts, relative judgements of size in visual
estimation, and protoquantitative reasoning (Resnick, 1992). Because measuring
instruments embody the principle of transitive inference, its extensive literature is also
explored in this section. Finally Miller's (1989; 1984) hypothesis that measurement
procedures may influence conceptions of amount is considered.
1.2.2.1 Ratio discrimination in infancy
A wealth of research has used habituation and looking time paradigms to explore
infants' abilities to discriminate quantities (Feigenson, Dehaene & Spelke, 2004),
including ratio characteristics of numerosities. With strict controls on non-numerical
features of displays, six-months-olds discriminate between large collections of dots in
the ratio 1:2. Thus they discriminate 8 versus 16, and 16 versus 32 dots, but not 8 versus
12 nor 16 versus 24. Ten-months-olds do discriminate between the latter collections,
which are in the ratio of 2:3. Similar discriminability applies to sounds, and this
similarity suggests representation of these ratios as such. An 'accumulator' analogue-
magnitude model (Meek & Church, 1983) is proposed to account for such
representation (Feigenson, Carey & Spelke, 2002). When an infant sees an array of
items, each item allows a burst of energy into an accumulator. A 'gate' comes down
after each item. After the last item in the set, the accumulated magnitude is stored in
memory. This magnitude represents the number of items in the set, but is a continuous
magnitude; that it represents them is shown by its ratio character.
Discrimination of small numerosities (1-3) is not made according to ratios. The findings
suggest that different developmental factors may be involved in approximate
representations of relative amounts (as ratios), from those involved in precise
representations of small differences in numerosity. Findings also suggest (non-human
primates appear to make similar representations) innate specification of some aspects of
quantity (Feigenson et al., 2004). The infancy studies provide developmental
underpinning for findings regarding early relative judgements (Bryant, 1974), and some
basis (if there are different developmental routes) for difficulties encountered in the
integration of number with amount, considered later, in the section dealing with units.
43

1.2.2.2 Relative versus absolute judgements of size
Piaget considered that relational reasoning, including relative judgements, develops
from the co-ordination of separate cognitive competences previously acquired. Bryant
(1974) proposed instead that the ability to make relative judgements develops before the
ability to make absolute judgements, and that this sequence is the key to the
development of concepts of size and number. Thus it is the size of objects in relation to
their frame of reference that is 'given' in perception (cf. Gibson, 1979) and judgements
of absolute size that are more difficult and develop later.
Bryant hypothesised that in early experiments to compare sizes of two stimuli (Kohler,
1918; Spence, 1937) participants were actually making two size comparisons: first of
the size of each stimulus relative to its immediate background; and second of the
relative sizes of stimuli to each other through their relationship to this common
background.
Lawrenson & Bryant (1972) tested this hypothesis by comparing children's 'relative' and
'absolute' responses. Independent groups of four to six-year-olds undertook 'relative' and
'absolute' tasks. In the 'relative' task, squares of white card in a succession of pairs of
different within-pair sizes were presented. Children in the 'relative' group were trained
to respond sometimes to the larger, and sometimes to the smaller square in each pair. In
the tests that followed, the children had to select either the larger or smaller square from
each pair. The relative sizes of the two squares within each pair remained the same for
each pair (one square being twice the area of the other) but the larger card in each pair
was always the same absolute size as the smaller card in the succeeding pair.
The 'absolute' group was trained to select always the square that was the same absolute
size as one of the squares in a preceding pair, but within a pair the correct choice was
sometimes the larger and sometimes the smaller. Lawrenson and Bryant reported more
errors overall on the 'absolute' than on the 'relative' task, irrespective of age, and took
the results of the study as strong evidence for primary use of a relative code by young
children.
Bryant argued on such evidence that young children recognize relationships such as
'larger than' and 'smaller than' before they recognize absolute size. This important claim,
subsequently widely accepted (e.g. Resnick 1992; Resnick & Singer 1993; Nunes &
Bryant 1996) and substantiated in relation to infants (Feigenson et al., 2004) was
rigorously tested in the present research in relation to measuring, where the tasks
required separate relative and absolute judgements to be made. Research Question 6:
44

How well do children measure? examined both types of judgment. In estimation tasks
(as well as language tasks), purely relative judgements were required and were
examined by Research Question 4: How well do children make ordinal comparisons of
length? Associations between success in relative and absolute judgements were then
statistically tested. (Research question 11: Are there associations among understanding
the everyday language of length, ability to make ordinal comparisons of length, and the
ability to measure?)
Bryant discussed implicit perceptual comparisons, not inferences following reflection,
whereas the Piagetian notion of co-ordination involved a degree of reasoning: in
conservation tasks, for example, children's justification of their judgements informed
the researchers' assessment of their understanding. Nevertheless Bryant's work gave to
perception a fundamental role in developing understanding of amount, in contrast to the
Piagetian view of perceptual salience as the source of errors.
1.2.2.3 Transitive inference
Standard units and measuring instruments on which they appear are physical
embodiments of transitive inference, the notion that a specific length (for example lcm)
may be abstracted from any given instantiation of it and used to compare the lengths of
two or more objects without the need to bring them together for direct comparison.
Transitivity, an axiom of measurement (Nagel, 1930), is the logical foundation of all
ordinal continua such as number, size and weight (Pears & Bryant, 1990) and hence
must be grasped if the notion of a scale is to be understood (Markovits, Dumas &
Malfait, 1995). Ability to make transitive inferences has been thoroughly investigated.
In typical transitivity studies involving length, a series of sticks A, B, C of increasing
length is employed such that A>B>C. The sticks are typically colour-coded to make
them individually memorable. Children are shown neighbouring sticks from the series
in pairs, and are asked to judge which stick is longer or shorter. This is the 'training'
phase and ensures that correct comparative judgements are being made. In the test
phase, children are shown some stick from the series. This is removed and another is
shown that was not its neighbour in the series; thus the child has never directly
compared these two sticks. For example A, then C may be shown. The child is asked
which is longer. To respond correctly, the child must make an inference based on the
length of the missing middle stick B. Correct responses over a number of trials are taken
as indicating that transitive inferences are being made.
45

Early studies
An early critic of Piaget's studies of transitivity, Braine (1959) identified many possible
influences on task outcome that the studies did not control for, such as differing
demands on perceptual discrimination by stimulus materials, level of vocabulary
development, and memory demands of an extended series of comparisons. His own
studies sought to eliminate some of these factors. For example, to control for memory of
absolute length of sticks (which would make inference redundant) differences in length
were made small and visual distractors were used. Children were trained to mastery
with pairs of sticks in the first phase. For reliability, a minimum of forty trials was used
in the test phase.
While Piaget believed that transitive inference and the ability to measure emerged
together at about 7 or 8 years, Braine concluded that transitive inference appeared about
two years earlier, and that ability to measure was achieved later. He also identified
children's ability to manipulate measuring instruments and interest in doing so as
important factors.
Smedslund (1963) identified several possible non-transitive explanations of Braine's
results in the transitivity tasks and claimed to have found support for Piaget as to the
age of acquisition of transitivity, but doubts were raised about whether his own studies
showed genuine transitive inference (Braine, 1964). Later investigators (Murray &
Youniss, 1968; Brainerd, 1973) used simpler protocols while similarly seeking to
control for confounding factors.
The middle term
In the studies of Murray & Youniss (1968; Youniss & Murray, 1970) interest centred on
the 'middle term' and its independence of the absolute length of the first term in
children's judgments. In apparently inferring that A is longer than C, perhaps children
merely ignored stick B and remembered that A was the longest in the series. Murray
and Youniss dealt with this by adopting several versions of the relationship with the
middle term: A>B>C, A>B=C and A=B>C. Only younger children were affected by
version. Bryant & Trabasso (1971) noted that for a truly transitive inference to be made,
the 'middle term' had to be understood as essentially relative: B is both longer than C
and shorter than A. However, after making the initial comparisons A, B and B, C (prior
to the inferential comparison) children could remember within each pair (the researchers
argued) which term was shorter and which was longer; a response in accordance with
this remembered judgement was thus indistinguishable from a correct inferential
46

response. They proposed a longer sequence, A>B>C>D>E as an unambiguous test.
Here, an inference was available that did not involve any anchoring to the absolute
length of the end terms A and E: that is the inference B>C and C>D, so B>D.
Memory demands
A longer sequence, however, puts greater demands on children's memory for the terms
in the series and their relations, so Bryant & Trabasso (1971) incorporated a thorough
training period for memory of the four direct comparisons. Their results showed that in
these circumstances 4, 5, and 6-year-olds performed well on all the inferences involved,
including the crucial B, D comparison. Youniss & Furth (1973) pointed out, however,
that memory had been confounded with other factors such as learning and attention.
Riley & Trabasso (1974) confirmed with children of a similar age the importance of
memory for the premises in transitivity, but Russell (1981) found that this was not a
sufficient condition: in one study, one-third of participants justified incorrect inferences
by reference to the correct premises, showing that these were both stored and retrieved
from memory. Riley & Trabasso (1974) also found that inferential responses were at a
higher level when questioning forced children to make a reversible judgment: for
example that not only was A>B, but at the same time B<A. The importance of memory
for the premises as a general factor in performance on reasoning tasks (Johnson-Laird,
1983) was investigated for transitive inference by Trabasso, Riley and Wilson (1975),
who pointed out that transitive inference is a form of syllogistic reasoning. For them as
for Johnson-Laird in his studies of adult reasoning, the key factor affecting success is
the manner of representation of the premises of the inference in memory. The key
question was: by what process does comparison of individual pairs of items lead to
transitive inference? Riley & Trabasso (1974), using six sticks, suggested that items at
each end of the series are again key.
Representation in memory
One possibility is that comparisons (premises) AB, BC and so on are represented
separately in memory as ordered pairs, and so must be retrieved separately and then
compared in distinct operations. The other possibility is that they are represented as a
linear order and retrieved as such. The 'inferential' comparison is then made by reading
it off from this series, and is not, therefore, actually inferential. Trabasso et al., (1975)
proposed the latter. They proposed that information about the longest and shortest pairs
of sticks (AB and EF) is encoded first, and then pairs are encoded working inwards
(BC, ED and finally CD). As evidence for this they found a serial position effect,
47

whereby the greatest number of errors occurred in the pairs furthest from the ends of the
series. Consistent with spatial encoding of the pairs as a series, they found better recall
for pair 2,5 (two inferential steps) than for 2,4 or 3,5 (one inferential step). This held for
younger and older children and for adults, and so, contrary to Piaget, did not appear to
be developmental. Breslow (1981) suggested that although inference need not be
involved if responses are 'read off from a serial representation, inference may be
essential in the construction of this representation in the training phase of studies. To
verify correct placing of a stick in a series, (as in Piaget's studies) one would have to
infer that all sticks to one side of the focus stick were shorter than it, and all those to the
other were longer. This could not be done by repeatedly comparing adjacent sticks:
transitive inference is involved.
The questions whether young children's responses to transitivity tasks indicate that they
learn the absolute length of individual sticks rather than comparative length, whether
each comparison they learn is stored independently or as part of a series, and whether
representation of such a series itself entails that transitive inferences have been made,
were not resolved (Thayer & Collyer, 1978; Miller, 1976; Harris & Bassett, 1975; De
Boysson-Bardies & O'Reagan, 1973). Moreover the typically very large number of trials
may have produced a training effect that casts doubt on the developmental
interpretations made of the results. Pears and Bryant (1990) ingeniously bypassed the
need to train memory for the premises in a transitivity task that investigated judgments
about spatial position rather than length. The premises consisted of stacks of two blocks,
A above B, B above C, C above D, D above E and E above F, in which the elements
were represented by colours, for example A=yellow, B=blue. The child's task was to
construct a stack of six blocks (sometimes fewer) in which the spatial relationships
between the colours in the two-block stacks was preserved. All the block stacks were on
view at once, removing the need for memory training, because absolute spatial positions
were not preserved in the final tower and so direct comparisons would not help. The
number of 4-5-year-old children apparently making correct inferences was well above
chance.
Transitive inference as analogical reasoning
Halford (1992) construed transitive inference as a form of analogical reasoning, that is,
mapping from a known source structure to an unknown target structure (Gentner, 1983).
Here, the source structure is the left-to-right or top-to-bottom series familiar in everyday
life; Halford cited evidence that constructing such a series often precedes transitive
48

inferences. His example gave top above middle above bottom as a source structure and
John is fairer than Peter is fairer than Tom as a target structure. Once the mapping has
been made, John is fairer than Tom can simply be read off Children have difficulty
with transitive inferences, he suggested, because of the processing load involved in
mapping. However, while mapping is a plausible model for a short, three-term series,
more may be involved than increased processing load for a longer series where
(Breslow, 1981) transitive inference may be involved in the initial construction of the
series (however familiar). More fundamentally, if children are 'reading off' the
inference (Trabasso et al., 1975) they could in principle do this as easily from the target
structure as from the source structure.
Using the mapping paradigm Goswami (1995) tested whether three- and four-year-olds
could make transitive inferences involving two relations of relative size. From an array
of three objects of their own, children identified an object that was 'the same' (according
to type of object, spatial position of objects within the array, or absolute or relative size)
as an object indicated in the experimenter's array of three. Transitive inference was
required for success where the spatial position of objects was selected, because the
children had to order the objects mentally before judging.
There was a very high success rate for both age groups. The lowest scores occurred
where the objects in the child's array differed both in absolute size and in spatial
position from those of the experimenter, but even here success was at around seventy
per cent. This was additional evidence, therefore, that pre-school children can
apparently make transitive inferences in some situations.
Sternberg used the case of transitive inference to consider how logical competence may
be constructed psychologically. Making use of the mental models paradigm (Sternberg,
1980a), he attempted to explain use of the 'middle term' as use of a 'pivot element'
consisting of the mental superimposition of term A on to term B for comparison with C.
Appraisal of the literature on transitive inference
A paradox emerges from the literature reviewed. While Piaget is silent as to how
transitivity, as a decisive advance in logical development, is mentally represented, many
who pursued this question tended to conclude that true inference was absent. Yet an
individual who can explain how units on a measuring instrument represent the same
quantity wherever that quantity is located has surely grasped a principle of considerable
importance.
49
Research on transitive inference represents one attempt to give an account of deductive
reasoning in terms of psychological process. Breslow (1981) argued that accounts
reviewed above are reductionist and fail to do justice to the central position given by
Piaget to the notion of logical competence. Youniss and Furth (1973: 315) made a
similar point when they described correct 'transitive inferences' made after extensive
memory training as purely perceptual and "sub-logical".
Two separate issues underlie this debate. The first concerns competence and
performance. Cognitive factors such as attention and memory influence children's
ability to make transitive inferences; so do features of an investigation, such as whether
tasks 'make sense' to a child and whether the researcher's language is understood in the
way intended (Donaldson, 1978). Some of these factors were addressed by the
researchers reviewed above, with the aim of investigating purely logical competence.
On a wider front, such efforts have resulted in claims of implicit logical ability quite
early in childhood (e.g. Donaldson, 1978; Gelman & Gallistel, 1978).
The second issue is more fundamental: the problem of how more powerful logical
structures can possibly arise from any combination of logically weaker components, and
it applies to the whole Piagetian framework underpinning measurement. It remains
intensely debated in domains such as linguistics, where the problem of the 'poverty of
the stimulus' (Chomsky, 1980) remains unresolved, but perhaps its intractability is
correctly viewed simply as the product of a category-mistake (Ryle, 1949); in this case,
an epistemological question is illegitimately posed as a question about psychological
processes.
The literature on transitive inference did not investigate children's understanding of
transitivity in a measurement context, and indeed to do this specifically would be
difficult. However in the present research, Research Question 6: How well do children
measure? provided opportunities to observe children's handling of different measuring
devices and consider how well they appeared to grasp the nature of the standard unit as
embodying the length of the measured object.
1.2.2.4 Protoquantities
Resnick and Singer (1993) proposed a developmental sequence that encompasses
children's competence in making qualitative judgements of amount, and their later
application of number to quantities in measurement. These competencies find their
place within four stages in the development of mathematical reasoning, which the
authors summarise as follows:
50

...early abilities to reason non-numerically about the relations among amounts of physical material provide the child with a set of relational schemas that eventually apply to numerically quantified material and later to numbers as mathematical objects (Resnick & Singer 1993:109)... Eventually...mental entities [will] allow [students] to treat operators (e.g. addition...) not just as actions to be carried out on numbers, but as mathematical objects with properties of their own (110).
`Measurement' is the second of the stages, intermediate between non-numerical
reasoning about quantities and purely formal reasoning with numbers (Resnick 1992),
but this term does not distinguish between countable objects and continuous quantities;
thus units of measurement are not specifically dealt with. It is rather the first,
protoquantitative, stage that is of importance for the present research, including the
discussion of direct and inverse `proto-ratio reasoning'.
Resnick's stages of mathematical reasoning in relation to measurement
Protoquantities are the forerunners of units of any kind. They are amounts of material
considered in qualitative terms. Protoquantitative reasoning is considered to develop
spontaneously from everyday experience of quantities and the language used about
them: to say that there are more boys than girls in the class, or that your house is smaller
than mine are protoquantitative judgements. Such reasoning is employed, too, by expert
adults such as engineers (Resnick & Singer, 1993). Both relative and absolute notions
are included: for example, bigger as well as big. However, the mathematical operations
associated with protoquantities - increase, decrease, combine, separate, compare, order
- are all relative in character; the simplest form is described as direct perceptual
comparison of different sizes of objects or sets. Protoquantitative reasoning can be
inferential, (if some marbles have been removed from a bag, there are fewer marbles in
the bag) and hypothetical (if some marbles were removed, there would be fewer)
(Resnick & Singer, 1993; Resnick, 1992). Like Bryant and unlike Piaget, therefore,
Resnick considers that logical inference develops early. The combining and separating
operations in protoquantitative reasoning also permit part/whole reasoning such as
knowing that if subsets are subdivided, there is no change in the whole set.
In the second stage, children apply counting principles (Gelman & Gallistel, 1978;
Steffe, von Glaserfeld, Richards & Cobb, 1983), developed earlier and independently,
to enumerate objects. Here, numbers describe objects (seven apples) or quantities of
material (ten centimetres of ribbon) and are inseparable from them.
In the third stage, numbers are considered in themselves, rather than as attributes of
physical objects or material. Their 'properties' take the form of relations with other
51

numbers, and are dissociated from quantities of material. In the ultimate stage,
operations on numbers (such as addition) themselves become objects of thought.
Protoquantitative ratio reasoning
Two types of non-numerical reasoning are described as possible forerunners of
numerical ratio reasoning (involved in units): fittingness and covariation. The first is
considered an external ratio after Vergnaud (1988) because different "measure spaces"
(Resnick & Singer, 1993:112) are involved, such as beds and bears in the three bears
story. Only the comparisons 'greater', 'less' and 'the same' are available to
protoquantitative external ratio reasoning, and are judgements of affordance (beds are
too small, too big or just right for a particular size of bear). Resnick & Singer also cite
evidence of "implicit ratio reasoning" (112), where an object may be judged, say, big
(for an egg) or small (for a cereal box). Here, ostensibly absolute judgements are
actually relative.
An internal ratio is the proportion of a part to the whole in the same "measure space"
and is involved in the understanding of units in measurement. Internal ratios are not
easy for children to understand (Nunes, 2008; Piaget et al., 1960), although Resnick and
Singer did not comment on this. The inverse relation between size and number of units,
an example of proportional reasoning that is central to measurement, causes particular
difficulty. In the present research, children were invited to comment on a variety of
everyday measuring devices whose scales displayed different units side by side, so that
their understanding of the inverse relation could be assessed (Research question 9a): Do
children understand the inverse relation between size and number of units?)
The protoquantitative covariation schema is applied to the correspondence of entities
across two series, also familiar from everyday experience, such as 'the larger the child,
the larger their clothes'. Inverse co-variation is also possible but somewhat more
difficult (cf. Piaget, 1965).
Protoquantitative judgements are not necessarily relational (they include subitisation of
small numerosities) and when relational, are not necessarily directly perceptual. Five-
year-olds can correctly judge at better-than-chance the more numerous of two displays
of dots and the longer of two strips of paper, where the two displays are not seen
simultaneously (Cowan, 1982).
52

Implications for measurement of the notion of protoquantities
The work of Resnick (1992) as well as Bryant (1974) suggests, against Piaget, that there
are many contexts in which 'co-ordinations' precede, rather than follow, absolute
judgements, and that a variety of types of inference of relevance to measurement may
be made by children in advance of the involvement of number in such judgements. One
important co-ordination, however, is a later rather than earlier accomplishment, and that
is the integration of early number competence with protoquantitative reasoning in
measurement. There is evidence to suggest that this may not be an easy step (Nunes,
Light & Mason, 1993; Petitto, 1990). While Resnick & Singer did not discuss potential
difficulties with this integration, the present research explicitly investigated it. Research
question 5: How well do children understand that a number may express length? was
pursued in measurement tasks by partnering questions about the absolute lengths of
lines (expressed as a number of units), with questions about comparative length of lines
(relative, protoquantitative judgements). This required children to convert their
protoquantitative judgements to numerical judgements.
1.2.2.5 How measurement procedures as 'tools of thought' may affect judgements
of quantity: Miller's (1989) study
In his work on measurement with 3 to 10-year-olds, Miller (1989) considered the
relationship between the use of certain measurement procedures and ability to conserve
quantity. He hypothesised that such procedures may be 'tools for thought', in the sense
that they may function as "schemes, organizing the domain over which they operate"
(p589). Miller hypothesised that children's reasoning about amounts and their
permissible transformations may be structured in terms of the measurement procedures
they use, and in terms of the attributes those procedures measure. His definition of
measurement as systematic use of some rule for comparing quantities (Stevens, 1975;
1946) permitted him to include counting among measurement procedures.
Miller's principal focus (1984, 1989) was Piaget's claim that a child must assemble all
qualitative logical prerequisites of measurement before successful quantitative
measurement can develop. Miller's counter-claim was that the learning of measurement
procedures can be the basis for later understanding of measurement principles.
He used invariance of a given amount of material as the focus of a series of
conservation studies in which the result of a measuring procedure appears to children
53

either to contradict, or not, invariance of the given amount. His predictions were that
where the experimenter transforms a fixed amount of material such that, when children
use an appropriate measuring procedure, they obtain a result that disagrees with their
pre-transformation judgement, children will tend to judge that the amount has changed.
Where the transformation does not produce a new result following the application of the
measuring procedure, children will tend to judge, correctly, that the amount has not
changed.
Substantiation of these differential predictions would provide evidence that it is the
measurement procedure that determines the way amount of material is represented in
thought, and hence the logic that children apply to the task. Procedures determine
principles, and not vice versa.
Number: children count a set of items. Two kinds of transformation are then made: a)
An item is cut in half. The number of items has thus increased, but amount of material
has not. The appropriate procedure (counting) suggests an increase in amount, so a child
is predicted to say (incorrectly) that amount has increased. b) Some items are squashed,
so that area has increased, but amount of material has not. The counting procedure
suggests no change, so the child's (correct) verdict would be no increase in amount.
Length: when the relevant procedure is the measurement of length, if changing length
also changes amount (e.g. adding extra material to make a strip of plasticine longer)
then children will make the correct judgement that amount has increased. If changing
length does not change amount (e.g. drawing out an existing strip of plasticine) then
children are predicted to say incorrectly that amount has increased.
Area: When the relevant procedure is the measurement of area, if both area and amount
are changed (adding material and also spreading out) then children will say amount has
changed. If changing area does not change amount (spreading or squashing without
adding material) then children will judge incorrectly that amount has increased.
The studies involved two toy turtles who had to be given an equal amount to eat. Their
food was clay pieces representing sweets (to involve counting) spaghetti (to involve
judging length) or fudge slabs (to involve judging area). Children were asked to make
judgements in each of the three domains of measurement before and after
transformation of the material in the different ways exemplified above.
Miller's predictions that there would be a higher proportion of non-conserving responses
where information from a relevant measurement procedure conflicted with actual
54

amount were broadly borne out in all age-groups.
This work provided evidence that young children have considerable ability to reason
about measurement, but that they frequently do not know how to interpret the outcome
of measurements they make. The 'tool' metaphor is elaborated in a socio-cultural
framework: if measurement is a 'tool of thought', it will have developed in response to
particular types of problems and thus exhibit 'functional fixedness' (Maier, 1931), that
is, the applicability of its principles in other settings may not be appreciated. Thus,
while some procedures may be available to children at an early age, such as judging
how far a stick will go into a hole, the extent to which children can make use of the
results of such a procedure will vary with the context. Miller's ingenious experiments
provided theoretical support for the idea that instruments and procedures involved in
measurement play a role in the development of underlying concepts. Equally interesting
is the suggestion that the role they play may mislead children. The present research
investigated whether differing measuring devices affected success in measuring length.
(Research Question 7: Do differences among measuring 'tools' affect ability to
measure?)
Miller's finding that counting may be a false cue to amount is particularly important in
understanding units of length. In the present research, Research Questions 5: How well
do children understand that a number may express length? and 9a): Do children
understand the inverse relation between size and number of units? followed up Miller's
finding.
1.2.2.6 Classroom development of 'tools of thought': an example
The idea of a 'tool of thought', where a practice and its characteristic tool enter into the
conceptual development of their users was worked out in detail in a project to develop
five-to-six-year-old pupils' understanding of measurement run by the National Council
for Teachers of Mathematics (NCTM) (Gravemeijer et al., 2003). The ruler or
numberline constituted the overarching tool; during a series of sessions, it underwent
various transformations or 'inscriptions', including footprint-units and other variously-
sized and numbered units, according to the outcomes of pupil discussions. The
conceptual insight of most interest arose from the notion of "measuring as an act of
structuring space" (Gravemeijer et al., 2003: 58) and that "the results of iterating [a
unit] signify an accumulation of distances". Here the Piagetian order is reversed:
measurement does not await a developed conception of space; rather it produces it. The
subdivisions on the ruler, as the embodiment of the iterated unit, now reflect
55

accumulated changes of position; physically constructed in the classroom, they may no
longer represent a paradox. Difficulties commonly associated with them are, however,
considered next.
1.2.3 Numerical components of measurement: units
In this section, studies of children's understanding of standard and non-standard units
are reviewed. Piaget noted the difficulty children may face in the idea that a given
length can be both one and many: that it can be subdivided yet retain its continuity
(Piaget & Inhelder, 1956). Others have suggested that re-organisation of a whole
conceptual field is required here. Subdivisions of a length in relation to the whole
constitute ratios, expressed as a fractional number, and difficulties with units in
measurement have been seen as one example of a general difficulty in moving from
whole numbers to fractions (Brown et al., 1995).
While the concept of ratio can remain implicit when using non-standard units or reading off labeled units on scales, in order to operate with many subdivisions on scales, ...an explicit grasp of ratio... [is] required. (Brown et al., 1995: 158-9)
The inverse relation between size and number of units in measurement both of extensive
and intensive quantities is a case of special importance (Howe, Nunes, Bryant, Bell, &
Desli, 2010). An idea that makes a strong showing in the literature on rational number is
that opportunities for children to access what would be seen by adults as a single
principle differ sharply according to context; teaching of principles needs to be carefully
tailored in the light of this research, of which a selection is now reviewed.
1.2.3.1 Partitioning and unitising
Lamon's (1996; 1994) concept of 'unitising' suggests one way in which the transition
from whole to rational numbers may be facilitated for children. Partitioning and
`unitising' (the use or creation of units) are inverse operations underlying rational
number. Both are part of everyday experience: partitioning is about sharing amounts;
unitising is about unifying them.
`Unitising' as a general strategy for the cognitive handling of quantities provides
evidence of competent proportional reasoning in everyday life. Typically, reasoners
choose their own units, which may be suggested by the social setting. Lamon's example
is of canned drinks, where a single can, a six-pack or a whole case may be the unit
selected.
56

`Unitising' empowers the reasoner to consider simultaneously a single aggregate and the
items that make it up - for example a six-pack and the six cans of drink it contains. It
provides a cognitive solution to the difficulty identified by Piaget of preserving the idea
of continuity, while understanding that this can be represented as a series of discrete
units. In Lamon's study, 9 to 12-year-olds partitioned food into fair shares. Some tasks
presented countable items in composite units, like packs of drinks cartons, or chocolate
bars marked in sections, while others presented whole units, such as pizzas, where
children would be asked, for example, to share four pizzas between three people.
Lamon identified three unitising strategies: the preserved pieces strategy, the mark all
strategy and the distribution strategy. In the preserved pieces strategy, three pizzas were
left intact (three pizza-units) for distribution to the three recipients, while the last pizza
was divided into three equal pieces (three one-third-pizza units) for distribution. In the
mark all strategy, each pizza was marked into one-third-pizza units, but only one would
be cut for distribution, the others being distributed as marked whole pizzas. In the
distribution strategy, each pizza was both marked and cut in pieces for distribution.
Economy of division varied: for sharing among three people, a pizza might be divided
into six pieces; or it might be marked into six and then cut only into three. Lamon found
an increase in economy according to age-group. However in the case of cans, or of a
pack of chewing gum, all the items were drawn inside the pack. Lamon suggests that
these were not yet conceptually single composite items seen as one unit.
Firm interpretation of such findings can be difficult, as shown by Goswami's (1995)
study of 3 and 4-year-olds. Here children had three sizes of cup and the experimenter
had corresponding pictured proportions of a whole object: of a pizza, shown in the pizza
tin, of proportions of a drink, shown in the glass, and of different numbers of
chocolates, shown in a box with spaces for eight. The children had to match the
appropriate pictured food or drink proportion, to the cup of the same relative size in
their own array. Almost all the 4-year-olds and over half the 3-year-olds told correctly
which pictured proportion corresponded to which size cup, and so were apparently able
to order the different pictured proportions of food or drink mentally. Goswami suggests,
however, that children may have ignored, or not noticed, the fact that each proportion
was part of a visible whole and considered the pictured proportions as 'honorary
wholes'.
Lamon's studies suggest that children find it easy to decompose quantities into units, but
only gradually learn to compose smaller units into larger ones. There is also a gradual
57

progression from an emphasis on number and counting (mark all and distributive
strategies) to conceptualisation of a continuous quantity that is also made up of units
(preserved pieces strategy). The difference between the mark all and distributive
strategies is particularly interesting. It suggests that children may need the reassurance
of visual subdivision, but that they also understand, in a situation where an item really
needs to be split and distributed, that visual subdivisions can be grouped into larger
units.
The notion of 'unitising' is illuminating, and constitutes a novel approach to the
paradox of 'continuity and subdivision' identified by Piaget & Inhelder (1956). It does
not dissolve the paradox, however. In the present work, several research questions
pursued this paradox and its instantiations. These are, Research Question 8: Is there
evidence that children conceptualise in different ways, units that are physically separate
and units that form a scale? Research Questions 9a): Do children understand the
inverse relation between size and number of units? and 9b): Do children understand
that larger units may 'contain' smaller ones? and Research Question 10: How well do
children cope with fractional units?
Petitto's investigation of children's understanding of the way in which numbers
represent length on a ruler, and of the equal interval principle, are considered next.
1.2.3.2 Petitto's numberline estimation study
Petitto (1990) investigated the relationship, in six to eight-year-olds, between counting,
use of a ruler, and spatial concepts. She noted that while young children count
proficiently on a numberline, they do not appear to understand the proportional
properties that guarantee equality of its units, or that units represent lengths. Two
studies explored development in understanding of a numberline during the first three
years in school, and involved counting and arithmetic, length conservation, and
understanding of equal intervals.
In the first study, children were scored as conservers or nonconservers of length on a
standard Piagetian task, then proceeded to a numberline estimation task. Six lines were
marked only at their endpoints, three being marked 0 and 10, and three 0 and 100. An
arrow indicated an (unmarked) point at a different position on each line. Told that the
numberline was like a ruler with marks omitted, the children had to supply the number
to which the arrow would point if all the lines were marked in.
58

Petitto hypothesised a sequence to proportion shift in understanding a ruler: that
numbers would be seen first as a sequence of points, and later as representing equal
distances (construed as understanding proportionality). Her second and third hypotheses
offered opposing mechanisms for any such shift. The component skills hypothesis
proposed that acquisition of relevant counting and arithmetic skills contributes directly
to use of the types of strategy that facilitate proportional understanding. If appearance of
such strategies closely followed the teaching of counting and arithmetic skills, the
component skills hypothesis would be supported. A conceptual differentiation
hypothesis proposed that only after length conservation had been achieved would
children use relevant numerical strategies learned in school. To conserve length is to
differentiate length from position, Petitto argued, so conservers would be more likely to
see numbers on a numberline as indicating a series of lengths than a sequence of
positions.
Petitto used children's accuracy in estimating target values on the numberline as a
measure of their use of a specific type of strategy. If children were using purely
sequential strategies, their estimates should deviate progressively more from the target
as its distance from an endpoint increased, and deviation should be greatest near the
midpoint of the line. If the sole endpoint used by a child is 0, then deviations from the
target should be greatest near the upper end of the line. The component skills hypothesis
would be supported, Petitto argued, if younger children, being more familiar with
smaller than larger numbers, showed higher levels of deviation from a target score in
the higher ranges, because this would be evidence that their counting and arithmetical
skills with small numbers affected their accuracy. She argued that the conceptual
change hypothesis would be supported by a sudden rather than gradual change in
accuracy that did not differ between large and small values, and was positively
correlated with conservation of length.
In the first study, experimental groups reflected major relevant topic changes in the
school curriculum as well as age differences relevant to cognitive developmental
changes. Among the skills taught during the three years of the study were counting by
ls, 10s and 5s, estimation prior to counting and measuring, and construction and use of
rulers by iterating a unit. All three were considered relevant to strategies the children
might use during the tasks in the study.
Overall, there was wider variation in accuracy when the target was near the mid-point
(compared with variation near end-points) for the two younger than for the two older
59

groups; this was claimed as evidence of a sequence-to-proportion shift. In the 0-100
numberlines, this shift was also supported by the fact that levels of deviation for the
midrange and highest targets were lowest for the oldest group. However, over- or under-
estimation in the scores with the 0-10 numberline, did not support any of the study's
hypotheses. There was no evidence of an effect of conservation on scores, and hence
none for the conceptual differentiation hypothesis.
Abrupt change in the deviation scores had been proposed as evidence for the conceptual
differentiation hypothesis. All significant differences in scores were, however, between
groups with at least 12 months schooling separating them. Although strategy use did
improve with age, and although children did progress from sequential to proportional
reasoning, Petitto concluded that the findings were best accounted for by the component
skills hypothesis, and that there is a 'gradualist' picture in which change follows school
instruction, particularly in the application of arithmetic and counting skills.
In these ambitious experiments, Petitto rigorously pursued the relationship between
counting and the development of proportional reasoning in relation to length, required
for successful measurement with a ruler. However, the variables she included made her
specific hypotheses rather difficult to test. The present research asked more simply:
How well do children understand that a number may express length? (Research
question 5) and tested this in measurement tasks by comparing qualitative judgements
of the length of lines with judgements of the same lines expressed as numbers of units.
1.2.3.3 Equality of standard units: testing understanding of equal intervals
To function as a measuring instrument, a ruler must be divided into equal intervals.
Petitto argued that this may be recognised as a convention, or may instead reflect
principled understanding. She hypothesised, as before, that aspects of school instruction
may indirectly affect principled understanding of units. For example, early school
experience of measuring by iteration of a unit may encourage a view of measuring as a
series of 'steps', and may fail to give children a sense of measuring a whole length as a
single entity, while later work on fractions, with the notion of wholes divided into equal
parts, may support them in understanding the role of subdivision in measurement. As
before, she hypothesised that length conservation was a pre-requisite for any
instructional effects on understanding of units.
The second study provided two tests of conventional aspects of equal intervals: the
ability to recognize an equal interval ruler among rulers of unequal intervals, and
recognition of the former as appropriate for a measuring task. It also provided a test of
60

principled understanding by presenting a task where it would be convenient to abandon
the equal interval ruler, to see whether there was resistance to doing this. The children
were presented with two sets of five rulers (half with a range of 0-10 units; half with a
range of 0-20) that were of equal intervals; of increasing or decreasing intervals; of
alternating intervals (where each was half or double the width of its predecessor); and of
irregular intervals. Each interval was numbered. Children were asked to identify from a
simple description of the interval configuration, which ruler the researcher had in mind,
and then to choose which ruler would be best for measuring. All either chose the equal
interval ruler or said that any would be equally good.
There was no significant effect of age-group or of conservation status on choices of the
equal interval ruler as best. A child was credited with understanding the equal interval
principle if the equal interval ruler was preferred consistently. All children who satisfied
this criterion were conservers. The author concluded that awareness that conventional
rulers have equal intervals, and conservation of length are both necessary conditions for
understanding the equal interval principle. However, since over half the children in her
sample with these two accomplishments did not use the equal interval ruler consistently,
they were not sufficient conditions. These studies suggest there may be a complex
interaction between various school activities in mathematics and conceptual change in
learning to measure, but they also illustrate the difficulty of tracking any influence such
activities may have.
Nunes and Bryant (1996) tested whether 5 and 6-year-olds knew that standard units
must be equal. A pictured ruler was marked similarly to those the children had in their
classroom, but without numbers. The children were asked to write in the numbers. The
experimenters observed whether children a) left equal spaces between their numbers; b)
consistently left blank spaces between numbers (showing that they understood
subdivision); and c) either started with 0, or left a blank space before 1 (showing that
they understood that the spaces on the ruler were the units).
Of ninety-two children without task-related motor problems, 40% did not write their
numbers in one-to-one correspondence with units. Half the children labelled only the
cm marks, thereby acknowledging subdivision. The others labelled both cm and half cm
marks (incidentally demonstrating that the children were not simply relying on their
memory of rulers in the classroom, on which half-cms were not numbered.) Eighty-nine
per cent wrote their 1 opposite the first line on the ruler and did not allow for 0,
indicating that they did not, after all, understand how the ruler represented units. Of a
61
sample of children interviewed about why they had placed their numbers where they
did, only one had allowed for 0. He had done this by writing numbers in the centimetre
gaps as he explained. The other children did not appear to understand the question,
making responses such as because that's where the numbers go or simply checking that
their number sequence was correct. The latter response seemed to indicate that children
understood the task as just another way of implementing a counting procedure.
In a second task, children were asked whether rulers drawn in various ways were
correctly drawn. Two rulers did not have equal intervals. Roughly the same number of
children recognised these rulers as incorrect as had written their numbers at equal
intervals on the pictured ruler in the first task. Four equal interval rulers were shown,
two with imperial and two with metric markings. One 'metric' and one 'imperial' ruler
started from 1, and the others from 0. About three-quarters of the children identified the
metric rulers as correctly drawn, whereas less than half thought the rulers showing
inches were correct, indicating a judgement on the basis of classroom familiarity with
centimetre rulers rather than on the principled basis of equality of intervals. Children's
understanding of the relationship between the size and number of units in general, of the
way units are represented on rulers, and of the equality of units within a single scale
were all investigated here.
The difficulties revealed, and those revealed in Petitto's second study, concerned
understanding the intervals marked on a ruler. These were examined in a different, and
in a sense, more direct manner in the present research. Here, children's measuring
behaviour was observed for indications of strategies they may have been adopting
(Research question: 6. How well do children measure?) and they were questioned about
scales they were shown on everyday measuring devices. (Research Question 9a): Do
children understand the inverse relation between size and number of units? and
Research Question 10: How well do they cope with fractional units?)
1.2.3.4 Conversion of units
Nunes and Bryant (1996) went on to investigate children's understanding of
relationships between units of different sizes. They noted particular difficulty in
converting one unit value to another. This required understanding that smaller units may
be 'contained' within larger ones and was the principle Lamon (1996) considered might
be established by 'unitising'. They described a study (Davydov, 1982) in which
children, shown two sizes of glass, were told that two small glasses held the same
amount as one large one. Asked how many large glassfuls of liquid there would be in a
62

collection of large and small glasses, the children responded with the total number of
glasses. Nunes and Bryant noted that no numerical operations were required here: if a
child understood units and was presented with two pieces of ribbon each 8 units long,
but one measured in larger units than the other, they should judge that the ribbon
measured in larger units is the longer ribbon even if unable to quantify the relationship
between the units. This would be a relative and protoquantitative judgement. (The more
difficult absolute judgement would involve finding a numerical value for the difference
in length of the two ribbons, and this would necessitate expressing one of the units used
in terms of the other). The hypothesis that children would know which was the longer of
such a pair of ribbons without being able to quantify the difference was tested with five
to seven-year-olds. Pairs of ribbons of similar colour but different lengths were assigned
one ribbon to the experimenter, and the other to the child. Children were first
familiarised with centimetres on a ruler. In the first block of trials children were given
information about each pair of ribbons (the experimenter's and their own) entirely in
centimetres. The information was sometimes of an absolute character (for example I
measured my ribbon and it was 6 cm long. Yours was 4 cm long) and sometimes a
mixture of absolute and relative information (My ribbon is 6 cm long and yours is
longer than 7 cm.), as children might later need both.
In the second block, the experimenter's ribbons were measured in cm and the child's in
inches. The children were first familiarised with the difference between cm and inches
and with the fact that 5 cm was equal to about 2 inches. All information given was now
absolute, but relative judgements would be made if children attempted to compare
different units. In both blocks the children were asked: Are the ribbons the same length,
or is one longer than the other? Feedback was provided by measuring the ribbons
against each other after the test.
In the test where only cm were used, there was no difference in performance between
the absolute and the absolute + relative conditions. Mean correct responses increased
with age and quickly reached a ceiling. There were more mistakes in both age-groups
where both cm and inches were used, but even the 5-year-olds performed better than
chance, indicating, Nunes and Bryant argued, some sensitivity to size of units. A
comparison was made between trials where the number of units was the same but the
size was different, and trials where both number and size were different. In the first case
children had only to reason that the larger units indicated the longer ribbon, but in the
second units had to be somehow converted for a judgement to be made. Performance
63

improved with age for both conditions, but for 5-year-olds was above chance only when
the same units were used, and in the condition with different units, even 7-year-olds did
not get maximum correct responses.
Nunes and Bryant concluded that children can manage simple relational reasoning (the
larger the unit, the greater the length) when the number of units is the same, but find
difficulty in converting units, even when this had been demonstrated, and visual
reminders given. They concluded that despite children's familiarity with rulers, the way
in which these represented units was not understood; that when, for example, children
read a ruler and said five centimetres they were merely applying a procedure whose
underlying logic they did not understand.
The present research pursued the question of conversion of units in an everyday context.
Children saw common measuring devices on which, side by side, scales showed
different units, and were asked to comment on the relationship between them. It also
tested generality of understanding by including devices that measured weight and
capacity as well as length. (Research Question 5: How well do children understand that
a number may express length? and Research Question 9b): Do children understand that
larger units may 'contain' smaller ones?)
Nunes, Light & Mason (1993), considered next, investigated the influence of familiar
versus unfamiliar measuring instruments and techniques on understanding of units.
1.2.3.5 Conventional versus non-conventional measuring instruments
Nunes et al. (1993) argued that children's measuring performance is influenced both by
their understanding of the principles of measurement and (like Miller, 1989) by the type
of representation of quantity embodied in measuring tools. They predicted age-related
developmental differences, and also differences between children according to different
measuring instruments used.
Paired six to eight-year-olds in three groups were asked to compare the lengths of two
lines. One group was given a conventional ruler marked with centimetres and fractions
of centimetres; the second group, a broken ruler that began at the 4 cm mark, and the
third, a length of string. The objective was to determine whether use of the conventional
`tool' would result in better performance than that achieved with the string. The
measurement principle of iteration of units is 'ready-made' in a ruler, while the string
had to be used in makeshift fashion as an iterated unit and was intended to assess
understanding of the principle. The purpose of the broken ruler was to test
64
understanding that the numbers on the ruler indeed signified iterated units: if this was
so, then the number four would not be taken as representing four units.
Results showed no significant age effects. Children using the ruler did significantly
better than those using the string; there were no significant differences between either of
these conditions and the broken ruler condition. All the children in the ruler condition
gave numerical responses, 84% of them correct. Sixty-three percent of the responses in
the broken ruler condition were correct, despite the greater rigour required in achieving
success. In the string condition, only 28% of the responses exemplified rigorous
procedures, either of iteration (the string being moved along when shorter than the line)
or folding (when longer). The results were claimed as clear evidence that use of a
conventional measuring tool aids measurement.
Eight and ten-year-olds participated in a similar study comparing two irregular areas of
wall. Here the conventional measuring 'tool' was not a physical instrument, but the
length x width algorithm. Conventional rulers and glued strips of ten 1 cm bricks were
provided to help. The make-shift element consisted of a collection of single bricks,
abundant for one group; for the other, less than needed to cover the area to be measured.
There were no overall differences in the proportion of correct responses in relation to
age or condition, but older children made better use of 'intellectual' strategies, that is,
versions of the width x height algorithm using the bricks. Children frequently shifted to
use of bricks from initial unsuccessful use of the ruler; many used bricks straight away
in the second trial.
Overall, results showed that the tool that directly measured amount of surface (the
bricks) was favoured over the more conventional but more complicated tool (the
algorithm) and its aids. Some children who used bricks did incorporate aspects of the
multiplicative algorithm, such as counting rows rather than single bricks. Some with
insufficient bricks, however, still 'counted', using a mixture of real and imaginary
bricks. The study shows that the influence of cultural familiarity is complex and not
always facilitative, and that its explanatory power may be limited. Nunes & Bryant
suggested, more simply, that having a practical solution to hand may discourage
intellectual performance.
The present research required children to use both conventional and non-conventional
devices for estimation and measurement, to see whether success varied according to
these features. (Research Question 7: Do differences among measuring 'tools' affect
ability to measure?).
65

1.2.3.6 Cultural tools
Underlying the work of Petitto and explicit in that of Nunes and colleagues is the notion
that conceptual knowledge is embodied in 'cultural tools' such as the ruler, and that
familiarity with such tools and their conventional uses can support acquisition of that
conceptual knowledge: mastering the procedure helps construct the principle. Their
work demonstrates, however, the limitations of this affordance. Success depends not
just on familiarity with the conventional tool, but on the practical skill required for its
deployment relative to less familiar but easier methods (Nunes et al., 1993). Miller
(1989) argued that the very specificity of the context that facilitates success with such
tools may hinder generalisation of any principles learned.
To understand the relationships that exist between units in measurement, understanding
of ratio is required. The topic of ratio reasoning is next considered.
1.2.3.7 Ratio
The ratio relationships that exist between units in measurement, among other topics
involving the shift from whole to rational numbers, can create considerable difficulties
for school students in the middle years (Behr, Harel, Post & Lesh, 1992). The inverse
relation between size and number of units is a special case of the ratio reasoning
involved. Reasoning about intensive quantities is another (Howe, Nunes, Bryant, Bell,
& Desli, 2010). Recent research has investigated contexts in which children of five
years upwards can employ ratio reasoning in advance of teaching about fractions, and
conditions for their success (Nunes & Bryant, 2009). One finding is that social 'sharing'
situations provide an early, reliable model for certain kinds of fractions: although
dividing a smaller by a larger number in general presents difficulties, young children
readily understand that one or more cakes can be fairly shared between a larger number
of children (Nunes, 2008). Another finding is that an external ratio, which holds
between different 'measure spaces' (Resnick & Singer, 1993) seems easier to represent
mentally than an internal ratio. Dividing one cake fairly between several children is
understood because children can use correspondences between the parts of two wholes
(the cake and the group of children). Partitioning e.g. subdividing a unit of length (same
`measure space') is more difficult, seemingly because only one whole is involved
(Nunes, 2008). Understanding the iteration of a unit as "accumulation of distances"
(Gravemeijer et al., 2003: 58) is thus only one side of the coin; the paradox of units as a
series of nested intervals (Piaget et al., 1960) remains difficult to grasp.
66

In the present research, Research Question 9a): Do children understand that larger units
may 'contain' smaller ones? and Research Question 10: How well do children cope with
fractional units? pursued the issue of partitioning.
The inverse relation in the concept of division
Correa, Nunes & Bryant (1998) explored the understanding of five to seven-year-olds of
the principle that the more parts into which a whole is divided, the greater the number of
parts. The tasks did not require the manipulation of numbers.
The first experiment involved partitive division. The two divisors were sets of blue and
pink toy rabbits. Dividends were sets of 12 or 24 plastic 'sweets'. A same-divisor
condition presented equal sets of blue and pink rabbits, while in a different-divisor
condition the sets were unequal. Children knew that within each set of rabbits, sweets
were distributed equally; however the total allocated to each rabbit was hidden. The
experimenter then pointed to a pink rabbit and asked whether it had more, less, or as
many sweets as one of the blue rabbits, and asked children to justify their answers. In
the different-divisor condition, two types of error were possible: that a rabbit received
the same number of sweets irrespective of group; or that a rabbit in the larger group
received more sweets. One-third of 5-year-olds, half the 6-year-olds and 90% of 7-year-
olds justified responses by appeal to the inverse relation ('more rabbits, so fewer sweets
each'). The minority 'more is more' justification ('more rabbits, so more sweets each')
did not decrease over the age-span, indicating for these children a persistent bias
towards addition.
The second experiment involved quotative division. Here the number of rabbits in each
group was unknown, but was determined by the number of equal allocations of sweets
that could be made from a fixed collection: if each rabbit is to have four sweets, and
there are 12 sweets in all, only three rabbits can have sweets. Again there were 'same
divisor' and 'different divisor' conditions; the 'different divisor' condition proved harder,
and there was improvement with age. In the 'different divisor' trials, less than one-fifth
of responses from 5-year-olds were justified in terms of the inverse relation (between
the number of sweets each rabbit could receive and the number receiving sweets), while
now nearly one-third were justified using the incorrect 'more is more' principle (the
larger the number of sweets each rabbit receives, the more rabbits can have sweets).
67
Limits of children's ratio reasoning
These studies showed, as the authors commented, a remarkable ability in a sizeable
proportion of a sample of young children to understand the inverse relation between
divisor and quotient independently of computation. The fact that others were probably
applying (incorrectly), also independently of computation, the 'more is more' principle
of addition, is also of interest. Correa and colleagues (1998) pointed out that the
procedure of 'sharing', familiar to children from a number of contexts, probably
facilitated understanding of partitive division. In the present research, Research
Question 9a): Do children understand the inverse relation between size and number of
units? investigated the inverse relation specifically in relation to scaled measuring
devices.
Kornilaki & Nunes (2005), however, pursuing the theme of the proposed facilitative
role for procedures, investigated partitive and quotative division of discrete versus
continuous quantities (fishes vs. portions of fish-cake for cats). There were differences
in correctness of reasoning according to age and type of division required, but not
according to discrete vs. continuous quantities. Since the 'sharing' procedure is known
to be more difficult for continuous quantities (e.g. Lamon, 1996), this was evidence that
principled understanding may be independent of procedures. Further evidence came
from the work of Howe, Nunes and Bryant (2010). In this study of reasoning about
intensive quantities, children's success increased with age, and was predicted by the
intellectual demands of a problem. In the study, the children were increasingly able to
take into account variables that were not especially salient in everyday experience and
language usage.
In an early study, Carpenter & Lewis (1976) argued, too, that measurement principles
may come to be understood not through measurement activities, but as a by-product of
general conceptual development. If so, they reasoned, there should be children who
understood that there was an inverse relation between unit size and number of units (this
being a compensatory relationship characteristic of all conservation), but failed to
understand that quantities could not be directly compared if measured in different units.
In tasks with six and seven-year-olds, a majority indeed said that more small boxes than
large would be needed to equal the lengths of lines. A similar finding with liquid
quantities enabled Carpenter and Lewis to claim a general developmental influence.
However, when discussing lines previously agreed to be of equal length, but each
measured with boxes of a different size, the same sample was confused about their
68

length, only 10% successfully compared lengths, and few mentioned both size and
number of units in their justifications. Hart's (2004) findings were very similar for
between one-third and two-thirds (decreasing with age) of 11 to 16-year-olds asked, in a
large national survey, about two paths measured respectively with paperclips and
walking sticks.
Overall, these studies give evidence of the ability of young children to apply
mathematical principles independently of their embodiment in number operations, and
hence of their ability to understand formal properties of specific tasks. They are
evidence, in fact, of the power and sophistication of protoquantitative reasoning.
However, despite some commonalities (Squire & Bryant, 2003), this ability seems
confined to specific types of task. Furthermore, while some argue that procedural
knowledge plays an important developmental role (Resnick & Singer, 1993; Karmiloff-
Smith, 1992) others argue for an independent conceptual route to understanding. Thus,
while children clearly have some insights to help them understand rational numbers
(Nunes, Bryant, Hurry & Pretzlik, 2006; Nunes, Bryant, Pretzlik, Bell, Evans & Wade,
2004) few broad generalisations can as yet be made. The present research contributed to
this knowledge specifically in relation to measurement. It did so by assessing children's
success in measuring tasks where it was necessary to take account of fractional units.
(Research Question 10: How well do children cope with fractional units?)
1.2.4 Procedural and conceptual knowledge
In the research reviewed above, the part played by routines and procedures in the
acquisition of conceptual knowledge is a persistent theme. Miller (1989) makes perhaps
the strongest claim for the priority of procedures: that they may determine mental
representation of quantity. Using child-generated procedures, Gravemeijer and
colleagues (2003) applied this idea in the classroom with some success. Procedures
enter Karmiloff-Smith's developmental model at Level 1, as the basis of all subsequent
conceptual change. The theoretical relationship between procedural and conceptual
knowledge in these authors is clearly-defined, and enables them to predict what
difficulties children are likely to encounter in developing conceptual understanding. In
other writers the relationship is less clearly-defined. Petitto (1990) concluded, on only
indirect evidence, that classroom practice in counting and arithmetical procedures was
69

the likely major contributor to improved conceptual understanding of proportion in
numberlines. Resnick & Singer (1993) considered that protoquantitative reasoning,
embedded in everyday language and routines for comparing quantities, was the basis for
increasingly abstract mathematical understanding, but did not discuss the nature and
possible difficulty of developments from the routines to the abstractions. Evidence that
everyday routines of sharing contribute to the understanding of units (Lamon, 1996) and
of the inverse relation in the concept of division (Correa et al., 1998) was naturally
available only for the highly specific contexts in which this was tested. There is also
evidence of conceptual development taking place independently of procedures
(Kornilaki & Nunes, 2005; Carpenter & Lewis, 1976).
With regard to conceptual competences, Rittle-Johnson & Siegler (1998) considered
two opposed accounts of those which appear early. The 'privileged domains' hypothesis
(Geary, 1995) proposed an evolutionary source for basic arithmetical concepts that
precede relevant social experience. The contrasting 'frequency of exposure' hypothesis
(Briars & Siegler, 1984) argued a procedural source in the early opportunities infants
have for observing and imitating procedures such as counting, and suggested that they
extract mathematical principles from such experience (although causal mechanisms are
not considered). More advanced mathematical competences are culturally specific and
must be explicitly, often laboriously, learned from instruction.
Some competencies relevant to measurement may usefully be considered in the light of
these hypotheses. For example, infants' early discrimination of ratio characteristics of
magnitudes (Feigenson et al., 2004) may facilitate ordinal comparison of length in early
childhood. Observation of, or participation in, measurement procedures in the home
may support the 'frequency of exposure' hypothesis, depending on the frequency of
such exposure and what is extracted from it. The framing of the present research
provided for consideration of these possible influences (Research Question 1 a): What do
children learn about measurement in their everyday social context, and lb): How might
this affect their conceptual understanding of measurement?).
Allied to procedures, and sometimes merging with them, is the proposed role of 'tools'
in the construction of knowledge and understanding of measurement (Gravemeijer et
al., 2003; Nunes et al., 1993; Miller 1989), because to learn the correct use of a tool is
70

to learn a procedure. The role of 'tools' in conceptual understanding is, however, a
narrower question than that of the role of procedures, and the distinction between
conceptual and procedural knowledge did not seem sufficiently clear-cut, despite its
prevalence in the literature, to structure the present research. In the context of
mathematical development, Rittle-Johnson & Siegler (1998:77) define conceptual
knowledge as "understanding the principles that govern a domain and of the
interrelations between pieces of knowledge in a domain" (whether or not that
knowledge is explicit). They define procedural knowledge as "action sequences for
solving problems". In the present research, measuring itself is clearly an action
sequence, but it cannot be undertaken without some conceptual understanding of how
units work in measurement. In one underpinning competence investigated
(understanding the everyday language of length) conceptual and socio-cognitive
understanding are intertwined. In another, (ordinal comparison of length) perceptual
skills are salient, and these are not well-described as an action sequence. The current
research therefore made use of the conceptual/procedural contrast only when this
seemed enlightening.
1.2.5 The present research
1.2.5.1 Key themes that provide the rationale
The developmental and educational literature reviewed was written from a variety of
perspectives, and the associated research undertaken for a variety of purposes. Persistent
themes can nevertheless be identified across this range of material that each suggest
some aspect of measurement or its conceptual underpinnings that are potential sources
of difficulty for children. These are described below and frame the present research.
Overall, evidence from the studies reviewed demonstrated the overriding influence on
research outcomes of the type of task employed. Increasing rigour and sensitivity of
design provided insights that were valuable, but increasingly various. Moreover
different insights were contributed by different samples of children.
The present research attempted to investigate children's understanding of measurement
in, so to say, a more unified way. It did this, firstly, by restricting itself to testing of
children's abilities in basic competencies underpinning measurement and in measuring
itself, using simple and robust tasks. Secondly, a single sample of children participated,
enabling some insight into how these competencies might be associated. (Research
71

Question 11: Are there associations among understanding the everyday language of
length, ability to make ordinal comparisons of length, and the ability to measure?)
Thirdly, the design, in which the same tasks were used with three school year-groups,
enabled year-group and age comparisons. (Research Question 12: Do age and length of
time in school make a difference to any of these abilities?) To help understand how
these competencies were acquired, the research also investigated the children's own
accounts of the home and school contexts in which they experienced measurement.
As Piaget saw, the competencies are interrelated. However, the first three aspects below
may be considered relatively independent themes, whereas those in later sections are
harder to separate.
Conservation of length
Logically, measurement presupposes the principle of conservation: the lengths of
objects cannot be compared, or measured with an instrument, if length may change
when position changes. In the literature, the criterion of understanding this principle has
generally been success in traditional Piagetian tasks, where children saw material
transformed before being asked to renew a previous judgement of length (see also
Petitto, 1990; Miller, 1989; Boulton-Lewis, 1987; Piaget, 1970; Piaget et al., 1960;
Braine, 1959). The term 'conservation' has also been applied more broadly in the
literature, where the context required judgement of invariance of length, whether or not
a transformation had been witnessed (e.g. Hart, 2004; Department of Education and
Science, 1981). Surveys appear to show that children even of secondary school age lack
some aspects of the ability to conserve length in this broader sense. For Petitto
(1990:58) success in a traditional Piagetian task constituted grounds for expecting "the
ability to conceptualise the distinction between position and length" (and hence how
units of length are represented) on a numberline. So the term 'conservation' has been
liberally interpreted, credited with a key role in the development of measurement, but
rarely (since Piaget) given a central focus. In the present research, children's ability to
conserve attributes of length across various transformations was thoroughly tested, and
was then compared with their measurement ability.
Absolute versus relative judgements
Ordinal comparisons of length are the logical foundation for measurement with units.
Except for judgements of 'same length', ordinal comparisons are relative judgements
and measurement with units absolute. The mathematical operations that Resnick (1992)
proposed as early-developing categories of protoquantitative reasoning are all relative in
72

character, and indeed there is evidence of discrimination of relative magnitudes in the
form of ratios in very early infancy (Feigenson et al., 2004). Bryant (1974) showed that
in some contexts young children did find relative judgements of size easier to make than
absolute judgements; for example they made more correct judgements of 'larger' or
`smaller' in respect of two items than correct judgements of 'same size'. If the ability to
make relative judgements is acquired early, it is important to identify any relationship
between this and the ability to make absolute judgements, because children as young as
5 years are expected to be taught to estimate in absolute terms (Primary Mathematics
Framework, Department for Children, Schools and Families, 2006: Year 1 Block D.
Assessment focus: Ma3, Measures) and because older children perform poorly in some
tasks that require absolute judgements involving units. Examples are numerical
estimation tasks using Duplo blocks (Brown et al., 1995) or mm (Department of
Education & Science, 1981) as units. What is needed is comparison of children's ability
to make ordinal comparisons of the length of objects (relative judgements) with their
ability to measure the same objects (absolute judgements). This was done in the present
research, where visual estimations and measurements of the length of the same lines
were made. Children also made relative judgements in tests of their understanding of
the everyday language and concepts of length.
The paradox of continuity and subdivision
Piaget and Inhelder (1956) suggested that the idea that a given length can be both
continuous and at the same time subdivided will cause conceptual difficulties for
children if they experience continuous length as different in kind from discrete units.
Gravemeijer et al., (2003) showed that encouraging children to assemble their own units
into a continuous length could overcome this difficulty. Petitto (1990) and Nunes &
Bryant (1996) provided evidence that children understood subdivisions on rulers in
some contexts. Lamon (1996) considered this 'one-or-many?' paradox as broader, and
that, developmentally, children may solve it by 'unitising', enabling them to
contemplate simultaneously a single unit and the sub-units that make it up.
Piaget also suggested, more concretely, (Piaget et al., 1960) that the nature of
measurement itself, i.e. physical iteration of a unit, is more evident when a single unit
can be physically moved along an object than when a continuous scale embodying the
same unit is used to measure the object; hence the use of a scaled instrument may prove
more difficult than the use of discrete units such as blocks. In contrast, Petitto (1990)
73

suggested that if children are taught at first to measure length by iteration of a unit, they
may cease to consider that they are measuring a single entity.
Here, an area of difficulty is identified without much convergence as to its nature. To
pursue the enquiry, the present research asked children, over a large number of trials, to
measure a continuous length with a ruler and tape measure (instruments embodying
continuous scales) and to measure the same length with wooden cubes (discrete units).
If different devices produced differences in performance, their character would be
described and possible causes considered.
Ratio and proportion
Nunes and Bryant (1996) identified the notion that larger units may contain smaller
ones as difficult for children. The surveys reviewed and the Primary Mathematics
Framework testify to educational concern that children should be able to convert from
one standard unit of measure to another. In the literature there is consensus that these
ideas require an understanding of ratio and proportion.
Despite evidence of receptivity to ratio information in infancy (Feigenson et al., 2004)
and of both early (Resnick & Singer, 1993) and later (Correa et al., 1998) ratio
reasoning in limited contexts, the ability to handle ratio and proportion in school
mathematics is generally considered a major hurdle of middle childhood (Behr et al.,
1992) of which surveys give evidence (Hiebert, 1981). Reluctance to convert units, and
other difficulties involving the idea that larger units contain smaller ones, as well as the
tendency to count numbered points on a ruler rather than spaces (Petitto, 1990),
probably reflect the failures in proportional reasoning that also underlie difficulties with
fractions (Brown et al., 1995) and intensive quantities (Howe, Nunes, Bryant, Bell, &
Desli, 2010).
The inverse relation between size and number of units is a special case of proportional
reasoning that underlies all measuring with units and is of fundamental importance, but
there are persistent reports of difficulties (Howe, Nunes, Bryant, Bell, & Desli, 2010);
Nunes and Bryant, 1996; Carpenter and Lewis, 1976). In the National Assessment of
Educational Progress Fourth Assessment (1988), no less than 50% of the 12-year-olds
surveyed had difficulties in one task. In the present research, understanding of this
inverse relation was explored in a realistic context as children commented on the scales
shown on various measuring instruments.
74

Mapping number on to quantity
Quantitative measurement involves the application of number to amount. As abilities to
be "assess[ed] for learning" in measurement, the Primary Mathematics Framework has a
mixture of counting skills and qualitative comparisons, with no suggestion that the two
processes may not be entirely congruent for children. I can use counting to solve
problems involving measures as a "children's learning outcome" encapsulates this
apparent lack of awareness. (Department for Children, Schools and Families, 2006:
Year 1, Block D, Ma3, Measures). While some authors (Resnick and Singer, 1993;
Petitto, 1990) expected development from qualitative comparisons of amount to the use
of units of measure through application of counting skills, others have disputed this
account. Lamon (1996) found a gradual development from over-dependence on number
and counting to conceptualisation of a continuous quantity (that is, development in the
opposite direction) while Miller (1989) showed that when number is not a valid cue to
amount, children's early facility with number and counting will simply lead them
astray. Nunes and Bryant (1996) found that children's labelling of a pictured
unnumbered ruler did not necessarily show understanding of units, but often resembled
a counting procedure. Carpenter and Lewis (1976) and Hart (2004) found children
judging greater quantity on the basis of greater number, rather than greater size of units.
The present research followed up these somewhat disparate findings with an
investigation of children's abilities to integrate qualitative and quantitative judgements
of amount. Number was introduced (see Chapter 5) into a study of visual estimation by
asking children to make comparisons of ordinal length with a given number of visible
units. Later (and conversely), after measuring in units (see Chapter 6) they were asked
to compare their numerical measurement with a given length in ordinal terms (i.e.
shorter, longer, or same).
A different type of problem in numerical measurement is to do with its approximate
nature, and with fractional units. In the present research, children were presented with a
number of lines to measure that included fractional units, so as to see how they dealt
with this situation.
Tools, procedures and principles
A diverse literature variously argues the degree and type of influence of procedural
competence on conceptual understanding (Kornilaki & Nunes, 2005; Rittle-Johnson &
Siegler, 1998; Karmiloff-Smith, 1992; Resnick, 1992). Allied to procedures, and
sometimes merging with them, is the proposed role of 'tools' in the construction of
75

knowledge and understanding of measurement (Gravemeijer et al., 2003; Nunes et al.,
1993; Miller, 1989). The cultural specificity of tools is also an important theme. In the
present study, children were asked to comment on and to use a range of everyday
measuring devices as a means of exploring their measurement skill, knowledge and
understanding. The complicated way in which these tools represented units was left
intact, to see how children dealt with these culturally specific features.
Influence of social context
While the literature reviewed frequently asserts the socially situated nature of children's
measurement ability, it rarely offers any social contextualisation for the research
reported. Without some knowledge of the social context, however, it is very difficult to
tell what factors might influence development of measurement. The present research
sought that understanding by using information from the children themselves about their
measurement experiences at home and in school as context for the research and to
inform interpretation of the results.
1.2.5.2 Overview of the research
The themes discussed above were incorporated into four investigations with primary
school participants. First, their experience and general knowledge of measurement were
explored through interviews. Second, their understanding of the language and concepts
of comparative length was investigated, then their ability to make visual comparisons of
ordinal length, and finally their measurement ability. Associations among performance
in language, visual comparison, and measurement tasks were then explored.
In the interviews, the children's language use was unrestricted. It was, however, highly
constrained in the rest of the research by the design of the tasks, and specifically the
form of the experimenter's questions and the verbal responses they invited. The
advantages of a more expansive design were considered, (particularly Piaget's
exploratory style of questioning and his invitation to justify responses) but it was
decided that these were outweighed by the increased difficulty of interpreting data
obtained in this way. The similarity across tasks of the language used, and invited, also
facilitated comparison of the outcomes.
1.2.5.3 Research questions
The research questions were introduced in the literature review, where they addressed
issues (brought together in the key themes above) that required further investigation.
They are as follows:
76

In relation to the sample studied:
1. a) What do children learn about measurement in their everyday social context,
and b) how might this affect their conceptual understanding of measurement?
2. Does the everyday language of length present any difficulties to children?
3. a) In the context of everyday length comparisons, do children conserve length? b) If not, does this make any difference to their measurement ability?
4. How well do children make ordinal comparisons of length?
5. How well do children understand that a number may express length?
6. How well do they measure?
7. Do differences among measuring 'tools' affect ability to measure?
8. Is there evidence that children conceptualise in different ways, units that are
physically separate and units that form a scale?
9. a) Do children understand the inverse relation between size and number of units?
b) Do they understand that larger units may 'contain' smaller ones?
10. How well do they cope with fractional units?
11. Are there associations among understanding the everyday language of length,
ability to make ordinal comparisons of length, and the ability to measure?
12. Do age and length of time in school make a difference to any of these abilities?
77

Chapter 2
General method
For convenience, general aspects of the method are set out here. Aspects relating to
specific phases of the research are described in the relevant chapters.
2.1 Sampling rationale
Five to eight-year-olds in three successive primary school years were selected for the
research. This age-span had a Piagetian basis as the period during which concepts
underlying measurement could be expected to mature (Piaget et al., 1960). Concurrently
children received instruction about measurement in accordance with the National
Curriculum, so that on both counts age-related improvements in measurement might be
expected. The research was based on successive waves of data collection from the same
sample of children. This had the advantage of enabling examination of the relationship
between different aspects of their performance.
2.2 Design
The research consisted of two interviews and three sets of tasks. All children were seen
individually and all experienced each interview and task.
2.3 Participants
The participants were eighty-three children attending a non-denominational London
state primary school. Families were mainly of British White and African-Caribbean
heritage and of mainly low socio-economic status as indicated by the eligibility for free
school meals, which was 65% of the total on roll. The participants consisted of three
complete school classes in successive year-groups as follows.
Table 2.01 Age and gender of the participants
Year 1 Year 2 Year 31
Mean (SD) age (years) at first interview
5.66 (0.31) 7.22 (0.25) 8.37 (0.33)
Range 5.18 to 6.19 6.80 to 7.59 7.96 to 9.09
Boys 14 8 15
Girls 15 17 14
N 29 25 29
Note 1. Please refer to Pattern and organization of sessions below
78

As Table 2.01 shows, there were more than twice as many girls as boys among Year 2
children. This imbalance in Year 2 had the potential to create a confound between age
and gender where there turned out to be gender differences, and made it especially
important to check these. Gender differences were tested throughout the research, and
results reported in the appropriate Results sections.
There were fewer participants in some aspects of the research than others, because
children had left the school during the period of the research or were otherwise
unavailable. No newcomers were added to the sample. The number of participants in
each part of the research is set out in Table 2.02
Table 2.02 Phases of the research with number of children participating in each phase,
according to year-group and gender
Phases (1 - 5) Year 1 Year 2 Year 3 Boys Girls N Boys Girls N Boys Girls N
1. 1st interview 12 12 24 8 17 25 14 12 26 2. Language tasks 12 12 24 6 15 21 14 13 27 3. Estimation tasks 12 13 25 7 16 23 15 13 28 4. Measurement tasks 12 13 25 7 16 23 15 13 28 4. 2nd interview 12 14 26 6 15 21 14 12 26
2.4 Materials
Interviews
The first interview, which sought information about children's general knowledge and
experience of measurement, employed an audio-recorder. The second interview, also
audio-recorded, was structured around six scaled measuring devices in everyday use
which children were shown and allowed to handle as they commented on various
aspects of the devices. In the text, transcribed verbatim utterances are usually italicised.
Tasks
Tasks that investigated children's understanding of the language and concepts of
measurement employed small plastic or metal toys and various items depicted on A4
cards. Tasks that examined their visual estimation and measurement abilities used A4
cards showing lines of various lengths. Various conventional and informal measuring
devices were also used.
79
Full details of all materials are located in the sections that report the interviews and
tasks. Appendix 1 shows examples of the materials.
2.5 Procedure
Setting
Children were seen individually in the school library, a quiet room relatively free of
interruptions. For all sessions, the child and researcher sat facing each other about 90
cm apart at a circular table. Table and chairs were child-height.
Pattern and organization of sessions
The order of the two interviews and the three series of tasks was the same for each
child. The first interview introduced children to the topic of measurement. Next came
the series of tasks that investigated their understanding of everyday language and
concepts of measurement. These could be accomplished fairly rapidly, and involved
equipment that the children could be expected to find entertaining. The estimation and
measurement tasks were generally more demanding. They required more time, care, and
accurate physical manipulation of equipment by the children, and were scheduled next.
It was considered that by this time, the topic of measurement would be engrossing the
children and would support their persistence in these tasks. The second interview came
last. It probed children's understanding of measurement more closely than the first, and
specifically of measuring instruments and the units they showed, continuing but
broadening the focus on instruments and their scales begun in the measurement tasks. In
concluding the research, the second interview had the added benefit of re-affirming to
the children the importance of their own knowledge and opinion.
The research took place during the Summer term of one school academic year, and the
Autumn and Spring terms of the next. Since it was not possible to arrange for the
Summer holiday to occur at the same point in the research schedule for all three classes,
careful thought was given as to how this break could best be managed. Since the break
was likely to have less effect on the older children, the following schedule was
implemented. Year 3 children participated in the first interview and carried out the tasks
on the language of measurement in the Summer term of one academic year. They
undertook the estimation and measurement tasks and participated in the second
interview in the Autumn term of the succeeding year, when, it should be noted, they
entered Year 4. They are referred to as 'Year 3 children' throughout for the sake of
80

simplicity. Year 2 children accomplished the entire sequence of work in the Summer
term. Year 1 children completed the entire sequence in the Autumn and Spring terms.
Table 2.03 Phases of the research, number of responses required, number of sessions,
and allocated time per session. All year-groups were similar.
Phases (1 - 5)
1. First
interview
2. Language
tasks
3. Estimation
tasks
4. Measurement
tasks
5. Second
interview Responses required
7 questions
75 responses
105 estimates
27 measurements
8 questions
Allocated sessions and time (minutes)
1 session (35 min)
1 session (15 min)
1 session (30 min)
1 to 2 sessions (40 min)
1 session (35 min)
General characteristics of the tasks and interviews
Table 2.03 presents an overview of the type and amount of work, and of the time taken,
by the programme of research. It shows the five phases of the research, the number of
sessions associated with each phase, and the time allocated to each session. 'Phase'
refers to distinct aspects of the research, each phase consisting either of a series of tasks,
or an interview. The results for each phase are reported in separate chapters of the
thesis, except for the two interviews, which are reported in a single chapter. (This is
because although the subject-matter of each interview was distinct, both interviews were
about 'general knowledge and experience of measurement' and both contributed to the
overall picture.) The sequence of phases (1-5) was invariant for each child.
`Session' has its usual meaning of a block of time spent on an activity with a single
child, and 'time allocated' refers to typical session lengths as planned by the researcher.
These turned out to be reasonably accurate in piloting. However, no aspect of the
research was actually time limited: each child was allowed to spend as long as they
needed to complete the tasks or interviews. There was thus no systematic variation in
time allocated to children in different year-groups.
One session could be organized to be consecutive with another from the next phase of
the research. Thus the first interview was generally followed up on the same day with
the language tasks; and the estimation tasks with the measurement tasks. There were
occasions where a session was interrupted at a suitable point by the researcher when she
81

judged that a child was becoming tired. When this happened, the session was resumed
as soon as feasible.
In the language tasks, the children reported in qualitative terms the comparative length,
width or height of various items presented in displays. Altogether children made 75
comparisons, but as these were purely visual comparisons, this phase of the work was
fairly rapidly accomplished, as Table 2.03 indicates. The 105 visual estimates were also
accomplished more quickly than their number might suggest, again because they were
perceptual judgements and required little manipulation of materials by the children. The
measurement tasks (27 measurements) required the most effort and were the most time-
consuming.
The researcher collected children individually from their classrooms; sessions were
planned to fit in with class and individual work schedules.
2.6 Conduct of the researcher
The researcher had enjoyed twenty-two years' primary teaching experience, and this
enabled good rapport with children and school staff as well as knowledge of classroom
and school procedures, in which she participated when appropriate, so that her presence
became accepted as routine. Her experience also informed her decisions concerning
organization and management of the research, including minor adjustments in response
to judgements of children's mood and level of engagement.
2.7 Ethical considerations
The support of the school head and relevant staff were obtained, and the consent of
parents and carers of participants was sought by letter. No parent or carer withheld
consent. The children were asked at the first session whether they were happy to
participate. After initial shyness on the part of some, all agreed, and most thereafter
came to sessions with enthusiasm. When during a long series of tasks there were signs
of fatigue, a session was terminated and the child was told that the series would be
finished another time, and was taken back to class. Occasional boredom and lapses of
concentration, on the other hand, were countered with encouragement and persuasion to
continue. The researcher relied on her knowledge of individual children to make
suitable judgements.
82
2.8 Piloting
Interviews and tasks were piloted with a sample of children covering the same age-
range in another school of similar intake, and minor adjustments made.
2.9 Analysis of data
All statistical tests were performed on a count of the number of correct responses made
by children in their performance of tasks. Since the number of observations differed
among tasks, descriptive statistics are generally reported as percentages correct, so as to
facilitate comparisons.
Counts were compared using general linear models with repeated measures. Mauchly's
test of sphericity was applied. If the test statistic was non-significant, sphericity
assumed degrees of freedom were used. If the test statistic was significant, and
Greenhouse-Geisser epsilon value .75, then Greenhouse-Geisser degrees of freedom
were used. Where Greenhouse-Geisser epsilon value > .75, Huyn-Feldt degrees of
freedom were used. All t tests were 2-tailed unless otherwise stated. All post hoc tests
were made using the Bonferroni adjustment.
83

Chapter 3
General knowledge and experience of measurement
3.1 Introduction
Essential features of measurement (for example dimensions and units) that children call
spontaneously to mind can provide a broad indication of the current state of their
conceptual elaboration of the domain. What they take to be the purposes of
measurement and the kinds of measuring activities that they readily recall can help us
understand the contexts and circumstances in which they acquire knowledge of it.
Information about these contexts and circumstances may in turn suggest the kinds of
influences that shape children's developing understanding of measurement and its
underlying principles. The first phase of the research therefore explored the general
knowledge of measurement of the children in the sample. This was done in two semi-
structured interviews.
The first interview, in which the researcher engaged each child at their first meeting,
focused on children's basic conceptualisation of measurement and the contexts in which
this had developed. It elicited what children called to mind when they heard the term
measure and cognate terms, and what experiences of measurement they recalled having
at home and at school. The second interview focused, more narrowly, on children's
knowledge about specific measuring devices, the dimensions of measurement with
which the children associated them, and the units they measured. It also explored
children's understanding of the general principle of the inverse relation between size
and number of units in the context of specific measuring devices. Children were
interviewed individually, each of the two interviews lasting about thirty-five minutes.
3.2 The first interview
The first interview explored the experiences the children reported having, or activities
they reported witnessing, that were considered by them to be measuring activities. It
sought information about the kinds of things children had measured or seen measured,
about what objects they considered to be measuring devices and how they thought these
measured. Dimensions of measurement that children spontaneously mentioned, such as
length, weight and capacity/volume were noted, and also terms they mentioned that
denoted aspects of these dimensions, such as tall, wide, heavy and how much inside.
84

Names of units of measurement employed by the children, and the dimensions they
applied them to, were also noted.
The first interview also checked children's ability to make direct comparisons of length,
in preparation for a later part of the research, where they were asked to make an
extended series of such comparisons. In the interview, children were asked how they
would compare two pencils of different lengths, and to demonstrate this. They were also
asked how they would check the comparative heights of themselves and the
experimenter.
The opportunity was also taken in this interview to bring to children's attention the
distinction between the terms taller and higher in preparation for a later part of the
research where they would compare vertical length of items. These were to be presented
at different spatial levels to test conceptual understanding of intrinsic height of items
(tallness) vs. height above ground. It was considered that while actually distinguishing
between the concepts 'taller' and 'higher', some children might use one term - for
example taller - for both. This is further discussed in Chapter 4. To offer children the
opportunity to consider the distinction between the two terms, the difference in meaning
was explained and illustrated in the first interview after they had been asked to compare
their own height with that of the interviewer.
Finally, possible gender differences were considered in what was communicated by
children about their knowledge and experience of measurement. The first interview was
selected for this purpose because here, children were invited to talk about measurement
in the broadest terms. Gender differences were considered, overall and for each year-
group, by examining differences between boys and girls in their responses to the
question Can you tell me what 'measure' means? and the questions that followed it
about measurement at home and at school, that is, questions a) b) and c) in the schedule
below. What was compared for boys and girls was a count for each child of the number
of types of response classified in the manner shown in Tables 3.02; 3.04; and 3.07.
3.2.1 Method
Participants
The sample for the first interview consisted of seventy-five children, after exclusion of
six children, on the advice of their class teacher, at an early stage of English acquisition
(three each in Years 1 and 3); and two children (in Year 1) for whom there was a
85

substantial amount of missing data due to a fault in the recording of the interview. There
were twenty-four in Year 1; twenty-five in Year 2; and twenty-six in Year 3.
Materials and procedure
At the first interview, the investigator introduced herself as a researcher interested in
measurement and in children's knowledge of it, and then invited the child to talk about
their experiences of measurement. The interview schedule, set out below, started with a
general question whose purpose was simply to introduce the term measure and see what
ideas children spontaneously associated with it. Children were next invited to recall
their experiences of measurement at home. The interview then moved on to ask about
their experiences at school. Finally, children were invited to make a direct comparison
of length and then asked about a specific height comparison.
The participants were allowed to be as expansive (or as reserved) as they wished, and
were not interrupted, as information about measurement itself was sometimes embedded
in a wider narrative that could give important insights into the social context in which
measurement activities took place. If there was no immediate response to a question,
five seconds were allowed to elapse before moving to the next (Black, Harrison, Lee,
Marshall & Wiliam, 2002). Children were not prompted to elaborate their response
except where this had been tautological, 'giving back' the words of the question (e.g.
measurement is when you measure something). A neutral prompt such as Could you say
something more about that? was then used. Prompts were not offered in other
circumstances in the first interview, because it became clear at an early stage that
children who were reluctant to respond became more so if the question was pursued at
once. In these circumstances it was felt that persistence risked eliciting a response to the
researcher's surmised expectations rather than to the question asked. However,
questions were returned to as appropriate later in the interview. All interviews were tape
recorded and transcribed.
Schedule
a) I'm interested in what children of your age know about measuring. We do it in school
and we sometimes need to do it at home. Can you tell me what `measure' means? What
do we mean by 'measure'? If the child seemed unable to answer this question the
following explanation was given before proceeding to the remaining questions. What I
mean by measuring is when you find out how big or small, or heavy something is, or
how much of it there is.
86

b) Have you ever seen someone measuring something at home? Tell me about it. Here
children reported activities in which they had participated as well as those they had
observed.
c) Have you done any measuring at school? Tell me what you did. Children interpreted
`you' in its collective sense, and described measuring they had seen classmates do as
well as measuring they had done themselves.
d) Two pencils, lying side-by-side on the table, and differing in length by approximately
1 cm, are indicated. Can you tell me just by looking, which of these two pencils is
longer? ... Can you think of a way we could check which is longer? Can you show me?
e) Who is taller, you or me? How do you know? If the child affirmed that the
interviewer must be taller because she was an adult, the probe Are adults always taller
than children? was used.
f) How could we check? If the child affirmed that no check was necessary, as the answer
was obvious, the following was added If you had a friend and you wanted to check who
is taller, how would you do that?
g) If you stood on the table, would that make you taller than me? If the child replied that
they would be taller than the experimenter if they stood on the table, she responded:
Actually you wouldn't be taller. You would be higher i fyou stood on the table, but you
wouldn't really be taller, because you didn't suddenly grow, did you? As explained
above, this part of the interview was intended as a 'seeding' experience in preparation
for a subsequent part of the research; no check was made immediately afterwards on
understanding of the distinction between taller and higher.
Classification of responses
Transcripts were carefully read, and patterns were sought within the children's
responses. Separable, broad features of measurement discerned in them provided the
basis for classification. In allocating children's utterances to categories, the overall
meaning of an utterance was considered, and specific terms children used were
subordinated to this. For example, as shown in Table 3.01, two specific responses to the
question Can you tell me what 'measure' means? were What size something is and
Making sure a building is the right size for people. While both mention size, in the first
response the term was used as an attribute and described a generic dimension or aspect
(c.f. 'What height something is' or 'how high something is'). In the second, size was
87

used to express a relation, and the response was best classified with those that spoke of
measurement as determining 'fit'.
A second reader was employed to validate categories, and to check reliability of
allocation to them. There was complete agreement on categories. The reliability check
was on a 25% sample for each question. The average inter-rater agreement on allocation
of utterances to categories across all questions, and across both interviews, was 97%.
Where raters did not agree on allocation of an utterance to a category, the utterance was
discussed until agreement was reached. The same inter-rater procedure was adopted
with all other questions.
Table 3.01 Categories of response to the question: Can you tell me what 'measure'
means?
Response mentions or describes Example response
A specific dimension (length, weight or capacity/volume) and/or one or more aspect of a dimension (e.g. tall, long; heavy; how much inside)
Non-specific dimensions (e.g. size) or aspects (e.g. big) only
Measurement as determining 'fit'
Measuring device - specific or generic (e.g. thing with numbers)
Specific unit
Entity that may be measured
Activity involving measuring
Specific measuring activities
Provision of a straight edge
A tautology, not elaborated
No response, Don't know, or irrelevant response
Measurement tells you how tall or wide something is
What size something is
Making sure a building is the right size for people
You use a measure thing, the numbers tell you where it goes up to
It's centimetres, millimetres, metres
We can measure tables, chairs, people
If you want to make a drink for the baby
In maths, if you measure something `cos you don't know how long it is.
It's when you underline your work
It's when you measure something
We write the letters down (irrelevant response)
88
3.2.2 Results
Can you tell me what 'measure' means?
The purpose of this first question was to ascertain what, if any, ideas immediately came
to mind for children when they heard the word measure, and what was looked for was
any mention of measurement dimensions or aspects of dimensions; of measuring
devices; of units of measurement; of entities that can be measured; or of activities
involving measurement. Responses were classified according to these broad categories,
which were not exclusive. For example, the response When you're measuring a [toy]
car you use a ruler. You need to write millimetres, centimetres or kilograms was
classified as having mentioned a measuring activity, a measuring device, and units.
Children's responses to the first question were typically brief. Ideas mentioned were
occasionally mutually incongruent (for example, units mentioned were sometimes
inappropriate to a dimension also mentioned). Classification of responses to this first
question ignored such incongruence. So in the above example, the incongruity of
kilograms was ignored.
Eight children (32%) in Year 3, three (12%) in Year 2 and six (26%) in Year 1 did not
give an answer to this initial question, and were offered the explanation What I mean by
measuring is when you find out how big or small, or heavy something is, or how much
of it there is. In Year 1, the explanation generally followed silence on the part of a child
(the usual wait of five seconds being allowed). In Years 2 and 3, the explanation was
generally given when a child asked What do you mean? Table 3.02 shows the number
of children mentioning the aspects of measurement listed.
A child who mentioned more than one instance included in a category was counted only
once. In Table 3.02, the category 'a tautology, not elaborated' is amalgamated with 'no
response, don't know, or irrelevant response'. Table 3.02 shows little apparent
awareness about measurement on the part of Year 1 children, nearly half of whom failed
to respond, or gave uninformative answers to this question. At most, a quarter of
children in this year-group responded in accordance with any category in Table 3.02.
There was a shift in Year 2 to a higher overall level of awareness, but this was restricted
to a narrow range of categories. While approximately the same pattern of responses
characterised Year 3, overall they had rather less to say than children in Year 2. Less
than half the children in these two year-groups mentioned a specific dimension or
aspect; rather fewer mentioned something that could be measured. Nearly half those in
89

Year 2 mentioned a measuring device, but in Year 3, nearly as many children mentioned
using a ruler for drawing straight lines as mentioned a measuring device.
Across the whole sample, almost the only devices mentioned were rulers, metre sticks
and tape measures, and almost the only dimension mentioned was length and its
associated aspects of height, length and width.
Table 3.02 Can you tell me what 'measure' means? In each year-group, the number of children responding according to the categories in Table 3.01
Mentions at least one of the following features of measurement Year 1 Year 2 Year 3
Specific dimension (or aspect of dimension) Length (height, length, width) 5 10 12 Weight 0 2 1 Capacity 0 2 0 Non-specific dimension or aspect only 5 2 1 No dimension mentioned 14 12 13
Measurement as determining 'fit' 0 1 2
Measuring device Ruler 0 8 4 Metre stick 0 3 2 Tape measure 1 3 1 Measuring jug 0 3 0 Height scale used in clinics 1 0 0 No device mentioned 22 14 21
Units Specific unit mentioned 0 7 4 No units mentioned 24 18 22
Entity that may be measured Specific entity mentioned 6 10 9 No entities mentioned 18 15 17
Activity involving measuring 1 4 5
Specific measuring activity 3 1 1 No activities mentioned 20 20 20
Uninformative or irrelevant responses Mentions drawing a straight edge 0 0 4 Tautology, no response, Don't know, or irrelevant response 10 6
3
Total uninformative/irrelevant responses 10 3 10
N 24 25 26
90

As a broad criterion of children's elaboration of the notion of measurement, five
features from Table 3.02 that were considered fundamental to measurement were
selected, and for each child a count was made of how many of these five features they
mentioned in response to the question Can you tell me what 'measure' means? Four of
the features chosen were: specific dimension or aspect; measuring device; unit of
measurement; and entity that may be measured. Mention either of an activity involving
measurement or of a specific measuring activity counted as the fifth feature. (No child
mentioned both.) Occurrence of any of the five features was counted only once for a
child, even if the child mentioned more than one instance of that feature.
Table 3.03 sets out the number of children in each year-group who mentioned the
number of features given.
Table 3.03 Number of children in each year-group mentioning a given number of features (0-5)
1 Year
2 3
Features 0 13 4 5 1 7 7 13 2 2 6 4 3 2 6 2 4 0 2 1 5 0 0 1
Mean' 0.2 0.4 0.5 (SD) (0.4) (0.5) (0.5)
N 24 25 26 Note 1. = mean number of features mentioned per child.
Over half the children in Year 1 mentioned none of the five features of measurement
selected, as Table 3.03 shows. The majority of children in Years 2 and 3 mentioned at
least one feature, although in Year 3, only a few children mentioned more than one.
Children in Year 2 were more evenly divided, with over 70% of children mentioning
one, two, or three features in roughly equal numbers. Differences between the year-
groups as to number of features mentioned were, however, non-significant.
91

Measurement at home
Have you ever seen someone measuring something at home? Tell me about it.
Those children who recalled measuring activities out of school usually needed little
prompting to give a full account of their experience. Some Year 1 children whose
accounts were hard to follow received neutral probes such as I didn't quite understand
that to encourage them to elucidate their responses.
Twelve children (50%) in Year 1, eighteen (72%) in Year 2 and twenty-four (92%) in
Year 3 said they had seen measuring at home, and gave relevant responses. The
accounts of these fifty-four children (68%) were typically full and circumstantial. Table
3.04 summarises the content of responses under the general headings of 'measurement
activity', 'measuring devices', 'dimensions' and 'units', with a number of sub-
categories. Table 3.05 sets out for each child the number of activities, items measured,
and measuring devices mentioned by each child. Table 3.06 furnishes examples of
children's descriptions. Tables 3.04 and 3.06 give a quite striking impression of the
wealth of situations in out-of-school environments in which the children encountered
measurement.
Table 3.04 indicates a wide range of measuring activities, with as many as thirteen out
of twenty-four Year 3 children recalling measuring up at home for floor or wall
coverings. Congruent with responses to Question 1, it was measurement of length that
featured in most activities; most devices that were mentioned measured length (the tape
measure being by far the most familiar to children) and most aspects mentioned were
those of length. Few children referred to units, but of those who did, most referred to
correct units for the dimension. Where children mentioned a measuring device, some
also gave a recognisable account of how it was deployed. Twelve children in Year 3, ten
in Year 2, and six in Year 1 did so.
Table 3.05 shows that, of those children in Years 2 and 3 who recalled measuring at
home, and who described at least one type of measuring activity that took place there,
most described only one. Only six Year 1 children mentioned measurement activities,
but of these, four mentioned more than one type of activity. Year 2 children mentioned
slightly more types of activity, on average, than those in Year 3. However, these
differences were not significant.
Most children in Years 2 and 3 recalled one or two types of item being measured at
home, with progressively fewer children mentioning more. In Year 1, most children
92

recalled only one type of item. There was no significant difference between year-
groups. Of those mentioning measuring devices, only two children mentioned more
than two. There was, again, no significant difference between year-groups.
Table 3.04 Have you ever seen someone measuring at home? The number in each year-group mentioning the listed type of activity, device, dimension, and unit.
1 Year
2 3 Type of activity
Fitting floor or wall covering or curtains 1 3 13 Fitting/buying clothes 2 3 4 Measuring space for furniture, people or animals1 4 7 5 Food or drink preparation 4 4 4 Determining height (person, plant, object) 6 2 2 Instructional activity 0 3 1 Other activity 3 7 8 No activity stated 4 1 1
Appropriate measurement device and use Tape 10 7 1 9 Ruler or metre stick 3 3 3 Scales 3 4 4 Measuring jug 4 3 2 Visual comparison 0 0 1 Direct comparison 0 1 1
Other device or use of device Spirit level 0 0 3 Ruler (as straight edge) 2 1 0 No device mentioned 3 6 2
Mention of aspects appropriate for the dimensions of
Length 5 7 9 Weight 2 3 2 No specific aspect mentioned 9 13 10
Units (correct for dimension) m, cm, mm, foot, inch, step 2 4 7 kg, ton, stone, oz 1 4 3 1, ml 0 0 1
Units (incorrect for dimension) m, cm, mm, kg, g
0 0
1 0
1 1
1, ml 0 0 1 No units mentioned 10 13 14
N 12 18 24 Note 1. or conversely, measuring furniture, people or animals for the available space.
93

Table 3.05 Measurement at home: the number of children in each year-group mentioning activities, items, and devices, according to the number of types mentioned
1 Year
2 3
Activities 0 0 0 3
1 2 9 10
2 1 2 0
3 2 1 3
4 1 1 0
Mean (SD) 2 2.3 (1.2) 1.5 (1) 1.2 (1.0)
N 6 13 16
Items'
0 0 0 0
1 7 8 8
2 1 6 8
3 1 3 3
4 1 1 1
5 1 0 1
6 0 0 1
Mean (SD) 2 1.9 (1.5) 1.8 (0.9) 2.2 (1.4)
N 11 18 22
Devices
0 0 0 2
1 5 8 10
2 4 3 6
3 1 0 1
Mean (SD) 2 1.6 (0.7) 1.3 (0.5) 1.3 (0.8)
N 10 11 19 Note 1. e.g. person, article of furniture, cooking ingredient. Several items of the same type mentioned by one child are counted as one item. 2. Mean activities, items or devices mentioned per child.
The quotations in Table 3.06 give a vivid picture of the children's personal interest in
the measurement experiences in the home setting that they reported, and their
specificity. For Year 1 children there was a sense that the personal nature of the
experience was closely bound up with their relationship with the adult doing the
measuring — being allowed on the roller coaster, for example, or holding the screws for
the model ship. In Years 2 and 3 the focus was more on the technical details of the
measurement procedure. Here there is a sense of the importance of units, though often
little sense of the accuracy that is the reason for their use.
94

Table 3.06 Examples of measuring activity at home as described by the children
Year My mum measured me to see if I could go on the roller coaster. You've got to 1 be about 5 foot and I was more than 5 foot. I was 6 foot, and so I could go on
there. We've got a jug with numbers to see how much water to put in the sand pit...because you can make better sand castles. My Dad uses it [tape]. And my mum can sew a skirt or trousers. And my dad can do what my mum can do. They share it [tape]. My granddad can use it [tape] for making something. He made a...model ship. It's in my bedroom. I gave him the screws. The doctor pulled it down on our head. It told...how tall I am. She put my feet on it. And it told how tall my feet were. My dad measured my bunk bed ...to find out the size. The size is 21, 3. [Did he see that on the tape?] He thought it was 88, 9.
Year 2 My sister's weight. You step on these toilet scales.
I helped my mum with cooking. We measured flour and sugar...with scales.
Mum measured the photo so she could get the right size frame, with that thing that you pull out. My dad was measuring a window...cos someone smashed one... [with] this little thing that's round and goes up. He looked at the number and it was about ten hundred kg. My mum measured peas in the garden with a tape. She wanted to know how long they were. My nan done it all the way to the other end of the room to see if there was enough space for the dog she was going to buy. [Was it a big dog?] [Indicates about 1 m with hands]. About 30 m long. It was heavier than me.
That tape thing...my mum held it up to her head and I counted from the bottom and I knew how small she was...she was 186 m. Nearly as tall as you.
Mum's always measuring. She puts this liquid [oil] in a box, and then there's a wood across and then another box, and she puts a block in it. She sees what's heavier.
You get this jug if you want to make milk and you put it in and you put the water in and see if it's past the 1, and then you pour it into the baby's bottle.
If you have a baby...you measure the cot and measure the room to see if it will fit.
Year In the shop...I have to stand like a scarecrow. My mum puts the dress at the 3 back of me to measure how long it is.
He was trying to put a wooden floor, but if you put all of them down, and you've got a long piece and a little gap, you have to measure it, and measure the hole... and then cut it off. My brother was trying to make a map of the underground and he knew how big the underground was, but the paper was only small, so he had to measure how long the paper would be. He had to add more paper.
95
We didn't measure the flour and sugar with the jug, we measured it with spoonfuls. Cos each spoon would be 5 ml. so we put 5 of those.
I want my wall to be painted different colours, pink, red, purple, green. So my dad has to measure about 5 or 6 cm of it, and then he just puts a little bit of paint.
When my dad makes pancakes he always...measures them in weight..,and when he sees which one's heavier, he always thinks it's worse I don't know why...he throws it away.
Measurement at school
Have you done any measuring at school? Tell me what you did
Children who recalled measuring activities in school typically began by listing
classroom objects and fittings that they had measured, moving on to give details about
the deployment of the device used. There was little circumstantial detail. Eight children
(32%) in Year 1, twenty-two (88%) in Year 2 and twenty-four (92%) in Year 3 recalled
measuring experiences at school, and gave relevant responses to this question. While
rather fewer children in Year 1, and rather more in Year 2 recalled measuring at school
than at home, the number of children who recalled measuring in each setting (fifty-four)
was the same overall. However the range of activities recalled and of types of item
measured was much narrower at school than at home, as Tables 3.07 and 3.08 indicate.
It was useful to think about school activities that children reported as having two types
of purpose, which were a) measurement for its own sake and b) measurement as part of
a broader classroom project. The former included measuring the length of arms or legs,
of items of classroom furniture, or of a line previously drawn. As part of a project,
children recalled measuring water to mix with substances such as sand or clay,
apparently to study porosity, measuring equal amounts of water to give to plants, and
measuring distances travelled by toy cars down an inclined plane. Two children also
mentioned measuring for the specific purpose of practising for Key Stage 2 Standard
Attainment Tests. These latter responses were categorised as 'measurement for its own
sake'. Responses were also classified according to mention of items measured,
measuring devices used, terms used that were appropriate to given aspects of
dimensions mentioned (such as 'tall or 'long' for length; 'light or 'heavy' for weight) or
were inappropriate; and units that were appropriate or inappropriate to the dimensions
they were applied to. Table 3.07 sets out this information.
96

Table 3.07 Have you done any measuring at school? The number in each year-group mentioning the listed purposes, items measured, device, dimensions, and units
1 Year
2 3 Purpose of measurement
For its own sake 8 22 24 As part of a broader classroom project 0 3 7 No purpose mentioned 0 0 0
Item measured Playground or classroom space (including floor or walls)
2 4 5
School furniture/fittings/equipment 5 16 18 Items for classroom project 0 3 7 Person or body part 2 6 8 Fluid 0 4 10 Drawn lines or shapes 0 5 2 No items mentioned 0 0 1
Measuring device Iterated body part 5 0 4 Discrete units (cubes; 'short rulers') 0 3 1 Ruler or m stick 4 17 2 1 Measuring jug 0 4 15 Visual comparison 0 1 0 Direct comparison 0 1 0
Other use Ruler (as straight edge) 0 2 2 No device mentioned 1 1 0
Terms appropriate to Length 1 5 5 Weight 0 0 3 Inappropriate 0 0 4 Non-specific 1 3 1 No terms mentioned 6 13 12
Units (correct for dimension) m, cm, mm, foot, inch, step 4 10 16 kg, ton, stone, oz 0 0 0 1, ml 0 0 0
Units (incorrect for dimension) m, cm, mm 0 1 4 kg, g 0 1 2 1, ml 0 0 0 No units mentioned 2 7 5
N 24 25 26
97
Table 3.07 indicates that measurement at school was typically recalled as undertaken for
its own sake and rarely as part of a wider classroom project. Most items children
remembered measuring at school consisted of classroom furniture or equipment,
classmates' height or the length of their arms, legs, hands or feet. In each year-group, at
least twice as many children mentioned units as had done so when recalling the home
context. As then, few mentioned incorrect units for the dimension. Most activities, as in
the home context, involved measurement of length, but the most commonly mentioned
devices used at school were the ruler and metre stick and (as recalled by Year 3
children) measuring jugs. In mentioning devices used at school, eight children in Year
3, thirteen in Year 2, and two in Year 1 gave a fair account of how they were deployed.
Table 3.08 shows the number of children who mentioned different types of item
measured and different measuring devices, according to the number of types mentioned.
(Inappropriate devices and units, and terms appropriate to various dimensions, listed in
Table 3.07, are excluded from this summary because few children mentioned any. Many
children mentioned appropriate units, but all were units of length, so this category was
likewise excluded.)
Table 3.08 shows that few children recalled measurement done at school for a purpose
beyond the measuring exercise itself. Year-groups did not differ significantly in this.
While rather fewer children recalled items measured in the home setting than at school,
the range of items measured was narrower at school (compare Tables 3.07 and 3.08).
There was again no significant difference between year-groups. However, many more
children in Years 2 and 3 mentioned one or more types of measuring device they used at
school than mentioned any devices used in the home setting. Year 3 children recalled
significantly more types of device used at school than did Year 2 children (t (42) = -
3.64; p = .0007); probably reflecting, by that stage, accumulated practice. The use at
school of iterated body parts (such as hand-breadths) and separated units was recalled
by a few children; neither figured among devices used at home. Three children in Year
3 and six in Year 2 also mentioned iterating rulers or metre sticks; of these, one child in
Year 2 and three in Year 3 mentioned adding the number of units produced.
98

Table 3.08 Measurement at school. Number of children in each year-group recalling the listed number of purposes', types of item, and types of device.
Purpose 1 Year
2 3
l a 8 19 17 2b 0 3 7
Mean (SD)1 1 (0) 1.1 (0.4) 1.3 (0.5)
Items 1 7 14 3 2 1 7 13 3 0 0 8 4 0 1 0
Mean (SD) 1 1.1 (0.4) 1.5 (0.7) 2.2 (0.7)
Devices 0 1 1 0 1 5 16 9 2 1 5 15 3 1 0 0
Mean (SD)2 1.3 (0.9) 1.2 (0.5) 1.6 (0.5)
N 8 22 24 Note 1. = maximum two: measurement for its own sake; measurement as part of a classroom project. a = one purpose mentioned; b = both purposes mentioned. 2.= Mean number of purposes, items or devices mentioned per child.
Table 3.09 gives examples of children's descriptions of measuring activities in school.
It illustrates that recall was of a much narrower range of measurement activities
performed in school than at home, but it also illustrates (in Years 2 and 3) greater
awareness of the techniques of using measuring devices, which are sometimes described
with considerable precision. Where numbers or units were mentioned, these represented
plausible quantities for the entities measured.
99

Table 3.09 Examples of measuring activity at school as described by the children
We measured [pictured]dinosaurs and trees with cubes
...the classroom with our feet
...the table with our hands and who had the longest hair
...the floor with paper cut-outs of our feet
...people, when I was in the nursery
Year ...pencils or lines
2 ...how long our finger could go on a line contd.
...windows, chairs, doors, books. When it kept going up we had to put our fingers on the numbers. ...the wall. We had a big ruler and we kept moving it up. ...the door. It was quite long. We used our normal rulers. We had to bring it up one by one. ...our teacher. We had to use a ruler that was longer than we normally use. ...jugs, we got some water, fill it to the top, look, write on the board how much there was inside.
...a table, a door...if it was longer than a little ruler we had to do it again...and write...how long it was, how many times we had used the ruler.
...capacity...[teacher] wrote how much we put in the jug and the most was 11. How much capacity will fit in cups and jugs.
In a practice SATS test there was measuring lines and we had to make one that was a bit longer. ...a skipping rope...with a long ruler. You can only measure skipping ropes, people and big boxes.
There was all sorts of jugs and water. [Teacher] had a little tin cup. She poured it into a jug, and then ... into another jug, and we knew that the bigger jug took more water.
...the board, how long. We used a couple of rulers...I was the only one who knew how to add the numbers.
...the table. We used a ruler. It was 30. Then we put it down. 30 again. So 60. Then we put the ruler down again. 90.
...a car...we used a 100 cm ruler. You push [the car], let it go, and see the number, how far it went. My one went to 47 cm.
We all got a piece of paper and drew loads of shapes and measured the size...some people used rulers, some...tape measures...some used a computer
[teacher] asked us to measure this line and it was 6 cm. But [teacher] measured it and said it was 4cm. So I measured it and it was 4.
Year 1
Year 3
100

...the table. You put your finger where the 30 is, pick it up, put the ruler there, count how much it is, if you've got another 17, it'll be 47.
...my teacher. I got this measuring stick and she stood up and I put the stick above her...and I didn't know what number she was cos she was taller than the stick.
...We got different kinds of soil...and we put the same amount of water in every jug to see how much it soaked in...see it's like what you get on rulers. It's like that on the jug.
contd.
...we put little things like these [toys] on the gram thing. It would go higher if it was lighter and lower if it was heavier
Comparison of responses according to gender
As already stated, gender differences were examined by considering differences in
responses between boys and girls in the first interview (overall and for each year-group)
to the question Can you tell me what 'measure' means? and the questions that followed
it about measurement at home and at school. What was compared for boys and girls
was a count for each child of the total number of types of response they made, as
labelled in Tables 3.02; 3.04; and 3.07.
There was no significant effect of gender. Between 2 and 19 types of response per child
were elicited by the three questions. The mean number of types of response for boys
(M= 7.6, SD = 4.88), and the mean number for girls (M= 8.6, SD = 5.66) were not
significantly different (t73 = -0.84, p = .39). The three year-groups were also tested
separately and again did not differ significantly. For Year 1, Mboys = 4.4, SD = 3.87;
Mgiris = 3.4, SD = 4.58; p = .51. For Year 2, Mboys = 8.1, SD = 4.49; M —girls 10.2,
SD = 4.97; p = .31. For Year 3, Mboys = 10.2, SD = 4.54; M —girls — 11.3, SD = 4.33;
p = .57.
Comparing length and height
The first question was: How could we check which pencil is longer ? Can you show me?
Children a) demonstrated direct comparison of the pencils, (either carefully aligning one
set of pencil ends, or omitting to do so) or b) stated that they would simply look, or
would use a ruler. To the question How do you know I am taller than you? the responses
could be classified as tautological (because you are) or as appealing to visual
comparison (I can see you are) or to a status criterion (age, occupation). Responses to
101

How could we check ? mentioned either direct comparisons of respective height, the use
of a measuring device, or both. As well as eliciting yes/no responses, the question
Would you be taller than me if you stood on the table? elicited qualified 'yes' responses,
in which some recognition was given to the fact that the judgement was not
straightforward. Table 3.10 sets out the numbers of children responding in these
various categories.
To the question Can you tell me just by looking, which of these two pencils is longer?
Each child answered in the affirmative, and indicated one of the pencils. When asked
how they would check this, a large majority of children in each year-group stated that
they would place the pencils together to determine which was the longest and did so
with endpoints correctly aligned, as Table 3.10 shows. All correctly identified the
longer pencil. A few stood the pencils on end, an alternative way of ensuring end-points
coincided. A few in each age-group failed to align endpoints of the pencils correctly;
two were satisfied with a visual comparison that did not involve bringing the two
pencils together. Four children said they would measure the pencils with a ruler, but did
not give a clear account or demonstration of how they would determine which pencil
was longer, having measured them.
In response to the next question, all the children correctly affirmed that the experimenter
was taller than themselves. To the question How do you know? A majority in Years 1
and 2 responded that they knew because the experimenter was an adult, a teacher, a
lady, went to college and the like. Somewhat fewer used this status criterion in Year 3,
and only in Year 3 did many children qualify their response when prompted by the
researcher (Are adults always taller than children?) by giving examples of exceptions
to this generalisation. (Five children in Year 2 and one child in Year 1 also did so). One
child affirmed that you could tell by the colour of an adult's hair whether they would be
shorter than a child, and explained that elderly people became shorter again, and that
when one was elderly, one's hair was grey.
When asked how they would check their height compared with that of the experimenter
(or a friend), about half in each year-group (more in Year 2) said both parties should
stand up and a direct comparison be made, while more than one-third (less in Year 2)
either said they would measure each with a ruler or tape, or mentioned this method as an
alternative to direct comparison. Mention of use of the ruler or tape was therefore more
frequent for measuring people's height than it had been for comparing the length of
pencils.
102

Table 3.10 Comparing lengths of pencils and heights of participant and experimenter. Number of children responding as indicated.
1 Year
2 3 How could we check which pencil is longer? Can you show me?
`You can see just by looking' 0 2 0 Children compared pencils directly, ends aligned 20 17 22 Children compared pencils directly, ends not aligned 4 3 3 `Measure them with a ruler' 1 2 1 Child demonstrated iteration of a unit 0 1 0 No response/ don't know 0 0 0
How do you know I am taller than you? `Because you are' 6 2 3 `I can see you are' 0 4 2 `You are older/adult/teacher' (unqualified) 13 14 8 `You are older/adult/teacher' (qualified in response to 1 5 10
Are adults always older than children?) Other 2 0 1 No response/ don't know 2 0 2
How could we check ? Direct comparison (` Stand up together and look — or
place hand on head - to check') 12 16 14
`Use tape/ruler' 7 3 7 Both direct comparison and measure 2 0 2 No need/don't know 3 6 3
N 24 25 26
Would you be taller than me if you stood on the table?
`Yes' 14 6 12 `No' 8 1 10 Qualified Yes 0 4 2 Don't know/confused response 1 1 3
N 24 13' 26 Note 1. Due to time-tabling constraints that affected Year 2, a large number of children were not asked this last question.
Of the children who were asked whether standing on a table would make them taller
than the experimenter, about half said that it would. The rest (except in Year 1, where
the proportion was one third) said that standing on a table would not make them taller,
or said that it would make them taller, but qualified this statement by adding but I would
be cheating, or only because your feet were still on the floor or other comments
indicating that this was not a straightforward case of being taller. As already stated, all
children were debriefed by being told Well you would be higher, but you wouldn't really
103

be taller, because you wouldn't suddenly have grown, would you? or Quite right: you
would be higher, but you wouldn't really be taller.
3.2.3 Discussion
In the context of this first interview, while few children elaborated the notion of
measurement beyond a very mundane level, many gave vivid and detailed accounts of
measurement activities they had experienced at home, and older children recalled with
some precision the more constrained process of measuring at school. The interview
suggested striking differences between home and school environments as far as
measurement was concerned. There was evidence of some confusion when children
were asked specifically about direct comparisons of height.
When asked what the word measure meant, more than half the children in Year 1 did
not respond, said they did not know, gave an irrelevant response, or said that it was
`when you measure something', and did not elaborate. Among the rest of Year 1, rather
less than half mentioned dimensions or aspects, and fifty per cent of these used non-
specific terms such as 'big, and 'size'. About half mentioned items that could be
measured; none mentioned units of any kind. (Table 3.02). Only four children
mentioned more than one feature of measurement according to the classification used
(Table 3.03). Children failing to respond positively were told that measurement was
when you find out how big or small, or heavy something is, or how much of it there is
before the remaining questions were put. Following this information, over half the
children in Year 1 said that they had seen measuring at home, and just under one third
recalled measuring in the classroom.
Given the much higher proportion of positive responses overall in Years 2 and 3, it is
fair to say that Year 1 children, as a group, probably had little background knowledge of
measurement at that stage in their lives. However, as Table 3.04 indicates, the range of
measuring activities, measuring devices, and dimensions and aspects of measurement
encountered in the home mentioned by those Year 1 children who did respond was
much the same as it was for Years 2 and 3. This was less true of the school setting (see
Table 3.06). Here, for Year 1, there was a narrower range in all categories, except units.
(Units of length were the only ones recalled in the school setting in any year-group.)
This probably reflected the lesser experience of measurement activities that Year 1
children had had in school.
104

There were few differences overall between Years 2 and 3; those tested were non-
significant at p < .05. Most could give some account of the notion of measurement when
asked the meaning of the term, although six children in Year 3 and three in Year 2 failed
to do so. The most frequently mentioned features were dimension and aspects —
overwhelmingly in the dimension of length — and items that could be measured. Less
than half the children in Year 2, and less than one fifth in Year 3 mentioned measuring
devices, and of the latter as many mentioned using the ruler to draw a straight line as to
measure. (Several Year 3 children mentioned being asked to draw a straight line, and
then measure it, as familiar classroom work, so perhaps the two activities were jointly
conceived of as measurement). Units were mentioned by few.
Rather fewer Year 2 children (72%) recalled measurement activities at home than at
school (88%); for Year 3 children the proportion was 92% in relation to both settings.
Year 3 children had been more involved than Year 2 in measuring up for carpets, tiling,
wallpaper or curtains in the home. For all year-groups the retractable tape was by far the
most familiar measuring device in the home setting. Units of length and weight were
mentioned by a few children in Years 2 and 3. Few children mentioned more than one
or two features of measurement in any of the categories identified (see Tables 3.05 and
3.08).
Which features of measurement children mentioned were of course strongly influenced
by the specific activities they had experienced and were reporting. For example, as
Table 3.04 shows, activities associated with redecorating the home, acquiring new
furniture, the fitting of new clothes or determining height predominated in the home
setting, and this probably accounts for the fact that measurement was thought of
predominantly in terms of length. Features of measurement (as categorised here) that
children readily called to mind were in fact modest in number. Units, even units of
length, were rarely mentioned. However, the children's reported experience of
measurement taken as a whole was a rich one, and presented two important contrasts
between home and school. Firstly, in the home, reported measurement activities
generally took place in the context of important family events such as moving house,
buying new furniture or equipment and painting and decorating, or were associated with
events that were special, or were pleasurable to the individual concerned. At school,
measurement was typically recalled as carried out for its own sake, on a narrow range of
classroom objects or of classroom or playground dimensions. Here, recording the result
of measuring was frequently seen as the most important part of the exercise. In one
105

response - 'we measure with a piece of paper' - the recording of measurement stood in
for the whole process: investigation revealed that this statement described writing down
the measurement, not using the piece of paper as a measuring device.
Secondly, most activities in the home were described in terms of affordances — of the fit
of an item (or person or animal) to available space. The use of the tape was prominently
involved in achieving this fit, but was not the focus of the activity. At school, by
contrast, the ruler or metre stick and the units marked on it were the focus of the
activity; what was measured (except on the seemingly rather rare occasions when
measurement formed part of a wider project) was of limited consequence. The use of
iterated or discrete units (Table 3.07) was occasionally recalled as happening at school,
but never in the home context. Moreover the category 'ruler or m stick' in that table
sometimes included cases where the child mentioned iterating a ruler or metre stick as a
unit and counting the iterations or, in some cases, adding together the units shown on
the device that were produced in successive iterations (examples can be found in Table
3.09). Furthermore the limitations of iterating informal units such as body parts - the
problems of different-sized feet, the difficulty of ensuring there were no gaps — were
sometimes hinted at, if not fully explained. It seemed, then, that while the school setting
achieved a focus on units that was not apparent at home, children had a firmly-rooted
sense of important purposes for which measurement was undertaken in 'real life' that
was not reflected in school. What they said about measurement at home also reflected
an appreciation of the difficulties this enterprise presented at times — the difficulties of
achieving a good fit where this really mattered. Some of the comments in Table 3.06,
particularly of Year 3, illustrate this.
Table 3.06 gives examples of real-life problems that require measurement for their
solution. Many of these problems are at once everyday and novel in character.
Cognitive effort is required to achieve the desired outcome, which supplies the problem-
solving impetus. If measurement in the classroom is typically devoid of any purpose
beyond itself, then attempts to teach it are unlikely to sustain children's active mental
engagement. As already suggested they may, for example, fail to persist with the
precision in carrying out measurement procedures that is essential for accuracy.
The two checks of understanding of direct comparison of length (pencils, and height of
child/experimenter) showed the great majority of children to be familiar with a
reasonably accurate method of direct comparison. However, asked to estimate whether
they themselves or the experimenter were taller, and asked to justify their response,
106

most children did so by appeal to the adult's age or grown-up status rather than by
reference to actual height. Although fewer children gave this justification in Year 3
than in other age-groups, and although nearly half the children in that year-group
showed greater understanding by qualifying their response, the overall finding did
suggest that where the human figure was concerned, some confusion was to be expected
about how height is described.
Finally, the check on understanding of the term taller (when the child was asked
whether standing on the table would make them taller), showed that a majority of
children in each year-group failed to make the distinction between intrinsic height and
height above ground when the term taller was used — again, in this particular example,
in the context of the human figure. The children were briefly trained in the correct uses
of taller and higher, and this conceptual and linguistic distinction was further examined
in a later part of the research.
3.3 The second interview
The purpose of the second interview was to obtain a picture of the children's knowledge
about scaled measuring devices in common use and the ways in which these measured.
Particular interest centred on the nature of children's understanding of the numbered
units shown on the devices. Children were shown a ruler, a tape measure, a measuring
jug, and a non-digital clock, wall thermometer and kitchen weighing machine. On each
device (except for the clock) two separated scales were shown whose units were
labelled, numbered and subdivided, and the scales themselves differed in general
appearance. The information displayed on the devices was therefore complex. A
decision was taken not to simplify this information, as the degree of complication was
considered typical of everyday measuring instruments, and it was of interest to see how
well children coped with it. 1.
The interview also afforded an opportunity to explore children's understanding of the
inverse relation between unit size and number of units (Nunes & Bryant 1996;
Carpenter & Lewis 1976). It was to this end that the devices selected (except for the
clock) each displayed two separate numbered scales, usually side by side, whose major
units differed in size. On the ruler, for example, 30 marked and numbered cm were
shown on one edge, while 300 mm (marked and numbered in tens) were shown on the
other edge. On the weighing machine, 8 oz were marked on a scale on the left of the
rectangular display panel, and 240 g were marked on a separate scale on the right. In
this way, a) units of different sizes, and b) different numbers of units (clearly numbered)
107

were fully visible and could easily be compared. (On the tape measure, cm and inch
scales were on reverse faces of the device). The inverse relation was explored for the
ruler, tape measure, measuring jug and weighing machine, but was omitted for the clock
and thermometer, the former because minute and hour scales do not appear separately
on clocks, and the latter because it was apparent in piloting that the children were
generally unfamiliar with units of temperature.
Finally, because all types of quantity measured by visible scales are represented as
length, it was thought possible that these visible scales might confuse children as to
what was actually measured. Devices were therefore selected that measured weight,
volume, time and temperature, as well as length; it was of interest to see whether
children would associate length with devices other than the ruler and tape measure.
Questioning focused on whether children could name a device, considered it to be a
measuring device, and could name the units shown on it and the dimensions to which
they applied. Children were also asked to describe how four of the devices were used.
This was not done for the ruler and tape measure, as children would be asked to
demonstrate their use in a later phase of the research. As each device was introduced,
children were encouraged to handle it and to comment on its markings and uses as they
wished.
1A fluid oz scale on the measuring jug was masked as it was felt the units named would be confused with oz units of weight on the weighing machine. A litre scale and a pint scale remained visible on the jug. 2 Cm and inch scales were not displayed side by side on the tape measure, but were on reverse faces.
3.3.1 Method
Participants
The sample comprised seventy-three children, twenty-six in Year 1, twenty-one in Year
2, and 26 in Year 3.
Materials and procedure
a) General questions about the devices and the units they showed
In the second interview, the first four questions sought the same kind of information
about each measuring device as had been asked in the first interview about
measurement in general. After children had handled and commented on each device,
they were asked to name it. They were then asked whether they thought it could be used
108

for measuring, and if so, how it was used, and what could be measured with it. The next
question, What do the numbers tell us? was designed to elicit knowledge of the
dimension measured by the instrument; and the next, Do you know what these letters
stand for? (the experimenter indicating abbreviated unit labels that appeared on the
instruments) invited children to name the units measured.
b) Questions investigating understanding of the inverse relation The children were
carefully prepared for the two important questions designed to probe their
understanding of the inverse relation between size and number of units. These questions
simply asked which of two visible units of different sizes on each device was the greater
(or smaller) and how the child knew this. These routine questions happened to have
produced, during piloting, unexpected responses relevant to children's understanding of
the inverse relation, and were retained without change. They were asked in relation to
the ruler, tape, weighing machine and measuring jug. In the case of the ruler (used here
by way of example) the first question was So which is longer, lcm or 1 mm? and the
second How do you know?
Thus, as noted above, the children had been allowed to become thoroughly familiar with
the ruler throughout the first part of the interview. They were then directed to its cm
edge, and asked Can you show me how long 1 cm is? If it was not clear from a child's
gesture that they intended to indicate the space between two marks that were 1 cm apart
on the ruler, the experimenter moved a pencil-tip across the space indicated by the child,
from one cm mark to the next, and said Yes, the space from here to here is 1 cm, isn't
it? If the child indicated a line or number rather than a space, the cm space was carefully
indicated, with the words Well actually, the cm is the space, not the line/number.
The child was then invited to identify a second cm - Can you show me another cm? —
and the follow-up explanation given again if necessary. The process was repeated once
more, so that the children indicated or were shown three separate cm spaces in all.
The child was then directed to the other edge of the ruler, and asked to indicate the
length of 1 mm. (Here their indication could be only approximate, and references to the
closeness of the marks or the tiny space involved were expected.) The procedure that
followed was the same as it had been for the cm.
With the ruler still in full view, the experimenter then asked a) So which is longer, 1 cm
or 1 mm? and b) How do you know? Whether the greater or smaller unit was mentioned
109
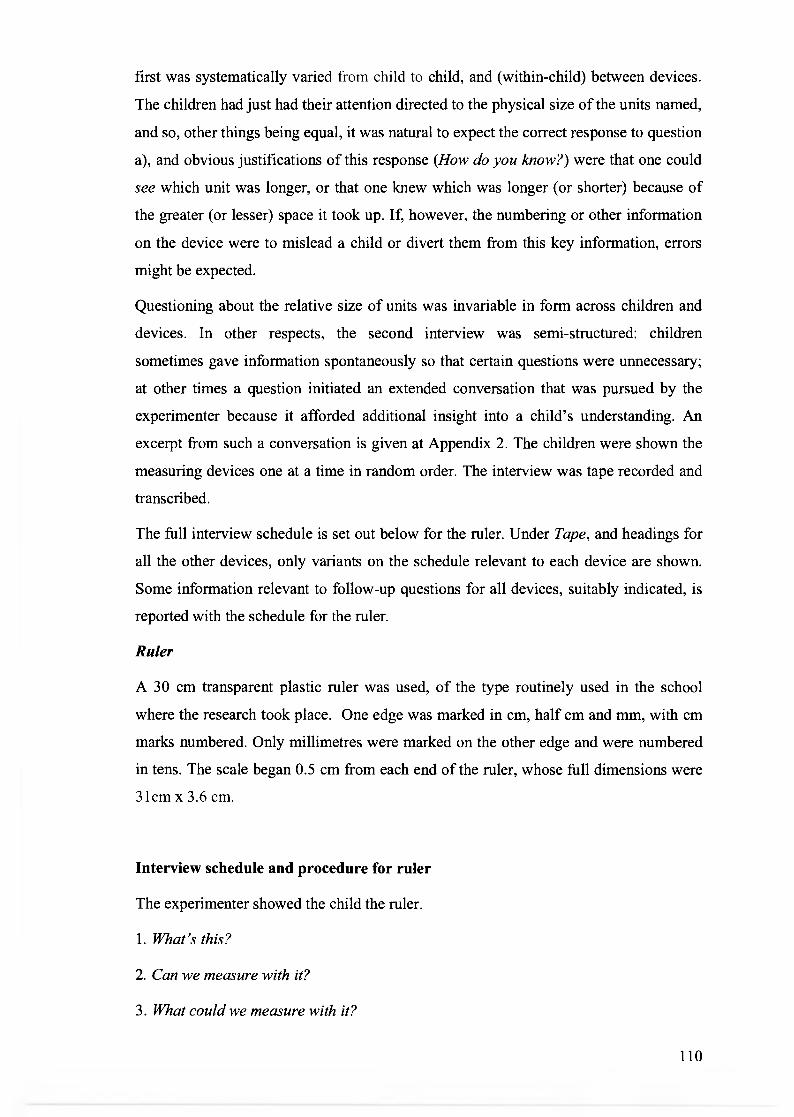
first was systematically varied from child to child, and (within-child) between devices.
The children had just had their attention directed to the physical size of the units named,
and so, other things being equal, it was natural to expect the correct response to question
a), and obvious justifications of this response (How do you know?) were that one could
see which unit was longer, or that one knew which was longer (or shorter) because of
the greater (or lesser) space it took up. If, however, the numbering or other information
on the device were to mislead a child or divert them from this key information, errors
might be expected.
Questioning about the relative size of units was invariable in form across children and
devices. In other respects, the second interview was semi-structured: children
sometimes gave information spontaneously so that certain questions were unnecessary;
at other times a question initiated an extended conversation that was pursued by the
experimenter because it afforded additional insight into a child's understanding. An
excerpt from such a conversation is given at Appendix 2. The children were shown the
measuring devices one at a time in random order. The interview was tape recorded and
transcribed.
The full interview schedule is set out below for the ruler. Under Tape, and headings for
all the other devices, only variants on the schedule relevant to each device are shown.
Some information relevant to follow-up questions for all devices, suitably indicated, is
reported with the schedule for the ruler.
Ruler
A 30 cm transparent plastic ruler was used, of the type routinely used in the school
where the research took place. One edge was marked in cm, half cm and mm, with cm
marks numbered. Only millimetres were marked on the other edge and were numbered
in tens. The scale began 0.5 cm from each end of the ruler, whose full dimensions were
31cm x 3.6 cm.
Interview schedule and procedure for ruler
The experimenter showed the child the ruler.
1. What's this?
2. Can we measure with it?
3. What could we measure with it?
110

4. What do the numbers tell us? If a child replied that the numbers told us about cm or
mm, they were re-directed as follows: Do they tell us how heavy [item] is? How long it
is? How much room it takes up? The order of last three questions was systematically
varied between children. Nineteen children in Year 1, fifteen in Year 2, and twenty in
Year 3 were offered these prompts for one or more devices. Their responses were
inspected for evidence of primacy or recency effects favouring alternatives offered in
the first or third positions. There was a high proportion of correct responses irrespective
of position, and an even distribution of incorrect responses between the three positions.
This indicated that any recency and primacy effects were unlikely to have influenced
the data.
5. Do you know what these letters stand for? [cm, mm] The name of a unit was supplied
if the child did not do so.
6. Can you show me how long 1 cm is? The experimenter confirmed/corrected and
indicated three 1 cm spaces to ensure that the size of the unit was attended to.
7. Can you show me how long 1 mm is? The experimenter confirmed/corrected and
indicated three 1 mm spaces.
8. So which is longer, 1 cm or 1 mm? The order of these options was reversed between
children. The ruler remained in full view.
Tape measure
A white fibreglass dressmaker's tape measure showing inches and cm. One side of the
tape was marked with cm and mm, with cm numbered. The reverse side of the tape was
marked in inches and eighths of inches, with inches numbered with particularly large
numerals. Both scales began at the extreme left-hand end of the tape. The full
dimensions of the tape were 152.4 cm x 1 cm. The last marked units were 150 cm and
59 inches. All numbers were correctly oriented for reading when the tape was vertical
with respect to the reader.
Interview schedule and procedure for tape measure
The interview schedule and procedure were as for the ruler, except that inches and cm
were mentioned instead of cm and mm.
Kitchen weighing machine
A white plastic machine 10 cm high, 8.5 cm deep and 6 cm wide, with a pan 11 x 11 x 5
cm deep, set on a sprung stand on top of the machine. Two separated vertical scales,
111

with a clear space of 7 mm between them, appeared side by side on the front of the
machine, an oz scale to the left, and a g scale to the right. An indicator moved
downwards horizontally across both scales when material was added to the pan. Each
scale was divided and numbered on its right, the g scale being divided into 5g divisions
and numbered every 20g from 0 to 240g; the oz scale divided into 1/4 oz divisions, and
every ounce numbered. Numbers therefore ranged from 0 to 8. The marks labelled '0' at
the top of each scale were level, but the gram scale extended below that of the ounces.
Interview schedule and procedure for weighing machine
The first three questions were as for the ruler. After question 5, where children were
asked to name units printed in abbreviated form on the two scales, the experimenter
asked the child to show how the machine was used. Small plastic toys and other objects
suited to the size of the scale pan were available. After they had placed material in the
pan, children were asked to read the amount indicated on each scale. The horizontal
indicator on the weighing machine crossed both scales, and the intention here was to
offer children the opportunity of seeing that the same amount could be expressed in
units of different sizes (yielding different numbers of units) to prepare the ground for
question 8, where they had to attend to the difference in size of units.
Measuring jug
A translucent, plastic jug of one-litre capacity, showing two scales, one on either side of
a single central spine. One scale showed 1 litre and the other 2 pints. Half a litre and 1
litre were marked on the litre scale, which was also divided into 50-m1 divisions and
numbered every 100 ml. The pint scale was divided into sixteenths of a pint up to the 1
pint mark, and into quarter-pints from the 1 pint to the 2 pint mark. The whole scale
was numbered in quarter pints (1/4, '/2, 11/4, 2). A further fluid oz scale was masked as
it was felt that the units named would be confused with oz units of weight on the
weighing machine.
Interview schedule and procedure for measuring jug
Questions 1 to 4 were as for the ruler. Question 5 took the form Can you read these
words? and followed up with: Do you know what they mean? (The words 'litre' and
`pint' were printed on the jug, and read to the child if necessary.) The experimenter
then asked how the jug was used for measuring.
The experimenter's demonstration of the size of a unit (questions 6 and 7) differed for
the jug from that for the ruler, tape measure and weighing machine. The jug's full
112

capacity was just 1 litre, so children could be shown only one 1-litre unit instead of
several. However, two pints were marked on the jug, and these were separately
indicated.
Clock
A 'travelling' clock, 5.5 cm x 5.5 cm x 2.8 cm in depth; diameter of the face 4.7 cm. As
well as hour and minute hands, there were a second hand and alarm indicator. The
circular dial was divided into hours, subdivided into minutes. Hours were boldly
numbered in digits 5mm2. Batteries were installed and the second hand moved visibly.
Interview schedule and procedure for clock
As for the other devices, children were first asked whether clocks measured anything,
and if so, what. It was anticipated, however, that many would say that clocks did not
measure anything, but instead told the time. The idea of time as measurable, and thence
as involving units, was therefore introduced to all children by question 3: How does a
clock tell us how much time has passed? This question was intended to lead naturally to
consideration of the functions of the hour, minute and second hands (and of the alarm
indicator). The question What do the numbers tell us? (with re-directing questions as
necessary, set out among the questions for 'ruler') then followed on as before, and then
How does a clock work?
No unit names were printed on the clock, and there was only one scale. The subsequent
questions as set out in relation to the ruler were therefore inapplicable.
Wall thermometer
The glass bulb and tube containing a red fluid were mounted in a plastic case. A
Fahrenheit scale was printed on one side of the glass tube and a Celsius scale on the
other. The Fahrenheit scale showed 2° divisions, extended from -40 ° at the bottom of
the scale to 130 ° at the top, and was numbered from 120 ° to 40 ° every 20 0. The
Celsius scale showed 1° divisions, extended from -40 ° at the bottom to 55 ° at the top,
and was numbered from -40 ° to 50 ° every 10 °. Zero degrees were therefore marked
part of the way up each scale. Degrees below zero were not marked with a minus sign
on either scale.
Interview schedule and procedure for thermometer
It was expected that children would have seen and would understand the function of a
thermometer and how it worked in general terms, but would be unfamiliar with F and C
113

scales and their relationship. The same first four questions were therefore asked for the
thermometer as for the ruler, and the children were also asked how a thermometer
worked. They were not asked about relationships between the units, as piloting had
shown this to be too difficult for them.
3.3.2 Results
Table 3.11 classifies children's responses to the first three questions. Table 3.12
classifies an important subset of responses to Question 3. Table 3.13 classifies the
responses to the question How does it work? asked in relation to four of the devices.
Table 3.14 classifies the responses to Question 4, and Table 3.15 the responses to
Question 5.
Can this device measure? What could we measure with it?
Table 3.11 Can this device measure? What could we measure with it? Number of children in each year-group who named the device shown, affirmed that it was a measuring device, and identified entities that could be measured with it
1
Yea r 2 3
Ruler Device named 26 21 26 Can it measure? - Yes 25 20 24 What can it measure? Identifies as measurable > 1 countable item 21 18 23 No information relevant to measurement given 0 0 0
Tape measure Device named 15 14 16 Can it measure? - Yes 26 21 26 What can it measure?
Identifies as measurable > 1 countable item 22 21 19 No information relevant to measurement given 0 0 0
Measuring jug Device named ('measuring jug' 2) 2 4 3 Can it measure? - Yes 16 18 23 What can it measure? Identifies as measurable > 1 liquid or uncountable
solid 14 11 16
Identifies as measurable > 1 inappropriate entity3 3 5 6 No information relevant to measurement given 0 0 0
Kitchen weighing machine Device named ('weighing machine' or 'scales')
16 21 26
Can it measure? - Yes
15 16 26
114

What can it measure? Identifies as measurable > 1 weighable solid or
collection Identifies as measurable > 1 inappropriate entity 5 No information relevant to measurement given
0
0 0
161
21 0
20
0 0
Clock Device named 26 21 26 Can it measure? What can it measure?
Yes: it measures time 0 1 3
Yes: it measures length 1 0 0 No: it tells the time (at a given moment) 15 18 21 No information relevant to measurement given 10 3 2
Thermometer Device named 0 4 4 Can it measure? What can it measure? Yes: it measures heat/cold/temperature 0 6 4
Yes: it measures length 4 0 0 No: it tells how hot or cold it is 1 16 12 No: it tells that you are ill/has to do with blood 4 2 9 Other associations 5 0 0 No information relevant to measurement given 7 2 3
N 26 21 26 Notes 1. Totals to > 16 because two children who said the machine could not measure went on to give examples of how it did; 2. 'measuring jar', 'measuring pot' and 'measuring cup' were also accepted; 3. for example, large countable items such as pieces of fruit; 4.`weighter' and 'thing for weighing' were also accepted; 5. for example, a person.
Table 3.11 shows that all children named the ruler, clock, and (in Years 2 and 3) the
weighing machine. Just over half in each year-group named the tape measure. Very few
named the measuring jug or thermometer. Eight children in each year-group called the
former simply a 'jug', `pot' jar' or 'cup', labels which gave no indication of a
measurement function. Seven children in Year 3, four in Year 2 and two children in
Year 1 mentioned the word 'temperature' when asked what the thermometer was.
Children who did not know or could not recall the name of a device, however, were
often able to describe what they took to be its function. This information included a) the
type of entity children considered could be measured by the device, and b) a description
of how the device was operated. These two categories of information are presented
respectively in Table 3.11 under the heading Can it measure? and in Table 3.13 under
the heading How does it work?
In general, the appearance of the scales on the weighing machine, the measuring jug, the
clock and the thermometer did not suggest to children that these devices measured
length. This was the case only for the clock and thermometer, and only among the
115

youngest children. Two children in Year 1 suggested that one could measure this with
the clock, and held one of its straight edges against a nearby object (book and tape
recorder). This could be seen as a sensible answer if the side of the clock was being
used as a non-standard unit; however, there was no attempt in either case to iterate the
unit along the object 'measured'.
Two other children in Year 1 affirmed that the thermometer was for measuring the
length of the foot (presumably they were reminded of the device used for that purpose
when children are measured for new shoes) and one described it as a 'blood ruler'.
References by a number of children to blood, or to the thermometer as indicating illness
— for example It's a blood thing. It tells you you're ill and You put your blood through it
to see if it's all right or The line goes up to show how sick you are - seemed to be
prompted by the association of the taking of one's temperature with illness and medical
settings, and by the colour of the fluid in the thermometer shown. Neither the mention
of measuring feet nor the association with illness suggests that the scales on the
thermometer were actually thought to measure length; rather it was the general
appearance of the device that seemed to prompt these associations. One Year 1 child,
for example, obviously reminded of a metronome, said that she had 'one of those' on
her piano, and it ticked.
Some associations seemed more complex. It goes red for fire, probably prompted by the
colour of the fluid, seemed to unite the ideas of heat, of red for danger, and of the
thermometer as an indicator or scale. Two other respondents, having correctly said that
the red fluid showed you how hot it was, added that if you wanted to know how cold it
was, you needed a thermometer with blue fluid, probably associating these colours with
the coding used on water taps. One of these two also turned the thermometer so that the
bulb was at the top and said that it was like a try-your-strength machine in a fun fair.
Sometimes two distinct functions would be mentioned: for example, one of the children
who associated a thermometer with measuring one's feet also said that you put it in your
mouth when you were sick. Three children had apparently seen a thermometer explode
in a television cartoon and, having described its function broadly correctly, went on to
state that when the line of fluid reached the top of the device, it exploded. Several others
mentioned explosions in relation to thermometers in more general terms.
By contrast, the five children in Years 2 and 3 who did not associate the thermometer
with the measurement of heat or indication of illness, said simply that they did not know
what it was for.
116

It should be noted that the response 'anything' to the question What can [this device]
measure? was not credited as acceptable, and children who responded in this way are
not enumerated in Table 3.11.
One type of response to the question What can [this device] measure? in relation to the
30 cm ruler and occasionally to the tape, was of particular interest. This was the usually
firmly uttered assertion that only small things - that is, only things no longer than the
device - could be measured with it. This response was frequent only in Year 3, where it
was made by half the children. Two interpretations of such a response suggest
themselves. Piaget remarks in the towers study (1960: 60) that when children have
accepted a stick or strip of paper as a measuring device, they at first do so only if the
device exceeds the height of the tower to be measured. Later they do accept a measure
that is shorter than the tower, but try to make up the full length in a makeshift way with
another object. Piaget argues that although the children are no longer trying to bring the
two towers together in a direct comparison and do accept an intermediate measure, their
understanding of units is still not established, because it does not occur to them either to
iterate a short strip as a unit, or to mark a longer strip in equal units and use that as a
measure.
One interpretation of children's comments in the present interview might thus be that by
a number of children the ruler or tape was not fully understood as the embodiment of
units that could be indefinitely iterated (the length of the device being merely
conventional) but rather that measurement was still seen as a direct comparison between
two objects - the ruler (or tape) and the item measured. A second possible interpretation
is that the children were taking too literally a common injunction (Department for
Education and Employment 1999; Department for Children, Schools and Families
2006) to select the best measuring device for the job in hand: the ruler for small objects,
and the tape for walls, doors and furniture (which, as they reported in the first interview,
were invariably measured with a tape at home). If the first interpretation is correct, and
general developmental factors were at work, one would expect this response to be
commonest among the youngest children. The fact that it was commonest in Year 3
makes the second explanation the more plausible, since these children had experienced
more measurement instruction in school.
To better understand each such response, the researcher followed it up with the question
Isn't there any way you could measure something longer i fyou just had this ruler/ tape?
The three main types of response to this further question are set out in Table 3.12.
117
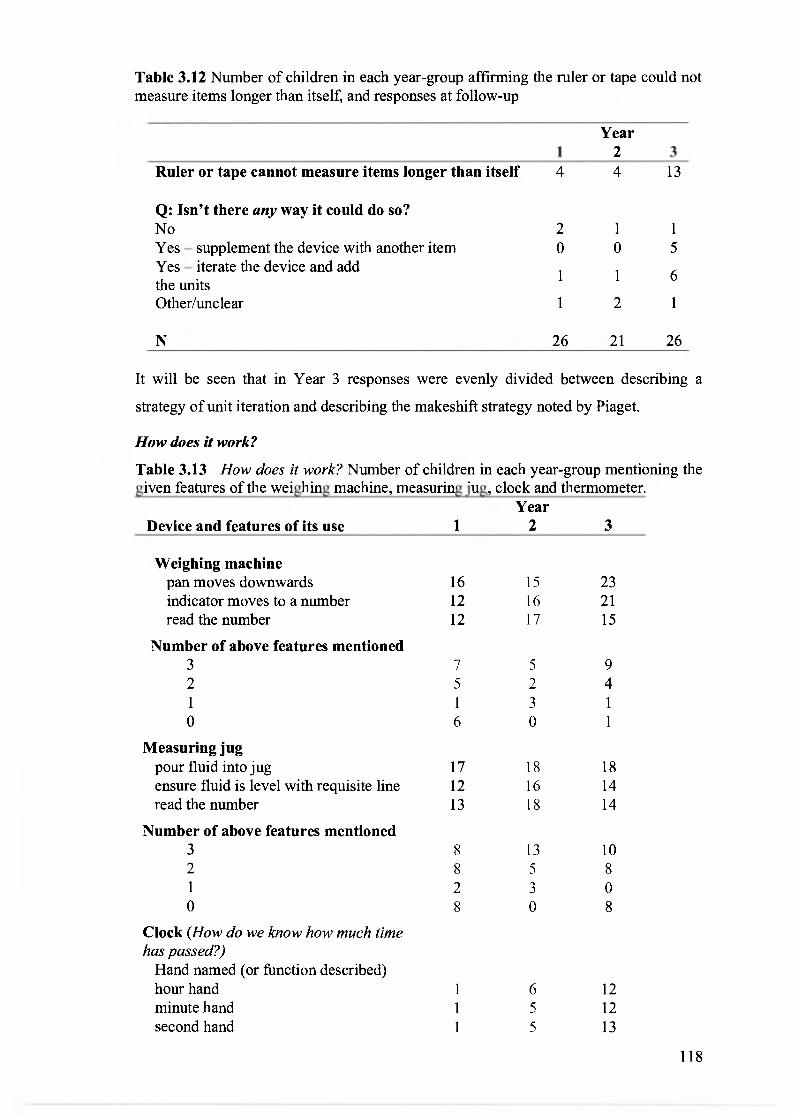
Table 3.12 Number of children in each year-group affirming the ruler or tape could not measure items longer than itself, and responses at follow-up
1 Year
2 3 Ruler or tape cannot measure items longer than itself 4 4 13
Q: Isn't there any way it could do so? No 2 1 1 Yes — supplement the device with another item 0 0 5 Yes — iterate the device and add the units
1 1 6
Other/unclear 1 2 1
N 26 21 26
It will be seen that in Year 3 responses were evenly divided between describing a
strategy of unit iteration and describing the makeshift strategy noted by Piaget.
How does it work?
Table 3.13 How does it work? Number of children in each year-group mentioning the given features of the weighing machine, measuring jug, clock and thermometer.
Year Device and features of its use 1 2 3
Weighing machine pan moves downwards 16 15 23 indicator moves to a number 12 16 21 read the number 12 17 15
Number of above features mentioned 3 7 5 9 2 5 2 4 1 1 3 1 0 6 0 1
Measuring jug pour fluid into jug 17 18 18 ensure fluid is level with requisite line 12 16 14 read the number 13 18 14
Number of above features mentioned 3 8 13 10 2 8 5 8 1 2 3 0 0 8 0 8
Clock (How do we know how much time has passed?)
Hand named (or function described) hour hand 1 6 12 minute hand 1 5 12 second hand 1 5 13
118

relative movement of hands 1 2 13
Number of above features mentioned 4 0 2 10 3 1 3 2 2 0 0 1 1 1 1 2 0 24 15 11
Thermometer either fluid rises when it is hot or fluid
falls when it is cold 3 3 2 both occur 0 0 6 no response 23 18 18
N 26 21 26
The sub-categories used in Table 3.13 describe basic actions necessary in using the
device (weighing machine and jug) and basic knowledge of how the device measures
(clock and thermometer). These sub-categories were chosen in advance of the children's
responses. Children were not asked How does it work? about the ruler or tape measure,
since they would be asked to demonstrate this in the measurement tasks. Table 3.13
shows that over half the children in each year-group could mention some features of
how one weighed material on a kitchen weighing machine, or measured liquid in a
measuring jug, although in Year 1 almost one-third failed to mention any such features,
and somewhat surprisingly, a similar number of Year 3 children were at a loss as far as
the measuring jug was concerned.
In the case of the weighing machine, all were given the opportunity to weigh small
items and were then asked to report the weight as shown on the two scales. All were
able to report the numbers where the indicator stopped; no child spontaneously added
the labels 'grams' and 'ounces'; the researcher supplied these.
In the case of the clock, it was thought that How does it work? might divert children's
attention to the mechanism of the device, and so here, How do we know how much time
has passed? did duty for the former question: the focus was on whether children would
describe the function of the hands on the clock face. In Year 3, about half the children
could name and/or describe the function of all three hands on the clock, and their
relative movements, (although four others in Year 3 were of the view that the function
of the fast-moving second hand was to haul round the other two hands). Nine children
in Year 1, three in Year 2 and one in Year 3 spoke almost exclusively about the alarm
function on the clock, usually for waking them in the morning, but also for reminding
119

them of other important daily events. One suggested that the purpose of the hands on
the clock was to 'get you to the time when the alarm went off, and although this was
explicitly stated only once, this order of importance among the clock's hands could be
inferred from what other children said. More generally, it became apparent that while
some children were interested in how clocks told the time, were focused on telling what
they knew of this and the part played by the various hands and markings on the clock,
and were aware of the relevance of these to the notion of time passing, others did not
think of the clock as recording the passing of time at all. (One child in Year 3 succinctly
remarked, It doesn't tell you how much time has passed. It tells you what time it is right
now.) Rather, they thought of the clock primarily as marking important daily events,
such as getting up, going to work or school, or having lunch, so that the 'times' at which
these happened were thought of as, in a sense, absolute. Only two children in Year 3
and one in Year 2 spoke in this way, but fifteen in Year 1 did so.
In the case of the thermometer, knowing that a rise or fall of the column of fluid
indicated a rise or fall in temperature was considered the key information.
Overall, very few children could supply much detail about how one used either clocks
or thermometers.
What do the numbers tell us?
Table 3.14 What do the numbers tell us?' Number of children in each year-group responding according to the categories listed
Year
Ruler 3
1 2
Mention of appropriate dimension (e.g. 'how long') 12 12 18 non-specific dimension ('how much there is') 2 0 0 inappropriate or mixed dimensions 3 1 1
don't know/no response 9 8 7
Tape measure Mention of
appropriate dimension (e.g. 'how long') 1 1 12 17 non-specific dimension ('how much there is') 0 0 1 inappropriate or mixed dimensions 4 1 2 don't know/no response 1 1 8 6
Measuring jug Mention of
appropriate dimension (e.g. 'how much inside') 5 7 7 non-specific ('how much there is') 4 4 7
120

inappropriate dimension: 'how long' 6 2 5 other inappropriate or mixed dimensions 4 2 4
don't know/no response 7 6 3
Thermometer Mention that
either fluid rises when hot or fluid falls when cold
both occur no response
15 11 17 5 2 2 0 1 1 5 2 1 1 5 5
0 0 0
0 0 2 0 0 8
26 20 11
0 3 2
0 0 6 23 18 18
26 21 26
Kitchen weighing machine Mention of
appropriate dimension (e.g. 'how heavy') non-specific ('how much there is') inappropriate dimension: 'how long' other inappropriate or mixed dimensions don't know/no response
Clock2 Mention of
appropriate dimension (e.g. 'how much time has passed')
hours only hours and minutes don't know/no response
Note 1. No child gave a positive response to this question in regard to the thermometer, so it is omitted. 2. No child responded in accordance with the subheadings used for the other devices, so except for the first, these are omitted.
Table 3.14 shows that in the case of the ruler, tape measure and weighing machine,
nearly half the children in each year-group, and sometimes more than half, named an
appropriate dimension in connection with the device that measured it, and relatively few
mentioned inappropriate dimensions, or a mixture of appropriate and inappropriate
dimensions.
In the case of the jug, it was necessary to refer to 'the amount inside', 'the amount of
room it takes up', or 'its capacity' to be credited with an appropriate dimension, and this
was difficult for most children. The non-specific the numbers tell us how much there is
was not accepted. Many children — often about one third in a year-group — did not
respond to this question.
121
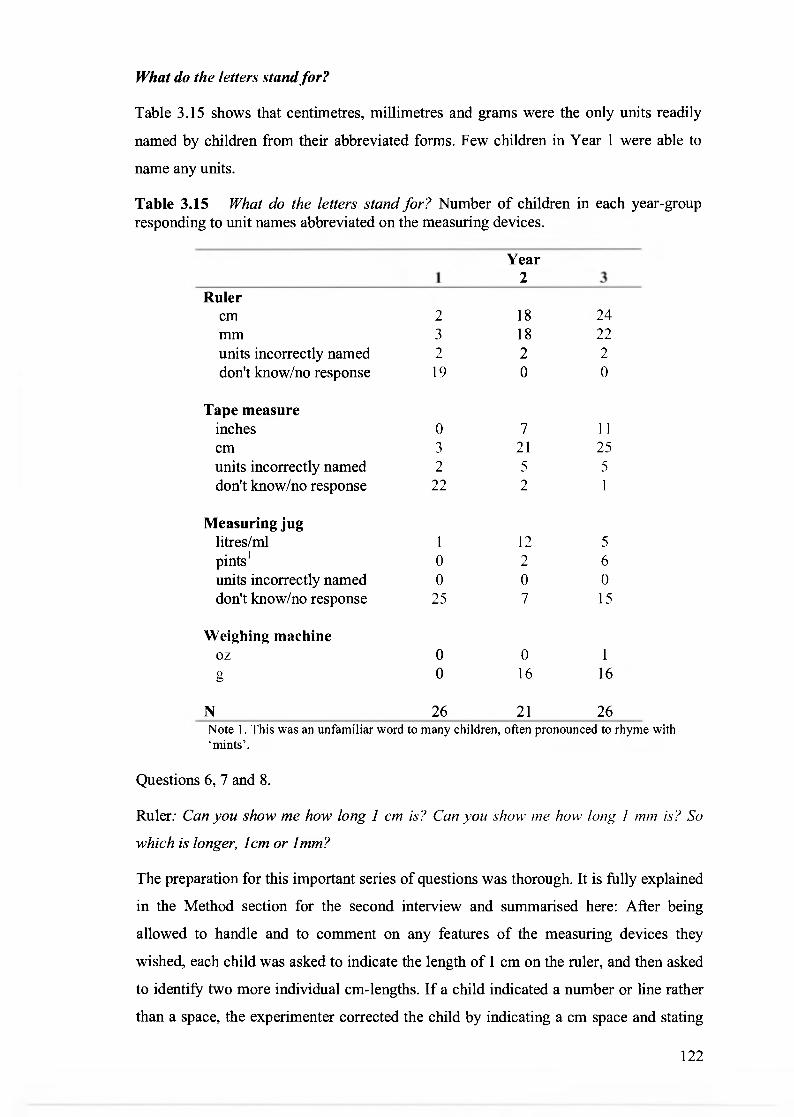
What do the letters stand for?
Table 3.15 shows that centimetres, millimetres and grams were the only units readily
named by children from their abbreviated forms. Few children in Year 1 were able to
name any units.
Table 3.15 What do the letters stand for? Number of children in each year-group responding to unit names abbreviated on the measuring devices.
1 Year
2 3 Ruler
cm 2 18 24 mm 3 18 22 units incorrectly named 2 2 2 don't know/no response 19 0 0
Tape measure inches 0 7 11 cm 3 21 25 units incorrectly named 2 5 5 don't know/no response 22 2 1
Measuring jug litres/ml 1 12 5 pints' 0 2 6 units incorrectly named 0 0 0 don't know/no response 25 7 15
Weighing machine oz 0 0 1 g 0 16 16
N 26 21 26 Note 1. This was an unfamiliar word to many children, often pronounced to rhyme with `mints'.
Questions 6, 7 and 8.
Ruler: Can you show me how long 1 cm is? Can you show me how long 1 mm is? So
which is longer, 1 cm or lmm?
The preparation for this important series of questions was thorough. It is fully explained
in the Method section for the second interview and summarised here: After being
allowed to handle and to comment on any features of the measuring devices they
wished, each child was asked to indicate the length of 1 cm on the ruler, and then asked
to identify two more individual cm-lengths. If a child indicated a number or line rather
than a space, the experimenter corrected the child by indicating a cm space and stating
122

that the space, and not the line or number, was the actual centimetre. The process was
repeated twice more. The same procedure was adopted in respect of the mm scale, the
point of a sharp pencil being use to indicate the length of individual mm. The
experimenter then asked So which is longer, 1 cm or lmm? When the child responded,
the experimenter asked, How do you know? With changes appropriate to the device and
the units involved, the same procedure was adopted for the tape measure, the weighing
machine and the measuring jug.
For each device, Table 3.16 shows the children's responses and their justifications.
Table 3.16 Children's judgements about the greater unit on each measuring device and their justifications, according to year-group
Year Question Response 1 2 3
Ruler Which is longer? 1 cm 5 13 13
How do you know? It takes up more space 2 6 7 The numerals are bigger 0 1 0 There are no little lines 0 1 I
Which is longer? 1 mm 16 6 11
How do you know? The numbers are larger 9 1 6 The numerals are bigger 1 0 0 There are more mm I 0 0 Don't know/No response 4 1 2 Justification inconsistent with response 1
2 3 0
Tape measure Which is longer? 1 inch 14 8 13
How do you know? It takes up more space 3 2 12 The numerals are bigger 3 0 2 There are more inches 0 1 0 Justification inconsistent with response
3 0 0
Which is longer? 1 cm 11 10 12
How do you know? The numbers are larger 2 2 5 It takes up more space 2 0 0 The numerals are bigger 0 1 0 There are more cm 3 5 0 Don't know/No response 0 1 1 Justification inconsistent with response
1 3 5
123

Weighing machine Which is heavier?
How do you know?
Which is heavier?
How do you know?
Measuring Jug Which has more inside?
How do you know?
Which has more inside?
How do you know?
1 g
The numbers are larger There are more grams
1 oz
It takes up more space The numbers are larger Don't know/No response Justification inconsistent with response
1 litre
The numbers are larger, (or there are more of them) It takes up more space Seen pints & litres before
1 pint
The numbers are larger, or there are more of them Don't know/No response Justification inconsistent with response
19
9 1
5
1 1 2
1
16
7
1 0
3
1
5
1
14
10 1
4
0 0 3
1
15
2
0 1
2
1
2
2
0
16
1 1 2
8
1
9
0
20
4
1 3
5
0
1
2
N 26 21 26 Note 1. = (for example) 1 cm is shorter than 1 mm because there are more mm; 1 g is heavier than 1 oz because there are not so many oz.
Table 3.16 shows that for every device, a substantial number of children affirmed that
the larger of the two units that they had just examined was in fact the smaller, and
frequently justified their response by appealing to the greater number of the smaller
units.
The ruler was of 30 cm and, numbered in tens on its other edge, 300 mm. Table 3.16
shows that half the children in Year 3, rather more than half in Year 2 and about one
fifth in Year 1 affirmed that 1 cm on the ruler was longer than 1 mm, and about half of
those in each year-group justified this correct response by saying that 1 cm occupied
more space than 1 mm. However, a majority of Year 1 children and a large minority in
Year 3 affirmed that, to the contrary, 1 mm was longer than 1 cm. About half of these
respondents in Years 1 and 3 justified this incorrect response by reference to the larger
124

number of mm than of cm shown on the ruler. A smaller proportion of Year 2 children,
but still more than a quarter, affirmed that mm were larger and justified this opinion by
reference to their larger number.
The tape measure showed cm on one face and inches on the other. In this case more
than half the Year 1 children correctly affirmed that 1 inch was longer than 1 cm, but
only three of these were able to supply a correct justification for their opinion. About
half the Year 3 children judged relative length of the units correctly and also justified
their opinion correctly. Rather less than one third of Year 2 children judged correctly,
and few could justify their response. Nearly half the children in each year-group judged
that 1 cm was longer than 1 inch. Reasons were similar to those advanced to support
incorrect opinions in relation to the ruler, or were absent; no type of reason
predominated.
In relation to the grams and ounces shown on the weighing machine, there was an even
higher proportion of erroneous judgments. This was despite the experience children had
been given of placing items in the pan of the machine and reading off the weight shown
in both g and oz. (It will be recalled that the indicator crossed both scales so that there
was a clear visual indication that the same weight could be expressed in units of
different sizes.) Most incorrect judgments were justified by reference to the larger
number of grams shown on the scale. The gram scale was longer than the scale showing
oz, and this may have encouraged the predominance of this justification. Few children
said that the ounce was the larger unit, and almost none who did offered a justification
for this view.
Well over half the children in each year-group correctly said that a litre was more than a
pint. In this they may have been responding to the absolute size of the litre as
represented on the jug; it was by far the largest unit on any scale they had been shown.
Greater familiarity with the litre may also have played its part. (The pint was a
seemingly unfamiliar unit that was sometimes pronounced to rhyme with 'mine). This
possibility is revisited in the general discussion. However, of the justifications (which
were few) the largest number were inconsistent with correct judgements that had been
made: children said that a litre was more than a pint because more litres than pints were
shown on the jug. In fact only one litre mark appeared on the jug, since it was of one-
litre capacity. Millilitres, marked in 100s, appeared prominently below the one-litre
mark, and it is likely that children were judging that there were more ml than pints.
125

3.3.3 Discussion
The second interview centred on a number of measuring devices. About these, overall,
the children were knowledgeable. However, there was clear evidence of confusion
about the relationship between the size and number of units shown on the instruments.
Although there were many occasions on which children said that they did not know the
answer to specific questions about the devices they were shown, or chose not to
respond, there were few examples of individuals being entirely mistaken about the
function of a device, the type of entity that it could measure, or the dimension it
measured. Overall, children had good knowledge of the uses of the ruler, tape measure,
weighing machine and measuring jug, the ways in which they measured, and the
dimensions they measured, as the commentary on Tables 3.11; 3.13 and 3.14 indicates.
They knew less about these matters in relation to the clock, and very little in relation to
the thermometer. There was little evidence that visible scales led children to assimilate
non-length dimensions to the dimension of length.
With regard to the clock, only four children considered that clocks measure time, and
although many of the older children were able to name and talk about the movements of
the hands (Table 3.13), and some were eager to demonstrate what they knew about
telling the time, few (Table 3.14) associated the numbers with hours, minutes and
seconds as units of time. Rather, the numbers associated with the clock were considered
as markers for the sequence of important daily events. Thus understanding of time as an
interval scale, stating "time 'at which' " was well on the way, while time as a ratio scale
(Haylock & Cockburn, 1989: 72) was little understood. The thermometer was the least
familiar device, and the reach of the ideas it prompted - the association with blood; the
metronome - suggested the extent to which the overall appearance of a measurement
device, together with the social contexts with which it is associated, may be recruited to
explain its function, and the same data suggest that from the appearance of a device and
the context in which it is encountered it may not be at all obvious to children that the
device has anything to do with measurement.
Of greatest interest were indications of fundamental misconceptions with regard to
units. There was the suggestion by some children that the ability of a device to measure
the length of an object might be limited in an absolute sense by its own length,
indicating that the idea, basic to measurement, of iterating a unit or collection of units
might not be fully understood.
126

More striking, however, was the large number of children across the age-range who
seemingly ignored the physical size of units they had just been examining, to assert that
a unit's size accorded with the number of them that was displayed on the device that
embodied them, and not with the extent of the space they occupied. This was asserted
across devices, whether length was actually measured, or was used to symbolise the
dimension measured. This finding suggested that the inverse relation between size and
number of units was far from understood by many of these children.
3.4 General discussion
As intended, the two interviews offered, firstly, useful evidence of the children's
knowledge of the essential features of measurement and of what they took to be its
purposes.
Secondly, the interviews gave evidence of the contexts in which this knowledge was
acquired. The first interview showed that between the two main contexts of acquisition
— home and school - there was a sharp contrast in the type of measuring experience that
children had had, and the type of importance they attached to it. At home, measurement
seemed to be conceptualised predominantly in terms of affordances, and this was done
in the service of important events of everyday life. At school the preoccupation was
with the handling of rulers and metre sticks and measurement was done for the purpose
of reporting the numbers of units involved. The interview thus showed the contrasting
sets of conditions under which children constructed their conceptual understanding of
measurement.
Thirdly, a more general contrast, a contrast that applied well beyond the measurement
domain, could be discerned from the interviews. It concerned two types of
understanding that children are expected to acquire, often from the very same
experience. These two types of understanding are discussed below under the labels
`conceptual' and 'social'. Development of measurement concepts may be influenced by
the degree of children's success in untangling 'conceptual' and 'social' information
embedded in their experience.
Finally and more specifically, understanding of a fundamental principle of
measurement, the inverse relation between the size and number of units was shown to
be insecure for many of the children.
127

Reflection on the character of the interviews
It is accepted that the picture of children's general knowledge and understanding given
in this chapter is likely to be incomplete, and this is discussed before further
consideration of the findings.
The first interview sought to establish what children spontaneously called to mind when
they were asked about measurement, and although they were given ample time to
respond, and encouraged where appropriate with neutral prompts, they were not pressed
to be more explicit than they chose. A more direct style of questioning was considered
but not adopted for this interview, since there were clear signs that the reticence of some
children would have been increased by this course of action. In these conditions it was
particularly difficult to know how far responses of individuals might represent the full
extent of their knowledge about measurement, and a non-response, a don't know, or an
apparently irrelevant response could not be taken as an indication of absence of
knowledge. However, it did seem fair to conclude that what a child said was an
indication of what was most salient for them about the notion of measurement, or, when
there was no positive response, of the fact that it was not salient at all. It also seemed
reasonable to assume that differences among year-groups in the degree of elaboration of
responses could be taken to indicate either a comparatively greater or lesser degree of
knowledge about measurement, or of availability of language to talk about it. The same
principles applied to the second interview, although here, fewer children were reticent
and dialogue with the researcher was on the whole more extensive. This was probably
because the measuring instruments they were handling provided a specific focus for
their talk.
In both interviews some children were far from reticent and did not restrict their
responses to the specific questions of the researcher, imparting instead a wide range of
information about measurement in the broader context of their lives.
In sum, whether children said much or little, the picture of their knowledge and
experience of measurement given in this chapter is likely to underestimate it.
Nevertheless this picture succeeded in providing evidence of the range of knowledge
that these children had about measurement, of the contexts in which it was acquired,
and also of the kind of job children face in developing good understanding of
measurement principles that are embedded in home and school experience.
128

General knowledge about features of measurement
In the first interview, few children mentioned more than one or two features of
measurement (dimensions, measuring devices, measurable entities, or measuring
activities). Most talk was of length, and given this predominance, some confusion might
have been expected as to what was actually measured with respect to other domains
whose scales represent units as length. In the second interview this was investigated by
asking children to comment on scaled instruments that measured length, weight,
volume, time and temperature, all of which represented their units as length. Where
children recognised instruments as measuring devices, there turned out to be little
confusion about what they measured, suggesting a store of tacit knowledge accumulated
from everyday experience and contrasting with the explicit knowledge characteristic of
the classroom.
Units of any kind were rarely mentioned in the first interview. Spontaneous mention of
units was not recorded in the second interview, but when asked What do the letters [on
the devices shown] stand for? children could usually name only centimetres,
millimetres and grams from their shortened form. Children in Years 2 and 3 often
recalled the lengths of specific objects measured in the classroom and expressed these
as numbers of (generally unnamed) units. Sometimes they even recalled the outcome of
iterating the ruler or metre stick and adding the numbers of units produced. Alongside
this evidence of competence, however, about half the children in Year 3 gave some
evidence of a belief that the length measured by a ruler or tape could not exceed the
length of the instrument. Pressed on the question, about half of these children stated that
the instrument could be iterated and the units added; however the rest either suggested
supplementing the ruler or tape with some other object not marked with units, or had no
suggestion to make. There was some indication here that understanding of measurement
as iterating a standard unit, and of the ruler as embodying this iteration, was not secure.
Furthermore, there was clear evidence of confusion about the relationship between size
and number of units when these were indicated on the instruments shown in the second
interview. This is further discussed below.
129

Measurement at home and at school
The first interview demonstrated that children's experience of measurement outside
school was a rich one, and was embedded in a wide range of interesting activities. The
predominant model of measurement of length was that of fitting an item to the space
available for it; the conception was that of affordance. Two possible consequences of
extensive experience of measurement activities that take the form of calculating or
estimating affordances suggest themselves. On the one hand such experiences may have
a generally beneficial impact on certain kinds of estimation ability: children may
become adept at visual comparisons of length. Children's visual estimation capabilities
were tested in a later part of this research. On the other hand, the same experience of
such direct comparisons of length and their success may encourage a `satisficing' stance
(Simon 1979), and motivation to be precise in the matter of deploying measuring
devices and interpreting amount expressed in units may be adversely affected. (It was
suggested above that motivation to be precise may also be adversely affected by lack of
interest in typical classroom measurement activities.)
The language used to describe measurement in the home was direct and vivid; where
units were named, they seemed to be deployed to embellish the narrative of which they
were a part, and were frequently inappropriate to the domain to which they were
applied. Numbers of units given were often wildly in excess of a sensible estimate for
the entity named; the large numbers seemed to be used to mark the importance of the
activity in which they figured.
Descriptions of measurement at school suggested, by contrast, typically rather mundane
activities, centering on the instrument involved (usually the ruler or metre stick), and on
the noting and recording of the number of units that was the product of the activity.
These activities were usually more carefully described than those in the home setting,
and there were often precise accounts of the handling of the measuring instrument and
of the outcomes of specific instances of measuring in terms of numbers of units. These
precise accounts suggested that the classroom experience was more likely than that of
the home to foster understanding of units, although the narrow range of classroom
activities and the fact that identical rulers and metre sticks were used throughout the
school left room for doubt as to how far that understanding would be generalised.
The conceptual and the social
In the course of development, specific experiences become represented with some
degree and form of generality. Both children and adults are expected to abstract general
130

principles from a wealth of specific daily experiences, and in the case of children, the
development of conceptual understanding - of transitivity and conservation for example
— that underlies many types of reasoning has been extensively studied. There has been
much less focus on the development of children's understanding of specific social
situations and their implications (such as what to do at a birthday party, or how to
conduct oneself in a particular type of classroom activity) or on how the conceptual and
the social might interact in specific contexts. The interviews in the present research
suggest a lack of continuity between the 'conceptual' and the 'social' in relation to
measurement concepts that may adversely affect their development.
For example, the way in which, in an out-of-school context, large numbers and the
names of comparatively large units may be used to embellish a measurement story of
personal importance to the teller has already been mentioned. In Table 3.06, the dog
about thirty metres long and the new window that measured about ten hundred
kilograms are cases in point. We might say that numbers and unit names are here put to
the 'social' use of marking the importance of the event. Exaggeration is licensed in such
social contexts; how do children come to recognise this as exaggeration, and adjust to
the classroom experience, where it is unacceptable inaccuracy? In contrast, Table 3.09
sees Year 2 and Year 3 children, disciplined by school experience of the measuring
activity itself, refer to plausible numbers of units (albeit usually unnamed), and how
these might be arrived at by addition. The contrast these data suggest between home and
school situations as to the role units play for children, together with the prominence of
measuring in the home in terms of affordances, indicate that teachers might have an
uphill struggle in persuading children of the importance of accuracy in measuring. More
fundamentally, precision may be difficult to establish as essential to the concept of a
unit in measurement.
Overall, this contrast suggests that features of measurement knowledge acquired in the
home and school contexts are not likely to support each other, and that the type of
measurement done in school may not be seen as relevant beyond that setting. There is a
broad parallel here with science education, where children's own frameworks for
explaining physical phenomena, acquired outside the classroom, may obstruct
understanding of the science account taught in the classroom (Driver, Guesne &
Tiberghien, 1985).
Next, consider the responses when children were asked whether they or the
experimenter was the taller, and how they knew. How do you know? elicited children's
131

social knowledge that those who were older and whom they perceived as of higher
status would be taller. This is effective use of social knowledge and those who made use
of it were likely to be right about the relative heights in most circumstances. The next
question How could you check that? was superficially similar, in that both were requests
to justify the judgment. However the first question activated social knowledge, while
the second elicited practical techniques for comparing physical height. This illustrated
quite well how superficially similar language may signal for children quite different
areas of knowledge.
Finally, consider the kinds of observations made by children about the clock and the
thermometer, the first very familiar to children; the second quite unfamiliar. These two
devices differed from the others used in the interview in two ways. Both measure
entities that are invisible and intangible, and both measure 'passively': unlike the other
devices, neither requires physical manipulation in order to measure. In fact few children
considered them to be measuring devices.
Possibly because of this, the social functions of both the clock and the thermometer
figured prominently in what children had to say about them. A 'time' on the clock was
seen as labelling an important event in the daily routine (rather than as a measure), and
the alarm indicator was accordingly prominent in discussion because it was a reminder
of such events. On the other hand associations prompted by the thermometer, about
which the children knew little, were more diffuse. Nevertheless, these associations were
not haphazard. The red colour of the fluid in the thermometer was associated with heat,
with blood, and with danger. The word 'temperature' was associated with being ill.
Blood, having a temperature, and hospitals were associated together, while the idea that
the device would explode when the column of liquid reached the top of the scale,
apparently initiated by a television cartoon, also contributed to what seemed to be a
vague association of thermometers with danger. Responses to the thermometer illustrate
how readily available everyday knowledge, social in origin, may be recruited
(especially by younger children) to invest what is little-known with meaning.
Understanding of the inverse relation between size and number of units
Responses on the relative size of units also illustrated how readily use is made of easily
available knowledge, in this case the knowledge that larger numbers usually mean
`more'.
Many children across the age-range repeatedly, after closely examining the relative size
of units, asserted that the smaller of the two units they had just examined was in fact the
132

larger, on the grounds that larger numbers were associated with it on the measuring
device. On the face of it, the way in which these children seemingly ignored the
evidence of their eyes was extraordinary; it seemed that the impression made on them
by large numbers completely overwhelmed the meaning of those numbers in relation to
the units of amount that they signified.
Miller (1989) contended that the procedure for measuring an amount (here, counting
units of length) affects children's judgements of amount. Thus if counting does not
change the amount of material — as happens when smaller units are used (or existing
units subdivided) —children will not conserve quantity and their judgements will be
wrong, because counting misleads in this situation. If this is so, then the proposed
influence must be very strong, considering the emphasis in the interview on comparing
the actual spaces occupied by the larger and smaller units.
The possibility that the more familiar unit was nominated as being 'larger' - in
importance, as it were - (the justification in terms of the number of units being ex post
facto) was considered but rejected. This suggestion was perhaps plausible where grams
were said to weigh more than ounces, since grams were by far the better-known unit of
weight to the children, and Table 3.16 shows that they were identified as being the
heavier by three times as many children as identified ounces as the heavier. Yet in
connection with the ruler, the same table shows more children saying that 1 mm was
longer than 1 cm than said the reverse, when throughout the research, the unit with
which the children were clearly most familiar was the cm. Furthermore, slightly more
children, looking at the tape measure, correctly said that an inch was longer than a cm
than said the reverse, yet the inch was by far the lesser-known unit, and some had never
heard of it. The litre was clearly more familiar to the children than the pint, and many
correctly said that a litre was more than a pint, with, however, incorrect justifications in
terms of there being a larger number of litres. (Since the jug was of one-litre capacity,
only one litre mark appeared on it). Here, as already argued, the most likely explanation
was that children were actually attending to the many ml marks rather than to the single
litre mark; the large number of 100 ml marks was much the most salient feature of this
scale on the jug. This would support the general thesis that the impression made on the
children by large numbers, in itself obscured the meaning of those numbers in relation
to the units they signified. The argument from familiarity of the unit becomes least
plausible, however, in the light of the substantial number of children who correctly
133

identified the greater (or lesser) unit, irrespective of their relative familiarity, and
justified this by indicating that they could see which was greater.
This finding suggested that many of the children did not understand the inverse relation
between size and number of units. It is possible that this task is made harder by the
complexity of the display of units found on common measuring devices, and suggests
firstly that the principle involved in the inverse relation should be explicitly taught, and
secondly that this might best be done using simplified displays of units.
The interviews established broad differences in the contexts in which children learned
about measurement, reflected in general characteristics of the language they used when
recalling those settings. The research next focused more closely on childrens'
understanding of specific everyday language and concepts of ordinal length.
134

Chapter 4
The language and concepts of ordinal length
4.1 Introduction
The previous chapter gave evidence that contrasting social contexts influence children's
developing understanding of measurement and it was the children's use of everyday
language, particularly in the first interview, that provided this evidence. In the
Discussion section of that chapter, examples were given of the ways in which the
children's social uses of the measurement language of several domains may contrast
unhelpfully with the conceptual focus of the same language in school. Rhetorical
devices such as exaggeration (applied to units) provided examples.
Does the everyday language of the domain of length present any specific difficulties to
children? The research continued by examining children's understanding of everyday
language and concepts used specifically in length comparisons, a choice made in
consideration of the tasks to follow, which required visual estimation and measurement
specifically of length. The expectation was that while the everyday language of length
provides essential conceptual underpinnings for measurement, the different social
contexts in which particular terms are used, as well as other subtleties of use, would
make it difficult for children to extract their conceptual content. Resnick summed this
up (1992:107-8) by saying that children learned "both less than and more than
mathematics on each such [social] occasion".
4.2 Ordinal length comparisons
How well do children make ordinal comparisons of length? The everyday language and
concepts investigated and reported in this chapter are those at work in ordinal length
comparisons such as The green line is longer than the black one. The understanding of
what it is for one object to be shorter, longer or the same length as another has to be
secure before units of length can enable us to be more precise about such comparisons,
because simply knowing that one number is greater than another can be entirely
misleading when considering how numbers of units represent length (Correa et al.,
1998; Nunes & Bryant 1996; Carpenter & Lewis, 1976). Thus the work reported in the
current chapter asked children to respond to questions like Which is longer? Which is
shorter? Which is the same length? The research attempted to distinguish children's
135

linguistic from their conceptual competence in relation to such questions by keeping
questions constant, while varying the materials about which they were asked.
Thus the first objective was to investigate children's understanding of the everyday
language of length. The second was to explore children's conceptual understanding of
ordinal length comparisons. In the context of everyday length comparisons, do children
conserve length? Here a lead was taken from Piaget's (1960) formulation of the
understanding required: that changing an object's position in space does not change its
length. The position in space of the materials used was systematically varied: the
question was whether the children's judgements of length would vary accordingly, or
whether they would remain constant across different spatial arrangements. This was
therefore a test of conservation in the broader sense described in 1.2.5.1, and because of
its fundamental importance to measurement, given greater prominence in the present
research than in the work reviewed there.
Finally, to assess generality of findings, a wide range of materials was used. Below, a
balance has been sought between giving full and detailed description of all the
materials, and an overview sufficient to inform understanding of what was done.
Examples of materials are included in appendices.
Except in the final interview, participants were more constrained from this phase of the
research onward, both by the tasks involved, and by the narrower focus and increased
directness of the questioning. The constraints, as already stated, were designed to
facilitate comparison of the outcomes of the tasks, and to limit potential difficulties of
interpretation of the results.
4.3 The language of length
The National Numeracy Strategy (1999) required 5-year-olds in UK schools to be able,
by the end of their first school year, to use terms like longer, shorter and taller to
compare the lengths of "two, then three or more" objects (Department for Education and
Employment, 1999:22). In its successor document, the Primary Mathematics
Framework (Department for Children, Schools and Families, 2006:Year 1 Block D,
Ma3, Measures) assessment for Year 1 emphasises problem-solving How did you find
out which of these two objects was the...shorter? and documents associated with the
new National Curriculum available to date (Qualifications and Curriculum
Development Agency, 2010) do not suggest major changes.
136

These formulations do not appear to anticipate any difficulties in the everyday use of
the language of length and may underestimate them, providing an additional impetus to
the present investigation, which examined children's understanding of three essential
attributes of length: height, length and width.
The language of ordinal comparison
The research tested children's ability to make five types of ordinal comparison, labelled
here for brevity 'least', 'less', 'same', 'more' and 'most'. For example, children were
shown displays of toy figures of different heights and asked to identify who was, from
head to feet, the shortest (`least'); who was shorter (`less'), the same height (`same'), or
taller (`more') than another figure; and who was the tallest (`most'). The same five
types of comparison were tested in relation to length, to width, and to height above
ground.
Bias in favour of terms that express greater quantity
In these types of comparison, one possible general influence is the bias in language
usage noted by Haylock and Cockburn (1989) in favour of terms that express greater,
rather than lesser, quantity; an example, perhaps, of the much greater frequency of
positively-toned than negatively-toned words in a number of languages (Zajonc 1968).
Thus, children tend to hear and speak of who has more, rather than who has fewer,
sweets; we are more likely to compare the heights of two people by saying that one is
taller, rather than that one is shorter. It was possible, therefore, that children would find
it easier to make comparisons of greater than of lesser length, due to increased exposure
to the relevant language. A number of more specific ways in which the everyday
language of height, length and width may be difficult for children to interpret are
discussed next.
The language of height, length and width in everyday life
First, children may find it difficult to determine what is meant by height, by length and
by width. Height refers to length from top to bottom where these extremities differ in
appearance (roof to ground level of a building; head to feet of a person). However, even
when a person is lying down, their height is still the distance from head to feet. Where
top and bottom do not differ in appearance (a block; a tube), height refers to the longest
dimension when that dimension is perpendicular to (`standing on') the surface that
supports the object. When the block or tube is lying at full length on the supporting
surface, however, the longest dimension is instead referred to as its length.
137

Understanding of the relevant convention with respect to human figures was tested in
the present research by asking children to compare the heights of figures some of whom
were standing, and some lying down.
Width refers to length from side to side. So the length of a pen is from top to bottom,
and its width is from side to side. The length of a car is from front to back, its width is
from side to side, and its height is from top to bottom. Children were asked to compare
the lengths of toy cars whose width and height differed as well as their length, offering
potential distractors and increasing the demands of the task. They were also asked to
judge the width of pens and pencils. This was expected to be easier because here, length
is proportionally much greater than width, making the two attributes relatively easy to
distinguish.
Understanding the difference between height from head to feet and height above
ground
Second, children may experience special difficulties in relation to height. When
speaking of the height of something or someone, one may be referring to length from
top to bottom or to height above the ground. In the latter sense, a short person might, for
example, be higher than a taller one, or a cottage higher than a lighthouse. Piaget and
colleagues noted (1960) that in comparing the heights of two towers, children appeared
to take into account only the tops of the towers, ignoring the differing levels of their
bases. One view of this behaviour might be that children were interpreting the
instructions as requiring judgment of height above the ground, rather than comparison
of the two towers from top to bottom. The English translation (Piaget et al., 1960)
supports this view, as the instructions to the children seem either ambiguous (first
instruction) or vague (the phrase that follows):
...the experimenter uses phrases such as: "You make a tower the same height as mine", or simply "the same as mine" &c. (Piaget et al., 1960: 30)
However, the original is not ambiguous in this way:
«Tu vas faire une tour de la meme grandeur que la mienne» ou « la meme que la mienne &c » (Piaget, Inhelder & Szeminska 1948: 44)
where the grammar, at least of the first sentence, clearly indicates intrinsic height or
size. Moreover, while the Concise Oxford English Dictionary (Pearsall, 2001) lists
height as having two physical meanings: 1. the measurement of someone or something
from head to foot or from base to top. 2. elevation above ground, Le Petit Larousse
Dictionnaire (Karoubi, Maire & Ouvrard, 2008) lists the sole physical meaning of
grandeur as dimension de quelque chose, taille, etendue. Elevation is not a possible
138

implication here. (Le Petit Larousse lists hauteur as having the same physical meaning
as the first listed above for height by the Concise Oxford Dictionary: dimension de
quelque chose de sa base a son sommet but lists a different expression - a hauteur de -
as indicating height above ground.)
It seems, then, that the difficulty encountered by the children in Piaget's study may not
have been entirely due to the language used (although it is true that the vagueness of la
meme que la mienne &c does not suggest particular care in this respect on the part of the
experimenters) but may have involved, as Piaget argued, conceptual factors. This
suggests that English-speaking children might encounter conceptual as well as linguistic
difficulties. They may not distinguish height from head to feet from height above
ground, and may accordingly make global judgements. This might be particularly likely
before experience has enabled them to elaborate the different ways in which height is
referred to in English. In the present research, during the first interview, for example,
children in all three year-groups appeared to judge that standing on a table would make
them taller.
To investigate the extent to which global judgments of this type might be made,
children were asked in the research to compare the heights (tallness) of toy figures some
of whom were standing on a block. The raised figures were actually the shorter among
those that children were asked to compare, so that children were tested with a potential
conflict between height of a figure from top to bottom and its height above the ground.
It is also possible that, once having distinguished height from top to bottom from height
above ground, children then switch to answering all questions about height as if they
referred to height from top to bottom. To test for this, further tasks were devised that
required children to compare heights of different items above ground. Shorter items
were raised to a higher level above ground than taller items, thus inducing a potential
conflict between overall distance above ground and height from top to bottom. If
children understood both types of question - those about height from top to bottom, and
those about height above ground — they would make both kinds of comparison
correctly.
Finally, the language of length may be used metaphorically, where no physical
reference is intended, as in the expressions 'the height of bad manners' and 'a tall
story'.
139

So children may not understand linguistic conventions governing talk about length that
are taken for granted by speakers, or the extent to which interpretation of terms
describing length depends on context.
4.4 Conceptual ability
The ability to conserve length, ignoring irrelevant features of spatial presentation when
judging comparative length, is a conceptual ability. Piaget and colleagues (1960) noted
that until the age of about seven years, children sometimes judged distance between toy
people to be greater when the people were of different heights, or their level was raised.
In comparing the heights of two towers, as already mentioned, children ignored the
differing levels of the bases of the towers. They judged wrongly when end-points of
parallel lines whose length was to be compared were displaced. If two lines of equal
length were each segmented into unequal pieces, the line in which an especially long
segment was included was judged to be the longer line.
In the present research, children's ability to ignore such irrelevant features of spatial
presentation was tested with two- and three-dimensional displays in which the relative
level of items differed, end-points were displaced, or the orientation of items differed.
4.5 Separation of language and conceptual ability
The work reported in this chapter sought to separate linguistic from conceptual
knowledge in children's understanding. It did this by asking them to make height,
length and width comparisons under two conditions. In the first (simple) condition, the
perceptual comparisons involved were straightforward. Within each display, items to be
compared were presented on the same level, and were aligned with a common end point
and parallel with each other. In the second (complex) condition, items that were similar
to those used in simple displays were rearranged so that the alignment of their end
points changed, their orientation varied, or the relative level of items differed.
In both simple and complex conditions, the experimenter's questions to children were
exactly the same. Since this was so, it was reasoned that if responses in the simple
condition were mainly correct, but children made appreciably more errors in the
complex condition, then their understanding of the language involved was not likely to
be responsible. In that case, their difficulties must be due to aspects of the displays
themselves. Because the same materials were used in simple as in complex displays,
and the relative length of items in each complex display was similar to that in the
140

corresponding simple display, it was the different spatial arrangement of items
presented that was likely to be the cause of difficulty.
Finally, evidence (Bryant, 1974) that relative judgments of size are easier than absolute
judgements would suggest that there would be more correct relative judgements of
greater or less length, than absolute judgements of equal length
4.6 Factors investigated
The three main factors investigated were (1) type of comparison (five types of
comparison, reflected in the five types of question asked); (2) attribute (three attributes:
height, length and width, reflected in the spatial relationships among the items
displayed, as well as in the questions asked about them); (3) complexity of display (two
levels: 'simple' and 'complex' as described above).
As an additional factor to test generality of understanding, displays were presented in
two formats: 3D format (real items) and 2D format (line drawings of similar items).
4.7 Method
4.7.1 Sample
Seventy-two of the children who were involved in all other aspects of the research
participated, twenty-four children in Year 1; twenty-one in Year 2 and twenty-seven in
Year 3.
4.7.2 Summary of materials and procedure
Table 4.01 presents an overview of the materials used in relation to each attribute of
length investigated. Table 4.02 sets out the wording of the questions used in relation to
the same attributes. Table 4.03 shows the number of comparisons children made
according to attribute and type of display.
Table 4.01 Summary of materials used to make comparisons of height from head to feet, of length, of width, and of height above ground
Attribute
Height from Height
head to Length Width above
feet ground
2D Pictured Lines of Pictured People of people of various writing various
141
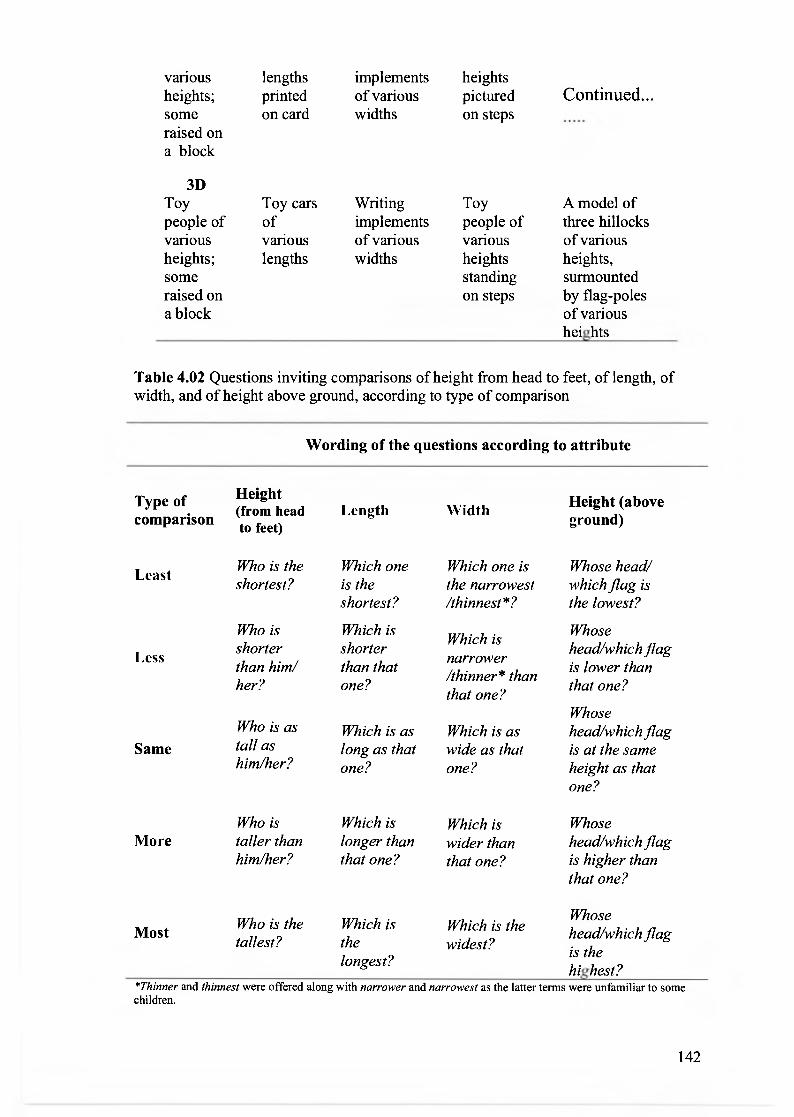
various heights; some raised on a block
3D Toy people of various heights; some raised on a block
Toy cars Writing Toy A model of of implements people of three hillocks various of various various of various lengths widths heights heights,
standing surmounted on steps by flag-poles
of various heights
lengths
implements
heights printed
of various pictured
Continued... on card
widths on steps
Table 4.02 Questions inviting comparisons of height from head to feet, of length, of width, and of height above ground, according to type of comparison
Wording of the questions according to attribute
Type of comparison
Least
Less
Same
More
Most
Height (from head to feet)
Who is the shortest?
Who is shorter than him/ her?
Who is as tall as him/her?
Who is taller than him/her?
Who is the tallest?
Length
Which one is the shortest?
Which is shorter than that one?
Which is as long as that one?
Which is longer than that one?
Which is the longest?
Width
Which one is the narrowest /thinnest*?
Which is narrower /thinner* than that one?
Which is as wide as that one?
Which is wider than that one?
Which is the widest?
Height (above ground)
Whose head/ which flag is the lowest?
Whose head/which flag is lower than that one?
Whose head/which flag is at the same height as that one?
Whose head/which flag is higher than that one?
Whose head/which flag is the highest?
*Thinner and thinnest were offered along with narrower and narrowest as the latter terms were unfamiliar to some children.
142

An example of how these questions were deployed is given under the heading 'Details
of procedure' below.
4.7.3 Details of materials
Height from head to feet
Children were asked to compare the heights of people in line drawings (2D format) and
of plastic toy people (3D format). In the simple condition (in both formats)
combinations of figures of different heights standing at the same level were shown, with
an appropriate figure indicated where the question required it. In the complex condition
(again in both formats) either the shortest figure was presented standing on a block, or
the tallest figure was presented lying down. Figures in line drawings ranged from 3.1
cm to 6.8 cm, and plastic toys from 5.1 cm to 7 cm in height.
Length
Children were questioned about lines of differing lengths printed on A4 card (2D
format) and about toy cars of assorted lengths (3D format). In the simple condition,
lines were parallel and with left end-points aligned. In the complex condition, lines
either appeared with endpoints displaced, or were presented at right angles to each
other. Toy cars that in the simple condition were parallel 'parked', with their rear
bumpers against a 'wall', were re-arranged in the complex condition in configurations
similar to the complex line displays. Lines ranged from 6.5 to 9.5 cm; cars from 6.7 to
10.2 cm in length .
Width
Children were questioned about line drawings of pencils and crayons (2D format). Real
writing implements such as pens, a pencil and board writers were also shown (3D
format). In the simple condition, the items were presented parallel and in close
proximity to each other. In the complex condition, items were presented further apart.
Their endpoints were displaced in some arrays, while in others they were orientated to
each other at angles between 45° and 135 °. Items in line drawings ranged from 0.6 to 5
cm in width; real items from 0.6 cm to 1.7 cm.
Height above ground
Ability to ignore the length of different components that separately contribute to height
above the ground, and to judge total height above the ground was tested using three
143

displays. In a pictured (2D) and a toy (3D) format, a set of four people of differing
heights was presented standing on a flight of steps, with the shorter people standing on
the higher steps. Children were asked: Whose head is higher? and cognate questions. A
further (3D) test presented a model of four hillocks, each surmounted by a flag. Each
hillock and each flagpole was of a different height, with shorter flagpoles standing on
taller hillocks. Here, children were asked: Which flag is higher? and cognate questions.
These three displays had no simple condition, since the type of height they were used to
investigate was by nature complex. Heights of toy people together with the steps on
which they were raised ranged from 11 cm to 16.1 cm, and of their pictured equivalents
from 6.7 cm to 9.1 cm; heights of flags ranged from 7.5 to 10 cm.
Presentation of experimental displays
For 2D displays, one set of ten cards was used for comparisons of height from head to
feet, another set of ten for length, and a further set of ten for width. Half the cards in
each set showed a simple arrangement of items and half showed a complex
arrangement. There were three items on each card.
For 3D displays, three items were drawn from a pool of six, among which at least two
were of equal height (or length, or width) so as to provide appropriate material for
questions such as Who is the same height as...?
For 'height above ground' one set of four people on steps (3D), one card showing the
pictured equivalent (2D), and one model (3D) sufficed for all questions.
Participants were seated opposite the experimenter, but no orientation was prescribed to
the viewer, so children were free to view the displays from any angle. For 2D displays
this could make little practical difference, since the viewpoint was fixed by the
drawings. 3D displays, however, were liable to be viewed from a wider range of angles.
A record sheet for each child listed the displays to be shown and was used to record
their responses.
Table 4.03 Number of comparisons made by each child in relation to attribute and type of display (75
Number of comparisons
Simple Displays
Complex 2D 3D
Attribute 2D 3D
Height from head to feet 5 5 5 5 Length 5 5 5 5 Width 5 5 5 5 Height above ground 5 5, 5
144

4.7.4 Details of procedure
Comparisons of height from head to feet are used as an example.
Children were asked to compare the heights of toy people (3D displays), and the
experimenter selected and arranged three toys from the six available so as to permit the
required comparison. She then pointed to the appropriate toy in a display and asked, for
example, Who is shorter than him (her)? noting the response. Displays were then
rearranged, and toys in successive displays were appropriately indicated. In 2D
displays, the experimenter indicated an appropriate pictured figure. Questions were
varied according to type of comparison and according to attribute as shown in Table
4.02.
Most children saw all the arrays in one session. (Those who did not, always saw simple
and complex counterparts in a single session.) For 3D displays, the experimenter made,
on the record sheet, a 'blind' selection of a specific question to be asked next and then
selected items for the appropriate display. For 2D presentations, each set of five cards
(corresponding to the five questions), was shuffled before blind selection of a card.
Children made the five comparisons for simple displays, followed by the five
corresponding comparisons for complex displays.
The experimenter said to each child: I am going to show you some toys, some pens and
pencils and some pictures, and ask you some questions about them, and then proceeded
with the questions. Minimum changes were made to the wording of questions to ask, as
appropriate, about height from head to feet, about length, about width, and about height
above ground (see Table 4.02). Children's response to each question was noted on their
record sheet.
4.7.5 Scoring
Responses were scored correct or incorrect.
4.8 Results
The results from the three displays associated with height above ground had no 'simple'
version, and so could not be included in the analysis of those from the main series of
displays. They were analysed separately.
145

Main series of displays: height from head to feet; length; width
The main series of displays tested comparisons of height from head to feet; length and
width. In view of the girl/boy imbalance in Year 2 noted in Chapter 2, a preliminary
analysis examined gender effects across the whole sample. There was no significant
effect of gender or significant interaction of gender with any other factor, including
year-group. Gender was therefore excluded from the analysis. Mean correct
comparisons according to year-group, type of comparison, attribute, format and
complexity are shown in Table 4.04. Related analysis of variance is shown in Table
4.05.
Table 4.04 reports a high proportion of correct comparisons, showing that children had
good understanding of the language and concepts of length comparison.
An initial mixed analysis of variance showed significant main effects for year-group
and for each of the four between-subjects factors shown in Table 4.04 (p < .01).
There were also a number of significant interactions. Higher-order interactions
involving either year-group or format, however, were mainly non-significant, and all
had very small F ratios; so to facilitate analysis of interactions, year-group and format
were removed from the principal anova and analysed separately. Thus, two analyses of
variance were performed as follows:
a) a three-way within-subjects analysis. Factors were i) type of comparison, with five
levels: least, less, same, more, and most; ii) attribute, with three levels: height from head
to feet, length, and width; iii) complexity, with two levels: simple and complex. This
analysis is reported in Table 4.05.
b) a two-way mixed analysis with year-group as between-subjects variable and format
as within-subjects variable. This is also reported in Table 4.05.
146

Table 4.04 Mean (SD) percentage of correct comparisons in the main series of displays according to year-group, type of comparison, attribute, complexity and format.
Year 1 Year 2 Year 3 All
Type of comparison Least (shortest/narrowest) 69 (18) 83 (8) 86 (11) 79 (15) Less (shorter/narrower) 88 (13) 92 (9) 97 (7) 92 (10)
Same (the same height/length/width) 73 (21) 82 (21) 81 (19) 79 (20) More (taller/longer/wider) 84 (16) 88 (14) 90(12) 88 (14)
Most (tallest/longest/widest) 71 (17) 83 (8) 86 (11) 80 (14)
Attribute Height 73 (12) 76 (13) 84 (11) 78 (13) Length 82 (16) 88 (11) 91 (10) 87 (13) Width 77 (21) 93 (10) 90 (16) 87 (18)
Complexity Simple 84 (12) 93 (7) 95 (6) 91 (10)
Complex 79 (17) 89 (12) 88 (12) 85 (14)
Format 2-D 79 (13) 87 (8) 89 (10) 85 (11) 3D 75 (14) 84 (10) 87 (7) 82 (12)
All 77 (18) 86 (14) 88 (14) 84 (16)
N 24 21 27 72 Note. Each child made 60 comparisons.
Table 4.05 Analysis of variance for correct comparisons according to a) type of comparison, attribute and complexity and b) year-group and format
Source Error df df Error Mean Square
F p
a) Type of comparison (T)
284 a 2.6a 2.45 18.49 <.01
Attribute (A) 122.1 b 1.713 2.14 12.03 <.01 Complexity (C) 71 1 10.63 82.92 <.01
T x A 12.3 5.3a 2.31 25.80 <.01 T x C 4.3 4 1.08 24.14 <.01 A x C 14.2 2 7.09 106.12 <.01
TxAxC 7.9 6.9k 1.17 24.31 <.01
b) Year-group (Y) 69 2 0.18 9.37 <.01 Format (F) 69 1 0.03 9.07 <.01
Y x F 69 2 0.003 0.42 .66
Note.a = Greenhouse-Geisser df used; b =Huynh-Feldt df used.
147
As Tables 4.04 and 4.05 show, children's judgments were significantly and
substantially more accurate with simple than with complex displays. There were main
effects for year-group, type of comparison and attribute. Post hoc tests showed that
overall, children in Year 2 and Year 3 made significantly more correct comparisons than
those in Year 1; that the length and the width of items were compared significantly
better than the height; and that there were significantly more successful comparisons
identifying less (shorter or narrower) and more (taller, longer or wider) than with the
other three types of comparison (least, most and same). Overall, children performed
significantly better with displays in 2D format than with 3D displays. Means plots
were used to investigate the significant three-way interaction between type of
comparison, attribute and complexity and are shown in Figure 4.01.
Inspection of the two plots in Figure 4.01 indicates two likely sources for the three-way
interaction observed. First, height from head to feet behaved entirely differently from
length or width according to type of comparison. As Figure 4.01(A) shows, there were
far fewer correct responses to the questions Who is the shortest? and Who is the tallest?
than to the corresponding questions for length and width. For height, there were also
more correct responses to Who is as tall as him? than for similar comparisons involving
equal length or width. Second, 'simple' differs markedly from 'complex' according to
attribute. Figure 4.01 (B) shows performance in simple and complex conditions to be
similar for width, to diverge somewhat for length, and to be widely different for height,
with performance at near maximum in the simple condition, while at a much lower level
in the complex condition.
148

Figure 4.01 Mean correct responses for (A) attributes of length according to type of comparison; (B) level of complexity according to attribute
95
t 85 a)
0 0 U) a)
-4- height
length
4- width co 75 0 0 U) a)
65
0 0 2 ri 55
‹,‘'
least less same more most
Type of comparison
o 95 B
O a)
O ° 85 cn
cn
cf) 75
O
O E 65 0 0 2 LL
-4- simple complex
55
height
length
width
Attribute
Second series of displays: height above ground
The second series (three displays) tested comparisons of height above ground. All three
displays presented conflicting cues about height (and hence all were complex displays).
It will be recalled that, relative to others in the same display, toy people or flags were
placed such that their height above ground contrasted with their height from head to feet
(for flagpoles, from top to bottom). For example, the shortest in a display of four toy
people stood on a step that raised its head above those of the others. Thus to answer the
question Whose head is the highest? correctly, it was necessary to ignore height from
head to feet.
149

Table 4.06 Mean (SD) percentage of correct judgements in the three tests of height above ground according to year-group and type of comparison
Displays of height above ground
Year 1 Year 2 Year 3 All
Toy people on steps (2-D) 63 (34) 69 (38) 79 (29) 71 (34) Toy people on steps (3-D) 69 (31) 67 (42) 83 (31) 74 (35)
Flags on hillocks (3-D) 80 (22) 88 (20) 96 (13) 88 (20)
Type of comparison Lowest 67 (34) 73 (39) 84 (28) 75 (34) Lower 69 (33) 73 (33) 88 (25) 77 (31)
At the same height 60 (26) 67 (32) 80 (23) 72 (28) Higher 81 (24) 79 (31) 89 (21) 83 (25) Highest 76 (29) 79 (27) 90 (22) 82 (26)
Total 71 (21) 74 (29) 86 (21) 77 (24)
N 24 21 27 72 Note. Each child made 15 comparisons in the three tests of height above ground.
A preliminary analysis of variance of the tasks comparing height above ground, again
undertaken to check any effect of imbalance between the sexes in Year 2, showed no
significant effect of gender, or significant interaction of gender with any other factor
including year-group; so the analysis was repeated without gender, as a three-way
mixed analysis with year-group as between-subjects factor and display (the three
different displays constituting the three levels) and type of comparison (with five levels
as shown in Table 4.06) as the two within-subjects factors. This analysis is reported in
Table 4.07.
Table 4.07 Analysis of variance of the three tests of comparison of height above ground
Source Error df Error mean square
df F P
Between subjects
Year-group (Y) 69 0.22 2 3.11 .05
Within subjects
Display (D) 126.4b 0.27 1.83b 13.46 <.01
D x Y 3.66b 0.36 .23
Type of comparison (T) 245.7b 0.11 3.56b 7.29 <.01
T x Y 7.12b 0.48 .85
D x T 389.8a 0.12 3.65a 7.92 <.01
DxTxY 11.30a 2.02 .03 Note.a= Greenhouse-Geisser df used; b =Huynh-Feldt df used.
150

100
70
60 0
50 0 0
40
-- least
-6-same more most
As Table 4.07 shows, there were significant main effects of display and of type of
comparison. Post hoc tests showed significantly better performance with the model of
flags set on hillocks than with either the real or the pictured displays of people on steps
(p < .05). There were significantly more correct responses to the question Which is
higher? (a comparison of more) than to Which is lowest? (least) and also significantly
more to Which is higher? and Which is highest? (most) than to Which is at the same
height? (same).There were two significant interactions, also shown in Table 4.07. The
three-way interaction involving display, type of comparison and year-group had a very
small F ratio; moreover there had been no main effect of year-group. It was therefore
considered that any interaction effect of year-group was likely to be marginal.
Accordingly the two-way interaction between display and type of comparison was
selected for investigation. This was done with the help of the means plot shown in
Figure 4.02.
Figure 4.02 Mean correct responses for type of comparison according to display.
toy people pictured people
flags
Display
Figure 4.02 shows the likeliest source of the interaction to be a very depressed
performance (compared with other comparisons) when children judged 'same height' in
the display that pictured people on steps.
151

The three types of height display compared
Table 4.08 brings together data for all three types of height display children saw in the
main and second series, i.e. height from head to feet (simple), height from head to feet
(complex) and height above ground. It shows that children performed best (in fact at
near maximum) in simple comparisons of height from head to feet. They performed
next best comparing height above ground and they performed worst of all in complex
comparisons of height from head to feet. All differences were significant at p < .05.
Among complex height displays and among displays of height above ground there were
no significant differences between year-groups.
Table 4.08 Mean (SD) percentage of correct judgements in all types of height display, according to year-group.
All types of height display Year 1 Year 2 Year 3 All
From head to feet (simple) 92 (10) 97 (10) 99 (0) 96 (10) From head to feet (complex) 53 (21) 56 (27) 69 (22) 60 (24) Height above ground (all displays complex)
71 (21) 74 (29) 86 (21) 77(24)
N 24 21 27 72
The differences reported in Table 4.08 were further investigated.
Complex height comparisons involving human figures
During the first interview, most children had correctly aligned the ends of pencils before
comparing their length, showing understanding that the same starting point must be
used when comparing the length of two objects. When it came to comparing their own
height with that of the experimenter, however, while most children said that the
experimenter was taller, they then affirmed that they themselves would be the taller if
they stood on a table, suggesting that the understanding shown did not generalise to the
human figure, at least in this context.
The opportunity was now taken to look at the human figure in a fresh context, and see
whether complex displays involving human figures presented greater difficulties than
other complex displays of height. Two of the three displays of height above ground used
human figures. The third (the display with flags) was separated from them and used as
the contrast. Correct responses for a) the display with flags were compared with b)
amalgamated correct responses for the other complex height displays that used human
figures (Table 4.08). Mean correct responses for the display with flags was 88%,
152

significantly greater than for displays with human figures at 68% (t = 6.96; df = 71; p <
.01). It should be borne in mind that children made in a) only five comparisons while in
b) they made twenty comparisons.
Further investigation of performance with a) complex height displays and
b) displays of height above ground
a) In relation to complex displays of height from head to feet, children performed
substantially and significantly worse when responding to the two questions Who is the
shortest? (34% correct) and Who is the tallest? (25% correct) (that is, in comparisons of
least and most) than to the other three questions: Who is shorter? (82%), Who is the
same height? (83%) and Who is taller? (76%) that is, in comparisons of less, same and
more (p < .01).
It was when answering the questions Who is the shortest? and Who is the tallest? that
children had to judge height from head to feet of figures raised on a block. In these
displays, the real or pictured block was a prominent feature, making the figure placed on
it the most salient figure in that display. As already stated, it was the shortest figure in
the display that was placed on the block, and its head was now the highest of the three
in the display by a considerable margin. By these arrangements the children's attention
was deliberately drawn to a cue that conflicted with the height of the figure from head
to feet. Thus when asked Who is the shortest? children who made a correct response
might first attend to the figure in the display whose head was the lowest, before
considering and correctly judging the shortest from head to feet, that is, the figure on the
block. Conversely, when asked Who is the tallest?, they might attend to, but then
disregard the joint height of the figure and the block. They would finally consider only
the height of that figure from head to feet.
In contrast, the questions Who is shorter? Who is the same height? or Who is taller?
were asked where a figure was made to lie down and children had to compare its height
with that of two standing figures. Here too a conflicting cue was provided, in that one
figure in a display was presented in an atypical posture for judging height, and where
height might be confused with length. Nevertheless, here, there was a high success rate.
Children were, on the whole, not misled about height from head to feet when presented
with a figure that was lying down. Only where they were required to distinguish
153

between the height of a figure from head to feet, and its level when raised on a block
was there any substantial difficulty.
b) The three displays of height above ground presented the reverse requirement. That
requirement was to ignore the distinction between the height of the figure (or flag) and
the step (or hillock) on which it was raised, attending only to total height. In these three
displays, as already reported, children did significantly better than in complex height
displays.
To examine children's understanding of these aspects of height more closely, responses
to specific height displays were selected for closer scrutiny. The display with flags was
omitted, since here there was a high level of success; only the results from displays that
employed human figures were used, as follows: a) the four displays of figures raised on
blocks in the complex height condition (height from head to feet), where the height of
the block had to be ignored; b) the four displays of figures standing on steps (height
above ground), where the height of a figure had to be considered together with that of
the step.
It was suggested in the introduction to this chapter that younger children in particular
might be likely to judge height in a global manner, and not discriminate, for example,
between the height of a figure from head to feet, and its height combined with that of
the block on which it stood. If global judgements of this kind were being made by a
child, one would expect errors when judging complex displays of height from head to
feet, combined with correct responses when judging height above ground, where
aggregating the height of a figure with that of the object on which it was raised was a
condition of success. This combination is labelled 'Category 1'.
It was further suggested that when a child had learned to judge a figure's height from
head to feet separately from that of the object on which it is raised, this knowledge
might then be applied across the board. Thus, when asked to judge height above ground,
such a child would ignore the height of the step on which a figure stood, and attend only
to its height from head to feet. If this type of over-discrimination was occurring, one
would expect correct judgements in complex displays of height from head to feet,
combined with errors in judging height above ground. This combination is labelled
`Category 2'
Children who had learned to make judgements that were appropriate to each context
would judge correctly in both situations (Category 3).
154

The numbers of children giving correct and incorrect responses, and the pattern of
correct and incorrect responses they gave, for height from head to feet (figures on
blocks) and for displays of height above ground (figures on steps), were set out in a
cross-tabulation matrix. For each child, the number of judgements made in conformity
with one of the three categories described above was then counted. Each child saw a
total of eight displays that were relevant to this question, and hence made a total of eight
judgements, in relation to these two aspects of height, so that seven or more judgements
in conformity with one category was above chance level (p < .05) for that category.
Children who met this criterion were allocated to the appropriate category (Table 4.09).
As Table 4.09 shows, a majority of those meeting the criterion were in Category 1,
making global judgements on every, or almost every occasion, whether appropriate or
not. Only three over-discriminated (Category 2). Eleven made judgements appropriate
to each context, of whom eight were children in Year 3.
Table 4.09 The number of children in each year-group whose judgements of height conformed to categories as stated.
Year Category 1: errors in judging height from
head to feet, combined with correct responses in judging height above
ground
Category 2: correct judgements of height
from head to feet, combined with errors in
judging height above ground
Category 3: judgements appropriate
to each context
Children who met 'greater
than chance' criterion
N
1 10 1 1 12 24 2 11 1 2 14 21 3 11 1 8 20 27
4.9 Discussion
Main findings
The work reported in this chapter showed fundamental prerequisites of measurement to
be well established among the children investigated. They were good at making
comparisons of length in a wide range of contexts, successfully ignoring a considerable
number of distracting cues, and they were good comprehenders of the everyday
language used to make those comparisons. This finding supports Resnick's description
of the scope and robust nature of children's protoquantitative reasoning, since all the
required judgements were protoquantitative (Resnick & Singer, 1993). More broadly, it
155

contributes a further context in which children's accomplishments in making relative
judgements are demonstrated.
The children saw each experimental display in a simple condition, where length
comparisons were expected to be easy, and in a complex condition, which presented
them with various conflicting cues about length to negotiate. The language used by the
experimenter to question the children was held constant across simple and complex
displays. It was considered that if children did well with the simple displays, but
appreciably worse with the complex displays, the language used could be ruled out as a
cause of difficulty. Instead, difficulties associated with spatial aspects of the displays
would be the likely cause. In contrast, a large number of errors in both simple and
complex conditions would suggest that difficulties associated with the language of
comparative length were the main cause. High levels of success in both conditions
would indicate that neither language nor spatial arrangement was a problem for these
children.
Children did attain a high level of success in both simple and complex conditions
overall, giving evidence that neither the language used, nor spatial arrangement
presented any great problem to them. The subtleties of the everyday language of length
did not, on the whole, elude them, and there was very little failure to conserve length. In
their everyday understanding of length there was, therefore, a sound basis for school
work in estimation and measurement. Even the youngest children did well, with only an
11% overall mean difference (which was, however, significant) between Year 1 and
Year 3 in the main series of tasks (Table 4.04). Mean correct responses were higher in
each successive year, although Year 2 and Year 3 did not differ significantly.
Performance was slightly but significantly better overall with displays in 2D than in 3D
format in the main series of displays; that is, children found it easier to compare height,
length or width of lines or items in line drawings than to compare these attributes of real
objects. This slight difference was probably due to the greater opportunity for
misjudgement permitted by children's freedom to view 3D displays from any angle,
while the viewing angle is fixed by the nature of line drawings. In the second series of
displays (the three displays of height above ground) on the other hand, there was a
much higher level of success with the complicated model of flags on hillocks, and a
slightly higher level of success with 3D displays of people, than with the 2D display in
that series (Table 4.06). The unexpected success with the model is considered below,
156

while the lesser success with the 2D than the 3D display of people was probably an
artefact of the line drawing used.
There was no evidence that comparisons of more were easier for children than
comparisons of less due to bias in language usage, as suggested by Haylock and
Cockburn (1989).
Length and width were compared significantly better than height from head to feet.
Differences in performance according to type of comparison (least, less, same, more and
most) and according to attribute (height, length and width), were largely due to poorer
judgements of height in certain contexts, which were further investigated.
Poorer performance in relation to aspects of height
Children comparing the height of figures in simple displays were successful over ninety
per cent of the time irrespective of year-group. Performance on complex versions of the
displays was much worse. It will be recalled that these complex formats were designed
to test children's ability to distinguish whether a figure was taller or shorter than
another, or merely situated higher or lower than another, and that this investigation was
suggested by the work of Piaget et al., (1960), where children comparing the heights of
towers appeared to ignore the fact that the bases of the towers were not at the same
level. Such phenomena formed part of Piaget's case that children elaborate only slowly
the conceptual properties of three-dimensional space. He expressed this by saying that
at first children do not understand that the size of an object does not vary when its
position changes. An alternative explanation, discussed in the introduction to this
chapter, concerns the language of height, and suggests that children fail to discriminate
the various meanings that can attach to questions about height in different contexts.
Where children were asked to compare the heights of figures from head to feet, level
was manipulated in complex versions of displays by standing one figure on a block, or
making it lie down. As already explained, to compare height correctly, a child had to
ignore these features of presentation, and attend only to the height of the figure from
head to feet. In the case of the raised figures, it was considered that younger children
might tend to make global judgements of the total height of the figure and the block,
due to lack of familiarity with the difference between the height of a figure in the sense
of its tallness, and its height in the sense of its distance above ground. Displays
featuring a figure that was lying down tested understanding of the same two senses of
height.
157

The three displays of height above ground, it will be remembered, were designed to test
the converse possibility: that children may indeed learn when intrinsic height of items is
being referred to, irrespective of their level above ground, but then apply this
knowledge indiscriminately, so that when asked about height above ground (Whose
head is higher?... Which flag is the lowest?) they judge, for example, height from head
to feet, or from the bottom of the flagpole to the top of the flag, and fail to take into
account the height of the base on which the item is raised.
If children in this research understood both types of question - those about height from
top to bottom, and those about height above ground — they would make both kinds of
comparison correctly.
In fact by far the greatest difficulty for children was in dissociating the height of a
figure from a block on which it stood. The figures that were lying down in complex
height displays caused no special problems. The three tests of height above ground were
significantly better performed overall than complex tests of height from head to feet.
This was surprising, because there were more conflicting cues in the latter comparisons.
Here, four figures were seen in the same display on steps of different heights, whereas
in complex height displays there were only three figures to compare, of which only one
was raised relative to the others. The model of flags on hillocks had even more potential
to confuse. Here again there were four items to be viewed simultaneously, and again
intrinsic height 'contradicted' the height to which the items were raised. But
additionally, there was no obvious point from which to view this model, and children
had to determine their own perspective on it.
It seemed that there was particular difficulty with displays involving raised human
figures. Children's responses specifically to raised figures (figures on blocks in the main
series of displays, and figures on steps in the three tests of height above ground) were
therefore examined by a crosstabulation in which the number of children making each
possible combination of correct responses to these two types of display was recorded
(Table 4.09). Over one-third of the children in each year-group had specific difficulty in
considering separate components of height when this was appropriate (in many cases
having no success at all) while making successful comparisons when a judgement of
aggregate height was called for.
So figures raised on blocks were the sole substantial problem. Taken together, the
findings for all the height displays suggest a bias towards the global in children's
judgements. Such a bias would have served them well in the complicated displays of
158
figures on steps and flags on hillocks, where the various ways in which height above
ground was partitioned had to be ignored, and would account for their greater success
with these displays. The fact that the height of figures that had been made to lie down
was well-judged also supports the view that it was the partitioning of height that proved
the stumbling block: no partitioning was necessary with the recumbent figures, who
presented the same type of conflicting cue to height as lines or cars placed at right
angles did to length. In neither height nor length displays did this type of conflict
present much difficulty.
Whether the failure to partition overall height was conceptual in character, or whether it
was due to difficulties with the language involved is difficult to determine, but two
considerations suggest the latter. Firstly, children who had erroneously identified a
figure on a block as the tallest would occasionally add because he's on the block. They
would nevertheless reiterate when asked, that the block really did make him taller.
Others would occasionally signal uncertainty by saying no-one is the tallest, or he's
cheating. These occurrences suggest an imperfect understanding of the different ways in
which the language of height is used in certain circumstances, rather than a genuine
failure to partition height between the block and the figure. Secondly, performance on
height above ground was significantly better for the display using flags on hillocks than
for the two displays using people on steps. A bias towards global height judgements
should have produced much the same result in both types of display, or even (since the
display with flags was more complicated) a better performance with the figures on
steps. It seemed that height in relation to human figures may have involved ambiguities
for the children not evoked by other objects whose height was judged, and that these
ambiguities were to do with language usage. Children may know, for example, that
people sometimes wear high-heeled shoes 'to make them taller'.
It may seem that questioning children about specific height judgements would have
been the most direct way of clarifying these issues, and this was a tempting option. But
to ask for reasons for all judgements would not have made sense (Why do you think that
car is the longest? inviting the response Because it is!), while to ask only about displays
that included raised figures risked signalling to children that these specific judgements
had been unsatisfactory in some way, and might have caused them to change their
judgements to satisfy the experimenter. The shortcomings of the approach adopted —
that of making inferences about understanding from a pattern of responses - are indeed
159

acknowledged, but it was considered that on the whole, the less intrusive method would
provide more reliable data.
In the tests reported in this chapter, children in Years 2 and 3 performed significantly
better overall than children in Year 1, but no significant differences were found between
year-groups either for complex height displays or for the three displays of height above
ground. That is, in the only aspects of the tests that proved difficult, there was no
significant increase in accuracy in successive year-groups. This could have been due to
characteristics of the specific sample studied, but for these children at least, neither
increased time in school nor more general developmental factors made the contribution
to greater understanding that might have been expected.
These findings suggest that, as far as height, length and width are concerned, it is height
that has the greatest potential to confuse, and that it is height that should, of the three
attributes, receive most attention in primary mathematics teaching.
The preceding chapter established important general characteristics of children's
conceptions of measurement, through examination of the children's everyday language
as they recalled their measurement experiences. Overall, the language resources at their
disposal proved to be rich, although often deployed with freedom rather than accuracy.
The current chapter continued the focus on everyday language, looking closely and
specifically at the understanding of language and concepts associated with ordinal
length comparisons. The children coped very well with most of the potential pitfalls
here, so that one basis for successful numerical measurement — understanding of ordinal
comparison - was shown to be in place. The research now moved to look at children's
ability to estimate length. Here, some of the language used in the current chapter was
again employed, (shorter; longer; same) but height and width were not considered; the
focus was on the attribute of length. The estimation procedure had some numerical
features, and measuring devices were introduced.
160
Chapter 5
Visual Estimation of Ordinal Length
5.1 Introduction
The ability to make comparisons of ordinal length must be secure if children are to go
on to understand how lengths of items can be compared using standard units. The
previous chapter investigated children's understanding of everyday language and
concepts of ordinal length, because it was possible that such everyday language and the
social contexts in which it was used might obstruct access to the conceptual content.
Chapter 4 reported little evidence of difficulty. Overall, the children coped remarkably
well in making ordinal comparisons in which they estimated the relative height, length
and width of various figures and objects.
The question How well do children make ordinal comparisons of length? was asked
again in relation to the work reported in the current chapter, but now the focus was on
their visual estimation ability as opposed to their understanding of the language and
concepts involved. The judgements were again relative. Here, children made more
judgements, and only of length; and they were made in a narrower range of contexts.
This further investigation of ordinal ability, as logical underpinning for measurement,
was also important because of the prominence of estimation in classroom activities.
Estimating and measuring
Estimating and measuring are often found as a pair among classroom activities in
British primary schools, with estimation either preceding or following measurement.
One rationale given to children for pairing estimation with measurement is that the
greater accuracy of measurement serves as a corrective to the inexactness of estimation.
Another, where estimation is encouraged as a check on measurement, is that
approximate agreement between the outcomes of the two procedures can indicate that
measuring was appropriately executed.
Whatever the rationale for estimation, it may be assumed by educators that estimation is
a more intuitive and thus a less demanding procedure than measurement. This may not
be the case, especially when children are expected to retrieve mental representations of
familiar objects, distances or units (Department of Education and Employment, 1999) to
compare them with the length of an entity that they can see.
161

The type of estimation reported in the current chapter did not give children the task of
retrieving such mental representations. This was because information about the
children's ability to make the ordinal comparisons that underlie measurement could be
provided just as well by a less demanding type of estimation, in which two entities to be
compared are both physically present. This type of estimation was used here.
There was good reason to expect that children would be successful at estimation of this
kind. Developmental literature indicated that young children may be adept at making
approximate judgements where no direct numerical comparisons are required. Resnick's
(1992) notion of protoquantities and Bryant's (1974) earlier argument that relative
judgments of size (involving qualitative comparison) are successfully made earlier than
absolute judgements, both suggest that we might expect children to be good qualitative
estimators of length; and research with infants suggests that ability to make certain
types of qualitative ratio judgement emerges very early indeed. (Feigenson et al., 2004;
Feigenson et aL, 2002). In Chapter 3 it was reported that children's experiences of
measuring at home seem frequently to take the form of judging affordances - the degree
of 'fit' of one object to another (Gibson, 1979); Chapter 4 reported their high level of
success in making qualitative comparisons of height, length and width. Together, these
sources suggested that qualitative estimation may develop early, and that one basis for
measurement with units might thus be secure.
Some of the varied materials used in the estimation and measurement tasks in the
present research were common to both sets of tasks. Employed in the estimation tasks,
the variety among these materials provided a range of conditions under which children
estimated, to test the robustness of their estimation ability.
In the measurement tasks, the varying of the materials had a more specific purpose. The
various features instantiated potential difficulties embedded in measurement concepts.
These potential difficulties concerned a) the ways in which number maps on to quantity,
b) notions of separation and continuity and c) subdivision of units and were suggested
by the developmental literature (Resnick, 1992; Miller, 1989; Piaget et al., 1960). These
features are described below. For convenience, their rationale in the measurement tasks
is also described.
Outline and rationale
Twenty-one lines of varying lengths were displayed at a fixed distance from the child,
who was asked to estimate whether each line was shorter, longer or the same length as
five different types of item, referred to hereafter as the comparators. Thus the materials
162

consisted on the one hand of a collection of lines, and on the other of a group of five
comparators. The collection of lines was large and varied so as to provide a thorough
test of estimation ability.
The five comparators were i) the whole length of one unmarked strip of card; ii) a
number of 1 cm wooden cubes; iii) a number of units on a second strip of card that was
marked and numbered in divisions of 1 cm (but not labelled `cm'); and finally a number
of cm indicated iv) on a ruler and v) on a tape measure. It was these five comparators
that featured the range of conditions under which children estimated, and provided the
grounds for potential conceptual difficulties when they measured. How the comparators
incorporated these features is now explained.
The features of the comparators
In her characterisation of mathematical development, Resnick (1992) had identified a
transition between qualitative judgements of quantity (protoquantities), and numerical
quantification of amount. The present estimation study was designed with this transition
in mind, to begin investigation (continued in the measurement study) of the question
How well do children understand that a number may express an amount? This was
done in the following way. While the comparisons that children were asked to make
continued to be qualitative (being ordinal comparisons of shorter/longer/same), they
were now asked to make most of these estimates in relation to a given number of cubes,
a given number of unnamed units, or a given number of centimetres on a ruler or tape.
Thus number was introduced for the first time in this research. Here, although
comparison of two numerical quantities was not required, it was of interest to see
whether the introduction of units in itself presented any difficulty. Children's
comparisons with the unmarked strip of card (no units) provided the required contrast.
Miller (1989) and Piaget and colleagues (1960) had demonstrated a difficulty involving
children's judgement of qualitative amount. They had shown that children did not
necessarily conserve amount when a quantity of material was divided into several
pieces. Additionally, there had been speculation that children might have conceptual
difficulties with the notion that a continuous length could be split into separate pieces
and yet continue to be constitutive of the same continuous length (Piaget et al., 1960)
or, conversely, (and more broadly) that a single aggregate consists simultaneously of the
items that make it up (Lamon, 1996). The requirement in the present research to use
comparators that separated units of length (the cubes) on the one hand and that
subdivided continuous units of length (on the ruler and tape measure) on the other
163

presented children with concrete examples of this paradox, and it was of interest to see
whether there would be any differences in success levels when using these comparators.
So three of the comparators (the cubes, the ruler and the tape measure) were intended to
suggest these areas of potential difficulty, while two (the unmarked strip of card, and
the strip marked at 1 cm intervals with no subdivisions) were free of them. The
unmarked strip of card made no use of units at all. (Children were simply asked to say
whether a given line was longer, shorter, or about the same length as the entire strip).
The strip of card marked and numbered at 1 cm intervals embodied continuous but un-
named units that were not subdivided. The collection of 1 cm wooden cubes constituted
individual units that had to be conceptualised as a continuous length before a valid
estimate could be made. Finally the ruler and tape measure, both marked with
centimetres subdivided into millimetres, showed continuous, subdivided, named units. It
was of interest to see whether, when the length of a line was estimated against
comparators that did not differ among themselves in length, but did differ in the respects
described, children would perform worse with some than with others.
Comparing estimation and measurement
When children had estimated the length of a set of lines in relation to the five
comparators listed above, they were asked to use three of these devices (the cubes, the
ruler and the tape measure) to measure nine of the lines. These three devices preserved
the key differences regarding separation, continuity and subdivision discussed above;
they were reduced to three (along with the reduction in the number of lines) because the
measurement task was laborious and there was a concern to maintain children's interest
and concentration.
The use of comparators as measuring devices enabled direct comparison of the
children's estimation and measurement skills. It also provided the possibility of
eliminating certain variables from examination of their measuring ability. Thus if the
differing features of cubes, ruler and tape measure had no effect on children's success
when used in estimating, then any differences according to these devices when they
were used for measurement could be ascribed to their characteristics specifically as
measuring devices.
The type of questioning used in the estimation study (whether a line was longer, shorter,
or the same length) was retained for part of the measurement task and had two
advantages. Firstly it facilitated comparison of the outcome of the tasks, since an
important independent variable was retained. Secondly, it was intended to recall the
164

type of language likely to be familiar from the home setting (where measurement was to
do with affordances), and measurement in this setting had been shown (in the first
interview) to engage children's interest.
5.2 Method
5.2.1 Sample
Seventy-six of the children who were involved in all other aspects of the research
participated, twenty-five children in Year 1; twenty-three in Year 2 and twenty-eight in
Year 3.
5.2.2 Materials
Lines
The twenty-one lines whose lengths were estimated constituted three sets of seven: one
set of lines that were overall rather 'short' (coloured red), one set of lines of 'medium'
length (coloured purple), and one set of 'long' lines (coloured black). The lines in each
set varied in length around a 'reference' line; all other lines in that set were either
shorter or longer than this reference line (Table 5.02).
The reference line in each set was equal in length to the comparators for that set. So the
reference line in the 'short' set was 5 cm long, and children were asked to estimate the
length of the lines in that set by comparison with a) an unmarked strip of card 5 cm
long, b) 5 x 1 cm cubes; c) 5 units on the marked strip; and d) and e) 5 cm on the ruler
and tape measure. (Thus the correct estimate of ordinal length when the reference line
was compared with one of these comparators would be the same. Correct estimates for
the other lines in the set would be either shorter or longer). The reference line and
comparators for the 'medium' and 'long' sets of lines were respectively 12 cm and 19
cm long.
In each set, the six lines either longer or shorter than the reference line varied
proportionately to it and were shorter than the reference line by approximately 6% (line
3), 30% (line 2) and 60% (line 1); and longer than it by approximately 4% (line 5), 40%
(line 6) and 60% (line 7). The actual length of the lines is set out in Table 5.02. They
were of 0.5 cm width and each was presented on a separate sheet of A4 white card. As a
factor in the design, these sets of lines are referred to as set hereafter. Line length is
referred to as length.
165

Comparators
1. Three strips of blue card 2 cm x 30 cm long, on each of which the central portion
(with which children compared the length of lines) was black. On each strip the black
portion was of equal length to the reference line in one of the three sets. Thus the
lengths of the black portions were 5cm (for comparison with the set of red lines), 12 cm
(for the purple set) and 19 cm (for the black set).
2. A collection of 1 cm3 wooden cubes
3. A strip of white card 4cm wide x 30 cm long, marked and numbered at 1 cm intervals
(but not marked 'cm')
4. The conventional 30 cm transparent plastic cm and mm ruler commonly used in the
school where the research took place, used in the second interview, and described
briefly in Chapter 3. The full dimensions of the ruler were 3.6 x 31 cm. Divisions of 1
cm, '/2 cm and 1 mm were marked on one edge (marks extended respectively 6 mm, 4
mm and 3 mm from the edge). Only cm were numbered. On the other edge, the pattern
of markings was identical. Ten-millimetre divisions extended 6 mm from the edge of
the ruler and were numbered 10 to 300; 5 mm (un-numbered) divisions extended 4 mm
from the edge, and 1 mm (un-numbered) divisions 3 mm from the edge. The 0 cm mark
occurred 7 mm from the end of the ruler at which the centimetre numbering began; the
300 mm mark appeared at the same end on the opposite edge. The 0 mm and 30 cm
marks occurred 5 cm from the end of the ruler where the millimetre numbering began.
The marks and numbering together extended to a depth of 1 cm across the face of the
ruler on each edge. The letters 'cm' were printed below the first centimetre space, and
`rum' below the first millimetre space on their respective sides of the ruler.
5. A fibreglass centimetre-and-inch dressmaker's tape measure, also used in the second
interview, and described briefly in Chapter 3. Cm were displayed on one face, and
inches on the other. Only the centimetre face of the tape was used for estimation and
measurement. The full dimensions of the tape were 152.4 cm x 1 cm. The last marked
cm units were 150 cm. One-centimetre divisions extended the full width of the tape,
except for a central space printed with the relevant number of cm. Half-centimetre
divisions (extending 5mm from one edge) and one-millimetre divisions (extending 3mm
from the same edge) were marked but not numbered. The numbers were correctly
positioned for reading when the tape was perpendicular to the reader. The zero position
was at the extremity of the tape. A semi-circular stud sealed the tape fabric at both ends
of the tape. The words and letters DEAN, FIBREGLASS TAPE, MADE IN
166

ENGLAND and CM were printed near the start of the tape. A summary of key features
of the comparators is set out in Table 5.01.
Table 5.01 Comparators in relation to which the lengths of lines were estimated
Comparator Characteristics A plain, unmarked strip No units — undivided length A number of lcm wooden cubes Separated and un-numbered units A cardboard strip marked and numbered at 1 cm intervals, but not labelled 'cm'
Continuous units that were numbered, but not named. The units were not subdivided.
A ruler marked with cm and mm Continuous, subdivided, numbered and named units
A tape measure marked with cm and mm
Continuous, subdivided, numbered and named units
5.2.3 Procedure
Sessions were approximately 30 minutes long.
The experimenter verified the children's understanding of the terms definitely longer,
definitely shorter, and about the same length by presenting books of obviously different
lengths, or of similar lengths, in appropriate pairs before starting the tasks. No child
gave evidence of difficulty in understanding these terms when questioned about them in
this context. The experimenter then said Today we are going to estimate, that is, guess,
the length of some lines. We are going to use different things to estimate their length.
Here is the first thing [e.g. plain unmarked strip]. I am going to hold up some lines, one
at a time, and I want you to tell me whether the line is definitely longer, definitely
shorter, or about the same length as this strip.
The comparator was placed on the table in front of the child, where the child was free to
handle it. The experimenter then successively held up each of the seven lines in one set,
at the child's eye level and at a distance of approximately 80 cm from the child, asking
each time Is this line definitely longer, definitely shorter, or about the same? [as the
comparator given].
For example, for the red lines (reference line 5 cm long), a child was offered the plain
unmarked strip, 5 cm long, for comparison, one at a time, with each of the lines in the
set. The process of comparison was then repeated with the same set of lines but a fresh
comparator, the child being asked, successively, to select 5 cubes, find 5 units on the
marked strip, 5 cm on the ruler and 5 cm on the tape measure, and to compare the length
of each of the lines with that of the comparator. Each time the child was asked to say
whether a line was definitely longer, definitely shorter, or about the same length as the
167

given comparator (unmarked strip; a given number of cubes), or as a number of units
identified on the comparator (the 30 cm marked strip, the ruler or the tape measure).
Thus the experimenter said: Is the line definitely longer, definitely shorter, or about the
same length as 5 cubes? ...as 5 units on your strip? ...as 5 cm on the ruler? ...as 5 cm
on the tape measure?
All seven lines in a set (see Table 5.02) were presented for estimation of their length in
relation to one comparator, before moving to the next comparator.
The three sets of lines: red, purple and black, were presented one set at a time. The order
of presentation of the sets, and of the comparators, was systematically varied between
children, and the lines within a set were presented in random order for each child.
In the few cases where children, for the purposes of the comparison, were unable to
count out a prescribed number of cubes accurately, or identify and name one- or two-
digit numerals on other comparators, the experimenter performed this task on the child's
behalf. No special effort in relation to number was therefore required by the task. Most
children made 105 estimates.
5.2.4 Criteria used for assessing children's judgements
As well as correct responses that used phrases modelled by the experimenter's questions
(such as It's definitely longer), other responses that expressed acceptable estimates were
also scored correct. Criteria were carefully considered so as to accommodate the range
of expressions a child might use to express an acceptable judgement. Thus a child's
estimate of the length of line 1 or line 2 was considered correct if they said that these
lines were definitely shorter, shorter, or a bit shorter than the comparator. Their
estimate of line 3, which was much closer in length to (though still shorter than) the
reference line, was considered correct if they said this line was about the same or the
same as the comparator and also if they said it was definitely shorter, shorter or a bit
shorter. Their estimate of the length of the reference line, line 4, was considered correct
only if they said it was about the same or the same as the comparator. Line 5 was scored
correct if a child said either that this line was definitely longer, longer or a bit longer
than the comparator, or if they said it was about the same or the same. Estimates of lines
6 and 7 were considered correct if a child said it was definitely longer, longer, or a bit
longer than the comparator. Two per cent of responses used other formulations. These
were easily assimilated to one of the foregoing categories. These criteria are
summarised in the right-hand column of Table 5.02.
168

Table 5.02. Lines whose lengths were estimated
Length (cm)
Short (red) Medium (purple) Long (black) Acceptable judgments
against comparator
Line 1 2 5 7.6 definitely shorter shorter
a bit shorter Line 2 3 7 11.4
Line 3 4.75 11.5 18.5
definitely shorter shorter
a bit shorter same
about the same
Line 4 5 (reference) 12 (reference) 19 (reference) same
about the same
Line 5 5.3 12.7 20
definitely longer longer
a bit longer same
about the same
Line 6 6.5 15.6 24.5 definitely longer longer
a bit longer Line 7 8 19.2 29
Regular checks were made to ensure that the child was judging the length of the line,
and not that of the comparator; for example that a judgment of it's definitely shorter
referred to the shortness of the line relative to the comparator, and not to the shortness
of the comparator relative to the line. The check was made by saying, for example, Are
you saying the line is shorter, or the cubes?
5.3 Results
Missing data
Three children, for whom there was a large amount of missing data due to extended
absence from school, were removed from the analysis. The few remaining missing
observations occurred because of premature termination of a session due to school
demands and amounted to 38 missing observations out of 7980.
In a repeated measures design, analysis would result in the loss of an unacceptably large
amount of information in view of the small proportion of scores that the missing values
represented. Missing data were therefore substituted as follows. It was noted that for 22
169

of the missing values, 70% or more of values present for that item in that year-group
were the same. For a further 6 missing values, between 50% and 69% of values were
the same, and for the remaining 10 missing values, between 49% and 38% were the
same. In view of this, missing values were assigned the modal response for that
particular variable for that year-group.
Analysis of accuracy
Table 5.03 sets out means according to year-group, comparator, set and length. As
before, on account of the girl/boy imbalance in Year 2, a preliminary analysis of
variance included gender as a factor. There was no significant effect of gender, or
significant interaction of gender with any other factor, including year-group. Gender
was therefore excluded from further analysis.
Table 5.03 Mean (SD) percentage of correct estimates according to year-group, comparator, line set, and line length
All Year 1 Year 2 Year 3 Comparator Plain strip 81 (9) 77(9) 82 (8) 85 (7) Cubes 81 (11) 76 (11) 81 (13) 85 (9) Marked strip 83 (10) 79 (10) 84 (13) 85 (7) Ruler 81 (12) 78 (11) 80 (15) 86 (10) Tape measure 81 (11) 77(12) 80 (11) 86 (10) Set Red 79 (10) 74 (9) 80 (11) 83 (8) Purple 82 (10) 79 (10) 81 (10) 86 (8) Black 80 (9) 77 (10) 80 (9) 84 (9) Length Line 1 98 (4) 98 (3) 98 (5) 99 (2) Line 2 90 (10) 89 (12) 90 (10) 91 (9) Line 3 79 (17)
49 (24) 83 (19)
76 (21) 41 (21) 74 (21)
80 (14) 51 (29) 84 (21)
80 (15) 55 (20) 90 (12)
Line 4 Line 5 Line 6 79 (19) 74 (16) 76 (23) 85 (17) Line 7 93 (10) 88 (12) 91 (11) 98 (5)
N 76 25 23 28
Table 5.03 shows, for all comparators and all sets, high mean correct estimates by
children in all year-groups. There was no year-group in which children obtained less
than 74% of responses correct according to comparator or set, and standard deviations
indicate a rather narrow range of scores, except for line 4.
170

To determine whether accuracy of estimates varied according to these factors, a four-
way mixed analysis of variance was conducted with year-group as between-subjects
factor and comparator, set and length as within-subjects factors. The only factors for
which there were significant main effects were year-group F (2, 73) = 8.30, p = .001)
and length F (2.99, 218.17) = 86.13, p < .001).
Post hoc tests showed significantly better estimation by Year 3 children than by those in
Year 1 (p < .01).
Post hoc tests also showed that there were significantly more correct estimates of line 1
(the shortest) than of all other lines; and of line 7 (the longest) than of all other lines
except line 2. There were no significant differences between lines 3, 5 and 6, or
between line 5 and line 2. Line 4 (equal in length to the comparator) was judged
significantly worse than all other lines.
Although set was not significant overall, it was involved in an interaction with length F
(7.50, 547.7) = 10.28, p < .01) as well as in a three-way interaction with length and
year-group F (15.01, 547.7) = 1.83, p = .03). As there was a very small F ratio for the
latter interaction, and no interaction of year-group with any other factor, it was
considered likely that year-group made only a marginal contribution to these
interactions and so the involvement of year-group was not pursued.
Although type of comparator was not significant overall, there was a significant
interaction between comparator and length F (13.60, 992.5) = 3.04,p < .01).
Means plots were obtained to investigate the set-length and comparator-length
interactions (Figure 5.01).
171

6 7 1 2 3 4 5
5
a)
0 0 (f) a, 4 cr)
0 0 cn a)
","c5
0
3
t 0
6 7
(b) Mean proportion (%) of estimates* correct, according to line length and comparator
3.00
0 0_ 2.00
0 2 a.
1.00
2 3 4 5
- plain
cubes
▪ marked
- ruler
tape
Figure 5.01 (a) Mean proportion (%) of estimates* correct, according to line length and set.
0
Length (1 = shortest)
▪ short (red)
-s- medium (purple)
—lb- long (black)
Length (1 = shortest)
Note: *out of five estimates
Figure 5.01(a) shows that while scores for the purple and black sets were progressively
lower for each of lines 1, 2 and 3, scores for the red set fell for line 2 and then rose
sharply for line 3. Further, scores for the red set ranked highest for lines 1, 3 and 4, but
ranked lowest for line 5. This is the most likely explanation for the interaction between
length and set. In the scores for each comparator, shown in 5.01(b), there was a
tendency, from line 1 to line 7, for scores that were initially higher to become
progressively lower in the rank order, best illustrated by the line indicating the score for
172

ruler. These two interactions made only a minor contribution to the overall picture
regarding children's estimates and were therefore not further considered.
Dealing with the latitude allowed in criteria for correctness
Lines 3, 4 and 5 in each set were close to each other in length, and it was expected that
of the alternatives offered the most likely estimate for all of them would be about the
same (i.e. about the same length as the comparator). However, line 3 was actually
slightly shorter, and line 5 slightly longer than their comparator (Table 5.02), so that
estimates of shorter and longer respectively were also counted as correct responses.
Because it was considered important to assess children's ability to judge equality of
length, responses accepted for line 4 were restricted to same and about the same. While
reasonable in essence, this strategy resulted in broader success criteria for lines 3 and 5
than for line 4, and could have contributed to the lower level of success in judging line
4.
The analysis of variance was therefore re-run a) with lines 3 and 5 excluded, and b)
separately for lines 3 and 5. As in the full analysis, reported above, there was no main
effect of comparator, and none of set, when lines 3 and 5 were excluded. In the separate
analysis of lines 3 and 5 there was a main effect for set (F (2, 139.9) = 6.36 p < .01);
judgements were significantly better for the red (short) set. In both a) and b), as before,
Year 3 children did significantly better than those in Year 1 (for a), F (2, 73) = 7.34, p <
.01); for b) F (2, 73) = 5.50, p < .01).
The comparative lack of success with line 4 was further investigated by looking at the
nature of the errors made by a fifty per cent sample of each year-group. Among the
errors of children in Year 1 the proportions of judgements of shorter and longer were
equal. Among children in Years 2 and 3, however, there were more than twice as many
judgements of longer than of shorter.
5.4 Discussion
This type of estimation task had two key features. The first was that comparator and line
compared were both physically present, and there was no need to make use of mental
representations of length. This contrasted, for example, with Petitto's (1990) numberline
studies, where children had to retrieve representations of sequence or proportions before
they could make a judgement. The second was that children were not asked to quantify
their comparisons, and were simply asked to say whether they thought lines were
173

definitely longer, definitely shorter, or about the same length as their comparators.
Clearly in these circumstances, these children were good estimators, even at five years
old. Success increased with age, but all year-groups attained a high proportion of correct
responses. There was no evidence of any differences in performance according to
gender.
In the introduction to this chapter it was recalled that in the home context (on the
evidence of the first interview) children typically encountered measurement of length as
the estimation or calculation of affordances: of the fit of an object to the space available.
Children were legitimate peripheral participators (Lave & Wenger, 1991) in these
activities or interested observers of them (in the double sense that the activities were
interesting, and that the children themselves often had a stake in the outcome) and it
was argued that these factors might contribute to an early aptitude for visual estimation
of relative length. The main finding of the current chapter is congruent with this
proposal, as well as with indications, also mentioned in the introduction, in the
developmental literature (Feigenson et al., 2004; 2002, Resnick, 1992; Bryant, 1974).
There was slight evidence of variation in success with different comparators, but no
overall difference according to comparator. In general terms this suggested that ability
to judge relative length, in this case in the face of a number of distractors presented by
physical differences between comparators, was very robust at the ages studied. More
particularly, the features of comparators that had been selected to suggest difficulties
that might be encountered when children contemplated units (separation, continuity and
subdivision) proved no stumbling block, that is, the mere appearance of these features,
in a non-measurement context, did not in itself confuse children. Nor, in itself, did the
introduction of number: performance with the cubes, ruler and tape measure, where
specific numbers of cubes or of cm were used in comparisons, was not significantly
worse than it was with the unmarked strip. These findings partially address the theme at
the end of Chapter 1 that is labelled 'mapping number on to quantity', where it was
noted that some authors saw a natural transition from qualitative comparisons of length
to comparisons involving units (Lamon, 1996; Resnick and Singer, 1993; Petitto, 1990)
facilitated by the development of counting, while Miller (1989) expected the counting
procedure, by its very dominance, to lead children astray when applied to continuous
quantities. Although measurement itself was not involved, the results reported in this
chapter, as far as they went, were consistent with the former view.
174

There was overall no significant difference in performance according to set, that is,
according to the absolute length of the lines judged. This accords with the early findings
of Bryant (1974) regarding the comparative ease for both children and adults of making
relative as opposed to absolute judgements of size, and is a particularly striking example
of it. The length of the three 'reference' lines for the red, purple and black sets differed
from set to set by seven cm, and within sets, the longest and shortest lines differed from
the reference line by as little as 3 cm (red set) and as much as 10 cm or more (black set).
While children saw, therefore, a very wide range of lines as regards absolute length,
good judgement of their relative lengths remained constant.
Performance did differ significantly according to the ratio of the length of lines to the
length of their comparator. There were significantly more correct estimates of line 1 (the
shortest in each set) than of all other lines; and of line 7 (the longest in each set) than of
all other lines except line 2. There were no significant differences among line 3, line 5
(in every set the two closest in length to the comparator) and line 6, and none between
line 5 and line 2. Line 4 (equal in length to the comparator) was judged significantly
worse than all other lines.
The overall picture is that there was a gradual improvement as the difference in length
between line and comparator increased. The lines that were furthest in length from the
comparator (lines 1 and 7 in every set) were the easiest to estimate correctly (with the
exception that there was no significant difference between line 2 and line 7)
undoubtedly due to the much greater discriminability of lines 1 and 7 from the
comparator (Ross, 1997). The degree of success for lines that were second most distant
from the comparator (lines 2 and & 6) 'overlapped' to some extent with that for lines
that were closest to it (lines 3 and 5), but overall, the same picture held. The overlap is
consistent with the 'accumulator' model of the mental representation of numbers as
continuous magnitudes (see 1.3.1), in which the representation is dependent on
discrimination of 'signal' from 'noise'. Siegler & Opfer (2003) point out that as
magnitudes approach each other in size, there will be overlap, and discrimination will
be harder. This model seems to fit the continuous magnitudes presented by the lines
used in the present research rather well, and if discriminative capacity, as evidence
seems to show, develops in early infancy, it would help to account for the high degree
of success in estimation shown by the children in the present study.
175

The line (line 4) that was exactly the same length as the comparator proved hardest for
children to judge correctly, with less than 50% success overall. This was not surprising,
since in this case there was no difference to discriminate. In fact it represented the same
kind of absolute judgement required of children by Lawrenson & Bryant (1972) and
found by them to be poorly performed. The type of error made when judging line 4 in
the present research was investigated, and while children in Year 1 were found to judge
this line to be shorter than its comparator just as often as they judged it to be longer,
children in Years 2 and 3 made twice as many erroneous judgements of longer than of
shorter. Perhaps, in the absence of a discriminable difference, a general positive bias in
favour of larger quantities was at work (Haylock and Cockburn, 1989) although there
was no sign of this among the findings reported in the previous chapter, and no
particular reason why this should be evident only among older children.
Given the high degree of overall success irrespective of comparator or of absolute
length of lines, together with the differences found according to length of line, we can
summarise children's performance on this estimation task as both robust and nuanced.
Differences among comparators made no overall difference to children's success in
estimating. We may therefore be confident that any differences according to comparator
when these were used as measuring devices could be ascribed to their characteristics
specifically as measuring devices. It is to the measurement tasks that we now turn.
176

Chapter 6
Measurement
6.1 Introduction
The analysis of children's visual estimation performance using all seven lines in each
set (twenty-one lines in all) is considered to have given a thorough, substantial picture
of children's estimation ability from 5 to 8 years old in the population and in the tasks
studied. It was found that that the children were good estimators, and that their success
did not differ significantly according to the type of comparator against which length of
lines was estimated, or, overall, according to the absolute length of those lines (that is,
according to whether the lines belonged to the 'short', 'medium' or 'long' set). It did
differ according to length of line relative to the comparator within sets. Since
differences among comparators had made no overall difference to children's success in
estimating, any differences according to comparators when these were used as
measuring devices could be ascribed to their characteristics specifically as measuring
devices. Do differences among measuring tools affect ability to measure? Is there any
evidence from children's handling of different devices that they consider units that are
physically separate and units that form a continuous scale to be incommensurable? Do
children falter when confronted with subdivided units? The materials children used in
the measuring tasks were designed to investigate these questions.
Careful thought was given to the type of measurement task employed. The research
already reported showed that children had much more to say about their experience of
measurement outside school than within school, and their recall of the former was much
more vivid and personal. The measurement tasks were designed to make sense to
children in the light of this out-of-school experience, the character of which had been
broadly apparent in piloting. Thus in measuring up for floor or wall covering, a person
may measure with a tape (in conventional units) the length, height or width to be
covered, and then measure in the same way the available covering material. If this work
is done collaboratively, one person may measure the space to be covered and announce
the number of units that represent the height, length or width, while another measures
the available material and announces the degree of fit (too short, too long, or just right).
The three-part task given to the children was designed to suggest some of these features.
Thus the experimenter asked the children a) to measure a line with the device supplied.
Next they were asked b) whether that line was longer, shorter, or the same length as a
177

given number of units. Here the children had to compare their measurement with the
number of units mentioned. This task, therefore, investigated how well children
understood that a number (of units) may express an amount. The number used was that
of the 'reference' length used in the estimation tasks — five, twelve or nineteen units —
associated respectively with the red, purple and black set of lines. (The procedure is
more fully described below). Finally c), the children were asked, as an absolute
judgement, how long the line actually was.
So children were asked to make both a numerical measurement and a comparison.
Conceptually, when a child had measured a line, and the experimenter asked, Is that
shorter, longer, or the same length as (say) 12 cm? the question tested understanding
that ordinal judgement (shorter, longer or same) was logically implied by a statement of
length measured in units. The comparison thus examined one aspect of the application
of number to quantity embedded in measurement practices.
Measurements were deliberately limited in number because it was clear that a more
extensive series would exhaust some children, as measuring demands more time and
persistence than estimation. Of the twenty-one lines whose length was estimated, nine
were measured and of the five comparators used in estimation, three were selected as
measuring devices. Thus nine lines were measured with each of three devices, making
twenty-seven measurements in all (Table 6.01).
The lines selected for measurement were lines 3, 4 and 5 (those that were closest to each
other in length) in each of the three sets. The numerical lengths of five of these nine
lines included fractional units (Table 6.01) and required children to deal with the
subdivision of units in an immediate and practical way. Of the five comparators used in
estimation, the cubes, the ruler and the tape measure were selected as measuring
devices. Between them, these three devices embodied all the areas of potential difficulty
that were of special interest in this research. The cubes constituted separated,
unnumbered units, while the units shown on the ruler and tape measure were numbered,
continuous and sub-divided. These specific devices were chosen, too, because each was
known (on the evidence of what children said at interview and of information from their
teachers) to be familiar to the children as an everyday item either at home or at school,
and (on the same evidence) most children had handled and manipulated cubes and rulers
and some had used tape measures. However, familiarity does not necessarily lead to
expertise. Each device needed to be handled and interpreted differently both because
they were physically different, and because they represented units in different ways. It
178

was anticipated, therefore, that when children came to use comparators as measuring
devices, there would indeed be significant differences according to the device used.
It was expected that competent handling of the devices would become harder as line
length increased, so that there would be an effect of set, and 'long' lines (black set)
would be harder to measure than 'short' lines (red set).
It was also expected that there would be a general improvement with increasing age.
Children in Years 2 and 3 were expected to be more successful overall than those in
Year 1. The latter were comparatively inexperienced in measuring with the ruler and
tape measure, and although their teacher indicated that they had used a number of
different non-conventional units for measurement including cubes, these young children
were expected to have difficulty in manipulating 1 cm cubes, which were rather small.
Better success was expected in Years 2 and 3 due to these older children's greater
experience in measuring in school, and their likely greater experience in measuring out
of school.
Table 6.01 The lines within each set used for the measurement tasks.
Length (cm)
Short (red set)
Medium (purple
set)
Long (black set)
Line 3
4.75 1 1.5 18.5
Line 4
5 (reference)
12 (reference)
19 (reference)
Line 5
5.3 12.7 20
6.2 Method
6.2.1 Sample
Seventy-six of the children who were involved in all other aspects of the research
participated, twenty-five children in Year 1; twenty-three in Year 2 and twenty-eight in
Year 3.
179

6.2.2 Materials
The collection of wooden 1 cm cubes, the 30cm ruler and the tape measure that were
used in the estimation task were used as measuring devices.
On the ruler, the edge to which the children were directed was marked in cm, half cm
and mm, with cm marks numbered. (Millimetres were numbered in tens on the other
edge.) The scale began 0.5 cm from the end of the ruler. Numbers on the ruler were
correctly oriented for reading when the ruler was horizontal with respect to the reader.
The face of the tape measure to which the children were directed was marked, as the
ruler was, with cm and mm, with cm numbered. Here, the numbers were correctly
oriented for reading when the tape was vertical with respect to the reader. The scale
began at the end of the tape. (The reverse face of the tape was marked in inches and
eighths of inches). Further details of the ruler and tape were given in Chapter 5.
The 'reference' line in each set (line 4), together with the line next shortest (line 3), and
the line next longest to it (line 5) (see Table 6.01) were measured. Each line was
presented to the child horizontally, as before, on a sheet of A4 card.
Written records were kept of children's measurements and of the ways in which they
deployed measuring devices.
6.2.3 Procedure
The same seating arrangements in the school library were observed as for all other
tasks. Measurement followed on from the estimation tasks and were, as previously
stated, about 40 minutes in length.
The children were asked to measure all three lines in all three sets with all three devices.
Thus each child made nine measurements with each device. The children received the
sets in a random order. Within each set, lines 3, 4 and 5 were randomly presented,
randomisation being achieved for both set and line by shuffling the cards used. The
order of the measuring devices was also randomised, this time by blind selection of the
word 'cubes', 'ruler', or 'tape' printed on a sheet of paper.
After the child had completed the estimation task, the experimenter handed to the child
one of the cards with a line on it and said Can you measure this line for me now,
please? and offered the ruler, the tape measure or a collection of cubes. After the child
had measured a line with the device, the experimenter asked Is the line longer, shorter,
or the same length? [as the appropriate 'reference' length in units].
180

For example, the experimenter gave the child a collection of cubes that was greater than
twelve and asked Is the line longer, shorter, or the same length as twelve cubes?
(Twelve cubes were the 'reference' length for the purple set; five and nineteen cubes,
respectively, for the red and black sets.) If the child miscounted, the experimenter
supplied the right number of cubes, but did nothing further to help: the children
arranged the cubes for measurement as they saw fit. If the ruler or tape was being used
the experimenter asked Is the line longer than 12 cm, shorter than 12 cm, or 12 cm
long? If the child had difficulty in identifying 12 cm on the ruler or tape, the
experimenter located the mark for them, but again did nothing further. The number of
cm mentioned was changed to five or nineteen as appropriate for the red and black sets.
The child's response to the question was recorded in writing. The experimenter then
asked How long is it [the line]? The response was similarly recorded. Ways in which
measuring devices were deployed were also noted in writing.
Children were asked to report comparisons and numerical measurements. Their report
was recorded for each measurement.
6.2.4 Analysis of results
In all analyses, correct responses were totalled across the twenty-seven measurements,
and subdivisions of the total were used for finer-grained analysis.
Reporting of the analysis follows the order in which the measurement procedure was
carried out by the children, that is, 1. physically measuring a line; 2. saying whether the
line was shorter, longer, or the same length as the number of units mentioned by the
researcher; 3. stating the absolute length of the line. Accordingly the three parts of the
analysis concern:
1. The correctness of positioning of the measuring devices
2. The correctness of comparisons
3. The correctness of numerical measurement
Positioning of the measuring devices
Children were scored on their alignment of the measuring device with the appropriate
end of the line to be measured. Correct alignment required that the zero position on the
scale (ruler, tape), or the placing of the outer edge of the first cube, coincided with the
181

end of the line. Also recorded were additional aspects of the deployment of devices that
were considered relevant to the errors in measurement that children made.
Comparisons
A child's response that a line was shorter, longer or the same length as the number of
units mentioned by the experimenter was termed their comparison because they
compared their own numerical measurement with a number of units given orally by the
experimenter (a relative judgement).
Numerical measurement
After they had measured a line and had made their comparison, children were asked
how long the line actually was. Their response to this question was termed their
numerical measurement (an absolute judgement). A numerical measurement was
scored correct if it was accurate to within 2.5 mm of the actual length of the line. This
was considered a reasonable degree of tolerance given the age of the children, and had
the advantage of being able to accommodate phrases incorporating the term quarter (2.5
mm being equal to 1/4 cm), since quarter (as well as half) are commonly used by many
children to express fractional units. Success with this task required a number of abilities
including the reading of the scale and the taking into account of fractional units.
An example
A child measuring the 4.75 cm line from the 1 cm mark on the ruler or tape, and
reporting the line length as 5.75 cm (or five and three-quarters cm), would be scored
incorrect for numerical measurement and incorrect for positioning the device with
respect to the starting point for measurement. They would, however, be scored correct
on their comparison if they said that the line they had measured as 5.75 cm was longer
than the five units mentioned by the experimenter. Thus correctness of the comparison
was based on the measurement they made, rather than on the actual length of the line.
Factor structure
As explained above, of the seven lines in each set used in the estimation tasks, only the
three 'central' lines in each set were used for the measurement tasks. While the twenty-
one lines used in the estimation tasks had overlapped in length between sets (for
example black lines 1 and 2 were shorter than purple lines 3 to 7, (see Table 5.02) there
were no overlaps among the nine lines retained, and the sets to which they belonged
now became 'islands', the differences between sets being much more marked. Moreover
the three lines retained in each set were very close in length (within a set, no difference
182

was greater than 1 cm). Thus, while the remaining lines within each set differed enough
to provide different measurement tasks, the major differences in line length became
those between the three sets. In these circumstances, it was decided to discard 'line' as a
factor in the analysis of variance, so that two within-subjects factors remained: device
and set.
Additional data collected: acknowledgement of fractional units
One of the hypotheses of this research was that children would have difficulties with the
notion that units of length can be subdivided. Each standard line and just one other (that
of 20 cm) were a whole number of units (cm) in length (Table 6.01). All other lines
embodied fractional units and were used to investigate the children's manner of
reporting, or failing to report, incomplete units. Where children acknowledged
fractional units, a record was kept of the ways in which they did so. (see Appendix 3).
6.3 Results
6.3.1 Missing data
The same three children who had been removed from the Estimation analysis due to a
large amount of missing data were removed from the Measurement analysis. Missing
Measurement data after this amounted a total 54 out of 2052 observations, again due to
premature termination of a session due to school demands. To avoid further loss of data
in a repeated measures design, these missing values were replaced. A random allocation
procedure was used in a manner that preserved the proportion of correct and incorrect
judgements for the variable, within the year-group for which they were missing. In the
majority of cases, this was a single substitution within a variable within one year-group.
In total there was only one occasion where as many as four substitutions were made.
Thus the substitutions are unlikely to have introduced significant differences into the
results.
6.3.2 Understanding of the term 'measure'
Four children asked what was meant, or appeared not to know what to do, when asked
to measure a line. These were all in Year 1. The children were given appropriate
guidance.
6.3.3 Preliminary analyses
As before, on account of the girl/boy imbalance in Year 2, gender was initially included
as a variable in all three analyses of variance (positioning the device; the comparisons;
183

and numerical measurement) but, as before, produced no main effect or interaction with
any other factor including year-group, and so was excluded from all further analyses.
6.3.4 Positioning the device
How children handled the devices in making their measurements went a long way
towards explaining their degree of success in measuring, as well as providing
information about their understanding of the way in which units were embodied and
represented in the different devices. The most important decision children had to make
concerned the positioning of the measuring device in relation to the line to be measured,
and the most important aspect of that was whether or not (cubes), the first cube was
aligned with the end of the line to be measured, and (ruler and tape) whether or not the
zero mark was so aligned. There were other important aspects of positioning. In the case
of measurement with cubes, it was necessary to remove gaps in the line of cubes, to
ensure that the line of cubes was straight, and to make sure that if the cubes shifted as
they were laid, compensating adjustments were made to maintain correct alignment. In
the case of both cubes and tape, it was necessary that children had a clear view of the
line to be measured, and did not obscure their own view, for example by covering the
line with the measuring device so that the full length of the line was not visible to them
when the measurement was made. (The ruler was transparent, so in this case it did not
matter if the line was covered).
What the children did in respect of the starting point of their measurement is reported
first. Whether gaps were closed and correct maintenance of a straight line of cubes was
attempted is reported next. Finally, whether the full length of the line measured was
visible to the child when they declared their measurement is reported.
Table 6.02 and Figure 6.01 show the mean proportion of measurements (out of 27)
where children used the correct starting point on the measuring device. Overall the
children made a poor selection of starting point, except when measuring with cubes.
184

Table 6.02 Mean (SD) proportion (%) of measurements where children used the correct starting point on the measuring device.
Year 1
Year 2
Year 3
All years
Measuring device
13 47 61 40 Ruler (21) (37) (36) (38)
29 31 31 30 Tape measure (32) (32) (32) (31)
79 90 88 86 Cubes (25) (10) (16) (19)
All correct 40 56 60 52 starting points (17) (19) (19) (20)
N 25 23 28 76
Figure 6.01. Mean proportion (%) of measurements where children used the correct starting point on the measuring device.
100
c 80 .o_ 0_
60 t "rn O 40 0
0
20
2 0
Year 1 Year 2 Year 3
•
-U- ruler -0- tape -A- cubes
Note. Error bars to show SD arc not provided because their overlapping heights would have confused the figure.
In all year-groups the correct starting point was much more likely to be selected for
cubes (in approximately 80% to 90% of measurements) than when using the tape
measure (approximately 30% of measurements) or ruler (13% to 61% of
185

measurements). Table 6.02 and Figure 6.01 indicate little difference between year-
groups for cubes and tape, but more use of correct starting points for the ruler in each
successive year-group. Large standard deviations, especially for ruler and tape measure,
indicate that individual children differed widely in their degree of correct use of starting
points.
A two-way analysis of variance had year-group and measuring device as factors.
Significant main effects were found for year-group (F (2, 73) = 9.28, p < .001) and
device (F (1.9, 138.92) = 96.13, p < .001) and there was a significant interaction
between them (F 4, 138.92) = 6.38, p < .001).
Post hoc tests showed that overall, children in Year 2 and Year 3 selected correct
starting points significantly more often than children in Year 1 (p < .01) with no
significant difference between children in Years 2 and 3. The tests also confirmed that,
overall, there were significantly more correct starting points using the cubes than the
ruler or tape measure (p <. 01), with no significant difference between ruler and tape.
The significant interaction between device and year-group was accounted for (Figure
6.01) by the very poor selection of correct starting point on the ruler by Year 1 and the
comparatively much better performance by Year 3. Differences between year-groups for
the other two devices were not so marked.
Separate analyses of variance for each year-group (Year 1 (F (2, 48) = 49.78, p <.001);
Year 2 (F (2, 44) = 29.37, p <.001); Year 3 (F (2, 54) = 31.87, p <.001)) confirmed that
when measuring with the cubes Year 1 and Year 2 children used significantly more
correct starting points than with the ruler and tape (p <.01), with no significant
difference between ruler and tape. Year 3 children were most likely to select the correct
starting point when using the cubes, and least likely to do so when using the tape. For
Year 3 there were significant differences among all three devices (p < .01). Separate
analyses of variance for each device (ruler (F (2, 73) = 6.25, p <.001); tape (F (2, 73) =
.09, NS); cubes (F (2, 73) = 3.33, p = .04) and post hoc tests showed that when using the
ruler, Year 2 and Year 3 children selected the correct starting point significantly more
often than those in Year 1 (p < .01). When using the cubes, Year 2 selected the correct
starting point significantly more often than Year 1 (p = .04) with no other significant
differences. There were no significant differences among year-groups for starting points
with the tape.
186
6.3.4.1 Consistency of use of correct starting points
Even when children used the correct starting point, very few did so consistently except
when using the cubes. Half the children in Years 2 and 3 always aligned the first cube
correctly, and almost all did so in more than fifty per cent of the measurements. Even in
Year 1, more than one third of the children always aligned the first cube correctly.
Performance with the ruler was much worse. More than half the children in Year 1
never aligned the ruler correctly, and only five did so in more than one tenth of their
measurements. In Year 2, there was a much more even spread among children of
degrees of consistency in correct alignment of the ruler. Three children never used the
correct starting point, four always did so, and the remainder of the children were more
or less evenly distributed between these two extremes. In Year 3 there were five
children who never used the correct starting point with the ruler, but overall children
used a higher proportion of correct starting points than in Year 2. Year on year,
children used the ruler increasingly correctly, but even in Year 3, only five children
always did so.
In selecting the correct starting point for the tape measure, there was little difference
between the year-groups. Only three children in the whole sample always used the
correct starting point. Half the children in Year 3, almost half in Year 2 and over one-
third in Year 1 never used it. The remainder were, as with the ruler, fairly evenly spread
between the two extremes.
6.3.4.2 Predominant starting points
The children made nine measurements with the ruler and nine with the tape measure.
The main points from which children started their measure were (in addition to 0 cm,
the correct starting point) -0.5cm, 0.5 cm and 1 cm, but many used a variety of non-
typical starting points. In the case of children in Years 2 and 3, these were often poor
alignments where children were two or three millimetres off one of the typical starting
points. For children in Year 1 the use of a non-typical starting point usually reflected a
completely haphazard approach, with no detectable strategy, and many non-typical
starting points employed. In Years 2 and 3, for a given measurement, children typically
took up several starting points before settling on one, and in those year-groups both
initial and later starting points typically conformed to one of the predominant
categories. Thus a Year 2 or 3 child might start from 1 cm, move to 0 cm, and move
back to 1 cm before finally making their measurement. In all cases the last starting
point taken up was the one recorded.
187

Ruler
On the ruler, those who measured from -0.5 cm were in fact measuring from the very
end of the ruler: the scale began half a centimetre from the end of the device. Those
measuring from 0.5 cm began from the first of the prominent half-cm marks to be seen
along its edge. A variety of non-typical starting points were also used.
Consistency of starting point for all nine measurements with the ruler was very rare.
More than half the children in Year 1 measured from the end of the ruler (-0.5 cm) some
of the time. In roughly equal proportions, about 40% sometimes measured from the
correct starting point (0 cm), from the 0.5 cm mark and from the 1 cm mark. Ninety-two
per cent of children in Year 1 used other starting points some or all of the time.
More than one third of the children in Year 2 sometimes measured from the end of the
ruler, and a similar proportion also sometimes measured from the first half-cm mark.
Over half sometimes measured from the 1 cm mark. A majority (78%) sometimes
measured from the correct starting point; 48% did so most of the time. Sixty-five per
cent of children in Year 2 occasionally measured from other starting points.
In Year 3, only 14% of children ever measured from the end of the ruler (-0.5 cm), and
21% from the first half-cm mark. Sixty-four per cent sometimes measured from the
correct starting point, and half did so most of the time. Thirty-nine per cent occasionally
measured from other starting points.
Four children (one in each of Years 1 and 2 and two in Year 3) identified on the ruler
the number mentioned by the experimenter (5, 12 or 19) and used that as their starting
point.
Overall the number of children who sometimes used the correct starting point on the
ruler increased in successive year-groups.
Tape measure
Consistency of starting points using the tape measure was just as rare as it was with the
ruler. Around half the children in Years 1 and 3 — more (70%) in Year 2 - sometimes
used the 0.5 cm point on the tape to begin their measurement, but most of these did so
only occasionally. Measuring from -0.5 cm was infrequent, since the scale started from
the end of the tape; the three children who used this starting point placed the end of the
tape 0.5cm from the left-hand end of the line being measured.
188

When using the tape, fewer children than was the case with the ruler ever used the
correct starting point. Only one child in each year-group consistently did so, and there
was little difference among year-groups as to the number of children who sometimes
did so. In this, too, the tape differed from the ruler, where an increase from year to year
was discernible. With the tape, more than half the children in each year-group
sometimes measured from the 1 cm mark, and surprisingly, over one third of children in
Year 3 frequently or consistently did so.
Fifteen children, almost evenly divided across year-groups, sometimes measured from
the number (5, 12 or 19) mentioned by the experimenter. This was three times as many
as had done so when using the ruler.
Most children in Year 1, more than half in Year 2, and just over one-third in Year 3
measured from a variety of non-typical starting points with the tape measure. In the case
of many children in Year 1, this was visibly the result of unsuccessful attempts to bring
this long, loosely hanging, unwieldy device into sensible contact with the line to be
measured.
6.3.4.3 Measuring with cubes: other adjustments
For each measurement with cubes, Table 6.03 shows the number of children who, as
well as aligning the first cube correctly, removed any gaps in the line of cubes, ensured
that the line of cubes was straight, and sought to make compensating adjustments to
maintain correct alignment if the cubes shifted as they were laid. It can be seen that
although more than half the children in each year-group observed all these precautions
for the majority of their nine measurements with cubes, no more than five in any year-
group did so with complete consistency. In this, the older children were no better than
the younger overall.
Table 6.03 Number of children in each year-group making all necessary adjustments when measuring with cubes
Measurements In all nine In 5 to 8 In 1 to 4 In none N
Year 1 5 13 7 0 25 Year 2 3 17 3 0 23 Year 3 5 18 5 0 28
A two-way analysis of variance with year-group and cubes as factors showed (F (2,
146) = 10.03, p < .001) that when children measured lines in the red (shortest) set with
the cubes, they attempted all necessary adjustments significantly more often than when
189

they measured purple or black lines (i.e. those in the longer sets) (p < .001). There was
no main effect of year-group, but there was a significant interaction involving year-
group. Separate analyses for the three school years showed that children in Year 1 were
significantly more careful when they measured the red lines (they attempted to make all
necessary adjustments in 76% of measurements) than when they measured the purple
ones (all necessary adjustments attempted in 53% of measurements): (F (1.71, 141.1) =
4.87, p = .02). The same was true of Year 2. All necessary adjustments were attempted
in 89% of measurements of the red lines and 65% of the purple: (F (2, 44) = 4.15, p —
.02). Surprisingly, neither red nor purple differed significantly from black — the longest
lines — where children persisted in their efforts to make all the necessary adjustments in
71% of measurements (Year 1) and in 69% (Year 2). In Year 3, red lines were again the
most carefully measured, but here the significant differences (F (2, 54) = 8.75, p = .001)
were between red (84% with all adjustments made) and black (51%) (p = .002); and
between purple (77%) and black (p = .01). Thus the longest lines were least carefully
measured in Year 3. However, large standard deviations in all year-groups for black
lines indicated that different children persisted to different degrees.
6.3.4.4 Obscuring the line
A number of children partially or completely covered the line they were measuring with
the measuring device. In the case of the ruler, which was transparent, the line was still
visible, so that its full length could be seen. The cubes or tape were both wider than the
line they measured and children frequently completely obscured a line with them, so
that they could no longer see it. Sometimes this was avoided. Table 6.04 shows, for the
children in each year-group, the incidence of obscuring the line with the measuring
device.
In the case of cubes, these were often stacked on the line, rather than parallel to and in
contact with it. This did not indeed make accurate measurement impossible (it was
virtually impossible with the tape in these circumstances) but it made it difficult. The
child could not see whether the first cube laid had shifted from its alignment with the
left-hand end of the line, nor could they see by how much a cube overlapped at the other
end of the line without, in both cases, lifting and replacing cubes. This made adjustment
of the line of cubes more complicated and less successful than it need have been, and
judgements about equality or non-equality of length, more complicated and less reliable.
Table 6.04 shows that the majority of children deployed the cubes in such a way as to
create these difficulties, and that a similar number of children did so in each year-group.
190

Table 6.04 Number of children who obscured the line with the measuring device: incidence in each year-group
Children
Never
obscuring the Cubes
Sometimes
line to be measured
Always N
Year 1 6 9 10 25 Year 2 2 10 11 23 Year 3 5 13 10 28
Tape N Never Sometimes Always
Year 1 4 7 14 "")5
Year 2 20 2 1 23 Year 3 25 2 1 28
As for the tape, despite having carefully identified their chosen starting point on this
device, and aligned it often carefully with the left-hand end of the line to be measured,
children sometimes covered the line with the tape and had to peer under it to determine
the position of the other end of the line in relation to the scale. Sometimes they made a
guess. This behaviour was rare in Years 2 and 3, but common in Year 1, as Table 6.04
shows.
6.3.5 The comparisons
These were the child's report, after measuring a line, as to whether the line was longer,
shorter, or the same length as the 'reference' number of units mentioned by the
experimenter. This report was called the child's 'comparison' because they compared
their own numerical measurement with a number of units given orally by the
experimenter. Correctness of comparisons was thus judged on the basis of the
measurement made, rather than on the actual length of the line measured.
6.3.5.1 Analysis of accuracy of comparisons
The means of correct comparisons according to year-group, measuring device and set
were calculated and are shown in Table 6.05. Overall performance was poor, success
being in the region of 50% although children in Years 2 and 3 did rather better than this
with the ruler.
191

Table 6.05 Mean (SD) proportion (%) of correct comparisons made by children according to year-group, device and set.
Year 1 Year 2 Year 3 All years
Measuring device
Ruler 42 (23) 60 (28) 67 (30) 56 (29)
Tape measure 50 (25) 47 (24) 52 (28) 50 (26)
Cubes 42 (24) 45 (21) 47 (23) 45 (23)
Set
red 44 (20) 47 (26) 56 (28) 49 (26)
purple 45 (28) 50 (24) 53 (27) 50 (27)
black 45 (24) 55 (26) 57 (29) 52 (27)
All comparisons 44 (24) 51 (25) 55 (28) 50 (26)
N 25 23 28 76 Note: Each child made 27 comparisons.
A three-way analysis of variance with year-group, device and set as factors found
significant main effects of year-group (F (2,73) = 6.70; p < .001) and device (F (2,146)
= 8.06; p < .001) and a significant interaction between device and year-group (F (4,146)
= 3.83; p = .005). Post hoc tests showed children in Year 1 to be significantly less
successful in their comparisons than those in Years 2 and 3 (p = .03). They also showed
the comparisons to be significantly worse with the cubes than with the ruler (p = .001).
The interaction, as Figure 6.02 indicates, was explained by the fact that while Years 2
and 3 performed similarly, that is, much better with the ruler than with the cubes or
Figure 6.02 Correct comparisons: interaction between device and year-group
80 0 (I) C 0
.2 60 Q E 0 0 0 2 40 0 0 C
a)
2 20
Year 1
Year 2 Year 3
-11-- Cubes Ruler -A- Tape
192

tape, Year 1 children performed no better with the ruler than with the cubes, and rather
less well than with the tape. This picture was confirmed by analyses of variance
performed separately for the three year-groups, which showed no significant difference
among the devices for children in Year 1, while children in both Year 2 (F (2, 44 = 5.50;
p = .007) and Year 3 (F (2, 54 = 7.64; p = .001) made significantly more correct
comparisons when they used the ruler than when they used the tape or the cubes (p <
.05).
6.3.6 Numerical measurement
For each line, the numerical measurement each child actually reported was entered as
data in decimal notation. If the child's utterance was not wholly numerical but could
sensibly be interpreted in this way, such an interpretation was made. For example if,
having measured a line with the ruler, a child said five and two little lines, '5.2' was
entered. Where numerical interpretation was not straightforward - where, for example
the child said five and a bit — no numerical measurement was entered, and their
utterance was counted as an error (although a separate record of such non-numerical
acknowledgements of fractional units was kept). Cubes are non-subdivided units, and
the number of expressions available to children here to express fractional units
numerically was in practice limited to and a half or and a quarter or and three quarters
(recorded as .5, .25 and .75). If children declined to give a numerical measurement,
either replying, when asked how long the line was, that they did not know, or simply
reiterating that it was longer, shorter, or the same length as the number of units supplied
by the experimenter, a zero was entered and the response counted as an error.
Numerical measurements were counted as correct if a child reported a measurement
within 2.5 mm of the actual length of the line. Children were scored correct or incorrect
irrespective of their mention of units.
6.3.6.1 Analysis of correctness
Each child made twenty-seven numerical measurements. The data giving their
performance according to year-group, device and set are shown in Table 6.06.
On average, under one third of numerical measurements were correct by the 2.5 mm
criterion, ranging from 21% in Year 1 to 36% in Year 3 (Table 6.06). A three-way
analysis of variance with one between-subjects factor (year-group) and two within-
subjects factors (measuring device and set) was performed. There were significant main
effects for all three factors: year-group (F (2,73) = 7.88, p = .001); device (F
193

(1.87,136.3) = 13.15, p < .001) and set (F (2,146) = 11.10, p < .001). There was also a
significant interaction between device and set (F (4,4) = 2.47, p = .045). Post hoc tests
showed that Year 1 children made significantly fewer correct measurements than those
Table 6.06 Mean (SD) proportion (%) of correct numerical measurements made by children according to year-group, device and set.
Year 1 Year 2 Year 3 All Measuring device Ruler 24 (29) 43 (29) 52 (29) 40 (29) Tape measure 23 (20) 28 (20) 29 (20) 27 (20) Cubes 16 (16) 29 (15) 25 (15) 24 (16) Set red 26 (22) 36 (22) 41 (21) 34 (22) purple 17 (17) 27(17) 26 (16) 23 (17) black 20 (19) 37 (19) 40 (19) 32 (18) All numerical measurements 21 (14) 33 (14) 36 (14) 30 (18)
N 25 23 28 76 Note: Each child made 27 measurements.
in Year 2 (p = .02) and Year 3 (p < .001); and that significantly more correct
measurements were made with the ruler than with the tape or the cubes (p < .01 in both
cases), with no significant difference between tape and cubes. (This partly reflected the
findings for the comparisons, where overall performance was worse with the cubes than
the ruler.) Post hoc tests showed that the medium-length (purple) lines were
significantly worse measured than either the short (red) lines (p < .001) or the long
(black) ones (p = .001). Since the significant interaction between device and set had a
very small F ratio, it was considered that any interaction effect was likely to be
marginal, and was not further investigated.
6.3.6.2 Failure to report a numerical measurement
Among the numerical measurements recorded as incorrect were an overall average of
23% of responses where children did not give a numerical measurement when
requested, either repeating their previous response that the line was shorter, longer, or
the same length as the number of units mentioned by the experimenter, or saying that
they did not know how long it was. This proportion was smaller in each successive
year-group and was 35% in Year 1; 20% in Year 2 and 16% in Year 3. There were
194

significant differences (F (2,73) = 10.87, p < .001) between Year 1 and Year 2, and
between Year 1 and Year 3 (p < .01 in both cases).
6.3.6.3 Response to lines that embodied fractional units
A prediction of the research was that children would have difficulty in dealing with
fractional units. Each child measured fifteen lines that were not a whole number of units
long, and their reports of these measurements were expected to give evidence of such
difficulty.
When children ignored fractional units, they either reported whole numbers, or no
numerical measurement at all, simply reiterating that a line was shorter, longer, or the
same length as the number of units mentioned by the experimenter.
When children did acknowledge fractional units, they did so in a number of ways that
included mention of halves and quarters; mention of a number of units additional to cm,
sometimes implicitly, such as five and three (5cm and 3mm); numerical allusions to
subdivisions on the ruler and tape such as ...and two little lines or five points before
twelve; and expressions that could not be interpreted numerically, such as nearly six or
twelve and a bit. Sometimes an expression mixed these categories, such as four and a
half and two millimetres (see Appendix 3). Table 6.07 shows acknowledgment of
fractional units however acknowledged. It can be seen that that no child acknowledged
fractional units on more than twelve occasions out of a possible fifteen, while
approximately half the children in Years 2 and 3 did so less than fifty per cent of the
time. Only one child in Year 1 acknowledged fractional units on more than fifty per
cent of possible occasions, and more than half never acknowledged them.
Table 6.07 Number of children in each year-group acknowledging fractional units.
Year 13 to 15 8 to 12 1 to 7 None N
1 0 1 10 14 25
2 0 10 12 1 23
3 0 14 13 1 28
Total 0 25 35 16 76 Note: acknowledgements out of a possible 15
Evidence of adjustment of starting point
If children dislike dealing with fractional units, it is likely that they will take measures
to avoid having to do so. In the present research, where children using the ruler and tape
were often observed to make several changes of starting point before settling on one,
195

and where their final decisions represented a wide variety of starting points, it seemed a
reasonable hypothesis that a starting point might be selected with a view to avoiding
fractional units. To test this, an examination was made of the measurement of certain
lines. These were lines that involved fractional units, but would enable a whole number
of units to be reported if, when measuring, an adjustment of 0.5 cm were made from the
correct starting point. The result was compared with the outcome of measuring those
lines that also involved fractional units, but where a whole number would not be the
outcome if the half-centimetre adjustment were made. The half-centimetre adjustment
was chosen because as a fraction it was familiar to the children, and thus likely to attract
them, and because half-cm were easily visible on the ruler and tape.
Inspection of Table 6.01 shows that (a) if line 3 in the purple set and line 5 in the black
set were measured from -0.5 cm or from 0.5 cm on the ruler or tape, a whole number
could be reported (11 or 12 cm in the first case and 18 or 19 cm in the second). By
contrast, (b), if line 3 or line 5 in the red set, or line 5 in the purple set were measured
from -0.5 cm or from 0.5 cm, this would not enable a child to report a whole number.
(The total number of measurements in (a) and (b) above is therefore ten).
The number of starting points from -0.5 cm or from 0.5 cm for (a) and for (b) were
calculated. In Year 3, on average, 22% of children adjusted their starting point by half a
centimetre when this would allow them to report a whole number (a), compared with
13% when it would not (b). In Year 2 the averages were 26% and 13% respectively, and
in Year 1, 22% and 23%. The difference (calculated on counts of those children giving
the two responses for the ten measurements) was significant for Year 2 (t = 2.48, df = 8,
p = .04). These data provide some indication that in Years 2 and 3, some choice of
incorrect starting points may have been motivated by the desire to avoid fractional units.
This is supported by the very similar proportions for (a) and (b) in Year 1, where
children's very poor measurement performance would not suggest any strategy at all in
their measuring behaviour.
Other evidence
A second source of evidence was offered by those instances where children, measuring
with the ruler or the tape, declined to report a numerical measurement, and either said
they did not know how long the line was, or simply reiterated that the line was longer,
shorter, or the same length as the number of units mentioned by the experimenter. By all
three year-groups, significantly more non-numerical responses were made for lines that
incorporated fractional units than for lines that were a whole number of units in length.
196

In Year 3, an average of 14% of responses on lines incorporating fractional units gave
no numerical measurement, compared with 7% on lines that were a whole number of
units in length (t = 2.20, df = 11, p < .01); in Year 2 the corresponding averages were
21% and 13% ; (t = 2.13, df = 15, p = .03); and in Year 1 they were 34% and 22% (t =
2.14, df = 14, p = .02). These figures, including a particularly high proportion in Year
1, suggest that some children may have 'played safe' by declining to give a numerical
measurement when confronted with fractional units that they did not know how to
report. The fact that this tendency lessened in successive year-groups supports this
interpretation, since it is likely that older children had more resources they could call
upon to help them report fractional units.
6.4 Discussion
6.4.1 Main finding
Overall, the children's measuring ability was found to be poor, with little improvement
from year-group to year-group except when measuring with the ruler.
6.4.2 Understanding of the term 'measurement'
It is worthy of comment that when handed a collection of cubes, a ruler or a tape
measure, and asked to measure a line, only four children in the entire sample ever
showed themselves at a loss as to what to do. With these exceptions (all in Year 1)
every child aligned cubes, ruler or tape in the same plane as the line to be measured, and
whichever starting point was used on the device, usually began their measurement at the
left-hand end of the line. (The exception was measurement with cubes, where cubes
might be stacked at various positions on the line before being moved to the left-hand
end.) Although some children struggled with the measurement device, none asked for
help. So children knew what measuring looked like, and were confident in undertaking
it. Their measuring ability, however, was poor.
6.4.2 Declining to report a numerical measurement
Although very few children declared any difficulty when they were asked to measure,
there was a substantial number of measurements where there was no numerical
response. This was true of just over one-third of measurements in Year 1, one-fifth in
Year 2, and 16% in Year 3. It has been argued that a proportion of these non-numerical
responses may have been due to a desire to avoid dealing with fractional units. This
197

desire, however, if present, may have been just one aspect of a general lack of
confidence that developed only as a child became fully involved in the measuring
operation, and their lack of hesitation when asked to measure may itself have been one
index of their lack of understanding of what was entailed in measurement.
6.4.3 Success in measuring lines of differing lengths
It had been expected that the shortest lines (red set) would be better measured than the
longest (black set) because correct handling of the measuring devices would be more
demanding when measuring longer lines. This did not occur. Instead, on average, there
was no difference in the degree of correct measurement of the longest and shortest sets
of lines, and both were better measured by all year-groups than lines of medium length
(purple set) (although the difference was smaller for Year 1). It is possible that red lines
were better measured simply because they were shorter, while black lines, especially for
Years 2 and 3, drew out the children's better efforts because they were visibly more
challenging. This difference should be set in the context of poor measurement
performance overall, however, where accuracy was nearly always below fifty per cent.
6.4.4 Measuring with cubes
In the great majority of measurements using cubes, with little difference between year-
groups, children correctly aligned the first cube with the end of the line to be measured.
However, there was poor consistency in ensuring that the length of the line to be
measured was matched by the joint length of the cubes used to measure it. That is, the
conservation of length essential to measurement was poorly observed. Though more
than half the children in each year-group did frequently remove gaps in the line of
cubes, ensure that the line was straight, and restore proper alignment if the cubes
moved, no more than five children in each class invariably did so. In this, the older
children were no better than the younger overall (Table 6.03). Children in Year 2 and
Year 3 were, however, less careful in placing their cubes when there were eighteen or
more cubes to be placed (lines in the black set), than when only five were needed,
whereas for children in Year 1 there was no difference. This suggested that older
children did understand what was needed, but became bored, or their concentration
lapsed, during the lengthier task, whereas children in Year 1 either found it hard to
manipulate even five cubes with the care required, or did not see the need for care.
198
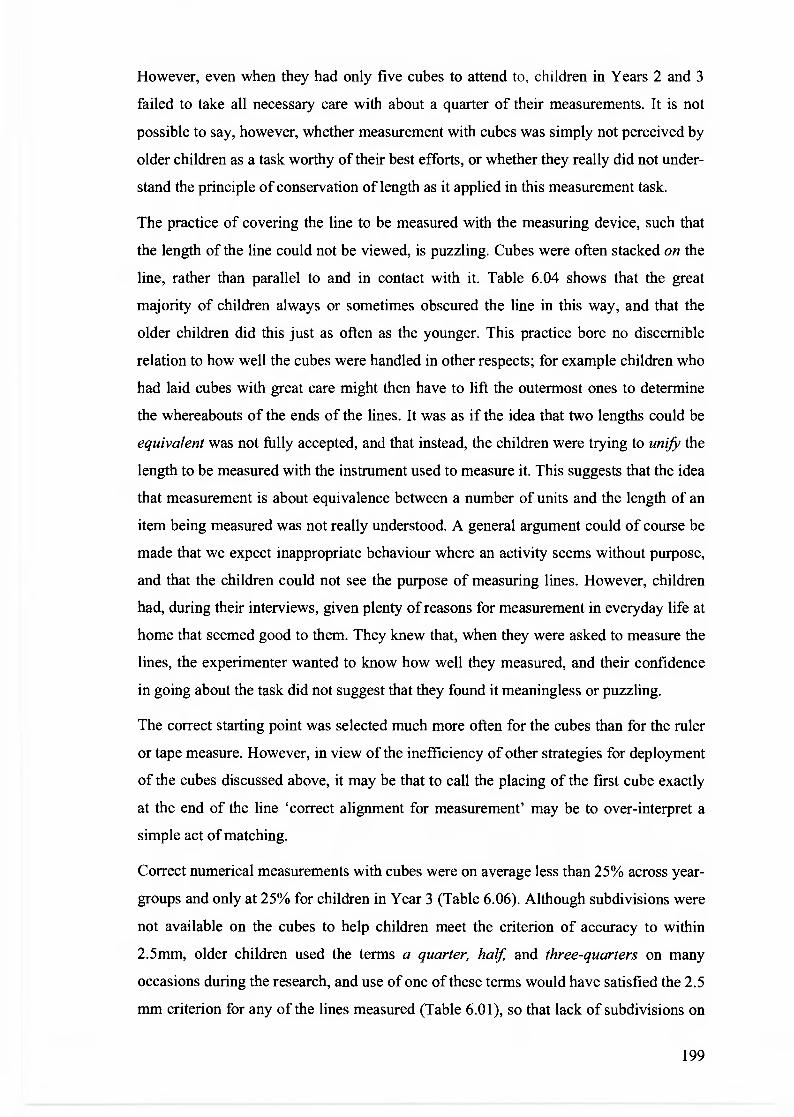
However, even when they had only five cubes to attend to, children in Years 2 and 3
failed to take all necessary care with about a quarter of their measurements. It is not
possible to say, however, whether measurement with cubes was simply not perceived by
older children as a task worthy of their best efforts, or whether they really did not under-
stand the principle of conservation of length as it applied in this measurement task.
The practice of covering the line to be measured with the measuring device, such that
the length of the line could not be viewed, is puzzling. Cubes were often stacked on the
line, rather than parallel to and in contact with it. Table 6.04 shows that the great
majority of children always or sometimes obscured the line in this way, and that the
older children did this just as often as the younger. This practice bore no discernible
relation to how well the cubes were handled in other respects; for example children who
had laid cubes with great care might then have to lift the outermost ones to determine
the whereabouts of the ends of the lines. It was as if the idea that two lengths could be
equivalent was not fully accepted, and that instead, the children were trying to unify the
length to be measured with the instrument used to measure it. This suggests that the idea
that measurement is about equivalence between a number of units and the length of an
item being measured was not really understood. A general argument could of course be
made that we expect inappropriate behaviour where an activity seems without purpose,
and that the children could not see the purpose of measuring lines. However, children
had, during their interviews, given plenty of reasons for measurement in everyday life at
home that seemed good to them. They knew that, when they were asked to measure the
lines, the experimenter wanted to know how well they measured, and their confidence
in going about the task did not suggest that they found it meaningless or puzzling.
The correct starting point was selected much more often for the cubes than for the ruler
or tape measure. However, in view of the inefficiency of other strategies for deployment
of the cubes discussed above, it may be that to call the placing of the first cube exactly
at the end of the line 'correct alignment for measurement' may be to over-interpret a
simple act of matching.
Correct numerical measurements with cubes were on average less than 25% across year-
groups and only at 25% for children in Year 3 (Table 6.06). Although subdivisions were
not available on the cubes to help children meet the criterion of accuracy to within
2.5mm, older children used the terms a quarter, half and three-quarters on many
occasions during the research, and use of one of these terms would have satisfied the 2.5
mm criterion for any of the lines measured (Table 6.01), so that lack of subdivisions on
199

the cubes was not an insuperable obstacle to accurate measurement. Overall, poor
numerical measurement with cubes seems to have been due to failure to marshal
consistently the various skills involved, but there is evidence, too, of lack of
understanding of underlying principles.
Children were scored for the correctness of their comparisons, irrespective of the
correctness of the numerical measurements on which they were based. To be successful,
children had to make a mental comparison of two numerical quantities and convert the
result into a comparative judgment. This was not, on the face of it, a difficult task, and
yet on average only 45% of children overall made the judgement correctly, and only
47% of children in Year 3 did so (Table 6.05). Absolute judgements are known to be
more difficult for children than relative judgements (Bryant, 1974), and here children
were asked to compare two sets of units expressed as absolute numbers to produce a
relative judgement (shorter or longer), so perhaps the task was rather more difficult
than it appeared. However, it is also possible that some children had not thought of the
numbers they were considering as units of length; that is, they knew that one of the
numbers was larger than the other but were confused as to what this implied about
length. If this is what happened, it contributes to the picture of confusion about basic
aspects of measurement.
6.4.5 Measuring with the ruler
Children in Year 1 clearly had very little idea about how to measure with a ruler, with
an average of only 13% correct starting points. On average, over half the measurements
were made from the correct starting point in Year 2, and over two-thirds in Year 3,
(although there was no significant difference between these two year-groups). Of the
three devices, only the ruler showed much improvement in use of the correct starting
point after Year 1, strongly suggesting that greater familiarity and frequency of use of
the ruler in later school years accounted for improvements, especially as the ruler used
in the study was of the type most commonly used in the school.
Several specific starting points other than the zero position on the scale were favoured
when children measured with the ruler, indicated in Table 6.04. The most commonly
chosen starting point other than the correct one for children in Years 2 and 3 was the 1
cm mark, indicating lack of understanding that numbers on a ruler label units of length
on the device.
More than a quarter of the children sometimes measured from the 0.5 cm mark. Half-
centimetres were marked with a longer line than the 1 mm lines, so these were
200

prominent divisions on the ruler, and this was the first such line. It is difficult to see
why this starting point should be attractive, although some evidence was found that
avoiding fractional units may have been implicated on some occasions. Four children
sometimes found on the ruler the number of units (5, 12 or 19) mentioned by the
experimenter and aligned this mark at the start of the line to be measured; this happened
more frequently when the tape was used. It suggests considerable confusion, with
children simply making use of a number they knew to be relevant in some way.
As Table 6.02 shows, very few children consistently used a single starting point for all
nine measurements and between 11 and 15 children in each year-group used a variety of
starting points that were not among the most favoured. This variety must indicate that
they had no settled principle for the use of the ruler. A hypothesis that children adjusted
their starting point so as to avoid dealing with fractional units was tested and evidence
was found that this might have happened in some cases.
Table 6.02 does however show that children in Years 2 and 3 made a larger number of
measurements from the zero mark on the ruler scale than from other marks, and
although it could be argued that only complete consistency would indicate
understanding of the principle of measuring from the start of the scale, increasing use of
the zero mark must at the very least indicate that a preference was being established,
probably as a result of instruction and increasing practice in measuring with a ruler.
Given the frequency of measurement from incorrect starting points, considerable
inaccuracy in reported measurements was to be expected, and as Table 6.06 shows,
measurements that were correct by the 2.5 mm criterion ranged from 13% in Year 1 to
only 51% in Year 3, with no significant difference in accuracy between Years 2 and 3.
Also contributing to the low level of accuracy were failure to offer a numerical
measurement when invited to do so, and reporting whole numbers when confronted
with fractional units. Table 6.07 shows that no children consistently reported fractional
units when appropriate, and nearly half the children in Year 2 and Year 3 did so on less
than half the possible occasions. There is evidence that these three causes of error may
have been interrelated. That is, on some occasions children may have adjusted their
starting points to avoid dealing with fractional units, and may have inappropriately
reported whole numbers for the same reason.
Nevertheless, only when measuring with the ruler were children in the older year-
groups appreciably more accurate than children in Year 1 (Figure 6.03). This suggests
that increased experience in measuring with the ruler as well as increased instruction
201

results in improvement. However, the much smaller extent to which children in the
older year-groups were more accurate with the cubes or the tape measure than children
in Year 1 suggests that any knowledge of measurement gained from practice with the
ruler was not generalised to other devices.
For children in Years 2 and 3, comparisons using the ruler were significantly better than
those using the tape or cubes. However, there was no significant difference in
correctness between tape and cubes, and none for children in Year 1 between any of the
devices. Speculation in the literature (Petitto, 1990; Piaget et al., 1960) that separate
units may differ in their difficulty for children from scaled measuring devices thus
received no support from this research.
It will be recalled that correctness of the comparisons was assessed independently of
correctness of numerical measurements. For cubes and tape, correctness of the
comparisons was on average 45% to 50%, and differed little between year-groups, or
between the two devices. It has already been suggested that this uniformly poor
performance of a relatively simple task may have been due to children's difficulties in
associating the numbers they saw on the device and heard from the experimenter with
the judgments of length they were asked to make. If older children were no better than
younger in making this association where cubes and tape were concerned, there is no
obvious reason why they should have been better with the ruler. It seems that greater
familiarity with the ruler must have facilitated this outcome with the older children, but
it is not clear by what mechanism this could have happened.
6.4.6 Measuring with the tape
No more than one third of measurements with the tape were made from the correct
starting point on the scale, and in this there were no significant differences between
year-groups. Considering that the scale started at the end of the tape, so that only
matching this to the end of the line was required for success, this result was surprising,
and suggested that, even though many had said at interview that they had seen tape
measures used at home, few had used one much themselves. The way in which the end
of the tape was sealed with a flat semi-circular stud which projected some way towards
the 1 cm mark, may for some have proved a distraction. About half the children in each
year-group sometimes measured from near the 0.5 cm position (Table 6.02).
Approximately the same number of children sometimes measured from the 1 cm mark
with the tape as with the ruler, but a greater number than with the ruler — fourteen —
sometimes began their measurement from the 5, 12 or 19 cm mark. If this type of choice
202

did indicate real confusion, then it is understandable that this would have been greater
with the unfamiliar tape than with the ruler. Children sometimes covered the line to be
measured with the tape, as they did with the cubes, so that the line they were measuring
was not visible to them, but in the case of the tape, this behaviour was practically
confined to Year 1.
Mean correct numerical measurements with the tape were very low and reached 25%
only in Year 3, with no significant difference between Years 2 and 3. As already
suggested, the desire to avoid fractional units (data for ruler and tape were combined to
investigate this) may have contributed to this lack of success.
Not surprisingly, Year 1 children were at sea when handling the tape, finding its length
and lack of rigidity very difficult to handle, and sometimes seemingly preoccupied by
the long series of numerals printed on it. Children in Year 2 and especially Year 3,
however, manipulated the tape better and might have been expected to be able to use of
knowledge of the ruler and its scale in measuring with the tape. This did not occur.
Comparisons using the tape were about 50% correct, did not differ significantly from
correct comparisons for cubes, or (like cubes) among year-groups. As with cubes, this
surprisingly poor performance of an apparently simple task is hard to explain for the
older children, except by some degree of dissociation between numbered units on the
tape and the notion of length.
When, in making their comparisons, children were asked to convert an absolute
judgement (their measurement in units) to a relative judgement, (that is, whether the line
was shorter, longer or the same length as a number of units mentioned by the
experimenter) no more than half did so successfully. Yet the reverse procedure
(reported in Chapter 5) — responding in relative terms when a specific number of units
was mentioned — showed a very high success rate. This seems to be a case, seen so often
in the literature, of sensitivity to the exact form of the task. Apparent similarity of
cognitive demand does not necessarily predict performance.
Practice in measuring with the ruler (as suggested above) and not sheer familiarity with
it as a 'cultural tool' seems likely to have accounted for the improved performance over
the others of the oldest year-group; the difficulty of coping with its numbering and
subdivisions produced poor results even with Year 3.
Units of length are similarly represented on tape measures and rulers. It might be
expected that children who have practiced measuring with a ruler will make use of this
203

knowledge when asked to measure with a tape measure, with which they have had less
practice. The fact that accuracy with the tape measure was so poor indicates that if there
was any transfer of knowledge, its effect was slight.
204

Chapter 7
Associations between measurement and measurement- related abilities
7.1 Introduction
The overall structure of the research reported in Chapters 4 to 6 was informed by the
logical relationship between measurement and measurement-related concepts. Thus the
language and concepts of ordinal comparisons of length (Chapter 4) logically underpin
estimation of ordinal length (Chapter 5), while ordinal comparisons underpin
measurement involving units (Chapter 6). An important outstanding question, however,
was whether the corresponding language, estimation and measurement abilities
supported each other psychologically.
To help understand this, statistical tests of association between the outcomes of the
three sets of tasks (reported respectively in Chapters 4, 5 and 6) were conducted. It will
be recalled that these tasks tested a) children's understanding of terms used to describe
ordinal length (such as shorter, widest, as tall as) together with the concepts such
language expressed (Chapter 4); b) their success in estimating whether lines were
shorter, longer, or the same length as various comparators, such as a number of cubes,
or a number of cm on a ruler (Chapter 5); and c) their measurement ability (Chapter 6).
Measurement ability was tested in two ways, reported in Chapter 6 as 'comparisons'
and 'numerical measurement'. In their comparisons, after measuring a line in units,
children were asked to say whether that line was shorter, longer, or of the same length
as a number of units mentioned by the experimenter (that is, to compare their
measurement with the number of units mentioned). In their numerical measurements,
they were asked, as an absolute judgement, how long (in units) the line they had
measured actually was. Comparisons were thus logically dependent on numerical
measurement. Because of the logical priority of numerical measurement, and because
the absolute judgments it called for are the typical outcome of measurement, only the
numerical measurement scores were used in the tests of association.
Several subsets among the tasks were of particular interest in exploring associations.
The 'complex' language tasks in Chapter 4 constituted one such subset, because they
were at the same time tests of conservation of length (see the description in Chapter 4).
It had been noted that, since Piaget, the literature had not given the central place to the
psychological relationship between conservation of length and measurement concepts
205

that their logical relationship merited. Association between performance on complex
language tasks and that on numerical measurement was therefore investigated.
Wherever feasible, in the remainder of this chapter, the phrase 'the language and
concepts of ordinal length' will be shortened to language'; 'visual estimation of ordinal
length' will be shortened to 'estimation'; and 'numerical measurement' will be
shortened to 'measurement'.
7.2 Method
Sample
The complete data required for correlational analysis were available for 68 children:
twenty-one in Year 1; twenty-one in Year 2; and twenty-six in Year 3.
7.2.1 Internal reliability testing
Valid statistical comparisons could be made only where performance on each series of
tasks could be assumed to reflect a coherent set of competencies in those performing
them. It will be recalled that, so as to assess generality of understanding, the variety of
materials employed had been wide, and it was possible that this variety affected the
extent to which the tasks within a series tapped similar competencies. Internal reliability
was therefore computed separately for scores on the tasks reported in Chapter 4
(language); Chapter 5 (estimation); and Chapter 6 (measurement). For this purpose,
each child's mean score across a) all language tasks, b) all estimation tasks and c) all
numerical measurement tasks were calculated and used to calculate Cronbach's alpha.
Acceptable alpha values (a (language) = .85; a (estimation) = .73; a (numerical
measurement) = .76) were obtained for the three sets of tasks. It would have been
interesting to explore correlations between performance in estimation and measurement
tasks further for the individual measuring devices (ruler, cubes and tape measure).
However, the outcomes of these three subsets of tasks did not achieve acceptable alpha
values (perhaps because the means were of smaller numbers of scores) and so were not
subjected to tests of association.
Next, each child's mean score across 'complex' language tasks (those constituting tests
of conservation of length) were used to calculate a, and achieved a satisfactory value (a
= .82).
206
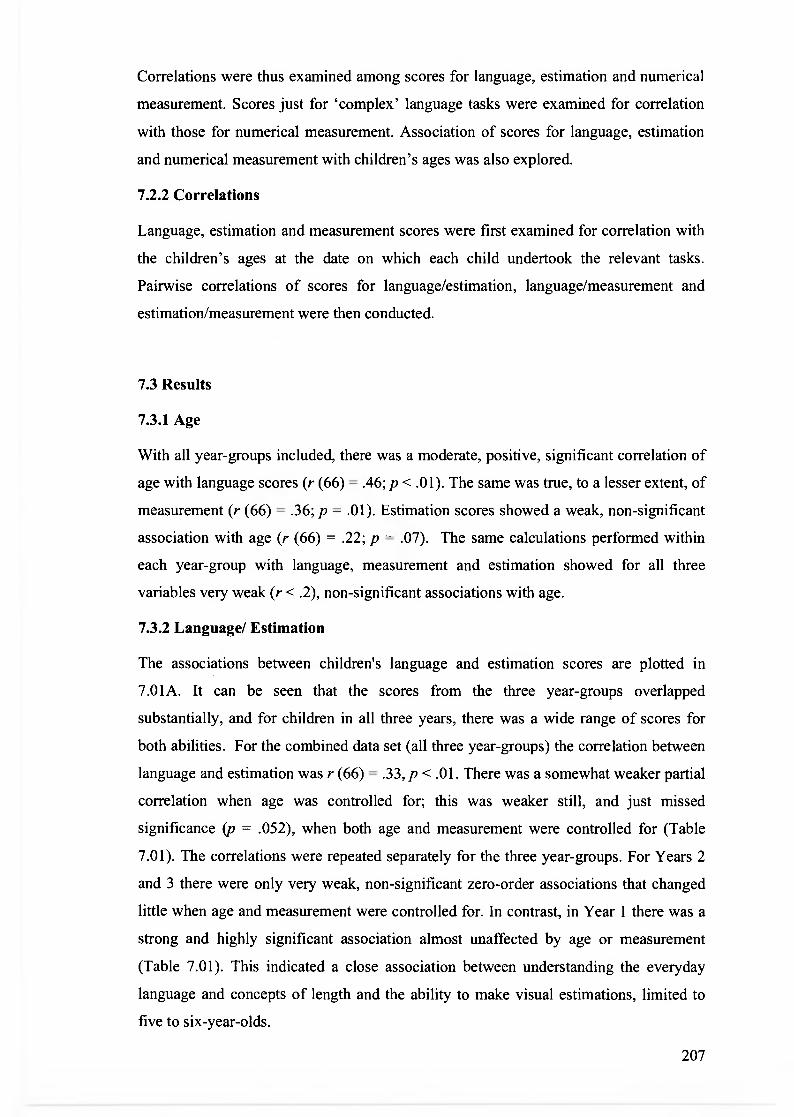
Correlations were thus examined among scores for language, estimation and numerical
measurement. Scores just for 'complex' language tasks were examined for correlation
with those for numerical measurement. Association of scores for language, estimation
and numerical measurement with children's ages was also explored.
7.2.2 Correlations
Language, estimation and measurement scores were first examined for correlation with
the children's ages at the date on which each child undertook the relevant tasks.
Pairwise correlations of scores for language/estimation, language/measurement and
estimation/measurement were then conducted.
7.3 Results
7.3.1 Age
With all year-groups included, there was a moderate, positive, significant correlation of
age with language scores (r (66) = .46; p < .01). The same was true, to a lesser extent, of
measurement (r (66) = .36; p = .01). Estimation scores showed a weak, non-significant
association with age (r (66) = .22; p = .07). The same calculations performed within
each year-group with language, measurement and estimation showed for all three
variables very weak (r < .2), non-significant associations with age.
7.3.2 Language/ Estimation
The associations between children's language and estimation scores are plotted in
7.01A. It can be seen that the scores from the three year-groups overlapped
substantially, and for children in all three years, there was a wide range of scores for
both abilities. For the combined data set (all three year-groups) the correlation between
language and estimation was r (66) = .33, p < .01. There was a somewhat weaker partial
correlation when age was controlled for; this was weaker still, and just missed
significance (p = .052), when both age and measurement were controlled for (Table
7.01). The correlations were repeated separately for the three year-groups. For Years 2
and 3 there were only very weak, non-significant zero-order associations that changed
little when age and measurement were controlled for. In contrast, in Year 1 there was a
strong and highly significant association almost unaffected by age or measurement
(Table 7.01). This indicated a close association between understanding the everyday
language and concepts of length and the ability to make visual estimations, limited to
five to six-year-olds.
207
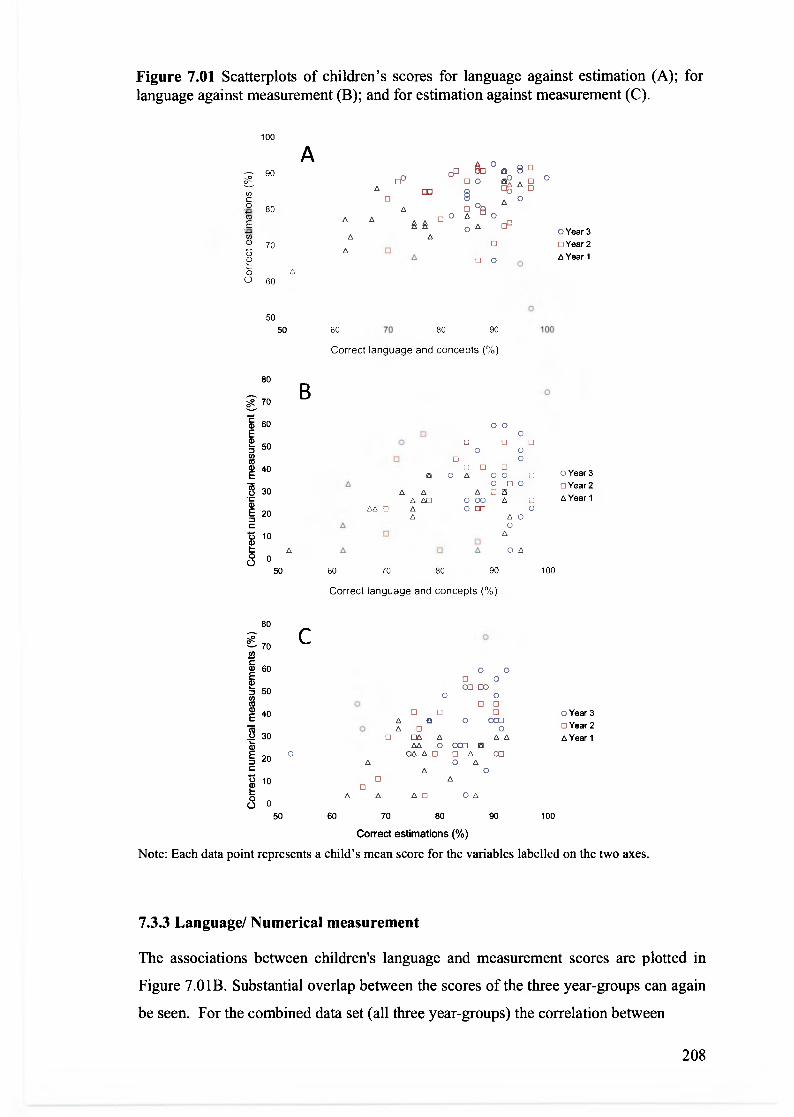
Figure 7.01 Scatterplots of children's scores for language against estimation (A); for language against measurement (B); and for estimation against measurement (C).
100
90 OD gzi 0 e 8 °
A 0° 0 0 Bo 0 0
00 r 1=1
0 @ 0 80 A 0 08
A
0 0 0 A A 0 A EP 0 Year 3 A A
70 0 0 Year 2 A 0
A A Year 1 D 0 0
60
0 50
50 60 70 80 90 100
Correct language and concepts (%)
80
e 70 ..-- .E. a) 60 00 E 0 0
50 0 0 0 0 m 0 0 (0 0 0 0 a) 40 1=1 0 0 E e 0 A o o o 0 Year 3
la A 0 D 0 0 Year 2 30 A A A 0 6
A Year 1 c 0)
A AC 0 00 A o
E zo 44 o A 0 GO 0 Z A A 0 C A 0
r) 10 A a) o t A A A 0 A
0 0 0
50 60 70 80 90 100
Correct language and concepts (%)
80 .--..
0 °-- 70 --- 70 co C ru 60 0 0 E 0 0
z ... CO00 50 0 0 u) co 0 0 0 g 40 0 0 0 0 Year 3
A 0 0 coo
, 0 A 0 0
0 A A 30 ❑ DA A o Year 2 A Year 1
.5
AA 0 OM Ei
20 0 A OA A 0 0 A CO
0 A C A 0 010 0 A
0 L 0 6 A A 0 0 A 0 0
50 60 70 80 90 100
Correct estimations (%)
Note: Each data point represents a child's mean score for the variables labelled on the two axes.
7.3.3 Language/ Numerical measurement
The associations between children's language and measurement scores are plotted in
Figure 7.01B. Substantial overlap between the scores of the three year-groups can again
be seen. For the combined data set (all three year-groups) the correlation between
Corr
ect
estim
ation
s (
%)
B 0
208

Table 7.01 Pearson's coefficients for zero order and partial correlations among a) language of ordinal length, b) visual estimation of ordinal length and c) numerical measurement.
Variables controlled for All Y1 Y2 Y3
Estimation Language
All None Age
Age and measurement
.33** .28* .24
Year 1 None Age
Age and measurement
.72** .71* .70*
Year 2 None Age
Age and measurement
.11
.09 -.04
Year 3 None Age
Age and measurement
-.15 -.13 -.17
Measurement Language
All None Age
Age and estimation
.30* .15 .06
Year 1 None Age
Age and estimation
.12
.15 -.06
Year 2 None Age
Age and estimation
.23
.22
.21
Year 3 None Age
Age and estimation
.05
.12
.16 Estimation
All None Age
Age and language
.39**
.35**
.33**
Year 1 None Age
Age and language
.22
.27
.24
Year 2 None Age
Age and language
.54*
.55*
.54*
Year 3 None Age
Age and language
.26
.25
.27
*p<.05; **p.01
Note 1. In partial correlations, coefficients are shown with i) age controlled for and ii) age and the third variable controlled for. Note 2. Coefficients are given for the whole sample N= 68) and separately for the three year-groups (Y1, N=21; Y2, N=21; Y3, N=26).
209

language and measurement was r (66) = .30, p = .01. Re-calculation controlling first for
age and then for age and estimation, however, revealed only very weak non-significant
associations between language and measurement (Table 7.01). The partial correlations
were repeated for the three year-groups separately and were, at best, weak. None were
significant (Table 7.01).
7.3.4 Measurement/ Estimation
The associations between children's measurement and estimation scores are plotted in
Figure 7.01C, where a positive relation between measurement and estimation scores is
evident. There is again no clear differentiation among the three year-groups as their
ranges of abilities overlap considerably. For the combined data set the correlation
between measurement and estimation was r (66) = .39, p < .01. This correlation
remained modest and highly significant when recalculated controlling for age, and then
for age and language (Table 7.01). The partial correlations were repeated separately for
the three year-groups. For Years 1 and 3 there was only a weak non-significant
association between measurement and estimation when controlling for age and then for
language and age. However, in Year 2 there was a moderate, positive, significant
association (Table 7.01).
7.3.5 Complex language tasks/numerical measurement
There were only very weak, non-significant correlations between complex language
tasks and numerical measurement both overall, and for any year-group, with or without
controlling for age. (In the zero order correlations, r < .2 except for Year 2 where
r = .27).
7.4 Discussion
Previous chapters showed that, overall, children had good understanding of everyday
language and concepts of measurement; that their visual estimation ability was good;
but that their measurement ability was poor. In relation to some aspects of their
performance there was substantial variation within year-groups; analysis of variance
showed, however, that there was typically an overall improvement between Years 1 and
3.
210

7.4.1 Correlations with age
Across the whole sample, correlations performed for the three types of ability with
children's age showed a moderate association with language scores and a more modest
association with measurement scores. There was however no significant association of
age with estimation scores, despite the fact that analysis of variance had identified a
significantly higher mean score for estimation in Year 3 than in Year 1. This effect was
explained by the great variation in ability across the year-groups.
When correlations of the language, estimation and measurement scores with children's
age were performed separately for the three year-groups, there were no significant
associations. Thus, despite an overall association of language and measurement scores
with age, within each year-group older children were no more successful than younger
and a wide range of language and measurement proficiency was indicated. So for these
two abilities, improvement was not so much age-related as year-group related,
suggesting, as one would expect, an effect of teaching and of (perhaps cohort-specific)
life experience.
7.4.2 Correlations among language, estimation and measurement scores.
There were modest, positive associations among language, estimation and measurement
scores. However when age and the third factor were controlled for, only measurement
and estimation scores were significantly correlated, and then only modestly. There was
no significant association between language and measurement, either overall, or for any
year-group, suggesting that language ability in itself had little bearing on measurement
ability. There was, however, a strong positive correlation of language with estimation
ability that was confined to Year 1, and a moderate positive correlation of estimation
ability with measurement ability confined to Year 2 (Table 7.01). This suggested a
ladder effect, whereby a degree of proficiency with the everyday language and concepts
of measurement supported ability in estimation of ordinal length in Year 1, and
proficiency in estimation supported measurement ability in Year 2, (although it is
possible that the direction of support was from measurement to estimation in Year 2:
this is discussed later). These suggestions are now further explored.
For Year 1, the strong association between understanding of language on the one hand,
and estimation ability on the other constituted the lower rung of the ladder: these
abilities were not associated for Years 2 and 3. Both sets of tasks involved ordinal
judgements and used questions of a similar structure, but in the language tasks, children
saw a wide range of everyday materials, and had to respond to a much broader range of
211

`length' vocabulary than was employed in the estimation tasks. In the latter, while
language and materials were more restricted, the tasks themselves were more
demanding, using many lines of different lengths, different types of comparator, and
involving units. It seemed that for the youngest group of children, the highly-structured
language tasks (reinforced by the extent to which they made ordinal comparisons
routinely in everyday life) did tap abilities which supported the more demanding
comparisons required by the estimation tasks, and that this support was no longer
needed by children from the two older year-groups for whom language and estimation
abilities were by then independent.
When it came to associations between the ability to make ordinal estimations of length
and measurement ability, none were significant except for Year 2, where there was a
moderate positive correlation. This effect constituted the upper rung of the ladder,
whereby ordinal estimation supported numerical measurement.
At least two interpretations are possible as to the direction of the effect. The first is that
logical order was the most influential factor: ordinal comparisons underpin
measurement with units. According to this interpretation, in Year 2 the extent to which
children made correct estimations supported their measurement ability, while by Year 3,
this effect was complete, and the two abilities were independent. In Year 1,
measurement ability was at too low a level to benefit from any such support.
The second possibility was that improvements in measurement drove improvements in
estimation in Year 2, facilitated by overall improvements in arithmetical skills feeding
into measurement practices. Incidental evidence of arithmetic skills being deployed in
classroom measurement activities was given in Interview 1. The argument would be that
by Year 3, measurement and arithmetic skills were developing independently, and that
in Year 1, children were at too early a stage in both skills for either to support the other.
That measurement could be supporting estimation looks implausible, however, in the
light of very good scores for estimation, contrasting with very poor scores for
measurement in all year-groups.
The 'ladder' remains a hypothesis, since the abilities featuring in it may in fact be
independent of each other, or accounted for by other factors, and this is a third
possibility. Nevertheless, the design of the research incorporated the idea that language
was likely to underpin estimation, and estimation likely to underpin measurement,
psychologically as well as logically, so that it is a persuasive hypothesis.
212

The correlational pattern overall provides a rich basis for reflection on how the
curricular arrangement of topics leading up to measurement might best be organized,
and on how judicious selection of language and materials can support the logical
transitions children need to make.
Surprisingly, no association was found between ability in the 'complex' language tasks
(which were also conservation tasks) and numerical measurement, despite the logical
relationship between conservation of length and the ability to measure. However, there
was a high level of success on the part of all year-groups in the language tasks,
suggesting that most children had surpassed the conceptual requirements of
conservation (as measured by these traditional tasks) that were needed for measurement,
and this probably explained the lack of association. The finding leaves unexplained,
however, examples of non-conservation of length in relation specifically to
measurement identified in surveys (e.g. Hart 2004; Department of Education and
Science 1981) and in the present research. This is considered further in the Discussion
chapter.
213
Chapter 8
Discussion
8.1 Introduction
The present research investigated children's ability in measurement and its allied
competences. Studies reviewed in Chapter 1 provided valuable but very various insights
into this ability. In consideration of this, the present research restricted itself to an
integrated set of tasks designed to assess basic measurement and measurement-related
abilities and offered to the same group of children. The research investigated the
children's understanding of the everyday language and concepts of length, their ability
to estimate ordinal length, and their ability to measure in units. The same experimental
tasks were suitable for three successive primary school year-groups and enabled
comparison of their abilities. The fact that a single sample of children participated
enabled exploration of how these abilities might be associated. To help understand how
the abilities were acquired, the research also investigated the children's own accounts of
the home and school contexts in which they experienced measurement. The results of
each interview and each series of tasks were discussed in Chapters 3 to 7. The present
chapter identifies and discusses the findings that were judged to be the most important.
It does so in relation to the research questions and key theoretical themes summarised at
the end of Chapter 1, and to the literature reviewed in that chapter. It also indicates how
future investigation could be taken forward, and considers some classroom implications
of the present findings.
The most important findings of this research were all, as it happened, somewhat
unexpected, particularly when considered together. Firstly, children turned out to be
poor measurers. Secondly, and in contrast, they showed very good ability in several
competences that logically underpin measurement, and might have been expected to
support it. Thirdly, performance in these underpinning competences was unexpectedly
and extraordinarily robust. It varied little across many different tasks indicating, to this
extent, conceptual security. Fourthly, while the children's understanding of
measurement did not mature with age and two to three years of schooling to anything
like the extent that might have been expected, there was nevertheless evidence of a
developmental process from the underpinning competences to measurement itself.
Finally, the influence of 'real life' experience on understanding of measurement was
214

mixed. On balance, there were probably more ways in which it hindered than helped.
Each of these findings is discussed below.
8.2 Main findings
8.2.1 Children as measurers
Children in this research measured surprisingly poorly. Those in Years 2 and 3
measured better with the ruler than with the other two devices, but even in these year-
groups only about half these measurements were correct by the criterion set. While the
immediate causes of the children's poor performance, as observed, arose from their
handling of the measuring devices, these procedural errors suggested conceptual
difficulties. Firstly, children were notably inconsistent in their choice of starting point
on the ruler or tape to begin their measurement. This suggested no settled idea (whether
correct or incorrect) about the relationship of units on these instruments to the length to
be measured. Secondly, supporting evidence for the frailty of this understanding came
from the way in which children often covered the line to be measured with a device, so
that matching units on the device to the length to be measured could not be achieved.
Having noticed that matching could not be achieved, children did not change their
strategy. This suggested that the idea of equivalence between the units of length shown
on the device and the length measured, if this idea existed, was overtaken by the
inclination to create a single length by superimposition. Operational transitive inference
seemed to be lacking here. Thirdly, there was the opinion of some of the older children
in the second interview, that the ruler could not measure an item longer than itself. Half
the children expressing this opinion could not suggest a way of dealing with the
situation that involved using the ruler to add more units (cf. Brown et al., 1995). The
units were not, seemingly, 'detachable' from the ruler that embodied them.
The subdivisions on the ruler appeared, as predicted, to be a source of difficulty, when
these were required to measure a line that was not a whole number of units long. This
difficulty was reflected in children often apparently choosing not to give a numerical
measurement at all, or to state a number of whole units, when fractional units were
involved.
When the cubes were used as units, the failure of many children to be consistent in
closing up the gaps between them similarly suggested lack of understanding that
equivalence between the length of the line of cubes and the length to be measured was
essential. It seems fair to describe this as failure to conserve length, not as in traditional
conservation tasks, but in the 'applied' sense exemplified in surveys of performance in
215

mathematics and science. Thus, in one survey, children failed to mark the start point of
a clockwork toy when measuring the distance it travelled (Department of Education and
Science, 1981). In another, children were asked to compare the length of parallel lines
drawn on squared paper. Because the ends of the lines were offset, direct comparison of
the two lines was impossible, but still it did not occur to some children to count the
number of squares crossed by each line. The line lengths were compared visually, and
errors resulted (Hart, 2004). As in the failure to place cubes correctly (in the present
research), these are examples of non-conservation of length in practical contexts.
Measurements with the cubes and tape measure were performed equally poorly, and
were worse performed than those using the ruler. This provided no support for the view
that continuous scales (represented by the tape measure and ruler) would make the
meaning of units more difficult to grasp than discrete units (the cubes) (Piaget et al.,
1960), or indeed for the reverse view (Petitto, 1990). It also suggested that children
could not make use of conceptual knowledge they may have gained through practice
with the ruler when it came to dealing with the units embodied in the other devices. The
notion of functional fixedness (Casler & Kelemen 2005; Miller 1989) whereby the
function of a tool, learned as a social norm (Rakoczy, Hamann, Warneken & Tomasello,
2010) may for that very reason obstruct full understanding of its properties and their
`portability' to other contexts, seems to apply here. The deployment of the calculator in
the classroom (where the nature of the tool might invite greater flexibility) has
encountered similar problems (Guin & Trouche, 1999). Even where the far richer
resources of computer environments have been developed, as tools, specifically to
instantiate mathematical principles (Noss & Hoyles, 1992), it has not always been clear
to the developers whether children participating in the computer activities have
understood those activities as mathematically structured.
The idea, therefore, that conventional measurement instruments, as 'cultural tools' with
which children are familiar, may both assist them to measure correctly and also support
their acquisition of underlying logical principles (Nunes et al., 1993) receives little
support from the present research. The first interview showed the measuring tape to be
very familiar from out-of-school contexts, but this did not help children use it correctly
when measuring. While performance with the familiar ruler was better among the older
children with longer experience of using it than among the younger children, its
subdivisions seemed to be avoided by many. In the second interview, the fact that the
greater numbers on the ruler were displayed in conjunction with the smaller units
216

seemed to disrupt any understanding that there is an inverse relation between size and
number of units. In this case, the physical appearance of the measuring instrument, for
all its familiarity, actually obstructed understanding of the concepts it embodied. These
findings suggest that basic ideas (such as the fact that larger numbers do not necessarily
indicate greater amount) should be explicitly taught and exemplified, and that the
benefits of familiarity cannot be taken for granted. Teaching of measurement may, for
example, profit from being routinely supported at first by simplified, if unfamiliar,
devices such as rulers marked with units that are not subdivided or numbered. Children
would then need to rely on counting the number of units that were equal to the length to
be measured. The marking of numerals on the ruler could then be introduced and
explained as a check on the counting of units, and in due course the conventional use of
numerals on rulers could be presented in the light of a convenience for measurers.
Evidence of conceptual difficulties about the relationship between number and quantity
came from children's 'comparisons', in which less than half the responses were correct,
even in Year 3. When children had measured a line and declared what they took to be its
length as a number (with or without mentioning units), they were asked whether the line
was therefore shorter, longer, or the same length as a 'reference' number of units
mentioned by the experimenter. It was this comparison of two numbers that was so
poorly performed. On the reasonable assumption that most of the children were easily
able to tell which was the greater of two numbers under twenty (20 cm being the
maximum length of a line and 19 cm the largest 'reference' number), it must have been
uncertainty about how these numbers mapped on to the physical length of a line
(enabling them to say which of two lines was, for example, shorter) that led to errors.
Finally, and most strikingly, there was clear evidence from the second interview that at
least one-third even of the older children did not understand that there is an inverse
relation between the size and number of units required to measure a given length. This
simple and fundamental principle of the proportional reasoning involved in
measurement thus eluded many children in this sample. Among the themes summarised
at the end of Chapter 1, that on ratio and proportion considered a range of research in
which children were successful in some contexts and unsuccessful in others. The
findings of the present research, in which children simply commented on the scales on
common measuring devices, indicated unequivocally that many would find difficulty
with everyday measurement tasks.
217

8.2.2 Competences underpinning measurement
Language
Children proved to be expert comprehenders of the everyday language of comparative
length, an ability not examined in the previous investigations reviewed. Piaget (Piaget et
al., 1960) discussed the understanding of ordination as a logical pre-requisite for
relative judgements of length; Bryant (1974) established that relative judgements are
made early and are easier to make than absolute judgements; Resnick (1992) proposed
categories of protoquantitative reasoning that develop early, underlie all reasoning about
quantities, and are all relative in character; while Feigenson et al., (2004) argued for an
ability to discriminate ratios between quantities in early infancy. Furthermore, the
present research showed that experience of measurement in the home favours
judgements of affordance or 'fit', which are relative judgements. All this evidence
pointed to the likelihood of early competence in judging relative length, but no evidence
was offered about the role of language in these relative judgements. (This was not, of
course, possible for the infancy studies).
The present research investigated such language in a dedicated series of tasks. It
investigated children's ability to understand the everyday language of length (that is, of
the attributes of height, length, and width) as they made relative judgements in the
differing contexts of a substantial number of displays. Some of the subtleties of the way
in which we use language that may have misled children as to the meaning of these
attributes were described in the introduction to Chapter 4.
Despite these subtleties, children in all age-groups proved to be excellent
comprehenders of such everyday language. They were highly successful in making
comparisons of height, length, and width in a wide range of contexts, the sole difficulty
concerning certain judgements of height where the human figure was involved. This
was no mean achievement, and meant that one likely barrier to the understanding of
measurement, that is, the everyday language involved, could be ruled out.
Conservation of length
The children were also good conservers of length in the traditional sense. The language
tasks incorporated a 'complex' condition in which the spatial arrangement of a
substantial number of displays tested conservation of length in its traditional Piagetian
form. With the sole exception regarding height already mentioned, these tests posed
remarkably few difficulties to children.
218

The competence with which conserving judgements were made should be given its full
weight. Conservation tests have long figured (either centrally or peripherally) in studies
of the development of measurement (Piaget et al., 1960; Boulton-Lewis, 1987; Miller,
1989; Petitto, 1990), as well as (in the broader sense explained above) in mathematics
surveys (Department of Education and Science, 1981; Hart, 2004) because conservation
is indispensible to any ability to judge amount. Performance on such tests has frequently
been found to be weak. By contrast, performance in the present research showed the
children to have this building block firmly in place. This did not guarantee, however,
that they would conserve length in the broader sense, as required by the measurement
tasks, and they frequently failed to do so.
Visual estimation of length
Children were consistently very good estimators of ordinal length throughout a long and
demanding series of comparisons. They were not confused when asked to make their
ordinal comparisons in relation to a given number of units. They were successful
regardless of the absolute length of the line whose length was judged. Most surprisingly,
the differences between the 'comparators' against which the length of lines was judged,
designed to be challenging, proved no obstacle. These five comparators comprised one
plain unmarked strip, three devices marked and numbered in various ways, and a
collection of wooden cubes. Children were equally successful with all of them. Their
performance did differ according to the ratio of the length of a line to that of its specific
comparator: the greater the ratio, the greater the likelihood of being correct. This was to
be expected in view of the greater discriminability of that difference in length (Ross,
1997), and was reflected in poorer performance in correctly estimating that certain lines
were the same length as their comparator (where there was no difference to
discriminate).
Lack of influence of the materials used
In language and estimation tasks, children's performance was, surprisingly, consistently
good in the face of a wide variety of experimental materials. In measurement tasks,
performance was somewhat better with the ruler than with the other devices, but was
pretty consistently poor. Conceptual difficulties arising at the contextual level were
therefore few.
In Chapters 4 and 5, the rather lengthy description of materials used for each series of
tasks reflected the care that had been taken to include features designed to test in many
different contexts the conceptual understanding examined. Thus the displays used in the
219

language tasks (for example, human figures, toy cars, writing implements in both 2-D
and 3-D format) and the different spatial orientations in which they were arranged in the
`complex' displays, required children to apply nuanced language conventions regarding
height, length, and width correctly for successful performance. In the estimation tasks
an elaborate combination of line lengths with five comparators that exemplified (or not)
discrete and continuous units, subdivisions and numbers were meant to assemble
various factors that previous research had identified as presenting difficulties to
children. In the event, this variety produced a surprisingly uniform result. In the
language tasks, only very few, very specific displays to do with human height were
found difficult; other variations were easily dealt with. In the estimation tasks, neither
the type of comparator nor the absolute length of lines affected the outcome, which was
uniformly successful, except for lines close in length, or of equal length, to their
comparator. Performance on the measurement tasks was uniformly poor, with
performance with the ruler by older children achieving only a modestly higher level.
It has already been remarked that in existing research on measurement, different types
of tasks and materials produced different outcomes. Few studies encompassed the range
of variation in materials used in the present research, and above all not with the same
participants. The single sample used in the present research revealed how stable across
contextual variation children's performance can be. It suggests that children may leave
behind conceptual difficulties arising at the contextual level, while overarching
conceptual difficulties, such as those associated with the very notion of units, in many
cases remain. One way of looking at these results is to say that they amplify those of
earlier studies (Resnick & Singer, 1993; Bryant, 1974) that concluded that relative
judgments are made earlier in development and are easier to make than the difficult
absolute judgements characteristic of measurement with units. The present research
brings into focus the detailed texture of that ease and that difficulty.
8.2.3 Age
While overall there was improved performance with age, this was a great deal less, and
less clear-cut, than might have been expected. Nevertheless, there was evidence of a
`ladder effect' between competencies from year-group to year-group.
The most typical finding in each series of tasks was a significant difference between the
performance of children in Years 1 and 3, but no significant difference between the two
younger or the two older year-groups. Among the results of some sub-sets of the tasks
(for example in the tests of 'height above ground' and in measurement performance
220

with tape and cubes) the degree of success was practically the same for all three year-
groups. There was little difference, either, when it came to interpretative or procedural
errors (which nonetheless had conceptual implications), such as identifying the smaller
unit as larger (in the second interview); using an incorrect starting-point for measuring
with the cubes and tape; and obscuring a line to be measured with the measuring device.
When the outcomes of the three main series of tasks (language, estimation and
measurement) were correlated with chronological age, there were significant, moderate,
positive correlations for language and measurement, but these disappeared when the
calculations were performed for each year-group separately. What accounted for this
was substantial variation in performance according to age that crossed year-group
boundaries, so that only when the full range of ages was considered could any trend be
picked out. Together with the significant differences in performance frequently found
only between Years 1 and 3, this presented no clear picture of the influence of
development and education on measurement ability.
When age and the third factor were controlled for in partial correlations, however, an
important developmental effect came into focus. Ability in the language and estimation
tasks correlated strongly and positively for Year 1 children, while estimation and
measurement ability were moderately positively correlated for Year 2. This suggested a
`ladder' whereby facility with the language of comparative length supported children, at
an early stage, in making accurate estimations of comparative length, while estimation
ability in turn facilitated accuracy in measurement by children at a later stage.
In the case of Year 1, then, there was a strong association between understanding of
language on the one hand, and estimation ability on the other. Both sets of tasks
involved ordinal judgements and used questions of a similar, closely-prescribed,
structure, but there the resemblance ended. In the language tasks, a wide range of
everyday real and pictured items was used, and questioning was about height and width
as well as length. In the estimation tasks, only the lengths of lines were compared, many
more comparisons were made, and numbers and units were involved. Nevertheless, it
seemed that for the youngest group of children, the language tasks (reinforced no doubt
by the extent to which they made ordinal comparisons routinely in everyday life) did tap
abilities which supported the more demanding comparisons required by the estimation
tasks.
221

8.2.4 The social and the conceptual
Finally, the question of broadest scope and potential interest was: what do children learn
about measurement in their everyday social context - in 'real life' - and how might this
affect their conceptual understanding of measurement? The terms 'social' and
`conceptual' are of broad connotation and their respective applications in the present
research were not straightforward. Nevertheless, the terms represent a contrast that is of
considerable consequence for education. Below, the term 'social' is especially broadly
construed, and includes classroom experience. The 'conceptual' in measurement is
taken to include, for example, conservation of length, transitivity, and logical
characteristics of units.
Resnick's succinct remark that at every opportunity for mathematics learning, children
learn "both less than and more than mathematics" (Resnick, 1992: 107) captures the
nature of the contrast between the social and the conceptual, as well as the difficulty of
separating the two. Applied to measurement, the less and more neatly present the
paradox that although everyday life throws up a wealth of social situations involving
measurement, conceptual aspects are not likely to be especially salient. This is so even
when measurement is at the heart of a social activity, such as (in the present research)
when buying new clothes or furniture, cooking, and home decorating. The value to
children of those social activities consisted in their importance in the children's lives
and in the pleasure they gave. Less was likely to be learned about measurement itself
because the focus was on the social function it served. More than measurement was
learned because that activity was embedded in an event of greater social substance.
In the general discussion at the end of Chapter 3, it was argued that guided experience
of measurement in school had probably led to the greater precision observed when
children in Years 2 and 3 spoke of units than when those in Year 1 did so. Yet precision
does not necessarily imply conceptual understanding. Even in school, where the social
setting is overtly dedicated to learning, and the focus is clearly on measurement itself,
children's perceptions of the social meaning of an activity may still influence what is
learned. In the present research, recall of occasions in school when measurement took
place was strikingly specific, and it was the specificity of the procedure that seemed to
be the focus. Precisely how the ruler or metre stick was manipulated on a particular
occasion, specific numbers of units and their addition, and, frequently, writing down the
outcome of a measurement were what children in Years 2 and 3 talked about. The
`social' value children attached to these activities might be described as 'getting the job
222

done'; reflections like ...so we knew the bigger jug held more water (Table 3.09) were
rare. If the goal of an activity is to complete a procedure, it is not difficult to see how
conceptual understanding could be bypassed. For example, fifty per cent of the children
in Year 3 stated that only 'small things' could be measured with a ruler (Chapter 3).
While half of these, when pressed, spoke of measuring a larger object by iterating the
ruler and adding the units, just as many could only suggest making up the full length of
a longer object by placing some other item at the end of the ruler. These children had no
ready access to the idea of measurement as the iteration of a unit; probably the
customary way of deploying the standard school ruler had obscured that. Thus at first
sight, neither home nor school terrain seemed necessarily to favour conceptual
understanding: the conceptual content of children's experiences risked being
overwhelmed by the social in both settings.
This discouraging evidence was balanced, however, by evidence of positive features,
particularly of the home setting. First, as already noted, most measurement activities in
the home served to determine the fit of an item to available space. These featured the
affordances and relative judgements identified by Gibson (1979) and Bryant (1974) as
forerunners of the absolute judgements characteristic of measurement in units.
Referring to the same class of ability, Resnick & Singer (1993) spoke of the
protoquantitative relationship of fittingness and considered this to be the basis of ratio
reasoning, also essential to understanding units. The home setting thus provided
children with the opportunity to acquire important competences underpinning
measurement, and did so in circumstances where familiarity and the enthusiasm
frequently associated with the activities were likely to make them a favourable basis for
future learning. Secondly, measurement typical of the home setting occurred as part of
problem-solving activities and strategies. This was particularly evident in the comments
of children in Years 2 and 3 (Chapter 3), for example in the description of laying a
wooden floor, or of mapping the London underground system. This approach was
highly valued by the Primary Mathematics Framework (Department for Children,
Schools and Families, 2006) which expected learning to occur as the outcome of
problem-solving 'enquiries'. Enjoyment of problem-solving activities in the home may
encourage a positive attitude to problem-solving in school, including the persistence
required, and the present research gave evidence that the home setting could nurture this
engagement.
223

In the interviews, what one might call the demands of the narrative gave evidence of an
additional social influence. One example again concerned units, whose whole purpose is
to make quantification precise. In telling the story of an important event that involved
measurement, quantities expressed in units were often absurdly large, especially in
Years 1 and 2. (Year 3 children were more precise). The younger children never
exaggerated in the direction of smaller numbers of units than were plausible, so that this
was not simply a case of increasing accuracy with age. Rather, large numbers seemed to
be used as markers of the importance of an event. An alternative explanation of this
finding is that this early favouring of larger numbers was an example of a general bias
in language usage towards terms expressing greater, rather than lesser, quantity noted by
Haylock and Cockburn (1989). There was no sign of this bias among the children's
ordinal comparisons in Chapter 4. In the estimation tasks reported in Chapter 5, children
in Years 2 and 3 did make twice as many erroneous judgements of longer than of
shorter, but children in Year 1 showed no such bias. Overall, this explanation is not
persuasive.
A second example of the influence of narrative was the construction of meaning around
the lesser-known measuring instruments children were shown in the second interview,
notably the clock and thermometer. The social function of the clock was so pervasive
that its marking of important events (Haylock and Cockburn, 1989) in the 'narrative' of
daily life took complete precedence over its recording of the passing of time and the
visible units in which this was measured. The unfamiliar thermometer prompted in
many children a network of associations reminiscent of Vygotsky's (1986) 'chain
complexes' (forerunners by some distance of fully-developed concepts) in an effort to
characterise its function. Thus its red ink was associated with blood; blood and the word
`temperature' were associated with illness and hospitals; while the colour red and the
idea of rising heat, boosted by memories of a television cartoon, prompted the notion of
an explosion.
It is possible that the cognitive importance of this type of narration by individuals has
been underestimated. In the literature, where a tradition stemming from the work of
Vygotsky has prioritised social over individual construction of meaning (e.g. Hoyles,
Healy & Sutherland 1991; Noss & Hoyles 1992; Sfard 2001), the focus in classroom
research has been on dialogic features of cognitive construction where partners in the
process have typically been seen equally as producers. The potential represented by the
receptive role of listener (likely to be an attentive adult) has been largely ignored. This
224

role can be useful in two ways. Firstly, a narrative is directed at an audience and the
listener provides that audience. The narrative situation requires an effort to engage, to
convince, perhaps to justify a stance, all conducive to the exercise of reasoning skills,
which have an important part to play in conceptual development. Secondly, such
narrations are likely to give evidence of both social and conceptual components of the
narrator's thinking, and did so in the current research. The narrations, (sometimes seen,
as in the current research, in the context of an interview) offer an opportunity to the
reflective listener to privilege the development of the conceptual components by skilful
questions or prompts. The science education literature has provided many hundreds of
examples of 'interviews about instances' and 'interviews about events', (Driver, Guesne
& Tiberghien 1985; Driver, Squires, Rushworth & Wood-Robinson 1994) where children's
explanations of science phenomena are elicited in individual interviews. However, the focus
was on children's non-conventional science schemas, and the purpose was to identify
commonalities among these. Little importance seems to have been attached to the social
component of what children may have said, and the transcripts of some interviews show little
attempt to understand what may have been of importance to children (e.g. Vosniadou &
Brewer 1992). With the help of suitably trained adults both in and out of school, it
seems feasible to plan one-to-one conversations where socially-embedded
conceptualisations are accepted and valued but also refined so as to foster cognitive
advance.
An influence that was 'social' in some sense but was hard to pin down concerned height
and the human figure. In the first interview, when asked how they knew the researcher
was taller than themselves, a majority in each year-group said that she must be because
she was an adult or a `teacher'; and when asked whether adults were always taller than
children, only in Year 3 did an appreciable number (just over one-third) allow that there
could be exceptions. It seemed that a 'status' criterion was involved in this judgement of
height. Inconsistently, however, about half the children in each year-group said that they
themselves would be taller if they stood on a table. A detailed analysis in Chapter 4 of
children's comparative judgements of 'tallness' revealed that, among various
complicated displays, only artificially raised human figures gave rise to erroneous
judgements of greater height. It seemed that the notion of height in relation to human
figures incorporated some metaphorical flavour that influenced the children's ordinal
judgements.
225

Thorough attunement to the social context is indispensible to understanding the
subtleties of language usage. Chapter 4 described in some detail potential conceptual
difficulties that might be engendered by the everyday language of length, but these
turned out not to be difficulties for the children concerned. Instead (with the exception
in certain circumstances of human height, already mentioned) their ordinal judgements
as responses to questions about height, length and width turned out to be excellent.
Their mastery of the receptive language skills needed for correct responses was fully
equal to the conceptual demands of the tasks, including the tests of conservation that
constituted the 'complex' tasks in this series. What they had learned from their social
context about the everyday language of length was entirely supportive of their
conceptual development.
Thus there were two aspects to the sheer vitality of the social, as reflected in children's
productive and receptive language in this research, reported respectively in Chapters 3
and 4. On the one hand measurement in the social context of the home could be highly
motivating; it produced experiences of measurement that could form a sound basis for
quantification with units in school; and it provided problem-solving opportunities as the
basis for strategy development. Social aspects of school procedures encouraged an
appetite for detail and accuracy. The known, everyday language of length, acquired in a
variety of social contexts, was navigated with ease.
When children were confronted with the unknown, however, the picture was rather
different. A drive to produce meaning took control, sometimes with positive effects for
learning, and sometimes with negative. In one context, for example, it helped children
to articulate their knowledge of fractional units (see Appendix 3), while in another it led
them to decline the suggestion that thermometers measured anything, in favour of a
view that the instrument indicated whether you were ill, or was to do with blood. But in
neither case did the drive to create meaning seem a natural ally of the reflection
necessary for conceptual understanding. The social requirement to communicate an
effective narrative, of which the first interview gave numerous examples, was similarly
likely to override reflection. In one way or another, it seemed, social resources stood
ever-ready to fill the gaps in conceptual understanding, and it is the difficult task of
pedagogy to help children to make a distinction between the two. It was suggested
above that advantage could be taken of children's narrations to strengthen burgeoning
conceptual elements within them. But the idea that teachers can build on children's
informal experience in any straightforward way must be considered problematic.
226

8.2.5 Reflections on earlier research
In this section, perspectives in the literature reviewed in Chapter 1 are revisited.
The paradoxical role of a logico-mathematical framework
The first reflection is far from new, but it retains its importance because a bias it
identifies is perennially attractive. That is, the high status of logico-mathematical theory
seems to exert a kind of gravitational pull on the study of the psychological
development of mathematical understanding. Clearly the mathematics involved in
measurement must provide the concepts whose development is studied, but frequently
the mathematics also supplies the types of explanation offered for experimental results,
where no independent argument or evidence is offered for their validity, and where the
psychological component is missing. Thus, Piaget (1965) explains a certain type of
error in seriation tasks by stating that children have not yet integrated their separate
understanding of ordinal and cardinal number. This integration also logically underlies
ability to understand units. Yet in the 'towers' task, at a stage where such integration is
supposed to be complete, it still does not occur to children to iterate a makeshift unit in
order to measure. At this point Piaget must introduce a further layer of explanation: he
contends that the continuous length to be measured is not experienced as comparable
with separate units (Piaget et al., 1960). It is not clear how either the first or the later
explanation could be justified empirically, but the logical allure of such explanations
can divert the researcher from a critique of their relevance.
A second and particularly important example is furnished by the definition of
measurement adopted by the same author and woven into every aspect of his account:
To measure is to take out of a whole one element, taken as a unit, and to transpose this unit on the remainder of a whole: measurement is therefore a synthesis of subdivision and change of position. (Piaget et al., 1960:3)
The issue here is not that of relevance: this definition, after all, does capture the logical
essence of iterating a unit in measurement. However, it also suggests that the unit
remains part of the object measured, rather than separate but equivalent to part of its
length. This is not obviously consistent with transitive inference as a fundamental
feature of measurement, where the length of the object measured and the length
embodied in the measuring device are logically distinct, and so available for
comparison. Now this apparent contradiction can easily be dealt with within an overall
logical framework. But the researcher accepting these conceptual guides can be left at a
227

loss when their features are played out in concrete terms. In the present research,
apparent failure to treat the line measured and the measuring device as independent
embodiments of length led children to cover up the line with the device, hampering the
whole measurement operation, and raising doubts about their understanding of transitive
inference. Some also insisted that long objects could not be measured with 'short'
rulers; measurement by iteration of the ruler as a unit or group of units apparently did
not occur to them. Which of the two types of difficulty should be seen as more
fundamental? Should such findings indeed be seen as entirely separable
psychologically, and each type of finding be investigated as an independent
phenomenon? More recent research has generally taken the latter approach, but it has
led to a field containing many isolated studies.
Researchers who avoid acceptance of the Piagetian logical framework can still accept
the plentiful a priori guidance it offers as to 'where to look' for fruitful areas of
empirical enquiry. In the first example given above, discussion of the theoretical
integration of ordinal with cardinal number suggests that children may indeed struggle
to grasp how a number sequence marks amount on a measuring device. So it proved in
the present research.
The value of surveys
Concerns about the insecurity of concepts underlying measurement, identified in
surveys of mathematical performance, were mostly borne out by the present research.
While children conserved length with ease in traditional conservation tasks (reported in
Chapter 4), they failed to do so in the context of the measurement tasks, just as they had
in practical contexts used in surveys (e.g. Department of Education and Science, 1981).
The measurement tasks and the interviews in the present research also provided
examples of apparent failure to understand measurement as iteration of a unit; of
transitivity (Brown et al., 1995); of the inverse relation between size and number of
units (Brown et al., 1995; Kouba et al., 1988); of sub-division of units, and that larger
units may be made up of smaller ones (Hiebert, 1981); and of general inaccuracy in
measurement (Hiebert, 1981). Despite doubts about exactly what can be learned from
them, therefore (Kamii and Lewis, 1991; Silver and Kenney, 1993), such surveys (like
the Piagetian heritage) have demonstrated their value in suggesting to researchers
`where to look'.
228

Cultural tools
The general Vygotskian precept that learning is by means of 'cultural tools' has inspired
a number of studies in measurement research (e.g. Nunes et al., 1993; Miller, 1989) but
there is little consistent evidence that conceptual understanding is advanced by the
prominence of the tool within the given culture. Children performed better with a more
familiar device (the ruler in the present research and in Nunes et al. (1993), but worse
with the familiar algorithm for calculating area in the latter study, and with the tape
measure in the current research. Moreover the degree of any beneficial effect varies
with different samples: in the current research, though measuring with the ruler
compared favourably with the cubes and tape, it was still very poor compared with that
of the Nunes et al. sample. Miller notes that socially-induced 'functional fixedness' may
inhibit the extending of any benefit to new contexts. Potential benefits of practices like
`unitising' using materials common in a given social environment (Lamon, 1994)
remain speculative. It seems that in teaching about units, each device should be assessed
for its pedagogic merits, by conceptual rather than social criteria, in a specific teaching
context. The present research, together with a wealth of Piagetian studies (e.g Piaget et
al., 1960:110), demonstrate that salient aspects of the representation of units may distort
conceptual content, and that what may turn out to be salient is not easy to predict. This
seems to apply equally to conventional and experimental representations of units.
Learning in informal contexts
The present research investigated children's experience of informal contexts in which
they learned about measurement, and expected evidence of "a constitutive role in
learning for improvisation...and emergent processes" (Lave & Wenger, 1991: 16). There
was indeed evidence of learning in informal settings, but this did not appear to favour
conceptual development in any straightforward way, and indeed sometimes appeared to
obstruct it. This was discussed in some detail earlier in this chapter. This finding,
however, should be set beside other evidence that sound mathematical models are
indeed developed in non-formal settings where a person's real livelihood is involved
(Nunes, 2010).
Relative judgements
Early development of relative judgements, which were quite sophisticated in some
domains (Feigenson et al., 2004; Resnick 1992; Gibson 1979; Bryant 1974; Carpenter
& Lewis, 1976;) was amply confirmed in the present research by the language and
estimation results.
229

Units
Difficulties regarding units, of which the most fundamental were to do with the general
relationship between larger and smaller units (Lamon, 1996; Nunes and Bryant, 1996;
Davydov,1982; Carpenter & Lewis, 1976; Piaget et al., 1960) were all reflected, in one
way or another, in the findings of the present research.
Principles and procedures
Finally, the debate about the relationship between conceptual and procedural
knowledge, and whether there is evidence that procedures promote conceptual learning
runs through much of the research reviewed. Resnick & Singer (1993); Karmiloff-Smith
(1992) and Piaget et al. (1960) all accord procedural knowledge a fundamental role in
conceptual development. Gravemeijer et al. (2003) and Lamon (1994) considered child-
created procedures to be particularly efficacious in promoting conceptual understanding.
In contrast, Kornilaki & Nunes (2005); Miller (1989) and Carpenter & Lewis (1976)
provided evidence that conceptual understanding might develop independently of
procedures. The present research did not engage with this debate as such; however the
findings did strongly suggest that flawed measuring procedures were the result of
conceptual confusion.
8.2.6 The developmental and the instructional: summary
What classroom implications might, in general terms, be suggested by the results of the
present research?
As stated in Chapter 1, the research was conducted from an individual constructivist
perspective, because socio-cultural accounts seemed unable to explain how fundamental
conceptual difficulties might be overcome at the individual level, except by what
amounted to procedural mastery. This seemed an inadequate mechanism. On the other
hand, while the influence of social factors is offered at its periphery, traditional
individual constructivism gives a rather solipsistic account of cognitive development
with little to say about the mechanisms of learning. Learning occurs, however, and (in a
broad sense) always in a social context.
It was argued earlier in this chapter that the dominance of the social over the cognitive
in children's everyday lives and language has not, on the evidence of the present
research, always been an ally of cognitive advance. So the task for education (long
acknowledged) is to harness dimensions of social experience and activity in and out of
school that are potentially beneficial for learning. The following summarises indications
230

in the present research as to how this might be done. It also identifies conceptual
difficulties that may be developmental in character that are relatively intractable.
Such intractability, discussed in the first section of this chapter, was demonstrated in the
present research by apparent failure to understand some fundamental conceptual
underpinnings of measurement. These were: the inverse relation between size and
number of units; the idea that larger units may 'contain' smaller ones; operational
conservation; operational transitive inference; and how numbers may express amount. It
seemed that for some children neither general developmental factors nor planned
classroom experiences had conferred secure understanding. Previous research, reviewed
in Chapter 1, confirms the intractability of difficulties in establishing these conceptual
underpinnings. Chapters 4 and 5 demonstrated that where children were conceptually
secure, they were so across many novel instantiations of the concepts that they
understood. A tentative conclusion might be that where there are intractable conceptual
problems, there is little point in attempting to overcome them indirectly by offering
children a range of materials, or by teaching a range of activities, designed to induce
understanding. Such instantiations may be used for their intrinsic interest and to
consolidate understanding, but the emphasis should be on frequent, simple explanation
of the principle involved, such as the fact (already mentioned) that a larger number does
not necessarily mean a greater amount of anything. Such 'up front' explanations seem
rather neglected, or deemed unnecessary; for example in the curricular objectives for
measurement in the Primary Mathematics Framework, 2006, discussed in the General
Introduction to this research.
To turn next to the correlations of performance on language, estimation and
measurement tasks with age, reported in Chapter 7: there were no significant
correlations with children's age within any year-group. In itself this does not suggest an
important role for developmental factors in the abilities tested by these tasks. On the
other hand there was (except for estimation), a modest, positive and significant
correlation with age across the sample as a whole. Together with the analyses in
Chapters 4, 5 and 6, which typically show significantly better performance in Year 3
than in Year 1, this suggests an effect of teaching, and perhaps of the children's
everyday experience in other settings, rather than of development. The correlational
evidence is far from conclusive, however, and it could just be that development is slow,
and that is why only a weak relationship is discernible across a sample with this profile.
231

But there is certainly no evidence of strong developmental shifts in understanding, and
there may be, therefore, good scope for effective instruction to make a difference.
In considering effective instruction, it is worth recalling that in Chapter 3, the current
research showed school measurement activities to encourage precision, but to be
detached from the purposes of measurement in the wider world, and probably rather
boring. By contrast, measurement activities at home were in the service of interesting
goals. As far as possible, this should be the rule in the classroom too.
Reference was made above to the harnessing of the social in the service of the cognitive.
It was suggested earlier in this chapter that the importance of the listener to
children's narratives had been underestimated. The narratives considered were those
about events of social importance to the children, where cognitive content was
overridden by the purely social interest of the material. (Excerpts from such narratives
were set out in Chapter 3). It was argued that a predominantly dialogic view of
language interactions had neglected the role of the reflective listener, and how
cognitively useful elements of children's narratives might be noted and encouraged by
such a listener. This is an idea (and a practice) worthy of developing within the
classroom and outside it.
Meanwhile the dialogic model is rapidly developing, to the benefit of classroom
learning. Researchers are currently constructing and testing classroom interactions,
particularly among peers, that may advance conceptual understanding and are pursuing
theoretical understanding of how and why such interactions work, when they do.
8.2.7 Directions for future research
This research featured intensive work with three year-groups in a single school involved
in the same experimental tasks. By these means, a very full picture of the range of the
abilities of this sample in measurement and cognate skills was achieved, and
investigation of possible associations among these was made possible. Experience with
this repeated measures design, together with the results, provides clear indicators as to
how work in the field could be taken forward.
It is safe to say that future research should focus on measurement itself. The poor
measurement ability shown in the present results did not appear to be underlain by
confusion about qualitative comparisons of length, either in language and conceptual
terms, or in estimating length visually: children were very successful in both language
232

and estimation studies. In the former, the one anomalous difficulty regarding the height
of human beings was clearly enough defined not to require further investigation. In
relation to the two younger age-groups, the ways in which language and estimation
ability may mediate measurement ability for individuals, suggested by the correlational
analysis, also deserve further study.
As far as measurement is concerned, we find in the children's apparent confusion about
some of its basic conceptual aspects a clear agenda for further investigation. These basic
aspects are both non-numerical and numerical, and some relate to defining
characteristics of separable units and of scaled devices as such. This being the case, if
aspects of the current design were retained, the cubes and the ruler respectively could
serve as exemplars, and the tape measure be dropped. The number of lines measured
could be reduced to a small set between, say, 11cm and 13 cm in length (the 'medium-
length' set in the current research) since there was no significant difference in children's
success between measuring much longer and much shorter lines. These reductions in
treatment levels would substantially shorten the period of time needed for data
collection, reducing the scope for intrusion of extraneous variables, and for the
possibility of any training effect. In further investigations, the first job would be to
determine whether the present findings regarding measurement are replicated with an
enlarged sample that includes older children and children from a broader range of social
and cultural backgrounds. Going up the present age-range rather than down is indicated
because the correlational analysis showed performance on the measurement tasks for
the oldest group of children to be independent of their language and estimation ability,
so that a focus on measurement among, say, seven to nine-year-olds would be
examining the nature of relatively settled concepts. Finally and ideally, a longitudinal
study, retaining the strengths of the repeated measures design, would enable a greater
focus on developmental questions.
Non-numerical problems of measurement
The length of an object and the units that are used to equal its length when it is
measured are conceptually equivalent: without being identical with its length, the units
conserve the length of the object being measured, and do so when they are physically
separated from it. As discussed at the start of this chapter, some of the behaviours and
statements of the children suggested that many did not wholly distinguish equivalence
from identity, but seemed to be identifying the units with the length to be measured. If
such behaviours and statements are replicated, their meaning should be pursued. The
233

listener role referred to above in connection with narratives would be important here;
some version of the 'think aloud technique' (van Someren, Barnard & Sandberg, 1994)
could be employed.
Numerical problems of measurement
a) The inverse relation between size and number of units is a logical principle in
measurement that is not essentially numerical in character, but apparent failure to
understand it in the present research was always demonstrated in relation to visible
numerals. Further research here does not seem to be necessary. The children's responses
(in the second interview) were generally unambiguous; so were their justifications of
them. The further work needed is work in the classroom where necessary, probably by
direct explanation of this form of the 'more is more' fallacy (cf. Piaget et al., 1960;
Correa et al., 1998).
b) The transition from qualitative to quantitative expressions of amount has been
identified as a key transition for children (Resnick & Singer, 1993; Piaget et al. 1960;)
When children were asked in the present research to say whether their measurement in
units meant that the line was shorter, longer or the same length as a number of units
given by the experimenter, no more than half the responses were correct. Many declined
to make this relative judgement at all. It was suggested above that some had not fully
worked out that the numbers they were considering actually expressed length. But one
must tread warily. Children were very successful in making similar relative judgements,
also involving number, prior to their own measurements (see Chapter 5). There seems
to be great sensitivity here to details of the task, particularly, perhaps, to the exact
language used by the experimenter. It had been hoped that by using the same
experimental materials (ruler, cubes and tape) for both the relative and the absolute
judgements involved, irrelevant influences would be removed, but this precaution
proved insufficient. This is an important area for continued research, as children are
expected to be able to estimate length in absolute terms very early on their school career
(Primary Mathematics Framework, Department for Children, Schools and Families,
2006: Year 1 Block D. Assessment focus: Ma3, Measures). However, careful thought
would need to be given to avoiding results that could be an artefact of the experimental
situation and the language used.
c) Children's utter confusion about how to align a device, even the familiar ruler, when
measuring length, seems best addressed jointly by research and pedagogy, beginning
with investigation of how well children understand the basis of measurement as
234

iteration of a single unit and proceeding, where necessary, to practice this form of
measurement. Devices with simplified, initially un-numbered scales could then be
gradually introduced, as suggested earlier. The routine use of fully conventional devices
such as the ruler, replete with subdivisions, would, where children seemed at all
insecure, be introduced to them with considerable care. The difficulties presented to
children in the current research by the need to take account of fractional units and the
extent to which (it was suspected) they took evasive action underlines the necessity of
careful nurturing of basic understanding, quite possibly into late primary education. The
project of Gravemeijer et al., (2003), reviewed in Chapter 1, is an excellent example of
the construction in the classroom of understanding of units.
8.2.8 Concluding remarks
The current findings raise some intriguing questions of a general character. Why does
sound conceptual understanding of amount at the ordinal level fail to be generally
supportive of measurement with units? How is it that successful performance across a
wide variety of materials is the rule for ordinal comparisons, while the physical
appearance of some of the same materials seems to be a decisive factor in failures of
measurement itself? What exactly is the influence of specific social experiences of
measurement on conceptual understanding, either at home or in school? It is hoped that
future research will cast light on these questions.
235
References
Aguiar, A., & Baillargeon, R. (1999). 2-5 months olds' reasoning about when objects
should and should not be occluded. Cognitive Psychology, 39, 166-157.
Behr, M., Harel, G., Post, T., & Lesh, R. (1992). Rational number, ratio, proportion. In
D. A. Grouws (Ed.) Handbook of Research on Mathematics Teaching and
Learning. New York: Macmillan.
Bergmann, G. & Spence, K. (1944). The logic of psychophysical measurement.
Psychological Review, 51(1), 1-24.
Black, P., Harrison, C., Lee, C., Marshall, B. & Wiliam, D. (2002) Working inside the
Black Box. London: King's College Department of Education and Professional
Studies.
Boulton-Lewis, G. M. (1987). Recent cognitive theories applied to sequential length
measuring knowledge in young children. British Journal of Educational
Psychology, 57, 330-342.
Bower, T., Broughton, J., & Moore, M. (1971). The development of the object concept as
manifested by changes in the tracking behaviour of infants between 7 and 20 weeks
of age. Journal of Experimental Child Psychology, 11, 182-193.
Bower, T. (1974). Development in Infancy. San Francisco: Freeman.
Bower, T. & Paterson, J. (1973). The separation of place, movement and time in the
world of the infant. Journal of Experimental Child Psychology, 15, 161-168.
de Boysson Bardies, B., & O'Regan, K. (1973). What children do in spite of adult
hypotheses. Nature, 246, 531-534.
Braine, M. D. S. (1959). The ontogeny of certain logical operations: Piaget's formulation
examined by non-verbal methods. Psychological Monographs: General and
Applied, 73(5, Whole no. 475), 799-810.
Brainerd, C. J. (1973). Order of acquisition of transitivity, conservation and class
inclusion of length and weight. Developmental Psychology, 8(1), 105-116.
Breslow, L. (1981). Reevaluation of the literature on the development of transitive
inferences. Psychological Bulletin, 89 (2), 325-351.
Briars, D., & Siegler, R.S. (1984). A featural analysis of preschoolers' counting
knowledge. Developmental Psychology, 24, 324-334.
236

Brown, M., Blondel, E., Simon, S. & Black, P. (1995). Progression in measuring.
Research Papers in Education, 10(2) 143-170.
Bryant, P. (1974). Perception and Understanding in Young Children. London: Methuen.
Bryant, P. & Kopytynska, H. (1976). Spontaneous measurement in young children.
Nature 260, 773.
Bryant, P. & Trebasso, T. (1971). Transitive inferences and memory in young children.
Nature 232, 456-458.
Carpenter, T.P. & Lewis, R. (1976). The development of a concept of a standard unit of
measure in young children. Journal of Research in Mathematics Education, 7, 53-
58.
Casler, K., & Kelemen, D. (2005). Young children's rapid learning about artifact
functions. Developmental Science, 8(6), 472-480.
Chomsky, N. (1980). Rules and Representations. Oxford: Basil Blackwell.
Correa, J., Nunes, T. & Bryant, P. (1998). Young children's understanding of division:
the relationship between division terms in a non-computational task. Journal of
Educational Psychology, 90(2), 321-329.
Cowan, R. (1982). Children's perception of length. Educational Psychology, 2(1), 73-77.
Darvizeh, Z., & Spencer, C. (1984). How do young children learn novel routes? The
importance of landmarks in the retracing of routes through the large-scale
environment. Environmental Education and Information, 3, 97-105. Cited in
Spencer, C., Blades, M. & Morsley, K (1989). The Child in the Physical
Environment: the Development of Spatial Knowledge and Cognition. Chichester:
Wiley
Davydov, V.V., (1982). The psychological characteristics of the formation of elementary
mathematics operations in children. In T. P. Carpenter, J. M. Moser & T. Romberg,
(Eds). Addition and Subtraction: a Cognitive Perspective. Hillsdale, N. J. :
Lawrence Erlbaum Associates.
Department of Children, Schools and Families (2006). National Strategy: Primary
Mathematics Framework. Qualifications and Curriculum Development Agency.
Department of Education (2010). National Strategy: Primary Mathematics Framework.
Qualifications and Curriculum Development Agency
237

Department of Education, National Curriculum website: Mathematics Key Stage 1.
URL:http://curriculum.qcda.gov.uk/key-stages-1-and
2/subjects/mathematics/keystagel/index.aspx Accessed 4.6. 2011.
Department of Education and Employment (1999). National Numeracy Strategy
Department of Education and Science (1981). Science in Schools Report No. 1.
Assessment of Performance Unit. London: HMSO
Donaldson, M. (1978). Children's Minds. London: Fontana
Driver, R., Squires, A., Rushworth, P. and Wood-Robinson, V. (1994). Making Sense of
Secondary Science. London : Routledge.
R. Driver, E. Guesne & A. Tiberghien (Eds.) (1985). Children's ideas in Science Milton
Keynes: Open University Press.
Feigenson, L., Cary, S., & Spelke, E. (2002) Infants' discrimination of number vs.
continuous extent. Cognitive Psychology 44, 33-66.
Feigenson, L., Dehaene, S., & Spelke, E. (2004). Core systems of number. Trends in
Cognitive Sciences 8(7), 307-314.
Freeman, N. (1980). Strategies of Representation in Young Children. London: Academic
Press. Cited in Wales, R. (1990). In R. Grieve & M. Hughes (Eds.), 1990.
Understanding Children: Essays in Honour of Margaret Donaldson. Oxford:
Blackwell.
Geary, D. C. (1995). Reflections of evolution and culture in children's cognition:
Implications for mathematical development and instruction. American
Psychologist, 50, 24-37.
Gelman, R. & Gallistel, C.R. (1978). The Child's Understanding of Number. Cambridge,
Mass: Harvard University Press
Gentner, D. (1983). Structure-mapping: a theoretical framework for analogy. Cognitive
Science 7, 155-170
Gibson, J. J. (1979). The Ecological Approach to Visual Perception. Boston, Mass:
Houghton Mifflin Company
Goswami, U. (1995). Transitive relational mappings in three- and four-year-olds: the
analogy of Goldilocks and the three bears. Child Development, 66, 877-892.
238

Gravemeijer, K., Bowers, J., & Stephan, M. (2003). A hypothetical learning trajectory on
measurement and flexible arithmetic. In M. Stephan, J. Bowers, P. Cobb, & K.
Gravemeijer (Eds.), Supporting students' development of measuring conceptions.
Journal of Research in Mathematics Education Monograph 12, (pp. 51-66).
Reston, VA: NCTM.
Guin, D. & Trouche, L. (1999) The complex process of converting tools into
mathematical instruments: the case of calculators. International Journal of
Computers for Mathematical Learning 3(3), 195-227.
Halford, G. S. (1982). The Development of Thought. Hillsdale, N. J. : Erlbaum.
Halford, G. S. (1992). Analogical reasoning and conceptual complexity in cognitive
development. Human Development, 35, 193-217.
Halford, G. & Wilson, W. (1980). A category theory approach to cognitive development.
Cognitive Psychology 12, 356-411.
Harris, P. L. & Bassett, E. (1975). Transitive inferences by 4-year-old children?
Developmental Psychology, 11, 875-876.
Hart, A. (1981). Children's spatial representation of the landscape. In L. Liben, A.
Patterson & N. Newcombe (Eds.) Spatial Representation and Behaviour Across the
Lifespan. New York: Academic Press
Hart, K. M. (2004). Children's Understanding of Mathematics : 11-16. Eastbourne:
Anthony Rowe Publishing Services.
Haylock, D. & Cockburn, A. (1989). Understanding Early Years Mathematics. London:
Paul Chapman Publishing Ltd.
Hespos, S. & Baillargeon, R. (2001). Reasoning about containment events in very young
infants. Cognition, 78(3), 207-245.
Hiebert, J. (1981). Cognitive development and learning linear measurement. Journal for
Research in Mathematics Education, 12(3), 197-211.
Houde, 0. (2000). Inhibition and cognitive development: object, number, categorization
and reasoning. Cognitive Development 15, 63-73.
Howe, C., Nunes, T., & Bryant, P. (2010) Intensive Quantities: Why they matter to
developmental research. British Journal of Developmental Psychology, 28, 307-
329.
239

Howe, C., Nunes, T., Bryant, P., Bell, D., & Desli, D. (2010). Intensive quantities:
Towards their recognition at primary school level. British Journal of Educational
Psychology Monograph Series II, Part 7, Understanding Number Development and
Difficulties, 101-108.
Hoyles, C., Healy, L., & Sutherland, R., (1991). Patterns of discussion between pupil
pairs in computer and non-computer environments. Journal of Computer Assisted
Learning, 7, 210-228.
IES National Center for Statistics (2003) National Assessment of Educational Progress
http://nces.ed.gov/nationsreportcard/mathematics/contentstrands.asp. Accessed
5.6.2011.
Johnson-Laird, P.N. (1983). Mental Models. Cambridge: Cambridge University Press.
Kamii, C. & Clark, F. (1997). Measurement of length: the need for a better approach to
teaching. School Science and Mathematics, 97(3), 16-21.
Kamii, C. & Lewis, B. (1991). Achievement tests in primary mathematics: perpetuating
lower-order thinking. Arithmetic Teacher, 38(9), 4 -9.
Karmiloff-Smith, A. (1984). Children's problem-solving. In M. E. Lamb, A. L. Brown &
B. Rogoff (Eds.) Advances in Developmental Psychology (Vol. 3): London:
Erlbaum.
Karmiloff-Smith, A. (1992). Beyond Modularity. Cambridge, Mass: MIT Press
Karoubi, L., Maire, P., & Ouvrard, C. (2008). Le Petit Larousse 2009 Dictionaire. Paris:
Gerard Hamon
Kato, Y. (1984). Development of spatial recognition in preschool children: on Piaget's
hypothesis of topological space. Paper presented to 'Forum Espace IV', National
Institute of Psychobiology, Marseilles, France. Cited in Spencer, C., Blades, M. &
Morsley, K (1989) The Child in the Physical Environment: the Development of
Spatial Knowledge and Cognition. Chichester: Wiley
Kohler, W. (1918). Simple structural functions in the chimpanzee's and in the chicken's
representations. Reprinted in Ellis, W.D. (1938) A Sourcebook of Gestalt
Psychology. London: Routledge
Kornilaki, E. & Nunes, T. (2005). Generalising principles in spite of procedural
differences: children's understanding of division. Cognitive Development, 20, 388-
406.
240

Kouba, C., Brown, C., Carpenter, T., Lindquist, M., Silver, E. & Swafford, J. (1988).
Results of the fourth NAEP assessment of mathematics: measurement, geometry,
data interpretation, attitudes and other topics. Arithmetic Teacher, 35(8), 10-16.
Lamon, S.J. (1994). Ratio and proportion: cognitive foundations in unitising and
norming. In J. Hiebert, & M. Behr, (Eds.) (1988). Number Concepts and
Operations in the Middle Grades Reston, VA: National Council for Teachers of
Mathematics.
Lamon, S.J. (1996). The development of unitizing: its role in children's partitioning
strategies. Journal for Research in Mathematics Education, 27(2), 170-193.
Laurendeau, M. & Pinard, A. (1970). The Development of the Concept of Space in the
Child New York: International Universities Press.
Lave, J. & Wenger, E. (1991). Situated Learning: Legitimate Peripheral Participation.
Cambridge: Cambridge University Press.
Lawrenson, W. & Bryant, P.E. (1972). Absolute and relative codes in young children.
Journal of Child Psychology and Psychiatry, 13, 25-35.
Maier, N. R. F. (1931). Reasoning in Humans: 2. The solution of a problem and its
appearance in consciousness. Journal of Comparative Psychology, 12, 181-194.
Markovits, H., Dumas, C. & Malfait, N. (1995). Understanding transitivity of a spatial
relationship: a developmental analysis. Journal of Experimental Child Psychology
59, 124-141.
Martin, J. L. (1976b). A test with selected topological properties of Piaget's hypothesis
concerning the spatial representation of the young child. Journal for research in
Mathematics Education, 7, 8-24. Cited in Spencer, C., Blades, M. & Morsley, K
(1989) The child in the Physical Environment: the Development of Spatial
Knowledge and Cognition Chichester: Wiley
Meck, W. H. & Church, R. M., (1983). A mode control model of counting and timing
processes. Journal of Experimental Psychology: Animal Behavior Processes, 9(3),
320-334.
Meltzoff, A. & Moore, M. (1998). Object representation, identity, and the paradox of
early permanence: Steps toward a new framework. Infant Behavior and
Development, 21(2) 201-235.
241

Miller, K. F. (1984). Child as the measurer of all things: measurement procedures and the
development of quantitative concepts. In C. Sophian (Ed.) Origins of Cognitive
Skills: The Eighteenth Annual Carnegie Symposium on Cognition.
Miller, K. F. (1989). Measurement as a tool for thought: the role of measuring procedures
in children's understanding of quantitative invariance. Developmental Psychology,
25(4), 589-60.
Miller, S. A. (1976). Non-verbal assessment of Piagetian concepts. Psychological
Bulletin, 83, 405-430.
Moore, M. & Melzoff, A. (1999). New findings on object permanence: a developmental
difference between two types of occlusion. British Journal of Developmental
Psychology, 17, 623-644.
Munakata, Y., McClelland, J. L., Johnson, M. J., & Siegler, R. S. (1997). Rethinking
infant knowledge: towards an adaptive process account of successes and failures in
object permanence tasks. Psychological Review, 104 (4), 686-713.
Murray, J. P. & Youniss, J. (1968). Achievement of inferential transitivity and its relation
to serial ordering. Child Development, 39, 1259 — 1268.
Nagel, E. (1930). Measurement. Erkentniss, 2, 313-333.
Neilson, I. (1977). A re-interpretation of the development of the object concept.
Unpublished PhD thesis, University of Edinburgh. Cited in Bower, T. (1982)
Development in Infancy. San Francisco: W.H.Freeman
Noss, R. & Hoyles, C. (1992). Looking back and looking forward. In R. Noss & C.
Hoyles (Eds.) Learning Mathematics and Logo. Cambridge, Mass.: MIT Press
Nunes, T. (2010). Continuities and discontinuities between informal and scientific
mathematical thinking: insights for education. Proceedings of the 34th conference
of the International Group for the Psychology of Mathematics Education, Brazil,
Vol 1.
Nunes, T. (2008). Understanding rational numbers. Conference paper, EARL". Budapest.
Nunes, T., & Bryant, P. (1996). Children Doing Mathematics. Oxford: Blackwell
Publishers Ltd.
Nunes, T. & Bryant, P. (2009). Understanding rational numbers and intensive quantities.
Key understandings in mathematics learning: Paper 3. Nuffield Foundation.
242

Nunes, T., Bryant, P., Hurry, J. & Pretzlik, U. (2006). Fractions: difficult but crucial in
mathematics learning. Teaching and Learning Research Brief No. 13, TLRP.
Nunes, T., Bryant, P., Pretzlik, U., Bell, D., Evans, D. & Wade, J. (2004). Children's
understanding of fractions. Paper presented at the ARDECO symposium, Paris.
Nunes, T., Light, P., & Mason, J. (1993). Tools for thought: the measurement of length
and area. Learning and Instruction, 3, 39-54.
Pears, R. & Bryant, P. (1990). Transitive inferences by young children about spatial
position. British Journal of Psychology, 81, 497-510.
J. Pearsall (Ed.) (2001). Concise Oxford English Dictionary. Oxford: Oxford University
Press.
Petitto, A. L. (1990). Development of numberline and measurement concepts. Cognition
and Instruction 7(1) 55-78.
Piaget, J. ( 1954). The Construction of Reality in the Child. New York: Basic Books
Piaget, J. ( 1965). The Child's Conception of Number. New York: W. W. Norton & Co.
Piaget, J. (1970). The Child's Conception of Movement and Speed London: Routledge &
Kegan Paul
Piaget, J. & Inhelder, B. (1956). The Child's Conception of Space. London: Routledge &
Kegan Paul
Piaget, J. & Inhelder, B. (1964). The Early Growth of Logic in the Child. New York:
Harper & Row
Piaget, J., Inhelder, B. & Szeminska (1948). Geometrie Spontanee de l 'Enfant. Paris:
Presses Universitaires de France.
Piaget, J., Inhelder, B. & Szeminska, A. (1960). The Child's Conception of Geometry.
London: Routledge & Kegan Paul
Pick, H. & Lockman, J. (1981). From frames of reference to spatial representations. In L.
Liben, A. Patterson & N. Newcombe (Eds.) Spatial Represntation and Behaviour
Across the Life Span. New York: Academic Press.
Pine, K. & Messer, D. (1999). What children do and what children know: Looking
beyond success using Karmiloff-Smith's RR framework. New Ideas in Psychology,
17, 17-30.
243
Pine, K. & Messer, D. (2003). The development of representations as children learn
about balancing. British Journal of developmental Psychology, 21, 285-301.
Philips, S. & Tolmie, A. (2007). Children's performance on and understanding of the
balance scale problem: the effects of parental support. Infant and Child
development, 16(1), 95-117.
Qualifications and Curriculum Development Agency (2010). Advance report on the new
national curriculum, untitled. http://www.qcda.gov.uld. Accessed 4.8.2011.
Rakoczy, H., Hamann, K., Warneken, F. & Tomasello, M. (2010) Bigger knows better:
young children selectively learn rule games from adults rather than from peers.
British Journal of Developmental Psychology, 28(4), 785-798.
Resnick, L. B. (1992). From protoquantities to operators: building mathematical
competence on a foundation of everyday knowledge. In G. Leinhardt, R. Putnam &
R.A. Hattrup (Eds.) Analysis of Arithmetic for Mathematics Teaching. Hove:
Lawrence Erlbaum Associates.
Resnick, L.B., & Singer, J. (1993). Protoquantitative origins of ratio reasoning. In T. P.
Carpenter, E. Fennema & T. A. Romberg (Eds.) Rational Numbers: An integration
of research. Hillsdale, N. J. : Lawrence Erlbaum Associates Inc.
Riley, C. & Trabasso, T. (1974). Comparatives, logical structures and encoding in a
transitive inference task. Journal of Experimental Child Psychology, 17, 187-203.
Rittle-Johnson, B. & Siegler, R.S. (1998). The relation between conceptual and
procedural knowledge in learning mathematics: A review of the literature. In C.
Donlan (Ed.) The Development of Mathematical Skills. Hove: Psychology Press.
Ross, H. E. (1997). On the possible relations between discriminability and apparent
magnitude. British Journal of Mathematical and Statistical Psychology (1997),
50, 187-203.
Russell, J. (1981). Children's memory for the premises in a transitive measurement task
assessed by elicited and spontaneous justifications. Journal of Experimental Child
Psychology, 31, 42-63.
Russell, J. (1987). Reasons for retaining the view that there is perceptual development in
childhood. In J. Russell (Ed.), Philosophical Perspectives on Developmental
Psychology. Oxford: Basil Blackwell Ltd.
Ryle, G. (1949). The Concept of Mind. Hutchinson. [Harmondsworth: Peregrine Books
244

1963]
de Schoenen, S. & Bower, T. (1978). The understanding of spatial relations. Paper
presented at Biannual round Table on Cognitive development in Infancy, Paris,
March. Cited in Bower, T. (1982) Development in Infancy. San Francisco: W. H.
Freeman.
Schools Examinations and Assessment Council (1991). APU Mathematics Monitoring
(Phase 2). Slough: NFER.
Sfard, A. (2001). There is more to discourse than meets the ears: looking at thinking as
communicating to learn more about mathematical learning. Educational Studies in
Mathematics, 46, 13-57.
Shusterman, A., Lee, S. A., & Spelke, E. (2008). Young children's spontaneous use of
geometry in maps. Developmental Science 11(2): Fl-F7.
Siegler, R. S. (1996). Emerging Minds. Oxford: Oxford University Press
Siegler, R. S. & Opfer, J. E. (2003). The development of numerical estimation: evidence
for multiple representations of numerical quantity. Psychological Science, 14(3),
237-243.
Silver, E. & Kenney, P. (1993). An examination of the relationships between the 1990
NAEP mathematics items for Grade 8 and selected themes from the NCTM
standards. Journal for Research in Mathematics Education, 24(2), 159-171.
Simon, H. A. (1979). Rational decision making in business organizations. The American
Economic Review 69(4), 493-513.
Smedslund, J. (1963). Development of concrete transitivity of length in children. Child
Development, 34, 389-405.
van Someren, M. W., Barnard, Y.F. & Sandberg, J. A. C. (1994). The Think Aloud
Method: a Practical Guide to Modelling Cognitive Processes. London: Academic
Press
Spelke, E. (1990). Principles of object perception. Cognitive Science 14, 29-56.
Spence, K.W. (1937). The differential response in animals to stimuli varying within a
single dimension. Psychological Review, 44, 430-44.
Spencer, C., Blades, M. & Morsley, K. (1989). The child in the Physical Environment:
the Development of Spatial Knowledge and Cognition. Chichester: Wiley
245

Squire, S. & Bryant, P. (2003). Children's understanding and misunderstanding of the
inverse relation in division. British Journal of Developmental Psychology 21, 507-
526.
Steffe, L.P. (1971). Thinking about measurement. ArithmeticTeacher, 18(5), 332-338.
Steffe, L. P., von Glaserfeld, E., Richards, J. & Cobb, P. (1983). Construction of
arithmetical meanings and strategies. New York: Praeger.
Sternberg, R.J. (1980a). Representation and process in linear syllogistic reasoning.
Journal of Experimental Psychology: General, 109, 119-159.
Stevens, S. S. (1946). On the theory of scales of measurement. Science, 103, 677-680.
Stevens, S. S. (1975). Psychophysics. New York: Wiley. Cited in Miller, K.F. (1989)
Measurement as a tool for thought: the role of measuring procedures in children's
understanding of quantitative invariance. Developmental Psychology, 25(4), 589-
60.
Thayer, E. S. & Collyer, C. E. (1978). The development of transitive inference: a review
of recent approaches. Psychological Bulletin, 85, 1327-1343.
Thompson, T. D. & Preston, R. (2004). Measurement in the middle grades: insights from
NAEP and TIMSS. Mathematics Teaching in the Middle School, 9(9), 514-519.
Trabasso, T. R. (1977). The role of memory as a system in making transitive inferences.
In R. V. Kail & J. W. Hagen (Eds) Perspectives on the Development of Memory
and Cognition. London: Wiley
Trabasso, T.R., Riley, C. A. & Wilson, E. G. (1975). The representation of linear order
and spatial strategies in reasoning: a developmental study. In R. J. Falmagne (Ed.)
Reasoning, Representation and Process in Children and Adults. Hillsdale, N.J:
Lawrence Erlbaum Associates.
Vergnaud, G. (1988). Multiplicative Structures. In J.Hiebert & M.Behr, (Eds.) Number
concepts and operations in the middle grades. Reston, VA: National Council of
Teachers of Mathematics.
Vosniadou, S. & Brewer, W. F. (1992). Mental models of the Earth: a study of
conceptual change in childhood. Cognitive Psychology, 24, 535-585.
Vygotsky, L. S. (1986). Thought and Language. Revised edition. Revised and
edited by A. Kozulin, (Ed.). Cambridge, Mass: MIT Press.
246

Wales, R. (1990). Children's pictures. In R. Grieve & M. Hughes Understanding
Children: Essays in Honour of Margaret Donaldson. Oxford: Blackwell
Williams, E. & Shuard, H. (1982) Primary Mathematics Today (3`d ed.). Harlow:
Longman
Woodfield, A. (1987). On the very idea of acquiring a concept. In J. Russell (Ed.),
Philosophical Perspectives on Developmental Psychology. Oxford: Basil
Blackwell.
Wynn, K. & Chiang, W. (1998). Limits to infants' knowledge of objects: the case of
magical appearance. Psychological Science, 9(6), 448-455.
Youniss, J. & Furth, H. (1973) Reasoning and Piaget Nature, Vol. 244, 314-315
Youniss, J. & Murray, J. P. (1970). Transitive inference with non-transitive elements
controlled. Developmental Psychology, 2(2), 167-175.
Zajonc, R. B. (1965). Attitudinal effects of mere exposure. Journal of Personality and
Social Psychology 9 (2, Pt.2): 1-27.
247

Appendices
Appendix 1
Materials used in the research
Figure A.01 Ruler
Figure A.02 Tape measure
Figure A.03 Cubes
Figure A.04 Thermometer
Figure A.05 Weighing machine
Figure A.06 Measuring jug
Figure A.07 Clock
Figure A.08 Marked and numbered strip
Figure A.09 Unmarked strips
Figure A.10 Toy figures
Figure A.11 'Steps' for raising toy figures
248

Figure A.12 Block for raising toy figures
Figure A.13 Toy cars
Figure A.14 2D figures. A: simple; B: complex. Who is the tallest?
Figure A.15 2D crayons. A: simple; B: complex. Which is the widest?
Figure A.16 Lines. A: simple; Which line is shorter than the red one? B: complex:
Which line is shorter than the pink one?
Figure A.17 Lines whose lengths were estimated (red set).
249

Figure A.01 Ruler
250

8\s \ L\s In \II \l‘ 0111.
■er'
\
\‘‘‘‘I
‘‘‘?‘\ c9 17, o4 °49
C-4
's:11 14*
111 1 "'I iii , cr) Ao'C ,en
rc;
1144i.(. \\
11111111 11111M1 111111 11
9 6\S
1,1
Figure A.02 Tape measure
2.5

r■_) 0 0 0 1111.1,11-J '
0 Cl` OD
0 0 173
0 0 4 0' .11111iiititiltitiititaii
cp loin,...!
1,11,11111111111111111111111111111 i t I , , 1„ I 11111111111111111111111iMPIMIffil
■-•-* \ .01 \ 0 C) 7 0 0 0 0 ° 0 0
► 0
**or •--t. **ti
tc•ifasitiego
H 11111111 '
111111111 5
11111111 111111111 111111H1 lIU IiIir impill illyii wilmtililmi 111111111 1 0 1 f
. .... .,
Figure A.03 Cubes
Figure A.04 Thermometer

0 0000000 0 00 0ooNT: N (.0 COI 04 tr
•-••
csl O
r- CNJ Cv) Q tn P.- co
crow
0
. 1111 1111 1 III' lit 11111111141
---
Figure A.05 Weighing machine
-)5;

ml 2 Pirq.
1 Litre
900 — 800 —
7M — --
600 — ,'2 Litre --
0
1 1/2
1 1/4
1 Pint
400
300
200
100
Figure A.06 Measuring jug
Figure A.07 Clock

Nk
Figure A.08 Marked and numbered strip
255

0
=-7
an
Figure A.09 Unmarked strips
256

■IplivintivillnM101111.11901PPWIIIII91”1".!'",o1
Figure A.10 Toy figures
Figure A.11 'Steps' for raising toy figures
Figure A.12 Block for raising toy figures
257

Figure A.13 Toy cars
258

Figure A.14 (A) 2-D figures (simple) Who is the tallest?
259

Figure A.14 (B) 2D figures. 2-D figures (complex) Who is the tallest?
260

Figure A.15 (A) 2D crayons (simple) Which is the widest?
261

Figure A.15 (B) 2D crayons (complex). Which is the widest?
262

Figure A.16 (A): simple. Which line is shorter than the red one?
263

Figure A.16 (B): complex. Which line is shorter than the pink one?
264

Figure A.17 Lines whose lengths were estimated (red set).
265

Appendix Two
Excerpt from the second interview with a Year 2 child, illustrating partial understanding of the relationship between the two scales on the weighing machine.
Experimenter: here you've got two different scales, two different ways of measuring, one there [indicates gram scale] and one there [indicates ounce scale]. Can you see the little g here? [indicates g scale].
Marie-Claire: Grams?
E: Exactly. This scale is measuring the weight in grams and this one, can you see that little 'oz'? It stands for ounces. [Explains oz in terms of parts of a lb (fruit or veg)]. It's a different way of measuring weight. So here we've got grams, here [indicates g scale] and here we've got ounces [indicates oz scale]. Do you want to weigh these? [toys]. [M-C places about 40g of toys in pan]. How much do they weigh?
M-C: Between the 40 and the 60.
E: And what about oz?
M-C: Between the 1 and the 2.
E: So which do you think weighs more, 1 gram or 1 oz?
M-C: Gram
E: Why?
M-C: It's cos they're — I'm looking at the numbers.
E: OK. Tell me about the numbers.
M-C: Cos 20's big, 40's big, 80's big, 100's big.
E: What about these? [indicates oz scale].
M-C: They're quite small for a number, but it's the same kind of thing to tell you some things.
E: When you say it's the same kind of thing even though the number's small, what do you mean?
M-C: It will still tell you the measurement even though it's different numbers. It won't tell you the same, but it's kind of the less of the same.
E: Can you explain that a bit?
M-C: You see when you see this bit here [indicates g scale] that's a bigger number than that bit [indicates oz scale]. Say if I put my hand there and it goes up to there — it goes up to the 4 [indicates 4 on the oz scale]. It goes up to 100 [on the g scale], and it goes up to the 4, and the 3, and 80 and 100, 120.... When it gets to 120 it will tell you what the
266

grams are...and it'll tell you the same, not the same thing, but it will tell you [how]...heavy it is in oz.
E [Removes scales] If I weighed some flour in there, and it came to 2 oz, about how many grams do you think it would be?
M-C: 40?
E: And if I weighed some flour, and it came to 5 oz, about how many grams do you think it would be?
M-C: Can I use my hands? [Counts on fingers] 80?
267

Appendix 3
Some ways in which children reported fractional units when they measured lines.
Child Actual Measurement
(cm)
Reported as
Year 1 1 12.5 A bit longer. To the middle line. A bit longer. Up to the big line near the 12.
2 12.5 Halfway to 13 3 21.3 21 and 3 steps to go
Year 2 1 12.7 A quarter to 13 2 12.5 12 middle
4.6 4 cm and 6 halves 5.2 5 and 2 of them lines
3 12.5 12 and 13 4 13.5 14 and a little bit less 5 13.6 4 more bits, it goes to 14
12.6 4 more mm, it makes 13 5.6 Half 6
6 11.5 Half 11 7 6.5 Half 6 cm 8 12.5 120.5 mm [i.e would be .5 if in cm] 9 5.2 About 1 more, a little chip from 5 10 11.5 About 12 cm, 5 points before it 11 18.75 Just a little bit to 19. 19 and a quarter.
Year 3 1 4.7 4 and a half and 2 mm 2 5.3 5, 3. [i.e. 5cm and 3mm] 3 11.5 Line in the middle from 12 4 11.5 Half of 11
11.5 Half of 12 5 4.6 4 cm and 6 halves 6 12.7 12 rounded up to 13 7 18.5 5 points after 18, so 18 and a half
268