assessing the pedagogical competences of teacher
TRANSCRIPT

E-ISSN 2281-4612
ISSN 2281-3993 Academic Journal of Interdisciplinary Studies
Published by MCSER-CEMAS-Sapienza University of Rome
Vol 2 No 1
March 2013
403
Assessing the Pedagogical Competences of Teacher Educators in the Teacher Education Institution of Pakistan
Tariq Mahmood
PhD Research Fellow
University of Education, Division of Education College road Town ship, Lahore
Corresponding author +923014981592 Email: [email protected]
Dr. Mukhtar Ahmed
Regional Director (Gujranwala),
Allama Iqbal Open University, Islamabad
Muhammad Tanvir Iqbal
PhD Research Fellow University of Education, Division of Education
College road Town ship, Lahore
Doi:10.5901/ajis/2013.2n1p403 Abstract
The study is designed to investigate the prevailing situation of teachers’ pedagogical competencies according to four indicators (subject knowledge, teaching strategy, resource material and assessment criteria) at higher education level. The main objectives of this study were to: assess the teachers’ performance using identified indicators, and compare the quality control system among different institutions and departments of the same institution. The sample of this study was 700 students in the 11 institutions and 636 students responded to this questionnaire hence the response rate was about 90%. A questionnaire was developed to collect data from the sample, and the validation of questionnaire was also ensured. The overall reliability of this questionnaire was established at 0.87 (Chronbach’s Alpha) which shows that the research instrument was reliable. The collected data was analyzed by using inferential statistics (T-Test) through SPSS Software. Data was analyzed to assess the difference in the use of pedagogical skills and techniques by the teachers of different universities. Comparisons inter university and among the different departments of the same university were done. Both significant as well as non-significant results were found among the different departments of universities.
1. Introduction Importance and necessity of any education system is vital for the prosperity of any country or nation. Teachers are the heart and soul of any education system and quality of that education system would be based on many factors but most crucial is quality of teachers. Since higher education caused the socio-economic and moral development of the nation, therefore at this level, would be high expectations with teachers’ performance.
E-ISSN 2281-4612
ISSN 2281-3993 Academic Journal of Interdisciplinary Studies
Published by MCSER-CEMAS-Sapienza University of Rome
Vol 2 No 1
March 2013
404
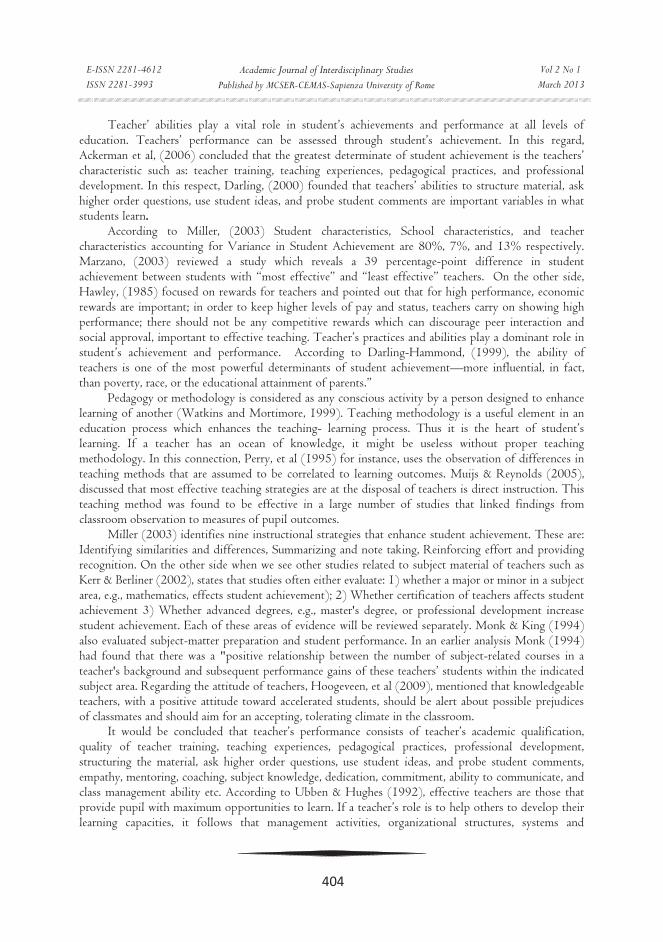
Teacher’ abilities play a vital role in student’s achievements and performance at all levels of education. Teachers’ performance can be assessed through student’s achievement. In this regard, Ackerman et al, (2006) concluded that the greatest determinate of student achievement is the teachers’ characteristic such as: teacher training, teaching experiences, pedagogical practices, and professional development. In this respect, Darling, (2000) founded that teachers’ abilities to structure material, ask higher order questions, use student ideas, and probe student comments are important variables in what students learn.
According to Miller, (2003) Student characteristics, School characteristics, and teacher characteristics accounting for Variance in Student Achievement are 80%, 7%, and 13% respectively. Marzano, (2003) reviewed a study which reveals a 39 percentage-point difference in student achievement between students with “most effective” and “least effective” teachers. On the other side, Hawley, (1985) focused on rewards for teachers and pointed out that for high performance, economic rewards are important; in order to keep higher levels of pay and status, teachers carry on showing high performance; there should not be any competitive rewards which can discourage peer interaction and social approval, important to effective teaching. Teacher’s practices and abilities play a dominant role in student’s achievement and performance. According to Darling-Hammond, (1999), the ability of teachers is one of the most powerful determinants of student achievement—more influential, in fact, than poverty, race, or the educational attainment of parents.”
Pedagogy or methodology is considered as any conscious activity by a person designed to enhance learning of another (Watkins and Mortimore, 1999). Teaching methodology is a useful element in an education process which enhances the teaching- learning process. Thus it is the heart of student’s learning. If a teacher has an ocean of knowledge, it might be useless without proper teaching methodology. In this connection, Perry, et al (1995) for instance, uses the observation of differences in teaching methods that are assumed to be correlated to learning outcomes. Muijs & Reynolds (2005), discussed that most effective teaching strategies are at the disposal of teachers is direct instruction. This teaching method was found to be effective in a large number of studies that linked findings from classroom observation to measures of pupil outcomes.
Miller (2003) identifies nine instructional strategies that enhance student achievement. These are: Identifying similarities and differences, Summarizing and note taking, Reinforcing effort and providing recognition. On the other side when we see other studies related to subject material of teachers such as Kerr & Berliner (2002), states that studies often either evaluate: 1) whether a major or minor in a subject area, e.g., mathematics, effects student achievement); 2) Whether certification of teachers affects student achievement 3) Whether advanced degrees, e.g., master's degree, or professional development increase student achievement. Each of these areas of evidence will be reviewed separately. Monk & King (1994) also evaluated subject-matter preparation and student performance. In an earlier analysis Monk (1994) had found that there was a "positive relationship between the number of subject-related courses in a teacher's background and subsequent performance gains of these teachers’ students within the indicated subject area. Regarding the attitude of teachers, Hoogeveen, et al (2009), mentioned that knowledgeable teachers, with a positive attitude toward accelerated students, should be alert about possible prejudices of classmates and should aim for an accepting, tolerating climate in the classroom.
It would be concluded that teacher’s performance consists of teacher’s academic qualification, quality of teacher training, teaching experiences, pedagogical practices, professional development, structuring the material, ask higher order questions, use student ideas, and probe student comments, empathy, mentoring, coaching, subject knowledge, dedication, commitment, ability to communicate, and class management ability etc. According to Ubben & Hughes (1992), effective teachers are those that provide pupil with maximum opportunities to learn. If a teacher’s role is to help others to develop their learning capacities, it follows that management activities, organizational structures, systems and
E-ISSN 2281-4612
ISSN 2281-3993 Academic Journal of Interdisciplinary Studies
Published by MCSER-CEMAS-Sapienza University of Rome
Vol 2 No 1
March 2013
405
processes need to intersect to maximized teaching and learning opportunities. The manifest propose of the teacher’s role performance is to produce learning in students. The teacher’s authority ultimately rests in the authority of his subject. For such a teacher his subject expertise is absolutely central to his identity.
Subject knowledge of teacher is important but assessment strategy and criteria of teacher is also at the key position to check teaching level of teachers. The collection of student ratings is not the only way or the best way but rather one way to evaluate instruction. Professionals in the field of teacher evaluation advocate a multiple-source and multiple-method approach to evaluating teaching effectiveness. The collection of student ratings should be combined with data collected from different sources using various methods such as peer review, teaching portfolios, classroom-observations, or self-evaluation.
Educational assessment is the process of documenting, usually in measurable terms, knowledge, skills, attitudes and beliefs. Assessment can focus on the individual learner, the learning community (class, workshop, or other organized group of learners), the institution, or the educational system as a whole. The main purposes of educational assessment are to provide teachers with feedback about pupil’s progress, Provide pupils with educative feedback, Motivate pupil, provide a record of progress, Provide a statement of current attainment, Assess pupil’s readiness for future learning. The teacher performance appraisal provides the opportunity in a systematic and structured way outside of every-day working routine, to discuss matters that support and advance target-oriented cooperation.
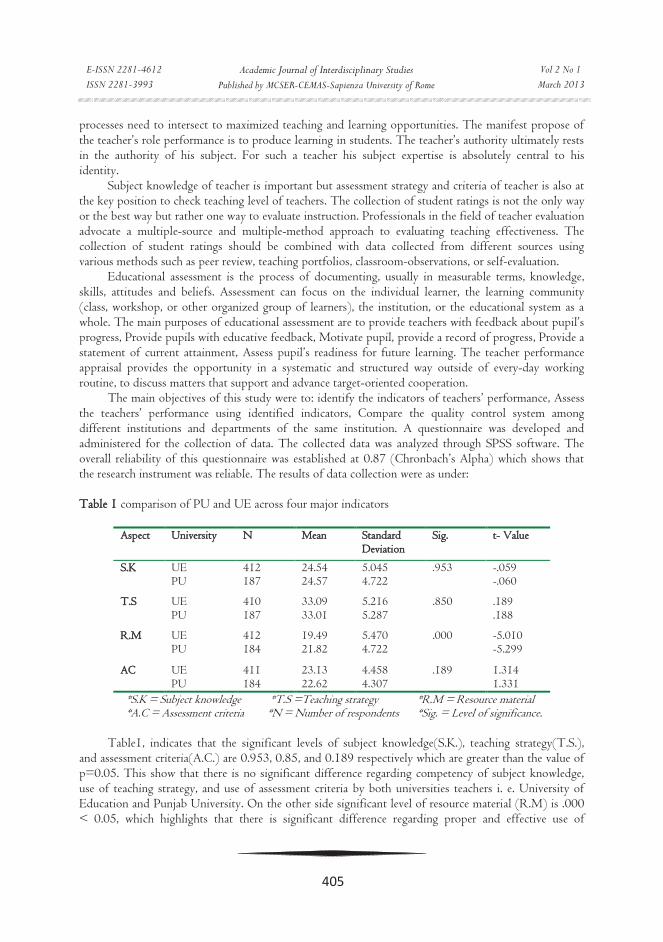
The main objectives of this study were to: identify the indicators of teachers’ performance, Assess the teachers’ performance using identified indicators, Compare the quality control system among different institutions and departments of the same institution. A questionnaire was developed and administered for the collection of data. The collected data was analyzed through SPSS software. The overall reliability of this questionnaire was established at 0.87 (Chronbach’s Alpha) which shows that the research instrument was reliable. The results of data collection were as under: Table 1 comparison of PU and UE across four major indicators
Aspect University N Mean Standard Deviation
Sig. t- Value
S.K UE 412 24.54 5.045 .953 -.059 PU 187 24.57 4.722 -.060
T.S UE 410 33.09 5.216 .850 .189 PU 187 33.01 5.287 .188
R.M UE 412 19.49 5.470 .000 -5.010 PU 184 21.82 4.722 -5.299
AC UE 411 23.13 4.458 .189 1.314 PU 184 22.62 4.307 1.331
*S.K = Subject knowledge *T.S =Teaching strategy *R.M = Resource material *A.C = Assessment criteria *N = Number of respondents *Sig. = Level of significance.
Table1, indicates that the significant levels of subject knowledge(S.K.), teaching strategy(T.S.),
and assessment criteria(A.C.) are 0.953, 0.85, and 0.189 respectively which are greater than the value of p=0.05. This show that there is no significant difference regarding competency of subject knowledge, use of teaching strategy, and use of assessment criteria by both universities teachers i. e. University of Education and Punjab University. On the other side significant level of resource material (R.M) is .000 < 0.05, which highlights that there is significant difference regarding proper and effective use of
E-ISSN 2281-4612
ISSN 2281-3993 Academic Journal of Interdisciplinary Studies
Published by MCSER-CEMAS-Sapienza University of Rome
Vol 2 No 1
March 2013
406
resource material (R.M) between the teachers of both universities. This difference may exist, because UE is newly established university and might be their teachers have scare resources but the results show high degree in UE teachers. This can be shown in graph as under.
Graph I Comparison of four indicators between PU and UE Table 2 Inter-Departmental Comparison of F.C.College about four indicators
Aspect Department N Mean Std. Deviation Sig. t- Value
S.K Dept. of Eng. 19 25.74 2.353 .164 1.432
Dept. of Math. 10 24.40 2.459 1.412
T.S Dept. of Eng. 19 35.21 3.645 .534 .630
Dept. of Math. 10 34.20 4.894 .574
R.M Dept. of Eng. 19 21.11 4.067 .997 .003
Dept. of Math. 10 21.10 3.929 .003
AC Dept. of Eng. 19 26.16 3.060 .897 .131
Dept. of Math. 10 26.00 3.127 .130
*S.K = Subject Knowledge. *T.S = Teaching Strategy *R.M =Resource Material *A.C = Assessment Criteria *N = Number of Respondents *Sig. = Level of significance
Table 2, indicates that the significant levels of subject knowledge(S.K), teaching strategy(T.S),
resource material (R.M), and assessment criteria(A.C) are 0.164,0.534, 0.997, and 0.897 respectively which are greater than the value of p=0.05. This shows that there is no significant difference regarding competency of subject knowledge, use of teaching strategy, proper use of resource material (R.M) and effective use of assessment criteria of teachers of English and Mathematics departments of F.C. College Lahore.
This is more clear in the Graph II as shown below.

E-ISSN 2281-4612
ISSN 2281-3993 Academic Journal of Interdisciplinary Studies
Published by MCSER-CEMAS-Sapienza University of Rome
Vol 2 No 1
March 2013
407
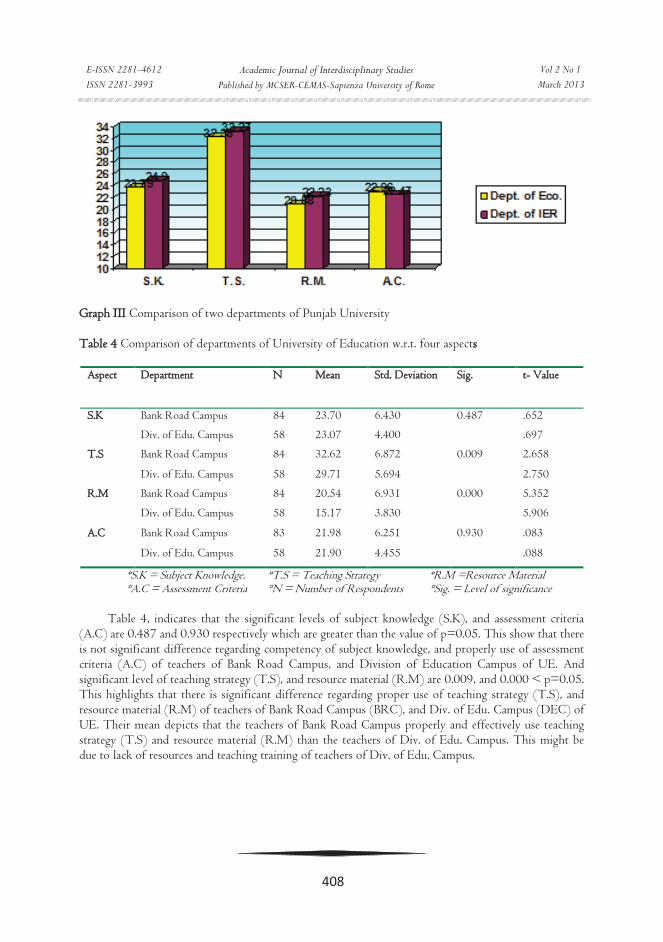
Graph II Mean values of two departments of F. C. College Table 3 Inter-Departmental Comparison about Four Indicators within PU
Aspect Department N Mean Std. Deviation Sig. t- Value
S.K Dept. of Eco. 56 23.79 4.670 0.140 -1.484
Dept. of IER 131 24.90 4.723 -1.490
T.S Dept. of Eco. 56 32.38 5.633 0.288 -1.066
Dept. of IER 131 33.27 5.131 -1.027
R.M Dept. of Eco. 56 20.88 3.673 0.043 -1.808
Dept. of IER 128 22.23 5.072 -2.045
A.C Dept. of Eco. 56 22.96 3.390 0.419 .717
Dept. of IER 128 22.47 4.657 .810
*S.K = Subject Knowledge. *T.S = Teaching Strategy *R.M =Resource Material *A.C = Assessment Criteria *N = Number of Respondents *Sig. = Level of significance
Table 3, indicates that the significance level of subject knowledge(S.K), teaching strategy(T.S),
and assessment criteria(A.C) are 0.140, 0.288, 0.419 respectively which are greater than the value of p=0.05. This shows that there is no significant difference regarding competency of subject knowledge, effective use of teaching strategy, and proper use of assessment criteria (A.C) of Economics and IER departments of PU teachers. And significant level of resource material (R.M) is 0.043 < p=0.05. This highlights that there is significant difference regarding proper use of resource material (R.M) of Economics and IER departments of PU teachers.
It may be clear with the Graph III.
E-ISSN 2281-4612
ISSN 2281-3993 Academic Journal of Interdisciplinary Studies
Published by MCSER-CEMAS-Sapienza University of Rome
Vol 2 No 1
March 2013
408
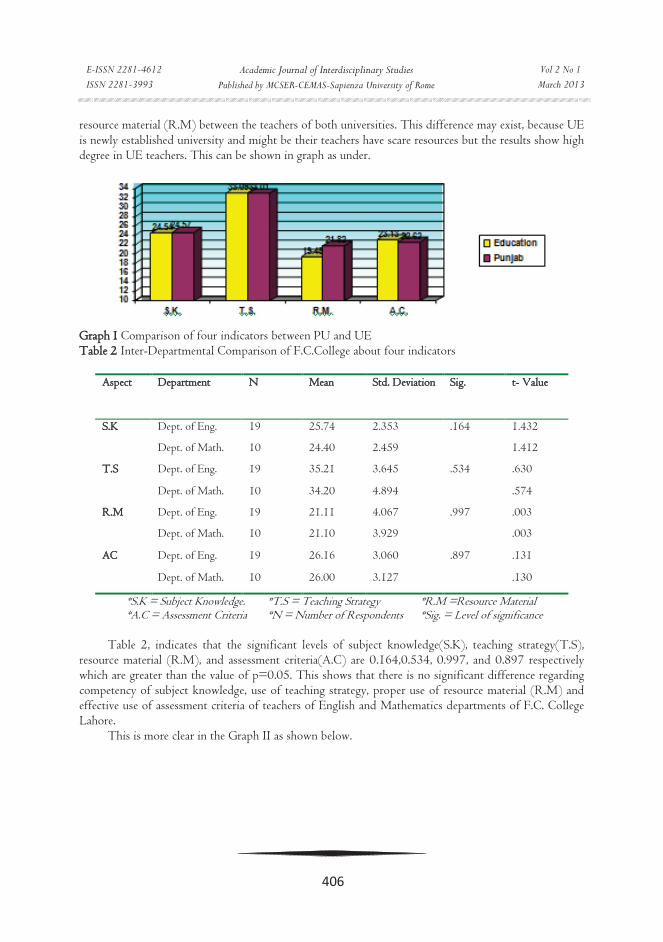
Graph III Comparison of two departments of Punjab University Table 4 Comparison of departments of University of Education w.r.t. four aspects
Aspect Department N Mean Std. Deviation Sig. t- Value
S.K Bank Road Campus 84 23.70 6.430 0.487 .652
Div. of Edu. Campus 58 23.07 4.400 .697
T.S Bank Road Campus 84 32.62 6.872 0.009 2.658
Div. of Edu. Campus 58 29.71 5.694 2.750
R.M Bank Road Campus 84 20.54 6.931 0.000 5.352
Div. of Edu. Campus 58 15.17 3.830 5.906
A.C Bank Road Campus 83 21.98 6.251 0.930 .083
Div. of Edu. Campus 58 21.90 4.455 .088
*S.K = Subject Knowledge. *T.S = Teaching Strategy *R.M =Resource Material *A.C = Assessment Criteria *N = Number of Respondents *Sig. = Level of significance
Table 4, indicates that the significant levels of subject knowledge (S.K), and assessment criteria
(A.C) are 0.487 and 0.930 respectively which are greater than the value of p=0.05. This show that there is not significant difference regarding competency of subject knowledge, and properly use of assessment criteria (A.C) of teachers of Bank Road Campus, and Division of Education Campus of UE. And significant level of teaching strategy (T.S), and resource material (R.M) are 0.009, and 0.000 < p=0.05. This highlights that there is significant difference regarding proper use of teaching strategy (T.S), and resource material (R.M) of teachers of Bank Road Campus (BRC), and Div. of Edu. Campus (DEC) of UE. Their mean depicts that the teachers of Bank Road Campus properly and effectively use teaching strategy (T.S) and resource material (R.M) than the teachers of Div. of Edu. Campus. This might be due to lack of resources and teaching training of teachers of Div. of Edu. Campus.
E-ISSN 2281-4612
ISSN 2281-3993 Academic Journal of Interdisciplinary Studies
Published by MCSER-CEMAS-Sapienza University of Rome
Vol 2 No 1
March 2013
409
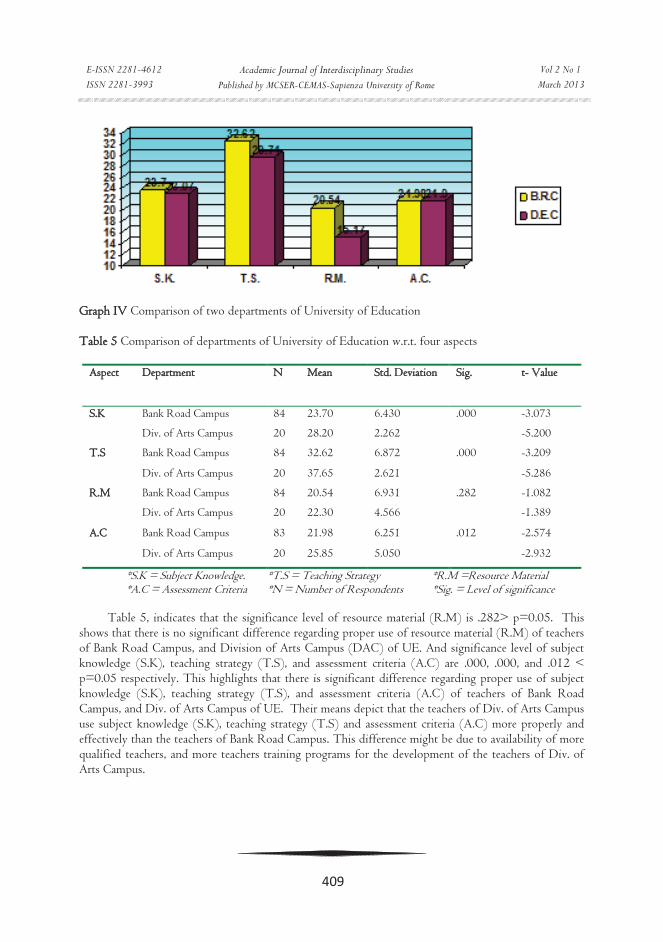
Graph IV Comparison of two departments of University of Education Table 5 Comparison of departments of University of Education w.r.t. four aspects
Aspect Department N Mean Std. Deviation Sig. t- Value
S.K Bank Road Campus 84 23.70 6.430 .000 -3.073
Div. of Arts Campus 20 28.20 2.262 -5.200
T.S Bank Road Campus 84 32.62 6.872 .000 -3.209
Div. of Arts Campus 20 37.65 2.621 -5.286
R.M Bank Road Campus 84 20.54 6.931 .282 -1.082
Div. of Arts Campus 20 22.30 4.566 -1.389
A.C Bank Road Campus 83 21.98 6.251 .012 -2.574
Div. of Arts Campus 20 25.85 5.050 -2.932
*S.K = Subject Knowledge. *T.S = Teaching Strategy *R.M =Resource Material *A.C = Assessment Criteria *N = Number of Respondents *Sig. = Level of significance
Table 5, indicates that the significance level of resource material (R.M) is .282> p=0.05. This
shows that there is no significant difference regarding proper use of resource material (R.M) of teachers of Bank Road Campus, and Division of Arts Campus (DAC) of UE. And significance level of subject knowledge (S.K), teaching strategy (T.S), and assessment criteria (A.C) are .000, .000, and .012 < p=0.05 respectively. This highlights that there is significant difference regarding proper use of subject knowledge (S.K), teaching strategy (T.S), and assessment criteria (A.C) of teachers of Bank Road Campus, and Div. of Arts Campus of UE. Their means depict that the teachers of Div. of Arts Campus use subject knowledge (S.K), teaching strategy (T.S) and assessment criteria (A.C) more properly and effectively than the teachers of Bank Road Campus. This difference might be due to availability of more qualified teachers, and more teachers training programs for the development of the teachers of Div. of Arts Campus.
E-ISSN 2281-4612
ISSN 2281-3993 Academic Journal of Interdisciplinary Studies
Published by MCSER-CEMAS-Sapienza University of Rome
Vol 2 No 1
March 2013
410
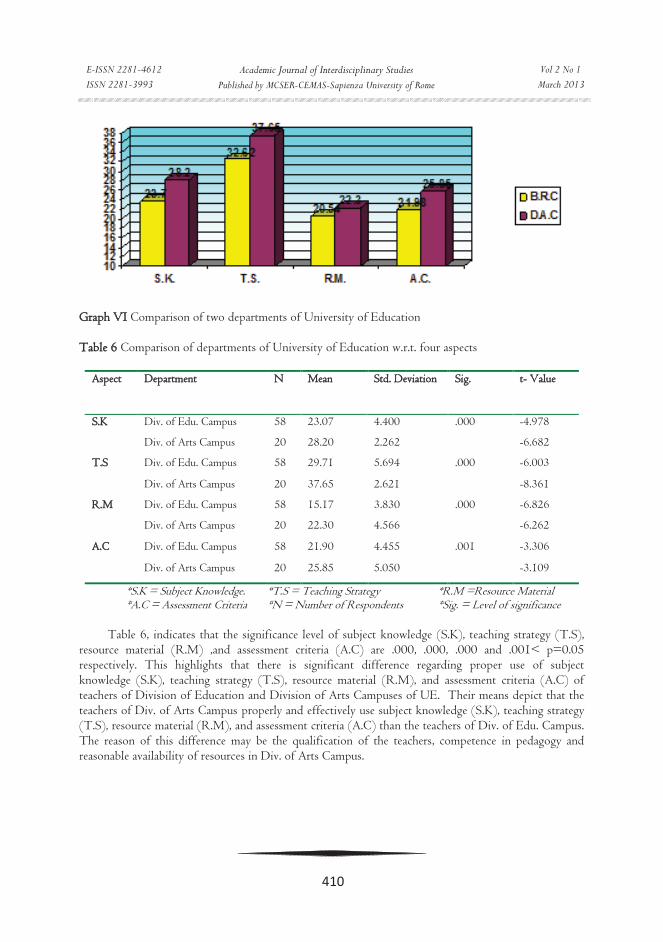
Graph VI Comparison of two departments of University of Education Table 6 Comparison of departments of University of Education w.r.t. four aspects
Aspect Department N Mean Std. Deviation Sig. t- Value
S.K Div. of Edu. Campus 58 23.07 4.400 .000 -4.978
Div. of Arts Campus 20 28.20 2.262 -6.682
T.S Div. of Edu. Campus 58 29.71 5.694 .000 -6.003
Div. of Arts Campus 20 37.65 2.621 -8.361
R.M Div. of Edu. Campus 58 15.17 3.830 .000 -6.826
Div. of Arts Campus 20 22.30 4.566 -6.262
A.C Div. of Edu. Campus 58 21.90 4.455 .001 -3.306
Div. of Arts Campus 20 25.85 5.050 -3.109
*S.K = Subject Knowledge. *T.S = Teaching Strategy *R.M =Resource Material *A.C = Assessment Criteria *N = Number of Respondents *Sig. = Level of significance
Table 6, indicates that the significance level of subject knowledge (S.K), teaching strategy (T.S),
resource material (R.M) ,and assessment criteria (A.C) are .000, .000, .000 and .001< p=0.05 respectively. This highlights that there is significant difference regarding proper use of subject knowledge (S.K), teaching strategy (T.S), resource material (R.M), and assessment criteria (A.C) of teachers of Division of Education and Division of Arts Campuses of UE. Their means depict that the teachers of Div. of Arts Campus properly and effectively use subject knowledge (S.K), teaching strategy (T.S), resource material (R.M), and assessment criteria (A.C) than the teachers of Div. of Edu. Campus. The reason of this difference may be the qualification of the teachers, competence in pedagogy and reasonable availability of resources in Div. of Arts Campus.
E-ISSN 2281-4612
ISSN 2281-3993 Academic Journal of Interdisciplinary Studies
Published by MCSER-CEMAS-Sapienza University of Rome
Vol 2 No 1
March 2013
411
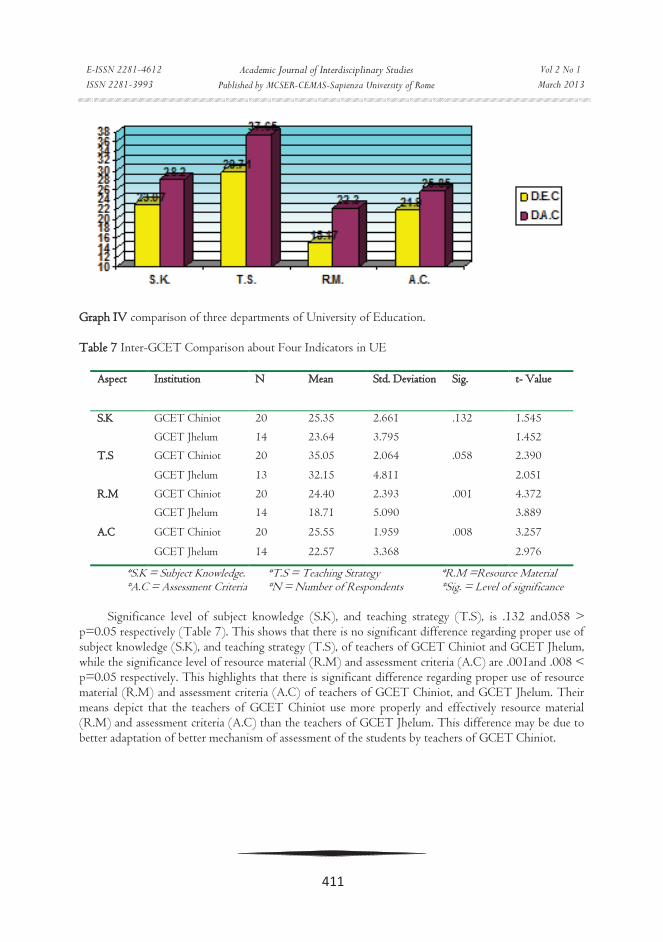
Graph IV comparison of three departments of University of Education. Table 7 Inter-GCET Comparison about Four Indicators in UE
Aspect Institution N Mean Std. Deviation Sig. t- Value
S.K GCET Chiniot 20 25.35 2.661 .132 1.545
GCET Jhelum 14 23.64 3.795 1.452
T.S GCET Chiniot 20 35.05 2.064 .058 2.390
GCET Jhelum 13 32.15 4.811 2.051
R.M GCET Chiniot 20 24.40 2.393 .001 4.372
GCET Jhelum 14 18.71 5.090 3.889
A.C GCET Chiniot 20 25.55 1.959 .008 3.257
GCET Jhelum 14 22.57 3.368 2.976
*S.K = Subject Knowledge. *T.S = Teaching Strategy *R.M =Resource Material *A.C = Assessment Criteria *N = Number of Respondents *Sig. = Level of significance
Significance level of subject knowledge (S.K), and teaching strategy (T.S), is .132 and.058 >
p=0.05 respectively (Table 7). This shows that there is no significant difference regarding proper use of subject knowledge (S.K), and teaching strategy (T.S), of teachers of GCET Chiniot and GCET Jhelum, while the significance level of resource material (R.M) and assessment criteria (A.C) are .001and .008 < p=0.05 respectively. This highlights that there is significant difference regarding proper use of resource material (R.M) and assessment criteria (A.C) of teachers of GCET Chiniot, and GCET Jhelum. Their means depict that the teachers of GCET Chiniot use more properly and effectively resource material (R.M) and assessment criteria (A.C) than the teachers of GCET Jhelum. This difference may be due to better adaptation of better mechanism of assessment of the students by teachers of GCET Chiniot.
E-ISSN 2281-4612
ISSN 2281-3993 Academic Journal of Interdisciplinary Studies
Published by MCSER-CEMAS-Sapienza University of Rome
Vol 2 No 1
March 2013
412
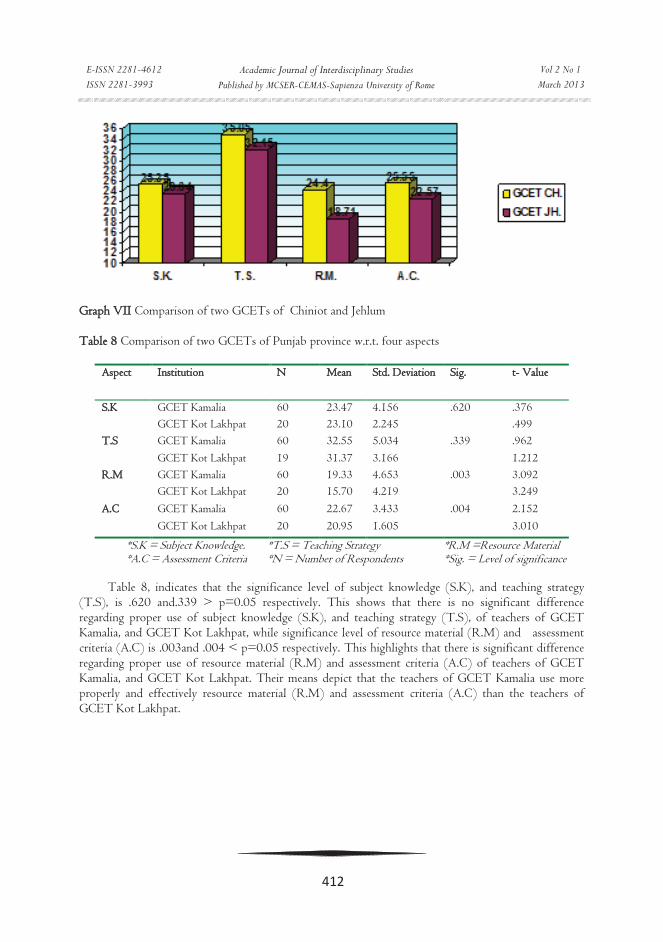
Graph VII Comparison of two GCETs of Chiniot and Jehlum Table 8 Comparison of two GCETs of Punjab province w.r.t. four aspects
Aspect Institution N Mean Std. Deviation Sig. t- Value
S.K GCET Kamalia 60 23.47 4.156 .620 .376
GCET Kot Lakhpat 20 23.10 2.245 .499
T.S GCET Kamalia 60 32.55 5.034 .339 .962
GCET Kot Lakhpat 19 31.37 3.166 1.212
R.M GCET Kamalia 60 19.33 4.653 .003 3.092
GCET Kot Lakhpat 20 15.70 4.219 3.249
A.C GCET Kamalia 60 22.67 3.433 .004 2.152
GCET Kot Lakhpat 20 20.95 1.605 3.010
*S.K = Subject Knowledge. *T.S = Teaching Strategy *R.M =Resource Material *A.C = Assessment Criteria *N = Number of Respondents *Sig. = Level of significance
Table 8, indicates that the significance level of subject knowledge (S.K), and teaching strategy
(T.S), is .620 and.339 > p=0.05 respectively. This shows that there is no significant difference regarding proper use of subject knowledge (S.K), and teaching strategy (T.S), of teachers of GCET Kamalia, and GCET Kot Lakhpat, while significance level of resource material (R.M) and assessment criteria (A.C) is .003and .004 < p=0.05 respectively. This highlights that there is significant difference regarding proper use of resource material (R.M) and assessment criteria (A.C) of teachers of GCET Kamalia, and GCET Kot Lakhpat. Their means depict that the teachers of GCET Kamalia use more properly and effectively resource material (R.M) and assessment criteria (A.C) than the teachers of GCET Kot Lakhpat.
E-ISSN 2281-4612
ISSN 2281-3993 Academic Journal of Interdisciplinary Studies
Published by MCSER-CEMAS-Sapienza University of Rome
Vol 2 No 1
March 2013
413
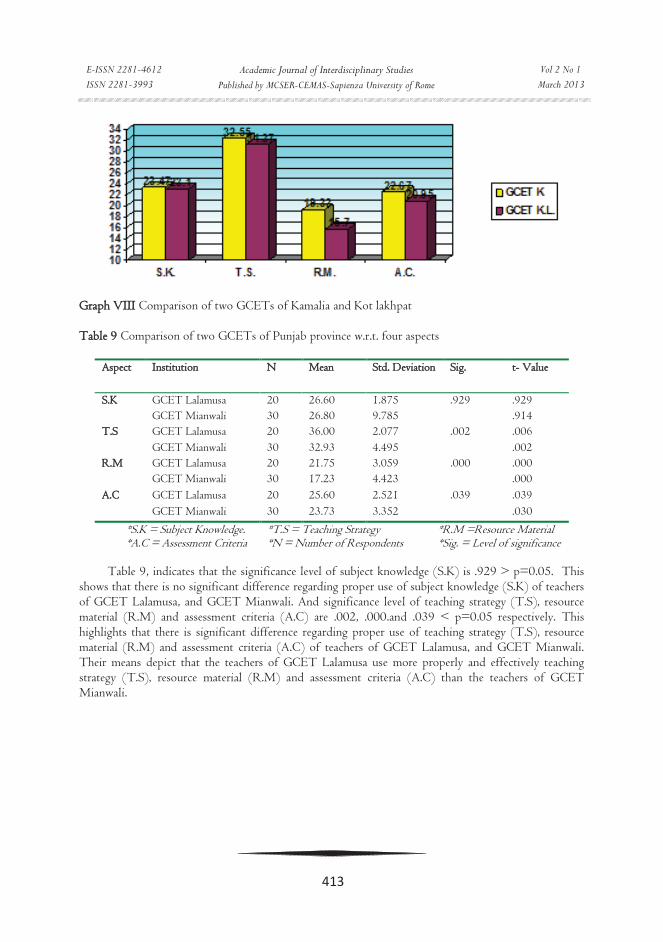
Graph VIII Comparison of two GCETs of Kamalia and Kot lakhpat Table 9 Comparison of two GCETs of Punjab province w.r.t. four aspects
Aspect Institution N Mean Std. Deviation Sig. t- Value
S.K GCET Lalamusa 20 26.60 1.875 .929 .929
GCET Mianwali 30 26.80 9.785 .914
T.S GCET Lalamusa 20 36.00 2.077 .002 .006
GCET Mianwali 30 32.93 4.495 .002
R.M GCET Lalamusa 20 21.75 3.059 .000 .000
GCET Mianwali 30 17.23 4.423 .000
A.C GCET Lalamusa 20 25.60 2.521 .039 .039
GCET Mianwali 30 23.73 3.352 .030
*S.K = Subject Knowledge. *T.S = Teaching Strategy *R.M =Resource Material *A.C = Assessment Criteria *N = Number of Respondents *Sig. = Level of significance
Table 9, indicates that the significance level of subject knowledge (S.K) is .929 > p=0.05. This
shows that there is no significant difference regarding proper use of subject knowledge (S.K) of teachers of GCET Lalamusa, and GCET Mianwali. And significance level of teaching strategy (T.S), resource material (R.M) and assessment criteria (A.C) are .002, .000.and .039 < p=0.05 respectively. This highlights that there is significant difference regarding proper use of teaching strategy (T.S), resource material (R.M) and assessment criteria (A.C) of teachers of GCET Lalamusa, and GCET Mianwali. Their means depict that the teachers of GCET Lalamusa use more properly and effectively teaching strategy (T.S), resource material (R.M) and assessment criteria (A.C) than the teachers of GCET Mianwali.
E-ISSN 2281-4612
ISSN 2281-3993 Academic Journal of Interdisciplinary Studies
Published by MCSER-CEMAS-Sapienza University of Rome
Vol 2 No 1
March 2013
414
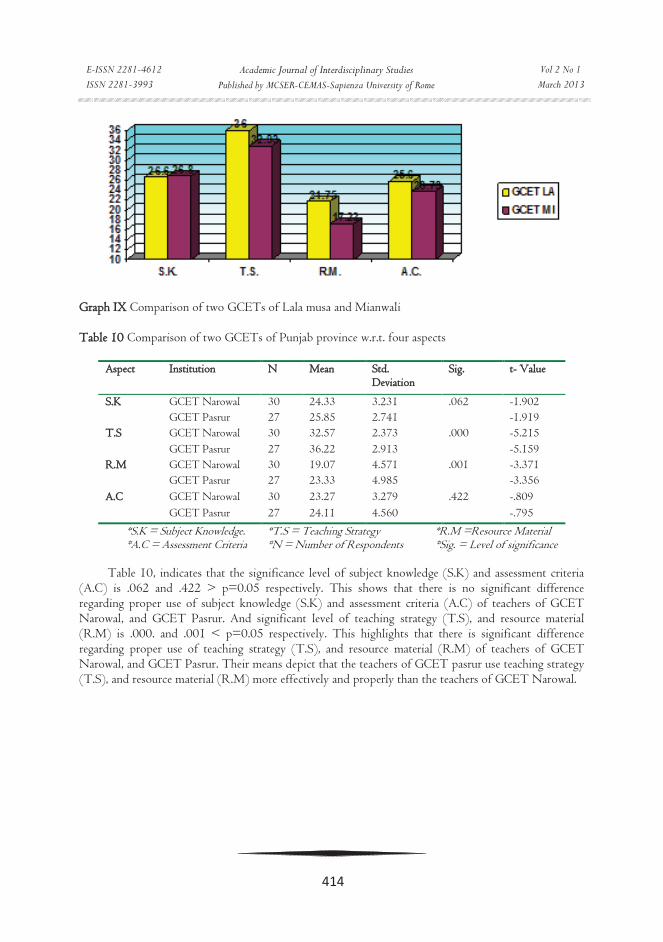
Graph IX Comparison of two GCETs of Lala musa and Mianwali Table 10 Comparison of two GCETs of Punjab province w.r.t. four aspects
Aspect Institution N Mean Std. Deviation
Sig. t- Value
S.K GCET Narowal 30 24.33 3.231 .062 -1.902
GCET Pasrur 27 25.85 2.741 -1.919
T.S GCET Narowal 30 32.57 2.373 .000 -5.215
GCET Pasrur 27 36.22 2.913 -5.159
R.M GCET Narowal 30 19.07 4.571 .001 -3.371
GCET Pasrur 27 23.33 4.985 -3.356
A.C GCET Narowal 30 23.27 3.279 .422 -.809
GCET Pasrur 27 24.11 4.560 -.795
*S.K = Subject Knowledge. *T.S = Teaching Strategy *R.M =Resource Material *A.C = Assessment Criteria *N = Number of Respondents *Sig. = Level of significance
Table 10, indicates that the significance level of subject knowledge (S.K) and assessment criteria
(A.C) is .062 and .422 > p=0.05 respectively. This shows that there is no significant difference regarding proper use of subject knowledge (S.K) and assessment criteria (A.C) of teachers of GCET Narowal, and GCET Pasrur. And significant level of teaching strategy (T.S), and resource material (R.M) is .000. and .001 < p=0.05 respectively. This highlights that there is significant difference regarding proper use of teaching strategy (T.S), and resource material (R.M) of teachers of GCET Narowal, and GCET Pasrur. Their means depict that the teachers of GCET pasrur use teaching strategy (T.S), and resource material (R.M) more effectively and properly than the teachers of GCET Narowal.
E-ISSN 2281-4612
ISSN 2281-3993 Academic Journal of Interdisciplinary Studies
Published by MCSER-CEMAS-Sapienza University of Rome
Vol 2 No 1
March 2013
415
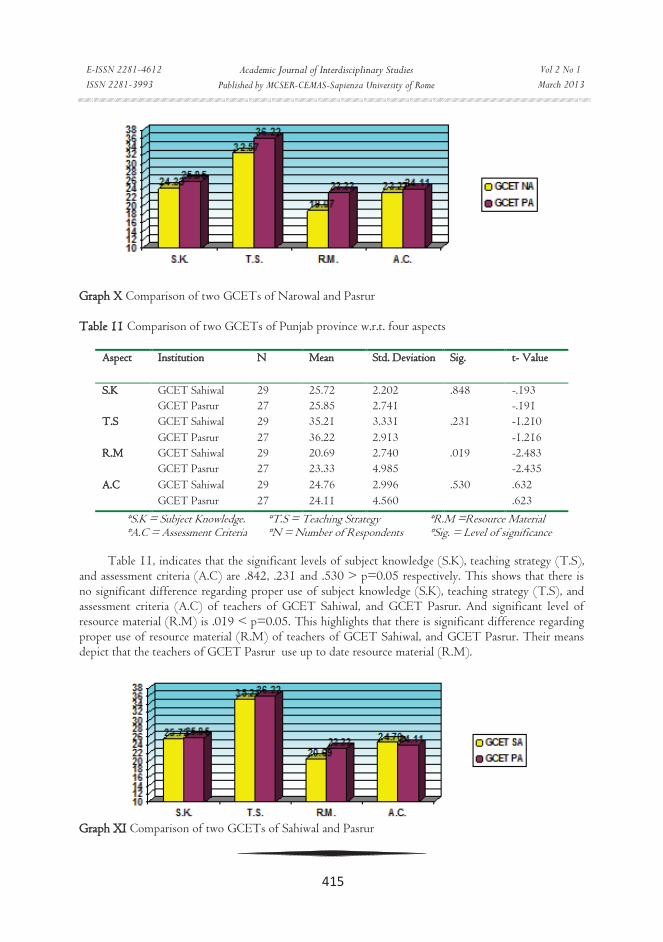
Graph X Comparison of two GCETs of Narowal and Pasrur Table 11 Comparison of two GCETs of Punjab province w.r.t. four aspects
Aspect Institution N Mean Std. Deviation Sig. t- Value
S.K GCET Sahiwal 29 25.72 2.202 .848 -.193
GCET Pasrur 27 25.85 2.741 -.191
T.S GCET Sahiwal 29 35.21 3.331 .231 -1.210
GCET Pasrur 27 36.22 2.913 -1.216
R.M GCET Sahiwal 29 20.69 2.740 .019 -2.483
GCET Pasrur 27 23.33 4.985 -2.435
A.C GCET Sahiwal 29 24.76 2.996 .530 .632
GCET Pasrur 27 24.11 4.560 .623
*S.K = Subject Knowledge. *T.S = Teaching Strategy *R.M =Resource Material *A.C = Assessment Criteria *N = Number of Respondents *Sig. = Level of significance
Table 11, indicates that the significant levels of subject knowledge (S.K), teaching strategy (T.S),
and assessment criteria (A.C) are .842, .231 and .530 > p=0.05 respectively. This shows that there is no significant difference regarding proper use of subject knowledge (S.K), teaching strategy (T.S), and assessment criteria (A.C) of teachers of GCET Sahiwal, and GCET Pasrur. And significant level of resource material (R.M) is .019 < p=0.05. This highlights that there is significant difference regarding proper use of resource material (R.M) of teachers of GCET Sahiwal, and GCET Pasrur. Their means depict that the teachers of GCET Pasrur use up to date resource material (R.M).
Graph XI Comparison of two GCETs of Sahiwal and Pasrur
E-ISSN 2281-4612
ISSN 2281-3993 Academic Journal of Interdisciplinary Studies
Published by MCSER-CEMAS-Sapienza University of Rome
Vol 2 No 1
March 2013
416
References Ackerman, T., Heafner, T., & Bartz, D. (2006). Teacher Effect Model for Impacting Student Achievement. Paper
presented at the 2006 annual meeting of the American Educational Research Association, San Francisco, California.
Darling, H. L. (2000). Teacher Quality and Student Achievement: A Review of State Policy Evidence. Education Policy Analysis Archives, 8 (1). Available at: http://epaa.asu.edu/epaa/v8n1/ Accessed on 10/05/2009
Darling, L. (1999). Educating teachers: The Academy’s greatest failure or its most important future? Academe 85 (1). Available at: http://epaa.asu.edu/epaa/v8n1/ Accessed on 10/05/2009.
Hawley, W. D. (1985). Designing and Implementing Performance: Based Career Ladder Plans. Educational leadership, 43(3), 57-61.
Hoogeveen, Lianne, Hell, V., Janet, G., Verhoeven, Ludo, (2009). Gifted Child Quarterly, 53 (1). 50-67 available at http://www.ferris.edu/htmls/academics/center/Teaching_and/Learning_Tips/Research%20on%20 Students'%20Evalution%20of%20Faculty%20Teaching/EvalTeachEffec.htm
Kerr, L. I., & Berliner, D. C. (2002). The effectiveness of "Teach for America" and other under-certified teachers on student academic achievement: A case of harmful public policy," Education Policy Analysis Archives, 10 (37). Available at http://epaa.asu.edu/epaa/v10n37/ Accessed on 2/4/2009
Marzano, R. J. (2003). What works in schools: Translating research into action. Alexandria, VA: Association for Supervision and Curriculum Development.
Miller, K. (2003). Policy Brief: School, Teacher, and Leadership Impacts on Student Achievement. Available at www.mcrel.org Accessed on 10/05/2009
Monk, D., & King, J. (1994). Multi-level teacher resource effects on pupil performance in secondary mathematics and science. In R. G. Eherenberg (Ed.), Choices and Consequences . Ithaca, NY: ILR Press.
Muijs, D. & Reynolds, D. (2005). Effective Teaching Evidence and Practice. London: SAGE Publications Ltd. Perry, Patricia, Chapman, David, Snyder, & Conrad, (1995). Quality of Teacher Work life and Classroom Practices
in Botswana. International Journal of Educational Development. 15(2), 115-125 Ubben, G. C., Hughes, W. L.(1992) “The Principal Creative Leadership for Effective Schools”. Boston: Allen and
Bacon. Watkins, C., & Mortimore, M. (1999). Pedagogy: what do we know? In M. Mortine (Ed.), London: Paul Chapman
Publishing.