mathematical modelling and evaluation of the different routes of transmission of lumpy skin disease...
TRANSCRIPT

RESEARCH Open Access
Mathematical modelling and evaluation of thedifferent routes of transmission of lumpy skindisease virusReuma Magori-Cohen1, Yoram Louzoun1, Yael Herziger2, Eldad Oron3, Alon Arazi4, Eeva Tuppurainen5,
Nahum Y Shpigel2 and Eyal Klement2*
Abstract
Lumpy skin disease (LSD) is a severe viral disease of cattle. Circumstantial evidence suggests that the virus is
transmitted mechanically by blood-feeding arthropods. We compared the importance of transmission via direct
and indirect contact in field conditions by using mathematical tools. We analyzed a dataset collected during the
LSD outbreak in 2006 in a large dairy herd, which included ten separated cattle groups. Outbreak dynamics and
risk factors for LSD were assessed by a transmission model. Transmission by three contact modes was modelled;
indirect contact between the groups within a herd, direct contact or contact via common drinking water within
the groups and transmission by contact during milking procedure. Indirect transmission was the only parameter
that could solely explain the entire outbreak dynamics and was estimated to have an overall effect that was over 5
times larger than all other possible routes of transmission, combined. The R0 value induced by indirect transmission
per the presence of an infectious cow for 1 day in the herd was 15.7, while the R0 induced by direct transmission
was 0.36. Sensitivity analysis showed that this result is robust to a wide range of assumptions regarding mean and
standard deviation of incubation period and regarding the existence of sub-clinically infected cattle. These results
indicate that LSD virus spread within the affected herd could hardly be attributed to direct contact between cattle
or contact through the milking procedure. It is therefore concluded that transmission mostly occurs by indirect
contact, probably by flying, blood-sucking insects. This has important implications for control of LSD.
IntroductionLumpy skin disease (LSD) is caused by Lumpy skin dis-
ease virus (LSDV), a DNA virus of the family Poxviridea
and of the genus Capripoxvirus. It is closely related and
has high antigenic resemblance to sheep pox and goat
pox viruses [1]. The disease is characterized by dissemi-
nated appearance of skin lesions, 2-5 cm in diameter
and lymphadenopathy, accompanied by high fever which
can sometimes exceed 41°C and may last up to 2 weeks
[2]. Morbidity rate varies widely depending on the abun-
dance of insect vectors and susceptibility of hosts ran-
ging from 3 to 85% [3]. In general, mortality rate is low
(1-3%) but in some occasions up to 75% mortality has
been reported [1]. LSD is associated with significant
production losses. It is therefore defined as a notifiable
disease by the World Organization for Animal Health
(OIE).
It is well accepted that lumpy skin disease is mechani-
cally transmitted by different types of biting and blood-
feeding arthropods, although the importance of the vec-
tors in the transmission of the virus in field conditions
is not fully understood. Aedes aegypti was found to suc-
cessfully transmit the virus between cattle up to 6 days
after feeding upon infected animals [4]. However, A.
aegypti is absent from Israel, where 3 LSD outbreaks
have been documented to date [5]. Stomoxys calcitrans,
Culicoides nubeculosus, Culex quinquefasciatus and
Anopheles stephensi failed to transmit the virus to sus-
ceptible cattle, although no transmission attempt was
made immediately after feeding on infected cattle [6].
Since LSDV is transmitted mechanically, such a time
frame for transmission is relevant, primarily with
* Correspondence: [email protected] School of Veterinary Medicine, Robert H. Smith Faculty of Agriculture,
Food and Environment, the Hebrew University, Israel
Full list of author information is available at the end of the article
Magori-Cohen et al. Veterinary Research 2012, 43:1
http://www.veterinaryresearch.org/content/43/1/1VETERINARY RESEARCH
© 2012 Magori-Cohen et al; licensee BioMed Central Ltd. This is an Open Access article distributed under the terms of the CreativeCommons Attribution License (http://creativecommons.org/licenses/by/2.0), which permits unrestricted use, distribution, andreproduction in any medium, provided the original work is properly cited.

interrupted feeders like Stomoxys calcitrans. In light of
its high abundance near previous outbreaks of LSD [7],
this fly cannot be precluded yet as a potential mechani-
cal vector for LSDV. Further studies are required to
investigate the role of biting flies in the transmission of
LSDV in experimental and field conditions.
In a study performed by Carn and Kitching, intrader-
mal inoculation of LSDV in cattle caused generalized
disease in less than 20% of cases while all other infected
animals developed only localized disease. As opposed to
this, over 70% of cattle infected intravenously showed
generalized disease. Infection through the conjuctival
sac was unsuccessful though it was attempted only on 2
animals. Individuals that lived for one month in close
contact with the infected animals did not develop dis-
ease [8]. In another study, experimental infection
showed low levels of virus in oral and nasal secretions
12 to 18 days post infection (dpi) [9]. Sharing of water
troughs was also raised as a possible route for LSDV
transmission [10].
The assumption regarding the high relative signifi-
cance of lumpy skin disease transmission by arthropods
is based either on data collected during experimental
infection with the Neethling strain [8] or on circumstan-
tial evidence of high abundance of blood-feeding arthro-
pods near LSD outbreaks [7,11]. To date, there is no
accurate data collected during natural outbreaks that
can support these previous findings. It is thus not clear
what is the relative significance of each of the suggested
routes in such natural settings. In the current study we
used mathematical modelling to understand the relative
role of each transmission route (indirect contact, direct
contact and transmission during the milking procedure).
This was performed by analyzing data collected during
the investigation and follow-up of an outbreak of lumpy
skin disease in a large dairy cattle herd in Israel in 2006.
Segregation of the groups in the herd prevented contact
between most of them. We used a back-calculation
method which was previously used for forecasting inci-
dence of Human Immunodeficiency Virus [12] and
Bovine Spongiform Encephalopathy [13]. This method
uses incidence data, together with an estimate of the
incubation period to glean information about past infec-
tion rates. By doing it for each cow and by knowing the
actual incidence for every group we could estimate the
probability of infection by each of the assessed transmis-
sion modes.
Material and methodsStudy population
An outbreak of LSD was suspected in the dairy herd of
Ein-Zurim on June 19th after the appearance of typical
lesions in a few cows. The herd is located in south wes-
tern Israel. The outbreak occurred in a non-grazing
intensive 610 head dairy farm which included 10 groups
(Figure 1). The groups were separated from each other
and did not share water troughs or feed bank. Water
was provided separately to each trough by a central
water system and each trough was drained separately.
Three groups included lactating cows (groups 1, 2 and
8, n = 246), while the 7 other groups included either
heifers in various stages (groups 4-6), cows at pre-cal-
ving stage (group 3), dry cows (group 7), fattening calves
(group 9 which, as noted in Figure 1, was scattered in
two cow sheds) or suckling calves (group 10). All groups
were completely separated from each other except
groups 9 and 4 and groups 3 and 7, which had common
fences but did not have common water troughs or feed
banks.
Epidemiologic investigation revealed that from May
15th to May 25th there was a cluster of 16 late preg-
nancy abortions that preceded the outbreak. Fourteen of
1
10
5
2
3
7
8
4
6
9
A
B 9
Figure 1 Location of the groups in the affected herd. A. Milking
pallor B. Euthanasia area. 1. First lactation cows 2. Second lactation
cows. 3. Pre-calving group 4. Replacement heifers pending
insemination and in early pregnancy 5. Replacement heifers (10-12
months old) 6. Pregnant replacement heifers 7. Dry cows. 8. High
parity 9. Fattening calves. 10. Suckling calves.
Magori-Cohen et al. Veterinary Research 2012, 43:1
http://www.veterinaryresearch.org/content/43/1/1
Page 2 of 13

the cows that aborted were pregnant heifers. All were
moved to the group of cows in first lactation (group 1
Figure 1). It appeared that on June 7th one of the abort-
ing heifers was culled as a result of poor performance
and body condition. The herdswoman reported that
while placing this calf on the truck she noticed the
abundance of numerous lumps scattered all over the
calf’s trunk and limbs. This calf is thus assumed to be
the index case and this date is defined as day 1 of the
outbreak. On June 22nd (outbreak day 16), 21 cows and
calves were culled after showing generalized lumpy skin
disease. The exact date of onset of clinical signs in these
cows and calves was not documented. However, after
interviewing the veterinarian and the herdswoman, it
was understood that generalized clinical signs of LSD
were not apparent before June 18th (outbreak day 12).
Thereafter, the disease spread rapidly within the herd.
Eventually, 206 animals were affected and culled with
generalized LSD, leaving 39 with only localized lesions
remaining in the herd. The last case appeared on July
21st. Thus, the total outbreak duration from the appear-
ance of the first suspected case until the occurrence of
the last case was 45 days (Figure 2).
Data collection and intervention
Starting from June 22nd, the whole herd was examined
daily by a single clinician to detect cattle that showed
typical LSD clinical signs. Suspected cattle were
categorized as having either localized disease (i.e. no
more than 3 localized lumps which were characterized
by an induration of a diameter not higher than 5 cm) or
a generalized disease, which was characterized by the
appearance of multiple indurations all over the trunk,
limbs and face (Figure 3), and was sometimes accompa-
nied by high fever, lymphadenopathy, limb oedema and
reduction in milk production. Cattle that showed sus-
pected lesions were examined again the next day to
monitor for the development of generalized clinical
signs. Cattle were culled during the same morning in
which generalized disease was detected, while those that
showed only small confined lesions were left in the
herd. On June 22nd the whole herd was vaccinated with
a live-attenuated sheep-pox vaccine (strain RM-65
(Abik®, Israel)) (Figure 2). Groups were vaccinated by
separate needles, but in some of the cases cattle from
the same group were vaccinated by the same needle.
Laboratory diagnosis
Lumpy skin disease virus was identified in seven cows
by a gel-based polymerase chain reaction (PCR) [14].
Virus isolation and electron microscopy were performed
on excised skin lesions as described by Brenner et al.
[15]. Following virus identification in the first cases,
diagnosis was mostly performed on the basis of clinical
signs according to the case definition described in the
previous section.
Figure 2 Epidemic curve of generalized LSD during the outbreak in Ein-Zurim, 2006. Black columns represent cases for which the date of
disease appearance is definite. Grey columns represent cases for which date of disease appearance is not definite. The dashed lines represent
their earliest assumed date of appearance. Double headed arrows represent the time period during which these cases may have first appeared.
Black arrow represents vaccination date.
Magori-Cohen et al. Veterinary Research 2012, 43:1
http://www.veterinaryresearch.org/content/43/1/1
Page 3 of 13

Dynamic transmission model
For the outbreak analysis, cases of LSD were defined as
those having generalized clinical disease. The following
assumptions were taken to explain the outbreak
dynamics:
• Except for the first few days, sick cattle were
removed when detected in the morning. Thus, each
cow was infective for only a few hours.
• All cows are susceptible to infection by LSD and
development of generalized morbidity. Since there is
no evidence in the literature to support this assump-
tion, its influence on model results was further
tested by sensitivity analysis.
• The disease has an incubation period, with a given
distribution f(∆t), where∆t is the time interval from
infection to the appearance of clinical signs. Cattle
are infective only on the appearance of clinical signs
(i.e. incubation period equals the latent period).
• Cattle can infect other cattle via four possible
routes A) long distance transmission between the
groups, possibly by blood-sucking flying arthropods
with a rate of alpha. Since the model describes
transmission within the farm, in which distance does
not exceed 300 meters, this parameter was not
defined as distance dependent. Therefore, the prob-
ability of the transmission of virus by this route
from an infectious cow to a susceptible one in the
same group equals the probability of virus transmis-
sion from the same cow to a cow in another group.
B) Infection by direct contact, not during milking,
with a rate of beta. Since there is no contact
between the cows from different groups (apart from
the contact during milking), this type of transmission
is possible only within each group. C) Transmission
of virus during the milking procedure, with a rate of
gamma. As all relevant groups were milked at the
same milking pallor (A, Figure 1) and no measures
were put in place to prevent transmission, such
transmission could occur within the group or
between groups of lactating cows (i.e. groups 1, 2
and 8), and D) Transmission between bordering
groups (i.e. groups 4 and 9 and groups 3 and 7) with
a rate of delta.
• 21 sick cattle heads were detected during the few
days prior to day 16, while no sick cattle were
Figure 3 Clinical appearance of lumpy skin disease during the outbreak in Ein-Zurim in 2006. A. Localized lumpy skin disease. B.
Generalized disease C. Generalized disease with limb oedema.
Magori-Cohen et al. Veterinary Research 2012, 43:1
http://www.veterinaryresearch.org/content/43/1/1
Page 4 of 13

observed at day 11. We thus assumed a cumulative
growth in the number of infected cows between day
11 and day 16. Two different case accumulation pat-
terns were tested, as shall be further explained.
• The cattle that showed clinical signs before day 16
(early cases) stayed for a long time in the herd, and
were culled only after a few days, while cattle that
became sick later stayed in the herd only for a few
hours until culling. Therefore, the early cases had
more time to infect other cattle than the late cases.
Thus, for the early period until day 16, probability of
infection is related to the prevalent cases while for
the late period it is related to the number of new
cases appearing each day. Furthermore, since the
early cases remained for the whole day in the herd
while the late cases stayed for only a few hours until
culling, we assume that the infectivity of the late
cases is smaller by a constant c than earlier cases.
These assumptions were combined to produce a
model in order to explain the outbreak dynamics. We
define a probability of Pij that a cow in group j at day i
would express clinical signs, given that it has not yet
done so. The total probability Pij for showing clinical
signs can thus be defined as:
Pij = α∑
k∈all groups
xik + βxij + γ∑
k∈join miliking groups
xij + δ∑
k∈neighboring groups
xik (1)
where xij and xik are the approximated numbers of
infectious cows in the respective groups in the respec-
tive days as computed through a convolution with the
appropriate incubation period (i.e. their sums multiplied
by the transmission parameters represent the sums of
previous prevalences, weighted by their contribution to
clinical incidence at day i). The first term includes the
total number of the infectious cows in the herd (includ-
ing the cows in the same group). The second term
includes only the cattle from the same group of the ani-
mals for which the probability of infection is calculated.
The third term includes only lactating cows in different
groups (groups 1, 2 and 8) given that the susceptible
cow is lactating, and the last term includes only cattle
from the groups bordering with groups 3, 4, 7 and 9,
(not including the self-group). The analysis was per-
formed on the 10 groups for each of the 50 days of
surveillance.
Since only the onset of clinical signs can be detected
we cannot determine the precise time of infection of
each cow. Therefore, we used a weighted combination
of the number of infected cows in previous days to com-
pute the infection probability. Formally, each xij is com-
puted as a convolution of the number of infectious cows
in each of the days preceding day i with a Gaussian dis-
tribution representing the distribution of incubation
periods between exposure to the virus and clinical (and
infectious) state: The following convolution formula was
used for xij:
xij =∑
i∗<i,j
1√
2πσe−
(i − i∗ − μ)2
2∗σ 2 yi∗j(2)
where yi*j is the number of sick cows in group j* at
day i*, μ is the estimated incubation period and s is the
standard deviation around this estimate.
In order to use realistic figures we searched the litera-
ture for experimental studies in which exact incubation
period from infection to generalized disease was
reported. Three such studies were found [8,9,16]. The
average incubation period reported in these studies was
7 days for virus isolation from blood and 11 days for
generalized disease (Table 1). We therefore fitted the
average incubation period for the model, limiting its
value to the range of 7 to 11 days. The standard devia-
tion for the incubation period was fitted as well.
As previously mentioned, the exact date of onset of
LSD clinical signs was not determined for the first 21
cows/calves. We thus reconstructed the outbreak using
two scenarios, with different accumulation during the
first 5 days preceding outbreak day 16; either a cumula-
tive linear increase in the number of prevalent cattle
showing clinical signs (i.e. constant number of incident
cases and a respective rounded number of prevalent
cases for days 11-16: 0, 4, 8, 12, 17, 21) or a cumulative
exponential increase in the prevalent number of infected
cattle showing clinical signs (i.e. linear increase in num-
ber of incident cases and rounded number of prevalent
cases for days 11-16: 0, 0, 1, 5, 12, 21). The constraint
for all of these scenarios was that on outbreak day 11
no cases existed in the herd and on outbreak day 16
there were 21 generalized LSD cases in the herd which
were culled in the same day.
The optimization analysis for both models (cumulative
and exponential increase in the prevalent number of
infected cattle showing clinical signs) was performed
simultaneously on seven parameters: alpha, beta,
gamma, delta - the transmission parameters, mu and
sigma - the average and the standard deviation in the
incubation time and c the ratio between the infectivity
after the disease was detected and the infectivity during
the first few days.
Estimation of model parameters and statistical analysis
Parameters were estimated by maximizing the fit to the
observed (clinical) incidence in time. Assuming that
each infected cow is an independent event that is not
affected by other infected cows in the same herd on the
same day, the number of sick cows should obey a
Magori-Cohen et al. Veterinary Research 2012, 43:1
http://www.veterinaryresearch.org/content/43/1/1
Page 5 of 13

binomial likelihood function:
∏
i
∏
j
(
Nij
yij
)
pyij
ij
(
1 − pij
)(Nij−yij)(3)
We first performed an analysis which included the
constant c which scales for the lower infectivity of later
cases (during control), the incubation time parameters
(mu and sigma) and each one of the transmission para-
meters separately (four parameters) to explore if the
outbreak scenario could be repeated using each trans-
mission parameter alone (i.e. first mu, sigma, c and
alpha, then mu, sigma, c and beta and so on). The ana-
lysis was continued by including the transmission para-
meter that showed the most significant contribution to
the model, and then by inserting the other parameters
one by one and testing the statistical significance of
their contribution by examining the change in the -2 log
maximum likelihood, which is c2 distributed. We further
tested the association of morbidity with cattle density
(number of cows/m2), age group (cows vs. calves, which
include suckling calves and fattening calves and all hei-
fers before first calving or aborting heifers) and lactation
status (eta, teta and nu in equations 4, 5 and 6, respec-
tively). These risk factors were tested in a model which
included alpha, beta and gamma. Lactation status was
also tested in a model which included only alpha and
beta since this risk factor overlaps with the definition of
gamma (transmission during the milking procedure).
The following models were used:
Pij =
⎡
⎣α∑
k∈all groups
xij + βxij + γ∑
k∈join milking groups
xik
⎤
(
1 + ηNij
Aj
)
(4)
for examining the association of cow density with inci-
dence, where Aj is the total area of each cow shed.
Pij =
⎡
⎣α∑
k∈all groups
xik + βxij + γ∑
k∈join milking groups
xik
⎤
(1 + θHj) (5)
for examining the association of cattle age (calf or
cow) with incidence, where Hj is an indicator variable,
equals to 0 for young calves or 1 for adult cows.
Pij =
⎡
⎣α∑
k∈all groups
xik + βxij + γ∑
k∈join milking groups
xik
⎤
(1 + v ∗ mgi) (6)
for examining the association of lactation status with
incidence, where mgi is an indicator variable, equals to 0
for cattle that were not milked during the outbreak or 1
for cows that were during the lactation period.
The optimal parameters were computed using a
Nedler-Mead minimization algorithm [17] implemented
on MATLAB® software. The algorithm was initiated
from multiple starting points to ensure a global minimi-
zation. The results were similar for most initial starting
points.
Sensitivity analysis
We performed a sensitivity analysis for each pair of
parameters in order to analyze their influence on the
maximum likelihood function of the model when com-
pared to the real outbreak data.
Further sensitivity analyses were performed to test the
robustness of model results to assumptions regarding
mean and standard deviation of the incubation period
and regarding the existence of subclinical infection. In
the first analysis, we set these parameters to be constant
and searched for the optimal values of alpha, beta and
gamma, in order to test if the ratio (beta + gamma)/
alpha remains small over a range of means and standard
deviations of the incubation period.
Table 1 Incubation period in 3 LSD clinical infection studies
Reference Titer (TCID50) Measured outcome Number of animals showing outcome in each dpi
1 2 3 4 5 6 7 8 9 10 11 12 13 14 Average SD
[16] (Tuppurainen et al.) 105.4 Generalized disease IV 1 1 6.5 0.7
Virus isolation * 2 6 0
[8] (Carn & Kitching) 102-106.5 Generalized disease ID 1 1 2 12 3.4
Virus isolation 1 3 NA
Generalized disease IV 4 2 2 10.75 1.9
Virus isolation 1 2 8 1.7
[9] (Babiuk et al.) 105.25 Generalized disease IV 4* NA NA
Virus isolation 2 2 7.5 1.7
Total Generalized disease*** 10.5 2.8
Virus isolation 6.9 2
* Isolation of virus from blood.
** Generalized disease is reported to occur between 6 to 10 dpi. Exact onset of clinical signs was not reported.
*** Without [9].
Magori-Cohen et al. Veterinary Research 2012, 43:1
http://www.veterinaryresearch.org/content/43/1/1
Page 6 of 13
The current model assumes all cows to be susceptible
to infection by LSD and development of generalized
morbidity. If this assumption is not correct the number
of susceptible cattle is expected to be diluted by non-
susceptible cows (which may be only sub-clinically
infected). We therefore tested the effect of this assump-
tion by assuming a varying number of susceptible cows
(out of those that never showed clinical signs).
An alternative model
The model studied here is the most straightforward
model, where clinical incidence is proportional to the
number of sick cows in the days before. An alternative
model can be proposed where, for direct transmission,
the clinical incidence is proportional to the proportion
of sick cows in the days before. We tested the fit of this
model by multiplying beta by xij*[N]/Nij instead of xijand gamma and delta (all associated with direct trans-
mission) by the sum over xik*[N]/Nij, instead of the sum
over xik, where [N] is the average number of cows over
days and groups.
Alternative fitting method
An alternative approach would be to use the clinical
incidence data for reconstruction of infection incidence,
using the incubation period distribution. Then, infection
incidence can be fitted to the prevalence of infection.
This alternative method, which qualitatively gives similar
results, is described in the additional file 1.
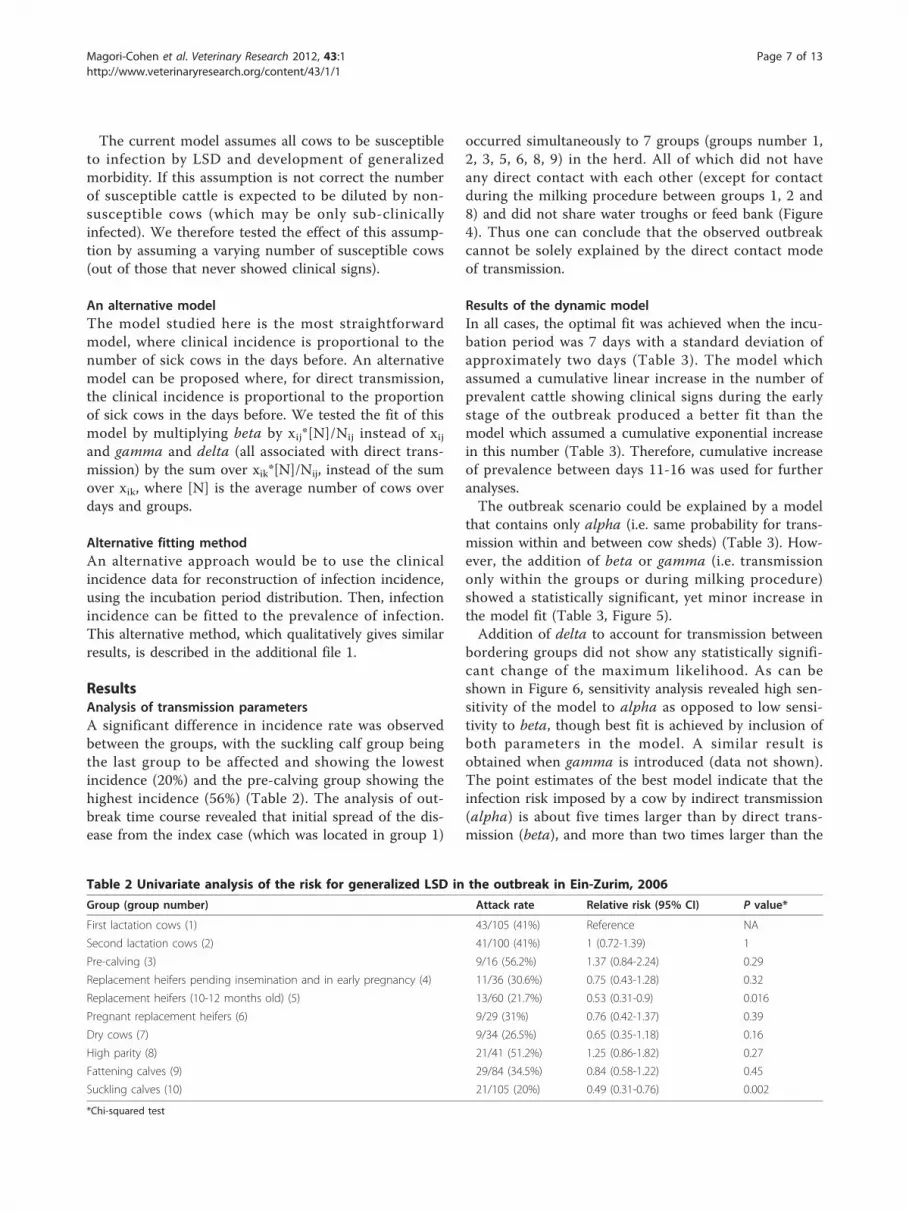
ResultsAnalysis of transmission parameters
A significant difference in incidence rate was observed
between the groups, with the suckling calf group being
the last group to be affected and showing the lowest
incidence (20%) and the pre-calving group showing the
highest incidence (56%) (Table 2). The analysis of out-
break time course revealed that initial spread of the dis-
ease from the index case (which was located in group 1)
occurred simultaneously to 7 groups (groups number 1,
2, 3, 5, 6, 8, 9) in the herd. All of which did not have
any direct contact with each other (except for contact
during the milking procedure between groups 1, 2 and
8) and did not share water troughs or feed bank (Figure
4). Thus one can conclude that the observed outbreak
cannot be solely explained by the direct contact mode
of transmission.
Results of the dynamic model
In all cases, the optimal fit was achieved when the incu-
bation period was 7 days with a standard deviation of
approximately two days (Table 3). The model which
assumed a cumulative linear increase in the number of
prevalent cattle showing clinical signs during the early
stage of the outbreak produced a better fit than the
model which assumed a cumulative exponential increase
in this number (Table 3). Therefore, cumulative increase
of prevalence between days 11-16 was used for further
analyses.
The outbreak scenario could be explained by a model
that contains only alpha (i.e. same probability for trans-
mission within and between cow sheds) (Table 3). How-
ever, the addition of beta or gamma (i.e. transmission
only within the groups or during milking procedure)
showed a statistically significant, yet minor increase in
the model fit (Table 3, Figure 5).
Addition of delta to account for transmission between
bordering groups did not show any statistically signifi-
cant change of the maximum likelihood. As can be
shown in Figure 6, sensitivity analysis revealed high sen-
sitivity of the model to alpha as opposed to low sensi-
tivity to beta, though best fit is achieved by inclusion of
both parameters in the model. A similar result is
obtained when gamma is introduced (data not shown).
The point estimates of the best model indicate that the
infection risk imposed by a cow by indirect transmission
(alpha) is about five times larger than by direct trans-
mission (beta), and more than two times larger than the
Table 2 Univariate analysis of the risk for generalized LSD in the outbreak in Ein-Zurim, 2006
Group (group number) Attack rate Relative risk (95% CI) P value*
First lactation cows (1) 43/105 (41%) Reference NA
Second lactation cows (2) 41/100 (41%) 1 (0.72-1.39) 1
Pre-calving (3) 9/16 (56.2%) 1.37 (0.84-2.24) 0.29
Replacement heifers pending insemination and in early pregnancy (4) 11/36 (30.6%) 0.75 (0.43-1.28) 0.32
Replacement heifers (10-12 months old) (5) 13/60 (21.7%) 0.53 (0.31-0.9) 0.016
Pregnant replacement heifers (6) 9/29 (31%) 0.76 (0.42-1.37) 0.39
Dry cows (7) 9/34 (26.5%) 0.65 (0.35-1.18) 0.16
High parity (8) 21/41 (51.2%) 1.25 (0.86-1.82) 0.27
Fattening calves (9) 29/84 (34.5%) 0.84 (0.58-1.22) 0.45
Suckling calves (10) 21/105 (20%) 0.49 (0.31-0.76) 0.002
*Chi-squared test
Magori-Cohen et al. Veterinary Research 2012, 43:1
http://www.veterinaryresearch.org/content/43/1/1
Page 7 of 13

Figure 4 Spread of generalized LSD between cattle groups. See Table 2I for group description. Grey scale indicates daily incidence in each
group.
Table 3 Assessment of transmission parameters for the outbreak of LSD in Ein-Zurim in 2006¥
alpha(Indirectcontact)
beta(directcontact)
gamma(transmission
betweenlactatinggroups)
delta(borderinggroups)
eta(density)
teta(age)
nu(lactationstatus)
Constant(c)
mu sigma L* p-value
€
alpha+beta+ gamma+delta
0.026 0.006 0.011 0.001 0.2 7 1.741 816.31 0.65
alpha+beta+ gamma 0.026 0.006 0.011 0.2 7 1.724 816.51 0.03
alpha+beta 0.032 0.008 0.2 7 1.797 820.98 0.0004
alpha+gamma 0.028 0.011 0.27 7 1.008 827.32 0.015
alpha§ 0.038 0.22 7 1.231 833.22
alpha+beta+ gamma+eta (Eq. 4)
0.023 0.0116 0.0069 -0.0032 0.2 7 1.88 815.88 0.43
alpha+beta+ gamma+teta (Eq. 5)
0.024 0.008 0.009 0.0013 0.2 7 1.79 815.82 0.41
alpha+beta+ gamma+nu (Eq. 6)
0.024 0.0088 0.0079 0.0044 0.2 7 1.48 816.25 0.61
alpha+beta+nu 0.023 0.0155 0.0002 0.2 7 1.85 817.24 0.053
alpha+beta+ gamma+delta linearincrease in the
number of incidentcases until day 16
0.031 0.014 0.008 0.000005 0.2 7 2.19 829.5
alpha+beta+ gamma+delta (beta+
gamma+delta ) areassociated with
incidence
0.033 0.008 0.002 0.000014 0.2 7 1.81 824.58
¥ Unless stated otherwise, a constant incidence prior to day 16 was assumed and all transmission parameters were associated with the number of cases and not
incidence.
* L = -2log (likelihood).
€ p-value for the addition of the last parameter.
§ The model without alpha has a likelihood of infinity.
Magori-Cohen et al. Veterinary Research 2012, 43:1
http://www.veterinaryresearch.org/content/43/1/1
Page 8 of 13

contribution of transmission by milking (gamma) (Table
3, line 1). Because the number of cows that are inter-
connected by indirect transmission is approximately ten
times larger than the number of cows that are linked by
direct contact the total contribution of indirect trans-
mission is 20-50 times larger than the contribution of
direct transmission. The contribution of each transmis-
sion modes to the basic reproductive number (R0) dur-
ing the initial stage of the outbreak can be calculated
per 1 day of abundance of an infectious cow in the
herd. Given a total number of approximately 600 cows,
R0 per one day for indirect transmission alone (alpha) is
0.026 × 600 = 15.6 and R0 for direct transmission alone
(beta) is 0.006 × 60 = 0.36. R0 for transmission through
milking procedure (gamma) is 0.011 × 246 = 2.7.
The addition of cow density, lactation status and age
to the full dynamic model (which included alpha, beta
and gamma) did not significantly increase the fit of the
A
B
Figure 5 Fit of transmission model with actual data of LSD outbreak in Ein-Zurim during 2006. Bars - actual data. Each line represents a
model. Note that the parameters of each model were optimized independently. A. Epidemic curve. B. Average daily incidence in each group
during the outbreak period.
Magori-Cohen et al. Veterinary Research 2012, 43:1
http://www.veterinaryresearch.org/content/43/1/1
Page 9 of 13

model with the observed data (Table 3). However, when
lactation status was added to a model which included
only alpha and beta its contribution was close to statis-
tical significance (p = 0.053).
Sensitivity analysis for the mean and standard deviation
of the incubation period
In order to test that the results of this model are not
sensitive to the precise details of the incubation period,
we repeated the analysis with fixed incubation period
average time and standard deviation, and looked for the
optimal values of alpha, beta and gamma. In all values
used for incubation period the ratio (beta + gamma)/
alpha was significantly lower than 1 (Figure 7a). It
should be emphasized again that alpha is then multi-
plied by a much larger number of cows than beta. Thus
the effective ratio is 5-10 times smaller than observed in
the sensitivity analysis.
Another sensitivity analysis tested the influence of the
assumption that all cattle are susceptible to generalized
clinical infection by LSDV. While reducing the number
of susceptible cows had an effect on the total force of
infection computed, it only further reduced the ratio
(beta+gamma)/alpha (Figure 7b).
Alternative model
The model in which direct transmission was associated
with incidence of infectious cattle performed worse than
the model in which all transmission parameters were
associated with the absolute number of infectious cattle
(Table 3). In this model the ratio (beta + gamma/alpha
was 0.32.
Alternative fitting method
The alternative fitting method, linking back calculated
infection incidence to prevalence, gave similar results
producing an even smaller ratio between direct and
indirect transmission (See additional file 1, Figure S1).
DiscussionThe results of this study indicate that in the outbreak
described, transmission of LSDV by direct contact had
only a minor effect on virus spread. These findings were
found to be very robust to various assumptions regard-
ing mean and standard deviation of incubation period
and regarding the existence of subclinical infection.
Low significance of direct transmission as opposed to
the high relative importance of indirect transmission
coincides with the outcome of previous experimental
studies [8,9] and was supported by several findings from
this study. The initial spread of the disease from the
index case occurred simultaneously to 7 groups in the
Figure 6 Sensitivity analysis of alpha (indirect contact) and
beta (direct contact). Surface color represents maximum likelihood
for the model fit with the real data of LSD outbreak in Ein-Zurim,
2006. Note, that the model is significantly more sensitive to alpha
than to beta, primarily around the optimal value.
A
B
Figure 7 Ratio between direct (beta + gamma) and indirect
(alpha) transmission rates as a function of: A. Fixed average and
standard deviation of the incubation time. B. Ratio of susceptible
cattle out of cattle that did not show clinical signs.
Magori-Cohen et al. Veterinary Research 2012, 43:1
http://www.veterinaryresearch.org/content/43/1/1
Page 10 of 13

herd that had not been in any direct contact with each
other. This suggests that the virus must have been
transmitted by indirect routes. The insignificance of the
transmission by direct contact may also be supported by
the fact that in two of the later affected groups (groups
4 and 7), only 3 to 5 days passed from onset of clinical
signs in initial cases to appearance of clinical signs in at
least 90% of the affected animals. Since at this stage
active surveillance was already conducted, there is a pre-
cise documentation of onset of clinical signs in all cases.
This time period, which is about half of the assumed
average incubation period of LSD (which averages
between 7 to 11 days as described in Table 1), shows
that secondary transmission within these groups hardly
took place. Therefore, most of the cases in groups 4 and
7 must have occurred as a result of indirect transmis-
sion of the virus from other groups.
The conclusion is further supported by the transmis-
sion model which indicates that the outbreak could be
explained almost entirely by inclusion of one parameter
(alpha) which represents transmission by indirect con-
tact within and between groups. Inclusion of another
parameter for transmission within the group does signif-
icantly increase the model fit with the observed data.
However, its actual effect is low (Figure 5) and sensitiv-
ity analysis shows that its influence on the maximum
likelihood of the model results is minor (Figure 6).
Furthermore, this increase can also be explained by dis-
tance, e.g. because of an increased probability of
mechanical transmission by flying biting insects,
between adjacent cows.
From a practical point of view, the results from this
study imply that the contribution of indirect transmis-
sion to R0 is significantly higher than that of direct
transmission. R0, attributed to gamma (transmission
between lactating groups), was 2.7. Though it was pre-
viously suggested that LSD can be transmitted by milk
[10], the interpretation that transmission during milking
procedure had a significant contribution to the spread
of this outbreak should be taken very cautiously. First,
gamma is only marginally significant (Table 2; p = 0.03).
Second, since the two largest lactating groups are
located very close to each other, gamma, like beta can
actually represent higher probability of indirect mechan-
ical transmission to individuals that are in high proxi-
mity to infectious cattle. Third, gamma can be
influenced by higher susceptibility of lactating cows to
generalized disease [18]. Indeed, when instead of
gamma we added a parameter to account for higher
susceptibility of lactating cows to clinical infection (nu,
Table 3), its contribution to model fit was close to sta-
tistical significance and was very close to the contribu-
tion of gamma. In any case, it should be remembered
that gamma is relevant only for 40% of the cattle in this
herd and for only 51% of the affected cattle, which were
scattered in three out of the 10 groups involved in this
outbreak. Thus, while indirect transmission can explain
the disease spread, it cannot be explained by direct
transmission or by transmission during the milking
procedure.
Potential mode of indirect transmission could either
be iatrogenic or by flying insects. Iatrogenic transmis-
sion in the extent observed in this outbreak is very unli-
kely as needles were changed between groups.
Therefore, if transmission would have occurred by vac-
cination it should have increased the transmission
within the groups and not between the groups. Also,
vaccine is administered subcutaneously and it was
shown previously that this way of inoculation would
mostly cause localized disease [8] while most of the ani-
mals affected through the described outbreak had gener-
alized disease. Therefore, the most likely mode of
transmission is by blood sucking flying insects. As mos-
quitoes are vessel feeders, injecting their saliva directly
into the blood stream, they might be candidates for
transmission. However, the mosquito female feeds on
blood only before oviposition. The time period between
blood feeding to oviposition is 2-5 days [19]. Adding
this time to the assumed incubation period for LSDV
would give a lag period of at least 9 days between mos-
quito feeding on a primary infected cow and appearance
of clinical signs in a secondary infected cow (it is more
likely that this time period is longer because this estima-
tion assumes the second blood meal to take place at the
same day of oviposition). Given the optimal lag period
calculated from the model (around 7 days) transmission
by mosquitoes through major blood meals seems unli-
kely. Failure to demonstrate virus persistence in Culex
spp. for a long enough time [6] does not support this
hypothesis either.
A more reasonable explanation is that virus is
mechanically transmitted by interrupted feeding. This
type of feeding is typical for the stable fly Stomoxys cal-
citrans [20], but the fact that it is a pool feeder [21] and
the failure to demonstrate transmission by this fly [6]
decrease the likelihood of this fly as being the primary
vector of this virus. Another possibility is that a mos-
quito species that is an interrupted feeder may serve as
the vector. Persistence of the virus in Culex mosquitoes
and primarily in C. pipiens which is highly abundant in
Israel [22], should be further investigated as well as
feeding habits of these mosquitoes on cattle. In light of
this study’s findings, unravelling the mechanism of
mechanical transmission of LSDV is of high interest and
significance.
Mathematical modeling shows that the ratio of biting
insect numbers to host numbers is positively correlated
with the transmission probability [23]. It was
Magori-Cohen et al. Veterinary Research 2012, 43:1
http://www.veterinaryresearch.org/content/43/1/1
Page 11 of 13

demonstrated by Torr et al. that increasing the number
of cattle heads in a herd increased the number of cap-
tured biting flies (including Stomoxys spp.) by a smaller
factor, therefore reducing the vector to host ratio [24].
This indicates that for a vector-borne disease, increase
in cattle density should decrease the probability of viral
transmission. If direct contact would have played an
important role in transmission, we would expect a posi-
tive correlation between cattle density and final attack
rate, as higher density would cause higher contact rate
[25]. We did not find an association between low den-
sity of cattle in a group and the risk of infection. There-
fore this part of the analysis cannot support a higher
significance for either direct or vector-borne indirect
transmission.
Suckling calves showed the lowest attack rate, though
in the dynamic model younger cattle did not show
higher susceptibility to infection. We are not aware of
previous reports of age related susceptibility to LSD. A
possible alternative explanation for the lower attack rate
in suckling calves may be associated with lower suscept-
ibility of calves to biting by flies as previously described
[24]. Another potential explanation can be associated
with location, as the lowest attack rate was documented
in the suckling calves which were located up to 100
meters from the other groups. Since the groups are
homogenic, confounding between these potential causes
can occur and cannot be fully accounted for.
A possible criticism of this study may be the lack of
accurate surveillance during the initial phases of the
outbreak. Unfortunately, this problem exists in many
outbreaks. Frequently, there is a lag between initial
appearance of clinical signs and the understanding that
an outbreak is occurring. We overcame this problem by
trying various scenarios (representing different
sequences of case occurrence) extrapolated for the initial
days of the outbreak from the data that we had. All sce-
narios gave the same results. The study can also be criti-
cized by the fact that quite early in the course of this
outbreak intervention was initiated, which included
increased use of insecticides and vaccination of the
herd, and most importantly immediate culling of the
animals. It is improbable that vaccination with a live
attenuated vaccine had any affect during the time frame
of the outbreak, since the time for virus propagation
and induction of immunity (when administered to
sheep) takes one month [26], while most cases occurred
within 10 days of vaccine administration. Furthermore,
during later outbreaks of LSD, which occurred in 2007
in Israel it was shown that this vaccine had low efficacy
[5]. Increased use of insecticides and more importantly
early culling probably had a significant effect on out-
break spread and indeed were simulated in the model
by inclusion of a constant c to differentiate cases that
stayed in the herd from cases that were culled immedi-
ately. Since these interventions were imposed equally for
all herd groups, the exact value of c should not have any
effect on the final conclusion of this study.
It is possible that in this outbreak there were animals that
were sub-clinically infected and were therefore not
detected. In an experimental infection of calves by LSDV,
Babiuk et al. showed that the highest levels of virus were
detected in the skin nodules [9]. Their results support a sig-
nificantly higher role of clinically affected animals (showing
skin lesions) in virus transmission as compared to sub-
clinically infected cattle. It can therefore be assumed that
neglecting potential sub-clinically infected animals did not
influence the calculation of transmission parameters.
Abundance of sub-clinically infected or non-susceptible
animals can also change outbreak dynamics by competing
with susceptible animals on contact with infectious cattle.
However, the sensitivity analysis that we performed showed
that the abundance of such non-susceptible, possibly sub-
clinically infected cattle, would not change the main con-
clusion of this study and would even support it (Figure 7b).
In conclusion, direct transmission would not support
the development of an outbreak of LSD and control
efforts should be mostly aimed at preventing indirect
transmission. The lack of any other possible indirect
transmission mechanism as well as previous experimen-
tal infections suggests that this route of transmission is
mainly vector borne. Therefore, the control of the vector
population may seem beneficial for preventing outbreak
spread. The results regarding transmission through
milking procedure may suggest that transmission by this
route may be important. However, as we explained ear-
lier, this result is not conclusive. Hence, until proven
otherwise, milking of LSD sick cows should be stopped.
Finally, one should remember that in this outbreak all
the animals showing severe disease were culled almost
immediately when the generalized disease was observed,
therefore significantly reducing the possibility for spread
via water contaminated with saliva or nasal discharge and
mutual grooming which might be increased during later
stages of the disease. Further epidemiological investiga-
tion of LSDV in other settings is therefore warranted.
Additional material
Additional file 1: Alternative fitting method for the Ein Zurim
Lumpy skin disease data from 2006 - the inverted model.
Description of an alternative fitting method in which infection incidence
is fitted to the prevalence of infection.
Acknowledgements
This study was supported by grant number 705-0012-08 of the Israeli dairy
board. We would like to thank Dr Karin Aharonson-Raz and Tal Azagi for
Magori-Cohen et al. Veterinary Research 2012, 43:1
http://www.veterinaryresearch.org/content/43/1/1
Page 12 of 13

their help in editing the article. We would also like to thank an anonymous
reviewer for his extremely helpful comments and remarks.
Author details1Department of Mathematics and Gonda Brain Research Center, Bar Ilan
University, Ramat Gan, Israel. 2Koret School of Veterinary Medicine, Robert H.
Smith Faculty of Agriculture, Food and Environment, the Hebrew University,
Israel. 3Hachaklait, Mutual Society for Veterinary Services, Caesarea, Israel. 4S.
A.E. Afikim, Afikim, Israel. 5Institute for Animal Health, Ash Road, Pirbright, UK.
Authors’ contributions
All authors read and approved the final manuscript. RMC designed and
constructed the model, performed statistical and sensitivity analysis and
drafted the manuscript. YL designed and constructed the model, performed
statistical and sensitivity analysis and drafted the manuscript. YH collected
the data, performed initial laboratory diagnosis and performed the GIS work.
EO and AA collected the data in the field and participated in outbreak
investigation. ET helped in study conduction and laboratory diagnosis. NYS
participated in outbreak investigation and study design. EK initiated the
study, designed the study and the model, drafted the manuscript and
performed the statistical analysis.
Competing interests
The authors declare that they have no competing interests.
Received: 28 February 2011 Accepted: 11 January 2012
Published: 11 January 2012
References
1. Babiuk S, Bowden TR, Boyle DB, Wallace DB, Kitching RP: Capripoxviruses:
an emerging worldwide threat to sheep, goats and cattle. Transbound
Emerg Dis 2008, 55:263-272.
2. Carn VM: Control of capripoxvirus infections. Vaccine 1993, 11:1275-1279.
3. Coetzer JAW: Lumpy skin disease. In Infectious Diseases of Livestock. Edited
by: Coetzer JAW, RCT. Oxford University Press Southern Africa;
2004:1268-1276.
4. Chihota CM, Rennie LF, Kitching RP, Mellor PS: Mechanical transmission of
lumpy skin disease virus by Aedes aegypti (Diptera: Culicidae). Epidemiol
Infect 2001, 126:317-321.
5. Brenner J, Bellaiche M, Gross E, Elad D, Oved Z, Haimovitz M, Wasserman A,
Friedgut O, Stram Y, Bumbarov V, Yadin H: Appearance of skin lesions in
cattle populations vaccinated against lumpy skin disease: statutory
challenge. Vaccine 2009, 27:1500-1503.
6. Chihota CM, Rennie LF, Kitching RP, Mellor PS: Attempted mechanical
transmission of lumpy skin disease virus by biting insects. Med Vet
Entomol 2003, 17:294-300.
7. Yeruham I, Nir O, Braverman Y, Davidson M, Grinstein H, Haymovitch M,
Zamir O: Spread of lumpy skin disease in Israeli dairy herds. Vet Rec 1995,
137:91-93.
8. Carn VM, Kitching RP: An investigation of possible routes of transmission
of lumpy skin disease virus (Neethling). Epidemiol Infect 1995, 114:219-226.
9. Babiuk S, Bowden TR, Parkyn G, Dalman B, Manning L, Neufeld J, Embury-
Hyatt C, Copps J, Boyle DB: Quantification of lumpy skin disease virus
following experimental infection in cattle. Transbound Emerg Dis 2008,
55:299-307.
10. Weiss KE: Lumpy skin disease. Virol Monogr 1968, 3:111-131.
11. Davies FG: Lumpy skin disease, an African capripox virus disease of
cattle. Br Vet J 1991, 147:489-503.
12. Brookmeyer R: Reconstruction and future trends of the AIDS epidemic in
the United States. Science 1991, 253:37-42.
13. Anderson RM, Donnelly CA, Ferguson NM, Woolhouse ME, Watt CJ, Udy HJ,
MaWhinney S, Dunstan SP, Southwood TR, Wilesmith JW, Ryan JB,
Hoinville LJ, Hillerton JE, Austin AR, Wells GA: Transmission dynamics and
epidemiology of BSE in British cattle. Nature 1996, 382:779-788.
14. Ireland DC, Binepal YS: Improved detection of capripoxvirus in biopsy
samples by PCR. J Virol Methods 1998, 74:1-7.
15. Brenner J, Haimovitz M, Oron E, Stram Y, Fridgut O, Bumbarov V,
Kuznetzova L, Oved Z, Waserman A, Garazzi S, Perl S, Lahav D, Edery N,
Yadin H: Lumpy skin disease (LSD) in a large dairy herd in Israel, June
2006. Isr J Vet Med 2006, 61:73-77.
16. Tuppurainen ES, Venter EH, Coetzer JA: The detection of lumpy skin
disease virus in samples of experimentally infected cattle using different
diagnostic techniques. Onderstepoort J Vet Res 2005, 72:153-164.
17. Nelder JA, Mead R: A simplex method for function minimization.
Computer J 1965, 7:308-313.
18. Tuppurainen ES, Oura CA: Review: Lumpy Skin Disease: An Emerging
Threat to Europe, the Middle East and Asia. Transbound Emerg Dis .
19. Foster WA, Walker ED: Mosquitoes (Culicidae). In Medical and veterinary
entomology. Edited by: Mullen G, Durden L. Elsevier science; 2002:203-262.
20. Prullage JB, Williams RE, Gaafar SM: On the transmissibility of
Eperythrozoon suis by Stomoxys calcitrans and Aedes aegypti. Vet
Parasitol 1993, 50:125-135.
21. Hall RD, Gerhardt RR: Flies (Diptera). In Medical and veterinary entomology.
Edited by: Mullen G, Durden L. Elsevier science; 2002:279-301.
22. Margalit Y: Culicidae. In Insects, Society for the protection of nature in Israel
Edited by: Kugler J 1989, 216-218.
23. Gubbins S, Carpenter S, Baylis M, Wood JL, Mellor PS: Assessing the risk of
bluetongue to UK livestock: uncertainty and sensitivity analyses of a
temperature-dependent model for the basic reproduction number. J R
Soc Interface 2008, 5:363-371.
24. Torr SJ, Prior A, Wilson PJ, Schofield S: Is there safety in numbers? The
effect of cattle herding on biting risk from tsetse flies. Med Vet Entomol
2007, 21:301-311.
25. Anderson RM, May RM: Infectious Diseases of Humans. Dynamics and Control
Oxford University Press; 1991.
26. Bhanuprakash V, Indrani BK, Hosamani M, Singh RK: The current status of
sheep pox disease. Comp Immunol Microbiol Infect Dis 2006, 29:27-60.
doi:10.1186/1297-9716-43-1Cite this article as: Magori-Cohen et al.: Mathematical modelling andevaluation of the different routes of transmission of lumpy skin diseasevirus. Veterinary Research 2012 43:1.
Submit your next manuscript to BioMed Centraland take full advantage of:
• Convenient online submission
• Thorough peer review
• No space constraints or color figure charges
• Immediate publication on acceptance
• Inclusion in PubMed, CAS, Scopus and Google Scholar
• Research which is freely available for redistribution
Submit your manuscript at www.biomedcentral.com/submit
Magori-Cohen et al. Veterinary Research 2012, 43:1
http://www.veterinaryresearch.org/content/43/1/1
Page 13 of 13