markov chain cfar detection for polarimetric data using data fusion
TRANSCRIPT

IEEE TRANSACTIONS ON GEOSCIENCE AND REMOTE SENSING, VOL. 50, NO. 2, FEBRUARY 2012 397
Markov Chain CFAR Detection for PolarimetricData Using Data Fusion
Chuhong Fei, Member, IEEE, Ting Liu, George A. Lampropoulos, Member, IEEE, andVassilis Anastassopoulos, Member, IEEE
Abstract—This paper proposes a new Markov-chain-based con-stant false alarm rate (CFAR) detector for polarimetric datausing low-level data fusion and high-level decision fusion. TheMarkov-chain-based CFAR detector extends traditional proba-bility density function (pdf) based CFAR detection to first-orderMarkov chain model by considering both correlation betweenneighboring pixels and pdf information in CFAR detection. Withthe additional correlation information, the proposed approachresults in advancing the performance of conventional CFAR de-tectors. Moreover, to take advantage of full polarizations of po-larimetric data, various data fusion methods are considered toimprove detection performance, including polarimetric transfor-mation, principal component analysis, and decision fusion. Ourexperimental results confirm the superiority of the new Markovchain polarimetric CFAR detector over conventional pdf-basedCFAR detectors.
Index Terms—Constant false alarm rate (CFAR) detection, datafusion, Markov chain, polarimetric synthetic aperture radar.
I. INTRODUCTION
IN RECENT years, the remote sensing community has paida significant amount of attention to detection of targets
in noise [1]–[4]. Polarimetric synthetic aperture radar multi-spectral and hyperspectral sensors are often involved in targetdetection procedures. The term noise refers to the backgroundclutter and any kind of interference caused by the medium orthe sensor. Characterization of the noise is the first step towardtarget detection. If the background noise can be represented ad-equately by means of a mathematical model, then the signal canbe extracted as a component deviating from this predeterminedbehavior. If, furthermore, the signal of interest is of knownbehavior, the detection procedure is highly facilitated.
Background clutter characterization has been extensivelystudied in the last two decades. Statistical description is themain approach in the topic [5], [6]. Depending on the op-erational conditions (reflecting surface, incidence angle, typeof radiation, polarization, weather conditions, etc.), different
Manuscript received December 17, 2010; revised April 6, 2011 and June 16,2011; accepted June 27, 2011. Date of publication September 15, 2011; dateof current version January 20, 2012. This work was supported by the CanadianSpace Agency under the Earth Observation Application Development Program.
C. Fei, T. Liu, and G. A. Lampropoulos are with A.U.G. Signals Ltd.,Toronto, ON M5H 4E8, Canada (e-mail: [email protected]; [email protected]; [email protected]; www.augsignals.com).
V. Anastassopoulos is with the Electronics Laboratory, Physics De-partment, University of Patras, 26500 Patras, Greece (e-mail: [email protected]).
Color versions of one or more of the figures in this paper are available onlineat http://ieeexplore.ieee.org.
Digital Object Identifier 10.1109/TGRS.2011.2164257
statistical models may apply, such as Weibull, K, gamma, andgeneralized gamma distributions [5]–[8]. Based on these para-metric distribution models, constant false alarm rate (CFAR)detection has been studied to adapt nonhomogeneous nature ofthe clutter in which a threshold is adaptively determined basedon an estimation of the local mean value or order statistics (OS)of the background clutter such that the false alarm rate is heldconstant for various clutter levels. Other attractive models forclutter in the literature also include an autoregressive process[9], the use of reflection coefficients as clutter describing fea-tures [10], the use of clutter cross section for terrain analysis[11], and the employment of chaotic dynamics [12]. Due to thenature of remotely sensed data and especially the inherent highcorrelation in those with polarimetric properties of SAR data,modeling the clutter with Markov statistics has been extensivelystudied [13], [14]. Specifically, Markov random fields (MRFs)[13], hidden Markov chains, and hidden MRFs [14] have beenproposed for clutter characterization and classification tasks.Markov statistics seem quite suitable for describing the correla-tion of data, which is due to the complex reflection mechanismsresponsible for compound probability density functions (pdfs)used in the literature [5]. However, detection procedures ofdistributed targets using Markov chains are yet to be addressed.
A large number of CFAR detectors have been proposedin the past in the literature, with different local statistics ofthe background clutter [15]. Among them are the conven-tional cell averager (CA) [16], the OS [17], [18], the median-morphological (MEMO) [19], and the Optimal-Weibull (OW)[20] CFAR detector. The detectors that have been proposedin the past deal with various types of clutter statistics anddifferent kinds of targets (fluctuating or not) [20]–[22]. Thesedifferent types of CFAR detectors have their own advantagesand disadvantages with different potential application situa-tions. Latest research work on CFAR detection has focused onadaptive CFAR algorithms based on SAR data properties [23].Gao et al. [24] recently proposes an adaptive and fast CFARalgorithm based on automatic censoring for target detection inhigh-resolution SAR images.
Compared to the conventional distribution models in manyproposed CFAR detection methods, Markov chain models pro-vide additional correlation information between pixels otherthan 1-D distribution information. Moreover, for polarimetricdata with four channels, multiple images should be appropri-ately fused in order to utilize complementary features fromdifferent channels for target detection performance enhance-ment. An effective polarimetric imagery fusion method [25]has been proposed to improve signal to clutter contrast by
0196-2892/$26.00 © 2011 IEEE

398 IEEE TRANSACTIONS ON GEOSCIENCE AND REMOTE SENSING, VOL. 50, NO. 2, FEBRUARY 2012
exploiting the polarization scattering characteristics of objectsand background clutter. This paper extends our early researchprogress on Markov chain detectors in [26]–[28] and attemptsto incorporate various data fusion techniques in Markov-chain-based CFAR detection in order to take advantage of full polar-izations of polarimetric data.
In this paper, detection of distributed targets in clutter iscarried out by assuming that irreducible Markov chain modelscharacterize their behavior. The proposed procedure is based onthe fact that representing the clutter and the target by meansof the transition matrix of an irreducible Markov chain isadequate to describe the underlying pdf as well as any orderof statistical correlation among the random variables [29]. Thisissue is extensively analyzed, and real SAR data are used tosupport the applicability of Markov chains in describing thestatistical and correlation properties of the clutter. In this case,however, the number of required parameters is large comparedto other representation methods. The detection procedure istotally based on the amplitude value as well as on the statisticalcorrelation of the target and the clutter. Real polarimetric dataare used for developing the Markov chain models as well as forproving the applicability of the proposed Markov chain CFARdetection approach.
Detection in a Markov ruled environment is a challengingresearch topic. Markov models describe successfully the cor-relation properties of the clutter, which should be effectivelyutilized in target detection. Such a model offers a global statisti-cal description of the available data. In this paper, the proposeddetection approach deals with a first-order Markov chain model.This approach is selected not only for simplicity reasons butalso in order to be able to address the CFAR detection problem.CFAR detection can be carried out straightforwardly whenthe Markov chain state-model structure remains unchanged asfar as its transition probabilities are concerned. In this paper,we consider the first-order Markov chain model because ofthe following: 1) it provides a good approximation of clutterand targets in local homogeneous blocks (relatively acceptableaveraging to estimate the parameters), and 2) it has fewerparameters to estimate from test data than a high-order model.However, the first-order Markov model can be easily expandedto higher order if a significantly large amount of homogeneousdata is available for parameter estimation. Furthermore, hiddenMarkov chain and hidden MRF models have been used success-fully to classify clutter [14]. In terms of characterizing clutternoise statistics, the MRF model is apparently better than theMarkov chain model because, physically, the clutter is spatiallyrelated due to the reflectance of the microwave signal. However,when applying the clutter statistical model to CFAR detectionhypothesis testing, the MRF model has the following majorchallenges which hinder its application to CFAR detection:1) parameter estimation is difficult in the MRF model, and2) computing false alarm and detection probabilities are diffi-cult, and no explicit probability equations are available in theMRF model. Therefore, the Markov chain model is consideredin this paper in order to derive CFAR detection algorithms fortarget detection applications.
This paper is organized as follows. Section II reviews con-ventional CFAR detection which is based on distribution of a
Fig. 1. In a typical conventional CFAR detection procedure, the thresholdTθ is adaptively determined according to the local statistic of the clutter suchthat the probability of false alarm (red area) is below a constant (i.e., CFAR).The detection probability [i.e., 1-miss probability (blue area)] is determinedafterward.
single pixel, and Section III derives the framework of Markov-chain-based CFAR detector and its implementation algorithm.In Section IV, data fusion ideas, including polarimetric datatransformation and decision fusion, are described to fuse fullpolarimetric channels to apply the new Markov chain CFARdetector. Experimental results on real polarimetric data areshown in Section V to confirm the performance advantageof the proposed Markov chain CFAR detector. Finally, theconclusion is drawn in Section VI.
II. CONVENTIONAL CFAR DETECTION APPROACH
In conventional CFAR detection, the clutter pdf is repre-sented by pc(x, θ) for background clutter pixel Xc, wherethe unknown parameter θ characterizes the nonhomogeneousnature of the clutter. The target pdf is given by pt(x) for targetpixel Xt. With the different statistical behaviors, we are able todistinguish the target from the background clutter by comparingthe pixel value to a threshold Tθ, as shown in Fig. 1.
Given a threshold Tθ, the false alarm probability Pfa isphysically the area under the clutter model pc(x; θ) for x ≥ Tθ,i.e.,
Pfa = P [Xc ≥ Tθ] =
∞∫Tθ
pc(x; θ) dx. (1)
The threshold Tθ is determined in an adaptive manner basedon clutter statistical model with unknown parameter θ estimatedfrom local background so that Pfa is held constant for vari-ous clutter levels (i.e., different θ); hence, it is called CFARdetectors.
A target is declared in the test cell x if its value is greater thanthe threshold Tθ. Therefore, the probability of detection Pd isthe area under the target model pt(x) for x ≥ Tθ
Pd = P [Xt ≥ Tθ] =
∞∫Tθ
pt(x) dx. (2)
In Fig. 1, we can easily see that the probability of detectionpd increases as the target pdf Pt(x) moves away from clutterpdf pc(x, θ).
Many commonly used CFAR detection algorithms includethe conventional CA [16], the OS [17], [18], the MEMO [19],and the OW [20] CFAR detector. The detectors that have beenproposed in the past deal with various types of clutter statistics

FEI et al.: MARKOV CHAIN CFAR DETECTION FOR POLARIMETRIC DATA 399
and different kinds of targets (fluctuating or not) [20]–[22].These CFAR detectors are designed in certain optimal waysthat are related to the Neyman–Pearson criterion in hypothesistesting [1], [30], [31]. In case that the parameter θ is discrete,the randomized Neyman–Pearson test [1] can be employed toobtain CFAR solutions.
However, conventional CFAR detection examines only onespecific sample pixel and makes detection decisions based onmerely the amplitude information (i.e., pdf) of the examinedsingle pixel for target detection. This limits separability oftargets from noisy clutter. With the finer resolution of advancedSAR such as RADARSAT-2, typical targets now contain ablock of multiple pixels. Thus, we are motivated to seek newfeatures to improve target detection based on a sequence ofneighboring target pixels. The Markov chain model is a promis-ing model to characterize the statistics of not only the pixelvalue but also the neighboring pixel correlation. We now extendthe pdf statistical model to the Markov chain statistical modelfor better target detection.
III. MARKOV-CHAIN-BASED CFAR DETECTOR
In a Markov chain environment, we are interested in not onlythe individual value of the examined sample but also the proba-bility of moving to the sample from its neighbors. The proposeddetection procedure in case of Markov chain environmentsfollows a totally different approach for discriminating clutterand target, although schematically it is similar to conventionalCFAR detection approach.
A. Markov Chain Model Representation
In a Markov chain representation, signals are represented indiscrete states rather than continuous values. The representationof discrete time continuous value random data (e.g., an image)using a well-defined irreducible Markov chain is developed inthis section.
Consider a discrete time random process X[n], n = 1, 2, . . .,which is identically distributed according to a pdf p(x). Therandom variable X[n] is distributed in real value, and thus,it should be quantized into a discrete state model for Markovchain representation. In quantization, the space of X[n] ispartitioned into N segments, with each one centered at si,i = 1, 2, . . . , N , as shown in Fig. 2.
Being in the ith segment, the center value si is obtainedas the outcome from the corresponding segment around. Thewidth of the segments is supposed to be very small suchthat the quantization error due to approximation of si inthe corresponding segment is sufficiently small. Using no-tations of Markov chains, each segment index i ∈ I = {i :1, 2, 3, . . . , N} is called a state, which corresponds to the ithsegment. The countable set {s1, s2, . . . , sN} is called the statespace [32]. The quantized random process X[n], which takesonly the discrete values on state space, with distribution pi, i ∈I , is a first-order Markov chain when the following condition issatisfied:
Pr [X[n] = si|X[n− 1] = sj , X[n− 2] = sk, . . .]
Fig. 2. Space of a random variable X is divided into N segments, where eachof which is represented by a discrete state.
Fig. 3. State transition diagram of a Markov chain.
= Pr [X[n] = si|X[n− 1] = sj ] . (3)
This means that the current state of the random processdepends only on the state at the preceding time instant re-gardless of any other previous times. The Markov chain ishomogeneous if the transition probability does not change withtime n. According to the terminology applied to homogeneousMarkov chains, the transition probability Qij = Pr[X[n] =sj |X[n− 1] = si] is the conditional probability of being attime n in the jth state, while at time n− 1, the ith statewas active. The transition probability among all states formsthe transition matrix. In a Markov chain with N states, asshown in Fig. 3, N2 interconnections (transition probabilities)are required to characterize the behavior of the Markov chain.These N2 parameters contribute in a detailed characterizationfor signals (clutter and target) and, eventually, accurate targetdetection. When using Markov chains to model clutter andtargets, these transition probabilities can be estimated from realdata by counting the frequency of occurrence of transitionsamong all states.
B. Markov-Chain-Based Detection
Evidently, in a Markov chain environment, emphasis shouldalso be given on the transition probabilities between pairsof neighboring pixels. The detection procedure in a Markovchain environment examines a block of several pixel neighbors.Detection is based on their joint probability (i.e., likelihood),which characterizes both the conventional individual pdf andthe transition probabilities among them.
Suppose that an image block under test consists of n pixels,and the image block can be represented by a vector as x =(x1, x2, . . . , xn), where each pixel xi takes value from theMarkov chain discrete state set {s1, s2, . . . , sN}, where N isthe total number of pixel states. By this vector representation

400 IEEE TRANSACTIONS ON GEOSCIENCE AND REMOTE SENSING, VOL. 50, NO. 2, FEBRUARY 2012
Fig. 4. Test image blocks with square and cross shapes, respectively.(a) Square test pixel block. (b) Cross test pixel block.
of an image block, we assume that xn depends on xn−1, xn−1
depends on xn−2, so on and so far. By detection theory [1], thetest vector x is declared as a target if the likelihood ratio
pt(Xt = x)
pc(Xc = x)≥ T (4)
where pt(·) and pc(·) are the likelihood of being a target (Xt)or background clutter (Xc), respectively, and T is a threshold.With the first-order Markov chain models, the likelihood canbe expanded as the product of a 1-D pdf and transition proba-bilities for both target and clutter. Then, we have the followingdetection criterion:
pt(x1)
pc(x1)
pt(x2|x1)
pc(x2|x1)· · · pt(xn|xn−1)
pc(xn|xn−1)≥ T. (5)
The first term of the aforementioned likelihood ratio is dueto the conventional 1-D pdf, and the remaining terms are dueto transitions from x1 up to xn. The aforementioned structureshows that the Markov chain detector is an extension of theconventional pdf-based detectors.
Probabilities of false alarm and detection are then, respec-tively, obtained by
Pfa =∑
R(x1,...,xn)≥T
pc(x1)pc(x2|x1) · · · pc(xn|xn−1) (6)
Pd =∑
R(x1,...,xn)≥T
pt(x1)pt(x2|x1) · · · pt(xn|xn−1) (7)
where R(x1, . . . , xn) denotes the likelihood ratio at the left sideof (5).
Generally, an image block under test is a 2-D region insteadof a vector sequence, so the likelihood of the block may notbe explicitly in the form of (5). In some cases, a 2-D imageblock can be ordered to form a Markov chain with depen-dency between neighboring pixels. An example is shown inFig. 4(a), where the test block is a 3 × 3 pixel block. By index-ing the nine pixels in the order of (x(−1,−1), x(−1,0), x(−1,1),x(0,1), x(0,0), x(0,−1), x(1,−1), x(1,0), x(1,1)) as shown by di-rected arrows in Fig. 4(a), the sequence forms a Markovchain. Generally, when such indexing strategy does not workfor some cases such as the example shown in Fig. 4(b), thelikelihood of the image block still can be decomposed to
Fig. 5. CFAR detection performs on a moving window. The test blockdetermines the image pixels for target detection and the pixels between theguard windows, and the background window forms the background clutter foradaptive statistical model estimation.
1-D pdf and/or transition probabilities using the Markov chainproperty. The likelihood of the five pixels in the cross-shapedblock in Fig. 4(b) can be expanded as p(x(0,0))p(x(0,−1)|x(0,0))p(x(−1,0)|x(0,0))p(x(0,1)|x(0,0))p(x(1,0)|x(0,0)). Such likeli-hood expansion strategy using Markov property will be em-ployed to derive a hypothesis detection criterion similar to theone in (5). However, as the likelihood expansion is specific tothe shape of the image block, the detection criterion and itscorresponding probability computations are also specific to theimage block.
C. Markov Chain CFAR Detection Algorithm
To guarantee CFAR, the threshold T in Markov detectionshould be adaptively determined according to a user-predefinedfalse alarm rate P set
fa . The best CFAR threshold should be thegreatest value such that the resulting false alarm rate in (6)is below a predefined level P set
fa . Direct calculation of theoptimal threshold for a given predefined false alarm rate iscomputationally expensive. An efficient way for CFAR detec-tion computation on the test vector x is instead to compute thecorresponding false alarm rate, called as P value in statistics, sothat a clutter block has larger likelihood than the test vector x,i.e.,
P testfa =
∑R(x1,...,xn)≥Rtest
pc(x1)pc(x2|x1) · · · pc(xn|xn−1)
(8)
where the test ratio Rtest = pt(x)/pc(x) is the ratio of thecurrent test block x. Then, the test pixel sequence is detectedas a target block if P test
fa < P setfa . The resulting Boolean result
(i.e., yes or no answer) can be assigned as the detection resultof the central pixel (i, j).
Due to the nonhomogeneous nature of the background clut-ter, CFAR detection implements adaptively on test images usingmoving windows, as shown in Fig. 5. The clutter Markov chainmodel is then estimated from local background window aroundtest pixel to make a CFAR decision on the test pixel. TheMarkov-chain-based CFAR detection algorithm is summarizedin the following.

FEI et al.: MARKOV CHAIN CFAR DETECTION FOR POLARIMETRIC DATA 401
For each pixel I(i, j) in the test image I , determine itstest neighbors and guard and background windows, and then,perform the following steps.
1) Estimate the clutter model locally from pixels in thebackground window around pixel (i, j).
2) Calculate the likelihood of the neighboring pixels ofbeing a clutter from the locally estimated clutter Markovmodel.
3) Calculate the likelihood of the neighboring pixels ofbeing a target from the global target Markov chain model.
4) Compute the likelihood ratio and the corresponding testfalse alarm rate in (8).
5) Detect the test pixel I(i, j) as a target pixel if the resultingtest false alarm rate P test
fa in (8) is greater than thepredefined rate P set
fa .
D. Markov Chain Model Estimation on SAR Images
To model background clutter using Markov chain model,there are parameters to estimate. One is Markov chain statemodel for variable space quantization, and the other is prob-ability transition matrix estimation.
1) Markov Chain State Quantization: As shown in Fig. 2,the space of a continuously distributed variable is divided intoN segments, where each of which is represented by a discretestate. The number of states N must be chosen to trade offquantization error due to value approximation and computationcomplexity. We tried different values in our experiments andchose N = 128 in our Markov chain model estimation, whichwe think results in sufficiently small quantization error underreasonable complexity.
There are many ways to partition the whole space of arandom variable into N segments. The simplest one would be auniform partition such that all segments are in equal width andthe center of each segment approximates its segment. However,because most of the SAR pixel values are focused in a narrowrange and the histogram of a SAR image is not a flat andbalanced distribution, uniform quantization is not efficient inrepresentation of the SAR image histogram. To better approxi-mate the original continuous histogram distribution, we wouldlike to have a small partition width (i.e., high resolution) in ahigh density area and a large width in the tail of the histogram.To achieve this better approximation, we propose a simplebut efficient nonuniform state quantization method utilizinghistogram equalization idea in our Markov chain state model.
Our proposed nonuniform quantization method is shown inFig. 6. Given a histogram or pdf of sample SAR data, we firstmap the original pixel value (denoted by x) to a transformationdomain such that the transformed data y has a predeterminedhistogram p(y) such as uniform or gamma distribution. Gammadistribution is used in our experiments. The transformationmapping y = f(x) is a monotonically increasing function andcan be uniquely determined by the original pdf p(x) and thedesired pdf p(y) according to the following relationship:
y∫0
p(y)dy =
x∫0
p(x) dx. (9)
Fig. 6. Nonuniform state quantization using histogram equalizationtransformation.
Then, in the space of y, we employ uniform partition,and their centers are represented by yi, i = 1, 2, . . . , N .Finally, these centers in y space are reversely transformed tox space according to (9), resulting in quantization points xi,i = 1, 2, . . . , N . Such uniform quantization in transform do-main results in nonuniform quantization in x space because ofthe nonlinear transformation function. We can see in Fig. 6 thatthe area of higher density in the histogram of the x variable hasa smaller partition width. This guarantees higher resolution inthe denser probability region.
2) Probability Transition Matrix Estimation: We know inSection III-A that the probability transition matrix dominatesthe behavior of a Markov chain model. This section provides apractical method to estimate the transition matrix from sampleSAR data.
From the Markov model, the transition probability of beingin the state j from the previous state i is the conditionalprobability Qij = Pr[X[n] = xj |X[n− 1] = xi]. This can bederived from the joint probability Pij = Pr[X[n] = xj , X[n−1] = xi] since
Qij =Pr [X[n] = xj |X[n− 1] = xi]
=Pr [X[n] = xj , X[n− 1] = xi]
Pr [X[n− 1] = xi]
=Pr [X[n] = xj , X[n− 1] = xi]∑j Pr [X[n] = xj , X[n− 1] = xi]
=Pij∑j Pij
. (10)
The joint probability Pij can be approximated by the fre-quency of occurrence of joint transitions from i to j among alltransitions as follows:
Pij=Pr [X[n]=xj , X[n− 1]=xi]
≈Number of n such that X[n]=xj and X[n− 1]=xi
Total number of transitions (X[n], X[n− 1]).
(11)
Specifically, for a 2-D SAR image, there are four neighborsaround a pixel. Therefore, we have four types of transitions,where each of which represents different directions from fourneighbors. Although the Markov chain only describes one-direction relationship of a time sequence, its time-reversed

402 IEEE TRANSACTIONS ON GEOSCIENCE AND REMOTE SENSING, VOL. 50, NO. 2, FEBRUARY 2012
Fig. 7. Polarimetric data fusion.
process is also a Markov chain since given the present, thepast, and the future are independent. Because we use Markovchain to model SAR image spatial correlation, it is reasonableto assume that the Markov chain is time reversible, i.e., stochas-tically the same, forward or backward in each spatial direction.Therefore, we estimate the overall transition probability byaveraging the joint probabilities from all directions.
Likewise, the marginal 1-D pdf distribution Pi =Pr[X[n] = xi] used in Markov chain detection (5) canalso be derived from the 2-D joint probability by
Pi =Pr [X[n] = xi] =∑i
Pr [X[n] = xj , X[n− 1] = xi]
=∑i
Pij . (12)
To fully estimate the joint probability in (11) and the tran-sition matrix in (10), a large number of pixels are required.For instance, with 128 Markov states, the transition matrixwill have 128× 128 = 16 384 elements to be estimated. In ourimplementation, a typical background window size is 256 ×256, so having at most 65 536 pixel samples. We find that theclutter transition matrix has most of nonzero elements in thetop-left corner and a lot of zeros elsewhere. This is consistent tothe fact that clutter pixels have small amplitude and are highlyspatially correlated. Therefore, there are not so many nonzeroparameters to be estimated in the transition matrix. In ourimplementation, after we count the frequency of transmissionoccurrence in joint probability estimation, we also apply asmoothing operation by convoluting with a 2-D Gaussian filter.This can be regarded as applying a Gaussian kernel in densityestimation of a 2-D distribution. This kernel density estimationmethod can produce a good approximation of the transitionmatrix even when there are a few samples available.
IV. MARKOV CHAIN CFAR DETECTOR FOR
POLARIMETRIC DATA USING DATA FUSION
To take advantage of full polarizations of polarimetric SARdata, data fusion is required to combine complementary fea-tures from different polarizations for target detection. In ourapplications, there are two possible data fusion approachesto polarimetric CFAR detection: polarimetric data fusion andCFAR detection decision fusion.
A. Polarimetric Data Fusion
In the polarimetric data fusion approach shown in Fig. 7,polarimetric data with four channels are first fused to generatea single fusion image. Markov chain CFAR detector is thenapplied to the fusion image so that it provides better detectionperformance than individual polarization images.
Fig. 8. CFAR detector decision fusion.
There are several polarimetric decomposition or transfor-mation techniques that may improve the signal-to-noise ratioof target and thus improve the detection performance. In thispaper, we consider two transformation techniques. One is po-larimetric whitening filtering (PWF) transformation [33], whichis commonly used in polarimetric data processing. The otheris principal component analysis (PCA), which transforms themultidimensional data to the projection with the most variance(energy) of the original data.
B. CFAR Detector Decision Fusion
Fig. 8 shows another approach: CFAR detector decisionfusion. Separate Markov CFAR detectors are applied to allpolarizations of the data, resulting in four decision images. Datafusion is then applied to individual decision images to obtainan overall decision image. Since the detection fusion approachfuses several detection decisions from individual CFAR detec-tors to obtain a final decision, it should be able to providecomplementary decision information, thus resulting in higherdetection performance than any individual detectors. The CFARdecision fusion idea has been exploited by many researchers[34]–[36], in which specific rules are required in order tomaximize overall detection accuracy while still maintaining aCFAR.
In the work, the optimal decision fusion rule in [34] isadopted using Neyman–Pearson testing criterion. A random-ized Neyman–Pearson test is used for fusing decisions from MCFAR detectors. It is assumed that all CFAR detectors operateat same CFAR Pf but at different detection probability Pdi
where i = 1, 2, . . . ,M . The log-likelihood ratio (LLR) test atthe fusion center is
log Λ(u) = logP (u1, u2, . . . , uM |H1)
P (u1, u2, . . . , uM |H0)
H1
≷H0
T (13)
where u = (u1, u2, . . . , uM ) is a row vector of the decisionsfrom the individual detectors, T is the threshold to be deter-mined by the desirable false alarm rate at the fusion center,H1 is the hypothesis that a target is present, and T0 is thehypothesis that a target is absent (i.e., clutter). Since differentCFAR detectors operate on different bands independently, sothat
log Λ(u) =
M∑i=1
logP (ui|H1)
P (ui|H0)=
M∑i=1
log Λ(ui)H1
≷H0
T. (14)
where log Λ(ui) = log(P (ui|H1)/P (ui|H0)). This equationdescribes the decision fusion criterion in the fusion center. It

FEI et al.: MARKOV CHAIN CFAR DETECTION FOR POLARIMETRIC DATA 403
Fig. 9. Typical set of polarization images of a ship target in the Atlantic Ocean. (a) HH polarization. (b) HV polarization. (c) VH polarization. (d) VV polarization.
has been proven that [34] the distribution of individual LLRs isgiven by
P (log Λ(ui)|H0) = (1− Pf )δ
(log Λ(ui)− log
1− Pdi
1− Pf
)
+ Pfδ
(log Λ(ui)− log
Pdi
Pf
)(15)
P (log Λ(ui)|H1) = (1− Pdi) δ
(log Λ(ui)− log
1− Pdi
1− Pf
)
+ Pdiδ
(log Λ(ui)− log
Pdi
Pf
)(16)
where the Dirac delta function δ(x) is equal to one when x = 0and zero otherwise.
The aforementioned relations describe the conditional distri-butions of the LLR tests at the individual CFAR detectors. Sincethe LLR test statistic in (13) is the sum of all individual LLRtests at all detectors, the conditional distribution of the LLR
test statistic at the fusion center is obtained by convolving theaforementioned contributions, i.e.,
P (log Λ(u)|H0) =P (log Λ(u1)|H0) ∗ P (log Λ(u2)|H0)
∗ · · · ∗ P (log Λ(uM )|H0) (17)P (log Λ(u)|H1) =P (log Λ(u1)|H1) ∗ P (log Λ(u2)|H1)
∗ · · · ∗ P (log Λ(uM )|H1) (18)
where ∗ denotes the convolution operation.Consequently, the probabilities of false alarm and detection
at the fusion center are described by the following expressions:
P fF =
∑logΛ(u)>T
P (log Λ(u)|H0) (19)
P fD =
∑logΛ(u)>T
P (log Λ(u)|H1) (20)
where the threshold T for the fusion center is to be determinedso that a CFAR P f
F is attained at the fusion center.

404 IEEE TRANSACTIONS ON GEOSCIENCE AND REMOTE SENSING, VOL. 50, NO. 2, FEBRUARY 2012
In fusion center implementation of different individualCFAR detectors with dissimilar Pdi
, it is not straightforwardto compute the probabilities of false alarm and detection at thefusion center in (19) and (20), respectively, and to determinethe optimal fusion threshold T . The optimal decision fusion hasbeen implemented as a unique software module to fuse decisionresults from Markov chain CFAR detectors in full polarimetricchannels.
V. EXPERIMENTAL RESULTS
The proposed Markov CFAR detector for polarimetric datais tested using simulated RADARSAT-2 data sets provided byCanada Space Agency as well as airborne polarimetric dataacquired by Environment Canada CV-580 airborne SAR. Wehave about a total of 13 polarimetric SAR images containingship targets for this application. A typical set of polarizationimages of the test scenes is shown in Fig. 9, where a ship targetis clearly seen in the Atlantic Ocean.
In our experiments, three Markov chain detectors with dif-ferent three, five, and nine test pixels as well as the pdf-baseddetector are compared to evaluate performance improvementdue to Markov chain models. As previously mentioned, theconventional pdf-based detector can be regarded as the trivialcase of a Markov chain detector where only one pixel is usedfor detection, which employs only histogram to make CFARdecisions. For comparison purposes, the cross-shaped test blockof pixel size 5 shown in Fig. 4(b) is also evaluated.
A. Analytical Performance Comparison
A common approach in the assessment of a detector per-formance is the receiver operating characteristic (ROC) curve.The ROC plot is a curve of probability of detection versusprobability of false alarm as the detector threshold varies. Forour application, the signal being detected is the ship in theSAR images, and the background clutter is the ocean. Giventhe global target and clutter models estimated from ground truthof all available test data, we plot the ROC curves for Markov-chain-based detectors as well as a pdf-based detector. The fourMarkov-chain-based detectors with different pixel sizes (three,five, and nine pixels and five pixels in cross shape) and theconventional pdf-based detector are evaluated for ROC curvecomparison.
The global target and clutter models are first estimatedusing the transition probability estimation method discussedin Section III-D-2 from all available test data with availableground truth information. With the estimated global target andclutter models, we then calculate the theoretical probabilityof false alarm and the probability of detection in (6) and (7),respectively, where the optimal decision region is specifiedin (5), with T as the detector threshold. Therefore, when thethreshold T varies, we obtain a ROC curve of probability ofdetection versus probability of false alarm. Such ROC curvecharacterizes the separability of the target and clutter statistics.
The analytical ROC curve results are shown in Figs. 10–14for four polarizations (HH, HV, VH, and VV) and the PWFimages, respectively. In the figures, the vertical lines indicatethe detection probability gain of the Markov-chain-based de-tector relative to the pdf-based detector. The results show thatthe Markov-chain-based detectors can always improve the pdf-
Fig. 10. ROC plots for HH polarization.
Fig. 11. ROC plots for HV polarization.
based detector. In particular, the Markov chain detector withnine test pixels can improve the pdf detector by an amount from22% to 40% in terms of detection probability gain at false alarmrate level 10−4. The Markov chain detectors with five pixelsin a row and five pixels in cross shape have almost the sameperformance. Other than the ROC curve plots, we also estimatethe signal-to-clutter ratio (SCR) gain for our proposed Markovchain detector. For a CFAR of 10−4, we find that the Markovchain detector with nine test pixels can achieve about 2.84 dBof SCR gain, averaging on four polarizations.
We can also see in Figs. 11 and 12 that the ROC plots for thecross-polarimetric channels (HV and VH) are very similar. Thisobservation confirms the cross-polarimetric symmetry that HVand VH channels are almost identical for natural scenes.
B. Experimental Results on Individual Polarizations
In this experiment, we implement and test the proposedMarkov-chain-based CFAR algorithm to real test images, asshown in Fig. 9. The Markov chain CFAR detection algorithmis carried out in moving windows throughout the entire test

FEI et al.: MARKOV CHAIN CFAR DETECTION FOR POLARIMETRIC DATA 405
Fig. 12. ROC plots for VH polarization.
Fig. 13. ROC plots for VV polarization.
Fig. 14. ROC plots for PWF transformation.
image. In the algorithm implementation, the ship target Markovchain model is known, which is estimated from all ship targetsin the data sets. In case that there is no prior informationavailable about the target, a default uniform transition matrixcan be initially used, although an accurate target model willimprove the detection performance to detect the correct targetsin CFAR scanning process.
In the experiments, we set the background window sizeto be 256 × 256. Different guard window sizes (5 × 5,5 × 10, 10 × 160, and 15 × 200) are chosen to exclude theactual target in local clutter model estimation process of CFARimplementation. Practically, when there is prior informationabout the orientation of the target in advance, square guardwindows are more appropriate, so three square guard windowsizes (20 × 20, 80 × 80, and 160 × 160) are also tested. Theconstant false alarm level is set to be P set
fa = 10−4. For eachguard window size, the CFAR detector scans over all movingwindows in the image and detects whether each test pixel isa target pixel or not. After entire image scanning, we comparethe detected target pixels with the ground truth information. Thedetection rate is measured as
Correct Detection Rate
=The number of correctly detected ship pixels
Total number of ship pixels. (21)
The aforementioned calculated detection rate is an experi-mental measure of the analytical probability of detection per-formance. Again, four different Markov chain detectors withthree, five, and nine row test pixels and five cross-shaped pixels,as well as the pdf-based detector, are tested in this CFAR exper-iment, and their correct detection rates are recorded to evaluatetheir performance in different guard window size cases.
In our first experiment testing, we apply the proposedMarkov chain detection to four individual polarization images.Polarimetric data are complex, and only amplitude informationof complex pixels is used in the experiment. Tables I–IV showthe measured CFAR detection rate results using HH, HV, VH,and VV amplitude images, respectively. In the tables, each rowrepresents the pdf-based detector and Markov chain detectorswith three, five, and nine row test pixels and cross-shapedfive test pixels, and each column corresponds to various guardwindow sizes.
The results in the tables show that the proposed Markovchain detectors can achieve significant improvement over theconventional pdf detector. In certain cases such as that withguard window 5 × 81 using HH polarization, the conventionalpdf detector detects only 32% of the target pixels, while theMarkov chain detector using nine neighboring pixels can detect85% of the target pixels. From the results, we also see that alarger guard window leads to better detection performance. Thisis because a large window size excludes more target pixels ortransient pixels out of the background window, thus resultingin accurate local clutter model estimation. The results of theMarkov chain detectors of five pixels in a row and five pixelsin cross shape are comparable, which is consistent to the ROCanalytical results.
By comparing the results in all polarizations, it seems thatHH and VV provide better CFAR detection performance thanHV and VH polarizations, which is not consistent with theanalytical results in Section V-A that the ROC curves of HV

406 IEEE TRANSACTIONS ON GEOSCIENCE AND REMOTE SENSING, VOL. 50, NO. 2, FEBRUARY 2012
TABLE ICFAR DETECTION RATES USING HH POLARIZATION
TABLE IICFAR DETECTION RATES USING HV POLARIZATION
TABLE IIICFAR DETECTION RATES USING VH POLARIZATION
TABLE IVCFAR DETECTION RATES USING VV POLARIZATION
and VH outperform those from HH and VV. This is becauseROC curve analysis characterizes global separability betweenship and ocean pixels, but the CFAR detection results onlyreflect local separability between ship target pixels and theirlocal background pixels in the background window but outof the guard window. Moreover, when the guard window sizeis not large enough to exclude all target pixels, some of thetarget pixels are wrongly regarded as clutter pixels. Thesewrongly identified target pixels result in inaccurate cluttermodel, leading to CFAR detection performance deterioration.Such interference is more sensitive in HH and VV channelssince the target pixels in HH and VV channels deviate morefrom the background pixels as shown from the ROC curves.
C. Experimental Results on Polarimetric Data Fusion
In the second experiment, we apply the proposed Markovchain detector to the PWF transformation image and the firstprincipal component of four polarization images.
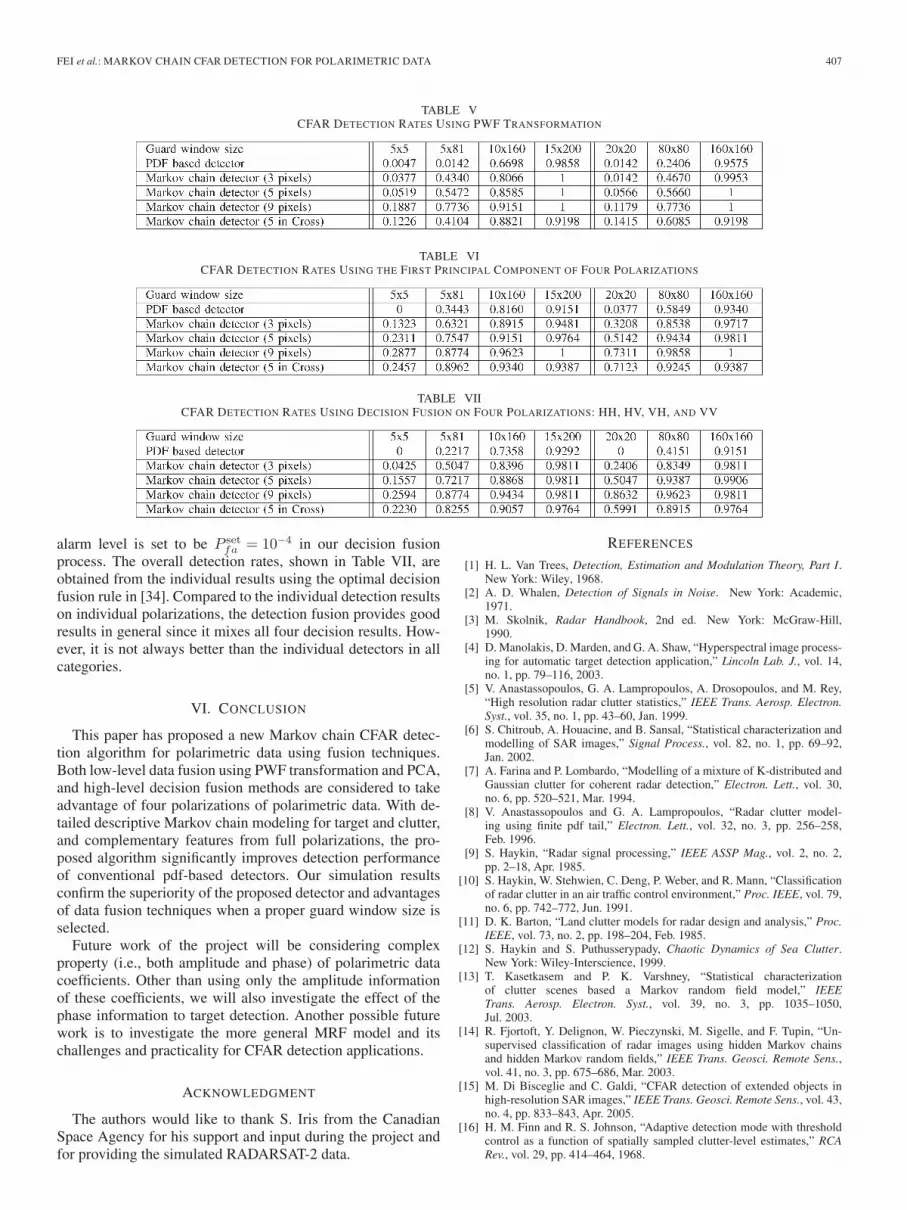
The CFAR detection results from the PWF images are shownin Tables V. By comparing the results to those from individualimages in Tables I–IV, we can see that PWF transformationleads to better detection results for a large guard window sizeof 15 × 200. However, improvement is not guaranteed for smallguard window sizes of 5 × 5 and 5 × 81. This is because theinterference from the target pixels due to wrong guard windowsizes results in inaccurate clutter model estimation in the localbackground window.
Table VI shows the detection results using the first principalcomponent of polarimetric data. Compared to individual CFARdetection results on HH, HV, VH, and VV, the PCA fusionmethod leads to better detection results in large guard windowcases of 10 × 160 and 15 × 200. This is because the principalcomponent contains most of the important information fromfour polarization images, so the target is more likely to bedifferentiated from background clutters. Again, for small guardwindow cases, the results are not always better because ofinterference due to wrong guard window sizes.
Both data fusion methods using PWF and PCA are able toachieve better performance than individual polarization imageswhen a proper guard window size is set. To exclude the inter-ference of all target pixels, the guard window size should beat least two times of the target size. However, in most detectioncases, one has no prior knowledge of target size and orientation.In such case, an appropriate square guard window size such as80 × 80 can be selected. Another practical solution in onlinetarget detection systems is to first apply a simple pdf-basedCFAR scan on images to obtain a quick estimation of targetsize and then to apply the proposed detection algorithm with anappropriate guard window size.
D. Experimental Results on Polarimetric Decision Fusion
In the third experiment, decision fusion on results from fourindividual channels is performed. Again, a predefined false
FEI et al.: MARKOV CHAIN CFAR DETECTION FOR POLARIMETRIC DATA 407
TABLE VCFAR DETECTION RATES USING PWF TRANSFORMATION
TABLE VICFAR DETECTION RATES USING THE FIRST PRINCIPAL COMPONENT OF FOUR POLARIZATIONS
TABLE VIICFAR DETECTION RATES USING DECISION FUSION ON FOUR POLARIZATIONS: HH, HV, VH, AND VV
alarm level is set to be P setfa = 10−4 in our decision fusion
process. The overall detection rates, shown in Table VII, areobtained from the individual results using the optimal decisionfusion rule in [34]. Compared to the individual detection resultson individual polarizations, the detection fusion provides goodresults in general since it mixes all four decision results. How-ever, it is not always better than the individual detectors in allcategories.
VI. CONCLUSION
This paper has proposed a new Markov chain CFAR detec-tion algorithm for polarimetric data using fusion techniques.Both low-level data fusion using PWF transformation and PCA,and high-level decision fusion methods are considered to takeadvantage of four polarizations of polarimetric data. With de-tailed descriptive Markov chain modeling for target and clutter,and complementary features from full polarizations, the pro-posed algorithm significantly improves detection performanceof conventional pdf-based detectors. Our simulation resultsconfirm the superiority of the proposed detector and advantagesof data fusion techniques when a proper guard window size isselected.
Future work of the project will be considering complexproperty (i.e., both amplitude and phase) of polarimetric datacoefficients. Other than using only the amplitude informationof these coefficients, we will also investigate the effect of thephase information to target detection. Another possible futurework is to investigate the more general MRF model and itschallenges and practicality for CFAR detection applications.
ACKNOWLEDGMENT
The authors would like to thank S. Iris from the CanadianSpace Agency for his support and input during the project andfor providing the simulated RADARSAT-2 data.
REFERENCES
[1] H. L. Van Trees, Detection, Estimation and Modulation Theory, Part I.New York: Wiley, 1968.
[2] A. D. Whalen, Detection of Signals in Noise. New York: Academic,1971.
[3] M. Skolnik, Radar Handbook, 2nd ed. New York: McGraw-Hill,1990.
[4] D. Manolakis, D. Marden, and G. A. Shaw, “Hyperspectral image process-ing for automatic target detection application,” Lincoln Lab. J., vol. 14,no. 1, pp. 79–116, 2003.
[5] V. Anastassopoulos, G. A. Lampropoulos, A. Drosopoulos, and M. Rey,“High resolution radar clutter statistics,” IEEE Trans. Aerosp. Electron.Syst., vol. 35, no. 1, pp. 43–60, Jan. 1999.
[6] S. Chitroub, A. Houacine, and B. Sansal, “Statistical characterization andmodelling of SAR images,” Signal Process., vol. 82, no. 1, pp. 69–92,Jan. 2002.
[7] A. Farina and P. Lombardo, “Modelling of a mixture of K-distributed andGaussian clutter for coherent radar detection,” Electron. Lett., vol. 30,no. 6, pp. 520–521, Mar. 1994.
[8] V. Anastassopoulos and G. A. Lampropoulos, “Radar clutter model-ing using finite pdf tail,” Electron. Lett., vol. 32, no. 3, pp. 256–258,Feb. 1996.
[9] S. Haykin, “Radar signal processing,” IEEE ASSP Mag., vol. 2, no. 2,pp. 2–18, Apr. 1985.
[10] S. Haykin, W. Stehwien, C. Deng, P. Weber, and R. Mann, “Classificationof radar clutter in an air traffic control environment,” Proc. IEEE, vol. 79,no. 6, pp. 742–772, Jun. 1991.
[11] D. K. Barton, “Land clutter models for radar design and analysis,” Proc.IEEE, vol. 73, no. 2, pp. 198–204, Feb. 1985.
[12] S. Haykin and S. Puthusserypady, Chaotic Dynamics of Sea Clutter.New York: Wiley-Interscience, 1999.
[13] T. Kasetkasem and P. K. Varshney, “Statistical characterizationof clutter scenes based a Markov random field model,” IEEETrans. Aerosp. Electron. Syst., vol. 39, no. 3, pp. 1035–1050,Jul. 2003.
[14] R. Fjortoft, Y. Delignon, W. Pieczynski, M. Sigelle, and F. Tupin, “Un-supervised classification of radar images using hidden Markov chainsand hidden Markov random fields,” IEEE Trans. Geosci. Remote Sens.,vol. 41, no. 3, pp. 675–686, Mar. 2003.
[15] M. Di Bisceglie and C. Galdi, “CFAR detection of extended objects inhigh-resolution SAR images,” IEEE Trans. Geosci. Remote Sens., vol. 43,no. 4, pp. 833–843, Apr. 2005.
[16] H. M. Finn and R. S. Johnson, “Adaptive detection mode with thresholdcontrol as a function of spatially sampled clutter-level estimates,” RCARev., vol. 29, pp. 414–464, 1968.

408 IEEE TRANSACTIONS ON GEOSCIENCE AND REMOTE SENSING, VOL. 50, NO. 2, FEBRUARY 2012
[17] H. Rolhling, “Radar CFAR thresholding in clutter and multiple target sit-uation,” IEEE Trans. Aerosp. Electron. Syst., vol. AES-19, no. 4, pp. 608–621, Jul. 1983.
[18] M. Shor and N. Levanon, “Performances of order statistics CFAR,” IEEETrans. Aerosp. Electron. Syst., vol. 27, no. 2, pp. 214–224, Mar. 1991.
[19] V. Anastassopoulos and G. A. Lampropoulos, “A new and robust CFARdetection algorithm,” IEEE Trans. Aerosp. Electron. Syst., vol. 28, no. 2,pp. 420–427, Apr. 1992.
[20] V. Anastassopoulos and G. A. Lampropoulos, “Optimal CFAR detectionin Weibull clutter,” IEEE Trans. Aerosp. Electron. Syst., vol. 31, no. 1,pp. 52–64, Jan. 1995.
[21] F. Gini, M. V. Groco, A. Farina, and P. Lombardo, “Optimum and mis-matched detection against K-distributed plus Gaussian clutter,” IEEETrans. Aerosp. Electron. Syst., vol. 34, no. 3, pp. 860–876, Jul. 1998.
[22] G. Gili and G. Lampropoulos, “A new asymptotically optimal K-pdfdetector,” in Proc. Int. Conf. Appl. Photon. Technol., Quebec, QC, Canada,Jun. 2000.
[23] M. E. Smith and P. K. Varshney, “Intelligent CFAR processor based ondata variability,” IEEE Trans. Aerosp. Electron. Syst., vol. 36, no. 3,pp. 837–847, Jul. 2000.
[24] G. Gao, L. Liu, L. Zhao, G. Shi, and G. Kuang, “An adaptive and fastCFAR algorithm based on automatic censoring for target detection inhigh-resolution SAR images,” IEEE Trans. Geosci. Remote Sens., vol. 47,no. 6, pp. 1685–1697, Jun. 2009.
[25] Y.-Q. Zhao, P. Gong, and Q. Pan, “Object detection by spectropolarime-teric imagery fusion,” IEEE Trans. Geosci. Remote Sens., vol. 46, no. 10,pp. 3337–3345, Oct. 2008.
[26] C. Fei, V. Anastassopoulos, T. Liu, G. Lampropoulos, K. Murnaghan, andR. Sabry, “Development of a polarimetric CFAR detector using Markovchains,” in Proc. IEEE Radar Conf., Rome, Italy, May 2008, pp. 1–6.
[27] C. Fei, T. Liu, G. Lampropoulos, R. Sabry, and K. Murnaghan, “A Markovchain CFAR detector for polarimetric data using adaptive linear discrimi-nant analysis,” in Proc. IEEE IGARSS, Boston, MA, Jul. 2008, pp. V-358–V-361 .
[28] C. Fei, T. Liu, G. Lampropoulos, and V. Anastassopoulos, “Markov chainCFAR detection for polarimetric data using data fusion,” in Proc. DSP,Santorini, Greece, Jul. 2009, pp. 1–6.
[29] V. Anastassopoulos, “Statistical and spectral properties of irreducibleMarkov chains,” in Proc. 14th Int. Conf. Dig. Signal Process., Santorini,Greece, Jul. 2002, pp. 1065–1068.
[30] A. De Maio, G. Fornaro, and A. Pauciullo, “Detection of single scatterersin multidimensional SAR imaging,” IEEE Trans. Geosci. Remote Sens.,vol. 47, no. 7, pp. 2284–2297, Jul. 2009.
[31] A. Huck and M. Guillaume, “Asymptotically CFAR-unsupervised targetdetection and discrimination in hyperspectral images with anomalous-component pursuit,” IEEE Trans. Geosci. Remote Sens., vol. 48, no. 11,pp. 3980–3991, Nov. 2010.
[32] J. R. Norris, Markov Chains. Cambridge, U.K.: Cambridge Univ. Press,1997.
[33] L. M. Novak and M. C. Burl, “Optimal speckle reduction in polarimet-ric SAR imagery,” IEEE Trans. Aerosp. Electron. Syst., vol. 26, no. 2,pp. 293–305, Mar. 1990.
[34] S. C. A. Thomopoulos, R. Viswanathan, and D. C. Bougoulias, “Optimaldecision fusion in multiple sensor systems,” IEEE Trans. Aerosp. Elec-tron. Syst., vol. AES-23, no. 5, pp. 644–653, Sep. 1987.
[35] G. A. Lampropoulos, V. Anastassopoulos, and J. F. Boulter, “Constantfalse alarm rate detection of point targets using distributed sensors,” Opt.Eng., vol. 37, no. 2, pp. 401–416, Feb. 1998.
[36] M. Barkat and P. K. Varshney, “Adaptive cell-averaging CFAR detectionin distributed sensor networks,” IEEE Trans. Aerosp. Electron. Syst.,vol. 27, no. 3, pp. 424–429, May 1991.
Chuhong Fei (S’04–M’06) was born in Zhejiang,China. He received the B.E. and M.E. degrees fromXi’an Jiaotong University, Xi’an, China, in 1994and 1997, respectively, and the M.A.Sc. and Ph.D.degrees in electrical and computer engineering fromthe University of Toronto, Toronto, ON, Canada, in2001 and 2006, respectively.
Since November 2006, he has been with A.U.G.Signals Ltd., Toronto, where he currently holds theChief Research Scientist position. His research inter-ests include radar image processing, remote sensing,
target detection and classification, multimedia signal processing, multimediasecurity, and data hiding.
Ting Liu received the B.Sc. degree from the Uni-versity of Science and Technology of China, Hefei,China, in 1997, the M.Sc. degree in electrical engi-neering from the University of Alberta, Edmonton,AB, Canada, in 1999, and the Ph.D. degree in electri-cal engineering from Queen’s University, Kingston,ON, Canada, in 2003.
Since July 2003, she has been with A.U.G. SignalsLtd., Toronto, ON, Canada. Her current research in-terests are in the area of digital signal processing andremote sensing, including detection, classification,
recognition, and signal fusion.Dr. Liu was a committee member of the International Conference on Space
Technology 2009.
George A. Lampropoulos (S’80–M’81) receivedthe B.Sc. (Honors) degree in control, electromag-netics, cybernetics, communications, and electronicsfrom the University of Patras, Patras, Greece, andthe M.Sc. degree in electronics and the Ph.D. de-gree in signal processing from Queen’s University,Kingston, ON, Canada.
He was a faculty member of the following univer-sities: Royal Military College, Kingston, from 1984to 1989; Laval University, Quebec City, QC, Canada,from 1987 to 1994; and University of Toronto,
Toronto, ON, Canada, in 1999. Since 2008, he has been an Adjunct Professorwith the Department of Electrical Engineering, University of Calgary, Calgary,AB, Canada. His industrial experience includes the following: SPAR Aerospacefrom 1989 to 1992 and A.U.G. Signals Ltd., Toronto, from 1992 to the presentas the President and CEO (being its founder and owner). He is also the Presidentof the Greek Space Agency (GSA) from 2006 to the present. He has supervisedmore than 180 industrial research projects in the area of communicationsand signal processing, including multisensor systems, detection, classification,multisensor signal processing, information fusion, and situation assessment.He has published more than 250 articles in journals, conferences, books, andtechnical reports in the area of signal processing. He coedited 13 books. Hisspecialization is in systems, electronics, and digital signal processing.
Dr. Lampropoulos is the founder of Photonics North, GSA, and InternationalConference of Space Technology. Among several board memberships, he is amember of the Defence Science Advisory Board of Canada, the Conferenceof Defence Associations Institute, and the selection committee of the VIMYawards in recent years. He held editorial positions in international journalsincluding the IEEE GEOSCIENCE AND REMOTE SENSING. He was an invitedkeynote speaker in major technical events and organized and was the generalchair in major multisociety conferences, i.e., International Conference onApplications of Photonic Technology or Photonics North (as General Chairfor 1994, 1996, and 1998; as Vice Chair for 2000, 2002, 2003, 2006, 2008,2009, 2010, and 2011; and as Honorary Chair for 2005). He is also the GeneralChairman of the 2009 International Conference on Space Technology held inThessaloniki, Greece, and the Finance Chair for 2011.
Vassilis Anastassopoulos (M’91) was born inPatras, Greece, in 1958. He received the B.Sc. degreein physics and the Ph.D. degree in electronics fromthe University of Patras, Patras, in 1980 and 1986,respectively.
He worked for two years in Canadian scientificinstitutions. Since 1987, he has been an academicstaff member with the Physics Department, Univer-sity of Patras, where he has been a Professor since2005, he was the Head of the Physics Departmentfor the biennium 2001–2003 and 2005–2007, and the
Vice Rector for Strategic Research Planning and Development from 2006 to2010. His publication record contains over 80 journal and conference papers,with more than 300 citations. His research interests are within the scopeof digital signal processing; image processing; radar signal processing andremote sensing with emphasis in multispectral, SAR, and infrared imagery;signal detection; pattern recognition with emphasis in handwritten analysis;and information fusion including image fusion, decision fusion, and sensorfusion architectures. Lately, he was involved in image processing techniquesfor astroparticle physics.