march 2019 - sbi mutual fund
TRANSCRIPT

March 2019
INDEX
......................................................................................................................................................................
......................................................................................................................................................................
......................................................................................................................................................................
......................................................................................................................................................................
......................................................................................................................................................................
......................................................................................................................................................................
......................................................................................................................................................................
......................................................................................................................................................................
......................................................................................................................................................................
......................................................................................................................................................................
......................................................................................................................................................................
......................................................................................................................................................................
......................................................................................................................................................................
......................................................................................................................................................................
......................................................................................................................................................................
......................................................................................................................................................................
......................................................................................................................................................................
......................................................................................................................................................................
......................................................................................................................................................................
......................................................................................................................................................................
......................................................................................................................................................................
......................................................................................................................................................................
......................................................................................................................................................................
......................................................................................................................................................................
......................................................................................................................................................................
......................................................................................................................................................................
......................................................................................................................................................................
Content Category No.
From the Managing Director’s Desk
Market Overview
From the CMO’s Desk
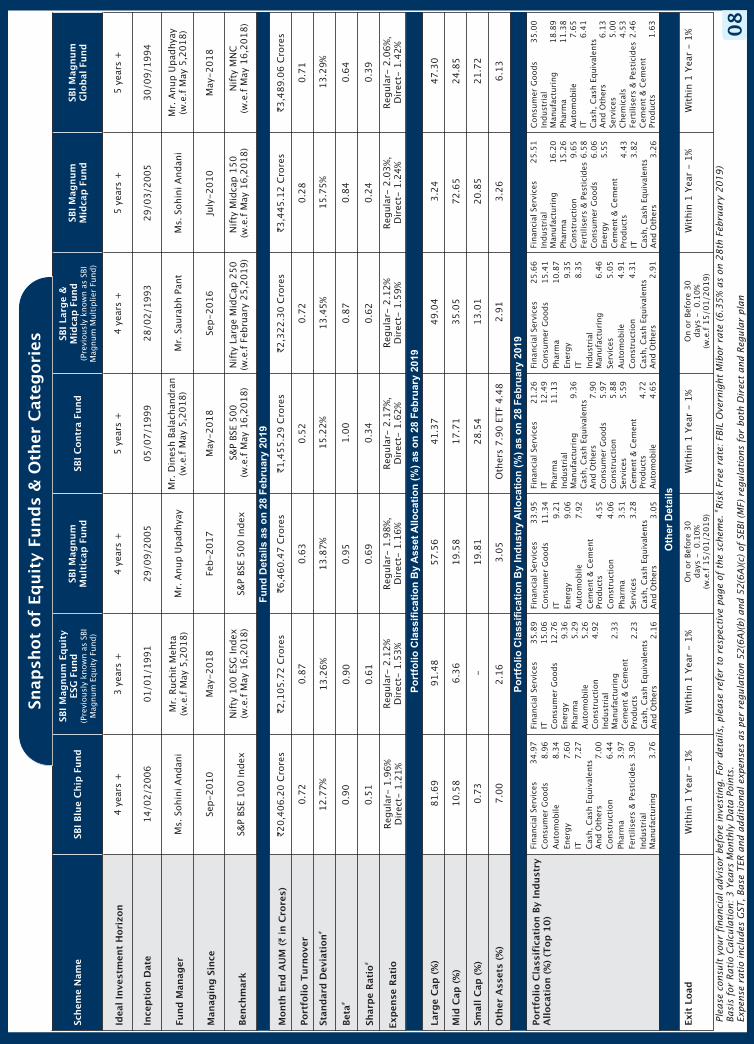
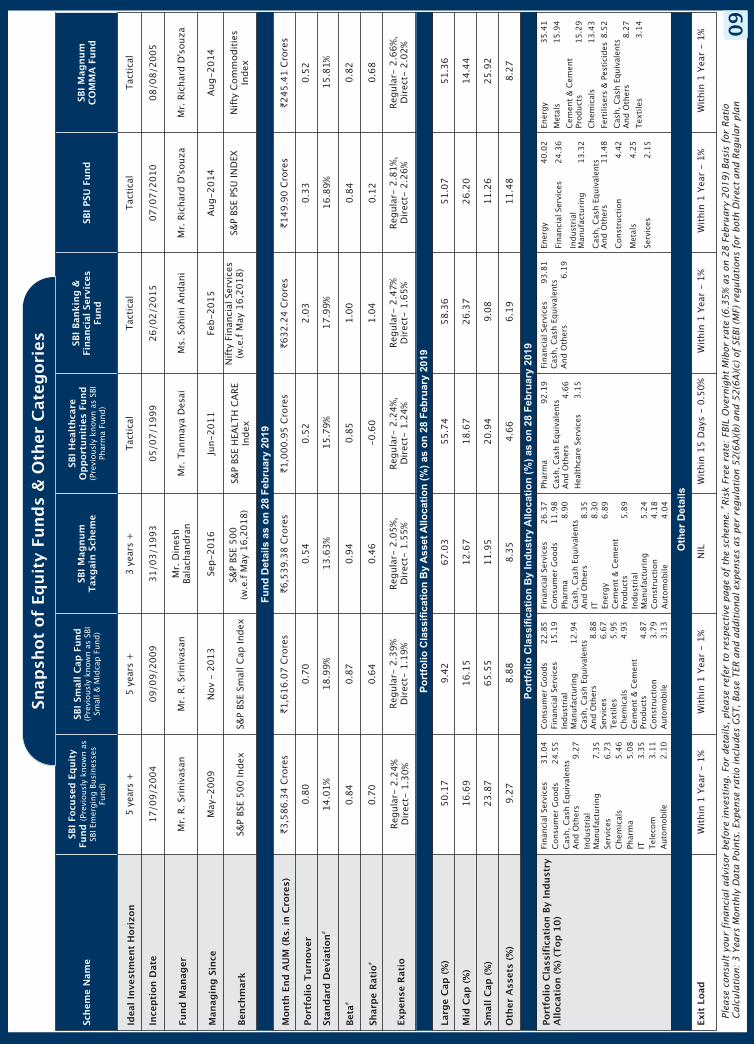
Snapshot of Equity Funds & Other Categories
Snapshot of Hybrid Funds & Solution Oriented Scheme
04
05
07
08
30
SBI Blue Chip Fund Equity - Large Cap 11
SBI Magnum Equity ESG Fund(Previously known as SBI Magnum Equity Fund) Equity - Thematic Fund 12
SBI Magnum Multicap Fund Equity - Multi Cap Fund 13
SBI Contra Fund Equity - Contra Fund 14
SBI Large & Midcap Fund(Previously known as SBI Magnum Multiplier Fund) Equity - Large & Mid Cap Fund 15
SBI Focused Equity Fund(Previously known as SBI Emerging Businesses Fund) Equity - Focused Fund 16
SBI Magnum MidCap Fund Equity - Mid Cap Fund 17
SBI Magnum Global Fund Equity - Thematic Fund 18
SBI Small Cap Fund(Previously known as SBI Small & Midcap Fund) Equity - Small Cap Fund 19
SBI Magnum Taxgain Scheme Equity - ELSS 20
SBI Healthcare Opportunities Fund(Previously known as SBI Pharma Fund) Equity - Sectoral Fund 21
SBI Banking And Financial Services Fund Equity - Sectoral Fund 22
SBI PSU Fund Equity - Sectoral Fund 23
SBI Magnum Comma Fund Equity - Sectoral Fund 24
SBI Infrastructure Fund Equity - Sectoral Fund 25
SBI Consumption Opportunities Fund(Previously known as SBI FMCG Fund) Equity - Thematic 26
SBI Technology Opportunities Fund(Previously known as SBI IT Fund) Equity - Sectoral Fund 27
SBI Gold Fund Fund of Fund 28
SBI Nifty Index Fund Index Fund 29
SBI Equity Hybrid Fund(Previously known as SBI Magnum Balanced Fund) Hybrid - Aggressive Hybrid Fund 31
SBI Dynamic Asset Allocation Fund Hybrid - Dynamic Asset Allocation Fund 32
SBI Debt Hybrid Fund(Previously known as SBI Magnum Monthly Income Plan) Hybrid - Conservative Hybrid Fund 33
SBI Multi Asset Allocation Fund(Previously known as SBI Magnum MonthlyIncome Plan - Floater) Hybrid - Multi Asset Allocation Fund 34
......................................................................................................................................................................
......................................................................................................................................................................
......................................................................................................................................................................
......................................................................................................................................................................
......................................................................................................................................................................
......................................................................................................................................................................
......................................................................................................................................................................
......................................................................................................................................................................
......................................................................................................................................................................
......................................................................................................................................................................
......................................................................................................................................................................
......................................................................................................................................................................
......................................................................................................................................................................
......................................................................................................................................................................
......................................................................................................................................................................
......................................................................................................................................................................
......................................................................................................................................................................
......................................................................................................................................................................
......................................................................................................................................................................
......................................................................................................................................................................
......................................................................................................................................................................
......................................................................................................................................................................
......................................................................................................................................................................
......................................................................................................................................................................
INDEXContent Category No.
SBI Magnum Children’s Benefit Fund(Previously known as SBI Magnum Children’s Benefit Plan) Solutions Oriented Scheme - Children’s Fund 35
SBI Equity Savings Fund Hybrid - Equity Savings Fund 36
SBI Arbitrage Opportunities Fund Hybrid - Arbitrage Fund 37
SBI Magnum Gilt Fund(Previously known as SBI Magnum Gilt Fund -Long Term Plan) Debt - Gilt Fund 40
SBI Magnum Income Fund Debt - Medium To Long Duration Fund 41
SBI Dynamic Bond Fund Debt - Dynamic Bond Fund 42
SBI Corporate Bond Fund Debt - Corporate Bond Fund 43
SBI Credit Risk Fund(Previously known as SBI Corporate Bond Fund) Debt - Credit Risk Fund 44
SBI Magnum Medium Duration Fund(Previously known as SBI Regular Savings Fund) Debt - Medium Duration Fund 45
SBI Short Term Debt Fund Debt - Short Duration Fund 46
SBI Magnum Constant Maturity Fund(Previously known as SBI Magnum Gilt Fund -Short Term Plan) Debt - Gilt Fund With 10 Year Constant Duration 47
SBI Magnum Low Duration Fund(Previously known as SBI Ultra Short Term Debt Fund) Debt - Low Duration Fund 48
SBI Savings Fund Debt - Money Market Fund 49
SBI Banking and PSU Fund(Previously known as SBI Treasury Advantage Fund) Debt - Banking And PSU Fund 50
SBI Liquid Fund(Previously known as SBI Premier Liquid Fund) Debt - Liquid Fund 51
SBI Magnum Ultra Short Duration Fund(Previously known as SBI Magnum InstaCash Fund) Debt - Ultra Short Duration Fund 52
SBI Overnight Fund(Previously known as SBI Magnum InstaCash Fund -Liquid Floater) Debt - Overnight Fund 53
Snapshot of Debt Funds & Other Categories 38
Comparative Performance for all Schemes 54
Systematic Investment Plan (SIP) 60
Total Expense Ratios 63
Dividend History Of Debt & Hybrid Funds 64
Disclaimer 67
SBI Funds Management Pvt Ltd Branches 68
How to read the Factsheet 69
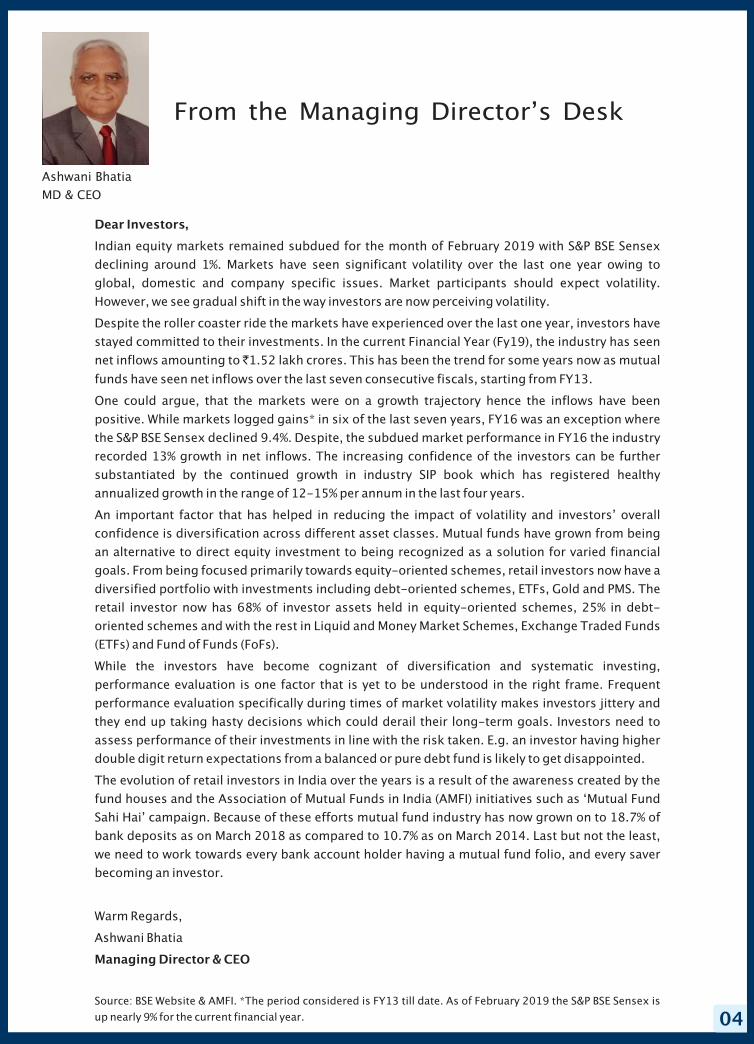
From the Managing Director’s Desk
Dear Investors,
Managing Director & CEO
Indian equity markets remained subdued for the month of February 2019 with S&P BSE Sensex
declining around 1%. Markets have seen significant volatility over the last one year owing to
global, domestic and company specific issues. Market participants should expect volatility.
However, we see gradual shift in the way investors are now perceiving volatility.
Despite the roller coaster ride the markets have experienced over the last one year, investors have
stayed committed to their investments. In the current Financial Year (Fy19), the industry has seen
net inflows amounting to 1.52 lakh crores. This has been the trend for some years now as mutual
funds have seen net inflows over the last seven consecutive fiscals, starting from FY13.
One could argue, that the markets were on a growth trajectory hence the inflows have been
positive. While markets logged gains* in six of the last seven years, FY16 was an exception where
the S&P BSE Sensex declined 9.4%. Despite, the subdued market performance in FY16 the industry
recorded 13% growth in net inflows. The increasing confidence of the investors can be further
substantiated by the continued growth in industry SIP book which has registered healthy
annualized growth in the range of 12-15% per annum in the last four years.
An important factor that has helped in reducing the impact of volatility and investors’ overall
confidence is diversification across different asset classes. Mutual funds have grown from being
an alternative to direct equity investment to being recognized as a solution for varied financial
goals. From being focused primarily towards equity-oriented schemes, retail investors now have a
diversified portfolio with investments including debt-oriented schemes, ETFs, Gold and PMS. The
retail investor now has 68% of investor assets held in equity-oriented schemes, 25% in debt-
oriented schemes and with the rest in Liquid and Money Market Schemes, Exchange Traded Funds
(ETFs) and Fund of Funds (FoFs).
While the investors have become cognizant of diversification and systematic investing,
performance evaluation is one factor that is yet to be understood in the right frame. Frequent
performance evaluation specifically during times of market volatility makes investors jittery and
they end up taking hasty decisions which could derail their long-term goals. Investors need to
assess performance of their investments in line with the risk taken. E.g. an investor having higher
double digit return expectations from a balanced or pure debt fund is likely to get disappointed.
The evolution of retail investors in India over the years is a result of the awareness created by the
fund houses and the Association of Mutual Funds in India (AMFI) initiatives such as ‘Mutual Fund
Sahi Hai’ campaign. Because of these efforts mutual fund industry has now grown on to 18.7% of
bank deposits as on March 2018 as compared to 10.7% as on March 2014. Last but not the least,
we need to work towards every bank account holder having a mutual fund folio, and every saver
becoming an investor.
Warm Regards,
Ashwani Bhatia
`
Source: BSE Website & AMFI. *The period considered is FY13 till date. As of February 2019 the S&P BSE Sensex is
up nearly 9% for the current financial year.
Ashwani Bhatia
MD & CEO
04
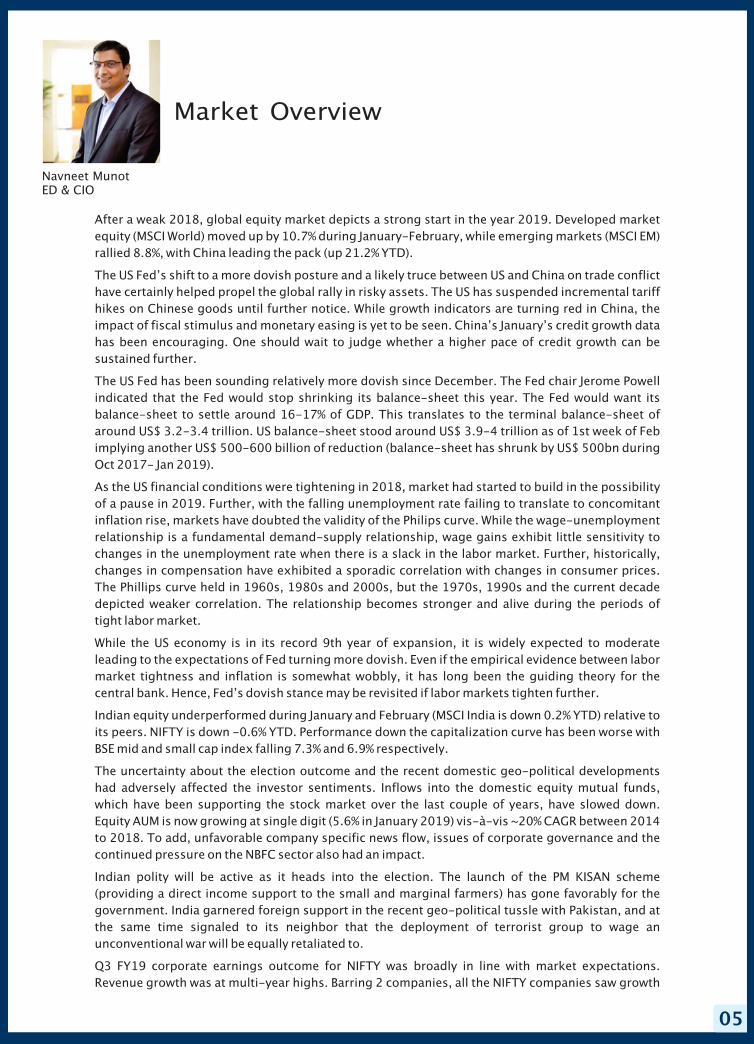
Market Overview
Navneet MunotED & CIO
After a weak 2018, global equity market depicts a strong start in the year 2019. Developed marketequity (MSCI World) moved up by 10.7% during January-February, while emerging markets (MSCI EM)rallied 8.8%, with China leading the pack (up 21.2% YTD).
The US Fed’s shift to a more dovish posture and a likely truce between US and China on trade conflicthave certainly helped propel the global rally in risky assets. The US has suspended incremental tariffhikes on Chinese goods until further notice. While growth indicators are turning red in China, theimpact of fiscal stimulus and monetary easing is yet to be seen. China’s January’s credit growth datahas been encouraging. One should wait to judge whether a higher pace of credit growth can besustained further.
The US Fed has been sounding relatively more dovish since December. The Fed chair Jerome Powellindicated that the Fed would stop shrinking its balance-sheet this year. The Fed would want itsbalance-sheet to settle around 16-17% of GDP. This translates to the terminal balance-sheet ofaround US$ 3.2-3.4 trillion. US balance-sheet stood around US$ 3.9-4 trillion as of 1st week of Febimplying another US$ 500-600 billion of reduction (balance-sheet has shrunk by US$ 500bn duringOct 2017- Jan 2019).
As the US financial conditions were tightening in 2018, market had started to build in the possibilityof a pause in 2019. Further, with the falling unemployment rate failing to translate to concomitantinflation rise, markets have doubted the validity of the Philips curve. While the wage-unemploymentrelationship is a fundamental demand-supply relationship, wage gains exhibit little sensitivity tochanges in the unemployment rate when there is a slack in the labor market. Further, historically,changes in compensation have exhibited a sporadic correlation with changes in consumer prices.The Phillips curve held in 1960s, 1980s and 2000s, but the 1970s, 1990s and the current decadedepicted weaker correlation. The relationship becomes stronger and alive during the periods oftight labor market.
While the US economy is in its record 9th year of expansion, it is widely expected to moderateleading to the expectations of Fed turning more dovish. Even if the empirical evidence between labormarket tightness and inflation is somewhat wobbly, it has long been the guiding theory for thecentral bank. Hence, Fed’s dovish stance may be revisited if labor markets tighten further.
Indian equity underperformed during January and February (MSCI India is down 0.2% YTD) relative toits peers. NIFTY is down -0.6% YTD. Performance down the capitalization curve has been worse withBSE mid and small cap index falling 7.3% and 6.9% respectively.
The uncertainty about the election outcome and the recent domestic geo-political developmentshad adversely affected the investor sentiments. Inflows into the domestic equity mutual funds,which have been supporting the stock market over the last couple of years, have slowed down.Equity AUM is now growing at single digit (5.6% in January 2019) vis-à-vis ~20% CAGR between 2014to 2018. To add, unfavorable company specific news flow, issues of corporate governance and thecontinued pressure on the NBFC sector also had an impact.
Indian polity will be active as it heads into the election. The launch of the PM KISAN scheme(providing a direct income support to the small and marginal farmers) has gone favorably for thegovernment. India garnered foreign support in the recent geo-political tussle with Pakistan, and atthe same time signaled to its neighbor that the deployment of terrorist group to wage anunconventional war will be equally retaliated to.
Q3 FY19 corporate earnings outcome for NIFTY was broadly in line with market expectations.Revenue growth was at multi-year highs. Barring 2 companies, all the NIFTY companies saw growth
05
in their revenue. However, this failed to translate into concomitant EBITDA growth. Nifty EBIDTA marginnarrowed by 180bps during the quarter. Autos, Metals and Oil &Gas were key sectors to see the margindecline. Most other sectors saw their operating margins being broadly stable.
Nifty PAT growth was at 6.4% with oil & gas being the key sector to drag down the profitability followedby autos and telecom. On the other hand, the performance of corporate banks stood out. Corporatebanks showed a sequential improvement in the asset quality trends. This provides visibility on theearnings outlook, as corporate banks were one of the key drivers for the earnings miss over the pastfew years.
NBFC delivered an in-line performance but saw moderation in the growth estimates owing to theprevailing stress in the liquidity and cost of funds environment. Disbursement growth moderatedsequentially. Tight liquidity and stress in NBFC sector had visible impact on real estate and auto sales.Banks, particularly the ones with strong liability franchise, are well positioned to regain market sharefrom the NBFCs. Recapitalization of select public sector banks and the RBI move towards reduction inrisk weights for NBFCs is expected to free up equity capital for banks against their exposures to firms.Banks can use this for incremental credit growth or improving their capital ratios.
Overall, despite the in-line performance of most of the companies, the direction of earnings revision isstill trending down. Our own expectation pencils FY19 NIFTY profit growth at ~13%. However, wecontinue to expect FY20 growth to the north of 20%, driven by favorable base and material pick-up infinancial sector profitability.
We forecast equity to see upside by end-2019. Investors (thus liquidity) are on the sidelines as they waitfor a better clarity on the likely outcome of the pending election. But whoever governs India for the nextfive years will enjoy the dividends from the significant structural reforms implemented in last couple ofyears. Interestingly, there is a huge convergence on economic policies across political parties andstructural factors should ensure a sustained growth in economy and markets over a medium term. Ofcourse, there could be intermittent sentimental impact leading to high volatility in the short run.Valuations have been de-rated, particularly in the small-cap space. Good news and good price canrarely be simultaneity. In such a scenario, we advise to stay invested in equities.
Coming to the bond market, despite the 25bps rate cut in the latest February monetary policy and anindication of more cuts in the offing; 10-year G-sec has moved up by 10bps since the policy date.Growth-inflation dynamics are supportive of rate cuts making the valuation attractive and globalenvironment is bond positive. Demand supply is the key risk to the bond outlook and is keeping theyields high despite easing monetary policy. Part of it emanates from weak fiscal, which translates intohigher supply risk. The other part hinges on banks’ appetite for government bonds in the current tightcredit to deposit environment. Any favorable development on demand supply front should guide ustowards the government bonds purchase.
Even though the central government’s interim budget has placed FY20 fiscal deficit at 3.4% of GDP,there is a increased recourse to expenditure funding through off-balance sheet means, keeping bondsupply elevated. This is getting reflected in wider corporate spreads and makes the non G-sec segmentrelatively attractive.
In the short-term segment, household demand for cash is blunting the RBI’s liquidity injections andstabilizing balance-of-payment conditions. Currency in circulation is nearing pre-demonetizationtrend (as percentage of GDP). We believe, a stronger drive on GST compliance post elections shouldreverse this trend. In the interim, however, the currency spike is effectively delaying the intendedimpact of the RBI’s liquidity push. In the near-term, the liquidity could tighten further, as governmentbuilds its cash balance before the month end.
Navneet Munot, ED & CIO – SBI Funds Management Private Limited
06
Dear Friends,
Executive Director & CMO (Domestic Business)
I believe this year is one of showing immense discipline in the face of market movements owing to
continued domestic and global issues like the upcoming elections, domestic corporate earnings,
trade uncertainties and crude oil prices. Our message as a fund house always has been that
investments should be made for your financial goals. Markets go through such phases, but one
should only concentrate on the goal and react once it has been achieved.
The industry added 2.5 lakh SIP folios taking the total folio count to 2.59 crore folios in February; with
the monthly SIP flows increasing from 8,064 crore last month to 8,095 crore in February. These
numbers are heartening considering the global and domestic uncertainties and maybe points to the
fact that now retail investors are planning their mutual fund investments in line with their financial
goals.
As we celebrated Women’s Day on 8th March, one area where I would like to see growth is women
taking up investment decisions. Unfortunately, women investors still form a very small base of the
mutual fund investors’ universe unlike the banking sector, and this needs to be addressed. It is time
they get involved and make decisions on money matters in the house. Mutual Funds are one of the
simpler investment options and offer convenience and ease of use in terms of facilities to invest both
online and offline. They are lighter on your budget, so you can start investing small amounts today.
All it takes is an initiative to learn more about your money and reach out to a financial adviser to plan
your finances.
As an industry, from a penetration perspective for newer investors, basic and easy to understand
products will always remain; and investing through a facility like SIP is ideal to gradually expose them
to the equity asset class. For this segment we as a fund house would focus our continued efforts on
educating them about investing with a goal in mind while offering custom solutions, facilities and
service through use of technology.
As I see changes happening around me across industries in terms of offerings, technological
capabilities and the opportunities available, I feel these are exciting times as a consumer, investor
and an observer. Make the most of these, start investing and stake your claim on the future.
Warm Regards,
D.P.Singh
` `
Data Source as on February 28, 2019; Source: AMFI and Internal
D.P. SinghED & CMO (Domestic Business)
07
From the CMO’s Desk
Po
rtfo
lio
Cla
ssif
icati
on
By In
du
str
yA
llo
cati
on
(%
) as o
n 2
8 F
eb
ruary
2019
Port
folio C
lass
ific
ati
on B
y In
dust
ryA
lloca
tion (
%)
(Top
10)
Oth
er
Deta
ils
Exit
Load
Wit
hin
1 Y
ear
- 1%
Wit
hin
1 Y
ear
- 1%
On o
r Be
fore
30
day
s -
0.1
0%
(w.e
.f 1
5/0
1/2
01
9)
Wit
hin
1 Y
ear
- 1%
On o
r Be
fore
30
day
s -
0.1
0%
(w.e
.f 1
5/0
1/2
01
9)
Wit
hin
1 Y
ear
- 1%
Wit
hin
1 Y
ear
- 1%
Finan
cial
Ser
vice
s3
4.9
7C
onsu
mer
Goods
8.9
6A
uto
mobile
8.3
4En
ergy
7.6
0IT
7.2
7C
ash, C
ash E
quiv
alen
tsA
nd O
ther
s7
.00
Const
ruct
ion
6.4
4Ph
arm
a3.9
7Fe
rtili
sers
& P
esti
cides
3.9
0In
dust
rial
Man
ufa
cturi
ng
3.7
6
Finan
cial
Ser
vice
s35.8
9IT
15.0
6C
onsu
mer
Goods
12.7
6En
ergy
9.3
6Ph
arm
a5.2
9A
uto
mobile
5.2
6C
onst
ruct
ion
4.9
2In
dust
rial
Man
ufa
cturi
ng
2.3
3C
emen
t &
Cem
ent
Product
s2.2
3C
ash, C
ash E
quiv
alen
tsA
nd O
ther
s2.1
6
Finan
cial
Ser
vice
s33.9
5C
onsu
mer
Goods
11.3
4IT
9.2
1En
ergy
9.0
6A
uto
mobile
7.9
2C
emen
t &
Cem
ent
Product
s4.5
5C
onst
ruct
ion
4.0
6Ph
arm
a3.5
1Se
rvic
es3.2
8C
ash, C
ash E
quiv
alen
tsA
nd O
ther
s3.0
5
Finan
cial
Ser
vice
s21.2
6IT
12.4
9Ph
arm
a11.1
3In
dust
rial
Man
ufa
cturi
ng
9.3
6C
ash, C
ash E
quiv
alen
tsA
nd O
ther
s7.9
0C
onsu
mer
Goods
5.9
7C
onst
ruct
ion
5.8
8Se
rvic
es5.5
9C
emen
t &
Cem
ent
Product
s4.7
2A
uto
mobile
4.6
5
Finan
cial
Ser
vice
s25.6
6C
onsu
mer
Goods
15.4
1Ph
arm
a10.8
7En
ergy
9.3
5IT
8.3
5In
dust
rial
Man
ufa
cturi
ng
6.4
6Se
rvic
es5.0
5A
uto
mobile
4.9
1C
onst
ruct
ion
4.3
1C
ash, C
ash E
quiv
alen
tsA
nd O
ther
s2.9
1
Finan
cial
Ser
vice
s25.5
1In
dust
rial
Man
ufa
cturi
ng
16.2
0Ph
arm
a15.2
6C
onst
ruct
ion
9.6
5Fe
rtili
sers
& P
esti
cides
6.5
8C
onsu
mer
Goods
6.0
6En
ergy
5.5
5C
emen
t &
Cem
ent
Product
s4.4
3IT
3.8
2C
ash, C
ash E
quiv
alen
tsA
nd O
ther
s3.2
6
Consu
mer
Goods
35.0
0In
dust
rial
Man
ufa
cturi
ng
18.8
9Ph
arm
a11.3
8A
uto
mobile
7.6
5IT
6.4
1C
ash, C
ash E
quiv
alen
tsA
nd O
ther
s6.1
3Se
rvic
es5.0
0C
hem
ical
s4.5
3Fe
rtili
sers
& P
esti
cides
2.4
6C
emen
t &
Cem
ent
Product
s1.6
3
Fu
nd
Deta
ils a
s o
n 2
8 F
eb
ruary
2019
Month
End
AU
M (
in C
rore
s)`
`20,4
06.2
0 C
rore
s`2,1
05.7
2 C
rore
s`6,4
60.4
7 C
rore
s`1,4
55.2
9 C
rore
s`2,3
22.3
0 C
rore
s`3,4
45.1
2 C
rore
s`3,4
89.0
6 C
rore
s
Port
folio T
urn
over
0.7
20.8
70.6
30.5
20.7
20.2
80.7
1
Exp
ense
Rati
oReg
ula
r- 1
.96%
Dir
ect-
1.2
1%
Reg
ula
r- 2
.12%
Dir
ect-
1.5
3%
Reg
ula
r- 1
.98%
,D
irec
t- 1
.16%
Reg
ula
r- 2
.17%
,D
irec
t- 1
.62%
Reg
ula
r- 2
.12%
Dir
ect-
1.5
9%
Reg
ula
r- 2
.03%
,D
irec
t- 1
.24%
Reg
ula
r- 2
.06%
,D
irec
t- 1
.42%
Stand
ard
Dev
iati
on
Bet
a
#
#
#Sh
arp
e R
ati
o
12.7
7%
0.9
0
0.5
1
13.2
6%
0.9
0
0.6
1
13.8
7%
0.9
5
0.6
9
15.2
2%
1.0
0
0.3
4
13.4
5%
0.8
7
0.6
2
15.7
5%
0.8
4
0.2
4
13.2
9%
0.6
4
0.3
9
Schem
e N
am
eSB
I Blu
e C
hip
Fund
SBI
Magnum
Mult
icap
Fund
SBI
Contr
a F
und
SBI
Magnum
Mid
cap
Fund
SBI
Magnum
Glo
bal Fu
nd
Idea
l In
ves
tmen
t H
ori
zon
4ye
ars
+3
year
s+
4ye
ars
+5
year
s+
4ye
ars
+5
year
s+
5ye
ars
+
Ince
pti
on D
ate
14
/02
/20
06
01
/01
/19
91
29
/09
/20
05
05
/07
/19
99
28
/02
/19
93
29
/03
/20
05
30
/09
/19
94
Fund
Manager
Ms.
Sohin
i A
ndan
iM
r. R
uch
it M
ehta
(w.e
.f M
ay 5
,2018)
Mr.
Anup U
pad
hya
yM
r. S
aura
bh P
ant
Ms.
Sohin
i A
ndan
i
Managin
g S
ince
Sep-2
010
May
-20
18
Feb-2
017
May
-20
18
Sep-2
016
July
-2010
May
-20
18
Ben
chm
ark
S&P
BSE
100 Index
S&P
BSE
500 Index
Po
rtfo
lio
Cla
ssif
icati
on
By
Asset
Allo
cati
on
(%
) as o
n 2
8 F
eb
ruary
2019
Larg
e C
ap
(%
)
Mid
Cap
(%
)
Small C
ap
(%
)
Oth
er A
sset
s (%
)
81.6
9
10.5
8
0.7
3
7.0
0
91.4
8
6.3
6
-
2.1
6
57.5
6
19.5
8
19.8
1
3.0
5
41.3
7
17.7
1
28.5
4
Oth
ers
7.9
0 E
TF
4.4
8
49.0
4
35.0
5
13.0
1
2.9
1
3.2
4
72.6
5
20.8
5
3.2
6
47.3
0
24.8
5
21.7
2
6.1
3
Snap
shot
of
Eq
uit
y Fu
nd
s &
Oth
er
Cate
gori
es
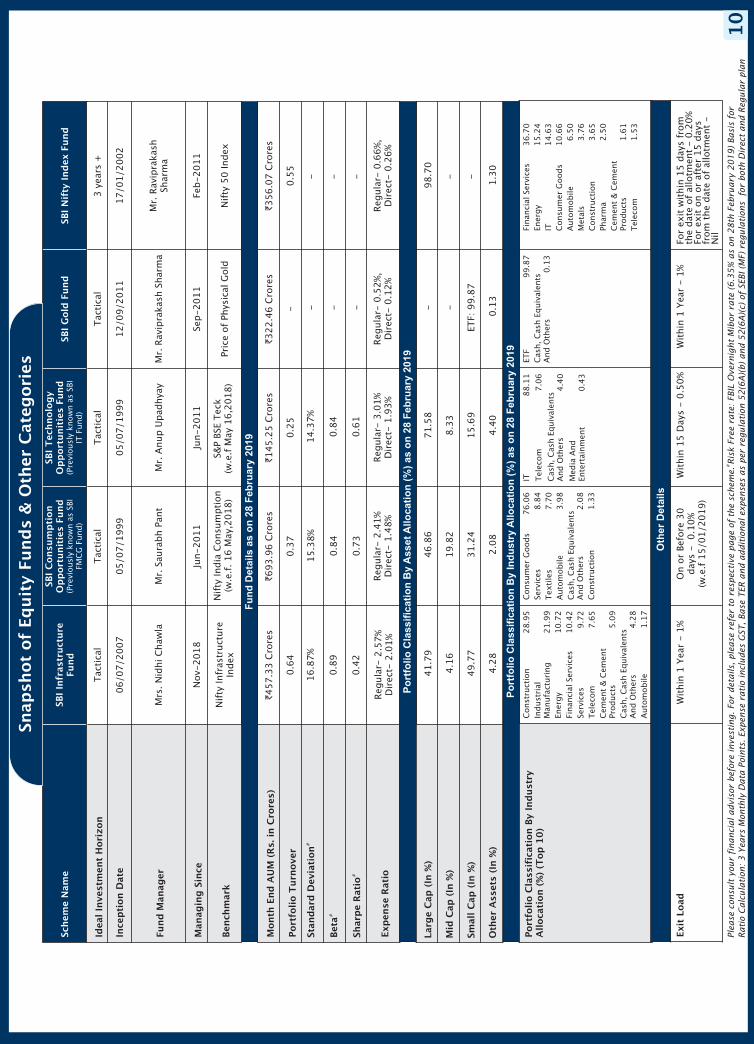
Ple
ase
consu
lt y
our
financia
l advis
or
befo
re invest
ing. For
deta
ils,
ple
ase
refe
r to
resp
ecti
ve p
age o
f th
e s
chem
e.
#Ris
k F
ree r
ate
: FBIL
Overn
ight
Mib
or
rate
()
Basi
s fo
r Rati
o C
alc
ula
tion: 3 Y
ears
Month
ly D
ata
Poin
ts.
Expense
rati
o inclu
des
GST, Base
TER a
nd a
ddit
ional expense
s as
per
regula
tion 5
2(6
A)(
b)
and 5
2(6
A)(
c)
of
SEBI (M
F)
regula
tions
for
both
Dir
ect
and R
egula
r pla
n
6.3
5%
as
on 2
8th
Febru
ary
2019
SBI
Larg
e &
Mid
cap
Fund
(Pre
viousl
y kn
ow
n a
s SB
IM
agnum
Mult
iplie
r Fu
nd)
SBI
Magnum
Eq
uit
yESG
Fund
(Pre
viousl
y kn
ow
n a
s SB
IM
agnum
Equit
y Fu
nd)
Mr.
Din
esh B
alac
han
dra
n(w
.e.f
May
5,2
018)
Mr.
Anup U
pad
hya
y(w
.e.f
May
5,2
018)
Nif
ty M
NC
(w.e
.f M
ay 1
6,2
018)
Nif
ty L
arge
Mid
Cap
250
(w.e
.f F
ebru
ary
25,2
019)
S&P
BSE
500
(w.e
.f M
ay 1
6,2
018)
Nif
ty M
idca
p 1
50
(w.e
.f M
ay 1
6,2
018)
Nif
ty 1
00 E
SG Index
(w.e
.f M
ay 1
6,2
018)
05
08
Po
rtfo
lio
Cla
ssif
icati
on
By In
du
str
yA
llo
cati
on
(%
) as o
n 2
8 F
eb
ruary
2019
Port
folio C
lass
ific
ati
on B
y In
dust
ryA
lloca
tion (
%)
(Top
10)
Finan
cial
Ser
vice
s3
1.0
4C
onsu
mer
Goods
24
.55
Cas
h, C
ash E
quiv
alen
tsA
nd O
ther
s9
.27
Indust
rial
Man
ufa
cturi
ng
7.3
5Se
rvic
es6.7
3C
hem
ical
s5
.46
Phar
ma
5.0
8IT
3.3
5T
elec
om
3.1
1A
uto
mobile
2.1
0
Consu
mer
Goods
22.8
5Fi
nan
cial
Ser
vice
s15.1
9In
dust
rial
Man
ufa
cturi
ng
12.9
4C
ash, C
ash E
quiv
alen
tsA
nd O
ther
s8.8
8Se
rvic
es6.6
7Tex
tile
s5.9
5C
hem
ical
s4.9
3C
emen
t &
Cem
ent
Product
s4.8
7C
onst
ruct
ion
3.7
9A
uto
mobile
3.1
3
Finan
cial
Ser
vice
s26.3
7C
onsu
mer
Goods
11.9
8Ph
arm
a8.9
0C
ash, C
ash E
quiv
alen
tsA
nd O
ther
s8.3
5IT
8.3
0En
ergy
6.8
9C
emen
t &
Cem
ent
Product
s5.8
9In
dust
rial
Man
ufa
cturi
ng
5.2
4C
onst
ruct
ion
4.1
8A
uto
mobile
4.0
4
Phar
ma
92.1
9
Cas
h, C
ash E
quiv
alen
tsA
nd O
ther
s4.6
6
Hea
lthca
re S
ervi
ces
3.1
5
Finan
cial
Ser
vice
s93.8
1C
ash, C
ash E
quiv
alen
tsA
nd O
ther
s6.1
9
Ener
gy
40.0
2
Finan
cial
Ser
vice
s24.3
6
Indust
rial
Man
ufa
cturi
ng
13.3
2
Cas
h, C
ash E
quiv
alen
tsA
nd O
ther
s11.4
8
Const
ruct
ion
4.4
2
Met
als
4.2
5
Serv
ices
2.1
5
Ener
gy
35.4
1
Met
als
15
.94
Cem
ent
& C
emen
tPr
oduct
s15.2
9
Chem
ical
s13.4
3
Fert
ilise
rs &
Pes
tici
des
8.5
2
Cas
h, C
ash E
quiv
alen
tsA
nd O
ther
s8.2
7
Tex
tile
s3.1
4
Fu
nd
Deta
ils a
s o
n 2
8 F
eb
ruary
2019
Month
End
AU
M (
Rs.
in C
rore
s)`3,5
86.3
4 C
rore
s`1,6
16.0
7 C
rore
s`6,5
39.3
8 C
rore
s`1,0
00.9
5 C
rore
s`632.2
4 C
rore
s`149.9
0 C
rore
s`245.4
1 C
rore
s
Port
folio T
urn
over
0.8
00.7
00.5
40.5
22.0
30.3
30.5
2
Exp
ense
Rati
oReg
ula
r- 2
.24%
Dir
ect-
1.3
0%
Reg
ula
r- 2
.39%
Dir
ect-
1.1
9%
Reg
ula
r- 2
.05%
,D
irec
t- 1
.55%
Reg
ula
r- 2
.24%
,D
irec
t- 1
.24%
Reg
ula
r- 2
.47%
Dir
ect-
1.6
5%
Reg
ula
r- 2
.81%
,D
irec
t- 2
.26%
Reg
ula
r- 2
.66%
,D
irec
t- 2
.02%
Stand
ard
Dev
iati
on
Bet
a
#
#
#Sh
arp
e R
ati
o
14.0
1%
0.8
4
0.7
0
18.9
9%
0.8
7
0.6
4
13.6
3%
0.9
4
0.4
6
15.7
9%
0.8
5
-0.6
0
17.9
9%
1.0
0
1.0
4
16.8
9%
0.8
4
0.1
2
15.8
1%
0.8
2
0.6
8
Schem
e N
am
e
SBI
Focu
sed
Eq
uit
yFu
nd
(Pre
viousl
y kn
ow
n a
sSB
I Em
ergin
g B
usi
nes
ses
Fund)
SBI
Small C
ap
Fund
(Pre
viousl
y kn
ow
n a
s SB
ISm
all &
Mid
cap F
und)
SBI
Magnum
Taxgain
Sch
eme
SBI
Hea
lthca
reO
pp
ort
unit
ies
Fund
(Pre
viousl
y kn
ow
n a
s SB
IPh
arm
aFu
nd)
SBI
Bankin
g &
Financi
al Se
rvic
esFu
nd
SBI
PSU
Fund
SBI
Magnum
CO
MM
A F
und
Idea
l In
ves
tmen
t H
ori
zon
5ye
ars
+5
year
s+
3ye
ars
+T
acti
cal
Tac
tica
lT
acti
cal
Tac
tica
l
Ince
pti
on D
ate
17
/09
/20
04
09
/09
/20
09
31
/03
/19
93
05
/07
/19
99
26
/02
/20
15
07
/07
/20
10
08
/08
/20
05
Fund
Manager
Mr.
R. Sr
iniv
asan
Mr.
R. Sr
iniv
asan
Mr.
Din
esh
Bala
chan
dra
nM
r. T
anm
aya
Des
aiM
s. S
ohin
i A
ndan
iM
r. R
ichar
d D
'souza
Mr.
Ric
har
d D
'souza
Managin
g S
ince
May
-20
09
Nov
- 2013
Sep-2
016
Jun-2
011
Feb-2
015
Aug-2
014
Aug-2
014
Ben
chm
ark
S&P
BSE
500 Index
S&P
BSE
Smal
l C
ap Index
S&P
BSE
HEA
LTH
CA
RE
Index
S&P
BSE
PSU
IN
DEX
Nif
ty C
om
modit
ies
Index
Po
rtfo
lio
Cla
ssif
icati
on
By
Asset
Allo
cati
on
(%
) as o
n 2
8 F
eb
ruary
2019
Larg
e C
ap
(%
)
Mid
Cap
(%
)
Small C
ap
(%
)
Oth
er A
sset
s (%
)
50.1
7
16.6
9
23.8
7
9.2
7
9.4
2
16.1
5
65.5
5
8.8
8
67.0
3
12.6
7
11.9
5
8.3
5
55.7
4
18.6
7
20.9
4
4.6
6
58.3
6
26.3
7
9.0
8
6.1
9
51.0
7
26.2
0
11.2
6
11.4
8
51.3
6
14.4
4
25.9
2
8.2
7
Oth
er
Deta
ils
Exit
Load
Wit
hin
1 Y
ear
- 1
%W
ithin
1 Y
ear
- 1%
NIL
Wit
hin
15 D
ays
- 0.5
0%
Wit
hin
1 Y
ear
- 1%
Wit
hin
1 Y
ear
- 1%
Wit
hin
1 Y
ear
- 1%
Snap
shot
of
Eq
uit
y Fu
nd
s &
Oth
er
Cate
gori
es
Ple
ase
consu
lt y
our
financia
l advis
or
befo
re invest
ing. For
deta
ils,
ple
ase
refe
r to
resp
ecti
ve p
age o
f th
e s
chem
e.
#Ris
k F
ree r
ate
: FBIL
Overn
ight
Mib
or
rate
(6.3
5%
as
on 2
8 F
ebru
ary
2019)
Basi
s fo
r Rati
oC
alc
ula
tion: 3 Y
ears
Month
ly D
ata
Poin
ts. Expense
rati
o inclu
des
GST, Base
TER a
nd a
ddit
ional expense
s as
per
regula
tion 5
2(6
A)(
b)
and 5
2(6
A)(
c)
of
SEBI (M
F)
regula
tions
for
both
Dir
ect
and R
egula
r pla
n
Nif
ty F
inan
cial
Ser
vice
s(w
.e.f
May
16,2
018)
S&P
BSE
500
(w.e
.f M
ay 1
6,2
018)
09
Ple
ase
consu
lt y
our
financia
l advis
or
befo
re invest
ing. For
deta
ils,
ple
ase
refe
r to
resp
ecti
ve p
age o
f th
e s
chem
e.#
Ris
k F
ree r
ate
: FBIL
Overn
ight
Mib
or
rate
(6.3
5%
as
on 2
8th
Febru
ary
2019)
Basi
s fo
r
Rati
o C
alc
ula
tion:
3 Y
ears
Month
ly D
ata
Poin
ts. Expense
rati
o inclu
des
GST, Base
TER
and a
ddit
ional expense
s as
per
regula
tion 5
2(6
A)(
b)
and 5
2(6
A)(
c)
of
SEBI (M
F)
regula
tions
for
both
Dir
ect
and R
egula
r pla
n
Po
rtfo
lio
Cla
ssif
icati
on
By In
du
str
yA
llo
cati
on
(%
)as o
n 2
8 F
eb
ruary
2019
Port
folio C
lass
ific
ati
on B
y In
dust
ryA
lloca
tion (
%)
(Top
10)
Const
ruct
ion
28.9
5In
dust
rial
Man
ufa
cturi
ng
21.9
9En
ergy
10.7
2Fi
nan
cial
Ser
vice
s10.4
2Se
rvic
es9.7
2Tel
ecom
7.6
5C
emen
t &
Cem
ent
Product
s5.0
9C
ash, C
ash E
quiv
alen
tsA
nd O
ther
s4.2
8A
uto
mobile
1.1
7
Consu
mer
Goods
76.0
6Se
rvic
es8.8
4Tex
tile
s7.7
0A
uto
mobile
3.9
8C
ash, C
ash E
quiv
alen
tsA
nd O
ther
s2.0
8C
onst
ruct
ion
1.3
3
IT88.1
1
Tel
ecom
7.0
6
Cas
h, C
ash E
quiv
alen
tsA
nd O
ther
s4.4
0
Med
iaA
nd
Ente
rtai
nm
ent
0.4
3
ETF
99.8
7C
ash, C
ash E
quiv
alen
tsA
nd O
ther
s0.1
3
Finan
cial
Ser
vice
s36.7
0En
ergy
15.2
4IT
14.6
3C
onsu
mer
Goods
10.6
6A
uto
mobile
6.5
0M
etal
s3
.76
Const
ruct
ion
3.6
5Ph
arm
a2.5
0C
emen
t &
Cem
ent
Product
s1.6
1Tel
ecom
1.5
3
Fu
nd
Deta
ils
as o
n 2
8 F
eb
ruary
2019
Month
End
AU
M (
Rs.
in C
rore
s)`457.3
3 C
rore
s`693.9
6 C
rore
s`145.2
5 C
rore
s`322.4
6 C
rore
s`356.0
7 C
rore
s
Port
folio T
urn
over
0.6
40.3
70.2
5-
0.5
5
Exp
ense
Rati
oReg
ula
r- 2
.57%
Dir
ect-
2.0
1%
Reg
ula
r- 2
.41%
Dir
ect-
1.4
8%
Reg
ula
r- 3
.01%
Dir
ect-
1.9
3%
Reg
ula
r- 0
.52%
,D
irec
t- 0
.12%
Reg
ula
r- 0
.66%
,D
irec
t- 0
.26%
Stand
ard
Dev
iati
on
Bet
a
#
#
#Sh
arp
e R
ati
o
16.8
7%
0.8
9
0.4
2
15.3
8%
0.8
4
0.7
3
14.3
7%
0.8
4
0.6
1
- - -
- - -
Schem
e N
am
eSB
I In
frast
ruct
ure
Fund
SBI
Gold
Fund
SBI
Nif
ty I
nd
ex F
und
Idea
l In
ves
tmen
t H
ori
zon
Tac
tica
lT
acti
cal
Tac
tica
lT
acti
cal
3ye
ars
+
Ince
pti
on D
ate
06
/07
/20
07
05
/07
/19
99
05
/07
/19
99
12
/09
/20
11
17
/01
/20
02
Fund
Manager
Mrs
. N
idhi C
haw
laM
r. S
aura
bh P
ant
Mr.
Anup U
pad
hya
yM
r. R
avip
raka
sh S
har
ma
Mr.
Rav
ipra
kash
Shar
ma
Managin
g S
ince
Nov-
2018
Jun-2
011
Jun-2
011
Sep-2
011
Feb-2
011
Ben
chm
ark
Nif
ty Infr
astr
uct
ure
Index
Pric
e of
Phys
ical
Gold
Nif
ty 5
0 Index
Po
rtfo
lio
Cla
ssif
icati
on
By
Asset
Allo
cati
on
(%
) as o
n 2
8 F
eb
ruary
2019
Larg
e C
ap
(In
%)
Mid
Cap
(In
%)
Small C
ap
(In
%)
Oth
er A
sset
s (I
n %
)
41.7
9
4.1
6
49.7
7
4.2
8
46.8
6
19.8
2
31.2
4
2.0
8
71.5
8
8.3
3
15.6
9
4.4
0
- -
0.1
3
ETF:
99.8
7
98.7
0
- -
1.3
0
Oth
er
Deta
ils
Exit
Load
Wit
hin
1 Y
ear
- 1
%O
n o
r Be
fore
30
day
s -
0.1
0%
(w.e
.f 1
5/0
1/2
01
9)
Wit
hin
15 D
ays
- 0.5
0%
Wit
hin
1 Y
ear
- 1%
For
exit
wit
hin
15 d
ays
from
the
dat
e of
allo
tmen
t -
0.2
0%
For
exit
on o
r af
ter
15 d
ays
from
the
da t
e of
allo
tmen
t -
Nil
Snap
shot
of
Eq
uit
y Fu
nd
s &
Oth
er C
ate
gori
esSB
I C
onsu
mp
tion
Op
port
unit
ies
Fund
(Pre
viousl
y kn
ow
n a
s SB
IFM
CG
Fund)
SBI
Tec
hnolo
gy
Op
port
unit
ies
Fund
(Pre
viousl
y kn
ow
n a
s SB
IIT
Fund)
Nif
ty India
Consu
mpti
on
(w.e
.f. 16 M
ay,2
018)
S&P
BSE
Tec
k(w
.e.f
May
16,2
018)
10
11
EQUITY-LARGE CAP
Option NAV ( )`
Reg-Plan-Dividend 20.6241
Reg-Plan-Growth 36.2535
Dir-Plan-Dividend 24.8937
Dir-Plan-Growth 38.3432
NET ASSET VALUE
Record Date Dividend NAV ( )`(in /Unit)`
23-Sep-16 (Reg Plan) 1.00 18.5964
23-Sep-16 (Dir Plan) 1.20 21.8569
17-Jul-15 (Reg Plan) 2.50 17.6880
17-Jul-15 (Dir Plan) 2.90 20.5395
21- Mar-14 (Reg Plan) 1.80 12.7618
LAST DIVIDENDS
Investors understand that their principal
will be at Moderately High risk
�
�
Long term capital appreciation.Investment in equity and equity-related instruments of large cap companies.
Pursuant to the circular issued by SEBI on ‘Categorization and Rationalization of the Schemes, there has been change in the fundamental attribute(s) of the schemewith effective from May 16, 2018.
SBI Blue Chip FundThis product is suitable for investors who are seeking^:
Face value: 10`
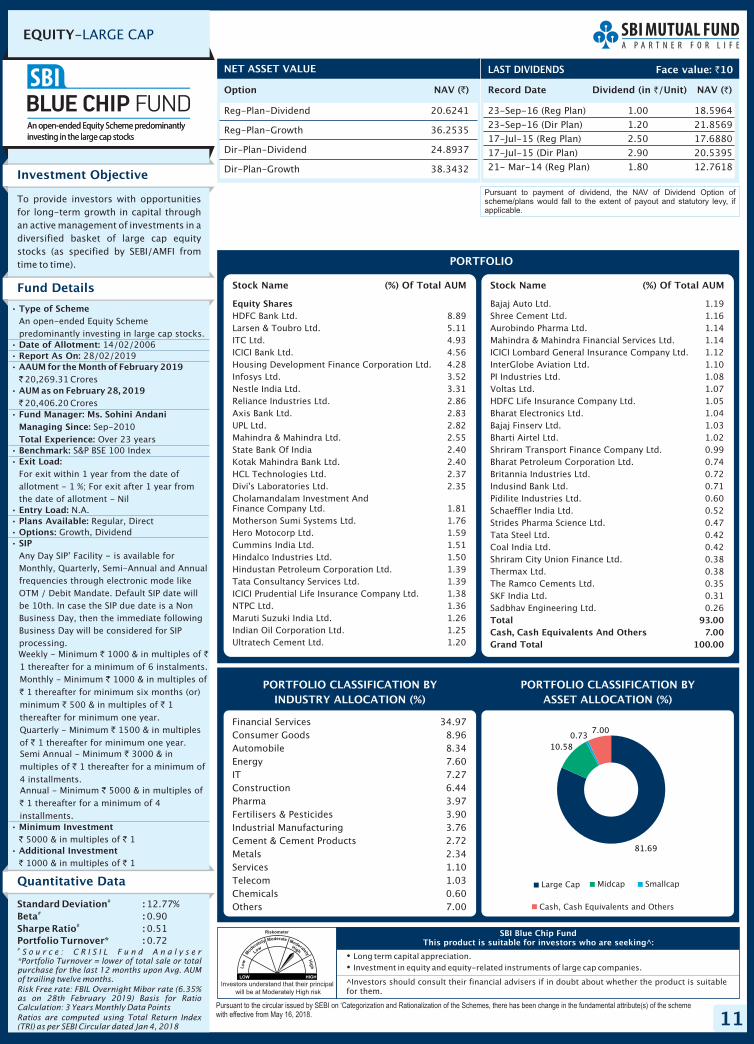
Investment Objective
Quantitative Data
To provide investors with opportunitiesfor long-term growth in capital throughan active management of investments in adiversified basket of large cap equitystocks (as specified by SEBI/AMFI fromtime to time).
Fund Details
Standard Deviation :Beta :Sharpe Ratio :Portfolio Turnover* :
#
#
#
12.77%0.900.510.72
#S o u r c e : C R I S I L F u n d A n a l y s e r
*Portfolio Turnover = lower of total sale or totalpurchase for the last 12 months upon Avg. AUMof trailing twelve months.
Risk Free rate: FBIL Overnight Mibor rate (6.35%as on 28th February 2019) Basis for RatioCalculation: 3 Years Monthly Data Points
Ratios are computed using Total Return Index(TRI) as per SEBI Circular dated Jan 4, 2018
PORTFOLIO CLASSIFICATION BY(%)ASSET ALLOCATION
Financial Services 34.97Consumer Goods 8.96Automobile 8.34Energy 7.60IT 7.27Construction 6.44Pharma 3.97Fertilisers & Pesticides 3.90Industrial Manufacturing 3.76Cement & Cement Products 2.72Metals 2.34Services 1.10Telecom 1.03Chemicals 0.60Others 7.00
•
•
•
•
•
•
•
•
•
•
•
•
•
•
Type of Scheme
Date of Allotment:Report As On:AAUM for the Month of February 2019
AUM as on February 28, 2019
Fund Manager: Ms. Sohini AndaniManaging Since:Total Experience:Benchmark:Exit Load:
Entry Load:Plans Available:Options:SIP
-
Minimum Investment
Additional Investment
An open-ended Equity Schemepredominantly investing in large cap stocks.
14/02/2006
20,269.31 Crores
20,406.20 Crores
Sep-2010Over 23 years
S&P BSE 100 Index
For exit within 1 year from the date ofallotment - 1 %; For exit after 1 year fromthe date of allotment - Nil
N.A.Regular, Direct
Growth, Dividend
Any Day SIP’ Facility is available forMonthly, Quarterly, Semi-Annual and Annualfrequencies through electronic mode likeOTM / Debit Mandate. Default SIP date willbe 10th. In case the SIP due date is a NonBusiness Day, then the immediate followingBusiness Day will be considered for SIPprocessing.Weekly - Minimum 1000 & in multiples of1 thereafter for a minimum of 6 instalments.Monthly - Minimum 1000 & in multiples of
1 thereafter for minimum six months (or)minimum 500 & in multiples of 1thereafter for minimum one year.Quarterly - Minimum 1500 & in multiplesof 1 thereafter for minimum one year.Semi Annual - Minimum 3000 & inmultiples of 1 thereafter for a minimum of4 installments.Annual - Minimum 5000 & in multiples of
1 thereafter for a minimum of 4installments.
5000 & in multiples of 1
1000 & in multiples of 1
28/02/2019
`
`
` `
`
`
` `
`
`
`
`
`
`
` `
` `
PORTFOLIO CLASSIFICATION BYINDUSTRY ALLOCATION (%)
PORTFOLIO
Equity SharesHDFC Bank Ltd. 8.89Larsen & Toubro Ltd. 5.11ITC Ltd. 4.93ICICI Bank Ltd. 4.56Housing Development Finance Corporation Ltd. 4.28Infosys Ltd. 3.52Nestle India Ltd. 3.31Reliance Industries Ltd. 2.86Axis Bank Ltd. 2.83UPL Ltd. 2.82Mahindra & Mahindra Ltd. 2.55State Bank Of India 2.40Kotak Mahindra Bank Ltd. 2.40HCL Technologies Ltd. 2.37Divi's Laboratories Ltd. 2.35Cholamandalam Investment AndFinance Company Ltd. 1.81Motherson Sumi Systems Ltd. 1.76Hero Motocorp Ltd. 1.59Cummins India Ltd. 1.51Hindalco Industries Ltd. 1.50Hindustan Petroleum Corporation Ltd. 1.39Tata Consultancy Services Ltd. 1.39ICICI Prudential Life Insurance Company Ltd. 1.38NTPC Ltd. 1.36Maruti Suzuki India Ltd. 1.26Indian Oil Corporation Ltd. 1.25Ultratech Cement Ltd. 1.20
Stock Name (%) Of Total AUM Stock Name (%) Of Total AUM
Bajaj Auto Ltd. 1.19Shree Cement Ltd. 1.16Aurobindo Pharma Ltd. 1.14Mahindra & Mahindra Financial Services Ltd. 1.14ICICI Lombard General Insurance Company Ltd. 1.12InterGlobe Aviation Ltd. 1.10PI Industries Ltd. 1.08Voltas Ltd. 1.07HDFC Life Insurance Company Ltd. 1.05Bharat Electronics Ltd. 1.04Bajaj Finserv Ltd. 1.03Bharti Airtel Ltd. 1.02Shriram Transport Finance Company Ltd. 0.99Bharat Petroleum Corporation Ltd. 0.74Britannia Industries Ltd. 0.72Indusind Bank Ltd. 0.71Pidilite Industries Ltd. 0.60Schaeffler India Ltd. 0.52Strides Pharma Science Ltd. 0.47Tata Steel Ltd. 0.42Coal India Ltd. 0.42Shriram City Union Finance Ltd. 0.38Thermax Ltd. 0.38The Ramco Cements Ltd. 0.35SKF India Ltd. 0.31Sadbhav Engineering Ltd. 0.26Total 93.00Cash, Cash Equivalents And Others 7.00Grand Total 100.00
Pursuant to payment of dividend, the NAV of Dividend Option ofscheme/plans would fall to the extent of payout and statutory levy, ifapplicable.
^Investors should consult their financial advisers if in doubt about whether the product is suitablefor them.
Cash, Cash Equivalents and Others
Large Cap Midcap Smallcap
81.69
10.580.73
7.00
12
EQUITY- THEMATICFUND
Option NAV ( )`
Reg-Plan-Dividend 30.4206
Reg-Plan-Growth 97.2722
Dir-Plan-Dividend 36.6094
Dir-Plan-Growth 101.9864
NET ASSET VALUE
Record Date Dividend NAV ( )`(in /Unit)`
16-Mar-18 (Reg Plan) 3.40 29.0857
16-Mar-18 (Dir Plan) 4.00 34.6356
30-May-17 (Reg Plan) 2.00 30.8936
(Dir Plan) 2.50 36.502730-May-17
29-Apr-16 (Reg Plan) 4.50 27.4893
29-Apr-16 (Dir Plan) 5.00 32.3240
24-Apr-15 (Reg Plan) 6.00 31.7479
24-Apr-15 (Dir Plan) 7.00 36.7592
LAST DIVIDENDS
Investors understand that their principal
will be at High risk
�
�
Long term capital appreciation.Investments in companies following the ESG theme.
SBI Magnum Equity ESG FundThis product is suitable for investors who are seeking^:
Face value: 10`
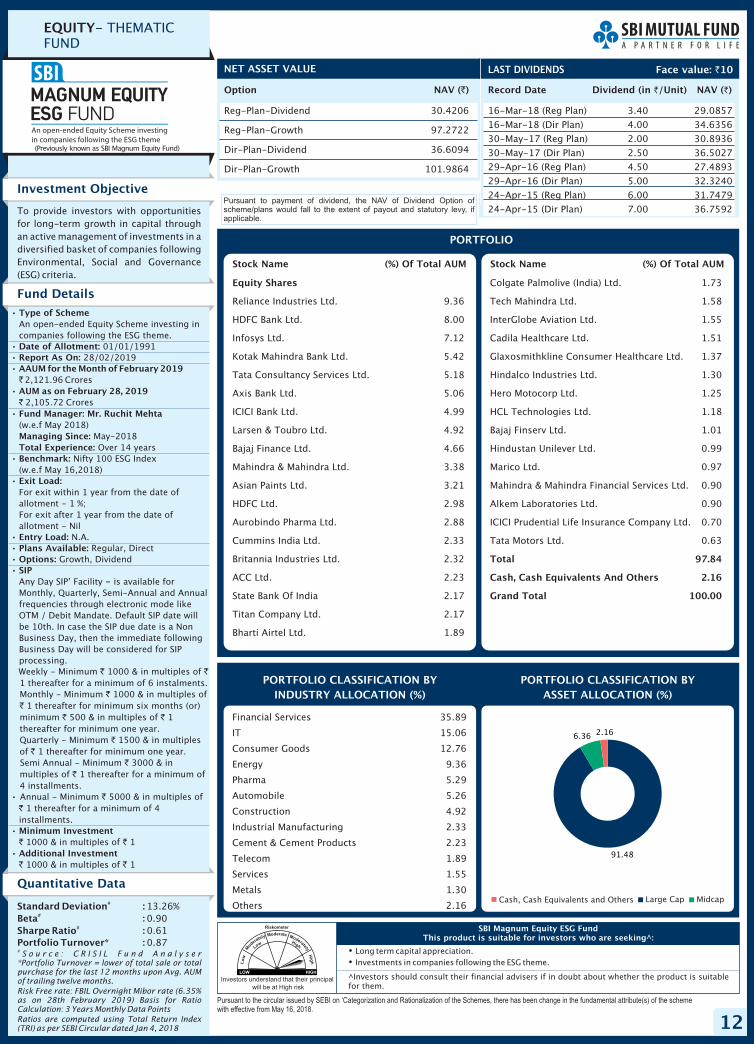
Investment Objective
Quantitative Data
To provide investors with opportunitiesfor long-term growth in capital throughan active management of investments in adiversified basket of companies followingEnvironmental, Social and Governance(ESG) criteria.
Fund Details
Standard Deviation :Beta :Sharpe Ratio :Portfolio Turnover* :
#
#
#
13.26%0.900.610.87
#S o u r c e : C R I S I L F u n d A n a l y s e r
*Portfolio Turnover = lower of total sale or totalpurchase for the last 12 months upon Avg. AUMof trailing twelve months.
Risk Free rate: FBIL Overnight Mibor rate (6.35%as on 28th February 2019) Basis for RatioCalculation: 3 Years Monthly Data Points
Ratios are computed using Total Return Index(TRI) as per SEBI Circular dated Jan 4, 2018
PORTFOLIO CLASSIFICATION BY(%)ASSET ALLOCATION
Financial Services 35.89
IT 15.06
Consumer Goods 12.76
Energy 9.36
Pharma 5.29
Automobile 5.26
Construction 4.92
Industrial Manufacturing 2.33
Cement & Cement Products 2.23
Telecom 1.89
Services 1.55
Metals 1.30
Others 2.16
Pursuant to payment of dividend, the NAV of Dividend Option ofscheme/plans would fall to the extent of payout and statutory levy, ifapplicable.
•
•
•
•
•
•
•
•
•
•
•
•
•
•
•
Type of Scheme
Date of Allotment:Report As On:AAUM for the February 2019
AUM as on February 28, 2019
Fund Manager: Mr. Ruchit Mehta
Managing Since:Total Experience:Benchmark:
Exit Load:
Entry Load:Plans Available:Options:SIP
-
Minimum Investment
Additional Investment
An open-ended Equity Scheme investing incompanies following the ESG theme.
01/01/199128/02/2019
2,121.96 Crores
2,105.72 Crores
(w.e.f May 2018)May-2018Over 14 years
Nifty 100 ESG Index(w.e.f May 16,2018)
For exit within 1 year from the date ofallotment - 1 %;For exit after 1 year from the date ofallotment - Nil
N.A.Regular, Direct
Growth, Dividend
Any Day SIP’ Facility is available forMonthly, Quarterly, Semi-Annual and Annualfrequencies through electronic mode likeOTM / Debit Mandate. Default SIP date willbe 10th. In case the SIP due date is a NonBusiness Day, then the immediate followingBusiness Day will be considered for SIPprocessing.Weekly - Minimum 1000 & in multiples of1 thereafter for a minimum of 6 instalments.Monthly - Minimum 1000 & in multiples of
1 thereafter for minimum six months (or)minimum 500 & in multiples of 1thereafter for minimum one year.Quarterly - Minimum 1500 & in multiplesof 1 thereafter for minimum one year.Semi Annual - Minimum 3000 & inmultiples of 1 thereafter for a minimum of4 installments.Annual - Minimum 5000 & in multiples of
1 thereafter for a minimum of 4installments.
1000 & in multiples of 1
1000 & in multiples of 1
Month of`
`
` `
`
`
` `
`
`
`
`
`
`
` `
` `
PORTFOLIO CLASSIFICATION BYINDUSTRY ALLOCATION (%)
PORTFOLIO
Equity Shares
Reliance Industries Ltd. 9.36
HDFC Bank Ltd. 8.00
Infosys Ltd. 7.12
Kotak Mahindra Bank Ltd. 5.42
Tata Consultancy Services Ltd. 5.18
Axis Bank Ltd. 5.06
ICICI Bank Ltd. 4.99
Larsen & Toubro Ltd. 4.92
Bajaj Finance Ltd. 4.66
Mahindra & Mahindra Ltd. 3.38
Asian Paints Ltd. 3.21
HDFC Ltd. 2.98
Aurobindo Pharma Ltd. 2.88
Cummins India Ltd. 2.33
Britannia Industries Ltd. 2.32
ACC Ltd. 2.23
State Bank Of India 2.17
Titan Company Ltd. 2.17
Bharti Airtel Ltd. 1.89
Stock Name (%) Of Total AUM Stock Name (%) Of Total AUM
Colgate Palmolive (India) Ltd. 1.73
Tech Mahindra Ltd. 1.58
InterGlobe Aviation Ltd. 1.55
Cadila Healthcare Ltd. 1.51
Glaxosmithkline Consumer Healthcare Ltd. 1.37
Hindalco Industries Ltd. 1.30
Hero Motocorp Ltd. 1.25
HCL Technologies Ltd. 1.18
Bajaj Finserv Ltd. 1.01
Hindustan Unilever Ltd. 0.99
Marico Ltd. 0.97
Mahindra & Mahindra Financial Services Ltd. 0.90
Alkem Laboratories Ltd. 0.90
ICICI Prudential Life Insurance Company Ltd. 0.70
Tata Motors Ltd. 0.63
Total 97.84
Cash, Cash Equivalents And Others 2.16
Grand Total 100.00
^Investors should consult their financial advisers if in doubt about whether the product is suitablefor them.
(Previously known as SBI Magnum Equity Fund)
Pursuant to the circular issued by SEBI on ‘Categorization and Rationalization of the Schemes, there has been change in the fundamental attribute(s) of the schemewith effective from May 16, 2018.
MidcapCash, Cash Equivalents and Others Large Cap
91.48
6.36 2.16
13
EQUITY-MULTI CAP FUND
Option NAV ( )`
Reg-Plan-Dividend 20.1519
Reg-Plan-Growth 45.0127
Dir-Plan-Dividend 23.7315
Dir-Plan-Growth 47.4803
NET ASSET VALUE
Record Date Dividend NAV ( )`(in /Unit)`
09-Mar-18 (Reg Plan) 1.90 20.5230
09-Mar-18 (Dir Plan) 2.20 23.9106
29-Dec-17 ( Plan) 2.90 27.6830
29-Dec-17 (Reg Plan) 2.50 23.8257
Dir
30-Dec-16 (Reg Plan) 1.90 19.2173
30-Dec-16 (Dir Plan) 2.20 22.0670
20-Nov-15 (Reg Plan) 2.90 19.2712
20-Nov-15 (Dir Plan) 3.20 21.8941
LAST DIVIDENDS
Investors understand that their principal
will be at Moderately High risk
�
�
Long term capital appreciation.Investments in a diversified basket of equity stocks spanning the entire market capitalizationspectrum to provide both long-term growth opportunities and liquidity
Pursuant to the circular issued by SEBI on ‘Categorization and Rationalization of the Schemes, there has been change in the fundamental attribute(s) of the scheme witheffective from May 16, 2018.
SBI Magnum Multicap FundThis product is suitable for investors who are seeking^:
Face value: 10`
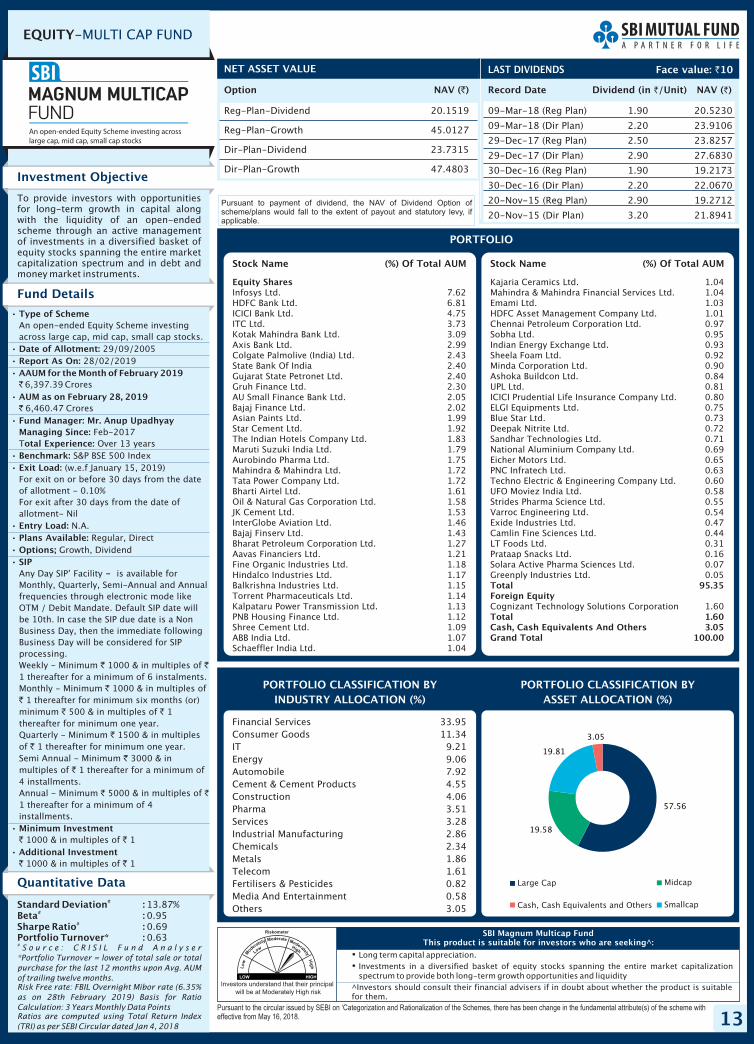
Investment Objective
Quantitative Data
To provide investors with opportunitiesfor long-term growth in capital alongwith the liquidity of an open-endedscheme through an active managementof investments in a diversified basket ofequity stocks spanning the entire marketcapitalization spectrum and in debt andmoney market instruments.
Fund Details
Standard Deviation :Beta :Sharpe Ratio :Portfolio Turnover* :
#
#
#
13.87%0.950.690.63
#S o u r c e : C R I S I L F u n d A n a l y s e r
*Portfolio Turnover = lower of total sale or total
purchase for the last 12 months upon Avg. AUM
of trailing twelve months.Risk Free rate: FBIL Overnight Mibor rate
Basis for Ratio
Calculation: 3 Years Monthly Data PointsRatios are computed using Total Return Index
(TRI) as per SEBI Circular dated Jan 4, 2018
(6.35%
as on 28th February 2019)
PORTFOLIO CLASSIFICATION BY(%)ASSET ALLOCATION
Financial Services 33.95Consumer Goods 11.34IT 9.21Energy 9.06Automobile 7.92Cement & Cement Products 4.55Construction 4.06Pharma 3.51Services 3.28Industrial Manufacturing 2.86Chemicals 2.34Metals 1.86Telecom 1.61Fertilisers & Pesticides 0.82Media And Entertainment 0.58Others 3.05
Pursuant to payment of dividend, the NAV of Dividend Option ofscheme/plans would fall to the extent of payout and statutory levy, ifapplicable.
•
•
•
•
•
•
•
•
•
•
•
•
•
•
Type of Scheme
Date of Allotment:Report As On:AAUM for the February 2019
AUM as on February 28, 2019
Fund Manager: Mr. Anup UpadhyayManaging Since:otal Experience:
Benchmark:Exit Load:
Entry Load:Plans Available:Options;SIP
-
Minimum Investment
Additional Investment
An open-ended Equity Scheme investingacross large cap, mid cap, small cap stocks.
29/09/200528/02/2019
6,397.39 Crores
6,460.47 Crores
Feb-2017T Over 13 years
S&P BSE 500 Index(w.e.f January 15, 2019)
For exit on or before 30 days from the dateof allotment - 0.10%For exit after 30 days from the date ofallotment- Nil
N.A.Regular, Direct
Growth, Dividend
Any Day SIP’ Facility is available forMonthly, Quarterly, Semi-Annual and Annualfrequencies through electronic mode likeOTM / Debit Mandate. Default SIP date willbe 10th. In case the SIP due date is a NonBusiness Day, then the immediate followingBusiness Day will be considered for SIPprocessing.Weekly - Minimum 1000 & in multiples of1 thereafter for a minimum of 6 instalments.Monthly - Minimum 1000 & in multiples of
1 thereafter for minimum six months (or)minimum 500 & in multiples of 1thereafter for minimum one year.Quarterly - Minimum 1500 & in multiplesof 1 thereafter for minimum one year.Semi Annual - Minimum 3000 & inmultiples of 1 thereafter for a minimum of4 installments.Annual - Minimum 5000 & in multiples of1 thereafter for a minimum of 4installments.
1000 & in multiples of 1
1000 & in multiples of 1
Month of`
`
` `
`
`
` `
`
`
`
`
` `
` `
` `
PORTFOLIO CLASSIFICATION BYINDUSTRY ALLOCATION (%)
PORTFOLIO
Equity SharesInfosys Ltd. 7.62HDFC Bank Ltd. 6.81ICICI Bank Ltd. 4.75ITC Ltd. 3.73Kotak Mahindra Bank Ltd. 3.09Axis Bank Ltd. 2.99Colgate Palmolive (India) Ltd. 2.43State Bank Of India 2.40Gujarat State Petronet Ltd. 2.40Gruh Finance Ltd. 2.30AU Small Finance Bank Ltd. 2.05Bajaj Finance Ltd. 2.02Asian Paints Ltd. 1.99Star Cement Ltd. 1.92The Indian Hotels Company Ltd. 1.83Maruti Suzuki India Ltd. 1.79Aurobindo Pharma Ltd. 1.75Mahindra & Mahindra Ltd. 1.72Tata Power Company Ltd. 1.72Bharti Airtel Ltd. 1.61Oil & Natural Gas Corporation Ltd. 1.58JK Cement Ltd. 1.53InterGlobe Aviation Ltd. 1.46Bajaj Finserv Ltd. 1.43Bharat Petroleum Corporation Ltd. 1.27Aavas Financiers Ltd. 1.21Fine Organic Industries Ltd. 1.18Hindalco Industries Ltd. 1.17Balkrishna Industries Ltd. 1.15Torrent Pharmaceuticals Ltd. 1.14Kalpataru Power Transmission Ltd. 1.13PNB Housing Finance Ltd. 1.12Shree Cement Ltd. 1.09ABB India Ltd. 1.07Schaeffler India Ltd. 1.04
Stock Name (%) Of Total AUM Stock Name (%) Of Total AUM
Kajaria Ceramics Ltd. 1.04Mahindra & Mahindra Financial Services Ltd. 1.04Emami Ltd. 1.03HDFC Asset Management Company Ltd. 1.01Chennai Petroleum Corporation Ltd. 0.97Sobha Ltd. 0.95Indian Energy Exchange Ltd. 0.93Sheela Foam Ltd. 0.92Minda Corporation Ltd. 0.90Ashoka Buildcon Ltd. 0.84UPL Ltd. 0.81ICICI Prudential Life Insurance Company Ltd. 0.80ELGI Equipments Ltd. 0.75Blue Star Ltd. 0.73Deepak Nitrite Ltd. 0.72Sandhar Technologies Ltd. 0.71National Aluminium Company Ltd. 0.69Eicher Motors Ltd. 0.65PNC Infratech Ltd. 0.63Techno Electric & Engineering Company Ltd. 0.60UFO Moviez India Ltd. 0.58Strides Pharma Science Ltd. 0.55Varroc Engineering Ltd. 0.54Exide Industries Ltd. 0.47Camlin Fine Sciences Ltd. 0.44LT Foods Ltd. 0.31Prataap Snacks Ltd. 0.16Solara Active Pharma Sciences Ltd. 0.07Greenply Industries Ltd. 0.05
Cognizant Technology Solutions Corporation 1.60
Total 95.35Foreign Equity
Total 1.60Cash, Cash Equivalents And Others 3.05Grand Total 100.00
^Investors should consult their financial advisers if in doubt about whether the product is suitablefor them.
Large Cap Midcap
Cash, Cash Equivalents and Others Smallcap
57.56
19.58
19.81
3.05
14
EQUITY-CONTRA FUND
Option NAV ( )`
Reg-Plan-Dividend 17.7296
Reg-Plan-Growth 102.2499
Dir-Plan-Dividend 22.4401
Dir-Plan-Growth 106.3258
NET ASSET VALUE
Investors understand that their principal
will be at Moderately High risk
�
�
Long term capital appreciation.Investments in a diversified portfolio of equity and equity related securities following a contrarianinvestment strategy.
Pursuant to the circular issued by SEBI on ‘Categorization and Rationalization of the Schemes, there has been change in the fundamental attribute(s) of the schemewith effective from May 16, 2018.
SBI Contra FundThis product is suitable for investors who are seeking^:
Investment Objective
Quantitative Data
To provide the investor with theopportunity of long-term capitalappreciation by investing in a diversifiedportfolio of equity and equity relatedsecurities following a contrarianinvestment strategy.
Standard Deviation :Beta :Sharpe Ratio :Portfolio Turnover* :
#
#
#
15.22%1.000.340.52
#S o u r c e : C R I S I L F u n d A n a l y s e r
*Portfolio Turnover = lower of total sale or totalpurchase for the last 12 months upon Avg. AUMof trailing twelve months.
Risk Free rate: FBIL Overnight Mibor rate (6.35%as on 28th February 2019) Basis for RatioCalculation: 3 Years Monthly Data Points
Note: Fund Manager for Foreign SecuritiesMr.Mohit Jain w.e.f. Nov 28, 2017. Exp. Over5years
Ratios are computed using Total Return Index(TRI) as per SEBI Circular dated Jan 4, 2018
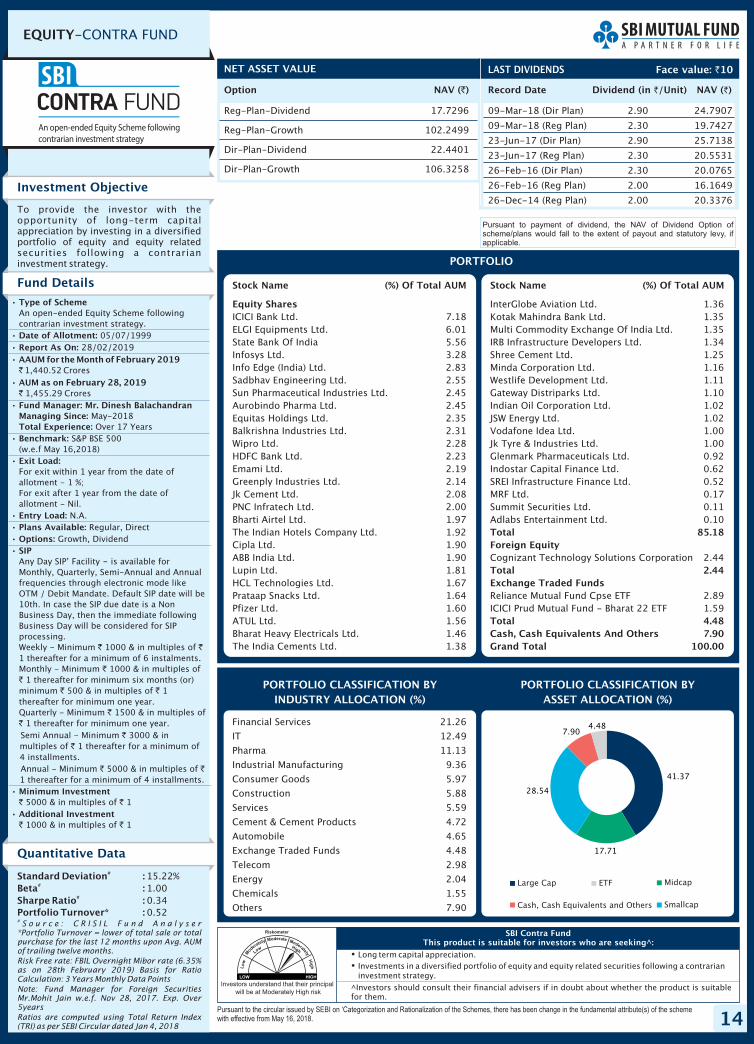
PORTFOLIO CLASSIFICATION BY(%)ASSET ALLOCATION
Financial Services 21.26
IT 12.49
Pharma 11.13
Industrial Manufacturing 9.36
Consumer Goods 5.97
Construction 5.88
Services 5.59
Cement & Cement Products 4.72
Automobile 4.65
Exchange Traded Funds 4.48
Telecom 2.98
Energy 2.04
Chemicals 1.55
Others 7.90
Fund Details
•
•
•
•
•
•
•
•
•
•
•
•
•
•
Type of Scheme
Date of Allotment:Report As On:AAUM for the
AUM as on
Fund Manager: Mr. Dinesh BalachandranManaging Since:Total Experience:Benchmark:
Exit Load:
Entry Load:Plans Available:Options:SIP
-
Minimum Investment
Additional Investment
An open-ended Equity Scheme followingcontrarian investment strategy.
05/07/1999
1,440.52 Crores
1,455.29 Crores
May-2018Over 17 Years
S&P BSE 500(w.e.f May 16,2018)
For exit within 1 year from the date ofallotment - 1 %;For exit after 1 year from the date ofallotment - Nil.
N.A.Regular, Direct
Growth, Dividend
Any Day SIP’ Facility is available forMonthly, Quarterly, Semi-Annual and Annualfrequencies through electronic mode likeOTM / Debit Mandate. Default SIP date will be10th. In case the SIP due date is a NonBusiness Day, then the immediate followingBusiness Day will be considered for SIPprocessing.Weekly - Minimum 1000 & in multiples of1 thereafter for a minimum of 6 instalments.Monthly - Minimum 1000 & in multiples of
1 thereafter for minimum six months (or)minimum 500 & in multiples of 1thereafter for minimum one year.Quarterly - Minimum 1500 & in multiples of
1 thereafter for minimum one year.Semi Annual - Minimum 3000 & inmultiples of 1 thereafter for a minimum of4 installments.Annual - Minimum 5000 & in multiples of1 thereafter for a minimum of 4 installments.
5000 & in multiples of 1
1000 & in multiples of 1
28/02/2019Month of February 2019
February 28, 2019`
`
` `
`
`
` `
`
`
`
`
` `
` `
` `
PORTFOLIO CLASSIFICATION BYINDUSTRY ALLOCATION (%)
PORTFOLIO
Equity SharesICICI Bank Ltd. 7.18ELGI Equipments Ltd. 6.01State Bank Of India 5.56Infosys Ltd. 3.28Info Edge (India) Ltd. 2.83Sadbhav Engineering Ltd. 2.55Sun Pharmaceutical Industries Ltd. 2.45Aurobindo Pharma Ltd. 2.45Equitas Holdings Ltd. 2.35Balkrishna Industries Ltd. 2.31Wipro Ltd. 2.28HDFC Bank Ltd. 2.23Emami Ltd. 2.19Greenply Industries Ltd. 2.14Jk Cement Ltd. 2.08PNC Infratech Ltd. 2.00Bharti Airtel Ltd. 1.97The Indian Hotels Company Ltd. 1.92Cipla Ltd. 1.90ABB India Ltd. 1.90Lupin Ltd. 1.81HCL Technologies Ltd. 1.67Prataap Snacks Ltd. 1.64Pfizer Ltd. 1.60ATUL Ltd. 1.56Bharat Heavy Electricals Ltd. 1.46The India Cements Ltd. 1.38
Stock Name (%) Of Total AUM Stock Name (%) Of Total AUM
InterGlobe Aviation Ltd. 1.36Kotak Mahindra Bank Ltd. 1.35Multi Commodity Exchange Of India Ltd. 1.35IRB Infrastructure Developers Ltd. 1.34Shree Cement Ltd. 1.25Minda Corporation Ltd. 1.16Westlife Development Ltd. 1.11Gateway Distriparks Ltd. 1.10Indian Oil Corporation Ltd. 1.02JSW Energy Ltd. 1.02Vodafone Idea Ltd. 1.00Jk Tyre & Industries Ltd. 1.00Glenmark Pharmaceuticals Ltd. 0.92Indostar Capital Finance Ltd. 0.62SREI Infrastructure Finance Ltd. 0.52MRF Ltd. 0.17Summit Securities Ltd. 0.11Adlabs Entertainment Ltd. 0.10
Cognizant Technology Solutions Corporation 2.44
Reliance Mutual Fund Cpse ETF 2.89ICICI Prud Mutual Fund - Bharat 22 ETF 1.59
Total 85.18Foreign Equity
Total 2.44Exchange Traded Funds
Total 4.48Cash, Cash Equivalents And Others 7.90Grand Total 100.00
^Investors should consult their financial advisers if in doubt about whether the product is suitablefor them.
Record Date Dividend NAV ( )`(in /Unit)`
09-Mar-18 (Dir Plan) 2.90 24.7907
09-Mar-18 (Reg Plan) 2.30 19.7427
26-Feb-16 (Dir Plan) 2.30 20.0765
26-Feb-16 (Reg Plan) 2.00 16.1649
26-Dec-14 (Reg Plan) 2.00 20.3376
23-Jun-17 (Dir Plan) 2.90 25.7138
23-Jun-17 (Reg Plan) 2.30 20.5531
LAST DIVIDENDS Face value: 10`
Pursuant to payment of dividend, the NAV of Dividend Option ofscheme/plans would fall to the extent of payout and statutory levy, ifapplicable.
Large Cap ETF Midcap
Cash, Cash Equivalents and Others Smallcap
41.37
17.71
28.54
7.904.48

15
EQUITY-LARGE & MID CAPFUND
Option NAV ( )`
Reg-Plan-Dividend 93.1144
Reg-Plan-Growth 206.1267
Dir-Plan-Dividend 110.8768
Dir-Plan-Growth 212.7361
NET ASSET VALUE
Record Date Dividend NAV ( )`(in /Unit)`
09-Mar-18 (Reg-plan) 11.00 94.1106
09-Mar-18 (Dir-plan) 13.00 111.1062
27-Feb-17 (Reg-plan) 7.80 89.6546
27-Feb-17 (Dir-plan) 9.20 105.2064
12-Sep-14 (Reg-plan) 11.50 74.9641
12-Oct-09 (Reg-plan) 7.00 57.91
LAST DIVIDENDS
Investors understand that their principal
will be at Moderately High risk
�
�
Long term capital appreciation.Investments in a diversified portfolio of large and midcap companies.
Pursuant to the circular issued by SEBI on ‘Categorization and Rationalization of the Schemes, there has been change in the fundamental attribute(s) of the scheme witheffective from May 16, 2018.
SBI Large & Midcap FundThis product is suitable for investors who are seeking^:
Face value: 10`
Investment Objective
Quantitative Data
To provide the investor with theopportunity of long-term capitalappreciation by investing in diversifiedportfolio comprising predominantly largecap and mid cap companies.
Fund Details
Standard Deviation :Beta :Sharpe Ratio :Portfolio Turnover* :
#
#
#
13.45%0.870.620.72
#S o u r c e : C R I S I L F u n d A n a l y s e r
*Portfolio Turnover = lower of total sale or totalpurchase for the last 12 months upon Avg. AUMof trailing twelve months.
Risk Free rate: FBIL Overnight Mibor rate (6.35%as on 28th February 2019) Basis for RatioCalculation: 3 Years Monthly Data Points
Ratios are computed using Total Return Index(TRI) as per SEBI Circular dated Jan 4, 2018
PORTFOLIO CLASSIFICATION BY(%)ASSET ALLOCATION
Financial Services 25.66
Consumer Goods 15.41
Pharma 10.87
Energy 9.35
IT 8.35
Industrial Manufacturing 6.46
Services 5.05
Automobile 4.91
Construction 4.31
Telecom 2.74
Cement & Cement Products 2.20
Fertilisers & Pesticides 1.78
Others 2.91
Pursuant to payment of dividend, the NAV of Dividend Option ofscheme/plans would fall to the extent of payout and statutory levy, ifapplicable.
•
•
•
•
•
•
•
•
•
•
•
•
•
•
Type of Scheme
Date of Allotment:Report As On:AAUM for the February 2019
AUM as on February 28, 2019
Fund Manager: Mr. Saurabh PantManaging Since:Total ExperienceBenchmark:
Exit Load:
Entry Load:Plans Available:Options:SIP
-
Minimum Investment
Additional Investment
An open-ended Equity Scheme investing inboth large cap and mid cap stocks.
28/02/199328/02/2019
2,322.79 Crores
2,322.30 Crores
Sep-2016Over 11 years
For exit on or before 30 days from the dateof allotment - 0.10%For exit after 30 days from the date ofallotment- Nil
N.A.Regular, Direct
Growth, Dividend
Any Day SIP’ Facility is available forMonthly, Quarterly, Semi-Annual and Annualfrequencies through electronic mode likeOTM / Debit Mandate. Default SIP date willbe 10th. In case the SIP due date is a NonBusiness Day, then the immediate followingBusiness Day will be considered for SIPprocessing.Weekly - Minimum 1000 & in multiples of
1 thereafter for a minimum of 6instalments.Monthly - Minimum 1000 & in multiples of
1 thereafter for minimum six months (or)minimum 500 & in multiples of 1thereafter for minimum one year.Quarterly - Minimum 1500 & in multiplesof 1 thereafter for minimum one year.
5000 & in multiples of 1
1000 & in multiples of 1
Month of`
`
`
`
`
`
` `
`
`
Semi Annual - Minimum ` 3000 & in
multiples of ` 1 thereafter for a minimum
of 4 installments.
Annual - Minimum ` 5000 & in multiples of
` 1 thereafter for a minimum of 4
installments.
` `
` `
NIFTY LargeMidCap 250(w.e.f February 25,2019)
PORTFOLIO CLASSIFICATION BYINDUSTRY ALLOCATION (%)
PORTFOLIO
Equity Shares
ICICI Bank Ltd. 5.28
State Bank Of India 5.21
Infosys Ltd. 5.03
Axis Bank Ltd. 4.58
HDFC Bank Ltd. 4.47
The Indian Hotels Company Ltd. 3.88
Divi's Laboratories Ltd. 3.56
ITC Ltd. 3.21
Jubilant Foodworks Ltd. 3.01
Sheela Foam Ltd. 2.97
Exide Industries Ltd. 2.84
Tata Power Company Ltd. 2.82
Larsen & Toubro Ltd. 2.78
Bharti Airtel Ltd. 2.74
Colgate Palmolive (India) Ltd. 2.71
Sanofi India Ltd. 2.57
Thermax Ltd. 2.51
Reliance Industries Ltd. 2.49
Jk Cement Ltd. 2.20
Muthoot Finance Ltd. 2.05
AU Small Finance Bank Ltd. 1.95
Torrent Pharmaceuticals Ltd. 1.94
JSW Energy Ltd. 1.80
PI Industries Ltd. 1.79
Stock Name (%) Of Total AUM Stock Name (%) Of Total AUM
Tata Consultancy Services Ltd. 1.71
Mahindra & Mahindra Financial Services Ltd. 1.71
Gujarat State Petronet Ltd. 1.69
Tech Mahindra Ltd. 1.61
Ahluwalia Contracts (India) Ltd. 1.53
Crompton Greaves Consumer Electricals Ltd. 1.52
ABB India Ltd. 1.45
Prataap Snacks Ltd. 1.42
Lemon Tree Hotels Ltd. 1.17
Kirloskar Oil Engines Ltd. 1.15
Dr. Reddy'S Laboratories Ltd. 1.13
Tata Motors Ltd. 1.13
Aurobindo Pharma Ltd. 0.98
Apollo Tyres Ltd. 0.94
GE T&D India Ltd. 0.86
Strides Pharma Science Ltd. 0.68
Manpasand Beverages Ltd. 0.55
NLC India Ltd. 0.55
Triveni Turbine Ltd. 0.48
Housing Development Finance Corporation Ltd. 0.40
Hatsun Agro Product Ltd. 0.04
Total 97.09
Cash, Cash Equivalents And Others 2.91
Grand Total 100.00
(Previously known as SBI Magnum Multiplier Fund)
^Investors should consult their financial advisers if in doubt about whether the product is suitablefor them.
Large Cap Midcap
Cash, Cash Equivalents and Others Smallcap
49.03
35.05
13.012.91
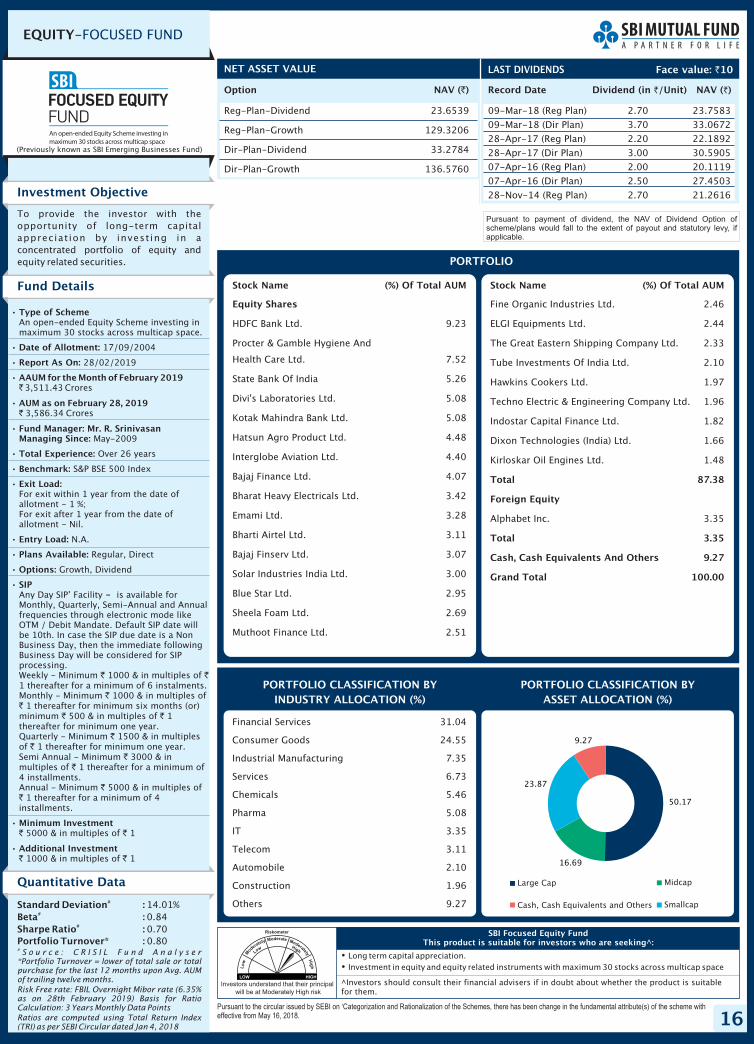
16
EQUITY-FOCUSED FUND
Option NAV ( )`
Reg-Plan-Dividend 23.6539
Reg-Plan-Growth 129.3206
Dir-Plan-Dividend 33.2784
Dir-Plan-Growth 136.5760
NET ASSET VALUE
Record Date Dividend NAV ( )`(in /Unit)`
09-Mar-18 (Reg Plan) 2.70 23.7583
09-Mar-18 (Dir Plan) 3.70 33.0672
28-Apr-17 (Reg Plan) 2.20 22.1892
(Dir Plan) 3.00 30.590528-Apr-17
07-Apr-16 (Reg Plan) 2.00 20.1119
07-Apr-16 (Dir Plan) 2.50 27.4503
28-Nov-14 (Reg Plan) 2.70 21.2616
LAST DIVIDENDS
Investors understand that their principal
will be at Moderately High risk
�
�
Long term capital appreciation.Investment in equity and equity related instruments with maximum 30 stocks across multicap space
Pursuant to the circular issued by SEBI on ‘Categorization and Rationalization of the Schemes, there has been change in the fundamental attribute(s) of the scheme witheffective from May 16, 2018.
SBI Focused Equity FundThis product is suitable for investors who are seeking^:
Face value: 10`
Investment Objective
Quantitative Data
To provide the investor with theopportunity of long-term capitalappreciat ion by invest ing in aconcentrated portfolio of equity andequity related securities.
Fund Details
Standard Deviation :Beta :Sharpe Ratio :Portfolio Turnover* :
#
#
#
14.01%0.840.700.80
#S o u r c e : C R I S I L F u n d A n a l y s e r
*Portfolio Turnover = lower of total sale or totalpurchase for the last 12 months upon Avg. AUMof trailing twelve months.
Risk Free rate: FBIL Overnight Mibor rate (6.35%as on 28th February 2019) Basis for RatioCalculation: 3 Years Monthly Data Points
Ratios are computed using Total Return Index(TRI) as per SEBI Circular dated Jan 4, 2018
PORTFOLIO CLASSIFICATION BY(%)ASSET ALLOCATION
Financial Services 31.04
Consumer Goods 24.55
Industrial Manufacturing 7.35
Services 6.73
Chemicals 5.46
Pharma 5.08
IT 3.35
Telecom 3.11
Automobile 2.10
Construction 1.96
Others 9.27
Pursuant to payment of dividend, the NAV of Dividend Option ofscheme/plans would fall to the extent of payout and statutory levy, ifapplicable.
•
•
•
•
•
•
•
•
•
•
•
•
•
•
•
Type of Scheme
Date of Allotment:
Report As On:
AAUM for the February 2019
AUM as on February 28, 2019
Fund Manager: Mr. R. SrinivasanManaging Since:
Total Experience:
Benchmark:
Exit Load:
Entry Load:
Plans Available:
Options:
SIP-
Minimum Investment
Additional Investment
An open-ended Equity Scheme investing inmaximum 30 stocks across multicap space.
17/09/2004
28/02/2019
3,511.43 Crores
3,586.34 Crores
May-2009
Over 26 years
S&P BSE 500 Index
For exit within 1 year from the date ofallotment - 1 %;For exit after 1 year from the date ofallotment - Nil.
N.A.
Regular, Direct
Growth, Dividend
Any Day SIP’ Facility is available forMonthly, Quarterly, Semi-Annual and Annualfrequencies through electronic mode likeOTM / Debit Mandate. Default SIP date willbe 10th. In case the SIP due date is a NonBusiness Day, then the immediate followingBusiness Day will be considered for SIPprocessing.Weekly - Minimum 1000 & in multiples of1 thereafter for a minimum of 6 instalments.Monthly - Minimum 1000 & in multiples of
1 thereafter for minimum six months (or)minimum 500 & in multiples of 1thereafter for minimum one year.Quarterly - Minimum 1500 & in multiplesof 1 thereafter for minimum one year.Semi Annual - Minimum 3000 & inmultiples of 1 thereafter for a minimum of4 installments.Annual - Minimum 5000 & in multiples of
1 thereafter for a minimum of 4installments.
5000 & in multiples of 1
1000 & in multiples of 1
Month of`
`
` `
``
` `
``
``
``
` `
` `
PORTFOLIO CLASSIFICATION BYINDUSTRY ALLOCATION (%)
PORTFOLIO
Equity Shares
HDFC Bank Ltd. 9.23
Procter & Gamble Hygiene And
Health Care Ltd. 7.52
State Bank Of India 5.26
Divi's Laboratories Ltd. 5.08
Kotak Mahindra Bank Ltd. 5.08
Hatsun Agro Product Ltd. 4.48
Interglobe Aviation Ltd. 4.40
Bajaj Finance Ltd. 4.07
Bharat Heavy Electricals Ltd. 3.42
Emami Ltd. 3.28
Bharti Airtel Ltd. 3.11
Bajaj Finserv Ltd. 3.07
Solar Industries India Ltd. 3.00
Blue Star Ltd. 2.95
Sheela Foam Ltd. 2.69
Muthoot Finance Ltd. 2.51
Stock Name (%) Of Total AUM Stock Name (%) Of Total AUM
Fine Organic Industries Ltd. 2.46
ELGI Equipments Ltd. 2.44
The Great Eastern Shipping Company Ltd. 2.33
Tube Investments Of India Ltd. 2.10
Hawkins Cookers Ltd. 1.97
Techno Electric & Engineering Company Ltd. 1.96
Indostar Capital Finance Ltd. 1.82
Dixon Technologies (India) Ltd. 1.66
Kirloskar Oil Engines Ltd. 1.48
Alphabet Inc. 3.35
Total 87.38
Foreign Equity
Total 3.35
Cash, Cash Equivalents And Others 9.27
Grand Total 100.00
(Previously known as SBI Emerging Businesses Fund)
^Investors should consult their financial advisers if in doubt about whether the product is suitablefor them.
Large Cap Midcap
Cash, Cash Equivalents and Others Smallcap
50.17
16.69
23.87
9.27
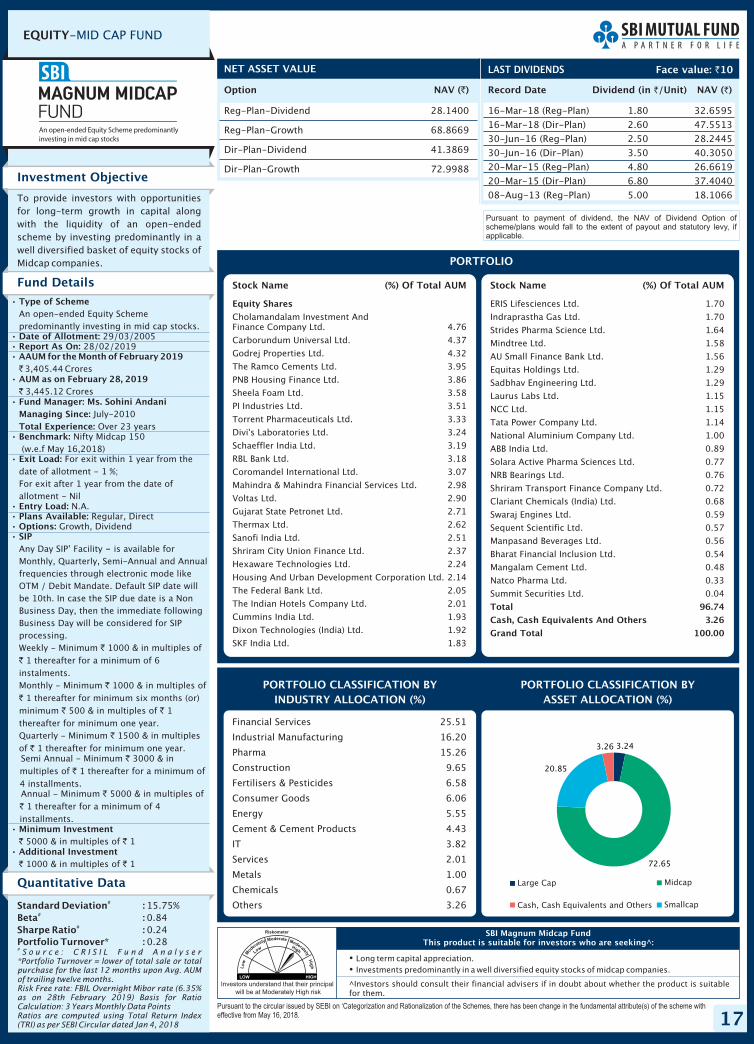
17
EQUITY-MID CAP FUND
Option NAV ( )`
Reg-Plan-Dividend 28.1400
Reg-Plan-Growth 68.8669
Dir-Plan-Dividend 41.3869
Dir-Plan-Growth 72.9988
NET ASSET VALUE
Record Date Dividend NAV ( )`(in /Unit)`
16-Mar-18 (Reg-Plan) 1.80 32.6595
16-Mar-18 (Dir-Plan) 2.60 47.5513
30-Jun-16 (Reg-Plan) 2.50 28.2445
30-Jun-16 (Dir-Plan) 3.50 40.3050
20-Mar-15 (Reg-Plan) 4.80 26.6619
20-Mar-15 (Dir-Plan) 6.80 37.4040
08-Aug-13 (Reg-Plan) 5.00 18.1066
LAST DIVIDENDS
Investors understand that their principal
will be at Moderately High risk
�
�
Long term capital appreciation.Investments predominantly in a well diversified equity stocks of midcap companies.
Pursuant to the circular issued by SEBI on ‘Categorization and Rationalization of the Schemes, there has been change in the fundamental attribute(s) of the scheme witheffective from May 16, 2018.
SBI Magnum Midcap FundThis product is suitable for investors who are seeking^:
Face value: 10`
Investment Objective
Quantitative Data
To provide investors with opportunitiesfor long-term growth in capital alongwith the liquidity of an open-endedscheme by investing predominantly in awell diversified basket of equity stocks ofMidcap companies.
Fund Details
Standard Deviation :Beta :Sharpe Ratio :Portfolio Turnover* :
#
#
#
15.75%0.840.240.28
#S o u r c e : C R I S I L F u n d A n a l y s e r
*Portfolio Turnover = lower of total sale or totalpurchase for the last 12 months upon Avg. AUMof trailing twelve months.Risk Free rate: FBIL Overnight Mibor rate (6.35%as on 28th February 2019) Basis for RatioCalculation: 3 Years Monthly Data PointsRatios are computed using Total Return Index(TRI) as per SEBI Circular dated Jan 4, 2018
PORTFOLIO CLASSIFICATION BY(%)ASSET ALLOCATION
Financial Services 25.51
Industrial Manufacturing 16.20
Pharma 15.26
Construction 9.65
Fertilisers & Pesticides 6.58
Consumer Goods 6.06
Energy 5.55
Cement & Cement Products 4.43
IT 3.82
Services 2.01
Metals 1.00
Chemicals 0.67
Others 3.26
Pursuant to payment of dividend, the NAV of Dividend Option ofscheme/plans would fall to the extent of payout and statutory levy, ifapplicable.
•
•
•
•
•
•
•
•
•
•
•
•
•
•
Type of Scheme
Date of Allotment:Report As On:AAUM for the February 2019
AUM as on February 28, 2019
Fund Manager: Ms. Sohini AndaniManaging Since:Total Experience:Benchmark:
Exit Load:
Entry Load:Plans Available:Options:SIP
-
Minimum Investment
Additional Investment
An open-ended Equity Schemepredominantly investing in mid cap stocks.
29/03/200528/02/2019
3,405.44 Crores
3,445.12 Crores
July-2010Over 23 years
Nifty Midcap 150(w.e.f May 16,2018)
For exit within 1 year from thedate of allotment - 1 %;For exit after 1 year from the date ofallotment - Nil
N.A.Regular, Direct
Growth, Dividend
Any Day SIP’ Facility is available forMonthly, Quarterly, Semi-Annual and Annualfrequencies through electronic mode likeOTM / Debit Mandate. Default SIP date willbe 10th. In case the SIP due date is a NonBusiness Day, then the immediate followingBusiness Day will be considered for SIPprocessing.Weekly - Minimum 1000 & in multiples of
1 thereafter for a minimum of 6instalments.Monthly - Minimum 1000 & in multiples of
1 thereafter for minimum six months (or)minimum 500 & in multiples of 1thereafter for minimum one year.Quarterly - Minimum 1500 & in multiplesof 1 thereafter for minimum one year.Semi Annual - Minimum 3000 & inmultiples of 1 thereafter for a minimum of4 installments.Annual - Minimum 5000 & in multiples of
1 thereafter for a minimum of 4installments.
5000 & in multiples of 1
1000 & in multiples of 1
Month of`
`
`
`
`
`
` `
`
``
`
`
`
` `
` `
PORTFOLIO CLASSIFICATION BYINDUSTRY ALLOCATION (%)
PORTFOLIO
Equity Shares
Cholamandalam Investment AndFinance Company Ltd. 4.76
Carborundum Universal Ltd. 4.37
Godrej Properties Ltd. 4.32
The Ramco Cements Ltd. 3.95
PNB Housing Finance Ltd. 3.86
Sheela Foam Ltd. 3.58
PI Industries Ltd. 3.51
Torrent Pharmaceuticals Ltd. 3.33
Divi's Laboratories Ltd. 3.24
Schaeffler India Ltd. 3.19
RBL Bank Ltd. 3.18
Coromandel International Ltd. 3.07
Mahindra & Mahindra Financial Services Ltd. 2.98
Voltas Ltd. 2.90
Gujarat State Petronet Ltd. 2.71
Thermax Ltd. 2.62
Sanofi India Ltd. 2.51
Shriram City Union Finance Ltd. 2.37
Hexaware Technologies Ltd. 2.24
Housing And Urban Development Corporation Ltd. 2.14
The Federal Bank Ltd. 2.05
The Indian Hotels Company Ltd. 2.01
Cummins India Ltd. 1.93
Dixon Technologies (India) Ltd. 1.92
SKF India Ltd. 1.83
Stock Name (%) Of Total AUM Stock Name (%) Of Total AUM
ERIS Lifesciences Ltd. 1.70
Indraprastha Gas Ltd. 1.70
Strides Pharma Science Ltd. 1.64
Mindtree Ltd. 1.58
AU Small Finance Bank Ltd. 1.56
Equitas Holdings Ltd. 1.29
Sadbhav Engineering Ltd. 1.29
Laurus Labs Ltd. 1.15
NCC Ltd. 1.15
Tata Power Company Ltd. 1.14
National Aluminium Company Ltd. 1.00
ABB India Ltd. 0.89
Solara Active Pharma Sciences Ltd. 0.77
NRB Bearings Ltd. 0.76
Shriram Transport Finance Company Ltd. 0.72
Clariant Chemicals (India) Ltd. 0.68
Swaraj Engines Ltd. 0.59
Sequent Scientific Ltd. 0.57
Manpasand Beverages Ltd. 0.56
Bharat Financial Inclusion Ltd. 0.54
Mangalam Cement Ltd. 0.48
Natco Pharma Ltd. 0.33
Summit Securities Ltd. 0.04
Total 96.74
Cash, Cash Equivalents And Others 3.26
Grand Total 100.00
^Investors should consult their financial advisers if in doubt about whether the product is suitablefor them.
Large Cap Midcap
Cash, Cash Equivalents and Others Smallcap
3.24
72.65
20.85
3.26

18
EQUITY-THEMATIC FUND
Option NAV ( )`
Reg-Plan-Dividend 49.7426
Reg-Plan-Growth 162.8277
Dir-Plan-Dividend 61.1884
Dir-Plan-Growth 171.4126
NET ASSET VALUE
Investors understand that their principal
will be at High risk
�
�
Long term capital appreciation.Investments in equity stocks of MNC companies.
Pursuant to the circular issued by SEBI on ‘Categorization and Rationalization of the Schemes, there has been change in the fundamental attribute(s) of the scheme witheffective from May 16, 2018.
SBI Magnum Global FundThis product is suitable for investors who are seeking^:
Investment Objective
Quantitative Data
To provide the investor with theopportunity of long-term capitalappreciation by investing in diversifiedportfolio comprising primarily of MNCcompanies.
Fund Details
Standard Deviation :Beta :Sharpe Ratio :Portfolio Turnover* :
#
#
#
13.29%0.640.390.71
#S o u r c e : C R I S I L F u n d A n a l y s e r
*Portfolio Turnover = lower of total sale or totalpurchase for the last 12 months upon Avg. AUMof trailing twelve months.
Risk Free rate: FBIL Overnight Mibor rate (6.35%as on 28th February 2019) Basis for RatioCalculation: 3 Years Monthly Data Points
Ratios are computed using Total Return Index(TRI) as per SEBI Circular dated Jan 4, 2018
PORTFOLIO CLASSIFICATION BY(%)ASSET ALLOCATION
Consumer Goods 35.00
Industrial Manufacturing 18.89
Pharma 11.38
Automobile 7.65
IT 6.41
Services 5.00
Chemicals 4.53
Fertilisers & Pesticides 2.46
Cement & Cement Products 1.63
Construction 0.83
Financial Services 0.09
Others 6.13
•
•
•
•
•
•
•
•
•
•
•
•
•
•
Type of Scheme
Date of Allotment:Report As On:AAUM for the February 2019
AUM as on February 28, 2019
Fund Manager: Mr. Anup Upadhyay
Managing Since:Total Experience:Benchmark:
Exit Load:
Entry Load:Plans Available:Options:SIP
Minimum Investment
Additional Investment
An open-ended Equity Scheme investing incompanies following the MNC theme.
30/09/199428/02/2019
3,478.45 Crores
3,489.06 Crores
(w.e.f May 5,2018)May-2018Over 13 years
Nifty MNC(w.e.f May 16,2018)
For exit within 12 months fromthe date of allotment - 1.00%;For exit after 12 months from the date ofallotment - Nil
N.A.Regular, Direct
Growth, Dividend
Any Day SIP’ Facility is available for Monthly,Quarterly, Semi-Annual and Annualfrequencies through electronic mode likeOTM / Debit Mandate. Default SIP date willbe 10th. In case the SIP due date is a NonBusiness Day, then the immediate followingBusiness Day will be considered for SIPprocessing.Weekly - Minimum 1000 & in multiples of
1 thereafter for a minimum of 6instalments.Monthly - Minimum 1000 & in multiples of
1 thereafter for minimum six months (or)minimum 500 & in multiples of 1thereafter for minimum one year.Quarterly - Minimum 1500 & in multiplesof 1 thereafter for minimum one year.Semi Annual - Minimum 3000 & inmultiples of 1 thereafter for a minimum of4 installments.Annual - Minimum 5000 & in multiples of1 thereafter for a minimum of 4
installments.
5000 & in multiples of 1
1000 & in multiples of 1
Month of`
`
`
`
`
`
` `
`
`
`
`
`
`
` `
` `
PORTFOLIO CLASSIFICATION BYINDUSTRY ALLOCATION (%)
PORTFOLIO
Equity Shares
Colgate Palmolive (India) Ltd. 7.55
Divi's Laboratories Ltd. 5.08
Hindustan Unilever Ltd. 4.94
Infosys Ltd. 4.84
Grindwell Norton Ltd. 4.21
Glaxosmithkline Consumer Healthcare Ltd. 4.15
Maruti Suzuki India Ltd. 4.11
Procter & Gamble Hygiene And
Health Care Ltd. 4.11
Britannia Industries Ltd. 3.85
Schaeffler India Ltd. 3.78
ABB India Ltd. 3.55
SKF India Ltd. 3.36
ATUL Ltd. 3.19
Westlife Development Ltd. 3.04
Nestle India Ltd. 3.02
Sanofi India Ltd. 2.73
ITC Ltd. 2.63
Goodyear India Ltd. 2.55
PI Industries Ltd. 2.46
Stock Name (%) Of Total AUM Stock Name (%) Of Total AUM
Whirlpool Of India Ltd. 2.25
ELGI Equipments Ltd. 2.05
Ge Power India Ltd. 1.93
Pfizer Ltd. 1.91
Dr. Reddy'S Laboratories Ltd. 1.67
ACC Ltd. 1.63
Dixon Technologies (India) Ltd. 1.45
Galaxy Surfactants Ltd. 1.35
Blue Dart Express Ltd. 1.26
Precision Camshafts Ltd. 0.99
Oracle Financial Services Software Ltd. 0.85
ITD Cementation India Ltd. 0.83
ACCelya Kale Solutions Ltd. 0.72
Redington (India) Ltd. 0.71
Greenply Industries Ltd. 0.54
United Breweries Ltd. 0.52
Sundaram Finance Holdings Ltd. 0.09
Total 93.87
Cash, Cash Equivalents And Others 6.13
Grand Total 100.00
^Investors should consult their financial advisers if in doubt about whether the product is suitablefor them.
Record Date Dividend NAV ( )`(in /Unit)`
29-Nov-17 (Reg Plan) 5.10 54.5060
29-Nov-17 (Dir Plan) 6.20 66.3252
25-Nov-16 (Reg Plan) 5.00 45.0759
25-Nov-16 (Dir Plan) 6.00 54.3465
30-Oct-15 (Reg Plan) 5.10 49.9803
30-Oct-15 (Dir Plan) 5.10 59.5549
LAST DIVIDENDS Face value: 10`
Pursuant to payment of dividend, the NAV of Dividend Option ofscheme/plans would fall to the extent of payout and statutory levy, ifapplicable.
Large Cap Midcap
Cash, Cash Equivalents and Others Smallcap
47.30
24.85
21.72
6.13
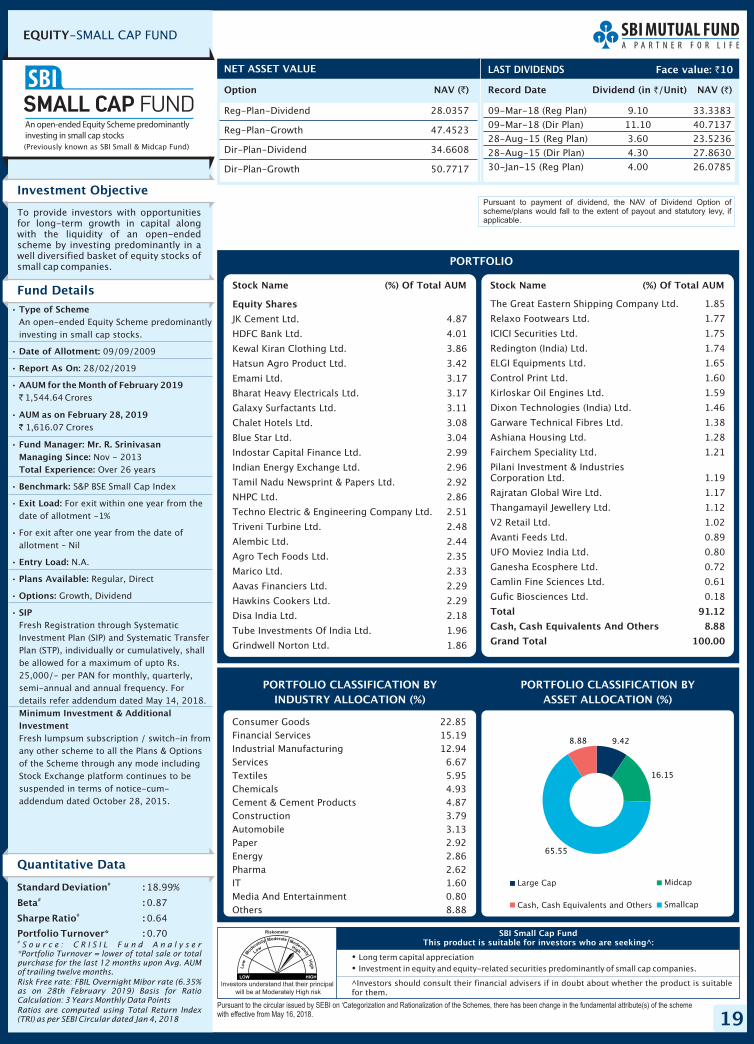
19
EQUITY-SMALL CAP FUND
Option NAV ( )`
Reg-Plan-Dividend 28.0357
Reg-Plan-Growth 47.4523
Dir-Plan-Dividend 34.6608
Dir-Plan-Growth 50.7717
NET ASSET VALUE
Record Date Dividend NAV ( )`(in /Unit)`
09-Mar-18 (Reg Plan) 9.10 33.3383
09-Mar-18 (Dir Plan) 11.10 40.7137
28-Aug-15 (Reg Plan) 3.60 23.5236
28-Aug-15 (Dir Plan) 4.30 27.8630
30-Jan-15 (Reg Plan) 4.00 26.0785
LAST DIVIDENDS
Investors understand that their principal
will be at Moderately High risk
�
�
Long term capital appreciationInvestment in equity and equity-related securities predominantly of small cap companies.
Pursuant to the circular issued by SEBI on ‘Categorization and Rationalization of the Schemes, there has been change in the fundamental attribute(s) of the schemewith effective from May 16, 2018.
SBI Small Cap FundThis product is suitable for investors who are seeking^:
Face value: 10`
Investment Objective
Quantitative Data
To provide investors with opportunitiesfor long-term growth in capital alongwith the liquidity of an open-endedscheme by investing predominantly in awell diversified basket of equity stocks ofsmall cap companies.
Fund Details
Standard Deviation :
Beta :
Sharpe Ratio :
Portfolio Turnover* :
#
#
#
18.99%
0.87
0.64
0.70#S o u r c e : C R I S I L F u n d A n a l y s e r
*Portfolio Turnover = lower of total sale or totalpurchase for the last 12 months upon Avg. AUMof trailing twelve months.
Risk Free rate: FBIL Overnight Mibor rate (6.35%as on 28th February 2019) Basis for RatioCalculation: 3 Years Monthly Data Points
Ratios are computed using Total Return Index(TRI) as per SEBI Circular dated Jan 4, 2018
PORTFOLIO CLASSIFICATION BY(%)ASSET ALLOCATION
Consumer Goods 22.85Financial Services 15.19Industrial Manufacturing 12.94Services 6.67Textiles 5.95Chemicals 4.93Cement & Cement Products 4.87Construction 3.79Automobile 3.13Paper 2.92Energy 2.86Pharma 2.62IT 1.60Media And Entertainment 0.80Others 8.88
Pursuant to payment of dividend, the NAV of Dividend Option ofscheme/plans would fall to the extent of payout and statutory levy, ifapplicable.
•
•
•
•
•
•
•
•
•
•
•
•
•
Type of Scheme
Date of Allotment:
Report As On:
AAUM for the February 2019
AUM as on February 28, 2019
Fund Manager: Mr. R. SrinivasanManaging Since:Total Experience:
Benchmark:
Exit Load:
Entry Load:
Plans Available:
Options:
SIP
Minimum Investment & AdditionalInvestment
An open-ended Equity Scheme predominantlyinvesting in small cap stocks.
09/09/2009
28/02/2019
1,544.64 Crores
1,616.07 Crores
Nov - 2013Over 26 years
S&P BSE Small Cap Index
For exit within one year from thedate of allotment -1%
For exit after one year from the date ofallotment – Nil
N.A.
Regular, Direct
Growth, Dividend
Fresh Registration through SystematicInvestment Plan (SIP) and Systematic TransferPlan (STP), individually or cumulatively, shallbe allowed for a maximum of upto Rs.25,000/- per PAN for monthly, quarterly,semi-annual and annual frequency. Fordetails refer addendum dated May 14, 2018.
Fresh lumpsum subscription / switch-in fromany other scheme to all the Plans & Optionsof the Scheme through any mode includingStock Exchange platform continues to besuspended in terms of notice-cum-addendum dated October 28, 2015.
Month of`
`
PORTFOLIO CLASSIFICATION BYINDUSTRY ALLOCATION (%)
PORTFOLIO
Equity Shares
JK Cement Ltd. 4.87
HDFC Bank Ltd. 4.01
Kewal Kiran Clothing Ltd. 3.86
Hatsun Agro Product Ltd. 3.42
Emami Ltd. 3.17
Bharat Heavy Electricals Ltd. 3.17
Galaxy Surfactants Ltd. 3.11
Chalet Hotels Ltd. 3.08
Blue Star Ltd. 3.04
Indostar Capital Finance Ltd. 2.99
Indian Energy Exchange Ltd. 2.96
Tamil Nadu Newsprint & Papers Ltd. 2.92
NHPC Ltd. 2.86
Techno Electric & Engineering Company Ltd. 2.51
Triveni Turbine Ltd. 2.48
Alembic Ltd. 2.44
Agro Tech Foods Ltd. 2.35
Marico Ltd. 2.33
Aavas Financiers Ltd. 2.29
Hawkins Cookers Ltd. 2.29
Disa India Ltd. 2.18
Tube Investments Of India Ltd. 1.96
Grindwell Norton Ltd. 1.86
Stock Name (%) Of Total AUM Stock Name (%) Of Total AUM
The Great Eastern Shipping Company Ltd. 1.85
Relaxo Footwears Ltd. 1.77
ICICI Securities Ltd. 1.75
Redington (India) Ltd. 1.74
ELGI Equipments Ltd. 1.65
Control Print Ltd. 1.60
Kirloskar Oil Engines Ltd. 1.59
Dixon Technologies (India) Ltd. 1.46
Garware Technical Fibres Ltd. 1.38
Ashiana Housing Ltd. 1.28
Fairchem Speciality Ltd. 1.21
Pilani Investment & IndustriesCorporation Ltd. 1.19
Rajratan Global Wire Ltd. 1.17
Thangamayil Jewellery Ltd. 1.12
V2 Retail Ltd. 1.02
Avanti Feeds Ltd. 0.89
UFO Moviez India Ltd. 0.80
Ganesha Ecosphere Ltd. 0.72
Camlin Fine Sciences Ltd. 0.61
Gufic Biosciences Ltd. 0.18
Total 91.12
Cash, Cash Equivalents And Others 8.88
Grand Total 100.00
^Investors should consult their financial advisers if in doubt about whether the product is suitablefor them.
(Previously known as SBI Small & Midcap Fund)
Large Cap Midcap
Cash, Cash Equivalents and Others Smallcap
9.42
16.15
65.55
8.88
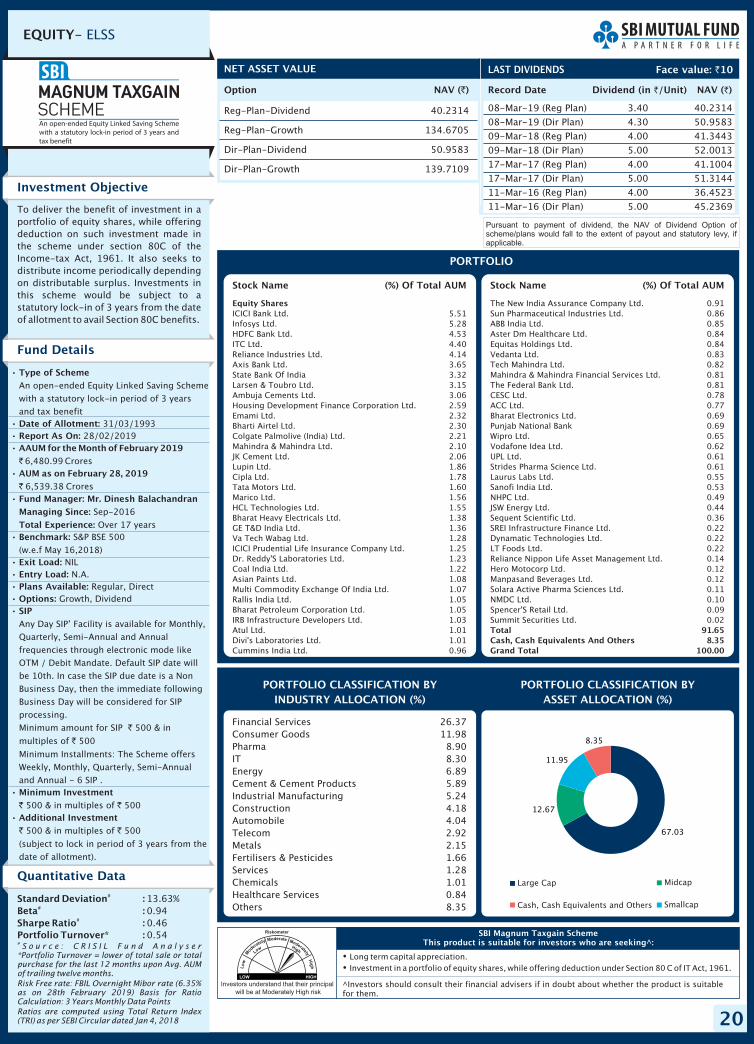
20
EQUITY- ELSS
Option NAV ( )`
Reg-Plan-Dividend 40.2314
Reg-Plan-Growth 134.6705
Dir-Plan-Dividend 50.9583
Dir-Plan-Growth 139.7109
NET ASSET VALUE
Record Date Dividend NAV ( )`(in /Unit)`
08-Mar-19 (Reg Plan) 3.40 40.2314
(Dir Plan) 4.30 50.9583
17-Mar-17 (Reg Plan) 4.00 41.1004
17-Mar-17 (Dir Plan) 5.00 51.3144
11-Mar-16 (Reg Plan) 4.00 36.4523
11-Mar-16 (Dir Plan) 5.00 45.2369
08-Mar-19
09-Mar-18 (Reg Plan) 4.00 41.3443
09-Mar-18 (Dir Plan) 5.00 52.0013
LAST DIVIDENDS
Investors understand that their principal
will be at Moderately High risk
�
�
Long term capital appreciation.Investment in a portfolio of equity shares, while offering deduction under Section 80 C of IT Act, 1961.
SBI Magnum Taxgain SchemeThis product is suitable for investors who are seeking^:
Face value: 10`
Investment Objective
Quantitative Data
To deliver the benefit of investment in aportfolio of equity shares, while offeringdeduction on such investment made inthe scheme under section 80C of theIncome-tax Act, 1961. It also seeks todistribute income periodically dependingon distributable surplus. Investments inthis scheme would be subject to astatutory lock-in of 3 years from the dateof allotment to avail Section 80C benefits.
Fund Details
Standard Deviation :Beta :Sharpe Ratio :Portfolio Turnover* :
#
#
#
13.63%0.940.460.54
#S o u r c e : C R I S I L F u n d A n a l y s e r
*Portfolio Turnover = lower of total sale or totalpurchase for the last 12 months upon Avg. AUMof trailing twelve months.
Risk Free rate: FBIL Overnight Mibor rate (6.35%as on 28th February 2019) Basis for RatioCalculation: 3 Years Monthly Data Points
Ratios are computed using Total Return Index(TRI) as per SEBI Circular dated Jan 4, 2018
PORTFOLIO CLASSIFICATION BY(%)ASSET ALLOCATION
Financial Services 26.37Consumer Goods 11.98Pharma 8.90IT 8.30Energy 6.89Cement & Cement Products 5.89Industrial Manufacturing 5.24Construction 4.18Automobile 4.04Telecom 2.92Metals 2.15Fertilisers & Pesticides 1.66Services 1.28Chemicals 1.01Healthcare Services 0.84Others 8.35
Pursuant to payment of dividend, the NAV of Dividend Option ofscheme/plans would fall to the extent of payout and statutory levy, ifapplicable.
•
•
•
•
•
•
•
•
•
•
•
•
•
•
Type of Scheme
Date of Allotment:Report As On:AAUM for the February 2019
AUM as on February 28, 2019
Fund Manager: Mr. Dinesh Balachandran
Managing Since:
Total Experience:Benchmark:
Exit Load:Entry Load:Plans Available:Options:SIP
Minimum Investment
Additional Investment
An open-ended Equity Linked Saving Scheme
with a statutory lock-in period of 3 years
and tax benefit31/03/1993
28/02/2019
6,480.99 Crores
6,539.38 Crores
Sep-2016
Over 17 yearsS&P BSE 500
(w.e.f May 16,2018)NIL
N.A.Regular, Direct
Growth, Dividend
Any Day SIP’ Facility is available for Monthly,
Quarterly, Semi-Annual and Annual
frequencies through electronic mode like
OTM / Debit Mandate. Default SIP date will
be 10th. In case the SIP due date is a Non
Business Day, then the immediate following
Business Day will be considered for SIP
processing.
Minimum amount for SIP 500 & in
multiples of 500
Minimum Installments: The Scheme offers
Weekly, Monthly, Quarterly, Semi-Annual
and Annual - 6 SIP .
500 & in multiples of 500
500 & in multiples of 500
(subject to lock in period of 3 years from the
date of allotment).
Month of
`
`
`
`
` `
` `
PORTFOLIO CLASSIFICATION BYINDUSTRY ALLOCATION (%)
PORTFOLIO
Equity SharesICICI Bank Ltd. 5.51Infosys Ltd. 5.28HDFC Bank Ltd. 4.53ITC Ltd. 4.40Reliance Industries Ltd. 4.14Axis Bank Ltd. 3.65State Bank Of India 3.32Larsen & Toubro Ltd. 3.15Ambuja Cements Ltd. 3.06Housing Development Finance Corporation Ltd. 2.59Emami Ltd. 2.32Bharti Airtel Ltd. 2.30Colgate Palmolive (India) Ltd. 2.21Mahindra & Mahindra Ltd. 2.10JK Cement Ltd. 2.06Lupin Ltd. 1.86Cipla Ltd. 1.78Tata Motors Ltd. 1.60Marico Ltd. 1.56HCL Technologies Ltd. 1.55Bharat Heavy Electricals Ltd. 1.38GE T&D India Ltd. 1.36Va Tech Wabag Ltd. 1.28ICICI Prudential Life Insurance Company Ltd. 1.25Dr. Reddy'S Laboratories Ltd. 1.23Coal India Ltd. 1.22Asian Paints Ltd. 1.08Multi Commodity Exchange Of India Ltd. 1.07Rallis India Ltd. 1.05Bharat Petroleum Corporation Ltd. 1.05IRB Infrastructure Developers Ltd. 1.03Atul Ltd. 1.01Divi's Laboratories Ltd. 1.01Cummins India Ltd. 0.96
Stock Name (%) Of Total AUM Stock Name (%) Of Total AUM
The New India Assurance Company Ltd. 0.91Sun Pharmaceutical Industries Ltd. 0.86ABB India Ltd. 0.85Aster Dm Healthcare Ltd. 0.84Equitas Holdings Ltd. 0.84Vedanta Ltd. 0.83Tech Mahindra Ltd. 0.82Mahindra & Mahindra Financial Services Ltd. 0.81The Federal Bank Ltd. 0.81CESC Ltd. 0.78ACC Ltd. 0.77Bharat Electronics Ltd. 0.69Punjab National Bank 0.69Wipro Ltd. 0.65Vodafone Idea Ltd. 0.62UPL Ltd. 0.61Strides Pharma Science Ltd. 0.61Laurus Labs Ltd. 0.55Sanofi India Ltd. 0.53NHPC Ltd. 0.49JSW Energy Ltd. 0.44Sequent Scientific Ltd. 0.36SREI Infrastructure Finance Ltd. 0.22Dynamatic Technologies Ltd. 0.22LT Foods Ltd. 0.22Reliance Nippon Life Asset Management Ltd. 0.14Hero Motocorp Ltd. 0.12Manpasand Beverages Ltd. 0.12Solara Active Pharma Sciences Ltd. 0.11NMDC Ltd. 0.10Spencer'S Retail Ltd. 0.09Summit Securities Ltd. 0.02Total 91.65Cash, Cash Equivalents And Others 8.35Grand Total 100.00
^Investors should consult their financial advisers if in doubt about whether the product is suitablefor them.
Large Cap Midcap
Cash, Cash Equivalents and Others Smallcap
67.03
12.67
11.95
8.35
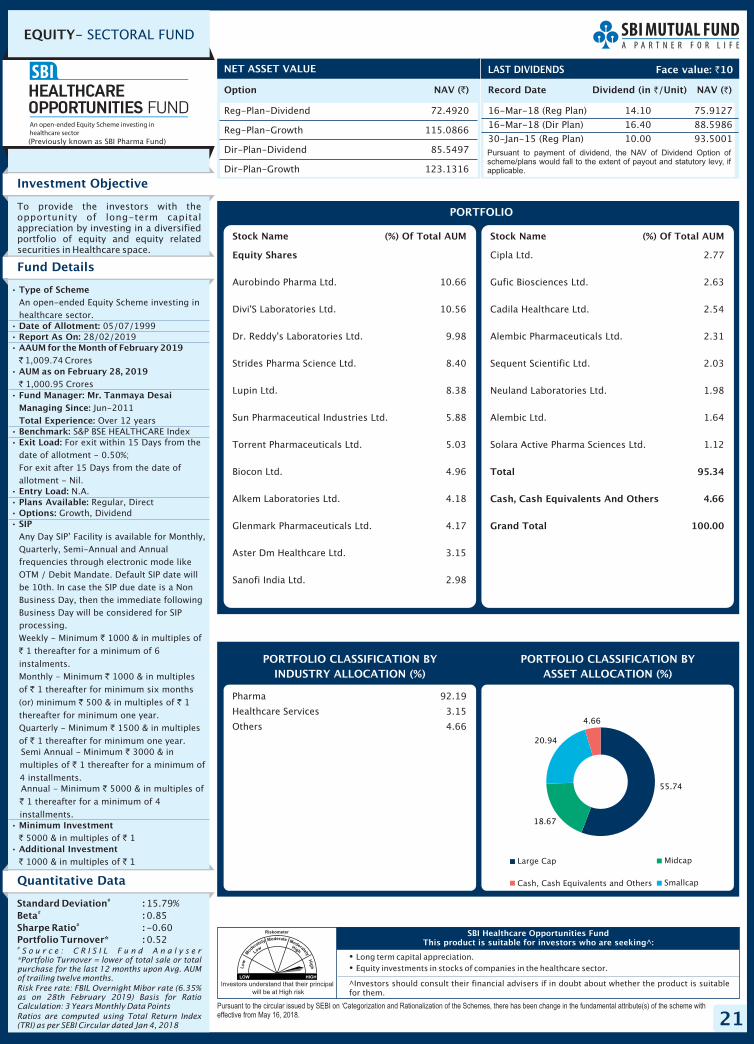
21
EQUITY- SECTORAL FUND
Option NAV ( )`
Reg-Plan-Dividend 72.4920
Reg-Plan-Growth 115.0866
Dir-Plan-Dividend 85.5497
Dir-Plan-Growth 123.1316
NET ASSET VALUE
Record Date Dividend NAV ( )`(in /Unit)`
16-Mar-18 (Reg Plan) 14.10 75.9127
16-Mar-18 (Dir Plan) 16.40 88.5986
30-Jan-15 (Reg Plan) 10.00 93.5001
LAST DIVIDENDS
Investors understand that their principal
will be at High risk
�
�
Long term capital appreciation.Equity investments in stocks of companies in the healthcare sector.
Pursuant to the circular issued by SEBI on ‘Categorization and Rationalization of the Schemes, there has been change in the fundamental attribute(s) of the scheme witheffective from May 16, 2018.
SBI Healthcare Opportunities FundThis product is suitable for investors who are seeking^:
Face value: 10`
Investment Objective
Quantitative Data
To provide the investors with theopportunity of long-term capitalappreciation by investing in a diversifiedportfolio of equity and equity relatedsecurities in Healthcare space.
Fund Details
Standard Deviation :Beta :Sharpe Ratio :Portfolio Turnover* :
#
#
#
15.79%0.85-0.600.52
#S o u r c e : C R I S I L F u n d A n a l y s e r
*Portfolio Turnover = lower of total sale or totalpurchase for the last 12 months upon Avg. AUMof trailing twelve months.
Risk Free rate: FBIL Overnight Mibor rate (6.35%as on 28th February 2019) Basis for RatioCalculation: 3 Years Monthly Data Points
Ratios are computed using Total Return Index(TRI) as per SEBI Circular dated Jan 4, 2018
PORTFOLIO CLASSIFICATION BY(%)ASSET ALLOCATION
Pharma 92.19
Healthcare Services 3.15
Others 4.66
Pursuant to payment of dividend, the NAV of Dividend Option ofscheme/plans would fall to the extent of payout and statutory levy, ifapplicable.
•
•
•
•
•
•
•
•
•
•
•
•
•
•
Type of Scheme
Date of Allotment:Report As On:AAUM for the February 2019
AUM as on February 28, 2019
Fund Manager: Mr. Tanmaya DesaiManaging Since:
Total Experience:Benchmark:Exit Load:
Entry Load:Plans Available:Options:SIP
Minimum Investment
Additional Investment
An open-ended Equity Scheme investing inhealthcare sector.
05/07/199928/02/2019
1,009.74 Crores
1,000.95 Crores
Jun-2011Over 12 years
S&P BSE HEALTHCARE IndexFor exit within 15 Days from the
date of allotment - 0.50%;For exit after 15 Days from the date ofallotment - Nil.
N.A.Regular, Direct
Growth, Dividend
Any Day SIP’ Facility is available for Monthly,Quarterly, Semi-Annual and Annualfrequencies through electronic mode likeOTM / Debit Mandate. Default SIP date willbe 10th. In case the SIP due date is a NonBusiness Day, then the immediate followingBusiness Day will be considered for SIPprocessing.Weekly - Minimum 1000 & in multiples of
1 thereafter for a minimum of 6
instalments.Monthly - Minimum 1000 & in multiples
of 1 thereafter for minimum six months
(or) minimum 500 & in multiples of 1
thereafter for minimum one year.Quarterly - Minimum 1500 & in multiples
of 1 thereafter for minimum one year.Semi Annual - Minimum 3000 & in
multiples of 1 thereafter for a minimum of
4 installments.Annual - Minimum 5000 & in multiples of
1 thereafter for a minimum of 4
installments.
5000 & in multiples of 1
1000 & in multiples of
Month of`
`
`
`
`
`
` `
`
`
`
`
`
`
` `
` ` 1
PORTFOLIO CLASSIFICATION BYINDUSTRY ALLOCATION (%)
PORTFOLIO
Equity Shares
Aurobindo Pharma Ltd. 10.66
Divi'S Laboratories Ltd. 10.56
Dr. Reddy's Laboratories Ltd. 9.98
Strides Pharma Science Ltd. 8.40
Lupin Ltd. 8.38
Sun Pharmaceutical Industries Ltd. 5.88
Torrent Pharmaceuticals Ltd. 5.03
Biocon Ltd. 4.96
Alkem Laboratories Ltd. 4.18
Glenmark Pharmaceuticals Ltd. 4.17
Aster Dm Healthcare Ltd. 3.15
Sanofi India Ltd. 2.98
Stock Name (%) Of Total AUM Stock Name (%) Of Total AUM
Cipla Ltd. 2.77
Gufic Biosciences Ltd. 2.63
Cadila Healthcare Ltd. 2.54
Alembic Pharmaceuticals Ltd. 2.31
Sequent Scientific Ltd. 2.03
Neuland Laboratories Ltd. 1.98
Alembic Ltd. 1.64
Solara Active Pharma Sciences Ltd. 1.12
Total 95.34
Cash, Cash Equivalents And Others 4.66
Grand Total 100.00
(Previously known as SBI Pharma Fund)
^Investors should consult their financial advisers if in doubt about whether the product is suitablefor them.
Large Cap Midcap
Cash, Cash Equivalents and Others Smallcap
55.74
18.67
20.94
4.66

22
EQUITY- SECTORAL FUND
Option NAV ( )`
Reg-Plan-Dividend 14.5416
Reg-Plan-Growth 16.1957
Dir-Plan-Dividend 15.0282
Dir-Plan-Growth 16.8162
NET ASSET VALUE
�
�
Long term capital appreciation.Investment predominantly in a portfolio of equity & equity related instruments of companies engagedin banking & financial services sector.
Pursuant to the circular issued by SEBI on ‘Categorization and Rationalization of the Schemes, there has been change in the fundamental attribute(s) of the schemewith effective from May 16, 2018.
SBI Banking & Financial Services FundThis product is suitable for investors who are seeking^:
Investment Objective
The investment objective of the scheme isto genera te long-te rm cap i ta lappreciation to unit holders from aportfolio that is invested predominantlyin equity and equity related securities ofcompanies engaged in banking andfinancial services. (However, there can beno assurance that the investmentobjective of the Scheme will be realized.)
Fund Details
PORTFOLIO CLASSIFICATION BY(%)ASSET ALLOCATION
Financial Services 93.81Others 6.19
•
•
•
•
•
•
•
•
•
•
•
•
•
•
Type of Scheme
Date of Allotment:Report As On:AAUM for the February 2019
AUM as on February 28, 2019
Fund Manager: Ms. Sohini AndaniManaging Since:Total Experience:Benchmark:Exit Load:
Entry Load:Plans Available:Options:SIP
Minimum Investment
Additional Investment
An open-ended Equity Scheme investing inBanking and Financial Services sector.
26/02/201528/02/2019
628.64 Crores
632.24 Crores
Feb-2015Over 23 years
Nifty Financial Services Index
For exit within 12 months from the date ofallotment - 1.00%;For exit after 12 months from the date ofallotment - Nil
N.A.Regular, Direct
Growth, Dividend
Any Day SIP’ Facility is available for Monthly,Quarterly, Semi-Annual and Annualfrequencies through electronic mode likeOTM / Debit Mandate. Default SIP date willbe 10th. In case the SIP due date is a NonBusiness Day, then the immediate followingBusiness Day will be considered for SIPprocessing.Weekly - Minimum 1000 & in multiples of
1 thereafter for a minimum of 6instalments.Monthly – Minimum 1000 & in multiples of1 thereafter for minimum 6months or
Minimum 500 & in multiples of 1thereafter for minimum 12monthsQuarterly - Minimum 1500 & in multiplesof 1 thereafter for minimum one year.Semi Annual - Minimum 3000 & inmultiples of 1 thereafter for a minimum of4 installments.Annual - Minimum 5000 & in multiples of
1 thereafter for a minimum of 4installments.
5000 & in multiples of 1
1000 & in multiples of 1
Month of`
`
``
``
` `
``
``
``
` `
` `
PORTFOLIO CLASSIFICATION BYINDUSTRY ALLOCATION (%)
^Investors should consult their financial advisers if in doubt about whether the product is suitablefor them.
PORTFOLIO
Equity Shares
Total 93.81
Cash, Cash Equivalents And Others 6.19
Grand Total 100.00
ICICI Bank Ltd. 13.06
Gruh Finance Ltd. 10.29
HDFC Bank Ltd. 10.17
Kotak Mahindra Bank Ltd. 9.80
Axis Bank Ltd. 9.78
State Bank Of India 8.78
AU Small Finance Bank Ltd. 6.22
PNB Housing Finance Ltd. 4.34
Muthoot Capital Services Ltd. 4.12
Bajaj Finance Ltd. 3.86
Equitas Holdings Ltd. 3.60
Yes Bank Ltd. 2.93
Muthoot Finance Ltd. 2.78
Mahindra & Mahindra Financial Services Ltd. 2.74
Aavas Financiers Ltd. 1.36
Stock Name (%) Of Total AUM
Investors understand that their principal
will be at High risk
Quantitative Data
Standard Deviation :Beta :Sharpe Ratio :Portfolio Turnover* :
#
#
#
17.99%1.001.042.03
#S o u r c e : C R I S I L F u n d A n a l y s e r
*Portfolio Turnover = lower of total sale or totalpurchase for the last 12 months upon Avg. AUMof trailing twelve months.
Risk Free rate: FBIL Overnight Mibor rate (6.35%as on 28th February 2019) Basis for RatioCalculation: 3 Years Monthly Data Points
Ratios are computed using Total Return Index(TRI) as per SEBI Circular dated Jan 4, 2018
Record Date Dividend NAV ( )`(in /Unit)`
16-Mar-18 (Reg Plan) 1.50 13.1746
16-Mar-18 (Dir Plan) 1.60 13.4469
LAST DIVIDENDS Face value: 10`
Pursuant to payment of dividend, the NAV of Dividend Option ofscheme/plans would fall to the extent of payout and statutory levy, ifapplicable.
Large Cap Midcap
Cash, Cash Equivalents and Others Smallcap
58.3626.37
9.08
6.19
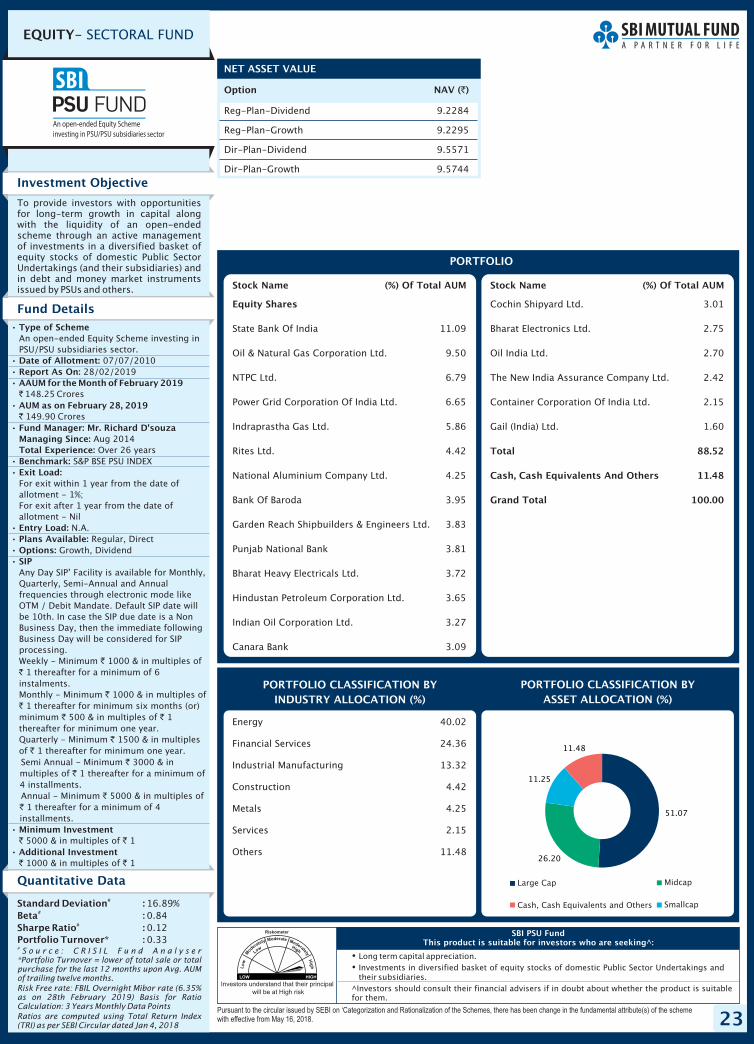
23
EQUITY- SECTORAL FUND
Option NAV ( )`
Reg-Plan-Dividend 9.2284
Reg-Plan-Growth 9.2295
Dir-Plan-Dividend 9.5571
Dir-Plan-Growth 9.5744
NET ASSET VALUE
�
�
Long term capital appreciation.Investments in diversified basket of equity stocks of domestic Public Sector Undertakings andtheir subsidiaries.
Pursuant to the circular issued by SEBI on ‘Categorization and Rationalization of the Schemes, there has been change in the fundamental attribute(s) of the schemewith effective from May 16, 2018.
SBI PSU FundThis product is suitable for investors who are seeking^:
Investment Objective
Quantitative Data
To provide investors with opportunitiesfor long-term growth in capital alongwith the liquidity of an open-endedscheme through an active managementof investments in a diversified basket ofequity stocks of domestic Public SectorUndertakings (and their subsidiaries) andin debt and money market instrumentsissued by PSUs and others.
Fund Details
Standard Deviation :Beta :Sharpe Ratio :Portfolio Turnover* :
#
#
#
16.89%0.840.120.33
#S o u r c e : C R I S I L F u n d A n a l y s e r
*Portfolio Turnover = lower of total sale or totalpurchase for the last 12 months upon Avg. AUMof trailing twelve months.
Risk Free rate: FBIL Overnight Mibor rate (6.35%as on 28th February 2019) Basis for RatioCalculation: 3 Years Monthly Data Points
Ratios are computed using Total Return Index(TRI) as per SEBI Circular dated Jan 4, 2018
PORTFOLIO CLASSIFICATION BY(%)ASSET ALLOCATION
Energy 40.02
Financial Services 24.36
Industrial Manufacturing 13.32
Construction 4.42
Metals 4.25
Services 2.15
Others 11.48
•
•
•
•
•
•
•
•
•
•
•
•
•
•
Type of Scheme
Date of Allotment:Report As On:AAUM for the February 2019
AUM as on February 28, 2019
Fund Manager: Mr. Richard D'souzaManaging Since:Total Experience:Benchmark:Exit Load:
Entry Load:Plans Available:Options:SIP
Minimum Investment
Additional Investment
An open-ended Equity Scheme investing inPSU/PSU subsidiaries sector.
07/07/201028/02/2019
148.25 Crores
149.90 Crores
Aug 2014Over 26 years
S&P BSE PSU INDEX
For exit within 1 year from the date ofallotment - 1%;For exit after 1 year from the date ofallotment - Nil
N.A.Regular, Direct
Growth, Dividend
Any Day SIP’ Facility is available for Monthly,Quarterly, Semi-Annual and Annualfrequencies through electronic mode likeOTM / Debit Mandate. Default SIP date willbe 10th. In case the SIP due date is a NonBusiness Day, then the immediate followingBusiness Day will be considered for SIPprocessing.Weekly - Minimum 1000 & in multiples of
1 thereafter for a minimum of 6instalments.Monthly - Minimum 1000 & in multiples of
1 thereafter for minimum six months (or)minimum 500 & in multiples of 1thereafter for minimum one year.Quarterly - Minimum 1500 & in multiplesof 1 thereafter for minimum one year.Semi Annual - Minimum 3000 & inmultiples of 1 thereafter for a minimum of4 installments.Annual - Minimum 5000 & in multiples of
1 thereafter for a minimum of 4installments.
5000 & in multiples of 1
1000 & in multiples of 1
Month of`
`
`
`
`
`
` `
`
`
`
`
`
`
` `
` `
PORTFOLIO CLASSIFICATION BYINDUSTRY ALLOCATION (%)
PORTFOLIO
Equity Shares
State Bank Of India 11.09
Oil & Natural Gas Corporation Ltd. 9.50
NTPC Ltd. 6.79
Power Grid Corporation Of India Ltd. 6.65
Indraprastha Gas Ltd. 5.86
Rites Ltd. 4.42
National Aluminium Company Ltd. 4.25
Bank Of Baroda 3.95
Garden Reach Shipbuilders & Engineers Ltd. 3.83
Punjab National Bank 3.81
Bharat Heavy Electricals Ltd. 3.72
Hindustan Petroleum Corporation Ltd. 3.65
Indian Oil Corporation Ltd. 3.27
Canara Bank 3.09
Stock Name (%) Of Total AUM Stock Name (%) Of Total AUM
Cochin Shipyard Ltd. 3.01
Bharat Electronics Ltd. 2.75
Oil India Ltd. 2.70
The New India Assurance Company Ltd. 2.42
Container Corporation Of India Ltd. 2.15
Gail (India) Ltd. 1.60
Total 88.52
Cash, Cash Equivalents And Others 11.48
Grand Total 100.00
^Investors should consult their financial advisers if in doubt about whether the product is suitablefor them.
Investors understand that their principal
will be at High risk
Large Cap Midcap
Cash, Cash Equivalents and Others Smallcap
51.07
26.20
11.25
11.48
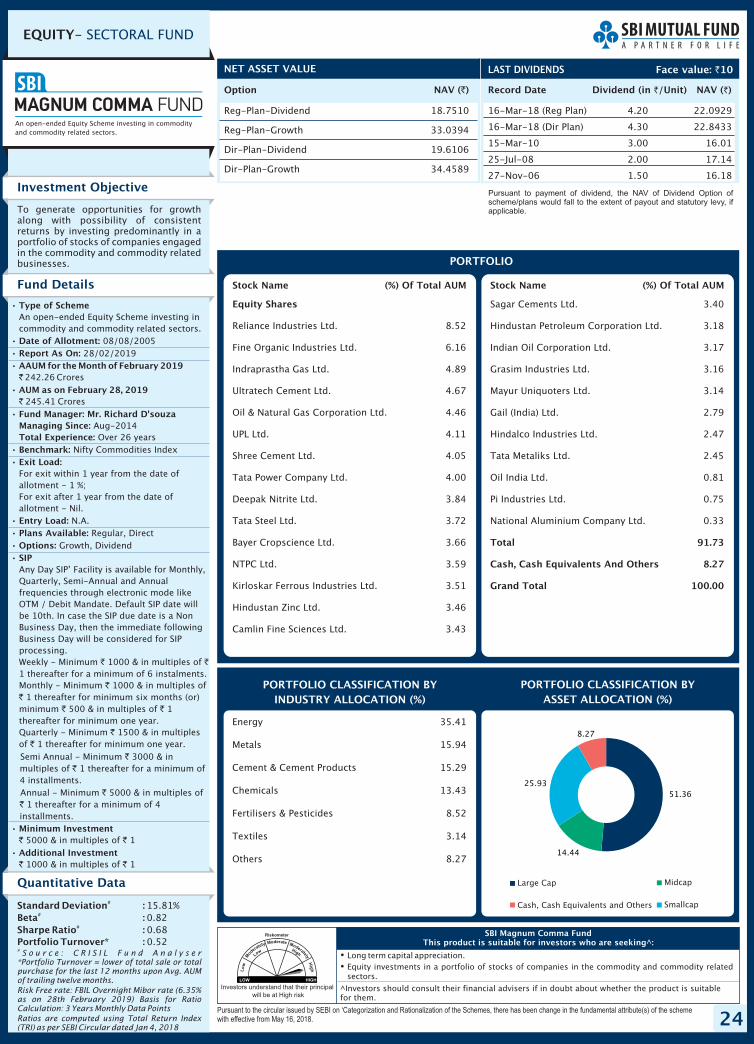
24
EQUITY- SECTORAL FUND
Option NAV ( )`
Reg-Plan-Dividend 18.7510
Reg-Plan-Growth 33.0394
Dir-Plan-Dividend 19.6106
Dir-Plan-Growth 34.4589
NET ASSET VALUE
Record Date Dividend NAV ( )`(in /Unit)`
16-Mar-18 (Reg Plan) 4.20 22.0929
16-Mar-18 (Dir Plan) 4.30 22.8433
15-Mar-10 3.00 16.01
25-Jul-08 2.00 17.14
27-Nov-06 1.50 16.18
LAST DIVIDENDS
�
�
Long term capital appreciation.Equity investments in a portfolio of stocks of companies in the commodity and commodity relatedsectors.
Pursuant to the circular issued by SEBI on ‘Categorization and Rationalization of the Schemes, there has been change in the fundamental attribute(s) of the schemewith effective from May 16, 2018.
SBI Magnum Comma FundThis product is suitable for investors who are seeking^:
Face value: 10`
Investment Objective
Quantitative Data
To generate opportunities for growthalong with possibility of consistentreturns by investing predominantly in aportfolio of stocks of companies engagedin the commodity and commodity relatedbusinesses.
Fund Details
Standard Deviation :Beta :Sharpe Ratio :Portfolio Turnover* :
#
#
#
15.81%0.820.680.52
#S o u r c e : C R I S I L F u n d A n a l y s e r
*Portfolio Turnover = lower of total sale or totalpurchase for the last 12 months upon Avg. AUMof trailing twelve months.
Risk Free rate: FBIL Overnight Mibor rate (6.35%as on 28th February 2019) Basis for RatioCalculation: 3 Years Monthly Data Points
Ratios are computed using Total Return Index(TRI) as per SEBI Circular dated Jan 4, 2018
PORTFOLIO CLASSIFICATION BY(%)ASSET ALLOCATION
Energy 35.41
Metals 15.94
Cement & Cement Products 15.29
Chemicals 13.43
Fertilisers & Pesticides 8.52
Textiles 3.14
Others 8.27
Pursuant to payment of dividend, the NAV of Dividend Option ofscheme/plans would fall to the extent of payout and statutory levy, ifapplicable.
•
•
•
•
•
•
•
•
•
•
•
•
•
•
Type of Scheme
Date of Allotment:Report As On:AAUM for the February 2019
AUM as on February 28, 2019
Fund Manager: Mr. Richard D'souzaManaging Since:Total Experience:Benchmark:Exit Load:
Entry Load:Plans Available:Options:SIP
Minimum Investment
Additional Investment
An open-ended Equity Scheme investing incommodity and commodity related sectors.
08/08/200528/02/2019
242.26 Crores
245.41 Crores
Aug-2014Over 26 years
Nifty Commodities Index
For exit within 1 year from the date ofallotment - 1 %;For exit after 1 year from the date ofallotment - Nil.
N.A.Regular, Direct
Growth, Dividend
Any Day SIP’ Facility is available for Monthly,Quarterly, Semi-Annual and Annualfrequencies through electronic mode likeOTM / Debit Mandate. Default SIP date willbe 10th. In case the SIP due date is a NonBusiness Day, then the immediate followingBusiness Day will be considered for SIPprocessing.Weekly - Minimum 1000 & in multiples of1 thereafter for a minimum of 6 instalments.Monthly - Minimum 1000 & in multiples of
1 thereafter for minimum six months (or)minimum 500 & in multiples of 1thereafter for minimum one year.Quarterly - Minimum 1500 & in multiplesof 1 thereafter for minimum one year.Semi Annual - Minimum 3000 & inmultiples of 1 thereafter for a minimum of4 installments.Annual - Minimum 5000 & in multiples of
1 thereafter for a minimum of 4installments.
5000 & in multiples of 1
1000 & in multiples of 1
Month of`
`
` `
`
`
` `
`
`
`
`
`
`
` `
` `
PORTFOLIO CLASSIFICATION BYINDUSTRY ALLOCATION (%)
PORTFOLIO
Equity Shares
Reliance Industries Ltd. 8.52
Fine Organic Industries Ltd. 6.16
Indraprastha Gas Ltd. 4.89
Ultratech Cement Ltd. 4.67
Oil & Natural Gas Corporation Ltd. 4.46
UPL Ltd. 4.11
Shree Cement Ltd. 4.05
Tata Power Company Ltd. 4.00
Deepak Nitrite Ltd. 3.84
Tata Steel Ltd. 3.72
Bayer Cropscience Ltd. 3.66
NTPC Ltd. 3.59
Kirloskar Ferrous Industries Ltd. 3.51
Hindustan Zinc Ltd. 3.46
Camlin Fine Sciences Ltd. 3.43
Stock Name (%) Of Total AUM Stock Name (%) Of Total AUM
Sagar Cements Ltd. 3.40
Hindustan Petroleum Corporation Ltd. 3.18
Indian Oil Corporation Ltd. 3.17
Grasim Industries Ltd. 3.16
Mayur Uniquoters Ltd. 3.14
Gail (India) Ltd. 2.79
Hindalco Industries Ltd. 2.47
Tata Metaliks Ltd. 2.45
Oil India Ltd. 0.81
Pi Industries Ltd. 0.75
National Aluminium Company Ltd. 0.33
Total 91.73
Cash, Cash Equivalents And Others 8.27
Grand Total 100.00
Investors understand that their principal
will be at High risk^Investors should consult their financial advisers if in doubt about whether the product is suitablefor them.
An open-ended Equity Scheme investing in commodityand commodity related sectors.
Large Cap Midcap
Cash, Cash Equivalents and Others Smallcap
51.36
14.44
25.93
8.27
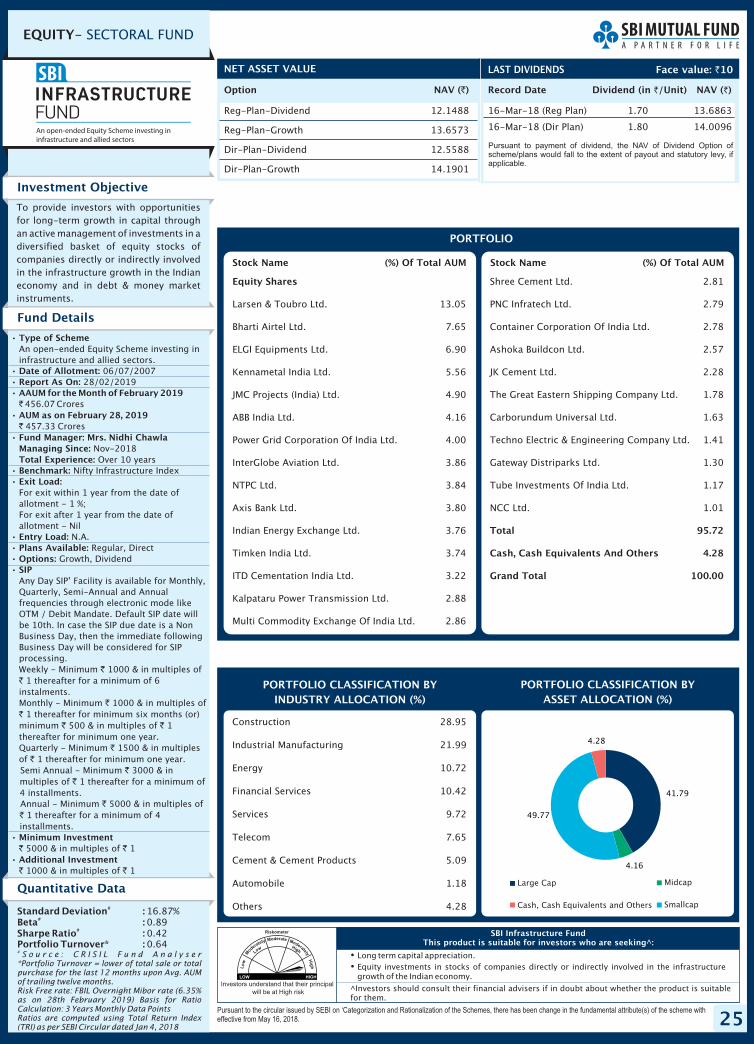
25
EQUITY- SECTORAL FUND
Option NAV ( )`
Reg-Plan-Dividend 12.1488
Reg-Plan-Growth 13.6573
Dir-Plan-Dividend 12.5588
Dir-Plan-Growth 14.1901
NET ASSET VALUE
Investors understand that their principal
will be at High risk
�
�
Long term capital appreciation.Equity investments in stocks of companies directly or indirectly involved in the infrastructuregrowth of the Indian economy.
Pursuant to the circular issued by SEBI on ‘Categorization and Rationalization of the Schemes, there has been change in the fundamental attribute(s) of the scheme witheffective from May 16, 2018.
SBI Infrastructure FundThis product is suitable for investors who are seeking^:
Investment Objective
Quantitative Data
To provide investors with opportunitiesfor long-term growth in capital throughan active management of investments in adiversified basket of equity stocks ofcompanies directly or indirectly involvedin the infrastructure growth in the Indianeconomy and in debt & money marketinstruments.
Fund Details
Standard Deviation :Beta :Sharpe Ratio :Portfolio Turnover* :
#
#
#
16.87%0.890.420.64
#S o u r c e : C R I S I L F u n d A n a l y s e r
*Portfolio Turnover = lower of total sale or totalpurchase for the last 12 months upon Avg. AUMof trailing twelve months.Risk Free rate: FBIL Overnight Mibor rate (6.35%as on 28th February 2019) Basis for RatioCalculation: 3 Years Monthly Data PointsRatios are computed using Total Return Index(TRI) as per SEBI Circular dated Jan 4, 2018
PORTFOLIO CLASSIFICATION BY(%)ASSET ALLOCATION
Construction 28.95
Industrial Manufacturing 21.99
Energy 10.72
Financial Services 10.42
Services 9.72
Telecom 7.65
Cement & Cement Products 5.09
Automobile 1.18
Others 4.28
•
•
•
•
•
•
•
•
•
•
•
•
•
•
Type of Scheme
Date of Allotment:Report As On:AAUM for the February 2019
AUM as on February 28, 2019
Fund Manager: Mrs. Nidhi ChawlaManaging Since:Total Experience:Benchmark:Exit Load:
Entry Load:Plans Available:Options:SIP
Minimum Investment
Additional Investment
An open-ended Equity Scheme investing ininfrastructure and allied sectors.
06/07/200728/02/2019
456.07 Crores
457.33 Crores
Nov-2018Over 10 years
Nifty Infrastructure Index
For exit within 1 year from the date ofallotment - 1 %;For exit after 1 year from the date ofallotment - Nil
N.A.Regular, Direct
Growth, Dividend
Any Day SIP’ Facility is available for Monthly,Quarterly, Semi-Annual and Annualfrequencies through electronic mode likeOTM / Debit Mandate. Default SIP date willbe 10th. In case the SIP due date is a NonBusiness Day, then the immediate followingBusiness Day will be considered for SIPprocessing.Weekly - Minimum 1000 & in multiples of
1 thereafter for a minimum of 6instalments.Monthly - Minimum 1000 & in multiples of
1 thereafter for minimum six months (or)minimum 500 & in multiples of 1thereafter for minimum one year.Quarterly - Minimum 1500 & in multiplesof 1 thereafter for minimum one year.Semi Annual - Minimum 3000 & inmultiples of 1 thereafter for a minimum of4 installments.Annual - Minimum 5000 & in multiples of
1 thereafter for a minimum of 4installments.
5000 & in multiples of 1
1000 & in multiples of 1
Month of`
`
`
`
`
`
` `
`
`
`
`
`
`
` `
` `
PORTFOLIO CLASSIFICATION BYINDUSTRY ALLOCATION (%)
PORTFOLIO
Equity Shares
Larsen & Toubro Ltd. 13.05
Bharti Airtel Ltd. 7.65
ELGI Equipments Ltd. 6.90
Kennametal India Ltd. 5.56
JMC Projects (India) Ltd. 4.90
ABB India Ltd. 4.16
Power Grid Corporation Of India Ltd. 4.00
InterGlobe Aviation Ltd. 3.86
NTPC Ltd. 3.84
Axis Bank Ltd. 3.80
Indian Energy Exchange Ltd. 3.76
Timken India Ltd. 3.74
ITD Cementation India Ltd. 3.22
Kalpataru Power Transmission Ltd. 2.88
Multi Commodity Exchange Of India Ltd. 2.86
Stock Name (%) Of Total AUM Stock Name (%) Of Total AUM
Shree Cement Ltd. 2.81
PNC Infratech Ltd. 2.79
Container Corporation Of India Ltd. 2.78
Ashoka Buildcon Ltd. 2.57
JK Cement Ltd. 2.28
The Great Eastern Shipping Company Ltd. 1.78
Carborundum Universal Ltd. 1.63
Techno Electric & Engineering Company Ltd. 1.41
Gateway Distriparks Ltd. 1.30
Tube Investments Of India Ltd. 1.17
NCC Ltd. 1.01
Total 95.72
Cash, Cash Equivalents And Others 4.28
Grand Total 100.00
^Investors should consult their financial advisers if in doubt about whether the product is suitablefor them.
Record Date Dividend NAV ( )`(in /Unit)`
16-Mar-18 (Reg Plan) 1.70 13.6863
16-Mar-18 (Dir Plan) 1.80 14.0096
LAST DIVIDENDS Face value: 10`
Pursuant to payment of dividend, the NAV of Dividend Option ofscheme/plans would fall to the extent of payout and statutory levy, ifapplicable.
Large Cap Midcap
Cash, Cash Equivalents and Others Smallcap
41.79
4.16
49.77
4.28
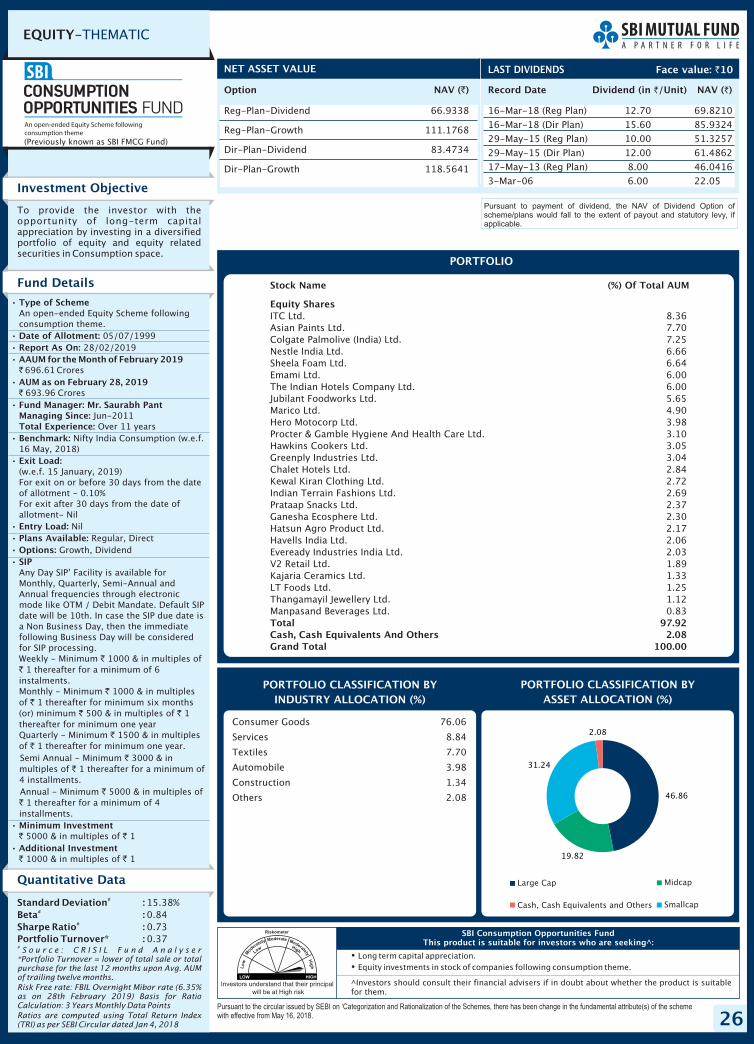
26
EQUITY-THEMATIC
Option NAV ( )`
Reg-Plan-Dividend 66.9338
Reg-Plan-Growth 111.1768
Dir-Plan-Dividend 83.4734
Dir-Plan-Growth 118.5641
NET ASSET VALUE
Record Date Dividend NAV ( )`(in /Unit)`
16-Mar-18 (Reg Plan) 12.70 69.8210
16-Mar-18 (Dir Plan) 15.60 85.9324
29-May-15 (Reg Plan) 10.00 51.3257
29-May-15 (Dir Plan) 12.00 61.4862
17-May-13 (Reg Plan) 8.00 46.0416
3-Mar-06 6.00 22.05
LAST DIVIDENDS
�
�
Long term capital appreciation.Equity investments in stock of companies following consumption theme.
Pursuant to the circular issued by SEBI on ‘Categorization and Rationalization of the Schemes, there has been change in the fundamental attribute(s) of the schemewith effective from May 16, 2018.
SBI Consumption Opportunities FundThis product is suitable for investors who are seeking^:
Face value: 10`
Investment Objective
Quantitative Data
To provide the investor with theopportunity of long-term capitalappreciation by investing in a diversifiedportfolio of equity and equity relatedsecurities in Consumption space.
Fund Details
Standard Deviation :Beta :Sharpe Ratio :Portfolio Turnover* :
#
#
#
15.38%0.840.730.37
#S o u r c e : C R I S I L F u n d A n a l y s e r
*Portfolio Turnover = lower of total sale or totalpurchase for the last 12 months upon Avg. AUMof trailing twelve months.
Risk Free rate: FBIL Overnight Mibor rate (6.35%as on 28th February 2019) Basis for RatioCalculation: 3 Years Monthly Data Points
Ratios are computed using Total Return Index(TRI) as per SEBI Circular dated Jan 4, 2018
PORTFOLIO CLASSIFICATION BY(%)ASSET ALLOCATION
•
•
•
•
•
•
•
•
•
•
•
•
•
•
Type of Scheme
Date of Allotment:Report As On:AAUM for the February 2019
AUM as on February 28, 2019
Fund Manager: Mr. Saurabh PantManaging Since:Total Experience:Benchmark:
Exit Load:
Entry Load:Plans Available:Options:SIP
Minimum Investment
Additional Investment
An open-ended Equity Scheme followingconsumption theme.
05/07/199928/02/2019
696.61 Crores
693.96 Crores
Jun-2011Over 11 years
Nifty India Consumption (w.e.f.16 May, 2018)
(w.e.f. 15 January, 2019)For exit on or before 30 days from the dateof allotment - 0.10%For exit after 30 days from the date ofallotment- Nil
NilRegular, Direct
Growth, Dividend
Any Day SIP’ Facility is available forMonthly, Quarterly, Semi-Annual andAnnual frequencies through electronicmode like OTM / Debit Mandate. Default SIPdate will be 10th. In case the SIP due date isa Non Business Day, then the immediatefollowing Business Day will be consideredfor SIP processing.Weekly - Minimum 1000 & in multiples of
1 thereafter for a minimum of 6instalments.Monthly - Minimum 1000 & in multiplesof 1 thereafter for minimum six months(or) minimum 500 & in multiples of 1thereafter for minimum one yearQuarterly - Minimum 1500 & in multiplesof 1 thereafter for minimum one year.Semi Annual - Minimum 3000 & inmultiples of 1 thereafter for a minimum of4 installments.Annual - Minimum 5000 & in multiples of
1 thereafter for a minimum of 4installments.
5000 & in multiples of 1
1000 & in multiples of 1
Month of`
`
`
`
`
`
` `
`
`
`
`
`
`
` `
` `
Consumer Goods 76.06
Services 8.84
Textiles 7.70
Automobile 3.98
Construction 1.34
Others 2.08
PORTFOLIO CLASSIFICATION BYINDUSTRY ALLOCATION (%)
PORTFOLIO
Equity Shares
Total 97.92Cash, Cash Equivalents And Others 2.08Grand Total 100.00
ITC Ltd. 8.36Asian Paints Ltd. 7.70Colgate Palmolive (India) Ltd. 7.25Nestle India Ltd. 6.66Sheela Foam Ltd. 6.64Emami Ltd. 6.00The Indian Hotels Company Ltd. 6.00Jubilant Foodworks Ltd. 5.65Marico Ltd. 4.90Hero Motocorp Ltd. 3.98Procter & Gamble Hygiene And Health Care Ltd. 3.10Hawkins Cookers Ltd. 3.05Greenply Industries Ltd. 3.04Chalet Hotels Ltd. 2.84Kewal Kiran Clothing Ltd. 2.72Indian Terrain Fashions Ltd. 2.69Prataap Snacks Ltd. 2.37Ganesha Ecosphere Ltd. 2.30Hatsun Agro Product Ltd. 2.17Havells India Ltd. 2.06Eveready Industries India Ltd. 2.03V2 Retail Ltd. 1.89Kajaria Ceramics Ltd. 1.33LT Foods Ltd. 1.25Thangamayil Jewellery Ltd. 1.12Manpasand Beverages Ltd. 0.83
Stock Name (%) Of Total AUM
Investors understand that their principal
will be at High risk
^Investors should consult their financial advisers if in doubt about whether the product is suitablefor them.
Pursuant to payment of dividend, the NAV of Dividend Option ofscheme/plans would fall to the extent of payout and statutory levy, ifapplicable.
(Previously known as SBI FMCG Fund)
Large Cap Midcap
Cash, Cash Equivalents and Others Smallcap
46.86
19.82
31.24
2.08
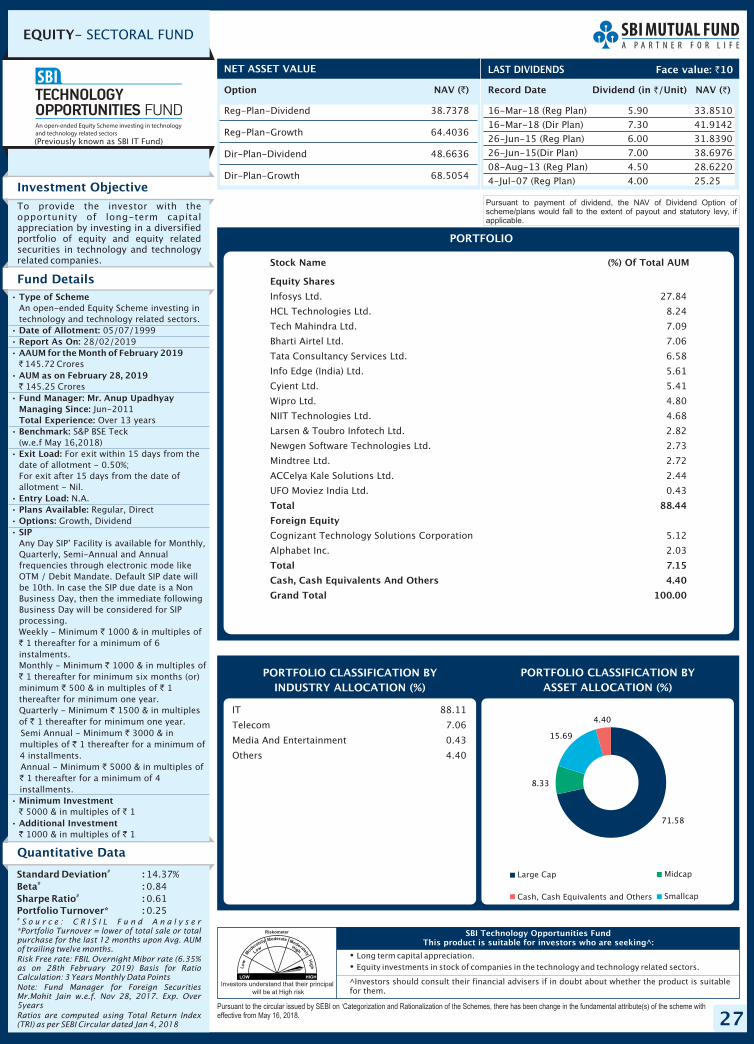
27
EQUITY- SECTORAL FUND
Option NAV ( )`
Reg-Plan-Dividend 38.7378
Reg-Plan-Growth 64.4036
Dir-Plan-Dividend 48.6636
Dir-Plan-Growth 68.5054
NET ASSET VALUE
Record Date Dividend NAV ( )`(in /Unit)`
16-Mar-18 (Reg Plan) 5.90 33.8510
16-Mar-18 (Dir Plan) 7.30 41.9142
26-Jun-15 (Reg Plan) 6.00 31.8390
26-Jun-15(Dir Plan) 7.00 38.6976
08-Aug-13 (Reg Plan) 4.50 28.6220
4-Jul-07 (Reg Plan) 4.00 25.25
LAST DIVIDENDS
�
�
Long term capital appreciation.Equity investments in stock of companies in the technology and technology related sectors.
Pursuant to the circular issued by SEBI on ‘Categorization and Rationalization of the Schemes, there has been change in the fundamental attribute(s) of the scheme witheffective from May 16, 2018.
SBI Technology Opportunities FundThis product is suitable for investors who are seeking^:
Face value: 10`
Investment Objective
Quantitative Data
To provide the investor with theopportunity of long-term capitalappreciation by investing in a diversifiedportfolio of equity and equity relatedsecurities in technology and technologyrelated companies.
Standard Deviation :Beta :Sharpe Ratio :Portfolio Turnover* :
#
#
#
14.37%0.840.610.25
#S o u r c e : C R I S I L F u n d A n a l y s e r
*Portfolio Turnover = lower of total sale or totalpurchase for the last 12 months upon Avg. AUMof trailing twelve months.
Risk Free rate: FBIL Overnight Mibor rate () Basis for Ratio
Calculation: 3 Years Monthly Data Points
Note: Fund Manager for Foreign SecuritiesMr.Mohit Jain w.e.f. Nov 28, 2017. Exp. Over5years
Ratios are computed using Total Return Index(TRI) as per SEBI Circular dated Jan 4, 2018
6.35%as on 28th February 2019
PORTFOLIO CLASSIFICATION BY(%)ASSET ALLOCATION
IT 88.11
Telecom 7.06
Media And Entertainment 0.43
Others 4.40
Pursuant to payment of dividend, the NAV of Dividend Option ofscheme/plans would fall to the extent of payout and statutory levy, ifapplicable.
Fund Details•
•
•
•
•
•
•
•
•
•
•
•
•
•
Type of Scheme
Date of Allotment:Report As On:AAUM for the February 2019
AUM as on February 28, 2019
Fund Manager: Mr. Anup UpadhyayManaging Since:Total Experience:Benchmark:
Exit Load:
Entry Load:Plans Available:Options:SIP
Minimum Investment
Additional Investment
An open-ended Equity Scheme investing intechnology and technology related sectors.
05/07/199928/02/2019
145.72 Crores
145.25 Crores
Jun-2011Over 13 years
S&P BSE Teck(w.e.f May 16,2018)
For exit within 15 days from thedate of allotment - 0.50%;For exit after 15 days from the date ofallotment - Nil.
N.A.Regular, Direct
Growth, Dividend
Any Day SIP’ Facility is available for Monthly,Quarterly, Semi-Annual and Annualfrequencies through electronic mode likeOTM / Debit Mandate. Default SIP date willbe 10th. In case the SIP due date is a NonBusiness Day, then the immediate followingBusiness Day will be considered for SIPprocessing.Weekly - Minimum 1000 & in multiples of
1 thereafter for a minimum of 6instalments.Monthly - Minimum 1000 & in multiples of
1 thereafter for minimum six months (or)minimum 500 & in multiples of 1thereafter for minimum one year.Quarterly - Minimum 1500 & in multiplesof 1 thereafter for minimum one year.Semi Annual - Minimum 3000 & inmultiples of 1 thereafter for a minimum of4 installments.Annual - Minimum 5000 & in multiples of
1 thereafter for a minimum of 4installments.
5000 & in multiples of 1
1000 & in multiples of 1
Month of`
`
`
`
`
`
` `
`
`
`
`
`
`
` `
` `
PORTFOLIO CLASSIFICATION BYINDUSTRY ALLOCATION (%)
PORTFOLIO
Equity Shares
Total 88.44
Foreign Equity
Total 7.15
Cash, Cash Equivalents And Others 4.40
Grand Total 100.00
Infosys Ltd. 27.84
HCL Technologies Ltd. 8.24
Tech Mahindra Ltd. 7.09
Bharti Airtel Ltd. 7.06
Tata Consultancy Services Ltd. 6.58
Info Edge (India) Ltd. 5.61
Cyient Ltd. 5.41
Wipro Ltd. 4.80
NIIT Technologies Ltd. 4.68
Larsen & Toubro Infotech Ltd. 2.82
Newgen Software Technologies Ltd. 2.73
Mindtree Ltd. 2.72
ACCelya Kale Solutions Ltd. 2.44
UFO Moviez India Ltd. 0.43
Cognizant Technology Solutions Corporation 5.12
Alphabet Inc. 2.03
Stock Name (%) Of Total AUM
(Previously known as SBI IT Fund)
^Investors should consult their financial advisers if in doubt about whether the product is suitablefor them.
Investors understand that their principal
will be at High risk
Large Cap Midcap
Cash, Cash Equivalents and Others Smallcap
71.58
8.33
15.69
4.40
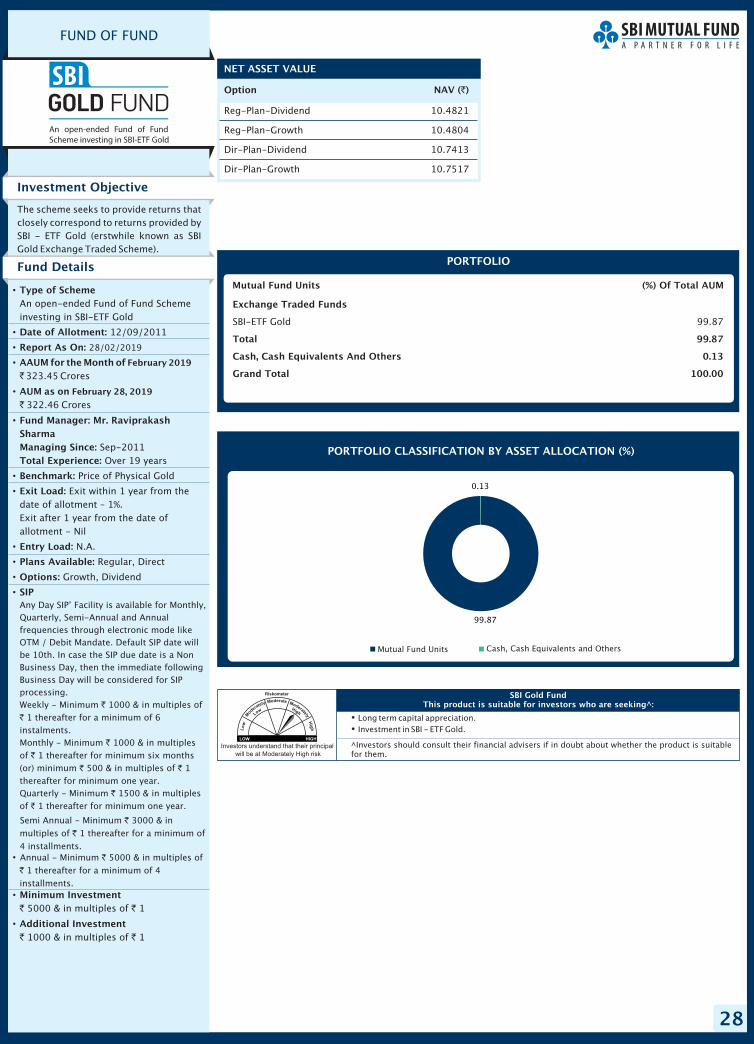
28
Option NAV ( )`
Reg-Plan-Dividend 10.4821
Reg-Plan-Growth 10.4804
Dir-Plan-Dividend 10.7413
Dir-Plan-Growth 10.7517
NET ASSET VALUE
Investors understand that their principal
will be at Moderately High risk
�
�
Long term capital appreciation.Investment in SBI - ETF Gold.
SBI Gold FundThis product is suitable for investors who are seeking^:
Investment Objective
The scheme seeks to provide returns thatclosely correspond to returns provided bySBI - ETF Gold (erstwhile known as SBIGold Exchange Traded Scheme).
Fund Details
PORTFOLIO CLASSIFICATION BY (%)ASSET ALLOCATION
•
•
•
•
•
•
•
•
•
•
•
•
•
•
•
Type of Scheme
Date of Allotment:
Report As On:
AAUM for the
AUM as on
Fund Manager: Mr. RaviprakashSharmaManaging Since:Total Experience:
Benchmark:
Exit Load:
Entry Load:
Plans Available:
Options:
SIP
Minimum Investment
Additional Investment
An open-ended Fund of Fund Schemeinvesting in SBI-ETF Gold
12/09/2011
323.45 Crores
322.46 Crores
Sep-2011Over 19 years
Price of Physical Gold
Exit within 1 year from thedate of allotment – 1%.Exit after 1 year from the date ofallotment - Nil
N.A.
Regular, Direct
Growth, Dividend
5000 & in multiples of 1
1000 & in multiples of 1
28/02/2019
Any Day SIP’ Facility is available for Monthly,Quarterly, Semi-Annual and Annualfrequencies through electronic mode likeOTM / Debit Mandate. Default SIP date willbe 10th. In case the SIP due date is a NonBusiness Day, then the immediate followingBusiness Day will be considered for SIPprocessing.Weekly - Minimum 1000 & in multiples of
1 thereafter for a minimum of 6instalments.Monthly - Minimum 1000 & in multiplesof 1 thereafter for minimum six months(or) minimum 500 & in multiples of 1thereafter for minimum one year.Quarterly - Minimum 1500 & in multiplesof 1 thereafter for minimum one year.
Semi Annual - Minimum 3000 & in
multiples of 1 thereafter for a minimum of
4 installments.Annual - Minimum 5000 & in multiples of
1 thereafter for a minimum of 4
installments.
Month of February 2019
February 28, 2019
`
`
` `
` `
`
`
`
`
` `
`
`
`
`
`
`
Mutual Fund Units Cash, Cash Equivalents and Others
PORTFOLIO
Exchange Traded Funds
Total 99.87
Cash, Cash Equivalents And Others 0.13
Grand Total 100.00
SBI-ETF Gold 99.87
Mutual Fund Units (%) Of Total AUM
^Investors should consult their financial advisers if in doubt about whether the product is suitablefor them.
FUND OF FUND
99.87
0.13
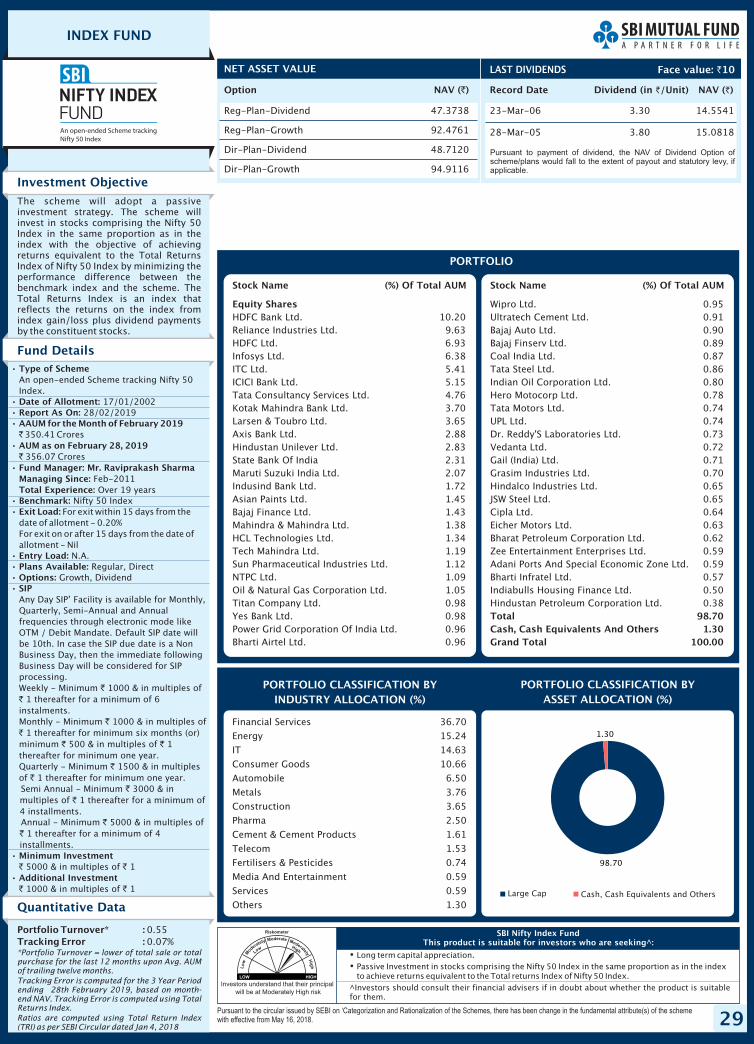
29
INDEX FUND
Option NAV ( )`
Reg-Plan-Dividend 47.3738
Reg-Plan-Growth 92.4761
Dir-Plan-Dividend 48.7120
Dir-Plan-Growth 94.9116
NET ASSET VALUE
Investors understand that their principal
will be at Moderately High risk
�
�
Long term capital appreciation.Passive Investment in stocks comprising the Nifty 50 Index in the same proportion as in the indexto achieve returns equivalent to the Total returns Index of Nifty 50 Index.
Pursuant to the circular issued by SEBI on ‘Categorization and Rationalization of the Schemes, there has been change in the fundamental attribute(s) of the schemewith effective from May 16, 2018.
SBI Nifty Index FundThis product is suitable for investors who are seeking^:
Investment Objective
Quantitative Data
The scheme will adopt a passiveinvestment strategy. The scheme willinvest in stocks comprising the Nifty 50Index in the same proportion as in theindex with the objective of achievingreturns equivalent to the Total ReturnsIndex of Nifty 50 Index by minimizing theperformance difference between thebenchmark index and the scheme. TheTotal Returns Index is an index thatreflects the returns on the index fromindex gain/loss plus dividend paymentsby the constituent stocks.
Fund Details
Portfolio Turnover* :Tracking Error :
0.550.07%
*Portfolio Turnover = lower of total sale or totalpurchase for the last 12 months upon Avg. AUMof trailing twelve months.
Tracking Error is computed for the 3 Year Periodending , based on month-end NAV. Tracking Error is computed using TotalReturns Index.
Ratios are computed using Total Return Index(TRI) as per SEBI Circular dated Jan 4, 2018
28th February 2019
PORTFOLIO CLASSIFICATION BY(%)ASSET ALLOCATION
Financial Services 36.70
Energy 15.24
IT 14.63
Consumer Goods 10.66
Automobile 6.50
Metals 3.76
Construction 3.65
Pharma 2.50
Cement & Cement Products 1.61
Telecom 1.53
Fertilisers & Pesticides 0.74
Media And Entertainment 0.59
Services 0.59
Others 1.30
•
•
•
•
•
•
•
•
•
•
•
•
•
•
Type of Scheme
Date of Allotment:Report As On:AAUM for the February 2019
AUM as on February 28, 2019
Fund Manager: Mr. Raviprakash SharmaManaging Since:Total Experience:Benchmark:Exit Load:
Entry Load:Plans Available:Options:SIP
Minimum Investment
Additional Investment
An open-ended Scheme tracking Nifty 50Index.
17/01/200228/02/2019
350.41 Crores
356.07 Crores
Feb-2011Over 19 years
Nifty 50 IndexFor exit within 15 days from the
date of allotment - 0.20%For exit on or after 15 days from the date ofallotment - Nil
N.A.Regular, Direct
Growth, Dividend
Any Day SIP’ Facility is available for Monthly,Quarterly, Semi-Annual and Annualfrequencies through electronic mode likeOTM / Debit Mandate. Default SIP date willbe 10th. In case the SIP due date is a NonBusiness Day, then the immediate followingBusiness Day will be considered for SIPprocessing.Weekly - Minimum 1000 & in multiples of
1 thereafter for a minimum of 6instalments.Monthly - Minimum 1000 & in multiples of
1 thereafter for minimum six months (or)minimum 500 & in multiples of 1thereafter for minimum one year.Quarterly - Minimum 1500 & in multiplesof 1 thereafter for minimum one year.Semi Annual - Minimum 3000 & inmultiples of 1 thereafter for a minimum of4 installments.Annual - Minimum 5000 & in multiples of
1 thereafter for a minimum of 4installments.
5000 & in multiples of 1
1000 & in multiples of 1
Month of`
`
`
`
`
`
` `
`
`
`
`
`
`
` `
` `
PORTFOLIO CLASSIFICATION BYINDUSTRY ALLOCATION (%)
PORTFOLIO
Equity SharesHDFC Bank Ltd. 10.20Reliance Industries Ltd. 9.63HDFC Ltd. 6.93Infosys Ltd. 6.38ITC Ltd. 5.41ICICI Bank Ltd. 5.15Tata Consultancy Services Ltd. 4.76Kotak Mahindra Bank Ltd. 3.70Larsen & Toubro Ltd. 3.65Axis Bank Ltd. 2.88Hindustan Unilever Ltd. 2.83State Bank Of India 2.31Maruti Suzuki India Ltd. 2.07Indusind Bank Ltd. 1.72Asian Paints Ltd. 1.45Bajaj Finance Ltd. 1.43Mahindra & Mahindra Ltd. 1.38HCL Technologies Ltd. 1.34Tech Mahindra Ltd. 1.19Sun Pharmaceutical Industries Ltd. 1.12NTPC Ltd. 1.09Oil & Natural Gas Corporation Ltd. 1.05Titan Company Ltd. 0.98Yes Bank Ltd. 0.98Power Grid Corporation Of India Ltd. 0.96Bharti Airtel Ltd. 0.96
Stock Name (%) Of Total AUMStock Name (%) Of Total AUM
Wipro Ltd. 0.95Ultratech Cement Ltd. 0.91Bajaj Auto Ltd. 0.90Bajaj Finserv Ltd. 0.89Coal India Ltd. 0.87Tata Steel Ltd. 0.86Indian Oil Corporation Ltd. 0.80Hero Motocorp Ltd. 0.78Tata Motors Ltd. 0.74UPL Ltd. 0.74Dr. Reddy'S Laboratories Ltd. 0.73Vedanta Ltd. 0.72Gail (India) Ltd. 0.71Grasim Industries Ltd. 0.70Hindalco Industries Ltd. 0.65JSW Steel Ltd. 0.65Cipla Ltd. 0.64Eicher Motors Ltd. 0.63Bharat Petroleum Corporation Ltd. 0.62Zee Entertainment Enterprises Ltd. 0.59Adani Ports And Special Economic Zone Ltd. 0.59Bharti Infratel Ltd. 0.57Indiabulls Housing Finance Ltd. 0.50Hindustan Petroleum Corporation Ltd. 0.38Total 98.70Cash, Cash Equivalents And Others 1.30Grand Total 100.00
^Investors should consult their financial advisers if in doubt about whether the product is suitablefor them.
Record Date Dividend NAV ( )`(in /Unit)`
23-Mar-06 3.30 14.5541
28-Mar-05 3.80 15.0818
LAST DIVIDENDS Face value: 10`
Pursuant to payment of dividend, the NAV of Dividend Option ofscheme/plans would fall to the extent of payout and statutory levy, ifapplicable.
Large Cap Cash, Cash Equivalents and Others
98.70
1.30
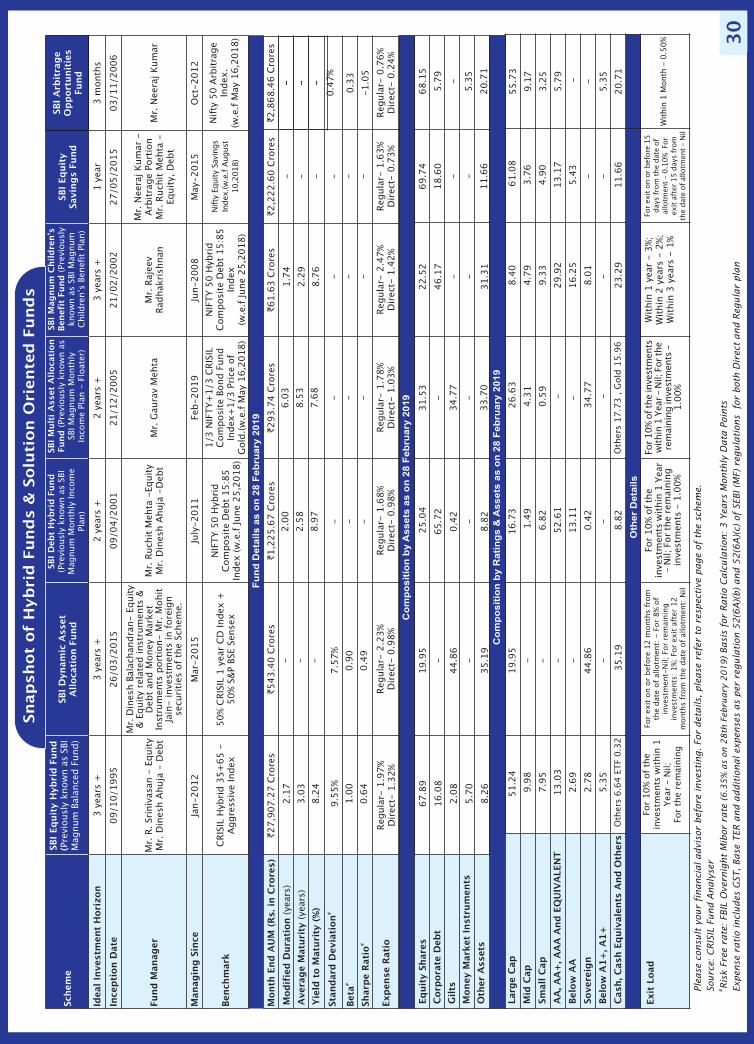
Fu
nd
Deta
ils a
s o
n 2
8 F
eb
ruary
2019
Schem
eSB
I D
ynam
ic A
sset
Alloca
tion F
und
SBI
Eq
uit
ySa
vin
gs
Fund
SBI
Arb
itra
ge
Op
port
unit
ies
Fund
Idea
l In
ves
tmen
t H
ori
zon
3ye
ars
+3
year
s+
2ye
ars
+2
year
s+
3ye
ars
+1
year
3m
onth
s
Ince
pti
on D
ate
09
/10
/19
95
26
/03
/20
15
09
/04
/20
01
21
/12
/20
05
21
/02
/20
02
27
/05
/20
15
03
/11
/20
06
Fund
Manager
Mr.
R. Sr
iniv
asan
- E
quit
yM
r. D
ines
h A
huja
- D
ebt
Mr.
Din
esh B
alac
han
dra
n-
Equit
y&
Equit
y re
late
d inst
rum
ents
&D
ebt
and M
oney
Mar
ket
Inst
rum
ents
port
ion-
Mr.
Mohit
Jain
- in
vest
men
ts in f
ore
ign
secu
riti
es o
f th
e Sc
hem
e.
Mr.
Ruch
it M
ehta
-Equit
yM
r. D
ines
h A
huja
-Deb
tM
r. G
aura
vM
ehta
Mr.
Raj
eev
Rad
hak
rish
nan
Mr.
Nee
raj K
um
ar -
Arb
itra
ge
Port
ion
Mr.
Ruch
it M
ehta
-Eq
uit
y, D
ebt
Mr.
Nee
raj K
um
ar
Managin
g S
ince
Jan-2
012
Mar
-20
15
July
-2011
Feb-2
019
Jun-2
008
May
-20
15
Oct
-2012
Ben
chm
ark
CRIS
IL H
ybri
d 3
5+
65 -
Aggre
ssiv
e In
dex
50%
CRIS
IL 1
yea
r C
D Index
+50%
S&
P BS
E Se
nse
x
NIF
TY 5
0 H
ybri
dC
om
posi
te D
ebt
15:8
5In
dex
(w
.e.f
June
25,2
018)
Snap
shot
of
Hyb
rid
Fund
s &
Solu
tion O
riente
d F
und
s
SBI
Eq
uit
y H
ybri
d F
und
(Pre
viousl
y kn
ow
nas
SBI
Mag
num
Bal
ance
d F
und)
Month
End
AU
M (
Rs.
in C
rore
s)`27,9
07.2
7 C
rore
s`543.4
0 C
rore
s`1,2
25.6
7 C
rore
s`293.7
4 C
rore
s`61.6
3 C
rore
s`2,2
22.6
0 C
rore
s`2,8
68.4
6 C
rore
s
- - -
Stand
ard
Dev
iati
on
#0.4
7%
Bet
a#
0.3
3
Sharp
e R
ati
o#
-1.0
5
Exp
ense
Rati
oReg
ula
r- 1
.97%
Dir
ect-
1.3
2%
Reg
ula
r- 2
.23%
Dir
ect-
0.9
8%
Reg
ula
r- 1
.68%
Dir
ect-
0.9
8%
Reg
ula
r- 1
.78%
Dir
ect-
1.0
3%
Reg
ula
r- 2
.47%
Dir
ect-
1.4
2%
Reg
ula
r- 1
.63%
Dir
ect-
0.7
3%
Reg
ula
r- 0
.76%
Dir
ect-
0.2
4%
2.1
7
3.0
3
8.2
4
9.5
5%
1.0
0
0.6
4
7.5
7%
0.9
0
0.4
9
- - -
- - -
- - -
- - -
- - -
2.0
0
2.5
8
8.9
7
6.0
3
8.5
3
7.6
8
1.7
4
2.2
9
8.7
6
- - -
Co
mp
osit
ion
by R
ati
ng
s &
Assets
as o
n 2
8 F
eb
ruary
2019
55.7
3
9.1
7
3.2
5
5.7
9
- -
5.3
5
20.7
1
Exit
Load
For
10
% o
f th
ein
vest
men
ts w
ithin
1Yea
r–
Nil;
For
the
rem
ainin
g
For
exit
on o
r bef
ore
12
month
s fr
om
the
dat
e of
allo
tmen
t: -
For
8%
of
inve
stm
ent-
Nil;
For
rem
ainin
gin
vest
men
ts:
1%
; Fo
r ex
it a
fter
12
month
s fr
om
the
da t
e of
allo
tmen
t: N
il
For
10%
of
the
inve
stm
ents
wit
hin
1Yea
r–
Nil;
For
the
rem
ainin
gin
vest
men
ts-
1.0
0%
For10%
ofth
ein
vest
men
tsw
ithin
1Yea
r–
Nil;
Forth
ere
mai
nin
gin
vest
men
ts-
1.0
0%
Wit
hin
1 y
ear
- 3%
;W
ithin
2 y
ears
- 2
%;
Wit
hin
3 y
ears
- 1
%
For
exit
on
or
bef
ore
15
day
sfr
om
the
dat
eof
allo
tmen
t–
0.1
0%
For
exit
afte
r15
day
sfr
om
the
dat
eof
allo
tmen
t–
Nil
Wit
hin
1M
onth
-0.5
0%
Larg
e C
ap
Mid
Cap
Small C
ap
AA
, AA
+, A
AA
And
EQ
UIV
ALE
NT
Bel
ow
AA
Sover
eign
Bel
ow
A1+
, A1+
Cash
, Cash
Eq
uiv
ale
nts
And
Oth
ers
Oth
er
Deta
ils
Co
mp
osit
ion
by
Assets
as o
n 2
8 F
eb
ruary
2019
Eq
uit
y Sh
are
s
Corp
ora
te D
ebt
Gilts
Money
Mark
et I
nst
rum
ents
Oth
er A
sset
s
67.8
9
16.0
8
2.0
8
5.7
0
8.2
6
19.9
5
-
44.8
6
-
35.1
9
25.0
4
65.7
2
0.4
2
-
8.8
2
31.5
3
-
34.7
7
-
33.7
0
22.5
2
46.1
7
- -
31.3
1
69.7
4
18.6
0
- -
11.6
6
68.1
5
5.7
9
-
5.3
5
20.7
1
51.2
4
9.9
8
7.9
5
13.0
3
2.6
9
2.7
8
5.3
5
Oth
ers
6.6
4 E
TF
0.3
2
19.9
5
- - - -
44.8
6
-
35.1
9
16.7
3
1.4
9
6.8
2
52.6
1
13.1
1
0.4
2
-
8.8
2
26
.63
4.3
1
0.5
9
- -
34
.77
-
Oth
ers
17
.73
,1
5.9
6G
old
8.4
0
4.7
9
9.3
3
29.9
2
16.2
5
8.0
1
-
23.2
9
61.0
8
3.7
6
4.9
0
13.1
7
5.4
3
- -
11.6
6
Ple
ase
consu
lt y
our
financia
l advis
or
befo
re invest
ing. For
deta
ils,
ple
ase
refe
r to
resp
ecti
ve p
age o
f th
e s
chem
e.
Sourc
e: C
RIS
IL F
und A
naly
ser
Ris
k F
ree r
ate
: FBIL
Overn
ight
Mib
or
rate
()
Basi
s fo
r Rati
o C
alc
ula
tion: 3 Y
ears
Month
ly D
ata
Poin
ts
Expense
rati
o inclu
des
GST, Base
TER a
nd a
ddit
ional expense
s as
per
regula
tion 5
2(6
A)(
b)
and 5
2(6
A)(
c)
of
SEBI (M
F)
regula
tions
for
both
Dir
ect
and R
egula
r pla
n
#6
.35
% a
s on 2
8th
Febru
ary
20
19
Mod
ifie
d D
ura
tion
Aver
age
Matu
rity
Yie
ld t
o M
atu
rity
(%
)(yea
rs)
(yea
rs)
Nifty
Equi
tySa
ving
sIn
dex
.(w.e
.fA
ugus
t10,2
018)
Nif
ty 5
0 A
rbit
rage
Index
.(w
.e.f
May
16,2
018)
SBI
Magnum
Child
ren’s
Ben
efit
Fund
(Pre
viousl
ykn
ow
n a
s SB
I M
agnum
Child
ren’s
Ben
efit
Pla
n)
SBI
Deb
t H
ybri
d F
und
(Pre
viousl
y kn
ow
n a
s SB
IM
agnum
Month
ly Inco
me
Plan
)
SBI
Mult
i A
sset
Alloca
tion
Fund
(Pre
viousl
y kn
ow
n a
sSB
I M
agnum
Month
lyIn
com
e Pl
an -
Flo
ater
)
1/3
NIF
TY+
1/3
CRIS
ILC
om
posi
te B
ond F
und
Index
+1/3
Pri
ce o
fG
old
.(w
.e.f
May
16,2
018)
NIF
TY 5
0 H
ybri
dC
om
posi
te D
ebt
15:8
5In
dex
(w.e
.f June
25,2
018)
- - -
30
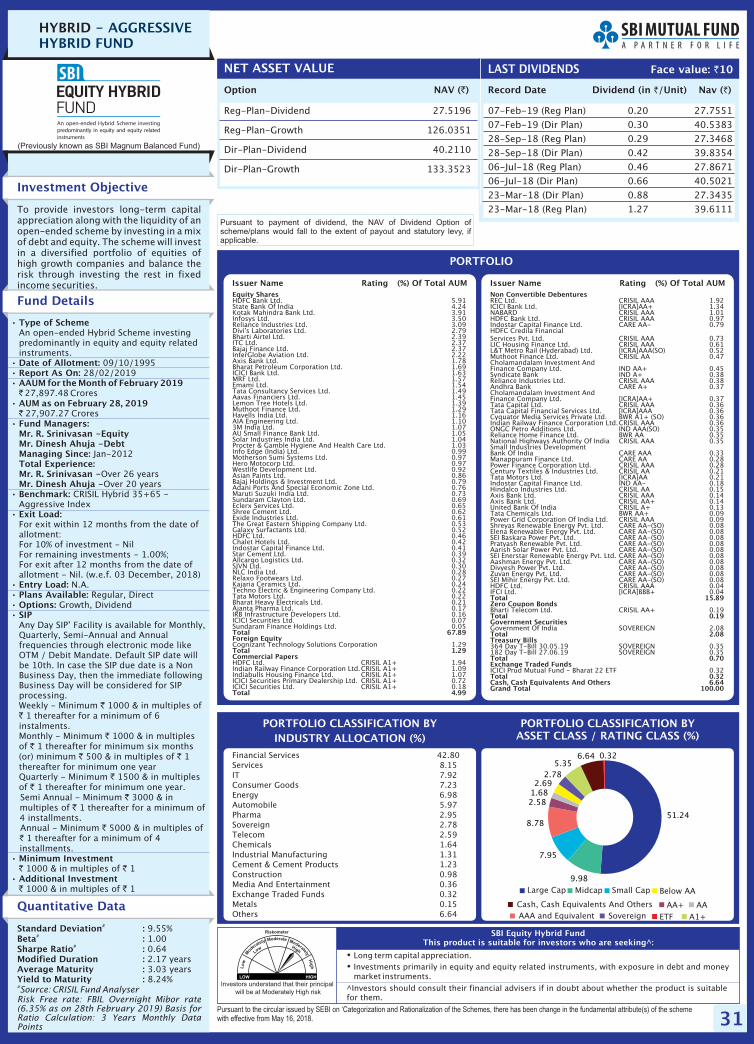
31
HYBRID - AGGRESSIVEHYBRID FUND
Option NAV ( )`
Reg-Plan-Dividend 27.5196
Reg-Plan-Growth 126.0351
Dir-Plan-Dividend 40.2110
Dir-Plan-Growth 133.3523
NET ASSET VALUE
Record Date Dividend Nav ( )`(in /Unit)`
07-Feb-19 (Reg Plan) 0.20 27.7551
07-Feb-19 (Dir Plan) 0.30 40.5383
28-Sep-18 (Reg Plan) 0.29 27.3468
28-Sep-18 (Dir Plan) 0.42 39.8354
06-Jul-18 (Reg Plan) 0.46 27.8671
06-Jul-18 (Dir Plan) 0.66 40.5021
23-Mar-18 (Dir Plan) 0.88 27.3435
23-Mar-18 (Reg Plan) 1.27 39.6111
LAST DIVIDENDS
Investors understand that their principal
will be at Moderately High risk
�
�
Long term capital appreciation.Investments primarily in equity and equity related instruments, with exposure in debt and moneymarket instruments.
Pursuant to the circular issued by SEBI on ‘Categorization and Rationalization of the Schemes, there has been change in the fundamental attribute(s) of the schemewith effective from May 16, 2018.
SBI Equity Hybrid FundThis product is suitable for investors who are seeking^:
Face value: 10`
Investment Objective
Quantitative Data
To provide investors long-term capitalappreciation along with the liquidity of anopen-ended scheme by investing in a mixof debt and equity. The scheme will investin a diversified portfolio of equities ofhigh growth companies and balance therisk through investing the rest in fixedincome securities.
Fund Details
Standard Deviation :Beta :Sharpe Ratio :
#
#
#
9.55%1.000.642.17Modified Duration :
Average Maturity :Yield to Maturity :
years3.03 years8.24%
#Source: CRISIL Fund Analyser
Risk Free rate: FBIL Overnight Mibor rate(6.35% as on 28th February 2019) Basis forRatio Calculation: 3 Years Monthly DataPoints
PORTFOLIO
Equity Shares
Total 67.89Foreign Equity
Total 1.29Commercial Papers
Total 4.99
HDFC Bank Ltd. 5.91State Bank Of India 4.24Kotak Mahindra Bank Ltd. 3.91Infosys Ltd. 3.50Reliance Industries Ltd. 3.09Divi's Laboratories Ltd. 2.79Bharti Airtel Ltd. 2.39ITC Ltd. 2.37Bajaj Finance Ltd. 2.37InterGlobe Aviation Ltd. 2.22Axis Bank Ltd. 1.78Bharat Petroleum Corporation Ltd. 1.69ICICI Bank Ltd. 1.63MRF Ltd. 1.57Emami Ltd. 1.54Tata Consultancy Services Ltd. 1.49Aavas Financiers Ltd. 1.45Lemon Tree Hotels Ltd. 1.39Muthoot Finance Ltd. 1.29Havells India Ltd. 1.16AIA Engineering Ltd. 1.103M India Ltd. 1.07AU Small Finance Bank Ltd. 1.05Solar Industries India Ltd. 1.04Procter & Gamble Hygiene And Health Care Ltd. 1.03Info Edge (India) Ltd. 0.99Motherson Sumi Systems Ltd. 0.97Hero Motocorp Ltd. 0.97Westlife Development Ltd. 0.92Asian Paints Ltd. 0.86Bajaj Holdings & Investment Ltd. 0.79Adani Ports And Special Economic Zone Ltd. 0.76Maruti Suzuki India Ltd. 0.73Sundaram Clayton Ltd. 0.69Eclerx Services Ltd. 0.65Shree Cement Ltd. 0.62Exide Industries Ltd. 0.61The Great Eastern Shipping Company Ltd. 0.53Galaxy Surfactants Ltd. 0.52HDFC Ltd. 0.46Chalet Hotels Ltd. 0.42Indostar Capital Finance Ltd. 0.41Star Cement Ltd. 0.39Allcargo Logistics Ltd. 0.32SJVN Ltd. 0.30NLC India Ltd. 0.28Relaxo Footwears Ltd. 0.27Kajaria Ceramics Ltd. 0.24Techno Electric & Engineering Company Ltd. 0.22Tata Motors Ltd. 0.22Bharat Heavy Electricals Ltd. 0.21Ajanta Pharma Ltd. 0.17IRB Infrastructure Developers Ltd. 0.16ICICI Securities Ltd. 0.07Sundaram Finance Holdings Ltd. 0.05
Cognizant Technology Solutions Corporation 1.29
HDFC Ltd. CRISIL A1+ 1.94Indian Railway Finance Corporation Ltd.CRISIL A1+ 1.09Indiabulls Housing Finance Ltd. CRISIL A1+ 1.07ICICI Securities Primary Dealership Ltd. CRISIL A1+ 0.72ICICI Securities Ltd. CRISIL A1+ 0.18
Non Convertible Debentures
Total 15.89Zero Coupon Bonds
Total 0.19Government Securities
Total 2.08Treasury Bills
Total 0.70Exchange Traded Funds
Total 0.32Cash, Cash Equivalents And Others 6.64Grand Total 100.00
REC Ltd. CRISIL AAA 1.92ICICI Bank Ltd. [ICRA]AA+ 1.34NABARD CRISIL AAA 1.01HDFC Bank Ltd. CRISIL AAA 0.97Indostar Capital Finance Ltd. CARE AA- 0.79HDFC Credila FinancialServices Pvt. Ltd. CRISIL AAA 0.73LIC Housing Finance Ltd. CRISIL AAA 0.61L&T Metro Rail (Hyderabad) Ltd. [ICRA]AAA(SO) 0.52Muthoot Finance Ltd. CRISIL AA 0.47Cholamandalam Investment AndFinance Company Ltd. IND AA+ 0.45Syndicate Bank IND A+ 0.38Reliance Industries Ltd. CRISIL AAA 0.38Andhra Bank CARE A+ 0.37Cholamandalam Investment AndFinance Company Ltd. [ICRA]AA+ 0.37Tata Capital Ltd. CRISIL AAA 0.36Tata Capital Financial Services Ltd. [ICRA]AAA 0.36Cyquator Media Services Private Ltd. BWR A1+ (SO) 0.36Indian Railway Finance Corporation Ltd.CRISIL AAA 0.36ONGC Petro Additions Ltd. IND AAA(SO) 0.35Reliance Home Finance Ltd. BWR AA 0.35National Highways Authority Of India CRISIL AAA 0.35Small Industries DevelopmentBank Of India CARE AAA 0.33Manappuram Finance Ltd. CARE AA 0.28Power Finance Corporation Ltd. CRISIL AAA 0.28Century Textiles & Industries Ltd. CRISIL AA 0.21Tata Motors Ltd. [ICRA]AA 0.21Indostar Capital Finance Ltd. IND AA- 0.18Hindalco Industries Ltd. CRISIL AA 0.15Axis Bank Ltd. CRISIL AAA 0.14Axis Bank Ltd. CRISIL AA+ 0.14United Bank Of India CRISIL A+ 0.13Tata Chemicals Ltd. BWR AA+ 0.09Power Grid Corporation Of India Ltd. CRISIL AAA 0.09Shreyas Renewable Energy Pvt. Ltd. CARE AA-(SO) 0.08Elena Renewable Energy Pvt. Ltd. CARE AA-(SO) 0.08SEI Baskara Power Pvt. Ltd. CARE AA-(SO) 0.08Pratyash Renewable Pvt. Ltd. CARE AA-(SO) 0.08Aarish Solar Power Pvt. Ltd. CARE AA-(SO) 0.08SEI Enerstar Renewable Energy Pvt. Ltd. CARE AA-(SO) 0.08Aashman Energy Pvt. Ltd. CARE AA-(SO) 0.08Divyesh Power Pvt. Ltd. CARE AA-(SO) 0.08Zuvan Energy Pvt. Ltd. CARE AA-(SO) 0.08SEI Mihir Energy Pvt. Ltd. CARE AA-(SO) 0.08HDFC Ltd. CRISIL AAA 0.04IFCI Ltd. [ICRA]BBB+ 0.04
Bharti Telecom Ltd. CRISIL AA+ 0.19
Government Of India SOVEREIGN 2.08
364 Day T-Bill 30.05.19 SOVEREIGN 0.35182 Day T-Bill 27.06.19 SOVEREIGN 0.35
ICICI Prud Mutual Fund - Bharat 22 ETF 0.32
PORTFOLIO CLASSIFICATION BYASSET CLASS / RATING CLASS (%)
Financial Services 42.80Services 8.15IT 7.92Consumer Goods 7.23Energy 6.98Automobile 5.97Pharma 2.95Sovereign 2.78Telecom 2.59Chemicals 1.64Industrial Manufacturing 1.31Cement & Cement Products 1.23Construction 0.98Media And Entertainment 0.36Exchange Traded Funds 0.32Metals 0.15Others 6.64
Pursuant to payment of dividend, the NAV of Dividend Option ofscheme/plans would fall to the extent of payout and statutory levy, ifapplicable.
•
•
•
•
•
•
•
•
•
•
•
•
•
•
Type of Scheme
Date of Allotment:Report As On:AAUM for the February 2019
AUM as on February 28, 2019
Fund Managers:Mr. R. Srinivasan -EquityMr. Dinesh Ahuja -DebtManaging Since:Total Experience:Mr. R. Srinivasan -Mr. Dinesh Ahuja -Benchmark:
Exit Load:
Entry Load:Plans Available:Options:SIP
Minimum Investment
Additional Investment
An open-ended Hybrid Scheme investingpredominantly in equity and equity relatedinstruments.
09/10/199528/02/2019
27,897.48 Crores
27,907.27 Crores
Jan-2012
Over 26 yearsOver 20 years
CRISIL Hybrid 35+65 -Aggressive Index
For exit within 12 months from the date ofallotment:For 10% of investment - NilFor remaining investments - 1.00%;For exit after 12 months from the date ofallotment - Nil. (w.e.f. 03 December, 2018)
N.A.Regular, Direct
Growth, Dividend
Any Day SIP’ Facility is available for Monthly,Quarterly, Semi-Annual and Annualfrequencies through electronic mode likeOTM / Debit Mandate. Default SIP date willbe 10th. In case the SIP due date is a NonBusiness Day, then the immediate followingBusiness Day will be considered for SIPprocessing.Weekly - Minimum 1000 & in multiples of
1 thereafter for a minimum of 6instalments.Monthly - Minimum 1000 & in multiplesof 1 thereafter for minimum six months(or) minimum 500 & in multiples of 1thereafter for minimum one yearQuarterly - Minimum 1500 & in multiplesof 1 thereafter for minimum one year.Semi Annual - Minimum 3000 & inmultiples of 1 thereafter for a minimum of4 installments.Annual - Minimum 5000 & in multiples of
1 thereafter for a minimum of 4installments.
1000 & in multiples of 1
1000 & in multiples of 1
Month of`
`
``
``
` `
``
``
``
` `
` `
PORTFOLIO CLASSIFICATION BYINDUSTRY ALLOCATION (%)
Issuer Name Rating (%) Of Total AUM Issuer Name Rating (%) Of Total AUM
^Investors should consult their financial advisers if in doubt about whether the product is suitablefor them.
(Previously known as SBI Magnum Balanced Fund)
Large Cap Midcap Small Cap Below AA
Cash, Cash Equivalents And Others AA+ AAAAA and Equivalent Sovereign ETF A1+
51.24
9.98
7.95
8.78
2.581.682.69
2.785.35
6.64 0.32
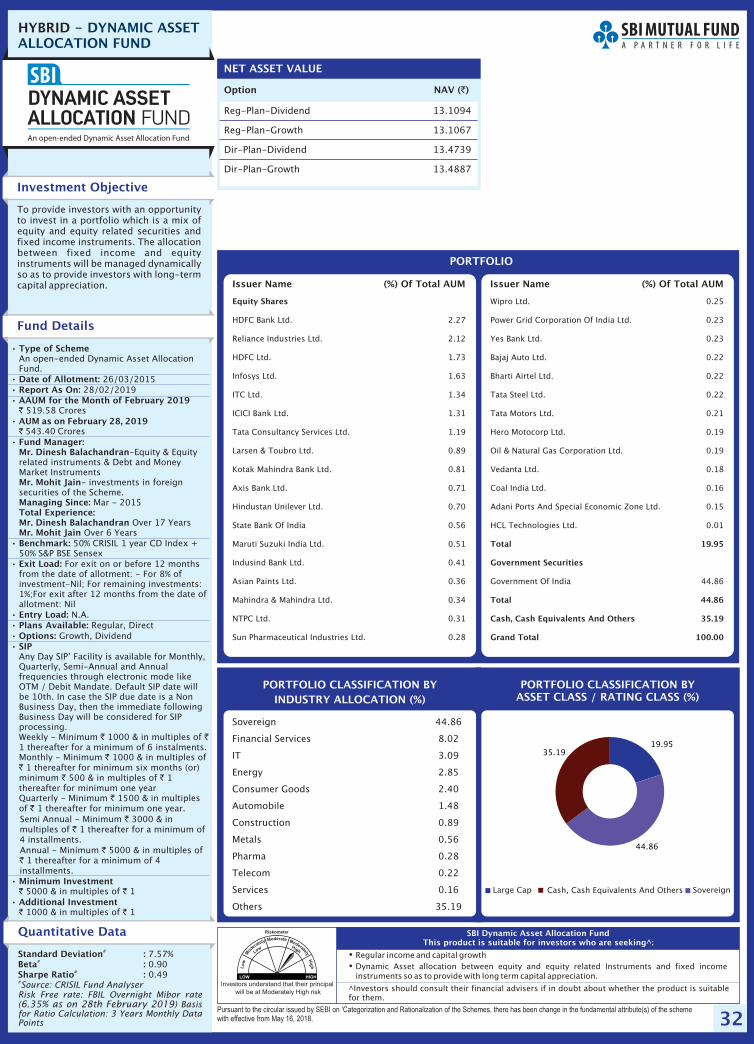
32
HYBRID - DYNAMIC ASSETALLOCATION FUND
Option NAV ( )`
Reg-Plan-Dividend 13.1094
Reg-Plan-Growth 13.1067
Dir-Plan-Dividend 13.4739
Dir-Plan-Growth 13.4887
NET ASSET VALUE
Investors understand that their principal
will be at Moderately High risk
�
�
Regular income and capital growthDynamic Asset allocation between equity and equity related Instruments and fixed incomeinstruments so as to provide with long term capital appreciation.
Pursuant to the circular issued by SEBI on ‘Categorization and Rationalization of the Schemes, there has been change in the fundamental attribute(s) of the schemewith effective from May 16, 2018.
SBI Dynamic Asset Allocation FundThis product is suitable for investors who are seeking^:
Investment Objective
To provide investors with an opportunityto invest in a portfolio which is a mix ofequity and equity related securities andfixed income instruments. The allocationbetween fixed income and equityinstruments will be managed dynamicallyso as to provide investors with long-termcapital appreciation.
Fund Details
PORTFOLIO
Equity Shares
HDFC Bank Ltd. 2.27
Reliance Industries Ltd. 2.12
HDFC Ltd. 1.73
Infosys Ltd. 1.63
ITC Ltd. 1.34
ICICI Bank Ltd. 1.31
Tata Consultancy Services Ltd. 1.19
Larsen & Toubro Ltd. 0.89
Kotak Mahindra Bank Ltd. 0.81
Axis Bank Ltd. 0.71
Hindustan Unilever Ltd. 0.70
State Bank Of India 0.56
Maruti Suzuki India Ltd. 0.51
Indusind Bank Ltd. 0.41
Asian Paints Ltd. 0.36
Mahindra & Mahindra Ltd. 0.34
NTPC Ltd. 0.31
Sun Pharmaceutical Industries Ltd. 0.28
Wipro Ltd. 0.25
Power Grid Corporation Of India Ltd. 0.23
Yes Bank Ltd. 0.23
Bajaj Auto Ltd. 0.22
Bharti Airtel Ltd. 0.22
Tata Steel Ltd. 0.22
Tata Motors Ltd. 0.21
Hero Motocorp Ltd. 0.19
Oil & Natural Gas Corporation Ltd. 0.19
Vedanta Ltd. 0.18
Coal India Ltd. 0.16
Adani Ports And Special Economic Zone Ltd. 0.15
HCL Technologies Ltd. 0.01
Government Of India 44.86
Total 19.95
Government Securities
Total 44.86
Cash, Cash Equivalents And Others 35.19
Grand Total 100.00
PORTFOLIO CLASSIFICATION BYASSET CLASS / RATING CLASS (%)
•
•
•
•
•
•
•
•
•
•
•
•
•
•
Type of Scheme
Date of Allotment:Report As On:AAUM for the February 2019
AUM as on February 28, 2019
Fund Manager:Mr. Dinesh Balachandran
Mr. Mohit Jain
Managing Since:Total Experience:Mr. Dinesh BalachandranMr. Mohit JainBenchmark:
Exit Load:
Entry Load:Plans Available:Options:SIP
Minimum Investment
Additional Investment
An open-ended Dynamic Asset AllocationFund.
26/03/201528/02/2019
519.58 Crores
543.40 Crores
-Equity & Equityrelated instruments & Debt and MoneyMarket Instruments
- investments in foreignsecurities of the Scheme.
Mar - 2015
Over 17 YearsOver 6 Years
50% CRISIL 1 year CD Index +50% S&P BSE Sensex
For exit on or before 12 monthsfrom the date of allotment: - For 8% ofinvestment-Nil; For remaining investments:1%;For exit after 12 months from the date ofallotment: Nil
N.A.Regular, Direct
Growth, Dividend
Any Day SIP’ Facility is available for Monthly,Quarterly, Semi-Annual and Annualfrequencies through electronic mode likeOTM / Debit Mandate. Default SIP date willbe 10th. In case the SIP due date is a NonBusiness Day, then the immediate followingBusiness Day will be considered for SIPprocessing.Weekly - Minimum 1000 & in multiples of1 thereafter for a minimum of 6 instalments.Monthly - Minimum 1000 & in multiples of
1 thereafter for minimum six months (or)minimum 500 & in multiples of 1thereafter for minimum one yearQuarterly - Minimum 1500 & in multiplesof 1 thereafter for minimum one year.Semi Annual - Minimum 3000 & inmultiples of 1 thereafter for a minimum of4 installments.Annual - Minimum 5000 & in multiples of
1 thereafter for a minimum of 4installments.
5000 & in multiples of 1
1000 & in multiples of 1
Month of`
`
` `
``
` `
``
``
``
` `
` `
Sovereign 44.86
Financial Services 8.02
IT 3.09
Energy 2.85
Consumer Goods 2.40
Automobile 1.48
Construction 0.89
Metals 0.56
Pharma 0.28
Telecom 0.22
Services 0.16
Others 35.19
PORTFOLIO CLASSIFICATION BYINDUSTRY ALLOCATION (%)
Issuer Name (%) Of Total AUMIssuer Name (%) Of Total AUM
^Investors should consult their financial advisers if in doubt about whether the product is suitablefor them.
Cash, Cash Equivalents And OthersLarge Cap Sovereign
Quantitative Data
Standard Deviation :Beta :Sharpe Ratio :
#
#
#
7.57%0.900.49
#Source: CRISIL Fund Analyser
Risk Free rate: FBIL Overnight Mibor rate( ) Basisfor Ratio Calculation: 3 Years Monthly DataPoints
6.35% as on 28th February 2019
19.95
44.86
35.19
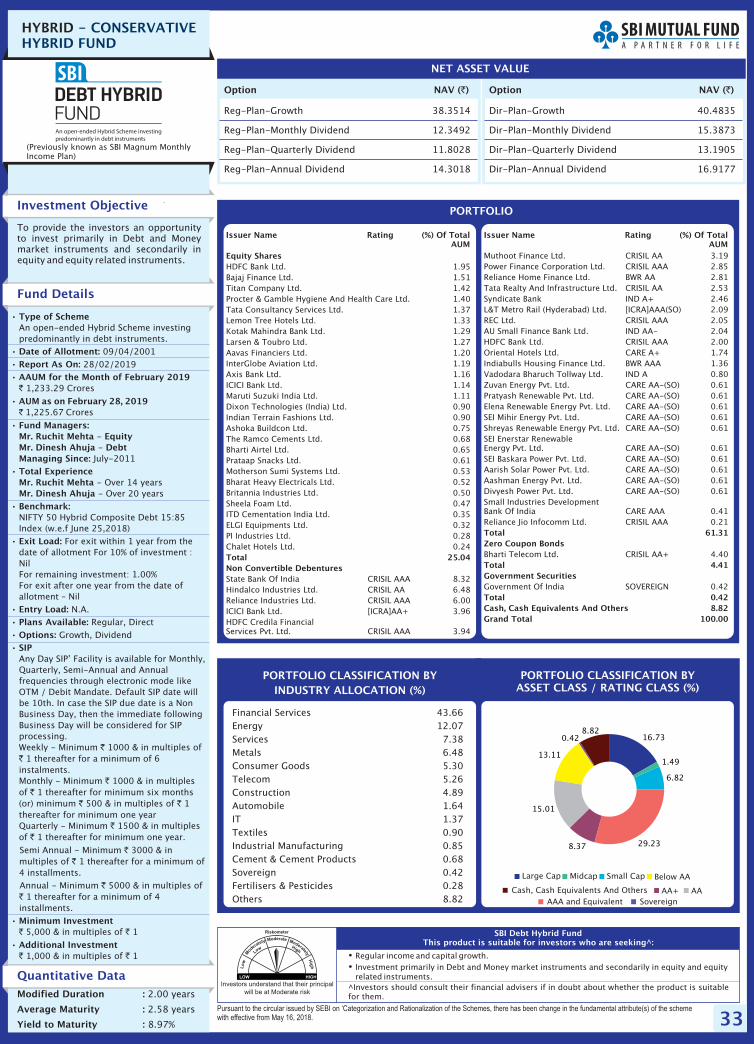
33
HYBRID - CONSERVATIVEHYBRID FUND
Option NAV ( )` Option NAV ( )`
Reg-Plan-Growth 38.3514
Reg-Plan-Monthly Dividend 12.3492
Reg-Plan-Quarterly Dividend 11.8028
Reg-Plan-Annual Dividend 14.3018
Dir-Plan-Growth 40.4835
Dir-Plan-Monthly Dividend 15.3873
Dir-Plan-Quarterly Dividend 13.1905
Dir-Plan-Annual Dividend 16.9177
NET ASSET VALUE
Investors understand that their principal
will be at Moderate risk
�
�
Regular income and capital growth.Investment primarily in Debt and Money market instruments and secondarily in equity and equityrelated instruments.
Pursuant to the circular issued by SEBI on ‘Categorization and Rationalization of the Schemes, there has been change in the fundamental attribute(s) of the schemewith effective from May 16, 2018.
SBI Debt Hybrid FundThis product is suitable for investors who are seeking^:
Investment Objective
Quantitative Data
To provide the investors an opportunityto invest primarily in Debt and Moneymarket instruments and secondarily inequity and equity related instruments.
Fund Details
Modified Duration :
Average Maturity :
Yield to Maturity :
2.00
2.58 years
8.97%
years
PORTFOLIO CLASSIFICATION BYASSET CLASS / RATING CLASS (%)
Financial Services 43.66Energy 12.07Services 7.38Metals 6.48Consumer Goods 5.30Telecom 5.26Construction 4.89Automobile 1.64IT 1.37Textiles 0.90Industrial Manufacturing 0.85Cement & Cement Products 0.68Sovereign 0.42Fertilisers & Pesticides 0.28Others 8.82
•
•
•
•
•
•
•
•
•
•
•
•
•
•
•
Type of Scheme
Date of Allotment:
Report As On:
AAUM for the February 2019
AUM as on February 28, 2019
Fund Managers:Mr. Ruchit Mehta EquityMr. Dinesh Ahuja DebtManaging Since:
Total ExperienceMr. Ruchit MehtaMr. Dinesh Ahuja
Benchmark:
Exit Load:
Entry Load:
Plans Available:
Options:
SIP
Minimum Investment
Additional Investment
An open-ended Hybrid Scheme investingpredominantly in debt instruments.
09/04/200128/02/2019
1,233.29 Crores
1,225.67 Crores
--
July-2011
- Over 14 years- Over 20 years
NIFTY 50 Hybrid Composite Debt 15:85Index
For exit within 1 year from thedate of allotment For 10% of investment :NilFor remaining investment: 1.00%For exit after one year from the date ofallotment – Nil
N.A.Regular, Direct
Growth, Dividend
Any Day SIP’ Facility is available for Monthly,Quarterly, Semi-Annual and Annualfrequencies through electronic mode likeOTM / Debit Mandate. Default SIP date willbe 10th. In case the SIP due date is a NonBusiness Day, then the immediate followingBusiness Day will be considered for SIPprocessing.Weekly - Minimum 1000 & in multiples of
1 thereafter for a minimum of 6instalments.Monthly - Minimum 1000 & in multiplesof 1 thereafter for minimum six months(or) minimum 500 & in multiples of 1thereafter for minimum one yearQuarterly - Minimum 1500 & in multiplesof 1 thereafter for minimum one year.
Semi Annual - Minimum 3000 & inmultiples of 1 thereafter for a minimum of4 installments.Annual - Minimum 5000 & in multiples of
1 thereafter for a minimum of 4installments.
5,000 & in multiples of 1
1,000 & in multiples of 1
Month of`
`
`
`
`
`
` `
`
`
`
`
`
`
` `
` `
(w.e.f June 25,2018)
PORTFOLIO CLASSIFICATION BYINDUSTRY ALLOCATION (%)
PORTFOLIO
Equity Shares
Total 25.04Non Convertible Debentures
HDFC Bank Ltd. 1.95Bajaj Finance Ltd. 1.51Titan Company Ltd. 1.42Procter & Gamble Hygiene And Health Care Ltd. 1.40Tata Consultancy Services Ltd. 1.37Lemon Tree Hotels Ltd. 1.33Kotak Mahindra Bank Ltd. 1.29Larsen & Toubro Ltd. 1.27Aavas Financiers Ltd. 1.20InterGlobe Aviation Ltd. 1.19Axis Bank Ltd. 1.16ICICI Bank Ltd. 1.14Maruti Suzuki India Ltd. 1.11Dixon Technologies (India) Ltd. 0.90Indian Terrain Fashions Ltd. 0.90Ashoka Buildcon Ltd. 0.75The Ramco Cements Ltd. 0.68Bharti Airtel Ltd. 0.65Prataap Snacks Ltd. 0.61Motherson Sumi Systems Ltd. 0.53Bharat Heavy Electricals Ltd. 0.52Britannia Industries Ltd. 0.50Sheela Foam Ltd. 0.47ITD Cementation India Ltd. 0.35ELGI Equipments Ltd. 0.32PI Industries Ltd. 0.28Chalet Hotels Ltd. 0.24
State Bank Of India CRISIL AAA 8.32Hindalco Industries Ltd. CRISIL AA 6.48Reliance Industries Ltd. CRISIL AAA 6.00ICICI Bank Ltd. [ICRA]AA+ 3.96HDFC Credila FinancialServices Pvt. Ltd. CRISIL AAA 3.94
Muthoot Finance Ltd. CRISIL AA 3.19Power Finance Corporation Ltd. CRISIL AAA 2.85Reliance Home Finance Ltd. BWR AA 2.81Tata Realty And Infrastructure Ltd. CRISIL AA 2.53Syndicate Bank IND A+ 2.46L&T Metro Rail (Hyderabad) Ltd. [ICRA]AAA(SO) 2.09REC Ltd. CRISIL AAA 2.05AU Small Finance Bank Ltd. IND AA- 2.04HDFC Bank Ltd. CRISIL AAA 2.00Oriental Hotels Ltd. CARE A+ 1.74Indiabulls Housing Finance Ltd. BWR AAA 1.36Vadodara Bharuch Tollway Ltd. IND A 0.80Zuvan Energy Pvt. Ltd. CARE AA-(SO) 0.61Pratyash Renewable Pvt. Ltd. CARE AA-(SO) 0.61Elena Renewable Energy Pvt. Ltd. CARE AA-(SO) 0.61SEI Mihir Energy Pvt. Ltd. CARE AA-(SO) 0.61Shreyas Renewable Energy Pvt. Ltd. CARE AA-(SO) 0.61SEI Enerstar RenewableEnergy Pvt. Ltd. CARE AA-(SO) 0.61SEI Baskara Power Pvt. Ltd. CARE AA-(SO) 0.61Aarish Solar Power Pvt. Ltd. CARE AA-(SO) 0.61Aashman Energy Pvt. Ltd. CARE AA-(SO) 0.61Divyesh Power Pvt. Ltd. CARE AA-(SO) 0.61Small Industries DevelopmentBank Of India CARE AAA 0.41Reliance Jio Infocomm Ltd. CRISIL AAA 0.21
Bharti Telecom Ltd. CRISIL AA+ 4.40
Government Of India SOVEREIGN 0.42
Total 61.31Zero Coupon Bonds
Total 4.41Government Securities
Total 0.42Cash, Cash Equivalents And Others 8.82Grand Total 100.00
Issuer Name Rating (%) Of TotalAUM
Issuer Name Rating (%) Of TotalAUM
^Investors should consult their financial advisers if in doubt about whether the product is suitablefor them.
(Previously known as SBI Magnum MonthlyIncome Plan)
AAA and Equivalent Sovereign
Large Cap Midcap Small Cap Below AA
Cash, Cash Equivalents And Others AA+ AA
16.73
1.49
6.82
29.238.37
15.01
13.11
0.428.82
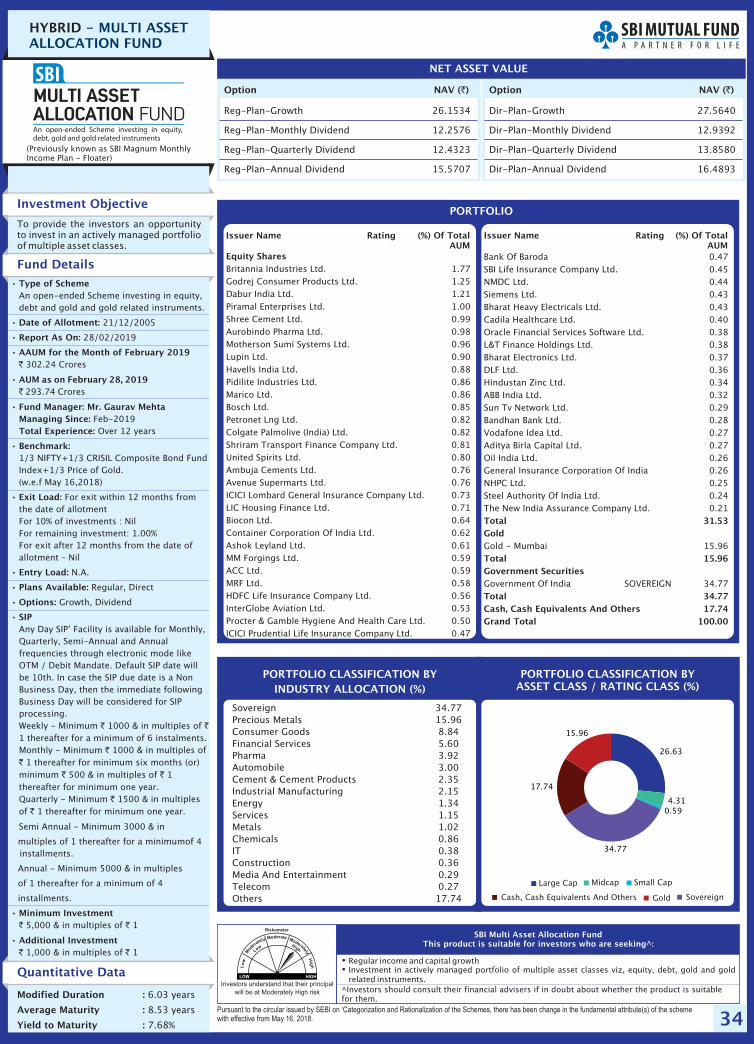
34
HYBRID - MULTI ASSETALLOCATION FUND
Option NAV ( )` Option NAV ( )`
Reg-Plan-Growth 26.1534
Reg-Plan-Monthly Dividend 12.2576
Reg-Plan-Quarterly Dividend 12.4323
Reg-Plan-Annual Dividend 15.5707
Dir-Plan-Growth 27.5640
Dir-Plan-Monthly Dividend 12.9392
Dir-Plan-Quarterly Dividend 13.8580
Dir-Plan-Annual Dividend 16.4893
NET ASSET VALUE
�
�
Regular income and capital growthInvestment in actively managed portfolio of multiple asset classes viz, equity, debt, gold and goldrelated instruments.
Pursuant to the circular issued by SEBI on ‘Categorization and Rationalization of the Schemes, there has been change in the fundamental attribute(s) of the schemewith effective from May 16, 2018.
SBI Multi Asset Allocation FundThis product is suitable for investors who are seeking^:
Investment Objective
Quantitative Data
To provide the investors an opportunityto invest in an actively managed portfolioof multiple asset classes.
Fund Details
Modified Duration :
Average Maturity :
Yield to Maturity :
6.03
8.53 years
7.68%
years
PORTFOLIO CLASSIFICATION BYASSET CLASS / RATING CLASS (%)
Sovereign 34.77Precious Metals 15.96Consumer Goods 8.84Financial Services 5.60Pharma 3.92Automobile 3.00Cement & Cement Products 2.35Industrial Manufacturing 2.15Energy 1.34Services 1.15Metals 1.02Chemicals 0.86IT 0.38Construction 0.36Media And Entertainment 0.29Telecom 0.27Others 17.74
•
•
•
•
•
•
•
•
•
•
•
•
•
•
Type of Scheme
Date of Allotment:
Report As On:
AAUM for the February 2019
AUM as on February 28, 2019
Fund Manager: Mr. Gaurav MehtaManaging Since:Total Experience:
Benchmark:
Exit Load:
Entry Load:
Plans Available:
Options:
SIP
Minimum Investment
Additional Investment
An open-ended Scheme investing in equity,debt and gold and gold related instruments.
21/12/2005
28/02/2019
302.24 Crores
293.74 Crores
Feb-2019Over 12 years
1/3 NIFTY+1/3 CRISIL Composite Bond FundIndex+1/3 Price of Gold.(w.e.f May 16,2018)
For exit within 12 months fromthe date of allotmentFor 10% of investments : NilFor remaining investment: 1.00%For exit after 12 months from the date ofallotment – Nil
N.A.
Regular, Direct
Growth, Dividend
Any Day SIP’ Facility is available for Monthly,Quarterly, Semi-Annual and Annualfrequencies through electronic mode likeOTM / Debit Mandate. Default SIP date willbe 10th. In case the SIP due date is a NonBusiness Day, then the immediate followingBusiness Day will be considered for SIPprocessing.Weekly - Minimum 1000 & in multiples of1 thereafter for a minimum of 6 instalments.Monthly - Minimum 1000 & in multiples of
1 thereafter for minimum six months (or)minimum 500 & in multiples of 1thereafter for minimum one year.Quarterly - Minimum 1500 & in multiplesof 1 thereafter for minimum one year.
Semi Annual - Minimum 3000 & in
multiples of 1 thereafter for a minimumof 4installments.
Annual - Minimum 5000 & in multiples
of 1 thereafter for a minimum of 4
installments.
5,000 & in multiples of 1
1,000 & in multiples of 1
Month of`
`
` `
`
`
` `
`
`
` `
` `
PORTFOLIO CLASSIFICATION BYINDUSTRY ALLOCATION (%)
PORTFOLIO
Equity SharesBritannia Industries Ltd. 1.77Godrej Consumer Products Ltd. 1.25Dabur India Ltd. 1.21Piramal Enterprises Ltd. 1.00Shree Cement Ltd. 0.99Aurobindo Pharma Ltd. 0.98Motherson Sumi Systems Ltd. 0.96Lupin Ltd. 0.90Havells India Ltd. 0.88Pidilite Industries Ltd. 0.86Marico Ltd. 0.86Bosch Ltd. 0.85Petronet Lng Ltd. 0.82Colgate Palmolive (India) Ltd. 0.82Shriram Transport Finance Company Ltd. 0.81United Spirits Ltd. 0.80Ambuja Cements Ltd. 0.76Avenue Supermarts Ltd. 0.76ICICI Lombard General Insurance Company Ltd. 0.73LIC Housing Finance Ltd. 0.71Biocon Ltd. 0.64Container Corporation Of India Ltd. 0.62Ashok Leyland Ltd. 0.61MM Forgings Ltd. 0.59ACC Ltd. 0.59MRF Ltd. 0.58HDFC Life Insurance Company Ltd. 0.56InterGlobe Aviation Ltd. 0.53Procter & Gamble Hygiene And Health Care Ltd. 0.50ICICI Prudential Life Insurance Company Ltd. 0.47
Bank Of Baroda 0.47SBI Life Insurance Company Ltd. 0.45NMDC Ltd. 0.44Siemens Ltd. 0.43Bharat Heavy Electricals Ltd. 0.43Cadila Healthcare Ltd. 0.40Oracle Financial Services Software Ltd. 0.38L&T Finance Holdings Ltd. 0.38Bharat Electronics Ltd. 0.37DLF Ltd. 0.36Hindustan Zinc Ltd. 0.34ABB India Ltd. 0.32Sun Tv Network Ltd. 0.29Bandhan Bank Ltd. 0.28Vodafone Idea Ltd. 0.27Aditya Birla Capital Ltd. 0.27Oil India Ltd. 0.26General Insurance Corporation Of India 0.26NHPC Ltd. 0.25Steel Authority Of India Ltd. 0.24The New India Assurance Company Ltd. 0.21
Gold - Mumbai 15.96
Government Of India SOVEREIGN 34.77
Total 31.53Gold
Total 15.96Government Securities
Total 34.77Cash, Cash Equivalents And Others 17.74Grand Total 100.00
Issuer Name Rating (%) Of TotalAUM
Issuer Name Rating (%) Of TotalAUM
^Investors should consult their financial advisers if in doubt about whether the product is suitablefor them.
Investors understand that their principal
will be at Moderately riskHigh
(Previously known as SBI Magnum MonthlyIncome Plan - Floater)
Cash, Cash Equivalents And Others SovereignGold
Large Cap Midcap Small Cap
26.63
4.310.59
34.77
17.74
15.96

35
SOLUTIONS ORIENTEDSCHEME-CHILDREN’SFUND
Option NAV ( )`
Reg-Plan-Growth 54.5667
Dir-Plan-Growth 57.5821
NET ASSET VALUE
Investors understand that their principal
will be at Moderately High risk
�
�
Regular income and capital appreciation.Investment primarily in debt and money market instruments and secondarily in actively managedequity and equity related instruments.
Pursuant to the circular issued by SEBI on ‘Categorization and Rationalization of the Schemes, there has been change in the fundamental attribute(s) of the schemewith effective from May 16, 2018.
SBI Magnum Children’s Benefit FundThis product is suitable for investors who are seeking^:
Investment Objective
Quantitative Data
To provide the investors an opportunityto earn regular income predominantlythrough investment in debt and moneymarket instruments and capitalappreciation through an activelymanaged equity portfolio.
Fund Details
Modified Duration :
Average Maturity :
Yield to Maturity :
1.74
2.29 years
8.76%
years
PORTFOLIO CLASSIFICATION BYASSET CLASS / RATING CLASS (%)
Financial Services 43.38
Sovereign 8.01
Energy 4.87
Metals 4.54
Consumer Goods 4.46
Construction 3.27
Industrial Manufacturing 2.93
Textiles 1.25
Healthcare Services 1.07
Paper 1.00
Telecom 0.98
Automobile 0.92
Others 23.30
•
•
•
•
•
•
•
•
•
•
•
•
•
•
Type of Scheme
Date of Allotment:Report As On:AAUM for the February 2019
AUM as on February 28, 2019
Fund Manager:Mr. Rajeev RadhakrishnanManaging Since:Total Experience:Benchmark:
Exit Load:
Entry Load:Plans Available:Options:SIP
Minimum Investment
Additional Investment
An open-ended fund for investment forchildren having a lock-in for at least 5years or till the child attains age ofmajority (whichever is earlier).
21/02/200228/02/2019
61.29 Crores
61.63 Crores
Jun-2008Over 17 years
NIFTY 50 Hybrid Composite Debt 15:85Index (w.e.f June 25,2018)
Within 1 year :3%, Within 2 years :2%,Within 3 years :1%, above 3 years: NIL.
N.ARegular, Direct
Growth,
Any Day SIP’ Facility is available forMonthly, Quarterly, Semi-Annual andAnnual frequencies through electronicmode like OTM / Debit Mandate. DefaultSIP date will be 10th. In case the SIP duedate is a Non Business Day, then theimmediate following Business Day will beconsidered for SIP processing.Weekly - Minimum 1000 & in multiples
of 1 thereafter for a minimum of 6
instalments.Monthly - Minimum 1000 & in multiples
of 1 thereafter for minimum six months
(or) minimum 500 & in multiples of 1
thereafter for minimum one yearQuarterly - Minimum 1500 & in multiples
of 1 thereafter for minimum one year.Semi Annual - Minimum 3000 & in
multiples of 1 thereafter for a minimum
of 4 installments.Annual - Minimum 5000 & in multiples
of 1 thereafter for a minimum of 4
installments.
5,000 & in multiples of 1
1,000 & in multiples of 1
Month of`
`
`
`
`
`
` `
`
`
`
`
`
`
` `
` `
PORTFOLIO CLASSIFICATION BYINDUSTRY ALLOCATION (%)
PORTFOLIO
Equity Shares
Axis Bank Ltd. 1.44
State Bank Of India 1.40
The New India Assurance Company Ltd. 1.33
Sadbhav Engineering Ltd. 1.27
ABB India Ltd. 1.13
Indian Terrain Fashions Ltd. 1.11
Punjab National Bank 1.07
Narayana Hrudayalaya Ltd. 1.07
Ahluwalia Contracts (India) Ltd. 1.06
Manpasand Beverages Ltd. 1.02
Tamil Nadu Newsprint & Papers Ltd. 1.00
Bharti Airtel Ltd. 0.98
ITD Cementation India Ltd. 0.94
Greenply Industries Ltd. 0.93
Tata Motors Ltd. 0.92
Hawkins Cookers Ltd. 0.92
ICICI Bank Ltd. 0.88
Colgate Palmolive (India) Ltd. 0.88
Bharat Heavy Electricals Ltd. 0.83
Tata Global Beverages Ltd. 0.71
Bharat Electronics Ltd. 0.48
Issuer Name Rating (%) Of TotalAUM
Issuer Name Rating (%) Of TotalAUM
Schaeffler India Ltd. 0.48
Vedanta Ltd. 0.43
Page Industries Ltd. 0.14
CRISIL Ltd. 0.08
REC Ltd. CRISIL AAA 7.98
ICICI Bank Ltd. [ICRA]AA+ 7.88
Syndicate Bank IND A+ 6.52
Muthoot Finance Ltd. CRISIL AA 5.16
Greenko Energies Pvt. Ltd. CARE A+ 4.87
Indostar Capital Finance Ltd. CARE AA- 4.86
Reliance Home Finance Ltd. BWR AA 4.79
Hindalco Industries Ltd. CRISIL AA 4.11
State Government Of Gujarat SOVEREIGN 8.01
Total 22.52
Non Convertible Debentures
Total 46.17
State Development Loans
Total 8.01
Cash, Cash Equivalents And Others 23.30
Grand Total 100.00
^Investors should consult their financial advisers if in doubt about whether the product is suitablefor them.
(Previously known as SBI Magnum Children’sBenefit Plan)
Large Cap Midcap Small Cap Below AA
Cash, Cash Equivalents And Others AA+ AAAAA and Equivalent Sovereign
8.40
4.79
9.33
7.98
7.88
14.0616.25
8.01
23.30
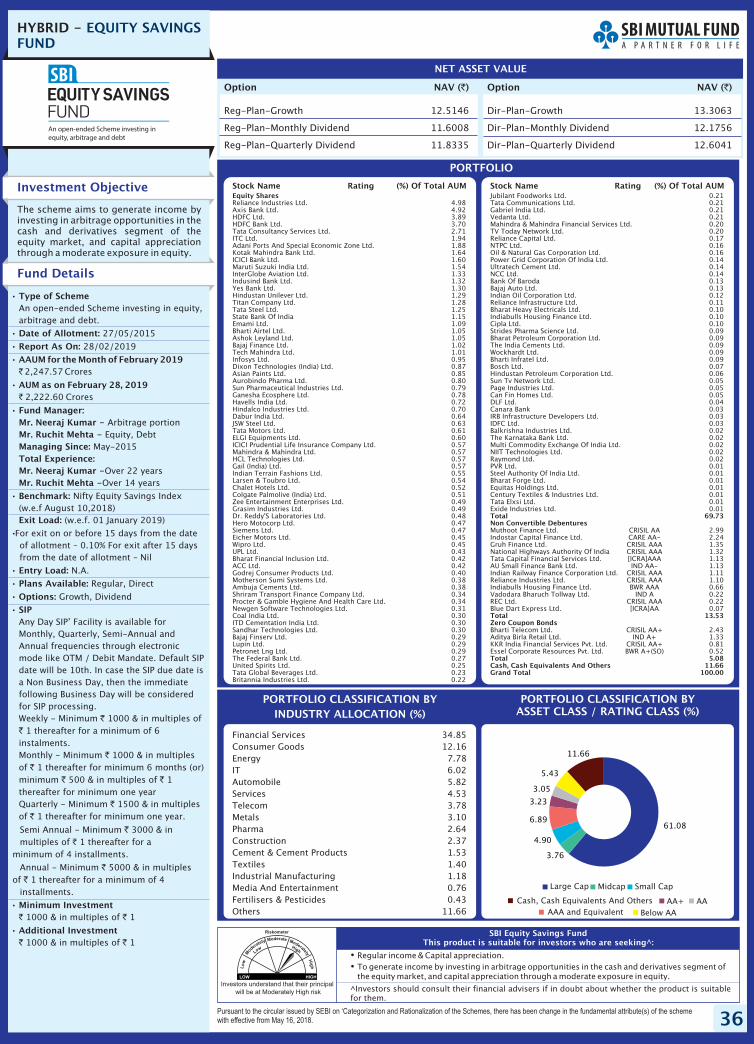
36
HYBRID - EQUITY SAVINGSFUND
Investors understand that their principal
will be at Moderately High risk
�
�
Regular income & Capital appreciation.To generate income by investing in arbitrage opportunities in the cash and derivatives segment ofthe equity market, and capital appreciation through a moderate exposure in equity.
Pursuant to the circular issued by SEBI on ‘Categorization and Rationalization of the Schemes, there has been change in the fundamental attribute(s) of the schemewith effective from May 16, 2018.
SBI Equity Savings FundThis product is suitable for investors who are seeking^:
Investment Objective
The scheme aims to generate income byinvesting in arbitrage opportunities in thecash and derivatives segment of theequity market, and capital appreciationthrough a moderate exposure in equity.
Fund Details
PORTFOLIO CLASSIFICATION BYASSET CLASS / RATING CLASS (%)
Financial Services 34.85Consumer Goods 12.16Energy 7.78IT 6.02Automobile 5.82Services 4.53Telecom 3.78Metals 3.10Pharma 2.64Construction 2.37Cement & Cement Products 1.53Textiles 1.40Industrial Manufacturing 1.18Media And Entertainment 0.76Fertilisers & Pesticides 0.43Others 11.66
•
•
•
•
•
•
•
•
•
•
•
•
•
•
Type of Scheme
Date of Allotment:
Report As On:
AAUM for the February 2019
AUM as on February 28, 2019
Fund Manager:Mr. Neeraj Kumar -Mr. Ruchit Mehta -Managing Since:Total Experience:Mr. Neeraj Kumar -Mr. Ruchit Mehta -
Benchmark:
Exit Load:
Entry Load:
Plans Available:
Options:
SIP
Minimum Investment
Additional Investment
An open-ended Scheme investing in equity,arbitrage and debt.
27/05/2015
28/02/2019
2,247.57 Crores
2,222.60 Crores
Arbitrage portionEquity, Debt
May-2015
Over 22 yearsOver 14 years
Nifty Equity Savings Index(w.e.f August 10,2018)
(w.e.f. 01 January 2019)
For exit on or before 15 days from the dateof allotment – 0.10% For exit after 15 daysfrom the date of allotment – Nil
N.A.
Regular, Direct
Growth, Dividend
Any Day SIP’ Facility is available forMonthly, Quarterly, Semi-Annual andAnnual frequencies through electronicmode like OTM / Debit Mandate. Default SIPdate will be 10th. In case the SIP due date isa Non Business Day, then the immediatefollowing Business Day will be consideredfor SIP processing.Weekly - Minimum 1000 & in multiples of
1 thereafter for a minimum of 6instalments.Monthly - Minimum 1000 & in multiplesof 1 thereafter for minimum 6 months (or)minimum 500 & in multiples of 1thereafter for minimum one yearQuarterly - Minimum 1500 & in multiplesof 1 thereafter for minimum one year.
Semi Annual - Minimum 3000 & inmultiples of 1 thereafter for a
minimum of 4 installments.
Annual - Minimum 5000 & in multiplesof 1 thereafter for a minimum of 4
installments.
1000 & in multiples of 1
1000 & in multiples of 1
Month of`
`
`
`
`
`
` `
`
`
`
`
`
`
` `
` `
PORTFOLIO CLASSIFICATION BYINDUSTRY ALLOCATION (%)
PORTFOLIO
Equity SharesReliance Industries Ltd. 4.98Axis Bank Ltd. 4.92HDFC Ltd. 3.89HDFC Bank Ltd. 3.70Tata Consultancy Services Ltd. 2.71ITC Ltd. 1.94Adani Ports And Special Economic Zone Ltd. 1.88Kotak Mahindra Bank Ltd. 1.64ICICI Bank Ltd. 1.60Maruti Suzuki India Ltd. 1.54InterGlobe Aviation Ltd. 1.33Indusind Bank Ltd. 1.32Yes Bank Ltd. 1.30Hindustan Unilever Ltd. 1.29Titan Company Ltd. 1.28Tata Steel Ltd. 1.25State Bank Of India 1.15Emami Ltd. 1.09Bharti Airtel Ltd. 1.05Ashok Leyland Ltd. 1.05Bajaj Finance Ltd. 1.02Tech Mahindra Ltd. 1.01Infosys Ltd. 0.95Dixon Technologies (India) Ltd. 0.87Asian Paints Ltd. 0.85Aurobindo Pharma Ltd. 0.80Sun Pharmaceutical Industries Ltd. 0.79Ganesha Ecosphere Ltd. 0.78Havells India Ltd. 0.72Hindalco Industries Ltd. 0.70Dabur India Ltd. 0.64JSW Steel Ltd. 0.63Tata Motors Ltd. 0.61ELGI Equipments Ltd. 0.60ICICI Prudential Life Insurance Company Ltd. 0.57Mahindra & Mahindra Ltd. 0.57HCL Technologies Ltd. 0.57Gail (India) Ltd. 0.57Indian Terrain Fashions Ltd. 0.55Larsen & Toubro Ltd. 0.54Chalet Hotels Ltd. 0.52Colgate Palmolive (India) Ltd. 0.51Zee Entertainment Enterprises Ltd. 0.49Grasim Industries Ltd. 0.49Dr. Reddy'S Laboratories Ltd. 0.48Hero Motocorp Ltd. 0.47Siemens Ltd. 0.47Eicher Motors Ltd. 0.45Wipro Ltd. 0.45UPL Ltd. 0.43Bharat Financial Inclusion Ltd. 0.42ACC Ltd. 0.42Godrej Consumer Products Ltd. 0.40Motherson Sumi Systems Ltd. 0.38Ambuja Cements Ltd. 0.38Shriram Transport Finance Company Ltd. 0.34Procter & Gamble Hygiene And Health Care Ltd. 0.34Newgen Software Technologies Ltd. 0.31Coal India Ltd. 0.30ITD Cementation India Ltd. 0.30Sandhar Technologies Ltd. 0.30Bajaj Finserv Ltd. 0.29Lupin Ltd. 0.29Petronet Lng Ltd. 0.29The Federal Bank Ltd. 0.27United Spirits Ltd. 0.25Tata Global Beverages Ltd. 0.23Britannia Industries Ltd. 0.22
Stock Name Rating (%) Of Total AUM Stock Name Rating (%) Of Total AUMJubilant Foodworks Ltd. 0.21Tata Communications Ltd. 0.21Gabriel India Ltd. 0.21Vedanta Ltd. 0.21Mahindra & Mahindra Financial Services Ltd. 0.20TV Today Network Ltd. 0.20Reliance Capital Ltd. 0.17NTPC Ltd. 0.16Oil & Natural Gas Corporation Ltd. 0.16Power Grid Corporation Of India Ltd. 0.14Ultratech Cement Ltd. 0.14NCC Ltd. 0.14Bank Of Baroda 0.13Bajaj Auto Ltd. 0.13Indian Oil Corporation Ltd. 0.12Reliance Infrastructure Ltd. 0.11Bharat Heavy Electricals Ltd. 0.10Indiabulls Housing Finance Ltd. 0.10Cipla Ltd. 0.10Strides Pharma Science Ltd. 0.09Bharat Petroleum Corporation Ltd. 0.09The India Cements Ltd. 0.09Wockhardt Ltd. 0.09Bharti Infratel Ltd. 0.09Bosch Ltd. 0.07Hindustan Petroleum Corporation Ltd. 0.06Sun Tv Network Ltd. 0.05Page Industries Ltd. 0.05Can Fin Homes Ltd. 0.05DLF Ltd. 0.04Canara Bank 0.03IRB Infrastructure Developers Ltd. 0.03IDFC Ltd. 0.03Balkrishna Industries Ltd. 0.02The Karnataka Bank Ltd. 0.02Multi Commodity Exchange Of India Ltd. 0.02NIIT Technologies Ltd. 0.02Raymond Ltd. 0.02PVR Ltd. 0.01Steel Authority Of India Ltd. 0.01Bharat Forge Ltd. 0.01Equitas Holdings Ltd. 0.01Century Textiles & Industries Ltd. 0.01Tata Elxsi Ltd. 0.01Exide Industries Ltd. 0.01
Muthoot Finance Ltd. CRISIL AA 2.99Indostar Capital Finance Ltd. CARE AA- 2.24Gruh Finance Ltd. CRISIL AAA 1.35National Highways Authority Of India CRISIL AAA 1.32Tata Capital Financial Services Ltd. [ICRA]AAA 1.13AU Small Finance Bank Ltd. IND AA- 1.13Indian Railway Finance Corporation Ltd. CRISIL AAA 1.11Reliance Industries Ltd. CRISIL AAA 1.10Indiabulls Housing Finance Ltd. BWR AAA 0.66Vadodara Bharuch Tollway Ltd. IND A 0.22REC Ltd. CRISIL AAA 0.22Blue Dart Express Ltd. [ICRA]AA 0.07
Bharti Telecom Ltd. CRISIL AA+ 2.43Aditya Birla Retail Ltd. IND A+ 1.33KKR India Financial Services Pvt. Ltd. CRISIL AA+ 0.81Essel Corporate Resources Pvt. Ltd. BWR A+(SO) 0.52
Total 69.73Non Convertible Debentures
Total 13.53Zero Coupon Bonds
Total 5.08Cash, Cash Equivalents And Others 11.66Grand Total 100.00
Option NAV ( )` Option NAV ( )`
Reg-Plan-Growth 12.5146
Reg-Plan-Monthly Dividend 11.6008
Reg-Plan-Quarterly Dividend 11.8335
Dir-Plan-Growth 13.3063
Dir-Plan-Monthly Dividend 12.1756
Dir-Plan-Quarterly Dividend 12.6041
NET ASSET VALUE
^Investors should consult their financial advisers if in doubt about whether the product is suitablefor them.
Large Cap Midcap Small Cap
AAA and Equivalent Below AA
Cash, Cash Equivalents And Others AA+ AA
61.08
3.76
4.90
6.89
3.23
3.05
5.43
11.66
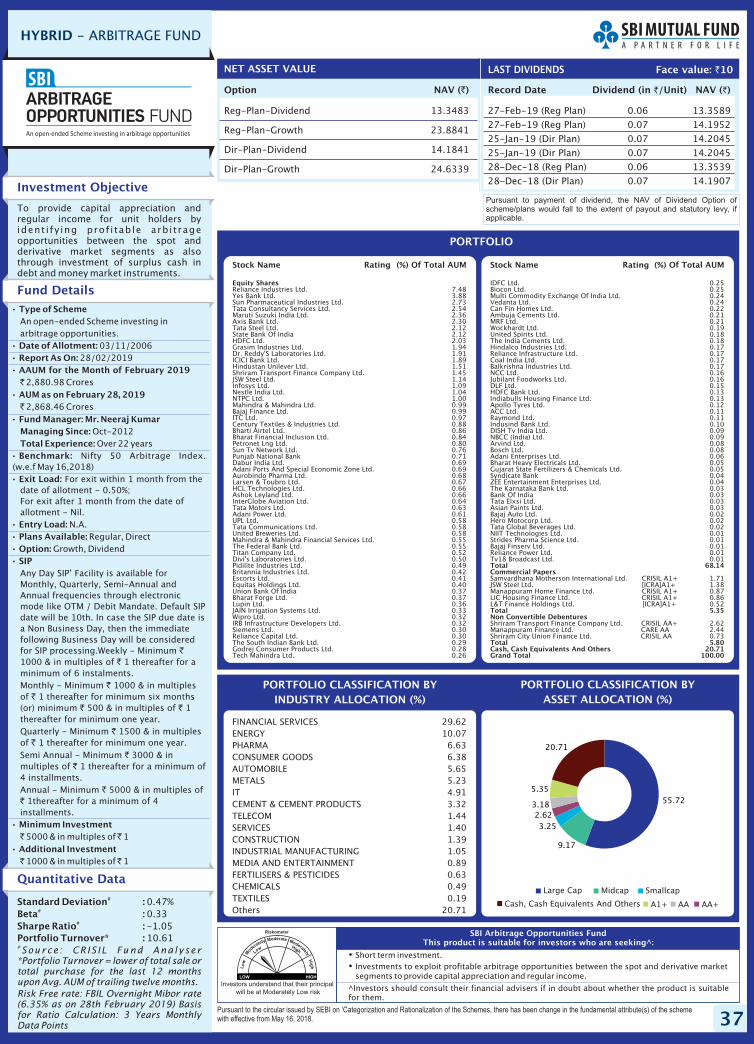
37
HYBRID - ARBITRAGE FUND
Option NAV ( )`
Reg-Plan-Dividend 13.3483
Reg-Plan-Growth 23.8841
Dir-Plan-Dividend 14.1841
Dir-Plan-Growth 24.6339
NET ASSET VALUE
Record Date Dividend NAV ( )`(in /Unit)`
27-Feb-19 (Reg Plan) 0.06 13.3589
27-Feb-19 (Reg Plan) 0.07 14.1952
25-Jan-19 (Dir Plan) 0.07 14.2045
25-Jan-19 (Dir Plan) 0.07 14.2045
28-Dec-18 (Reg Plan) 0.06 13.3539
28-Dec-18 (Dir Plan) 0.07 14.1907
LAST DIVIDENDS
Investors understand that their principal
will be at Moderately Low risk
�
�
Short term investment.Investments to exploit profitable arbitrage opportunities between the spot and derivative marketsegments to provide capital appreciation and regular income.
SBI Arbitrage Opportunities FundThis product is suitable for investors who are seeking^:
Face value: 10`
Investment Objective
Quantitative Data
To provide capital appreciation andregular income for unit holders byident i fy ing prof i table arbi t rageopportunities between the spot andderivative market segments as alsothrough investment of surplus cash indebt and money market instruments.
Fund Details
Standard Deviation :Beta :Sharpe Ratio :Portfolio Turnover* :
#
#
#
0.47%0.33-1.0510.61
#Source : CR IS IL Fund Analyser
*Portfolio Turnover = lower of total sale ortotal purchase for the last 12 monthsupon Avg. AUM of trailing twelve months.
Risk Free rate: FBIL Overnight Mibor rate(6.35% as on 28th February 2019) Basisfor Ratio Calculation: 3 Years MonthlyData Points
PORTFOLIO CLASSIFICATION BY(%)ASSET ALLOCATION
FINANCIAL SERVICES 29.62ENERGY 10.07PHARMA 6.63CONSUMER GOODS 6.38AUTOMOBILE 5.65METALS 5.23IT 4.91CEMENT & CEMENT PRODUCTS 3.32TELECOM 1.44SERVICES 1.40CONSTRUCTION 1.39INDUSTRIAL MANUFACTURING 1.05MEDIA AND ENTERTAINMENT 0.89FERTILISERS & PESTICIDES 0.63CHEMICALS 0.49TEXTILES 0.19Others 20.71
Pursuant to payment of dividend, the NAV of Dividend Option ofscheme/plans would fall to the extent of payout and statutory levy, ifapplicable.
•
•
•
•
•
•
•
•
•
•
•
•
•
•
Type of Scheme
Date of Allotment:Report As On:AAUM for the February 2019
AUM as on February 28, 2019
Fund Manager: Mr. Neeraj KumarManaging Since:Total Experience:Benchmark:
Exit Load:
Entry Load:Plans Available:Option:SIP
Minimum Investment
Additional Investment
An open-ended Scheme investing inarbitrage opportunities.
03/11/200628/02/2019
2,880.98 Crores
2,868.46 Crores
Oct-2012Over 22 years
Nifty 50 Arbitrage Index.(w.e.f May 16,2018)
For exit within 1 month from thedate of allotment - 0.50%;For exit after 1 month from the date ofallotment - Nil.
N.A.Regular, Direct
Growth, Dividend
Any Day SIP’ Facility is available forMonthly, Quarterly, Semi-Annual andAnnual frequencies through electronicmode like OTM / Debit Mandate. Default SIPdate will be 10th. In case the SIP due date isa Non Business Day, then the immediatefollowing Business Day will be consideredfor SIP processing.Weekly - Minimum1000 & in multiples of 1 thereafter for aminimum of 6 instalments.Monthly - Minimum 1000 & in multiplesof 1 thereafter for minimum six months(or) minimum 500 & in multiples of 1thereafter for minimum one year.Quarterly - Minimum 1500 & in multiplesof 1 thereafter for minimum one year.Semi Annual - Minimum 3000 & inmultiples of 1 thereafter for a minimum of4 installments.Annual - Minimum 5000 & in multiples of
1thereafter for a minimum of 4installments.
5000 & in multiples of 1
1000 & in multiples of 1
Month of`
`
`
`
`
`
` `
`
`
`
`
`
`
` `
` `
PORTFOLIO CLASSIFICATION BYINDUSTRY ALLOCATION (%)
PORTFOLIO
Equity SharesReliance Industries Ltd. 7.48Yes Bank Ltd. 3.88Sun Pharmaceutical Industries Ltd. 2.73Tata Consultancy Services Ltd. 2.54Maruti Suzuki India Ltd. 2.36Axis Bank Ltd. 2.30Tata Steel Ltd. 2.12State Bank Of India 2.12HDFC Ltd. 2.03Grasim Industries Ltd. 1.94Dr. Reddy'S Laboratories Ltd. 1.91ICICI Bank Ltd. 1.89Hindustan Unilever Ltd. 1.51Shriram Transport Finance Company Ltd. 1.45JSW Steel Ltd. 1.14Infosys Ltd. 1.09Nestle India Ltd. 1.04NTPC Ltd. 1.00Mahindra & Mahindra Ltd. 0.99Bajaj Finance Ltd. 0.99ITC Ltd. 0.97Century Textiles & Industries Ltd. 0.88Bharti Airtel Ltd. 0.86Bharat Financial Inclusion Ltd. 0.84Petronet Lng Ltd. 0.80Sun Tv Network Ltd. 0.76Punjab National Bank 0.71Dabur India Ltd. 0.69Adani Ports And Special Economic Zone Ltd. 0.69Aurobindo Pharma Ltd. 0.68Larsen & Toubro Ltd. 0.67HCL Technologies Ltd. 0.66Ashok Leyland Ltd. 0.66InterGlobe Aviation Ltd. 0.64Tata Motors Ltd. 0.63Adani Power Ltd. 0.61UPL Ltd. 0.58Tata Communications Ltd. 0.58United Breweries Ltd. 0.58Mahindra & Mahindra Financial Services Ltd. 0.55The Federal Bank Ltd. 0.55Titan Company Ltd. 0.52Divi's Laboratories Ltd. 0.50Pidilite Industries Ltd. 0.49Britannia Industries Ltd. 0.42Escorts Ltd. 0.41Equitas Holdings Ltd. 0.40Union Bank Of India 0.37Bharat Forge Ltd. 0.37Lupin Ltd. 0.36JAIN Irrigation Systems Ltd. 0.33Wipro Ltd. 0.32IRB Infrastructure Developers Ltd. 0.32Siemens Ltd. 0.30Reliance Capital Ltd. 0.30The South Indian Bank Ltd. 0.29Godrej Consumer Products Ltd. 0.28Tech Mahindra Ltd. 0.26
Stock Name Rating (%) Of Total AUM Stock Name Rating (%) Of Total AUM
IDFC Ltd. 0.25Biocon Ltd. 0.25Multi Commodity Exchange Of India Ltd. 0.24Vedanta Ltd. 0.24Can Fin Homes Ltd. 0.22Ambuja Cements Ltd. 0.21MRF Ltd. 0.21Wockhardt Ltd. 0.19United Spirits Ltd. 0.18The India Cements Ltd. 0.18Hindalco Industries Ltd. 0.17Reliance Infrastructure Ltd. 0.17Coal India Ltd. 0.17Balkrishna Industries Ltd. 0.17NCC Ltd. 0.16Jubilant Foodworks Ltd. 0.16DLF Ltd. 0.15HDFC Bank Ltd. 0.13Indiabulls Housing Finance Ltd. 0.13Apollo Tyres Ltd. 0.12ACC Ltd. 0.11Raymond Ltd. 0.11Indusind Bank Ltd. 0.10DISH Tv India Ltd. 0.09NBCC (India) Ltd. 0.09Arvind Ltd. 0.08Bosch Ltd. 0.08Adani Enterprises Ltd. 0.06Bharat Heavy Electricals Ltd. 0.05Gujarat State Fertilizers & Chemicals Ltd. 0.05Syndicate Bank 0.04ZEE Entertainment Enterprises Ltd. 0.04The Karnataka Bank Ltd. 0.03Bank Of India 0.03Tata Elxsi Ltd. 0.03Asian Paints Ltd. 0.03Bajaj Auto Ltd. 0.02Hero Motocorp Ltd. 0.02Tata Global Beverages Ltd. 0.02NIIT Technologies Ltd. 0.01Strides Pharma Science Ltd. 0.01Bajaj Finserv Ltd. 0.01Reliance Power Ltd. 0.01Tv18 Broadcast Ltd. 0.01
Samvardhana Motherson International Ltd. CRISIL A1+ 1.71JSW Steel Ltd. [ICRA]A1+ 1.38Manappuram Home Finance Ltd. CRISIL A1+ 0.87LIC Housing Finance Ltd. CRISIL A1+ 0.86L&T Finance Holdings Ltd. [ICRA]A1+ 0.52
Shriram Transport Finance Company Ltd. CRISIL AA+ 2.62Manappuram Finance Ltd. CARE AA 2.44Shriram City Union Finance Ltd. CRISIL AA 0.73
Total 68.14Commercial Papers
Total 5.35Non Convertible Debentures
Total 5.80Cash, Cash Equivalents And Others 20.71Grand Total 100.00
^Investors should consult their financial advisers if in doubt about whether the product is suitablefor them.
Pursuant to the circular issued by SEBI on ‘Categorization and Rationalization of the Schemes, there has been change in the fundamental attribute(s) of the schemewith effective from May 16, 2018.
SmallcapLarge Cap Midcap
Cash, Cash Equivalents And Others A1+ AA AA+
55.72
9.17
3.252.62
3.18
5.35
20.71
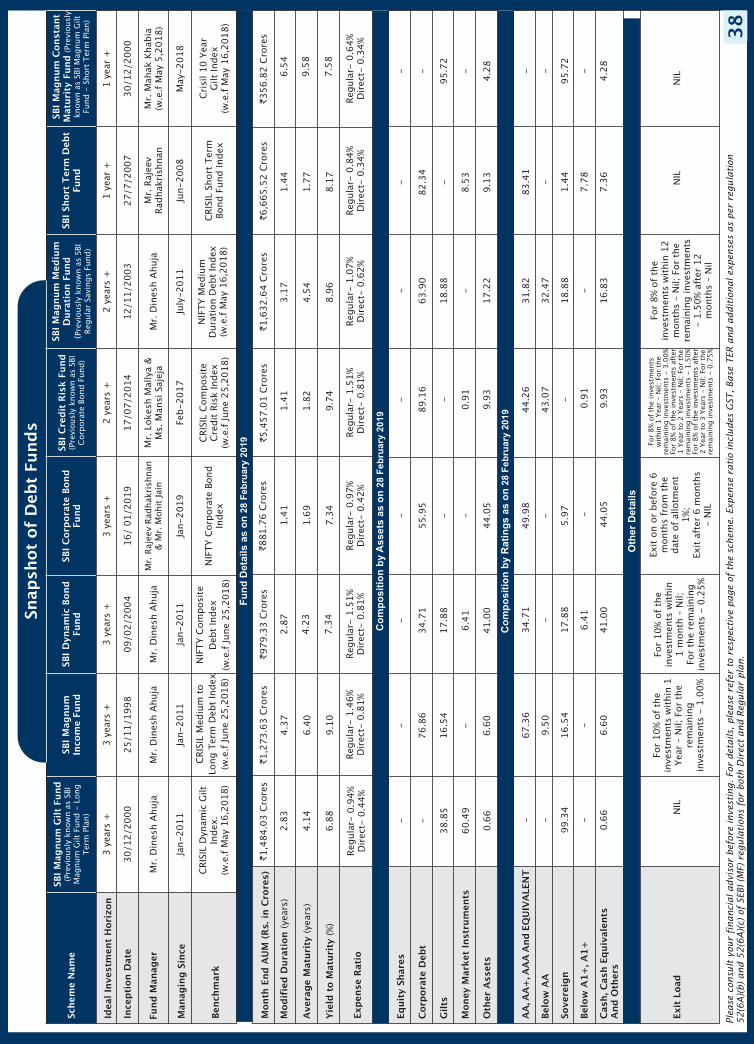
Co
mp
osit
ion
by R
ati
ng
s a
s o
n28 F
eb
ruary
2019
AA
, AA
+, A
AA
And
EQ
UIV
ALE
NT
Bel
ow
AA
Sover
eign
Bel
ow
A1+
, A1+
Cash
, Cash
Eq
uiv
ale
nts
And
Oth
ers
Exit
Load
NIL
NIL
Fu
nd
Deta
ils a
s o
n28 F
eb
ruary
2019
Month
End
AU
M (
Rs.
in C
rore
s)`1,4
84.0
3 C
rore
s`1,2
73.6
3 C
rore
s`979.3
3 C
rore
s`881.7
6 C
rore
s`5,4
57.0
1 C
rore
s`1,6
32.6
4 C
rore
s`6,6
65.5
2 C
rore
s`356.8
2 C
rore
s
Exp
ense
Rati
oReg
ula
r- 0
.94%
Dir
ect-
0.4
4%
Reg
ula
r- 1
.46%
Dir
ect-
0.8
1%
Reg
ula
r- 1
.51%
Dir
ect-
0.8
1%
Reg
ula
r- 0
.97%
Dir
ect-
0.4
2%
Reg
ula
r- 1
.51%
Dir
ect-
0.8
1%
Reg
ula
r- 1
.07%
Dir
ect-
0.6
2%
Reg
ula
r- 0
.84%
Dir
ect-
0.3
4%
Reg
ula
r- 0
.64%
Dir
ect-
0.3
4%
Mod
ifie
d D
ura
tion
Aver
age
Matu
rity
(yea
rs)
(yea
rs)
Yie
ld t
o M
atu
rity
(%)
2.8
3
4.1
4
6.8
8
4.3
7
6.4
0
9.1
0
2.8
7
4.2
3
7.3
4
1.4
1
1.8
2
9.7
4
3.1
7
4.5
4
8.9
6
1.4
4
1.7
7
8.1
7
6.5
4
9.5
8
7.5
8
Snap
shot
of
Fund
sD
ebt
Schem
e N
am
e
SBI
Magnum
Gilt
Fund
(Pre
viousl
y kn
ow
n a
s SB
IM
agnum
Gilt
Fund -
Long
Ter
m P
lan)
SBI
Magnum
Inco
me
Fund
SBI
Dyn
am
ic B
ond
Fund
SBI
Corp
ora
te B
ond
Fund
SBI
Cre
dit
Ris
k F
und
(Pre
viousl
y kn
ow
n a
s SB
IC
orp
ora
te B
ond F
und)
SBI
Magnum
Med
ium
Dura
tion F
und
( Pre
viousl
y kn
ow
n a
s SB
IReg
ula
r Sa
vings
Fund)
SBI
Short
Ter
m D
ebt
Fund
Idea
l In
ves
tmen
t H
ori
zon
3ye
ars
+3
year
s+
3ye
ars
+3
year
s+
2ye
ars
+2
year
s+
1ye
ar+
1ye
ar+
Ince
pti
on D
ate
30
/12
/20
00
25
/11
/19
98
09
/02
/20
04
16
/0
1/2
01
91
7/0
7/2
01
41
2/1
1/2
00
32
7/7
/20
07
30
/12
/20
00
Fund
Manager
Mr.
Din
esh A
huja
Mr.
Din
esh A
huja
Mr.
Din
esh A
huja
Mr.
Raj
eev
Rad
hak
rish
na n
& M
r. M
ohit
Ja i
nM
r. L
oke
sh M
ally
a&
Ms.
Man
si S
ajej
aM
r. D
ines
h A
huja
Mr.
Raj
eev
Rad
hak
rish
nan
Mr.
Mah
ak K
hab
ia(w
.e.f
May
5,2
018)
Managin
g S
ince
Jan-2
011
Jan-2
011
Jan-2
011
Jan-2
019
Feb-2
017
July
-2011
Jun-2
008
May
-20
18
Ben
chm
ark
NIF
TY C
orp
ora
te B
ond
Index
CRIS
IL C
om
posi
teC
redit
Ris
k In
dex
(w.e
.f June
25,2
018)
CRIS
IL S
hort
Ter
mBo
nd F
und Index
Co
mp
osit
ion
by
Assets
as o
n28 F
eb
ruary
2019
Eq
uit
y Sh
are
s
Corp
ora
te D
ebt
Gilts
Money
Mark
et I
nst
rum
ents
Oth
er A
sset
s
– -
38.8
5
60.4
9
0.6
6
-
76.8
6
16.5
4
-
6.6
0
-
34.7
1
17.8
8
6.4
1
41.0
0
-
89.1
6
-
0.9
1
9.9
3
-
63.9
0
18.8
8
-
17.2
2
-
82.3
4
-
8.5
3
9.1
3
- -
95.7
2
-
4.2
8
- -
99.3
4
-
0.6
6
67.3
6
9.5
0
16.5
4
-
6.6
0
34.7
1
-
17.8
8
6.4
1
41.0
0
44.2
6
-
0.9
1
9.9
3
43.0
7
31.8
2
32.4
7
18.8
8
-
16.8
3
83.4
1
-
1.4
4
7.7
8
7.3
6
- -
95.7
2
-
4.2
8
For
10%
of
the
inve
stm
ents
wit
hin
1Yea
r–
Nil;
For
the
rem
ainin
gin
vest
men
ts -
1.0
0%
For
10%
of
the
inve
stm
ents
1 m
onth
–N
il;Fo
r th
e re
mai
nin
gin
vest
men
ts -
0.2
5%
wit
hin
For
8%
of
the
inve
stm
ents
wit
hin
12
month
s–
Nil;
For
the
rem
ainin
g inve
stm
ents
- 1.5
0%
aft
er 1
2m
onth
s–
Nil
For
8%
of
the
inve
stm
ents
1 Y
ear
–N
il; F
or
the
rem
ainin
g inve
stm
ents
- 3
.00%
For
8%
of
the
inve
stm
ents
aft
er1 Y
ear
to 2
Yea
rs–
Nil;
For
the
rem
ainin
g inve
stm
ents
- 1
.50%
For
8%
of
the
inve
stm
ents
aft
er2 Y
ear
to 3
Yea
rs–
Nil;
For
the
rem
ainin
g inve
stm
ents
- 0
.75%
wit
hin
Ple
ase
consu
lt y
our
financia
l advis
or
befo
re invest
ing. For
deta
ils,
ple
ase
refe
r to
resp
ecti
ve p
age o
f th
e s
chem
e. Expense
rati
o inclu
des
GST, Base
TER a
nd a
ddit
ional expense
s as
per
regula
tion
52(6
A)(
b)
and 5
2(6
A)(
c)
of
SEBI (M
F)
regula
tions
for
both
Dir
ect
and R
egula
r pla
n.
SBI
Magnum
Const
ant
Matu
rity
Fund
(Pre
viousl
ykn
ow
n a
s SB
I M
agnum
Gilt
Fund -
Short
Ter
m P
lan)
CRIS
IL D
ynam
ic G
iltIn
dex
.(w
.e.f
May
16,2
018)
CRIS
IL M
ediu
m t
oLo
ng T
erm
Deb
t In
dex
(w.e
.f June
25,2
018)
NIF
TY C
om
posi
teD
ebt
Index
(w.e
.f June
25,2
018)
NIF
TY M
ediu
mD
ura
tion D
ebt
Index
(w.e
.f M
ay 1
6,2
018)
Cri
sil 10 Y
ear
Gilt
Index
(w.e
.f M
ay 1
6,2
018)
Oth
er
Deta
ils
-
55.9
5
- -
44.0
5
49.9
8
5.9
7
-
44.0
5
-
Exit
on o
r bef
ore
6m
onth
s fr
om
the
dat
e of
allo
tmen
t1%
;Ex
it a
fter
6 m
onth
s-
NIL
1.4
1
1.6
9
7.3
4
38
NIL
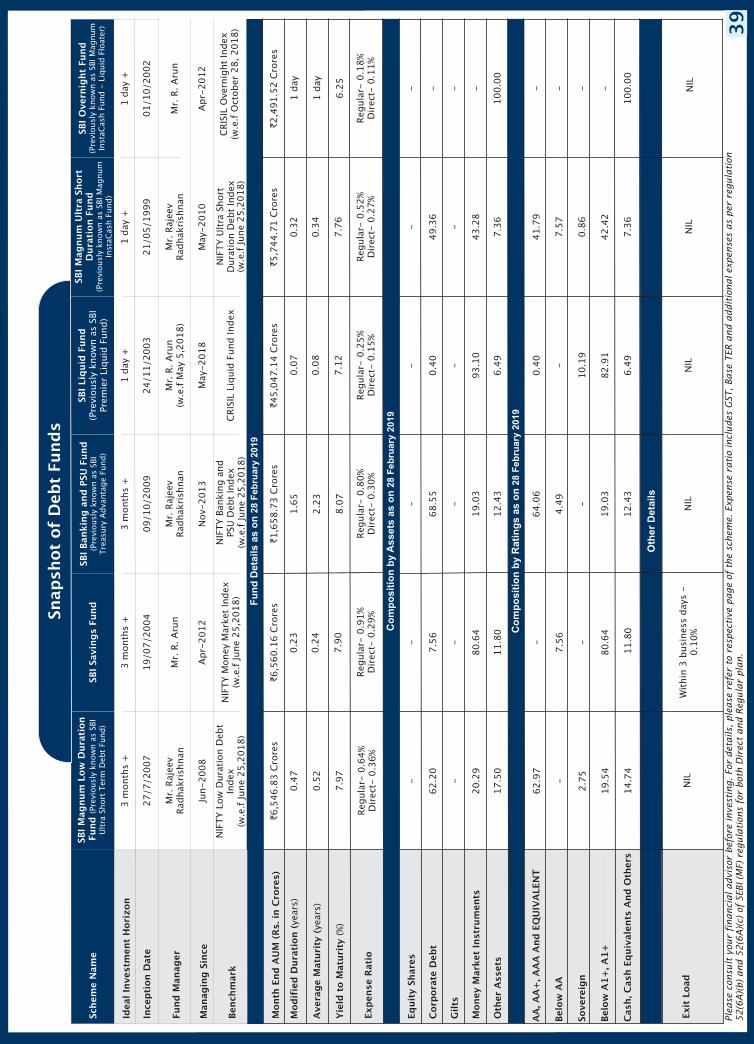
Co
mp
osit
ion
by R
ati
ng
s a
s o
n28 F
eb
ruary
2019
Exit
Load
NIL
Wit
hin
3 b
usi
nes
s day
s -
0.1
0%
NIL
NIL
NIL
AA
, AA
+, A
AA
And
EQ
UIV
ALE
NT
Bel
ow
AA
Sover
eign
Bel
ow
A1+
, A1+
Cash
, Cash
Eq
uiv
ale
nts
And
Oth
ers
Oth
er
Deta
ils
Fu
nd
Deta
ils a
s o
n28 F
eb
ruary
2019
Month
End
AU
M (
Rs.
in C
rore
s)`6,5
46.8
3 C
rore
s`6,5
60.1
6 C
rore
s`1,6
58.7
3 C
rore
s`45,0
47.1
4 C
rore
s`5,7
44.7
1 C
rore
s`2,4
91.5
2 C
rore
s
Exp
ense
Rati
oReg
ula
r- 0
.64%
Dir
ect-
0.3
6%
Reg
ula
r- 0
.91%
Dir
ect-
0.2
9%
Reg
ula
r- 0
.80%
Dir
ect-
0.3
0%
Reg
ula
r0.2
5%
Dir
ect-
0.1
5%
-Reg
ula
r- 0
.52%
Dir
ect-
0.2
7%
Reg
ula
r- 0
.18%
Dir
ect-
0.1
1%
Mod
ifie
d D
ura
tion (
Aver
age
Matu
rity
Yie
ld t
o M
atu
rity
year
s)
year
s)
(%)
(
0.4
7
0.5
2
7.9
7
0.2
3
0.2
4
7.9
0
1.6
5
2.2
3
8.0
7
0.0
7
0.0
8
7.1
2
0.3
2
0.3
4
7.7
6
1 d
ay
1 d
ay
6.2
5
Schem
e N
am
eSB
I Sa
vin
gs
Fund
SBI
Bankin
g a
nd
PSU
Fund
(Pre
viousl
y kn
ow
n a
s SB
ITre
asury
Adva
nta
ge
Fund)
SBI
Liq
uid
Fund
(Pre
viousl
y kn
ow
n a
s SB
IPr
emie
r Li
quid
Fund)
Idea
l In
ves
tmen
t H
ori
zon
3m
onth
s+
3m
onth
s+
3m
onth
s+
1day
+1
day
+1
day
+
Ince
pti
on D
ate
27
/7/2
00
71
9/0
7/2
00
409/1
0/2
009
24/1
1/2
003
21/0
5/1
999
01/1
0/2
002
Fund
Manager
Mr.
Raj
eev
Rad
hak
rish
nan
Mr.
R. A
run
Mr.
Raj
eev
Rad
hak
rish
nan
Mr.
R. A
run
(w.e
.f M
ay 5
,2018)
Mr.
Raj
eev
Rad
hak
rish
nan
Mr.
R. A
run
Managin
g S
ince
Jun-2
008
Apr-
2012
Nov-
2013
May
-20
18
May
-2010
Apr-
2012
Ben
chm
ark
NIF
TY M
oney
Mar
ket
Index
(w.e
.f June
25,2
018)
CRIS
IL L
iquid
Fund Index
Co
mp
osit
ion
by
Assets
as o
n28 F
eb
ruary
2019
Eq
uit
y Sh
are
s
Corp
ora
te D
ebt
Gilts
Money
Mark
et I
nst
rum
ents
Oth
er A
sset
s
-
62.2
0
-
20.2
9
17.5
0
-
7.5
6
-
80.6
4
11.8
0
-
68.5
5
-
19.0
3
12.4
3
-
0.4
0
-
93.1
0
6.4
9
-
49.3
6
-
43.2
8
7.3
6
- - - -
100.0
0
62.9
7
-
2.7
5
19.5
4
14.7
4
-
7.5
6
-
80.6
4
11.8
0
64.0
6
4.4
9
-
19.0
3
12.4
3
0.4
0
-
10.1
9
82.9
1
6.4
9
41.7
9
7.5
7
0.8
6
42.4
2
7.3
6
- - - -
100.0
0
Snap
shot
of
Deb
t Fu
nd
s
Ple
ase
consu
lt y
our
financia
l advis
or
befo
re invest
ing. For
deta
ils,
ple
ase
refe
r to
resp
ecti
ve p
age o
f th
e s
chem
e. Expense
rati
o inclu
des
GST, Base
TER a
nd a
ddit
ional expense
s as
per
regula
tion
52(6
A)(
b)
and 5
2(6
A)(
c)
of
SEBI (M
F)
regula
tions
for
both
Dir
ect
and R
egula
r pla
n.
SBI
Over
nig
ht
Fund
( Pre
viousl
y kn
ow
n a
s SB
I M
agnum
Inst
aCas
h F
und -
Liq
uid
Flo
a ter
)
SBI
Magnum
Ult
ra S
hort
Dura
tion F
und
(Pre
viousl
y kn
ow
n a
s SB
I M
agnum
Inst
aCas
h F
und)
SBI
Magnum
Low
Dura
tion
Fund
(Pre
viousl
y kn
ow
n a
s SB
IU
ltra
Short
Ter
m D
ebt
Fund)
CRIS
IL O
vern
ight
Index
(w.e
.f O
ctober
28, 2018)
NIF
TY U
ltra
Short
Dura
tion D
ebt
Index
(w.e
.f June
25,2
018)
NIF
TY B
anki
ng a
nd
PSU
Deb
t In
dex
(w.e
.f June
25,2
018)
NIF
TY L
ow
Dura
tion D
ebt
Index
(w.e
.f June
25,2
018)
NIL
39
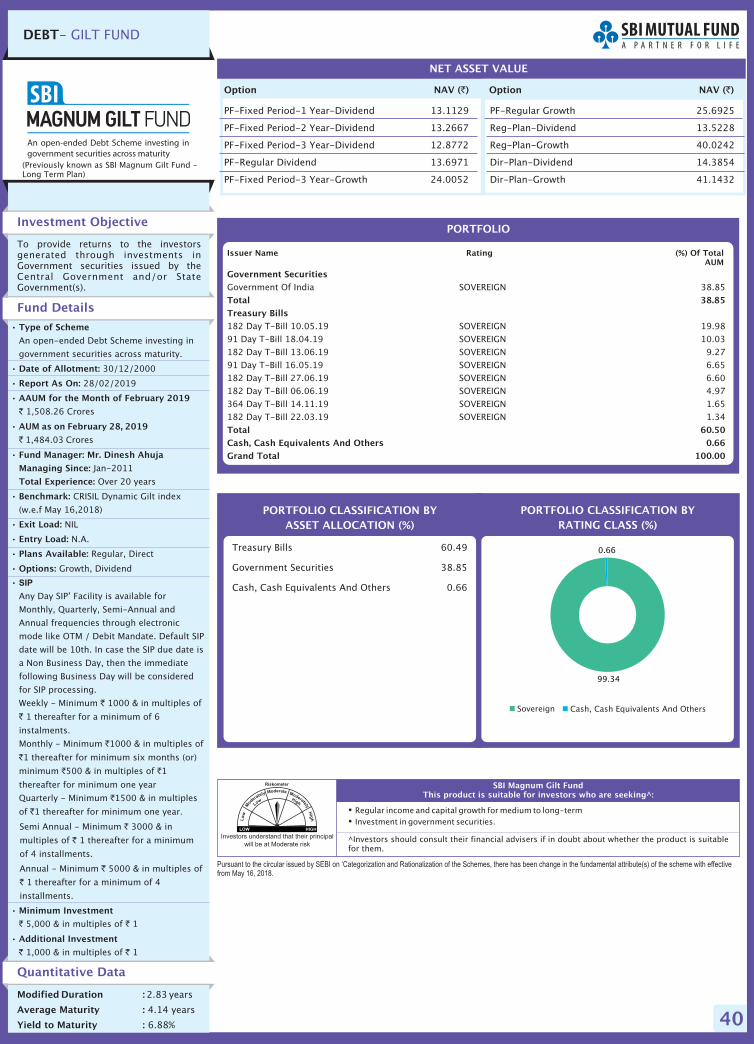
40
DEBT- GILT FUND
Investment Objective
Quantitative Data
To provide returns to the investorsgenerated through investments inGovernment securities issued by theCentral Government and/or StateGovernment(s).
Fund Details
Modified Duration :
Average Maturity :
Yield to Maturity :
2.83
4.14 years
6.88%
years
•
•
•
•
•
•
•
•
•
•
•
•
•
•
Type of Scheme
Date of Allotment:
Report As On:
AAUM for the February 2019
AUM as on February 28, 2019
Fund Manager: Mr. Dinesh Ahuja
Managing Since:
Total Experience:
Benchmark:
Exit Load:
Entry Load:
Plans Available:
Options:
Minimum Investment
Additional Investment
An open-ended Debt Scheme investing in
government securities across maturity.
30/12/2000
28/02/2019
1,508.26 Crores
1,484.03 Crores
Jan-2011
Over 20 years
CRISIL Dynamic Gilt index
(w.e.f May 16,2018)
NIL
N.A.
Regular, Direct
Growth, Dividend
Any Day SIP’ Facility is available for
Monthly, Quarterly, Semi-Annual and
Annual frequencies through electronic
mode like OTM / Debit Mandate. Default SIP
date will be 10th. In case the SIP due date is
a Non Business Day, then the immediate
following Business Day will be considered
for SIP processing.
Weekly - Minimum 1000 & in multiples of
1 thereafter for a minimum of 6
instalments.
Monthly - Minimum 1000 & in multiples of
1 thereafter for minimum six months (or)
minimum 500 & in multiples of 1
thereafter for minimum one year
Quarterly - Minimum 1500 & in multiples
of 1 thereafter for minimum one year.
Semi Annual - Minimum 3000 & in
multiples of 1 thereafter for a minimum
of 4 installments.
Annual - Minimum 5000 & in multiples of
1 thereafter for a minimum of 4
installments.
5,000 & in multiples of 1
1,000 & in multiples of 1
Month of
`
`
`
`
`
`
` `
`
`
`
`
`
`
` `
` `
SIP
Option NAV ( )`
PF-Fixed Period-1 Year-Dividend 13.1129
PF-Fixed Period-2 Year-Dividend 13.2667
PF-Fixed Period-3 Year-Dividend 12.8772
PF-Regular Dividend 13.6971
PF-Fixed Period-3 Year-Growth 24.0052
NET ASSET VALUE
Option NAV ( )`
PF-Regular Growth 25.6925
Reg-Plan-Dividend 13.5228
Reg-Plan-Growth 40.0242
Dir-Plan-Dividend 14.3854
Dir-Plan-Growth 41.1432
PORTFOLIO CLASSIFICATION BYRATING CLASS (%)
Treasury Bills 60.49
Government Securities 38.85
Cash, Cash Equivalents And Others 0.66
PORTFOLIO CLASSIFICATION BYASSET ALLOCATION (%)
Investors understand that their principal
will be at Moderate risk
�
�
Regular income and capital growth for medium to long-termInvestment in government securities.
Pursuant to the circular issued by SEBI on ‘Categorization and Rationalization of the Schemes, there has been change in the fundamental attribute(s) of the scheme with effectivefrom May 16, 2018.
SBI Magnum Gilt FundThis product is suitable for investors who are seeking^:
^Investors should consult their financial advisers if in doubt about whether the product is suitablefor them.
PORTFOLIO
Government Securities
Total 38.85
Treasury Bills
Total 60.50
Cash, Cash Equivalents And Others 0.66
Grand Total 100.00
Government Of India SOVEREIGN 38.85
182 Day T-Bill 10.05.19 SOVEREIGN 19.98
91 Day T-Bill 18.04.19 SOVEREIGN 10.03
182 Day T-Bill 13.06.19 SOVEREIGN 9.27
91 Day T-Bill 16.05.19 SOVEREIGN 6.65
182 Day T-Bill 27.06.19 SOVEREIGN 6.60
182 Day T-Bill 06.06.19 SOVEREIGN 4.97
364 Day T-Bill 14.11.19 SOVEREIGN 1.65
182 Day T-Bill 22.03.19 SOVEREIGN 1.34
Issuer Name Rating (%) Of TotalAUM
Sovereign Cash, Cash Equivalents And Others
(Previously known as SBI Magnum Gilt Fund -Long Term Plan)
99.34
0.66
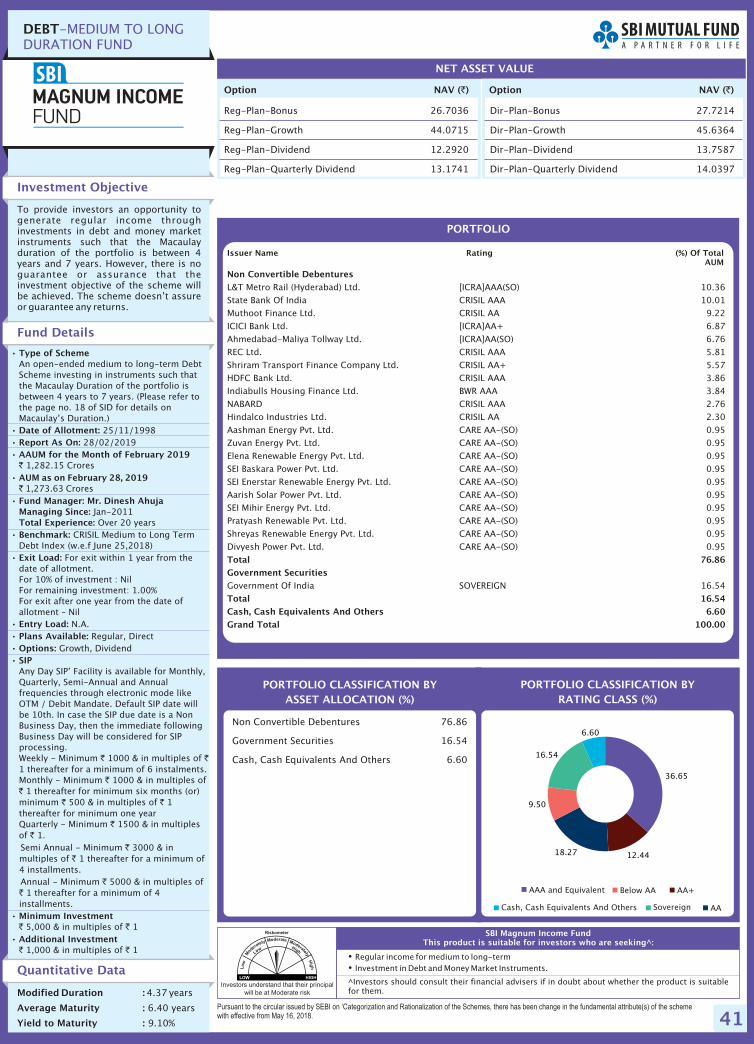
41
DEBT-MEDIUM TO LONGDURATION FUND
Option NAV ( )`
Reg-Plan-Bonus 26.7036
Reg-Plan-Growth 44.0715
Reg-Plan-Dividend 12.2920
Reg-Plan-Quarterly Dividend 13.1741
NET ASSET VALUE
Option NAV ( )`
�
�
Regular income for medium to long-termInvestment in Debt and Money Market Instruments.
Pursuant to the circular issued by SEBI on ‘Categorization and Rationalization of the Schemes, there has been change in the fundamental attribute(s) of the schemewith effective from May 16, 2018.
SBI Magnum Income FundThis product is suitable for investors who are seeking^:
Investment Objective
Quantitative Data
To provide investors an opportunity togenerate regular income throughinvestments in debt and money marketinstruments such that the Macaulayduration of the portfolio is between 4years and 7 years. However, there is noguarantee or assurance that theinvestment objective of the scheme willbe achieved. The scheme doesn’t assureor guarantee any returns.
Fund Details
Modified Duration :
Average Maturity :
Yield to Maturity :
4.37
6.40 years
9.10%
years
PORTFOLIO CLASSIFICATION BYRATING CLASS (%)
Non Convertible Debentures 76.86
Government Securities 16.54
Cash, Cash Equivalents And Others 6.60
•
•
•
•
•
•
•
•
•
•
•
•
•
•
Type of Scheme
Date of Allotment:Report As On:AAUM for the February 2019
AUM as on February 28, 2019
Fund Manager: Mr. Dinesh AhujaManaging Since:Total Experience:Benchmark:
Exit Load:
Entry Load:Plans Available:Options:SIP
Minimum Investment
Additional Investment
An open-ended medium to long-term DebtScheme investing in instruments such thatthe Macaulay Duration of the portfolio isbetween 4 years to 7 years. (
25/11/199828/02/2019
1,282.15 Crores
1,273.63 Crores
Jan-2011Over 20 years
CRISIL Medium to Long TermDebt Index
For exit within 1 year from thedate of allotment.For 10% of investment : NilFor remaining investment: 1.00%For exit after one year from the date ofallotment – Nil
N.A.Regular, Direct
Growth, Dividend
Any Day SIP’ Facility is available for Monthly,Quarterly, Semi-Annual and Annualfrequencies through electronic mode likeOTM / Debit Mandate. Default SIP date willbe 10th. In case the SIP due date is a NonBusiness Day, then the immediate followingBusiness Day will be considered for SIPprocessing.Weekly - Minimum 1000 & in multiples of1 thereafter for a minimum of 6 instalments.Monthly - Minimum 1000 & in multiples of
1 thereafter for minimum six months (or)minimum 500 & in multiples of 1thereafter for minimum one yearQuarterly - Minimum 1500 & in multiplesof 1.Semi Annual - Minimum 3000 & inmultiples of 1 thereafter for a minimum of4 installments.Annual - Minimum 5000 & in multiples of
1 thereafter for a minimum of 4installments.
5,000 & in multiples of 1
1,000 & in multiples of 1
Month of`
`
` `
`
`
` `
`
`
`
`
`
`
` `
` `
Please refer tothe page no. 18 of SID for details onMacaulay’s Duration.)
(w.e.f June 25,2018)
PORTFOLIO CLASSIFICATION BYASSET ALLOCATION (%)
Dir-Plan-Bonus 27.7214
Dir-Plan-Growth 45.6364
Dir-Plan-Dividend 13.7587
Dir-Plan-Quarterly Dividend 14.0397
^Investors should consult their financial advisers if in doubt about whether the product is suitablefor them.
Investors understand that their principal
will be at Moderate risk
PORTFOLIO
Non Convertible Debentures
Total 76.86
Government Securities
Total 16.54
Cash, Cash Equivalents And Others 6.60
Grand Total 100.00
L&T Metro Rail (Hyderabad) Ltd. [ICRA]AAA(SO) 10.36
State Bank Of India CRISIL AAA 10.01
Muthoot Finance Ltd. CRISIL AA 9.22
ICICI Bank Ltd. [ICRA]AA+ 6.87
Ahmedabad-Maliya Tollway Ltd. [ICRA]AA(SO) 6.76
REC Ltd. CRISIL AAA 5.81
Shriram Transport Finance Company Ltd. CRISIL AA+ 5.57
HDFC Bank Ltd. CRISIL AAA 3.86
Indiabulls Housing Finance Ltd. BWR AAA 3.84
NABARD CRISIL AAA 2.76
Hindalco Industries Ltd. CRISIL AA 2.30
Aashman Energy Pvt. Ltd. CARE AA-(SO) 0.95
Zuvan Energy Pvt. Ltd. CARE AA-(SO) 0.95
Elena Renewable Energy Pvt. Ltd. CARE AA-(SO) 0.95
SEI Baskara Power Pvt. Ltd. CARE AA-(SO) 0.95
SEI Enerstar Renewable Energy Pvt. Ltd. CARE AA-(SO) 0.95
Aarish Solar Power Pvt. Ltd. CARE AA-(SO) 0.95
SEI Mihir Energy Pvt. Ltd. CARE AA-(SO) 0.95
Pratyash Renewable Pvt. Ltd. CARE AA-(SO) 0.95
Shreyas Renewable Energy Pvt. Ltd. CARE AA-(SO) 0.95
Divyesh Power Pvt. Ltd. CARE AA-(SO) 0.95
Government Of India SOVEREIGN 16.54
Issuer Name Rating (%) Of TotalAUM
AAA and Equivalent Below AA AA+
AASovereignCash, Cash Equivalents And Others
36.65
12.4418.27
9.50
16.54
6.60
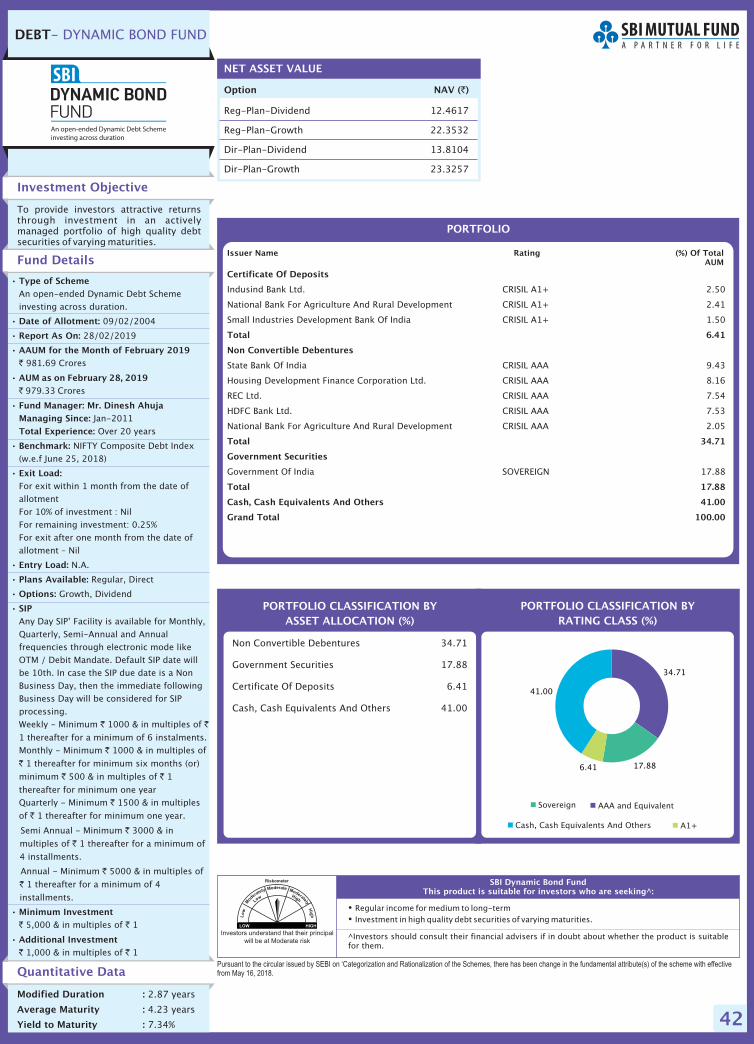
42
DEBT- DYNAMIC BOND FUND
Option NAV ( )`
Reg-Plan-Dividend 12.4617
Reg-Plan-Growth 22.3532
Dir-Plan-Dividend 13.8104
Dir-Plan-Growth 23.3257
NET ASSET VALUE
Investors understand that their principal
will be at Moderate risk
�
�
Regular income for medium to long-termInvestment in high quality debt securities of varying maturities.
Pursuant to the circular issued by SEBI on ‘Categorization and Rationalization of the Schemes, there has been change in the fundamental attribute(s) of the scheme with effectivefrom May 16, 2018.
SBI Dynamic Bond FundThis product is suitable for investors who are seeking^:
Investment Objective
Quantitative Data
To provide investors attractive returnsthrough investment in an activelymanaged portfolio of high quality debtsecurities of varying maturities.
Fund Details
Modified Duration :
Average Maturity :
Yield to Maturity :
2.87 years
4.23 years
7.34%
PORTFOLIO CLASSIFICATION BYRATING CLASS (%)
Non Convertible Debentures 34.71
Government Securities 17.88
Certificate Of Deposits 6.41
Cash, Cash Equivalents And Others 41.00
•
•
•
•
•
•
•
•
•
•
•
•
•
•
Type of Scheme
Date of Allotment:
Report As On:
AAUM for the February 2019
AUM as on February 28, 2019
Fund Manager: Mr. Dinesh Ahuja
Managing Since:
Total Experience:
Benchmark:
Exit Load:
Entry Load:
Plans Available:
Options:
SIP
Minimum Investment
Additional Investment
An open-ended Dynamic Debt Scheme
investing across duration.
09/02/2004
28/02/2019
981.69 Crores
979.33 Crores
Jan-2011
Over 20 years
NIFTY Composite Debt Index
For exit within 1 month from the date of
allotment
For 10% of investment : Nil
For remaining investment: 0.25%
For exit after one month from the date of
allotment – Nil
N.A.
Regular, Direct
Growth, Dividend
Any Day SIP’ Facility is available for Monthly,
Quarterly, Semi-Annual and Annual
frequencies through electronic mode like
OTM / Debit Mandate. Default SIP date will
be 10th. In case the SIP due date is a Non
Business Day, then the immediate following
Business Day will be considered for SIP
processing.
Weekly - Minimum 1000 & in multiples of
1 thereafter for a minimum of 6 instalments.
Monthly - Minimum 1000 & in multiples of
1 thereafter for minimum six months (or)
minimum 500 & in multiples of 1
thereafter for minimum one year
Quarterly - Minimum 1500 & in multiples
of 1 thereafter for minimum one year.
Semi Annual - Minimum 3000 & in
multiples of 1 thereafter for a minimum of
4 installments.
Annual - Minimum 5000 & in multiples of
1 thereafter for a minimum of 4
installments.
5,000 & in multiples of 1
1,000 & in multiples of 1
Month of
`
`
` `
`
`
` `
`
`
`
`
`
`
` `
` `
(w.e.f June 25, 2018)
PORTFOLIO CLASSIFICATION BYASSET ALLOCATION (%)
^Investors should consult their financial advisers if in doubt about whether the product is suitablefor them.
PORTFOLIO
Certificate Of Deposits
Total 6.41
Non Convertible Debentures
Total 34.71
Government Securities
Total 17.88
Cash, Cash Equivalents And Others 41.00
Grand Total 100.00
Indusind Bank Ltd. CRISIL A1+ 2.50
National Bank For Agriculture And Rural Development CRISIL A1+ 2.41
Small Industries Development Bank Of India CRISIL A1+ 1.50
State Bank Of India CRISIL AAA 9.43
Housing Development Finance Corporation Ltd. CRISIL AAA 8.16
REC Ltd. CRISIL AAA 7.54
HDFC Bank Ltd. CRISIL AAA 7.53
National Bank For Agriculture And Rural Development CRISIL AAA 2.05
Government Of India SOVEREIGN 17.88
Issuer Name Rating (%) Of TotalAUM
Cash, Cash Equivalents And Others A1+
AAA and EquivalentSovereign
34.71
17.886.41
41.00
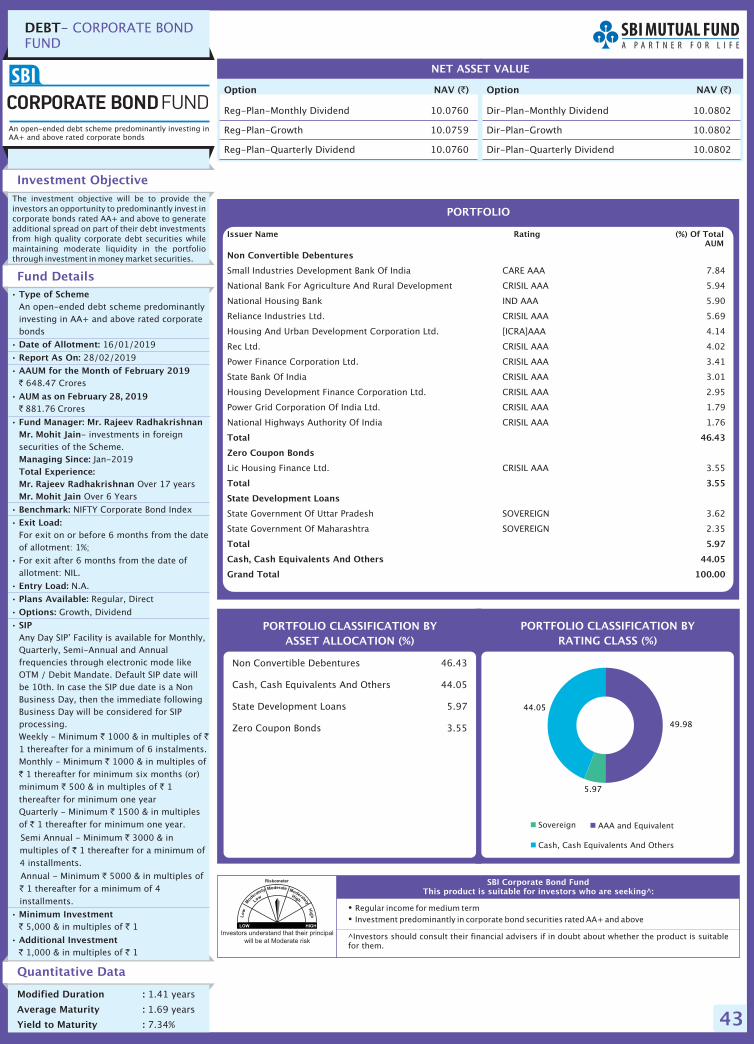
43
DEBT- CORPORATE BONDFUND
Option NAV ( )` Option NAV ( )`
Reg-Plan-Monthly Dividend
Reg-Plan-Growth
Reg Quarterly Dividend
10.0760
10.0759
-Plan- 10.0760
Dir-Plan- 10.0802
10.0802
Dir-Plan-Quarterly Dividend 10.0802
Monthly Dividend
Dir-Plan-Growth
NET ASSET VALUE
Investors understand that their principal
will be at Moderate risk
�
�
Regular income for medium termInvestment predominantly in corporate bond securities rated AA+ and above
SBI Corporate Bond FundThis product is suitable for investors who are seeking^:
Investment Objective
Quantitative Data
The investment objective will be to provide theinvestors an opportunity to predominantly invest incorporate bonds rated AA+ and above to generateadditional spread on part of their debt investmentsfrom high quality corporate debt securities whilemaintaining moderate liquidity in the portfoliothrough investment in money market securities.
Fund Details
Modified Duration :
Average Maturity :
Yield to Maturity :
1.41 years
1.69 years
7.34%
PORTFOLIO CLASSIFICATION BYRATING CLASS (%)
Non Convertible Debentures 46.43
Cash, Cash Equivalents And Others 44.05
State Development Loans 5.97
Zero Coupon Bonds 3.55
•
•
•
•
•
•
•
•
•
•
•
•
•
•
•
Type of Scheme
Date of Allotment:
Report As On:
AAUM for the February 2019
AUM as on February 28, 2019
Fund Manager: Mr. Rajeev RadhakrishnanMr. Mohit Jain
Managing Since:Total Experience:Mr. Rajeev RadhakrishnanMr. Mohit Jain
Benchmark:
Exit Load:
Entry Load:
Plans Available:
Options:
SIP
Minimum Investment
Additional Investment
An open-ended debt scheme predominantlyinvesting in AA+ and above rated corporatebonds
16/01/2019
28/02/2019
648.47 Crores
881.76 Crores
- investments in foreignsecurities of the Scheme.
Jan-2019
Over 17 yearsOver 6 Years
NIFTY Corporate Bond Index
For exit on or before 6 months from the dateof allotment: 1%;
For exit after 6 months from the date ofallotment: NIL.
N.A.
Regular, Direct
Growth, Dividend
Any Day SIP’ Facility is available for Monthly,Quarterly, Semi-Annual and Annualfrequencies through electronic mode likeOTM / Debit Mandate. Default SIP date willbe 10th. In case the SIP due date is a NonBusiness Day, then the immediate followingBusiness Day will be considered for SIPprocessing.Weekly - Minimum 1000 & in multiples of1 thereafter for a minimum of 6 instalments.Monthly - Minimum 1000 & in multiples of
1 thereafter for minimum six months (or)minimum 500 & in multiples of 1thereafter for minimum one yearQuarterly - Minimum 1500 & in multiplesof 1 thereafter for minimum one year.
Semi Annual - Minimum 3000 & inmultiples of 1 thereafter for a minimum of4 installments.
Annual - Minimum 5000 & in multiples of1 thereafter for a minimum of 4
installments.
5,000 & in multiples of 1
1,000 & in multiples of 1
Month of`
`
` `
`
`
` `
`
`
`
`
`
`
` `
` `
PORTFOLIO CLASSIFICATION BYASSET ALLOCATION (%)
^Investors should consult their financial advisers if in doubt about whether the product is suitablefor them.
PORTFOLIO
Non Convertible Debentures
Total 46.43
Zero Coupon Bonds
Total 3.55
State Development Loans
Total 5.97
Cash, Cash Equivalents And Others 44.05
Grand Total 100.00
Small Industries Development Bank Of India CARE AAA 7.84
National Bank For Agriculture And Rural Development CRISIL AAA 5.94
National Housing Bank IND AAA 5.90
Reliance Industries Ltd. CRISIL AAA 5.69
Housing And Urban Development Corporation Ltd. [ICRA]AAA 4.14
Rec Ltd. CRISIL AAA 4.02
Power Finance Corporation Ltd. CRISIL AAA 3.41
State Bank Of India CRISIL AAA 3.01
Housing Development Finance Corporation Ltd. CRISIL AAA 2.95
Power Grid Corporation Of India Ltd. CRISIL AAA 1.79
National Highways Authority Of India CRISIL AAA 1.76
Lic Housing Finance Ltd. CRISIL AAA 3.55
State Government Of Uttar Pradesh SOVEREIGN 3.62
State Government Of Maharashtra SOVEREIGN 2.35
Issuer Name Rating (%) Of TotalAUM
Cash, Cash Equivalents And Others
AAA and EquivalentSovereign
An open-ended debt scheme predominantly investing inAA+ and above rated corporate bonds
49.98
5.97
44.05
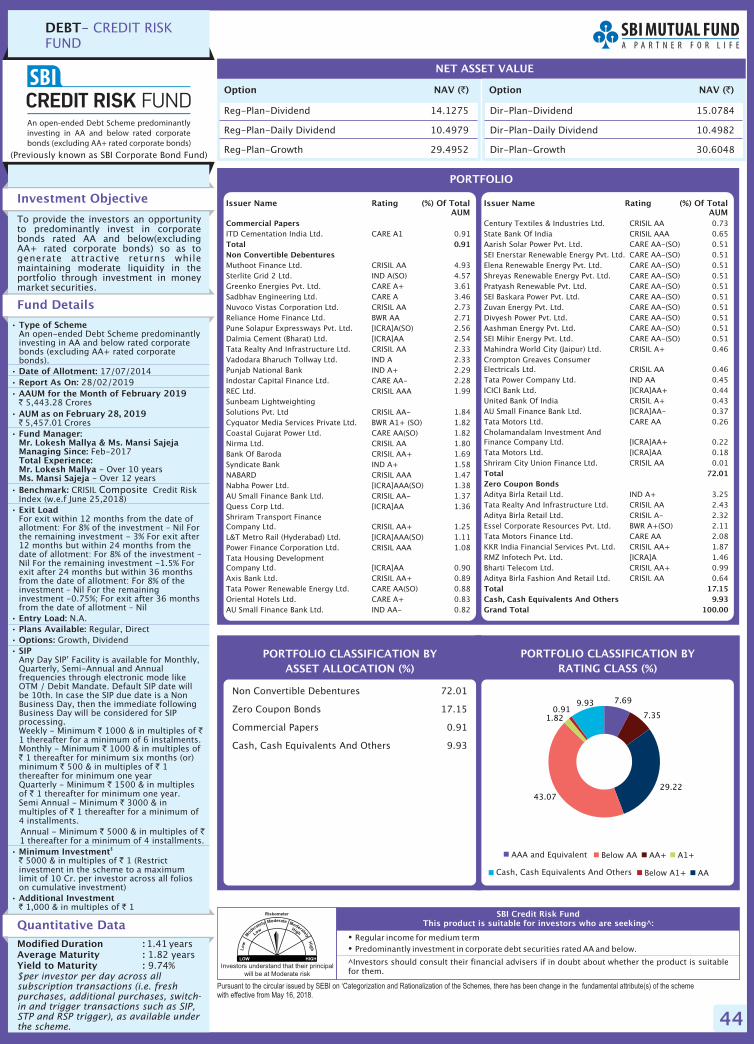
44
DEBT- CREDIT RISKFUND
Option NAV ( )`
Reg-Plan-Dividend 14.1275
Reg-Plan-Daily Dividend 10.4979
Reg-Plan-Growth 29.4952
NET ASSET VALUE
Option NAV ( )`
Investors understand that their principal
will be at Moderate risk
�
�
Regular income for medium termPredominantly investment in corporate debt securities rated AA and below.
Pursuant to the circular issued by SEBI on ‘Categorization and Rationalization of the Schemes, there has been change in the fundamental attribute(s) of the schemewith effective from May 16, 2018.
SBI Credit Risk FundThis product is suitable for investors who are seeking^:
Investment Objective
Quantitative Data
To provide the investors an opportunityto predominantly invest in corporatebonds rated AA and below(excludingAA+ rated corporate bonds) so as togenerate attractive returns whilemaintaining moderate liquidity in theportfolio through investment in moneymarket securities.
Fund Details
Modified Duration :Average Maturity :Yield to Maturity :
1.411.82 years9.74%
years
$per investor per day across allsubscription transactions (i.e. freshpurchases, additional purchases, switch-in and trigger transactions such as SIP,STP and RSP trigger), as available underthe scheme.
PORTFOLIO CLASSIFICATION BYRATING CLASS (%)
Non Convertible Debentures 72.01
Zero Coupon Bonds 17.15
Commercial Papers 0.91
Cash, Cash Equivalents And Others 9.93
•
•
•
•
•
•
•
•
•
•
•
•
•
•
Type of Scheme
Date of Allotment:Report As On:AAUM for the
AUM as on
Fund Manager:Mr. Lokesh Mallya & Ms. Mansi SajejaManaging Since:Total Experience:Mr. Lokesh MallyaMs. Mansi SajejaBenchmark:
Exit Load
Entry Load:Plans Available:Options:SIP
Minimum Investment
Additional Investment
An open-ended Debt Scheme predominantlyinvesting in AA and below rated corporatebonds (excluding AA+ rated corporatebonds).
17/07/2014
5,443.28 Crores
5,457.01 Crores
Feb-2017
- Over 10 years- Over 12 years
CRISIL Credit RiskIndex
For exit within 12 months from the date ofallotment: For 8% of the investment – Nil Forthe remaining investment - 3% For exit after12 months but within 24 months from thedate of allotment: For 8% of the investment –Nil For the remaining investment -1.5% Forexit after 24 months but within 36 monthsfrom the date of allotment: For 8% of theinvestment – Nil For the remaininginvestment -0.75%; For exit after 36 monthsfrom the date of allotment – Nil
N.A.Regular, Direct
Growth, Dividend
Any Day SIP’ Facility is available for Monthly,Quarterly, Semi-Annual and Annualfrequencies through electronic mode likeOTM / Debit Mandate. Default SIP date willbe 10th. In case the SIP due date is a NonBusiness Day, then the immediate followingBusiness Day will be considered for SIPprocessing.Weekly - Minimum 1000 & in multiples of1 thereafter for a minimum of 6 instalments.Monthly - Minimum 1000 & in multiples of
1 thereafter for minimum six months (or)minimum 500 & in multiples of 1thereafter for minimum one yearQuarterly - Minimum 1500 & in multiplesof 1 thereafter for minimum one year.Semi Annual - Minimum 3000 & inmultiples of 1 thereafter for a minimum of4 installments.Annual - Minimum 5000 & in multiples of1 thereafter for a minimum of 4 installments.
5000 & in multiples of 1 (Restrictinvestment in the scheme to a maximumlimit of 10 Cr. per investor across all folioson cumulative investment)
1,000 & in multiples of 1
28/02/2019Month of February 2019
February 28, 2019`
`
` `
``
` `
``
``
` `
` `
` `
$
Composite(w.e.f June 25,2018)
PORTFOLIO CLASSIFICATION BYASSET ALLOCATION (%)
Dir-Plan-Dividend 15.0784
Dir-Plan-Daily Dividend 10.4982
Dir-Plan-Growth 30.6048
PORTFOLIO
Issuer Name Rating (%) Of TotalAUM
Issuer Name Rating (%) Of TotalAUM
(Previously known as SBI Corporate Bond Fund)
^Investors should consult their financial advisers if in doubt about whether the product is suitablefor them.
AAA and Equivalent Below AA AA+ A1+
AABelow A1+Cash, Cash Equivalents And Others
Commercial Papers
Total 0.91Non Convertible Debentures
ITD Cementation India Ltd. CARE A1 0.91
Muthoot Finance Ltd. CRISIL AA 4.93Sterlite Grid 2 Ltd. IND A(SO) 4.57Greenko Energies Pvt. Ltd. CARE A+ 3.61Sadbhav Engineering Ltd. CARE A 3.46Nuvoco Vistas Corporation Ltd. CRISIL AA 2.73Reliance Home Finance Ltd. BWR AA 2.71Pune Solapur Expressways Pvt. Ltd. [ICRA]A(SO) 2.56Dalmia Cement (Bharat) Ltd. [ICRA]AA 2.54Tata Realty And Infrastructure Ltd. CRISIL AA 2.33Vadodara Bharuch Tollway Ltd. IND A 2.33Punjab National Bank IND A+ 2.29Indostar Capital Finance Ltd. CARE AA- 2.28REC Ltd. CRISIL AAA 1.99Sunbeam LightweightingSolutions Pvt. Ltd CRISIL AA- 1.84Cyquator Media Services Private Ltd. BWR A1+ (SO) 1.82Coastal Gujarat Power Ltd. CARE AA(SO) 1.82Nirma Ltd. CRISIL AA 1.80Bank Of Baroda CRISIL AA+ 1.69Syndicate Bank IND A+ 1.58NABARD CRISIL AAA 1.47Nabha Power Ltd. [ICRA]AAA(SO) 1.38AU Small Finance Bank Ltd. CRISIL AA- 1.37Quess Corp Ltd. [ICRA]AA 1.36Shriram Transport FinanceCompany Ltd. CRISIL AA+ 1.25L&T Metro Rail (Hyderabad) Ltd. [ICRA]AAA(SO) 1.11Power Finance Corporation Ltd. CRISIL AAA 1.08Tata Housing DevelopmentCompany Ltd. [ICRA]AA 0.90Axis Bank Ltd. CRISIL AA+ 0.89Tata Power Renewable Energy Ltd. CARE AA(SO) 0.88Oriental Hotels Ltd. CARE A+ 0.83AU Small Finance Bank Ltd. IND AA- 0.82
Century Textiles & Industries Ltd. CRISIL AA 0.73State Bank Of India CRISIL AAA 0.65Aarish Solar Power Pvt. Ltd. CARE AA-(SO) 0.51SEI Enerstar Renewable Energy Pvt. Ltd. CARE AA-(SO) 0.51Elena Renewable Energy Pvt. Ltd. CARE AA-(SO) 0.51Shreyas Renewable Energy Pvt. Ltd. CARE AA-(SO) 0.51Pratyash Renewable Pvt. Ltd. CARE AA-(SO) 0.51SEI Baskara Power Pvt. Ltd. CARE AA-(SO) 0.51Zuvan Energy Pvt. Ltd. CARE AA-(SO) 0.51Divyesh Power Pvt. Ltd. CARE AA-(SO) 0.51Aashman Energy Pvt. Ltd. CARE AA-(SO) 0.51SEI Mihir Energy Pvt. Ltd. CARE AA-(SO) 0.51Mahindra World City (Jaipur) Ltd. CRISIL A+ 0.46Crompton Greaves ConsumerElectricals Ltd. CRISIL AA 0.46Tata Power Company Ltd. IND AA 0.45ICICI Bank Ltd. [ICRA]AA+ 0.44United Bank Of India CRISIL A+ 0.43AU Small Finance Bank Ltd. [ICRA]AA- 0.37Tata Motors Ltd. CARE AA 0.26Cholamandalam Investment AndFinance Company Ltd. [ICRA]AA+ 0.22Tata Motors Ltd. [ICRA]AA 0.18Shriram City Union Finance Ltd. CRISIL AA 0.01
Aditya Birla Retail Ltd. IND A+ 3.25Tata Realty And Infrastructure Ltd. CRISIL AA 2.43Aditya Birla Retail Ltd. CRISIL A- 2.32Essel Corporate Resources Pvt. Ltd. BWR A+(SO) 2.11Tata Motors Finance Ltd. CARE AA 2.08KKR India Financial Services Pvt. Ltd. CRISIL AA+ 1.87RMZ Infotech Pvt. Ltd. [ICRA]A 1.46Bharti Telecom Ltd. CRISIL AA+ 0.99Aditya Birla Fashion And Retail Ltd. CRISIL AA 0.64
Total 72.01Zero Coupon Bonds
Total 17.15Cash, Cash Equivalents And Others 9.93Grand Total 100.00
7.69
7.35
29.2243.07
1.820.91
9.93
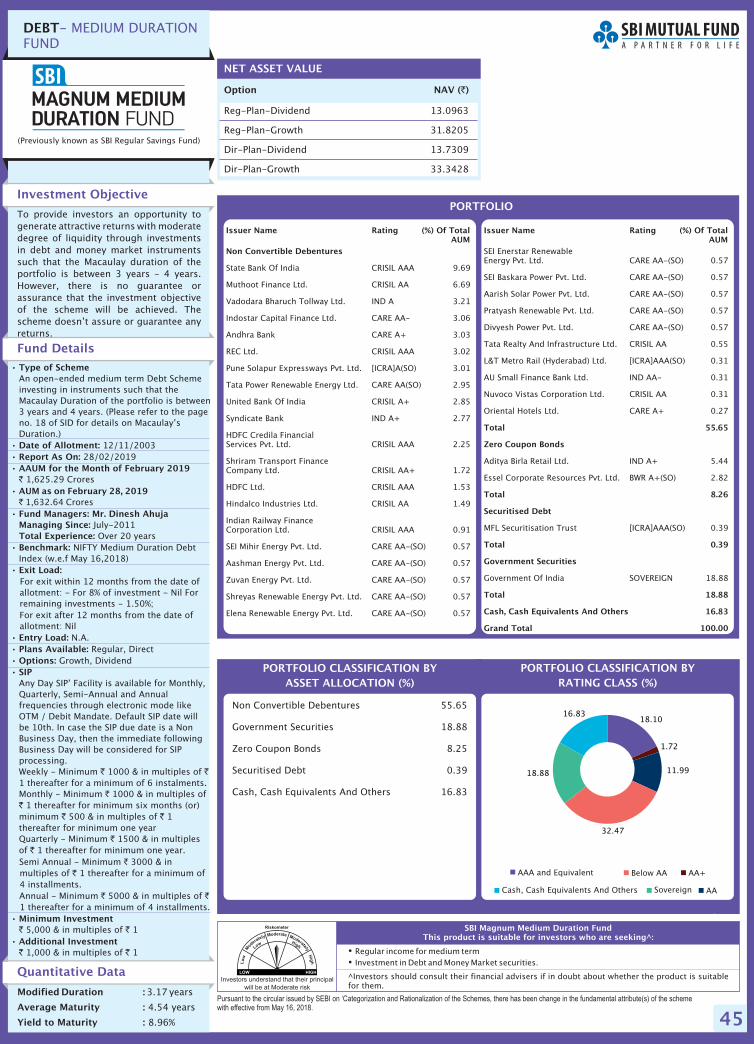
45
DEBT- MEDIUM DURATIONFUND
Option NAV ( )`
Reg-Plan-Dividend 13.0963
Reg-Plan-Growth 31.8205
Dir-Plan-Dividend 13.7309
Dir-Plan-Growth 33.3428
NET ASSET VALUE
�
�
Regular income for medium termInvestment in Debt and Money Market securities.
Pursuant to the circular issued by SEBI on ‘Categorization and Rationalization of the Schemes, there has been change in the fundamental attribute(s) of the schemewith effective from May 16, 2018.
SBI Magnum Medium Duration FundThis product is suitable for investors who are seeking^:
Investment Objective
Quantitative Data
To provide investors an opportunity togenerate attractive returns with moderatedegree of liquidity through investmentsin debt and money market instrumentssuch that the Macaulay duration of theportfolio is between 3 years – 4 years.However, there is no guarantee orassurance that the investment objectiveof the scheme will be achieved. Thescheme doesn’t assure or guarantee anyreturns.
Fund Details
Modified Duration :
Average Maturity :
Yield to Maturity :
3.17
4.54 years
8.96%
years
PORTFOLIO CLASSIFICATION BYRATING CLASS (%)
Non Convertible Debentures 55.65
Government Securities 18.88
Zero Coupon Bonds 8.25
Securitised Debt 0.39
Cash, Cash Equivalents And Others 16.83
•
•
•
•
•
•
•
•
•
•
•
•
•
•
Type of Scheme
Date of Allotment:Report As On:AAUM for the February 2019
AUM as on February 28, 2019
Fund Managers: Mr. Dinesh AhujaManaging Since:Total Experience:Benchmark:
Exit Load:
Entry Load:Plans Available:Options:SIP
Minimum Investment
Additional Investment
An open-ended medium term Debt Schemeinvesting in instruments such that theMacaulay Duration of the portfolio is between3 years and 4 years. (
12/11/200328/02/2019
1,625.29 Crores
1,632.64 Crores
July-2011Over 20 years
NIFTY Medium Duration DebtIndex (w.e.f May 16,2018)
For exit within 12 months from the date ofallotment: - For 8% of investment - Nil Forremaining investments - 1.50%;For exit after 12 months from the date ofallotment: Nil
N.A.Regular, Direct
Growth, Dividend
Any Day SIP’ Facility is available for Monthly,Quarterly, Semi-Annual and Annualfrequencies through electronic mode likeOTM / Debit Mandate. Default SIP date willbe 10th. In case the SIP due date is a NonBusiness Day, then the immediate followingBusiness Day will be considered for SIPprocessing.Weekly - Minimum 1000 & in multiples of1 thereafter for a minimum of 6 instalments.Monthly - Minimum 1000 & in multiples of
1 thereafter for minimum six months (or)minimum 500 & in multiples of 1thereafter for minimum one yearQuarterly - Minimum 1500 & in multiplesof 1 thereafter for minimum one year.Semi Annual - Minimum 3000 & inmultiples of 1 thereafter for a minimum of4 installments.Annual - Minimum 5000 & in multiples of1 thereafter for a minimum of 4 installments.
5,000 & in multiples of 1
1,000 & in multiples of 1
Month of`
`
` `
`
`
` `
`
`
`
`
` `
` `
` `
Please refer to the pageno. 18 of SID for details on Macaulay’sDuration.)
PORTFOLIO CLASSIFICATION BYASSET ALLOCATION (%)
PORTFOLIO
Non Convertible Debentures
State Bank Of India CRISIL AAA 9.69
Muthoot Finance Ltd. CRISIL AA 6.69
Vadodara Bharuch Tollway Ltd. IND A 3.21
Indostar Capital Finance Ltd. CARE AA- 3.06
Andhra Bank CARE A+ 3.03
REC Ltd. CRISIL AAA 3.02
Pune Solapur Expressways Pvt. Ltd. [ICRA]A(SO) 3.01
Tata Power Renewable Energy Ltd. CARE AA(SO) 2.95
United Bank Of India CRISIL A+ 2.85
Syndicate Bank IND A+ 2.77
HDFC Credila FinancialServices Pvt. Ltd. CRISIL AAA 2.25
Shriram Transport FinanceCompany Ltd. CRISIL AA+ 1.72
HDFC Ltd. CRISIL AAA 1.53
Hindalco Industries Ltd. CRISIL AA 1.49
Indian Railway FinanceCorporation Ltd. CRISIL AAA 0.91
SEI Mihir Energy Pvt. Ltd. CARE AA-(SO) 0.57
Aashman Energy Pvt. Ltd. CARE AA-(SO) 0.57
Zuvan Energy Pvt. Ltd. CARE AA-(SO) 0.57
Shreyas Renewable Energy Pvt. Ltd. CARE AA-(SO) 0.57
Elena Renewable Energy Pvt. Ltd. CARE AA-(SO) 0.57
SEI Enerstar RenewableEnergy Pvt. Ltd. CARE AA-(SO) 0.57
SEI Baskara Power Pvt. Ltd. CARE AA-(SO) 0.57
Aarish Solar Power Pvt. Ltd. CARE AA-(SO) 0.57
Pratyash Renewable Pvt. Ltd. CARE AA-(SO) 0.57
Divyesh Power Pvt. Ltd. CARE AA-(SO) 0.57
Tata Realty And Infrastructure Ltd. CRISIL AA 0.55
L&T Metro Rail (Hyderabad) Ltd. [ICRA]AAA(SO) 0.31
AU Small Finance Bank Ltd. IND AA- 0.31
Nuvoco Vistas Corporation Ltd. CRISIL AA 0.31
Oriental Hotels Ltd. CARE A+ 0.27
Aditya Birla Retail Ltd. IND A+ 5.44
Essel Corporate Resources Pvt. Ltd. BWR A+(SO) 2.82
MFL Securitisation Trust [ICRA]AAA(SO) 0.39
Government Of India SOVEREIGN 18.88
Total 55.65
Zero Coupon Bonds
Total 8.26
Securitised Debt
Total 0.39
Government Securities
Total 18.88
Cash, Cash Equivalents And Others 16.83
Grand Total 100.00
Issuer Name Rating (%) Of TotalAUM
Issuer Name Rating (%) Of TotalAUM
(Previously known as SBI Regular Savings Fund)
^Investors should consult their financial advisers if in doubt about whether the product is suitablefor them.
Investors understand that their principal
will be at Moderate risk
AAA and Equivalent Below AA AA+
AASovereignCash, Cash Equivalents And Others
18.10
1.72
11.99
32.47
18.88
16.83
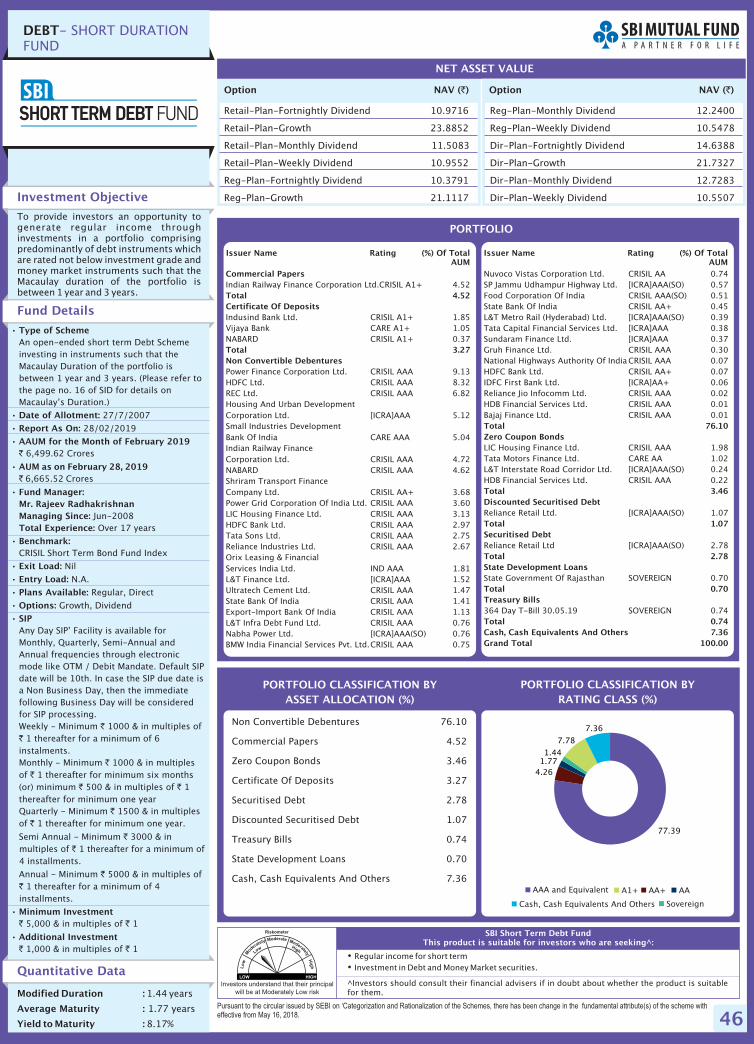
46
DEBT- SHORT DURATIONFUND
�
�
Regular income for short termInvestment in Debt and Money Market securities.
Pursuant to the circular issued by SEBI on ‘Categorization and Rationalization of the Schemes, there has been change in the fundamental attribute(s) of the scheme witheffective from May 16, 2018.
SBI Short Term Debt FundThis product is suitable for investors who are seeking^:
Investment Objective
Quantitative Data
To provide investors an opportunity togenerate regular income throughinvestments in a portfolio comprisingpredominantly of debt instruments whichare rated not below investment grade andmoney market instruments such that theMacaulay duration of the portfolio isbetween 1 year and 3 years.
Fund Details
Modified Duration :
Average Maturity :
Yield to Maturity :
1.44
1.77 years
8.17%
years
PORTFOLIO CLASSIFICATION BYRATING CLASS (%)
Non Convertible Debentures 76.10
Commercial Papers 4.52
Zero Coupon Bonds 3.46
Certificate Of Deposits 3.27
Securitised Debt 2.78
Discounted Securitised Debt 1.07
Treasury Bills 0.74
State Development Loans 0.70
Cash, Cash Equivalents And Others 7.36
•
•
•
•
•
•
•
•
•
•
•
•
•
•
Type of Scheme
Date of Allotment:
Report As On:
AAUM for the February 2019
AUM as on February 28, 2019
Fund Manager:Mr. Rajeev RadhakrishnanManaging Since:Total Experience:
Benchmark:
Exit Load:
Entry Load:
Plans Available:
Options:
SIP
Minimum Investment
Additional Investment
An open-ended short term Debt Schemeinvesting in instruments such that theMacaulay Duration of the portfolio isbetween 1 year and 3 years. (
27/7/2007
28/02/2019
6,499.62 Crores
6,665.52 Crores
Jun-2008Over 17 years
CRISIL Short Term Bond Fund Index
Nil
N.A.
Regular, Direct
Growth, Dividend
Any Day SIP’ Facility is available forMonthly, Quarterly, Semi-Annual andAnnual frequencies through electronicmode like OTM / Debit Mandate. Default SIPdate will be 10th. In case the SIP due date isa Non Business Day, then the immediatefollowing Business Day will be consideredfor SIP processing.Weekly - Minimum 1000 & in multiples of
1 thereafter for a minimum of 6instalments.Monthly - Minimum 1000 & in multiplesof 1 thereafter for minimum six months(or) minimum 500 & in multiples of 1thereafter for minimum one yearQuarterly - Minimum 1500 & in multiplesof 1 thereafter for minimum one year.
Semi Annual - Minimum 3000 & inmultiples of 1 thereafter for a minimum of4 installments.
Annual - Minimum 5000 & in multiples of1 thereafter for a minimum of 4
installments.
5,000 & in multiples of 1
1,000 & in multiples of 1
Month of`
`
`
`
`
`
` `
`
`
`
`
`
`
` `
` `
Please refer tothe page no. 16 of SID for details onMacaulay’s Duration.)
PORTFOLIO CLASSIFICATION BYASSET ALLOCATION (%)
Option NAV ( )`
Retail-Plan-Fortnightly Dividend 10.9716
Retail-Plan-Growth 23.8852
Retail-Plan-Monthly Dividend 11.5083
Retail-Plan-Weekly Dividend 10.9552
Reg-Plan-Fortnightly Dividend 10.3791
Reg-Plan-Growth 21.1117
NET ASSET VALUE
Option NAV ( )`
Reg-Plan-Monthly Dividend 12.2400
Reg-Plan-Weekly Dividend 10.5478
Dir-Plan-Fortnightly Dividend 14.6388
Dir-Plan-Growth 21.7327
Dir-Plan-Monthly Dividend 12.7283
Dir-Plan-Weekly Dividend 10.5507
PORTFOLIO
Commercial Papers
Total 4.52Certificate Of Deposits
Total 3.27Non Convertible Debentures
Indian Railway Finance Corporation Ltd.CRISIL A1+ 4.52
Indusind Bank Ltd. CRISIL A1+ 1.85Vijaya Bank CARE A1+ 1.05NABARD CRISIL A1+ 0.37
Power Finance Corporation Ltd. CRISIL AAA 9.13HDFC Ltd. CRISIL AAA 8.32REC Ltd. CRISIL AAA 6.82Housing And Urban DevelopmentCorporation Ltd. [ICRA]AAA 5.12Small Industries DevelopmentBank Of India CARE AAA 5.04Indian Railway FinanceCorporation Ltd. CRISIL AAA 4.72NABARD CRISIL AAA 4.62Shriram Transport FinanceCompany Ltd. CRISIL AA+ 3.68Power Grid Corporation Of India Ltd. CRISIL AAA 3.60LIC Housing Finance Ltd. CRISIL AAA 3.13HDFC Bank Ltd. CRISIL AAA 2.97Tata Sons Ltd. CRISIL AAA 2.75Reliance Industries Ltd. CRISIL AAA 2.67Orix Leasing & FinancialServices India Ltd. IND AAA 1.81L&T Finance Ltd. [ICRA]AAA 1.52Ultratech Cement Ltd. CRISIL AAA 1.47State Bank Of India CRISIL AAA 1.41Export-Import Bank Of India CRISIL AAA 1.13L&T Infra Debt Fund Ltd. CRISIL AAA 0.76Nabha Power Ltd. [ICRA]AAA(SO) 0.76BMW India Financial Services Pvt. Ltd.CRISIL AAA 0.75
Nuvoco Vistas Corporation Ltd. CRISIL AA 0.74SP Jammu Udhampur Highway Ltd. [ICRA]AAA(SO) 0.57Food Corporation Of India CRISIL AAA(SO) 0.51State Bank Of India CRISIL AA+ 0.45L&T Metro Rail (Hyderabad) Ltd. [ICRA]AAA(SO) 0.39Tata Capital Financial Services Ltd. [ICRA]AAA 0.38Sundaram Finance Ltd. [ICRA]AAA 0.37Gruh Finance Ltd. CRISIL AAA 0.30National Highways Authority Of India CRISIL AAA 0.07HDFC Bank Ltd. CRISIL AA+ 0.07IDFC First Bank Ltd. [ICRA]AA+ 0.06Reliance Jio Infocomm Ltd. CRISIL AAA 0.02HDB Financial Services Ltd. CRISIL AAA 0.01Bajaj Finance Ltd. CRISIL AAA 0.01
LIC Housing Finance Ltd. CRISIL AAA 1.98Tata Motors Finance Ltd. CARE AA 1.02L&T Interstate Road Corridor Ltd. [ICRA]AAA(SO) 0.24HDB Financial Services Ltd. CRISIL AAA 0.22
Reliance Retail Ltd. [ICRA]AAA(SO) 1.07
Reliance Retail Ltd [ICRA]AAA(SO) 2.78
State Government Of Rajasthan SOVEREIGN 0.70
364 Day T-Bill 30.05.19 SOVEREIGN 0.74
Total 76.10Zero Coupon Bonds
Total 3.46Discounted Securitised Debt
Total 1.07Securitised Debt
Total 2.78State Development Loans
Total 0.70Treasury Bills
Total 0.74Cash, Cash Equivalents And Others 7.36Grand Total 100.00
Issuer Name Rating (%) Of TotalAUM
Issuer Name Rating (%) Of TotalAUM
Investors understand that their principal
will be at Moderately Low risk
^Investors should consult their financial advisers if in doubt about whether the product is suitablefor them.
AAA and Equivalent A1+ AA+ AA
SovereignCash, Cash Equivalents And Others
77.39
4.261.771.44
7.78
7.36
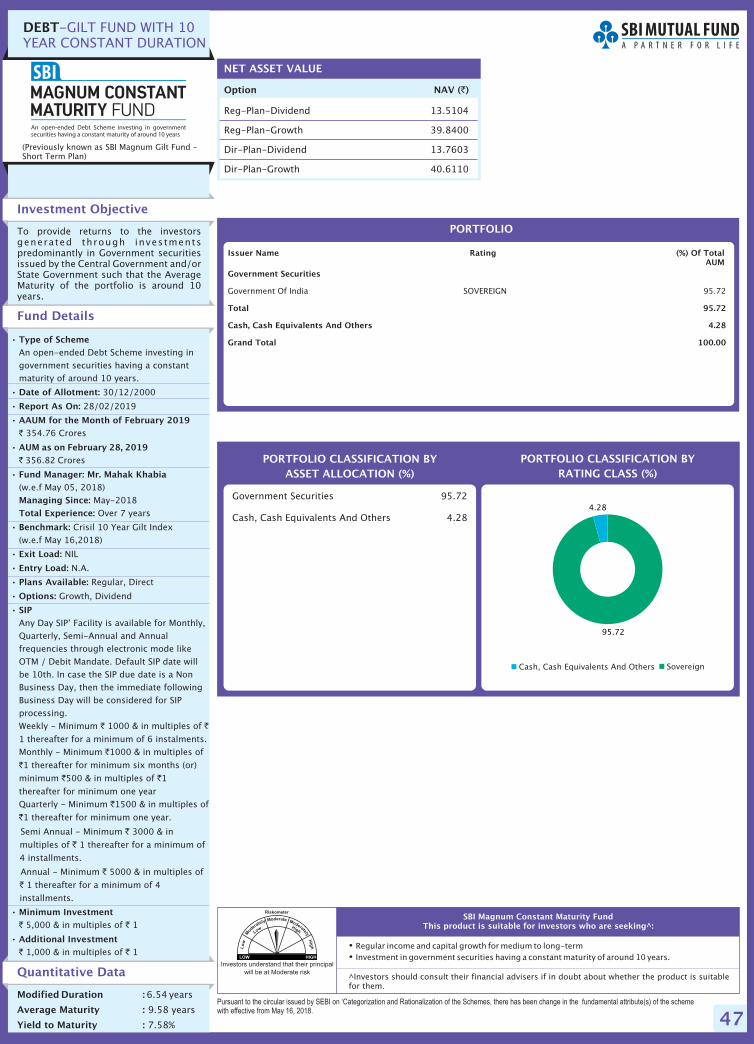
47
Option NAV ( )`
Reg-Plan-Dividend 13.5104
Reg-Plan-Growth 39.8400
Dir-Plan-Dividend 13.7603
Dir-Plan-Growth 40.6110
NET ASSET VALUE
�
�
Regular income and capital growth for medium to long-termInvestment in government securities having a constant maturity of around 10 years.
Pursuant to the circular issued by SEBI on ‘Categorization and Rationalization of the Schemes, there has been change in the fundamental attribute(s) of the schemewith effective from May 16, 2018.
SBI Magnum Constant Maturity FundThis product is suitable for investors who are seeking^:
Investment Objective
Quantitative Data
To provide returns to the investorsgenerated through investmentspredominantly in Government securitiesissued by the Central Government and/orState Government such that the AverageMaturity of the portfolio is around 10years.
Fund Details
Modified Duration :
Average Maturity :
Yield to Maturity :
6.54
9.58 years
7.58%
years
PORTFOLIO CLASSIFICATION BYRATING CLASS (%)
Government Securities 95.72
Cash, Cash Equivalents And Others 4.28
•
•
•
•
•
•
•
•
•
•
•
•
•
•
Type of Scheme
Date of Allotment:
Report As On:
AAUM for the February 2019
AUM as on February 28, 2019
Fund Manager: Mr. Mahak Khabia
Managing Since:
Total Experience:
Benchmark:
Exit Load:
Entry Load:
Plans Available:
Options:
SIP
Minimum Investment
Additional Investment
An open-ended Debt Scheme investing in
government securities having a constant
maturity of around 10 years.
30/12/2000
28/02/2019
354.76 Crores
356.82 Crores
(w.e.f May 05, 2018)
May-2018
Over 7 years
Crisil 10 Year Gilt Index
(w.e.f May 16,2018)
NIL
N.A.
Regular, Direct
Growth, Dividend
Any Day SIP’ Facility is available for Monthly,
Quarterly, Semi-Annual and Annual
frequencies through electronic mode like
OTM / Debit Mandate. Default SIP date will
be 10th. In case the SIP due date is a Non
Business Day, then the immediate following
Business Day will be considered for SIP
processing.
Weekly - Minimum 1000 & in multiples of
1 thereafter for a minimum of 6 instalments.
Monthly - Minimum 1000 & in multiples of
1 thereafter for minimum six months (or)
minimum 500 & in multiples of 1
thereafter for minimum one year
Quarterly - Minimum 1500 & in multiples of
1 thereafter for minimum one year.
Semi Annual - Minimum 3000 & in
multiples of 1 thereafter for a minimum of
4 installments.
Annual - Minimum 5000 & in multiples of
1 thereafter for a minimum of 4
installments.
5,000 & in multiples of 1
1,000 & in multiples of 1
Month of
`
`
` `
`
`
` `
`
`
`
`
`
`
` `
` `
PORTFOLIO CLASSIFICATION BYASSET ALLOCATION (%)
DEBT-GILT FUND WITH 10YEAR CONSTANT DURATION
PORTFOLIO
Government Securities
Total 95.72
Cash, Cash Equivalents And Others 4.28
Grand Total 100.00
Government Of India SOVEREIGN 95.72
Issuer Name Rating (%) Of TotalAUM
Investors understand that their principal
will be at Moderate risk^Investors should consult their financial advisers if in doubt about whether the product is suitablefor them.
SovereignCash, Cash Equivalents And Others
(Previously known as SBI Magnum Gilt Fund -Short Term Plan)
95.72
4.28
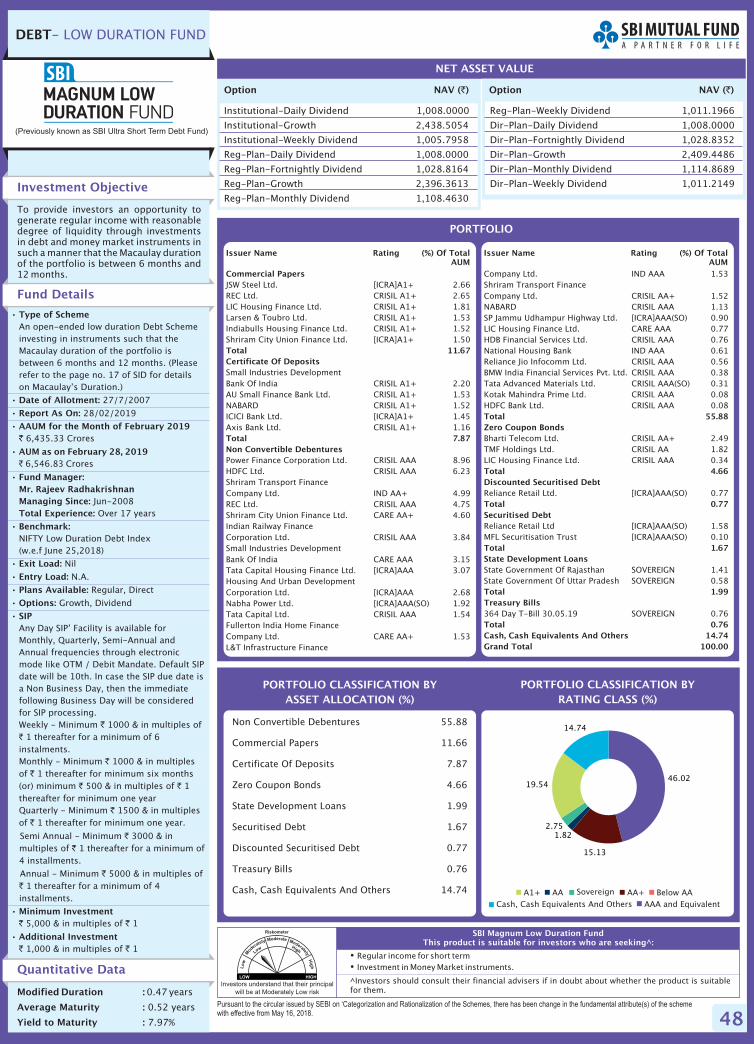
48
Option NAV ( )`
Institutional-Daily Dividend 1,008.0000
Institutional-Growth 2,438.5054
Institutional-Weekly Dividend 1,005.7958
Reg-Plan-Daily Dividend 1,008.0000
Reg-Plan-Fortnightly Dividend 1,028.8164
Reg-Plan-Growth 2,396.3613
Reg-Plan-Monthly Dividend 1,108.4630
NET ASSET VALUE
Option NAV ( )`
�
�
Regular income for short termInvestment in Money Market instruments.
Pursuant to the circular issued by SEBI on ‘Categorization and Rationalization of the Schemes, there has been change in the fundamental attribute(s) of the schemewith effective from May 16, 2018.
SBI Magnum Low Duration FundThis product is suitable for investors who are seeking^:
Investment Objective
Quantitative Data
To provide investors an opportunity togenerate regular income with reasonabledegree of liquidity through investmentsin debt and money market instruments insuch a manner that the Macaulay durationof the portfolio is between 6 months and12 months.
Fund Details
Modified Duration :
Average Maturity :
Yield to Maturity :
0.47
0.52 years
7.97%
years
PORTFOLIO CLASSIFICATION BYRATING CLASS (%)
Non Convertible Debentures 55.88
Commercial Papers 11.66
Certificate Of Deposits 7.87
Zero Coupon Bonds 4.66
State Development Loans 1.99
Securitised Debt 1.67
Discounted Securitised Debt 0.77
Treasury Bills 0.76
Cash, Cash Equivalents And Others 14.74
•
•
•
•
•
•
•
•
•
•
•
•
•
•
Type of Scheme
Date of Allotment:
Report As On:
AAUM for the February 2019
AUM as on February 28, 2019
Fund Manager:Mr. Rajeev RadhakrishnanManaging Since:Total Experience:
Benchmark:
Exit Load:
Entry Load:
Plans Available:
Options:
SIP
Minimum Investment
Additional Investment
An open-ended low duration Debt Schemeinvesting in instruments such that theMacaulay duration of the portfolio isbetween 6 months and 12 months. (
27/7/2007
28/02/2019
6,435.33 Crores
6,546.83 Crores
Jun-2008Over 17 years
NIFTY Low Duration Debt Index(w.e.f June 25,2018)
Nil
N.A.
Regular, Direct
Growth, Dividend
Any Day SIP’ Facility is available forMonthly, Quarterly, Semi-Annual andAnnual frequencies through electronicmode like OTM / Debit Mandate. Default SIPdate will be 10th. In case the SIP due date isa Non Business Day, then the immediatefollowing Business Day will be consideredfor SIP processing.Weekly - Minimum 1000 & in multiples of
1 thereafter for a minimum of 6instalments.Monthly - Minimum 1000 & in multiplesof 1 thereafter for minimum six months(or) minimum 500 & in multiples of 1thereafter for minimum one yearQuarterly - Minimum 1500 & in multiplesof 1 thereafter for minimum one year.
Semi Annual - Minimum 3000 & inmultiples of 1 thereafter for a minimum of4 installments.
Annual - Minimum 5000 & in multiples of1 thereafter for a minimum of 4
installments.
5,000 & in multiples of 1
1,000 & in multiples of 1
Month of`
`
`
`
`
`
` `
`
`
`
`
`
`
` `
` `
Pleaserefer to the page no. 17 of SID for detailson Macaulay’s Duration.)
PORTFOLIO CLASSIFICATION BYASSET ALLOCATION (%)
Reg-Plan-Weekly Dividend 1,011.1966
Dir-Plan-Daily Dividend 1,008.0000
Dir-Plan-Fortnightly Dividend 1,028.8352
Dir-Plan-Growth 2,409.4486
Dir-Plan-Monthly Dividend 1,114.8689
Dir-Plan-Weekly Dividend 1,011.2149
DEBT- LOW DURATION FUND
PORTFOLIO
Commercial Papers
Total 11.67Certificate Of Deposits
Total 7.87Non Convertible Debentures
JSW Steel Ltd. [ICRA]A1+ 2.66REC Ltd. CRISIL A1+ 2.65LIC Housing Finance Ltd. CRISIL A1+ 1.81Larsen & Toubro Ltd. CRISIL A1+ 1.53Indiabulls Housing Finance Ltd. CRISIL A1+ 1.52Shriram City Union Finance Ltd. [ICRA]A1+ 1.50
Small Industries DevelopmentBank Of India CRISIL A1+ 2.20AU Small Finance Bank Ltd. CRISIL A1+ 1.53NABARD CRISIL A1+ 1.52ICICI Bank Ltd. [ICRA]A1+ 1.45Axis Bank Ltd. CRISIL A1+ 1.16
Power Finance Corporation Ltd. CRISIL AAA 8.96HDFC Ltd. CRISIL AAA 6.23Shriram Transport FinanceCompany Ltd. IND AA+ 4.99REC Ltd. CRISIL AAA 4.75Shriram City Union Finance Ltd. CARE AA+ 4.60Indian Railway FinanceCorporation Ltd. CRISIL AAA 3.84Small Industries DevelopmentBank Of India CARE AAA 3.15Tata Capital Housing Finance Ltd. [ICRA]AAA 3.07Housing And Urban DevelopmentCorporation Ltd. [ICRA]AAA 2.68Nabha Power Ltd. [ICRA]AAA(SO) 1.92Tata Capital Ltd. CRISIL AAA 1.54Fullerton India Home FinanceCompany Ltd. CARE AA+ 1.53L&T Infrastructure Finance
Company Ltd. IND AAA 1.53Shriram Transport FinanceCompany Ltd. CRISIL AA+ 1.52NABARD CRISIL AAA 1.13SP Jammu Udhampur Highway Ltd. [ICRA]AAA(SO) 0.90LIC Housing Finance Ltd. CARE AAA 0.77HDB Financial Services Ltd. CRISIL AAA 0.76National Housing Bank IND AAA 0.61Reliance Jio Infocomm Ltd. CRISIL AAA 0.56BMW India Financial Services Pvt. Ltd. CRISIL AAA 0.38Tata Advanced Materials Ltd. CRISIL AAA(SO) 0.31Kotak Mahindra Prime Ltd. CRISIL AAA 0.08HDFC Bank Ltd. CRISIL AAA 0.08
Bharti Telecom Ltd. CRISIL AA+ 2.49TMF Holdings Ltd. CRISIL AA 1.82LIC Housing Finance Ltd. CRISIL AAA 0.34
Reliance Retail Ltd. [ICRA]AAA(SO) 0.77
Reliance Retail Ltd [ICRA]AAA(SO) 1.58MFL Securitisation Trust [ICRA]AAA(SO) 0.10
State Government Of Rajasthan SOVEREIGN 1.41State Government Of Uttar Pradesh SOVEREIGN 0.58
364 Day T-Bill 30.05.19 SOVEREIGN 0.76
Total 55.88Zero Coupon Bonds
Total 4.66Discounted Securitised Debt
Total 0.77Securitised Debt
Total 1.67State Development Loans
Total 1.99Treasury Bills
Total 0.76Cash, Cash Equivalents And Others 14.74Grand Total 100.00
Issuer Name Rating (%) Of TotalAUM
Issuer Name Rating (%) Of TotalAUM
Investors understand that their principal
will be at Moderately Low risk
^Investors should consult their financial advisers if in doubt about whether the product is suitablefor them.
(Previously known as SBI Ultra Short Term Debt Fund)
Below AAAA+A1+ AA Sovereign
AAA and EquivalentCash, Cash Equivalents And Others
46.02
15.13
1.822.75
19.54
14.74
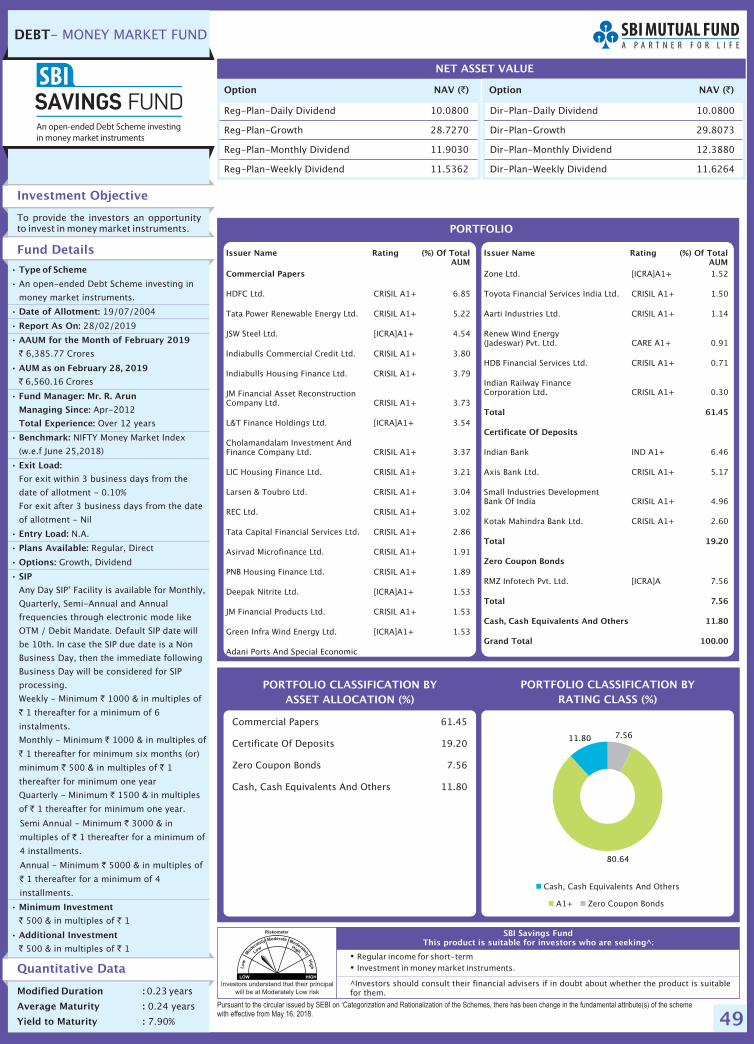
49
Option NAV ( )`
Reg-Plan-Daily Dividend 10.0800
Reg-Plan-Growth 28.7270
Reg-Plan-Monthly Dividend 11.9030
Reg-Plan-Weekly Dividend 11.5362
NET ASSET VALUE
Option NAV ( )`
�
�
Regular income for short-termInvestment in money market instruments.
Pursuant to the circular issued by SEBI on ‘Categorization and Rationalization of the Schemes, there has been change in the fundamental attribute(s) of the schemewith effective from May 16, 2018.
SBI Savings FundThis product is suitable for investors who are seeking^:
Investment Objective
Quantitative Data
To provide the investors an opportunityto invest in money market instruments.
Fund Details
Modified Duration :
Average Maturity :
Yield to Maturity :
0.23
0.24 years
7.90%
years
PORTFOLIO CLASSIFICATION BYRATING CLASS (%)
Commercial Papers 61.45
Certificate Of Deposits 19.20
Zero Coupon Bonds 7.56
Cash, Cash Equivalents And Others 11.80
•
•
•
•
•
•
•
•
•
•
•
•
•
•
•
Type of Scheme
Date of Allotment:
Report As On:
AAUM for the February 2019
AUM as on February 28, 2019
Fund Manager: Mr. R. Arun
Managing Since:
Total Experience:
Benchmark:
Exit Load:
Entry Load:
Plans Available:
Options:
SIP
Minimum Investment
Additional Investment
An open-ended Debt Scheme investing in
money market instruments.
19/07/2004
28/02/2019
6,385.77 Crores
6,560.16 Crores
Apr-2012
Over 12 years
NIFTY Money Market Index
For exit within 3 business days from the
date of allotment - 0.10%
For exit after 3 business days from the date
of allotment - Nil
N.A.
Regular, Direct
Growth, Dividend
Any Day SIP’ Facility is available for Monthly,
Quarterly, Semi-Annual and Annual
frequencies through electronic mode like
OTM / Debit Mandate. Default SIP date will
be 10th. In case the SIP due date is a Non
Business Day, then the immediate following
Business Day will be considered for SIP
processing.
Weekly - Minimum 1000 & in multiples of
1 thereafter for a minimum of 6
instalments.
Monthly - Minimum 1000 & in multiples of
1 thereafter for minimum six months (or)
minimum 500 & in multiples of 1
thereafter for minimum one year
Quarterly - Minimum 1500 & in multiples
of 1 thereafter for minimum one year.
Semi Annual - Minimum 3000 & in
multiples of 1 thereafter for a minimum of
4 installments.
Annual - Minimum 5000 & in multiples of
1 thereafter for a minimum of 4
installments.
500 & in multiples of 1
500 & in multiples of 1
Month of
`
`
`
`
`
`
` `
`
`
`
`
`
`
` `
` `
(w.e.f June 25,2018)
PORTFOLIO CLASSIFICATION BYASSET ALLOCATION (%)
Dir-Plan-Daily Dividend 10.0800
Dir-Plan-Growth 29.8073
Dir-Plan-Monthly Dividend 12.3880
Dir-Plan-Weekly Dividend 11.6264
DEBT- MONEY MARKET FUND
PORTFOLIO
Commercial Papers
HDFC Ltd. CRISIL A1+ 6.85
Tata Power Renewable Energy Ltd. CRISIL A1+ 5.22
JSW Steel Ltd. [ICRA]A1+ 4.54
Indiabulls Commercial Credit Ltd. CRISIL A1+ 3.80
Indiabulls Housing Finance Ltd. CRISIL A1+ 3.79
JM Financial Asset ReconstructionCompany Ltd. CRISIL A1+ 3.73
L&T Finance Holdings Ltd. [ICRA]A1+ 3.54
Cholamandalam Investment AndFinance Company Ltd. CRISIL A1+ 3.37
LIC Housing Finance Ltd. CRISIL A1+ 3.21
Larsen & Toubro Ltd. CRISIL A1+ 3.04
REC Ltd. CRISIL A1+ 3.02
Tata Capital Financial Services Ltd. CRISIL A1+ 2.86
Asirvad Microfinance Ltd. CRISIL A1+ 1.91
PNB Housing Finance Ltd. CRISIL A1+ 1.89
Deepak Nitrite Ltd. [ICRA]A1+ 1.53
JM Financial Products Ltd. CRISIL A1+ 1.53
Green Infra Wind Energy Ltd. [ICRA]A1+ 1.53
Adani Ports And Special Economic
Zone Ltd. [ICRA]A1+ 1.52
Toyota Financial Services India Ltd. CRISIL A1+ 1.50
Aarti Industries Ltd. CRISIL A1+ 1.14
Renew Wind Energy(Jadeswar) Pvt. Ltd. CARE A1+ 0.91
HDB Financial Services Ltd. CRISIL A1+ 0.71
Indian Railway FinanceCorporation Ltd. CRISIL A1+ 0.30
Indian Bank IND A1+ 6.46
Axis Bank Ltd. CRISIL A1+ 5.17
Small Industries DevelopmentBank Of India CRISIL A1+ 4.96
Kotak Mahindra Bank Ltd. CRISIL A1+ 2.60
RMZ Infotech Pvt. Ltd. [ICRA]A 7.56
Total 61.45
Certificate Of Deposits
Total 19.20
Zero Coupon Bonds
Total 7.56
Cash, Cash Equivalents And Others 11.80
Grand Total 100.00
Issuer Name Rating (%) Of TotalAUM
Issuer Name Rating (%) Of TotalAUM
Investors understand that their principal
will be at Moderately Low risk
^Investors should consult their financial advisers if in doubt about whether the product is suitablefor them.
Cash, Cash Equivalents And Others
A1+ Zero Coupon Bonds
7.56
80.64
11.80
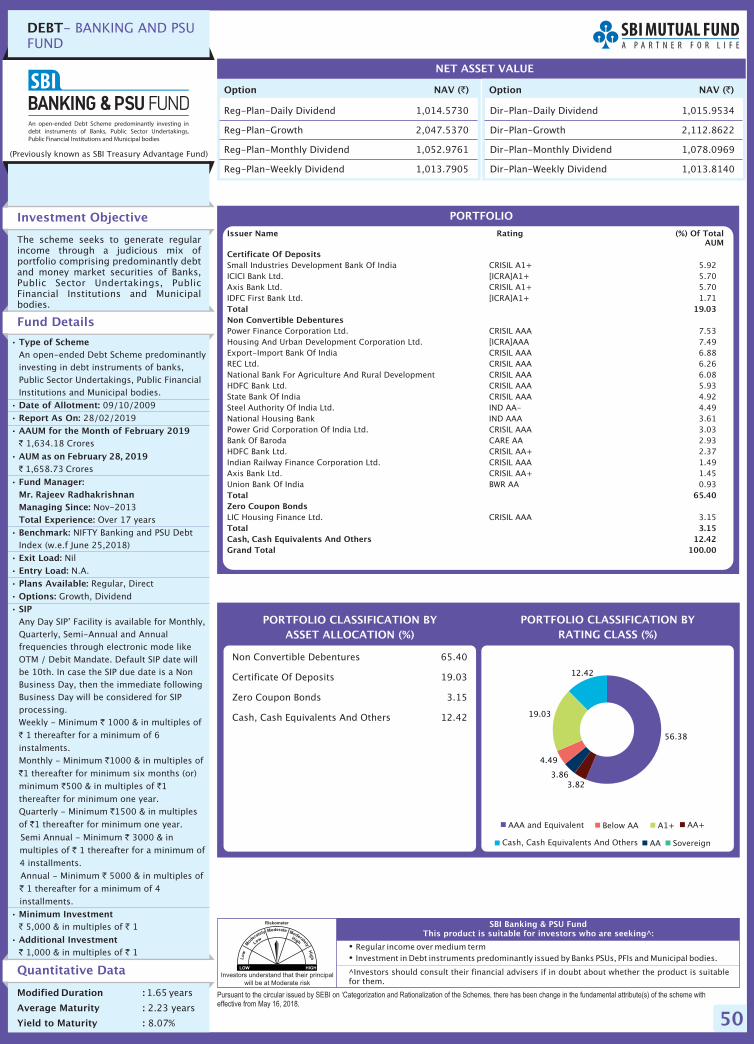
50
Option NAV ( )`
Reg-Plan-Daily Dividend 1,014.5730
Reg-Plan-Growth 2,047.5370
Reg-Plan-Monthly Dividend 1,052.9761
Reg-Plan-Weekly Dividend 1,013.7905
NET ASSET VALUE
Option NAV ( )`
�
�
Regular income over medium termInvestment in Debt instruments predominantly issued by Banks PSUs, PFIs and Municipal bodies.
Pursuant to the circular issued by SEBI on ‘Categorization and Rationalization of the Schemes, there has been change in the fundamental attribute(s) of the scheme witheffective from May 16, 2018.
SBI Banking & PSU FundThis product is suitable for investors who are seeking^:
Investment Objective
Quantitative Data
The scheme seeks to generate regularincome through a judicious mix ofportfolio comprising predominantly debtand money market securities of Banks,Public Sector Undertakings, PublicFinancial Institutions and Municipalbodies.
Fund Details
Modified Duration :
Average Maturity :
Yield to Maturity :
1.65
2.23 years
8.07%
years
PORTFOLIO CLASSIFICATION BYRATING CLASS (%)
Non Convertible Debentures 65.40
Certificate Of Deposits 19.03
Zero Coupon Bonds 3.15
Cash, Cash Equivalents And Others 12.42
•
•
•
•
•
•
•
•
•
•
•
•
•
•
Type of Scheme
Date of Allotment:
Report As On:
AAUM for the February 2019
AUM as on February 28, 2019
Fund Manager:Mr. Rajeev RadhakrishnanManaging Since:Total Experience:
Benchmark:
Exit Load:
Entry Load:
Plans Available:
Options:
SIP
Minimum Investment
Additional Investment
An open-ended Debt Scheme predominantlyinvesting in debt instruments of banks,Public Sector Undertakings, Public FinancialInstitutions and Municipal bodies.
09/10/200928/02/2019
1,634.18 Crores
1,658.73 Crores
Nov-2013Over 17 years
NIFTY Banking and PSU DebtIndex
NilN.A.
Regular, DirectGrowth, Dividend
Any Day SIP’ Facility is available for Monthly,Quarterly, Semi-Annual and Annualfrequencies through electronic mode likeOTM / Debit Mandate. Default SIP date willbe 10th. In case the SIP due date is a NonBusiness Day, then the immediate followingBusiness Day will be considered for SIPprocessing.Weekly - Minimum 1000 & in multiples of
1 thereafter for a minimum of 6
instalments.Monthly - Minimum 1000 & in multiples of
1 thereafter for minimum six months (or)
minimum 500 & in multiples of 1
thereafter for minimum one year.Quarterly - Minimum 1500 & in multiples
of 1 thereafter for minimum one year.
Semi Annual - Minimum 3000 & in
multiples of 1 thereafter for a minimum of
4 installments.Annual - Minimum 5000 & in multiples of
1 thereafter for a minimum of 4
installments.
5,000 & in multiples of 1
1,000 & in multiples of 1
Month of`
`
`
`
`
`
` `
`
`
`
`
`
`
` `
` `
(w.e.f June 25,2018)
PORTFOLIO CLASSIFICATION BYASSET ALLOCATION (%)
Dir-Plan-Daily Dividend 1,015.9534
Dir-Plan-Growth 2,112.8622
Dir-Plan-Monthly Dividend 1,078.0969
Dir-Plan-Weekly Dividend 1,013.8140
DEBT- BANKING AND PSUFUND
PORTFOLIO
Investors understand that their principal
will be at Moderate risk
^Investors should consult their financial advisers if in doubt about whether the product is suitablefor them.
(Previously known as SBI Treasury Advantage Fund)
AAA and Equivalent Below AA A1+ AA+
AA SovereignCash, Cash Equivalents And Others
Certificate Of Deposits
Total 19.03Non Convertible Debentures
Total 65.40Zero Coupon Bonds
Total 3.15Cash, Cash Equivalents And Others 12.42Grand Total 100.00
Small Industries Development Bank Of India CRISIL A1+ 5.92ICICI Bank Ltd. [ICRA]A1+ 5.70Axis Bank Ltd. CRISIL A1+ 5.70IDFC First Bank Ltd. [ICRA]A1+ 1.71
Power Finance Corporation Ltd. CRISIL AAA 7.53Housing And Urban Development Corporation Ltd. [ICRA]AAA 7.49Export-Import Bank Of India CRISIL AAA 6.88REC Ltd. CRISIL AAA 6.26National Bank For Agriculture And Rural Development CRISIL AAA 6.08HDFC Bank Ltd. CRISIL AAA 5.93State Bank Of India CRISIL AAA 4.92Steel Authority Of India Ltd. IND AA- 4.49National Housing Bank IND AAA 3.61Power Grid Corporation Of India Ltd. CRISIL AAA 3.03Bank Of Baroda CARE AA 2.93HDFC Bank Ltd. CRISIL AA+ 2.37Indian Railway Finance Corporation Ltd. CRISIL AAA 1.49Axis Bank Ltd. CRISIL AA+ 1.45Union Bank Of India BWR AA 0.93
LIC Housing Finance Ltd. CRISIL AAA 3.15
Issuer Name (%) Of TotalAUM
Rating
56.38
3.823.86
4.49
19.03
12.42
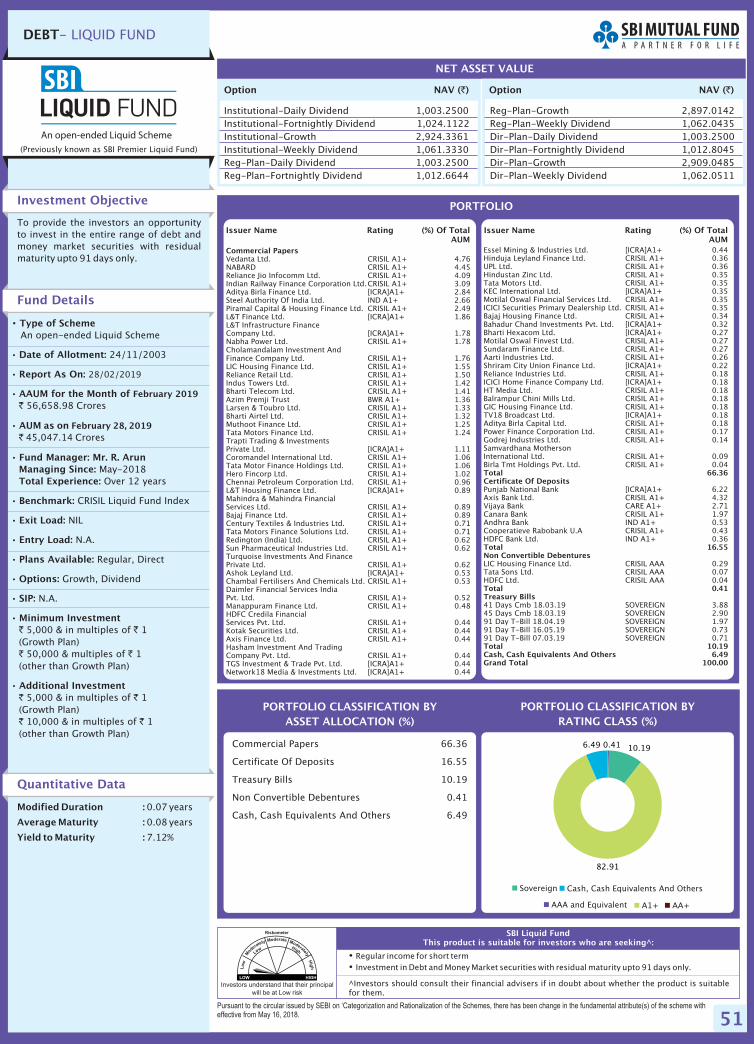
51
DEBT- LIQUID FUND
�
�
Regular income for short termInvestment in Debt and Money Market securities with residual maturity upto 91 days only.
Pursuant to the circular issued by SEBI on ‘Categorization and Rationalization of the Schemes, there has been change in the fundamental attribute(s) of the scheme witheffective from May 16, 2018.
SBI Liquid FundThis product is suitable for investors who are seeking^:
Investment Objective
Quantitative Data
To provide the investors an opportunityto invest in the entire range of debt andmoney market securities with residualmaturity upto 91 days only.
Fund Details
Modified Duration :
Average Maturity :
Yield to Maturity :
0.07
0.08 years
7.12%
years
PORTFOLIO CLASSIFICATION BYRATING CLASS (%)
Commercial Papers 66.36
Certificate Of Deposits 16.55
Treasury Bills 10.19
Non Convertible Debentures 0.41
Cash, Cash Equivalents And Others 6.49
• Type of Scheme
Date of Allotment:
Report As On:
AAUM for the
AUM as on
Fund Manager: Mr. R. ArunManaging Since:Total Experience:
Benchmark:
Exit Load:
Entry Load:
Plans Available:
Options:
SIP:
Minimum Investment
Additional Investment
An open-ended Liquid Scheme
24/11/2003
56,658.98 Crores
45,047.14 Crores
May-2018Over 12 years
CRISIL Liquid Fund Index
NIL
N.A.
Regular, Direct
Growth, Dividend
N.A.
5,000 & in multiples of 1(Growth Plan)
50,000 & multiples of 1(other than Growth Plan)
5,000 & in multiples of 1(Growth Plan)
10,000 & in multiples of 1(other than Growth Plan)
•
•
•
•
•
•
•
•
•
•
•
•
•
28/02/2019
Month of February 2019
February 28, 2019
`
`
` `
` `
` `
` `
PORTFOLIO CLASSIFICATION BYASSET ALLOCATION (%)
Option NAV ( )`
Institutional-Daily Dividend 1,003.2500Institutional-Fortnightly Dividend 1,024.1122Institutional-Growth 2,924.3361Institutional-Weekly Dividend 1,061.3330Reg-Plan-Daily Dividend 1,003.2500Reg-Plan-Fortnightly Dividend 1,012.6644
NET ASSET VALUE
Option NAV ( )`
Reg-Plan-Growth 2,897.0142Reg-Plan-Weekly Dividend 1,062.0435Dir-Plan-Daily Dividend 1,003.2500Dir-Plan-Fortnightly Dividend 1,012.8045Dir-Plan-Growth 2,909.0485Dir-Plan-Weekly Dividend 1,062.0511
PORTFOLIO
Commercial PapersVedanta Ltd. CRISIL A1+ 4.76NABARD CRISIL A1+ 4.45Reliance Jio Infocomm Ltd. CRISIL A1+ 4.09Indian Railway Finance Corporation Ltd.CRISIL A1+ 3.09Aditya Birla Finance Ltd. [ICRA]A1+ 2.84Steel Authority Of India Ltd. IND A1+ 2.66Piramal Capital & Housing Finance Ltd. CRISIL A1+ 2.49L&T Finance Ltd. [ICRA]A1+ 1.86L&T Infrastructure FinanceCompany Ltd. [ICRA]A1+ 1.78Nabha Power Ltd. CRISIL A1+ 1.78Cholamandalam Investment AndFinance Company Ltd. CRISIL A1+ 1.76LIC Housing Finance Ltd. CRISIL A1+ 1.55Reliance Retail Ltd. CRISIL A1+ 1.50Indus Towers Ltd. CRISIL A1+ 1.42Bharti Telecom Ltd. CRISIL A1+ 1.41Azim Premji Trust BWR A1+ 1.36Larsen & Toubro Ltd. CRISIL A1+ 1.33Bharti Airtel Ltd. CRISIL A1+ 1.32Muthoot Finance Ltd. CRISIL A1+ 1.25Tata Motors Finance Ltd. CRISIL A1+ 1.24Trapti Trading & InvestmentsPrivate Ltd. [ICRA]A1+ 1.11Coromandel International Ltd. CRISIL A1+ 1.06Tata Motor Finance Holdings Ltd. CRISIL A1+ 1.06Hero Fincorp Ltd. CRISIL A1+ 1.02Chennai Petroleum Corporation Ltd. CRISIL A1+ 0.96L&T Housing Finance Ltd. [ICRA]A1+ 0.89Mahindra & Mahindra FinancialServices Ltd. CRISIL A1+ 0.89Bajaj Finance Ltd. CRISIL A1+ 0.89Century Textiles & Industries Ltd. CRISIL A1+ 0.71Tata Motors Finance Solutions Ltd. CRISIL A1+ 0.71Redington (India) Ltd. CRISIL A1+ 0.62Sun Pharmaceutical Industries Ltd. CRISIL A1+ 0.62Turquoise Investments And FinancePrivate Ltd. CRISIL A1+ 0.62Ashok Leyland Ltd. [ICRA]A1+ 0.53Chambal Fertilisers And Chemicals Ltd. CRISIL A1+ 0.53Daimler Financial Services IndiaPvt. Ltd. CRISIL A1+ 0.52Manappuram Finance Ltd. CRISIL A1+ 0.48HDFC Credila FinancialServices Pvt. Ltd. CRISIL A1+ 0.44Kotak Securities Ltd. CRISIL A1+ 0.44Axis Finance Ltd. CRISIL A1+ 0.44Hasham Investment And TradingCompany Pvt. Ltd. CRISIL A1+ 0.44TGS Investment & Trade Pvt. Ltd. [ICRA]A1+ 0.44Network18 Media & Investments Ltd. [ICRA]A1+ 0.44
Essel Mining & Industries Ltd. [ICRA]A1+ 0.44Hinduja Leyland Finance Ltd. CRISIL A1+ 0.36UPL Ltd. CRISIL A1+ 0.36Hindustan Zinc Ltd. CRISIL A1+ 0.35Tata Motors Ltd. CRISIL A1+ 0.35KEC International Ltd. [ICRA]A1+ 0.35Motilal Oswal Financial Services Ltd. CRISIL A1+ 0.35ICICI Securities Primary Dealership Ltd. CRISIL A1+ 0.35Bajaj Housing Finance Ltd. CRISIL A1+ 0.34Bahadur Chand Investments Pvt. Ltd. [ICRA]A1+ 0.32Bharti Hexacom Ltd. [ICRA]A1+ 0.27Motilal Oswal Finvest Ltd. CRISIL A1+ 0.27Sundaram Finance Ltd. CRISIL A1+ 0.27Aarti Industries Ltd. CRISIL A1+ 0.26Shriram City Union Finance Ltd. [ICRA]A1+ 0.22Reliance Industries Ltd. CRISIL A1+ 0.18ICICI Home Finance Company Ltd. [ICRA]A1+ 0.18HT Media Ltd. CRISIL A1+ 0.18Balrampur Chini Mills Ltd. CRISIL A1+ 0.18GIC Housing Finance Ltd. CRISIL A1+ 0.18TV18 Broadcast Ltd. [ICRA]A1+ 0.18Aditya Birla Capital Ltd. CRISIL A1+ 0.18Power Finance Corporation Ltd. CRISIL A1+ 0.17Godrej Industries Ltd. CRISIL A1+ 0.14Samvardhana MothersonInternational Ltd. CRISIL A1+ 0.09Birla Tmt Holdings Pvt. Ltd. CRISIL A1+ 0.04
Punjab National Bank [ICRA]A1+ 6.22Axis Bank Ltd. CRISIL A1+ 4.32Vijaya Bank CARE A1+ 2.71Canara Bank CRISIL A1+ 1.97Andhra Bank IND A1+ 0.53Cooperatieve Rabobank U.A CRISIL A1+ 0.43HDFC Bank Ltd. IND A1+ 0.36
LIC Housing Finance Ltd. CRISIL AAA 0.29Tata Sons Ltd. CRISIL AAA 0.07HDFC Ltd. CRISIL AAA 0.04
41 Days Cmb 18.03.19 SOVEREIGN 3.8845 Days Cmb 18.03.19 SOVEREIGN 2.9091 Day T-Bill 18.04.19 SOVEREIGN 1.9791 Day T-Bill 16.05.19 SOVEREIGN 0.7391 Day T-Bill 07.03.19 SOVEREIGN 0.71
Total 66.36Certificate Of Deposits
Total 16.55Non Convertible Debentures
Total 0.41Treasury Bills
Total 10.19Cash, Cash Equivalents And Others 6.49Grand Total 100.00
Issuer Name Rating (%) Of TotalAUM
Issuer Name Rating (%) Of TotalAUM
Investors understand that their principal
will be at Low risk
^Investors should consult their financial advisers if in doubt about whether the product is suitablefor them.
Sovereign Cash, Cash Equivalents And Others
A1+ AA+AAA and Equivalent
(Previously known as SBI Premier Liquid Fund)
0.41 10.19
82.91
6.49
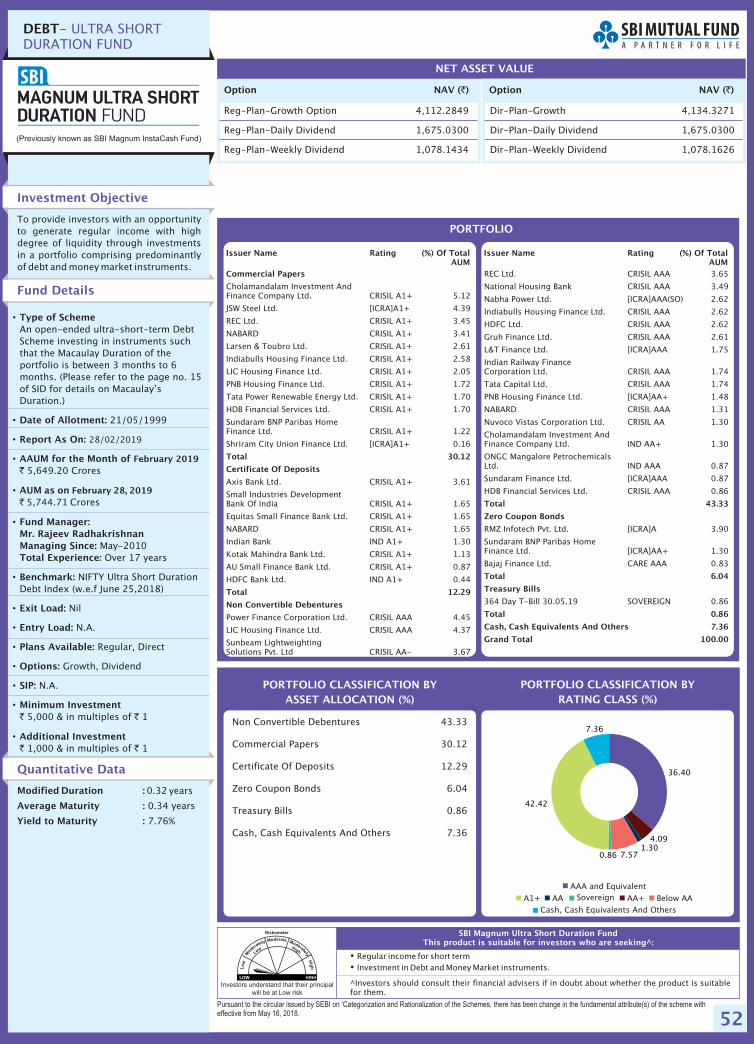
52
�
�
Regular income for short termInvestment in Debt and Money Market instruments.
Pursuant to the circular issued by SEBI on ‘Categorization and Rationalization of the Schemes, there has been change in the fundamental attribute(s) of the scheme witheffective from May 16, 2018.
SBI Magnum Ultra Short Duration FundThis product is suitable for investors who are seeking^:
PORTFOLIO CLASSIFICATION BYRATING CLASS (%)
Non Convertible Debentures 43.33
Commercial Papers 30.12
Certificate Of Deposits 12.29
Zero Coupon Bonds 6.04
Treasury Bills 0.86
Cash, Cash Equivalents And Others 7.36
PORTFOLIO CLASSIFICATION BYASSET ALLOCATION (%)
DEBT- ULTRA SHORTDURATION FUND
Option NAV ( )`
Reg-Plan-Growth Option 4,112.2849
Reg-Plan-Daily Dividend 1,675.0300
Reg-Plan-Weekly Dividend 1,078.1434
NET ASSET VALUE
Option NAV ( )`
Dir-Plan-Growth 4,134.3271
Dir-Plan-Daily Dividend 1,675.0300
Dir-Plan-Weekly Dividend 1,078.1626
PORTFOLIO
Commercial Papers
Total 30.12
Certificate Of Deposits
Total 12.29
Non Convertible Debentures
Cholamandalam Investment AndFinance Company Ltd. CRISIL A1+ 5.12
JSW Steel Ltd. [ICRA]A1+ 4.39
REC Ltd. CRISIL A1+ 3.45
NABARD CRISIL A1+ 3.41
Larsen & Toubro Ltd. CRISIL A1+ 2.61
Indiabulls Housing Finance Ltd. CRISIL A1+ 2.58
LIC Housing Finance Ltd. CRISIL A1+ 2.05
PNB Housing Finance Ltd. CRISIL A1+ 1.72
Tata Power Renewable Energy Ltd. CRISIL A1+ 1.70
HDB Financial Services Ltd. CRISIL A1+ 1.70
Sundaram BNP Paribas HomeFinance Ltd. CRISIL A1+ 1.22
Shriram City Union Finance Ltd. [ICRA]A1+ 0.16
Axis Bank Ltd. CRISIL A1+ 3.61
Small Industries DevelopmentBank Of India CRISIL A1+ 1.65
Equitas Small Finance Bank Ltd. CRISIL A1+ 1.65
NABARD CRISIL A1+ 1.65
Indian Bank IND A1+ 1.30
Kotak Mahindra Bank Ltd. CRISIL A1+ 1.13
AU Small Finance Bank Ltd. CRISIL A1+ 0.87
HDFC Bank Ltd. IND A1+ 0.44
Power Finance Corporation Ltd. CRISIL AAA 4.45
LIC Housing Finance Ltd. CRISIL AAA 4.37
Sunbeam LightweightingSolutions Pvt. Ltd CRISIL AA- 3.67
REC Ltd. CRISIL AAA 3.65
National Housing Bank CRISIL AAA 3.49
Nabha Power Ltd. [ICRA]AAA(SO) 2.62
Indiabulls Housing Finance Ltd. CRISIL AAA 2.62
HDFC Ltd. CRISIL AAA 2.62
Gruh Finance Ltd. CRISIL AAA 2.61
L&T Finance Ltd. [ICRA]AAA 1.75
Indian Railway FinanceCorporation Ltd. CRISIL AAA 1.74
Tata Capital Ltd. CRISIL AAA 1.74
PNB Housing Finance Ltd. [ICRA]AA+ 1.48
NABARD CRISIL AAA 1.31
Nuvoco Vistas Corporation Ltd. CRISIL AA 1.30
Cholamandalam Investment AndFinance Company Ltd. IND AA+ 1.30
ONGC Mangalore PetrochemicalsLtd. IND AAA 0.87
Sundaram Finance Ltd. [ICRA]AAA 0.87
HDB Financial Services Ltd. CRISIL AAA 0.86
RMZ Infotech Pvt. Ltd. [ICRA]A 3.90
Sundaram BNP Paribas HomeFinance Ltd. [ICRA]AA+ 1.30
Bajaj Finance Ltd. CARE AAA 0.83
364 Day T-Bill 30.05.19 SOVEREIGN 0.86
Total 43.33
Zero Coupon Bonds
Total 6.04
Treasury Bills
Total 0.86
Cash, Cash Equivalents And Others 7.36
Grand Total 100.00
Issuer Name Rating (%) Of TotalAUM
Issuer Name Rating (%) Of TotalAUM
Investors understand that their principal
will be at Low risk
^Investors should consult their financial advisers if in doubt about whether the product is suitablefor them.
Investment Objective
Quantitative Data
To provide investors with an opportunityto generate regular income with highdegree of liquidity through investmentsin a portfolio comprising predominantlyof debt and money market instruments.
Fund Details
Modified Duration :
Average Maturity :
Yield to Maturity :
0.32
0.34 years
7.76%
years
•
•
•
•
•
•
•
•
•
•
•
•
•
•
Type of Scheme
Date of Allotment:
Report As On:
AAUM for the
AUM as on
Fund Manager:Mr. Rajeev RadhakrishnanManaging Since:Total Experience:
Benchmark:
Exit Load:
Entry Load:
Plans Available:
Options:
SIP:
Minimum Investment
Additional Investment
An open-ended ultra-short-term DebtScheme investing in instruments suchthat the Macaulay Duration of theportfolio is between 3 months to 6months. (
21/05/1999
5,649.20 Crores
5,744.71 Crores
May-2010Over 17 years
NIFTY Ultra Short DurationDebt Index (w.e.f June 25,2018)
Nil
N.A.
Regular, Direct
Growth, Dividend
N.A.
5,000 & in multiples of 1
1,000 & in multiples of 1
28/02/2019
Month of February 2019
February 28, 2019
`
`
` `
` `
Please refer to the page no. 15of SID for details on Macaulay’sDuration.)
(Previously known as SBI Magnum InstaCash Fund)
AAA and Equivalent
Below AAAA+A1+ AA Sovereign
Cash, Cash Equivalents And Others
36.40
4.091.30
7.570.86
42.42
7.36
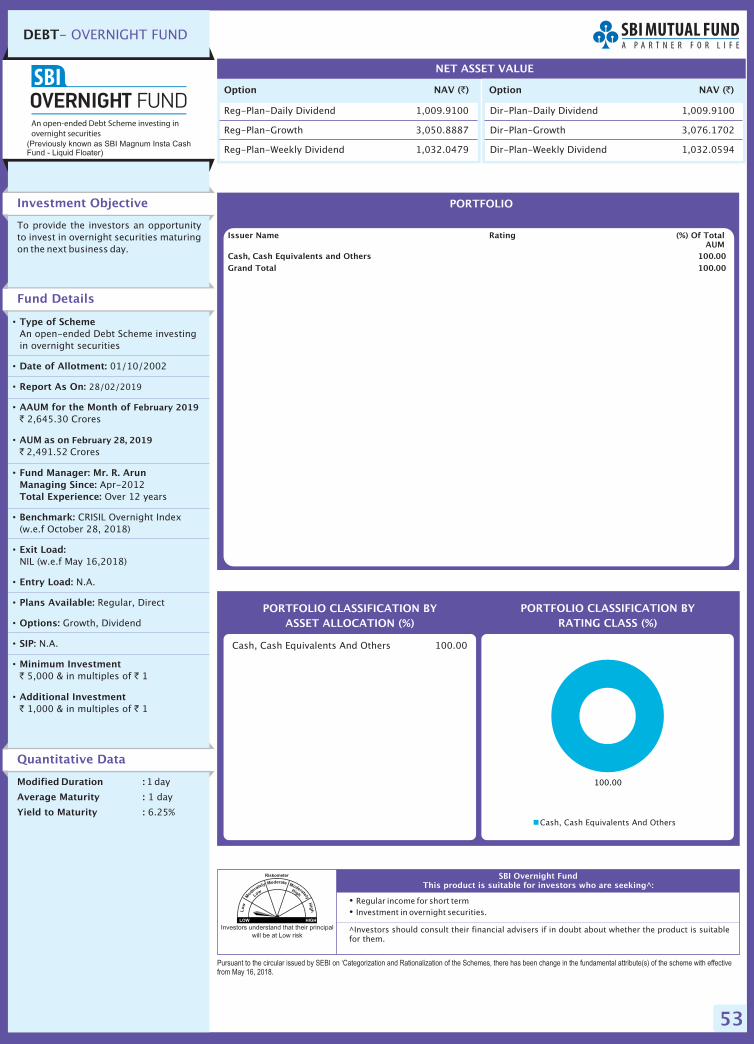
53
�
�
Regular income for short termInvestment in overnight securities.
Pursuant to the circular issued by SEBI on ‘Categorization and Rationalization of the Schemes, there has been change in the fundamental attribute(s) of the scheme with effectivefrom May 16, 2018.
SBI Overnight FundThis product is suitable for investors who are seeking^:
PORTFOLIO CLASSIFICATION BYRATING CLASS (%)
Cash, Cash Equivalents And Others 100.00
Investment Objective
Quantitative Data
To provide the investors an opportunityto invest in overnight securities maturingon the next business day.
Fund Details
Modified Duration :
Average Maturity :
Yield to Maturity :
1 day
1 day
6.25%
•
•
•
•
•
•
•
•
•
•
•
•
•
•
Type of Scheme
Date of Allotment:
Report As On:
AAUM for the Month of
AUM as on
Fund Manager: Mr. R. ArunManaging Since:Total Experience:
Benchmark:
Exit Load:
Entry Load:
Plans Available:
Options:
SIP:
Minimum Investment
Additional Investment
An open-ended Debt Scheme investingin overnight securities
01/10/2002
2,645.30 Crores
2,491.52 Crores
Apr-2012Over 12 years
CRISIL Overnight Index(w.e.f October 28, 2018)
NIL (w.e.f May 16,2018)
N.A.
Regular, Direct
Growth, Dividend
N.A.
5,000 & in multiples of 1
1,000 & in multiples of 1
28/02/2019
February 2019
February 28, 2019
`
`
` `
` `
PORTFOLIO CLASSIFICATION BYASSET ALLOCATION (%)
DEBT- OVERNIGHT FUND
Option NAV ( )`
Reg-Plan-Daily Dividend 1,009.9100
Reg-Plan-Growth 3,050.8887
Reg-Plan-Weekly Dividend 1,032.0479
NET ASSET VALUE
Option NAV ( )`
Dir-Plan-Daily Dividend 1,009.9100
Dir-Plan-Growth 3,076.1702
Dir-Plan-Weekly Dividend 1,032.0594
PORTFOLIO
Cash, Cash Equivalents and Others 100.00
Grand Total 100.00
Issuer Name (%) Of TotalAUM
Rating
Investors understand that their principal
will be at Low risk^Investors should consult their financial advisers if in doubt about whether the product is suitablefor them.
Cash, Cash Equivalents And Others
100.00
(Previously known as SBI Magnum Insta CashFund - Liquid Floater)
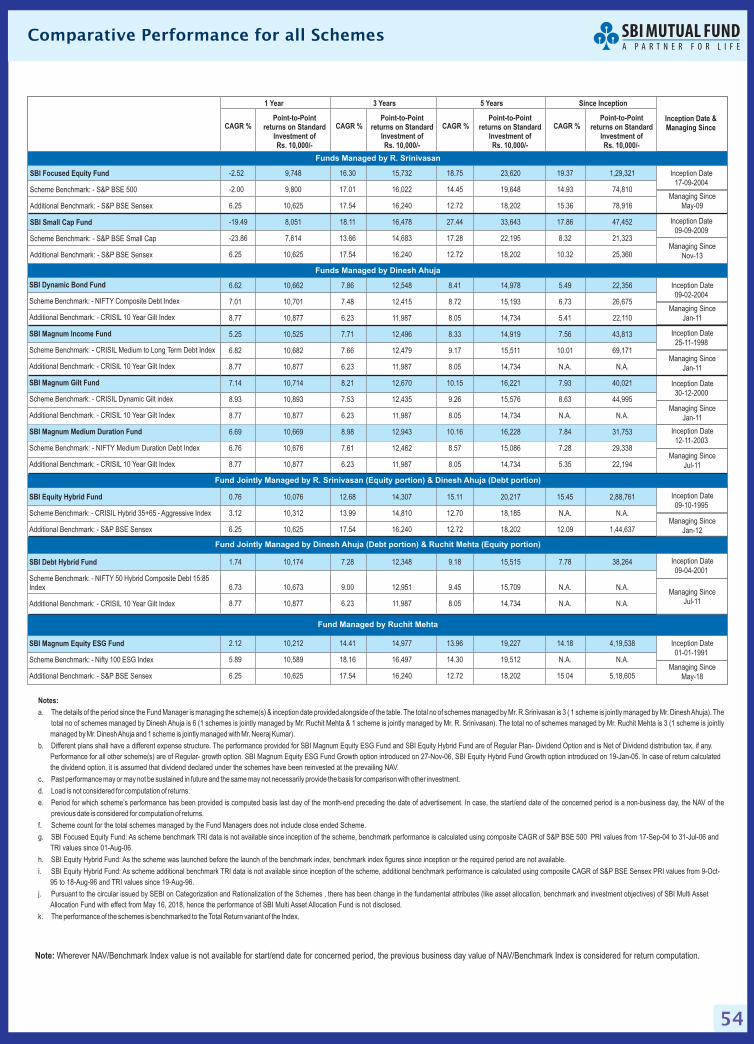
54
Comparative Performance for all Schemes
Note: Wherever NAV/Benchmark Index value is not available for start/end date for concerned period, the previous business day value of NAV/Benchmark Index is considered for return computation.
CAGR %Point-to-Point
returns on StandardInvestment ofRs. 10,000/-
CAGR %Point-to-Point
returns on StandardInvestment ofRs. 10,000/-
CAGR %Point-to-Point
returns on StandardInvestment ofRs. 10,000/-
3 Years 5 Years
CAGR %Point-to-Point
returns on StandardInvestment ofRs. 10,000/-
Since Inception
Inception Date &Managing Since
Managing Since
May-09
Inception Date
17-09-2004
1 Year
Managing Since
Nov-13
Inception Date
09-09-2009
-2.52 9,748 16.30 15,732 18.75 23,620 19.37 1,29,321
-2.00 9,800 17.01 16,022 14.45 19,648 14.93 74,810
6.25 10,625 17.54 16,240 12.72 18,202 15.36 78,916
-19.49 8,051 18.11 16,478 27.44 33,643 17.86 47,452
-23.86 7,614 13.66 14,683 17.28 22,195 8.32 21,323
6.25 10,625 17.54 16,240 12.72 18,202 10.32 25,360
SBI Focused Equity Fund
SBI Small Cap Fund
Scheme Benchmark: - S&P BSE 500
Additional Benchmark: - S&P BSE Sensex
Scheme Benchmark: - S&P BSE Small Cap
Additional Benchmark: - S&P BSE Sensex
Funds Managed by R. Srinivasan
Notes:
a.
c. Past performance may or may not be sustained in future and the same may not necessarily provide the basis for comparison with other investment.
d. Load is not considered for computation of returns.
e. Period for which scheme’s performance has been provided is computed basis last day of the month-end preceding the date of advertisement. In case, the start/end date of the concerned period is a non-business day, the NAV of the
previous date is considered for computation of returns.
The details of the period since the Fund Manager is managing the scheme(s) & inception date provided alongside of the table. The total no of schemes managed by Mr. R.Srinivasan is 3 ( 1 scheme is jointly managed by Mr. DineshAhuja). The
total no of schemes managed by Dinesh Ahuja is 6 (1 schemes is jointly managed by Mr. Ruchit Mehta & 1 scheme is jointly managed by Mr. R. Srinivasan). The total no of schemes managed by Mr. Ruchit Mehta is 3 (1 scheme is jointly
managed by Mr. DineshAhuja and 1 scheme is jointly managed with Mr. Neeraj Kumar).
b. Different plans shall have a different expense structure. The performance provided for SBI Magnum Equity ESG Fund and SBI Equity Hybrid Fund are of Regular Plan- Dividend Option and is Net of Dividend distribution tax, if any.
Performance for all other scheme(s) are of Regular- growth option. SBI Magnum Equity ESG Fund Growth option introduced on 27-Nov-06, SBI Equity Hybrid Fund Growth option introduced on 19-Jan-05.
h. SBI Equity Hybrid Fund: As the scheme was launched before the launch of the benchmark index, benchmark index figures since inception or the required period are not available.
i. SBI Equity Hybrid Fund: As scheme additional benchmark TRI data is not available since inception of the scheme, additional benchmark performance is calculated using composite CAGR of S&P BSE Sensex PRI values from 9-Oct-
95 to 18-Aug-96 and TRI values since 19-Aug-96.
j. Pursuant to the circular issued by SEBI on Categorization and Rationalization of the Schemes , there has been change in the fundamental attributes (like asset allocation, benchmark and investment objectives) of SBI Multi Asset
Allocation Fund with effect from May 16, 2018, hence the performance of SBI Multi Asset Allocation Fund is not disclosed.
In case of return calculated
the dividend option, it is assumed that dividend declared under the schemes have been reinvested at the prevailing NAV.
f. Scheme count for the total schemes managed by the Fund Managers does not include close ended Scheme.
g. SBI Focused Equity Fund: As scheme benchmark TRI data is not available since inception of the scheme, benchmark performance is calculated using composite CAGR of S&P BSE 500 PRI values from 17-Sep-04 to 31-Jul-06 and
TRI values since 01-Aug-06.
k. The performance of the schemes is benchmarked to the Total Return variant of the Index.
Managing Since
Jan-11
Inception Date
09-02-2004
Managing Since
Jan-11
Inception Date
25-11-1998
Managing Since
Jan-11
Managing Since
Jul-11
Inception Date
30-12-2000
Inception Date
12-11-2003
Inception Date
09-10-1995
Inception Date
09-04-2001
Inception Date
01-01-1991
Managing Since
Jan-12
Managing Since
Jul-11
Managing Since
May-18
Funds Managed by Dinesh Ahuja
Fund Jointly Managed by R. Srinivasan (Equity portion) & Dinesh Ahuja (Debt portion)
Fund Jointly Managed by Dinesh Ahuja (Debt portion) & Ruchit Mehta (Equity portion)
Fund Managed by Ruchit Mehta
6.62 10,662 7.86 12,548 8.41 14,978 5.49 22,356
7.01 10,701 7.48 12,415 8.72 15,193 6.73 26,675
8.77 10,877 6.23 11,987 8.05 14,734 5.41 22,110
5.25 10,525 7.71 12,496 8.33 14,919 7.56 43,813
6.82 10,682 7.66 12,479 9.17 15,511 10.01 69,171
8.77 10,877 6.23 11,987 8.05 14,734 N.A. N.A.
7.14 10,714 8.21 12,670 10.15 16,221 7.93 40,021
8.93 10,893 7.53 12,435 9.26 15,576 8.63 44,995
8.77 10,877 6.23 11,987 8.05 14,734 N.A. N.A.
6.69 10,669 8.98 12,943 10.16 16,228 7.84 31,753
6.76 10,676 7.61 12,462 8.57 15,086 7.28 29,338
8.77 10,877 6.23 11,987 8.05 14,734 5.35 22,194
0.76 10,076 12.68 14,307 15.11 20,217 15.45 2,88,761
3.12 10,312 13.99 14,810 12.70 18,185 N.A. N.A.
6.25 10,625 17.54 16,240 12.72 18,202 12.09 1,44,637
1.74 10,174 7.28 12,348 9.18 15,515 7.78 38,264
6.73 10,673 9.00 12,951 9.45 15,709 N.A. N.A.
8.77 10,877 6.23 11,987 8.05 14,734 N.A. N.A.
2.12 10,212 14.41 14,977 13.96 19,227 14.18 4,19,538
5.89 10,589 18.16 16,497 14.30 19,512 N.A. N.A.
6.25 10,625 17.54 16,240 12.72 18,202 15.04 5,18,605
SBI Dynamic Bond Fund
SBI Magnum Income Fund
SBI Magnum Gilt Fund
SBI Magnum Medium Duration Fund
SBI Equity Hybrid Fund
SBI Debt Hybrid Fund
Scheme Benchmark: - NIFTY Composite Debt Index
Additional Benchmark: - CRISIL 10 Year Gilt Index
Scheme Benchmark: - CRISIL Medium to Long Term Debt Index
Additional Benchmark: - CRISIL 10 Year Gilt Index
Scheme Benchmark: - CRISIL Dynamic Gilt index
Additional Benchmark: - CRISIL 10 Year Gilt Index
Scheme Benchmark: - NIFTY Medium Duration Debt Index
Additional Benchmark: - CRISIL 10 Year Gilt Index
Scheme Benchmark: - CRISIL Hybrid 35+65 - Aggressive Index
Additional Benchmark: - S&P BSE Sensex
Scheme Benchmark: - NIFTY 50 Hybrid Composite Debt 15:85Index
Additional Benchmark: - CRISIL 10 Year Gilt Index
SBI Magnum Equity ESG Fund
Scheme Benchmark: - Nifty 100 ESG Index
Additional Benchmark: - S&P BSE Sensex
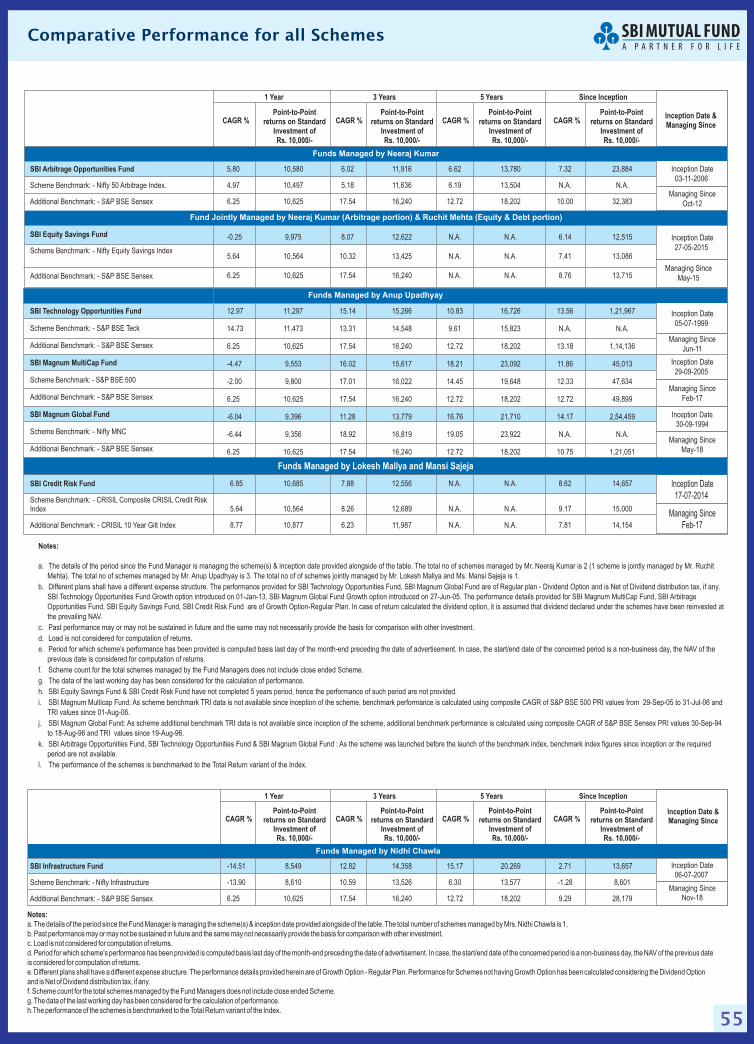
55
Comparative Performance for all Schemes
Notes:
a.
b.
c. Past performance may or may not be sustained in future and the same may not necessarily provide the basis for comparison with other investment.
d. Load is not considered for computation of returns.
e. Period for which scheme’s performance has been provided is computed basis last day of the month-end preceding the date of advertisement. In case, the start/end date of the concerned period is a non-business day, the NAV of the
previous date is considered for computation of returns.
f. Scheme count for the total schemes managed by the Fund Managers does not include ended Scheme.
The details of the period since the Fund Manager is managing the scheme(s) & inception date provided alongside of the table. The total no of schemes managed by Mr. Neeraj Kumar is 2 (1 scheme is jointly managed by Mr. Ruchit
Mehta). The total no of schemes managed by Mr. Anup Upadhyay is 3. The total no of of schemes jointly managed by Mr. Lokesh Mallya and Ms. Mansi Sajeja is 1.
Different plans shall have a different expense structure. The performance provided for SBI Technology Opportunities Fund, SBI Magnum Global Fund are of Regular plan - Dividend Option and is Net of Dividend distribution tax, if any.
SBI Technology Opportunities Fund Growth option introduced on 01-Jan-13, SBI Magnum Global Fund Growth option introduced on 27-Jun-05. The performance details provided for SBI Magnum MultiCap Fund, SBI Arbitrage
Opportunities Fund, SBI Equity Savings Fund, SBI Credit Risk Fund are of Growth Option-Regular Plan. In case of return calculated the dividend option, it is assumed that dividend declared under the schemes have been reinvested at
the prevailing NAV.
close
g. The data of the last working day has been considered for the calculation of performance.
h. SBI Equity Savings Fund & SBI Credit Risk Fund have not completed 5 years period, hence the performance of such period are not provided.
i. SBI Magnum Multicap Fund: As scheme benchmark TRI data is not available since inception of the scheme, benchmark performance is calculated using composite CAGR of S&P BSE 500 PRI values from 29-Sep-05 to 31-Jul-06 and
TRI values since 01-Aug-06.
j. SBI Magnum Global Fund: As scheme additional benchmark TRI data is not available since inception of the scheme, additional benchmark performance is calculated using composite CAGR of S&P BSE Sensex PRI values 30-Sep-94
to 18-Aug-96 and TRI values since 19-Aug-96.
k. SBI Arbitrage Opportunities Fund, SBI Technology Opportunities Fund & SBI Magnum Global Fund : As the scheme was launched before the launch of the benchmark index, benchmark index figures since inception or the required
period are not available.
l. The performance of the schemes is benchmarked to the Total Return variant of the Index.
CAGR %Point-to-Point
returns on StandardInvestment ofRs. 10,000/-
CAGR %Point-to-Point
returns on StandardInvestment ofRs. 10,000/-
CAGR %Point-to-Point
returns on StandardInvestment ofRs. 10,000/-
3 Years 5 Years
CAGR %Point-to-Point
returns on StandardInvestment ofRs. 10,000/-
Since Inception
Inception Date &Managing Since
Managing Since
Oct-12
Inception Date
03-11-2006
SBI Arbitrage Opportunities Fund
SBI Equity Savings Fund
Scheme Benchmark: - Nifty 50 Arbitrage Index.
Additional Benchmark: - S&P BSE Sensex
Scheme Benchmark: - Nifty Equity Savings Index
Additional Benchmark: - S&P BSE Sensex
5.80 10,580 6.02 11,916 6.62 13,780 7.32 23,884
4.97 10,497 5.18 11,636 6.19 13,504 N.A. N.A.
6.25 10,625 17.54 16,240 12.72 18,202 10.00 32,383
-0.25 9,975 8.07 12,622 N.A. N.A. 6.14 12,515
5.64 10,564 10.32 13,425 N.A. N.A. 7.41 13,086
6.25 10,625 17.54 16,240 N.A. N.A. 8.76 13,715
1 Year
Managing Since
May-15
Inception Date
27-05-2015
Fund Jointly Managed by Neeraj Kumar (Arbitrage portion) & Ruchit Mehta (Equity & Debt portion)
Funds Managed by Neeraj Kumar
Managing Since
Jun-11
Inception Date
05-07-1999
Managing Since
Feb-17
Inception Date
29-09-2005
Funds Managed by Anup Upadhyay
Managing Since
May-18
Inception Date
30-09-1994
SBI Technology Opportunities Fund
SBI Magnum MultiCap Fund
SBI Magnum Global Fund
Scheme Benchmark: - S&P BSE Teck
Additional Benchmark: - S&P BSE Sensex
Scheme Benchmark: - S&P BSE 500
Additional Benchmark: - S&P BSE Sensex
Scheme Benchmark: - Nifty MNC
Additional Benchmark: - S&P BSE Sensex
12.97 11,297 15.14 15,266 10.83 16,726 13.56 1,21,967
14.73 11,473 13.31 14,548 9.61 15,823 N.A. N.A.
6.25 10,625 17.54 16,240 12.72 18,202 13.18 1,14,136
-4.47 9,553 16.02 15,617 18.21 23,092 11.86 45,013
-2.00 9,800 17.01 16,022 14.45 19,648 12.33 47,634
6.25 10,625 17.54 16,240 12.72 18,202 12.72 49,899
-6.04 9,396 11.28 13,779 16.76 21,710 14.17 2,54,459
-6.44 9,356 18.92 16,819 19.05 23,922 N.A. N.A.
6.25 10,625 17.54 16,240 12.72 18,202 10.75 1,21,051
Managing Since
Feb-17
Inception Date
17-07-2014
SBI Credit Risk Fund
Scheme Benchmark: - CRISIL Composite CRISIL Credit RiskIndex
Additional Benchmark: - CRISIL 10 Year Gilt Index
6.85 10,685 7.88 12,556 N.A. N.A. 8.62 14,657
5.64 10,564 8.26 12,689 N.A. N.A. 9.17 15,000
8.77 10,877 6.23 11,987 N.A. N.A. 7.81 14,154
Funds Managed by Lokesh Mallya and Mansi Sajeja
CAGR %Point-to-Point
returns on StandardInvestment ofRs. 10,000/-
CAGR %Point-to-Point
returns on StandardInvestment ofRs. 10,000/-
CAGR %Point-to-Point
returns on StandardInvestment ofRs. 10,000/-
3 Years 5 Years
CAGR %Point-to-Point
returns on StandardInvestment ofRs. 10,000/-
Since Inception
Inception Date &Managing Since
1 Year
-14.51 8,549 12.82 14,358 15.17 20,269 2.71 13,657
-13.90 8,610 10.59 13,526 6.30 13,577 -1.28 8,601
6.25 10,625 17.54 16,240 12.72 18,202 9.29 28,179
Funds Managed by Nidhi Chawla
SBI Infrastructure Fund
Scheme Benchmark: - Nifty Infrastructure
Additional Benchmark: - S&P BSE Sensex
Inception Date
06-07-2007
Managing Since
Nov-18
Notes:
a. The details of the period since the Fund Manager is managing the scheme(s) & inception date provided alongside of the table. The total number of schemes managed by Mrs. Nidhi Chawla is 1.
b. Past performance may or may not be sustained in future and the same may not necessarily provide the basis for comparison with other investment.
c. Load is not considered for computation of returns.
d. Period for which scheme's performance has been provided is computed basis last day of the month-end preceding the date of advertisement. In case, the start/end date of the concerned period is a non-business day, the NAV of the previous date
is considered for computation of returns.
e. Different plans shall have a different expense structure. The performance details provided herein are of Growth Option - Regular Plan. Performance for Schemes not having Growth Option has been calculated considering the Dividend Option
and is Net of Dividend distribution tax, if any.
f. Scheme count for the total schemes managed by the Fund Managers does not include close ended Scheme.
g. The data of the last working day has been considered for the calculation of performance.
h.The performance of the schemes is benchmarked to the Total Return variant of the Index.
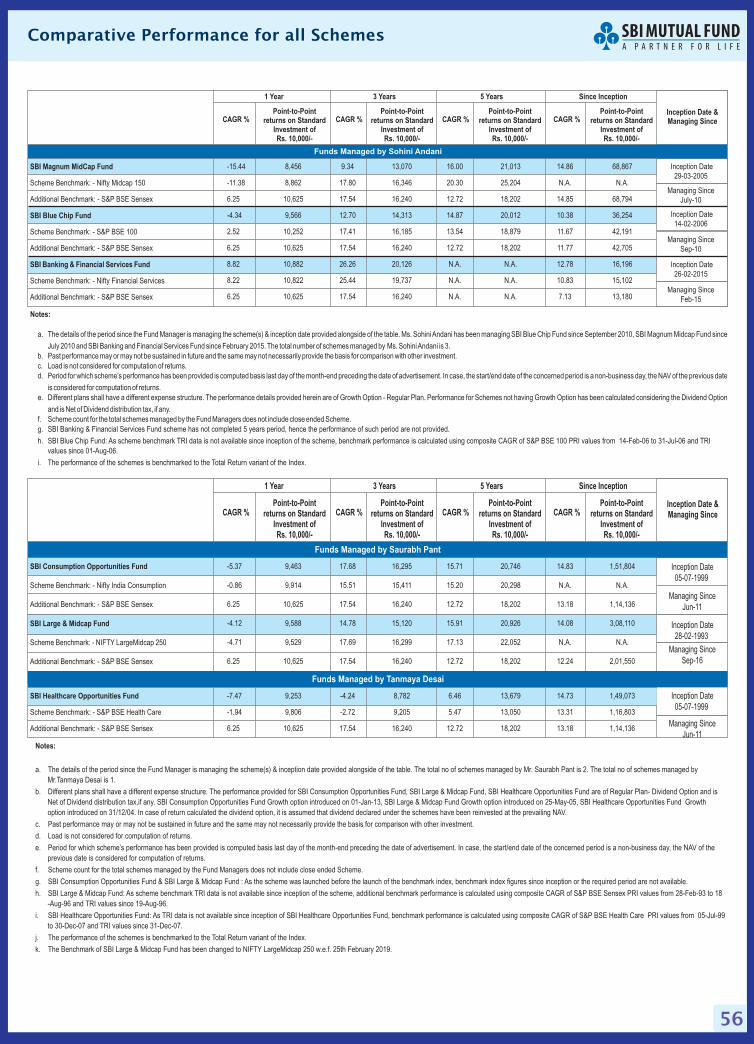
56
Comparative Performance for all Schemes
Notes:
a.
b.
c. Past performance may or may not be sustained in future and the same may not necessarily provide the basis for comparison with other investment.
d. Load is not considered for computation of returns.
e. Period for which scheme’s performance has been provided is computed basis last day of the month-end preceding the date of advertisement. In case, the start/end date of the concerned period is a non-business day, the NAV of the
previous date is considered for computation of returns.
f. Scheme count for the total schemes managed by the Fund Managers does not include ended Scheme.
The details of the period since the Fund Manager is managing the scheme(s) & inception date provided alongside of the table. The total no of schemes managed by Mr. Saurabh Pant is 2. The total no of schemes managed by
Mr.Tanmaya Desai is 1.
Different plans shall have a different expense structure. The performance provided for SBI Consumption Opportunities Fund, SBI Large & Midcap Fund, SBI Healthcare Opportunities Fund are of Regular Plan- Dividend Option and is
Net of Dividend distribution tax,if any. SBI Consumption Opportunities Fund Growth option introduced on 01-Jan-13, SBI Large & Midcap Fund Growth option introduced on 25-May-05, SBI Healthcare Opportunities Fund Growth
option introduced on 31/12/04. In case of return calculated the dividend option, it is assumed that dividend declared under the schemes have been reinvested at the prevailing NAV.
close
g. SBI Consumption Opportunities Fund & SBI Large & Midcap Fund : As the scheme was launched before the launch of the benchmark index, benchmark index figures since inception or the required period are not available.
h. SBI Large & Midcap Fund: As scheme benchmark TRI data is not available since inception of the scheme, additional benchmark performance is calculated using composite CAGR of S&P BSE Sensex PRI values from 28-Feb-93 to 18
-Aug-96 and TRI values since 19-Aug-96.
i. SBI Healthcare Opportunities Fund: As TRI data is not available since inception of SBI Healthcare Opportunities Fund, benchmark performance is calculated using composite CAGR of S&P BSE Health Care PRI values from 05-Jul-99
to 30-Dec-07 and TRI values since 31-Dec-07.
j. The performance of the schemes is benchmarked to the Total Return variant of the Index.
k. The Benchmark of SBI Large & Midcap Fund has been changed to NIFTY LargeMidcap 250 w.e.f. 25th February 2019.
CAGR %Point-to-Point
returns on StandardInvestment ofRs. 10,000/-
CAGR %Point-to-Point
returns on StandardInvestment ofRs. 10,000/-
CAGR %Point-to-Point
returns on StandardInvestment ofRs. 10,000/-
3 Years 5 Years
CAGR %Point-to-Point
returns on StandardInvestment ofRs. 10,000/-
Since Inception
Inception Date &Managing Since
Managing Since
Jun-11
Inception Date
05-07-1999
SBI Consumption Opportunities Fund
SBI Large & Midcap Fund
Scheme Benchmark: - Nifty India Consumption
Additional Benchmark: - S&P BSE Sensex
Scheme Benchmark: - NIFTY LargeMidcap 250
Additional Benchmark: - S&P BSE Sensex
-5.37 9,463 17.68 16,295 15.71 20,746 14.83 1,51,804
-0.86 9,914 15.51 15,411 15.20 20,298 N.A. N.A.
6.25 10,625 17.54 16,240 12.72 18,202 13.18 1,14,136
-4.12 9,588 14.78 15,120 15.91 20,926 14.08 3,08,110
-4.71 9,529 17.69 16,299 17.13 22,052 N.A. N.A.
6.25 10,625 17.54 16,240 12.72 18,202 12.24 2,01,550
Managing Since
Sep-16
Inception Date
28-02-1993
1 Year
Funds Managed by Saurabh Pant
Managing Since
Jun-11
Inception Date
05-07-1999
SBI Healthcare Opportunities Fund
Scheme Benchmark: - S&P BSE Health Care
Additional Benchmark: - S&P BSE Sensex
-7.47 9,253 -4.24 8,782 6.46 13,679 14.73 1,49,073
-1.94 9,806 -2.72 9,205 5.47 13,050 13.31 1,16,803
6.25 10,625 17.54 16,240 12.72 18,202 13.18 1,14,136
Funds Managed by Tanmaya Desai
Notes:
a. Ms. SohiniAndani has been managing SBI Blue Chip Fund since September 2010, SBI Magnum Midcap Fund since
July 2010 and SBI Banking and Financial Services Fund since February 2015. The total number of schemes managed by Ms. SohiniAndani is 3.
b. Past performance may or may not be sustained in future and the same may not necessarily provide the basis for comparison with other investment.
c. Load is not considered for computation of returns.
d. Period for which scheme’s performance has been provided is computed basis last day of the month-end preceding the date of advertisement. In case, the start/end date of the concerned period is a non-business day, the NAV of the previous date
is considered for computation of returns.
e. Different plans shall have a different expense structure. The performance details provided herein are of Growth Option - Regular Plan. Performance for Schemes not having Growth Option has been calculated considering the Dividend Option
and is Net of Dividend distribution tax, if any.
f. Scheme count for the total schemes managed by the Fund Managers does not include Scheme.close ended
g. SBI Banking & Financial Services Fund scheme has not completed 5 years period, hence the performance of such period are not provided.
h. SBI Blue Chip Fund: As scheme benchmark TRI data is not available since inception of the scheme, benchmark performance is calculated using composite CAGR of S&P BSE 100 PRI values from 14-Feb-06 to 31-Jul-06 and TRI
values since 01-Aug-06.
i. The performance of the schemes is benchmarked to the Total Return variant of the Index.
The details of the period since the Fund Manager is managing the scheme(s) & inception date provided alongside of the table.
CAGR %Point-to-Point
returns on StandardInvestment ofRs. 10,000/-
CAGR %Point-to-Point
returns on StandardInvestment ofRs. 10,000/-
CAGR %Point-to-Point
returns on StandardInvestment ofRs. 10,000/-
3 Years 5 Years
CAGR %Point-to-Point
returns on StandardInvestment ofRs. 10,000/-
Since Inception
Inception Date &Managing Since
Managing Since
July-10
Inception Date
29-03-2005
SBI Magnum MidCap Fund
SBI Blue Chip Fund
SBI Banking & Financial Services Fund
Scheme Benchmark: - Nifty Midcap 150
Additional Benchmark: - S&P BSE Sensex
Scheme Benchmark: - S&P BSE 100
Additional Benchmark: - S&P BSE Sensex
Scheme Benchmark: - Nifty Financial Services
Additional Benchmark: - S&P BSE Sensex
-15.44 8,456 9.34 13,070 16.00 21,013 14.86 68,867
-11.38 8,862 17.80 16,346 20.30 25,204 N.A. N.A.
6.25 10,625 17.54 16,240 12.72 18,202 14.85 68,794
-4.34 9,566 12.70 14,313 14.87 20,012 10.38 36,254
2.52 10,252 17.41 16,185 13.54 18,879 11.67 42,191
6.25 10,625 17.54 16,240 12.72 18,202 11.77 42,705
8.82 10,882 26.26 20,126 N.A. N.A. 12.78 16,196
8.22 10,822 25.44 19,737 N.A. N.A. 10.83 15,102
6.25 10,625 17.54 16,240 N.A. N.A. 7.13 13,180
1 Year
Managing Since
Sep-10
Inception Date
14-02-2006
Managing Since
Feb-15
Inception Date
26-02-2015
Funds Managed by Sohini Andani
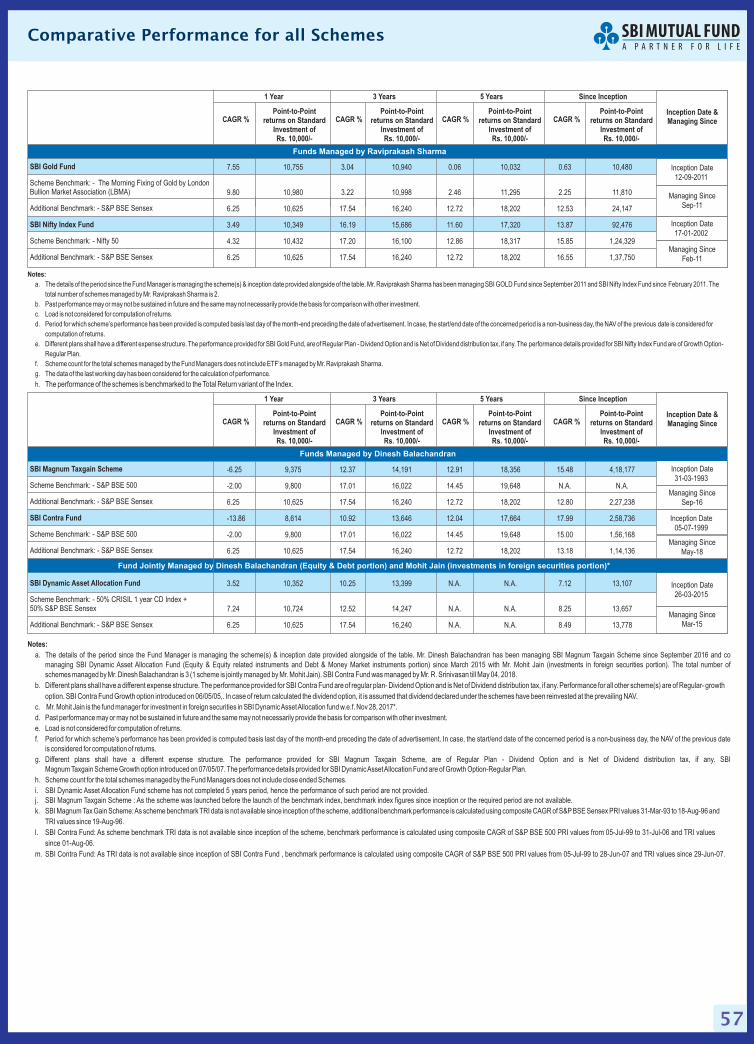
57
Comparative Performance for all Schemes
Notes:
a. Mr. Dinesh Balachandran has been managing SBI Magnum Taxgain Scheme since September 2016 and co
managing SBI Dynamic Asset Allocation Fund (Equity & Equity related instruments and Debt & Money Market instruments portion) since March 2015 with Mr. Mohit Jain (investments in foreign securities portion). The total number of
schemes managed by Mr. Dinesh Balachandran is 3 (1 scheme is jointly managed by Mr. Mohit Jain).
c. Mr. Mohit Jain is the fund manager for investment in foreign securities in SBI DynamicAssetAllocation fund w.e.f. Nov 28, 2017*.
d. Past performance may or may not be sustained in future and the same may not necessarily provide the basis for comparison with other investment.
e. Load is not considered for computation of returns.
f. Period for which scheme’s performance has been provided is computed basis last day of the month-end preceding the date of advertisement. In case, the start/end date of the concerned period is a non-business day, the NAV of the previous date
is considered for computation of returns.
g. Different plans shall have a different expense structure. The performance provided for SBI Magnum Taxgain Scheme, are of Regular Plan - Dividend Option and is Net of Dividend distribution tax, if any. SBI
Magnum Taxgain Scheme Growth option introduced on 07/05/07. The performance details provided for SBI DynamicAssetAllocation Fund are of Growth Option-Regular Plan.
h. Scheme count for the total schemes managed by the Fund Managers does not include ended Schemes.
SBI Contra Fund was managed by Mr. R. Srinivasan till May 04, 2018.
In case of return calculated the dividend option, it is assumed that dividend declared under the schemes have been reinvested at the prevailing NAV.
l. SBI Contra Fund: As scheme benchmark TRI data is not available since inception of the scheme, benchmark performance is calculated using composite CAGR of S&P BSE 500 PRI values from 05-Jul-99 to 31-Jul-06 and TRI values
since 01-Aug-06.
m. SBI Contra Fund: As TRI data is not available since inception of SBI Contra Fund , benchmark performance is calculated using composite CAGR of S&P BSE 500 PRI values from 05-Jul-99 to 28-Jun-07 and TRI values since 29-Jun-07.
close
i. SBI Dynamic Asset Allocation Fund scheme has not completed 5 years period, hence the performance of such period are not provided.
j. SBI Magnum Taxgain Scheme : As the scheme was launched before the launch of the benchmark index, benchmark index figures since inception or the required period are not available.
k. SBI Magnum Tax Gain Scheme:As scheme benchmark TRI data is not available since inception of the scheme, additional benchmark performance is calculated using composite CAGR of S&P BSE Sensex PRI values 31-Mar-93 to 18-Aug-96 and
TRI values since 19-Aug-96.
The details of the period since the Fund Manager is managing the scheme(s) & inception date provided alongside of the table.
b. Different plans shall have a different expense structure. The performance provided for SBI Contra Fund are of regular plan- Dividend Option and is Net of Dividend distribution tax, if any. Performance for all other scheme(s) are of Regular- growth
option. SBI Contra Fund Growth option introduced on 06/05/05,.
CAGR %Point-to-Point
returns on StandardInvestment ofRs. 10,000/-
CAGR %Point-to-Point
returns on StandardInvestment ofRs. 10,000/-
CAGR %Point-to-Point
returns on StandardInvestment ofRs. 10,000/-
3 Years 5 Years
CAGR %Point-to-Point
returns on StandardInvestment ofRs. 10,000/-
Since Inception
Managing Since
Mar-15
Inception Date
26-03-2015
Fund Jointly Managed by Dinesh Balachandran (Equity & Debt portion) and Mohit Jain (investments in foreign securities portion)*
Inception Date &Managing Since
Managing Since
Sep-16
Managing Since
May-18
Inception Date
31-03-1993
Inception Date
05-07-1999
SBI Magnum Taxgain Scheme
SBI Contra Fund
SBI Dynamic Asset Allocation Fund
Scheme Benchmark: - S&P BSE 500
Additional Benchmark: - S&P BSE Sensex
Scheme Benchmark: - S&P BSE 500
Additional Benchmark: - S&P BSE Sensex
Scheme Benchmark: - 50% CRISIL 1 year CD Index +50% S&P BSE Sensex
Additional Benchmark: - S&P BSE Sensex
-6.25 9,375 12.37 14,191 12.91 18,356 15.48 4,18,177
-2.00 9,800 17.01 16,022 14.45 19,648 N.A. N.A.
6.25 10,625 17.54 16,240 12.72 18,202 12.80 2,27,238
-13.86 8,614 10.92 13,646 12.04 17,664 17.99 2,58,736
-2.00 9,800 17.01 16,022 14.45 19,648 15.00 1,56,168
6.25 10,625 17.54 16,240 12.72 18,202 13.18 1,14,136
3.52 10,352 10.25 13,399 N.A. N.A. 7.12 13,107
7.24 10,724 12.52 14,247 N.A. N.A. 8.25 13,657
6.25 10,625 17.54 16,240 N.A. N.A. 8.49 13,778
1 Year
Funds Managed by Dinesh Balachandran
Notes:
a.
The performance of the schemes is benchmarked to the Total Return variant of the Index.
The details of the period since the Fund Manager is managing the scheme(s) & inception date provided alongside of the table. Mr. Raviprakash Sharma has been managing SBI GOLD Fund since September 2011 and SBI Nifty Index Fund since February 2011. The
total number of schemes managed by Mr. Raviprakash Sharma is 2.
b. Past performance may or may not be sustained in future and the same may not necessarily provide the basis for comparison with other investment.
c. Load is not considered for computation of returns.
d. Period for which scheme’s performance has been provided is computed basis last day of the month-end preceding the date of advertisement. In case, the start/end date of the concerned period is a non-business day, the NAV of the previous date is considered for
computation of returns.
e. Different plans shall have a different expense structure. The performance provided for SBI Gold Fund, are of Regular Plan - Dividend Option and is Net of Dividend distribution tax, if any. The performance details provided for SBI Nifty Index Fund are of Growth Option-
Regular Plan.
f. Scheme count for the total schemes managed by the Fund Managers does not include ETF’s managed by Mr. Raviprakash Sharma.
g. The data of the last working day has been considered for the calculation of performance.
h.
CAGR %Point-to-Point
returns on StandardInvestment ofRs. 10,000/-
CAGR %Point-to-Point
returns on StandardInvestment ofRs. 10,000/-
CAGR %Point-to-Point
returns on StandardInvestment ofRs. 10,000/-
3 Years 5 Years
CAGR %Point-to-Point
returns on StandardInvestment ofRs. 10,000/-
Since Inception
Inception Date &Managing Since
Managing Since
Sep-11
Inception Date
12-09-2011
SBI Gold Fund
SBI Nifty Index Fund
Scheme Benchmark: - The Morning Fixing of Gold by LondonBullion Market Association (LBMA)
Additional Benchmark: - S&P BSE Sensex
Scheme Benchmark: - Nifty 50
Additional Benchmark: - S&P BSE Sensex
7.55 10,755 3.04 10,940 0.06 10,032 0.63 10,480
9.80 10,980 3.22 10,998 2.46 11,295 2.25 11,810
6.25 10,625 17.54 16,240 12.72 18,202 12.53 24,147
3.49 10,349 16.19 15,686 11.60 17,320 13.87 92,476
4.32 10,432 17.20 16,100 12.86 18,317 15.85 1,24,329
6.25 10,625 17.54 16,240 12.72 18,202 16.55 1,37,750
1 Year
Managing Since
Feb-11
Inception Date
17-01-2002
Funds Managed by Raviprakash Sharma
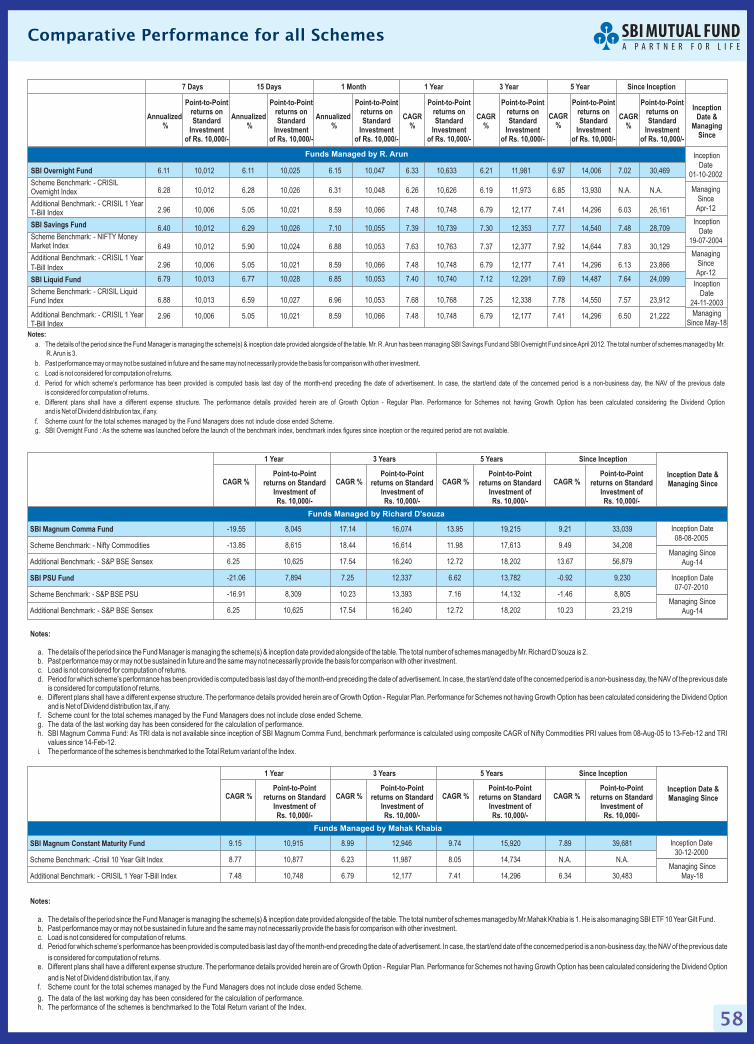
58
Comparative Performance for all Schemes
Notes:
a. The total number of schemes managed by Mr. Richard D’souza is 2.b. Past performance may or may not be sustained in future and the same may not necessarily provide the basis for comparison with other investment.c. Load is not considered for computation of returns.d. Period for which scheme’s performance has been provided is computed basis last day of the month-end preceding the date of advertisement. In case, the start/end date of the concerned period is a non-business day, the NAV of the previous date
is considered for computation of returns.e. Different plans shall have a different expense structure. The performance details provided herein are of Growth Option - Regular Plan. Performance for Schemes not having Growth Option has been calculated considering the Dividend Option
and is Net of Dividend distribution tax, if any.f. Scheme count for the total schemes managed by the Fund Managers does not include ended Scheme.closeg. The data of the last working day has been considered for the calculation of performance.h. SBI Magnum Comma Fund: As TRI data is not available since inception of SBI Magnum Comma Fund, benchmark performance is calculated using composite CAGR of Nifty Commodities PRI values from 08-Aug-05 to 13-Feb-12 and TRI
values since 14-Feb-12.. The performance of the schemes is benchmarked to the Total Return variant of the Index.
The details of the period since the Fund Manager is managing the scheme(s) & inception date provided alongside of the table.
Notes:
a. The total number of schemes managed by Mr.Mahak Khabia is 1.b. Past performance may or may not be sustained in future and the same may not necessarily provide the basis for comparison with other investment.c. Load is not considered for computation of returns.d. Period for which scheme’s performance has been provided is computed basis last day of the month-end preceding the date of advertisement. In case, the start/end date of the concerned period is a non-business day, the NAV of the previous date
is considered for computation of returns.e. Different plans shall have a different expense structure. The performance details provided herein are of Growth Option - Regular Plan. Performance for Schemes not having Growth Option has been calculated considering the Dividend Option
and is Net of Dividend distribution tax, if any.f. Scheme count for the total schemes managed by the Fund Managers does not include .
He is also managing SBI ETF 10 Year Gilt Fund.
close ended Scheme
g. The data of the last working day has been considered for the calculation of performance.h. The performance of the schemes is benchmarked to the Total Return variant of the Index.
The details of the period since the Fund Manager is managing the scheme(s) & inception date provided alongside of the table.
CAGR %Point-to-Point
returns on StandardInvestment ofRs. 10,000/-
CAGR %Point-to-Point
returns on StandardInvestment ofRs. 10,000/-
CAGR %Point-to-Point
returns on StandardInvestment ofRs. 10,000/-
3 Years 5 Years
CAGR %Point-to-Point
returns on StandardInvestment ofRs. 10,000/-
Since Inception
Inception Date &Managing Since
Managing Since
Aug-14
Inception Date
08-08-2005SBI Magnum Comma Fund
SBI PSU Fund
Scheme Benchmark: - Nifty Commodities
Additional Benchmark: - S&P BSE Sensex
Scheme Benchmark: - S&P BSE PSU
Additional Benchmark: - S&P BSE Sensex
-19.55 8,045 17.14 16,074 13.95 19,215 9.21 33,039
-13.85 8,615 18.44 16,614 11.98 17,613 9.49 34,208
6.25 10,625 17.54 16,240 12.72 18,202 13.67 56,879
-21.06 7,894 7.25 12,337 6.62 13,782 -0.92 9,230
-16.91 8,309 10.23 13,393 7.16 14,132 -1.46 8,805
6.25 10,625 17.54 16,240 12.72 18,202 10.23 23,219
1 Year
Funds Managed by Richard D'souza
Managing Since
Aug-14
Inception Date
07-07-2010
Notes:
a. Mr. R.Arun has been managing SBI Savings Fund and SBI Overnight Fund sinceApril 2012. The total number of schemes managed by Mr.
R.Arun is 3.
b. Past performance may or may not be sustained in future and the same may not necessarily provide the basis for comparison with other investment.
c. Load is not considered for computation of returns.
d. Period for which scheme’s performance has been provided is computed basis last day of the month-end preceding the date of advertisement. In case, the start/end date of the concerned period is a non-business day, the NAV of the previous date
is considered for computation of returns.
e. Different plans shall have a different expense structure. The performance details provided herein are of Growth Option - Regular Plan. Performance for Schemes not having Growth Option has been calculated considering the Dividend Option
and is Net of Dividend distribution tax, if any.
f. Scheme count for the total schemes managed by the Fund Managers does not include ended Scheme.close
g. SBI Overnight Fund : As the scheme was launched before the launch of the benchmark index, benchmark index figures since inception or the required period are not available.
The details of the period since the Fund Manager is managing the scheme(s) & inception date provided alongside of the table.
CAGR %Point-to-Point
returns on StandardInvestment ofRs. 10,000/-
CAGR %Point-to-Point
returns on StandardInvestment ofRs. 10,000/-
CAGR %Point-to-Point
returns on StandardInvestment ofRs. 10,000/-
3 Years 5 Years
CAGR %Point-to-Point
returns on StandardInvestment ofRs. 10,000/-
Since Inception
Inception Date &Managing Since
Managing Since
May-18
Inception Date
30-12-2000
1 Year
9.15 10,915 8.99 12,946 9.74 15,920 7.89 39,681
8.77 10,877 6.23 11,987 8.05 14,734 N.A. N.A.
7.48 10,748 6.79 12,177 7.41 14,296 6.34 30,483
Funds Managed by Mahak Khabia
SBI Magnum Constant Maturity Fund
Scheme Benchmark: -Crisil 10 Year Gilt Index
Additional Benchmark: - CRISIL 1 Year T-Bill Index
Annualized%
Annualized%
Annualized%
CAGR%
CAGR%
CAGR%
CAGR%
Point-to-Pointreturns onStandard
Investmentof Rs. 10,000/-
Point-to-Pointreturns onStandard
Investmentof Rs. 10,000/-
Point-to-Pointreturns onStandard
Investmentof Rs. 10,000/-
Point-to-Pointreturns onStandard
Investmentof Rs. 10,000/-
Point-to-Pointreturns onStandard
Investmentof Rs. 10,000/-
Point-to-Pointreturns onStandard
Investmentof Rs. 10,000/-
Point-to-Pointreturns onStandard
Investmentof Rs. 10,000/-
InceptionDate &
ManagingSince
7 Days 15 Days 1 Month 1 Year 3 Year 5 Year Since Inception
6.11 10,012 6.11 10,025 6.15 10,047 6.33 10,633 6.21 11,981 6.97 14,006 7.02 30,469
6.28 10,012 6.28 10,026 6.31 10,048 6.26 10,626 6.19 11,973 6.85 13,930 N.A. N.A.
2.96 10,006 5.05 10,021 8.59 10,066 7.48 10,748 6.79 12,177 7.41 14,296 6.03 26,161
6.40 10,012 6.29 10,026 7.10 10,055 7.39 10,739 7.30 12,353 7.77 14,540 7.48 28,709
6.49 10,012 5.90 10,024 6.88 10,053 7.63 10,763 7.37 12,377 7.92 14,644 7.83 30,129
2.96 10,006 5.05 10,021 8.59 10,066 7.48 10,748 6.79 12,177 7.41 14,296 6.13 23,866
6.79 10,013 6.77 10,028 6.85 10,053 7.40 10,740 7.12 12,291 7.69 14,487 7.64 24,099
6.88 10,013 6.59 10,027 6.96 10,053 7.68 10,768 7.25 12,338 7.78 14,550 7.57 23,912
2.96 10,006 5.05 10,021 8.59 10,066 7.48 10,748 6.79 12,177 7.41 14,296 6.50 21,222
Inception
Date
01-10-2002
Managing
Since
Apr-12
Inception
Date
19-07-2004
Managing
Since
Apr-12
Inception
Date
24-11-2003
Managing
Since May-18
SBI Overnight Fund
SBI Savings Fund
SBI Liquid Fund
Scheme Benchmark: - CRISILOvernight Index
Additional Benchmark: - CRISIL 1 YearT-Bill Index
Scheme Benchmark: - NIFTY MoneyMarket Index
Additional Benchmark: - CRISIL 1 Year
T-Bill Index
Scheme Benchmark: - CRISIL LiquidFund Index
Additional Benchmark: - CRISIL 1 YearT-Bill Index
Funds Managed by R. Arun
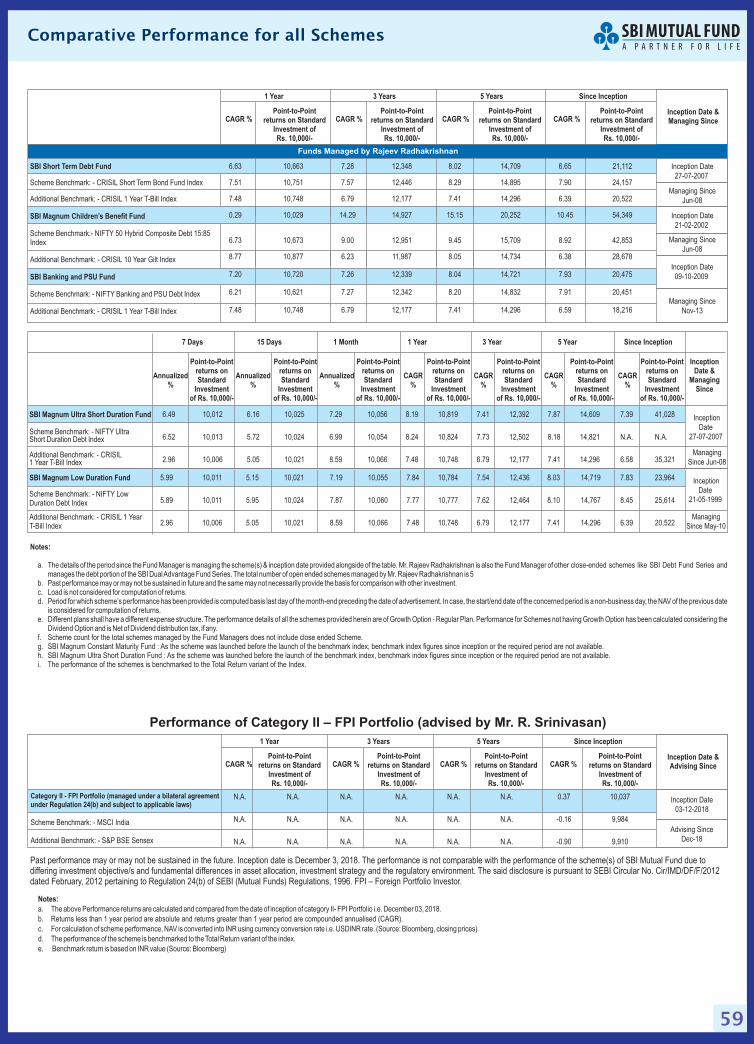
59
Comparative Performance for all Schemes
Notes:
a. Mr. Rajeev Radhakrishnan is also the Fund Manager of other close-ended schemes like SBI Debt Fund Series andmanages the debt portion of the SBI DualAdvantage Fund Series. The total number of open ended schemes managed by Mr. Rajeev Radhakrishnan is 5
b. Past performance may or may not be sustained in future and the same may not necessarily provide the basis for comparison with other investment.c. Load is not considered for computation of returns.d. Period for which scheme’s performance has been provided is computed basis last day of the month-end preceding the date of advertisement. In case, the start/end date of the concerned period is a non-business day, the NAV of the previous date
is considered for computation of returns.e. Different plans shall have a different expense structure. The performance details of all the schemes provided herein are of Growth Option - Regular Plan. Performance for Schemes not having Growth Option has been calculated considering the
Dividend Option and is Net of Dividend distribution tax, if any.f. Scheme count for the total schemes managed by the Fund Managers does not include .close ended Schemeg. SBI Magnum Constant Maturity Fund : As the scheme was launched before the launch of the benchmark index, benchmark index figures since inception or the required period are not available.h. SBI Magnum Ultra Short Duration Fund : As the scheme was launched before the launch of the benchmark index, benchmark index figures since inception or the required period are not available.i. The performance of the schemes is benchmarked to the Total Return variant of the Index.
The details of the period since the Fund Manager is managing the scheme(s) & inception date provided alongside of the table.
CAGR %
CAGR %
Point-to-Pointreturns on Standard
Investment ofRs. 10,000/-
Point-to-Pointreturns on Standard
Investment ofRs. 10,000/-
CAGR %
CAGR %
Point-to-Pointreturns on Standard
Investment ofRs. 10,000/-
Point-to-Pointreturns on Standard
Investment ofRs. 10,000/-
CAGR %
CAGR %
Point-to-Pointreturns on Standard
Investment ofRs. 10,000/-
Point-to-Pointreturns on Standard
Investment ofRs. 10,000/-
3 Years
3 Years
5 Years
5 Years
CAGR %
CAGR %
Point-to-Pointreturns on Standard
Investment ofRs. 10,000/-
Point-to-Pointreturns on Standard
Investment ofRs. 10,000/-
Since Inception
Since Inception
Advising Since
Dec-18
Inception Date
03-12-2018
N.A. N.A. N.A. N.A. N.A. N.A. 0.37 10,037
N.A. N.A. N.A. N.A. N.A. N.A. -0.16 9,984
N.A. N.A. N.A. N.A. N.A. N.A. -0.90 9,910
Inception Date &Managing Since
Inception Date &Advising Since
1 Year
1 Year
Managing Since
Jun-08
Inception Date
27-07-2007
Managing Since
Jun-08
Inception Date
21-02-2002
Inception Date
09-10-2009
Managing Since
Nov-13
6.63 10,663 7.28 12,348 8.02 14,709 6.65 21,112
7.51 10,751 7.57 12,446 8.29 14,895 7.90 24,157
7.48 10,748 6.79 12,177 7.41 14,296 6.39 20,522
0.29 10,029 14.29 14,927 15.15 20,252 10.45 54,349
6.73 10,673 9.00 12,951 9.45 15,709 8.92 42,853
8.77 10,877 6.23 11,987 8.05 14,734 6.38 28,678
7.20 10,720 7.26 12,339 8.04 14,721 7.93 20,475
6.21 10,621 7.27 12,342 8.20 14,832 7.91 20,451
7.48 10,748 6.79 12,177 7.41 14,296 6.59 18,216
Funds Managed by Rajeev Radhakrishnan
SBI Short Term Debt Fund
SBI Magnum Children’s Benefit Fund
SBI Banking and PSU Fund
Scheme Benchmark: - CRISIL Short Term Bond Fund Index
Additional Benchmark: - CRISIL 1 Year T-Bill Index
Scheme Benchmark:- NIFTY 50 Hybrid Composite Debt 15:85Index
Additional Benchmark: - CRISIL 10 Year Gilt Index
Scheme Benchmark: - NIFTY Banking and PSU Debt Index
Additional Benchmark: - CRISIL 1 Year T-Bill Index
Notes:
a.
c. For calculation of scheme performance, NAV is converted into INR using currency conversion rate i.e. USDINR rate. (Source: Bloomberg, closing prices)
d. The performance of the scheme is benchmarked to the Total Return variant of the index.
e. Benchmark return is based on INR value (Source: Bloomberg)
The above Performance returns are calculated and compared from the date of inception of category II- FPI Portfolio i.e. December 03, 2018.
b. Returns less than 1 year period are absolute and returns greater than 1 year period are compounded annualised (CAGR).
Performance of Category II – FPI Portfolio (advised by Mr. R. Srinivasan)
Past performance may or may not be sustained in the future. Inception date is December 3, 2018. The performance is not comparable with the performance of the scheme(s) of SBI Mutual Fund due todiffering investment objective/s and fundamental differences in asset allocation, investment strategy and the regulatory environment. The said disclosure is pursuant to SEBI Circular No. Cir/IMD/DF/F/2012dated February, 2012 pertaining to Regulation 24(b) of SEBI (Mutual Funds) Regulations, 1996. FPI – Foreign Portfolio Investor.
Category II - FPI Portfolio (managed under a bilateral agreementunder Regulation 24(b) and subject to applicable laws)
Scheme Benchmark: - MSCI India
Additional Benchmark: - S&P BSE Sensex
SBI Magnum Low Duration Fund
Scheme Benchmark: - NIFTY LowDuration Debt Index
Additional Benchmark: - CRISIL 1 YearT-Bill Index
5.99 10,011 5.15 10,021 7.19 10,055 7.84 10,784 7.54 12,436 8.03 14,719 7.83 23,964
5.89 10,011 5.95 10,024 7.87 10,060 7.77 10,777 7.62 12,464 8.10 14,767 8.45 25,614
2.96 10,006 5.05 10,021 8.59 10,066 7.48 10,748 6.79 12,177 7.41 14,296 6.39 20,522Managing
Since May-10
Inception
Date
21-05-1999
Managing
Since Jun-08
Inception
Date
27-07-2007
Annualized%
Annualized%
Annualized%
CAGR%
CAGR%
CAGR%
CAGR%
Point-to-Pointreturns onStandard
Investmentof Rs. 10,000/-
Point-to-Pointreturns onStandard
Investmentof Rs. 10,000/-
Point-to-Pointreturns onStandard
Investmentof Rs. 10,000/-
Point-to-Pointreturns onStandard
Investmentof Rs. 10,000/-
Point-to-Pointreturns onStandard
Investmentof Rs. 10,000/-
Point-to-Pointreturns onStandard
Investmentof Rs. 10,000/-
Point-to-Pointreturns onStandard
Investmentof Rs. 10,000/-
InceptionDate &
ManagingSince
7 Days 15 Days 1 Month 1 Year 3 Year 5 Year Since Inception
SBI Magnum Ultra Short Duration Fund
Scheme Benchmark: - NIFTY UltraShort Duration Debt Index
Additional Benchmark: - CRISIL1 Year T-Bill Index
6.49 10,012 6.16 10,025 7.29 10,056 8.19 10,819 7.41 12,392 7.87 14,609 7.39 41,028
6.52 10,013 5.72 10,024 6.99 10,054 8.24 10,824 7.73 12,502 8.18 14,821 N.A. N.A.
2.96 10,006 5.05 10,021 8.59 10,066 7.48 10,748 6.79 12,177 7.41 14,296 6.58 35,321
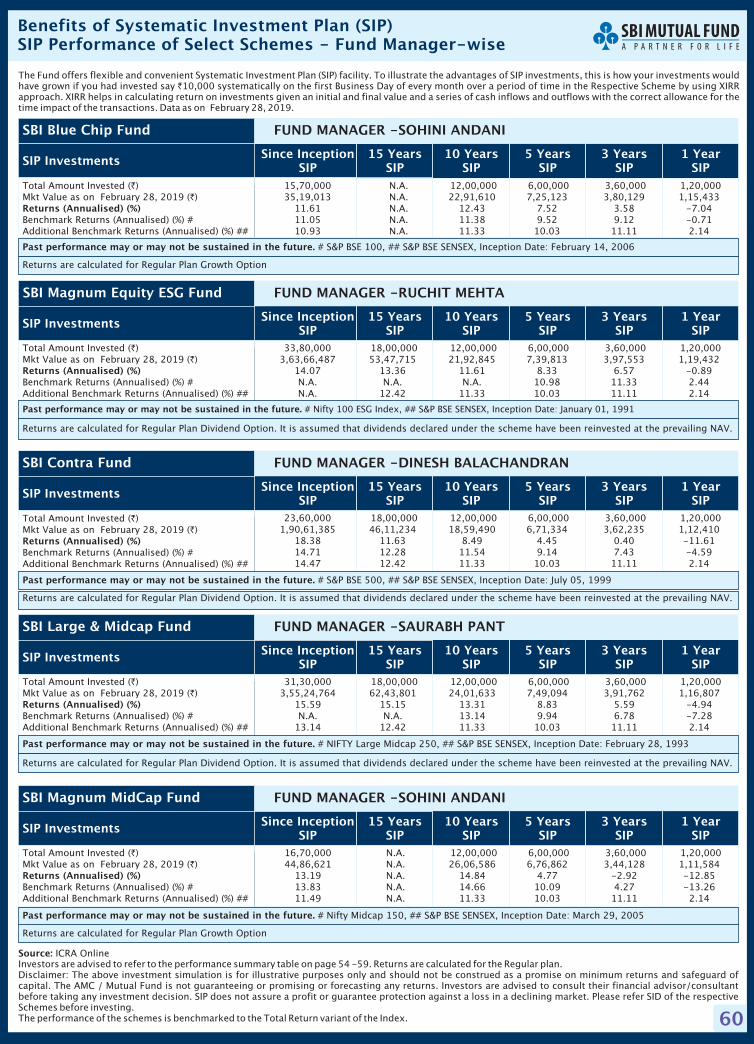
60
The Fund offers flexible and convenient Systematic Investment Plan (SIP) facility. To illustrate the advantages of SIP investments, this is how your investments wouldhave grown if you had invested say 10,000 systematically on the first Business Day of every month over a period of time in the Respective Scheme by using XIRRapproach. XIRR helps in calculating return on investments given an initial and final value and a series of cash inflows and outflows with the correct allowance for thetime impact of the transactions. Data as on February 28, 2019.
`
Investors are advised to refer to the performance summary table on page 54 -59. Returns are calculated for the Regular plan.Disclaimer: The above investment simulation is for illustrative purposes only and should not be construed as a promise on minimum returns and safeguard ofcapital. The AMC / Mutual Fund is not guaranteeing or promising or forecasting any returns. Investors are advised to consult their financial advisor/consultantbefore taking any investment decision. SIP does not assure a profit or guarantee protection against a loss in a declining market. Please refer SID of the respectiveSchemes before investing.The performance of the schemes is benchmarked to the Total Return variant of the Index.
Source: ICRA Online
Benefits of Systematic Investment Plan (SIP)SIP Performance of Select Schemes - Fund Manager-wise
33,80,000 18,00,000 12,00,000 6,00,000 3,60,000 1,20,0003,63,66,487 53,47,715 21,92,845 7,39,813 3,97,553 1,19,432
14.07 13.36 11.61 8.33 6.57 -0.89N.A. N.A. N.A. 10.98 11.33 2.44N.A. 12.42 11.33 10.03 11.11 2.14
Total Amount Invested ( )Mkt Value as on February 28, 2019 ( )
Benchmark Returns (Annualised) (%) #Additional Benchmark Returns (Annualised) (%) ##
`
`
Returns (Annualised) (%)
SIP Investments
Past performance may or may not be sustained in the future. # Nifty 100 ESG Index, ## S&P BSE SENSEX, Inception Date: January 01, 1991
Returns are calculated for Regular Plan Dividend Option. It is assumed that dividends declared under the scheme have been reinvested at the prevailing NAV.
SBI Magnum Equity ESG Fund FUND MANAGER -RUCHIT MEHTA
23,60,000 18,00,000 12,00,000 6,00,000 3,60,000 1,20,0001,90,61,385 46,11,234 18,59,490 6,71,334 3,62,235 1,12,410
18.38 11.63 8.49 4.45 0.40 -11.6114.71 12.28 11.54 9.14 7.43 -4.5914.47 12.42 11.33 10.03 11.11 2.14
Total Amount Invested ( )Mkt Value as on February 28, 2019 ( )
Benchmark Returns (Annualised) (%) #Additional Benchmark Returns (Annualised) (%) ##
`
`
Returns (Annualised) (%)
SIP Investments
Past performance may or may not be sustained in the future. # S&P BSE 500, ## S&P BSE SENSEX, Inception Date: July 05, 1999
Returns are calculated for Regular Plan Dividend Option. It is assumed that dividends declared under the scheme have been reinvested at the prevailing NAV.
SBI Contra Fund FUND MANAGER -DINESH BALACHANDRAN
15,70,000 N.A. 12,00,000 6,00,000 3,60,000 1,20,00035,19,013 N.A. 22,91,610 7,25,123 3,80,129 1,15,433
11.61 N.A. 12.43 7.52 3.58 -7.0411.05 N.A. 11.38 9.52 9.12 -0.7110.93 N.A. 11.33 10.03 11.11 2.14
Total Amount Invested ( )Mkt Value as on February 28, 2019 ( )
Benchmark Returns (Annualised) (%) #Additional Benchmark Returns (Annualised) (%) ##
`
`
Returns (Annualised) (%)
SIP Investments
Past performance may or may not be sustained in the future. # S&P BSE 100, ## S&P BSE SENSEX, Inception Date: February 14, 2006
Returns are calculated for Regular Plan Growth Option
SBI Blue Chip Fund FUND MANAGER -SOHINI ANDANI
31,30,000 18,00,000 12,00,000 6,00,000 3,60,000 1,20,0003,55,24,764 62,43,801 24,01,633 7,49,094 3,91,762 1,16,807
15.59 15.15 13.31 8.83 5.59 -4.94N.A. N.A. 13.14 9.94 6.78 -7.28
13.14 12.42 11.33 10.03 11.11 2.14
Total Amount Invested ( )Mkt Value as on February 28, 2019 ( )
Benchmark Returns (Annualised) (%) #Additional Benchmark Returns (Annualised) (%) ##
`
`
Returns (Annualised) (%)
SIP Investments
Past performance may or may not be sustained in the future. # NIFTY Large Midcap 250, ## S&P BSE SENSEX, Inception Date: February 28, 1993
Returns are calculated for Regular Plan Dividend Option. It is assumed that dividends declared under the scheme have been reinvested at the prevailing NAV.
SBI Large & Midcap Fund FUND MANAGER -SAURABH PANT
16,70,000 N.A. 12,00,000 6,00,000 3,60,000 1,20,00044,86,621 N.A. 26,06,586 6,76,862 3,44,128 1,11,584
13.19 N.A. 14.84 4.77 -2.92 -12.8513.83 N.A. 14.66 10.09 4.27 -13.2611.49 N.A. 11.33 10.03 11.11 2.14
Total Amount Invested ( )Mkt Value as on February 28, 2019 ( )
Benchmark Returns (Annualised) (%) #Additional Benchmark Returns (Annualised) (%) ##
`
`
Returns (Annualised) (%)
SIP Investments
Past performance may or may not be sustained in the future. # Nifty Midcap 150, ## S&P BSE SENSEX, Inception Date: March 29, 2005
Returns are calculated for Regular Plan Growth Option
SBI Magnum MidCap Fund FUND MANAGER -SOHINI ANDANI
Since InceptionSIP
15 YearsSIP
10 YearsSIP
5 YearsSIP
3 YearsSIP
1 YearSIP
Since InceptionSIP
15 YearsSIP
10 YearsSIP
5 YearsSIP
3 YearsSIP
1 YearSIP
Since InceptionSIP
15 YearsSIP
10 YearsSIP
5 YearsSIP
3 YearsSIP
1 YearSIP
Since InceptionSIP
15 YearsSIP
10 YearsSIP
5 YearsSIP
3 YearsSIP
1 YearSIP
Since InceptionSIP
15 YearsSIP
10 YearsSIP
5 YearsSIP
3 YearsSIP
1 YearSIP
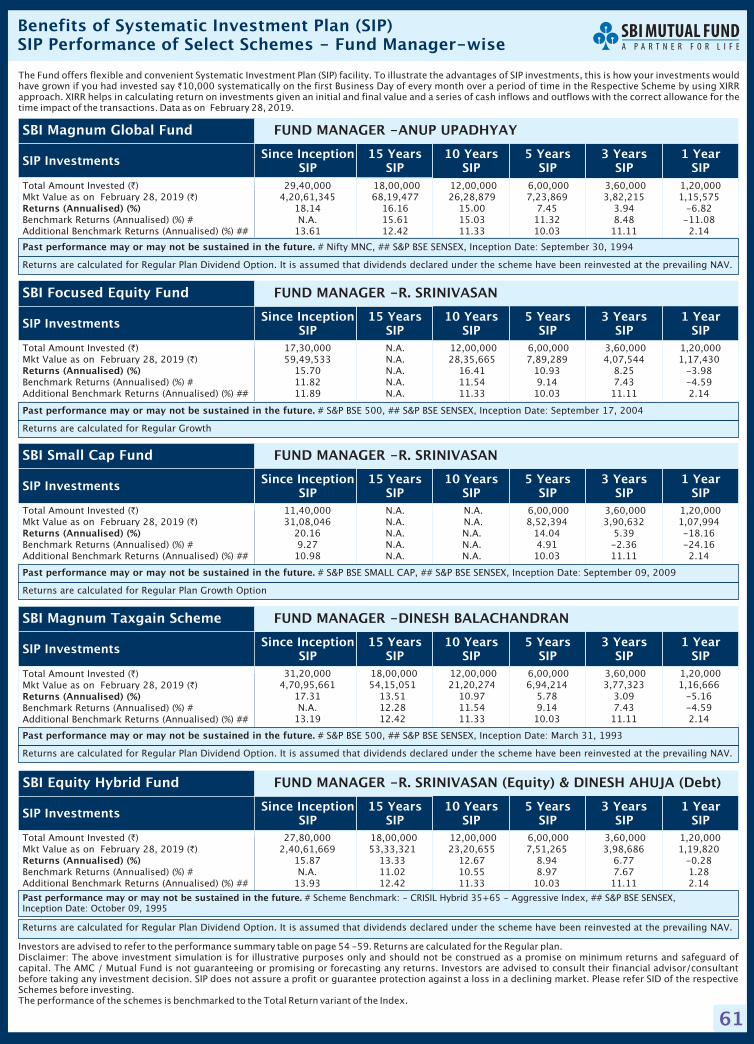
61
The Fund offers flexible and convenient Systematic Investment Plan (SIP) facility. To illustrate the advantages of SIP investments, this is how your investments wouldhave grown if you had invested say 10,000 systematically on the first Business Day of every month over a period of time in the Respective Scheme by using XIRRapproach. XIRR helps in calculating return on investments given an initial and final value and a series of cash inflows and outflows with the correct allowance for thetime impact of the transactions. Data as on February 28, 2019.
`
Investors are advised to refer to the performance summary table on page 54 -59. Returns are calculated for the Regular plan.Disclaimer: The above investment simulation is for illustrative purposes only and should not be construed as a promise on minimum returns and safeguard ofcapital. The AMC / Mutual Fund is not guaranteeing or promising or forecasting any returns. Investors are advised to consult their financial advisor/consultantbefore taking any investment decision. SIP does not assure a profit or guarantee protection against a loss in a declining market. Please refer SID of the respectiveSchemes before investing.The performance of the schemes is benchmarked to the Total Return variant of the Index.
Benefits of Systematic Investment Plan (SIP)SIP Performance of Select Schemes - Fund Manager-wise
27,80,000 18,00,000 12,00,000 6,00,000 3,60,000 1,20,0002,40,61,669 53,33,321 23,20,655 7,51,265 3,98,686 1,19,820
15.87 13.33 12.67 8.94 6.77 -0.28N.A. 11.02 10.55 8.97 7.67 1.28
13.93 12.42 11.33 10.03 11.11 2.14
Total Amount Invested ( )Mkt Value as on February 28, 2019 ( )
Benchmark Returns (Annualised) (%) #Additional Benchmark Returns (Annualised) (%) ##
`
`
Returns (Annualised) (%)
SIP Investments
Past performance may or may not be sustained in the future. # Scheme Benchmark: - CRISIL Hybrid 35+65 - Aggressive Index, ## S&P BSE SENSEX,Inception Date: October 09, 1995
Returns are calculated for Regular Plan Dividend Option. It is assumed that dividends declared under the scheme have been reinvested at the prevailing NAV.
SBI Equity Hybrid Fund FUND MANAGER -R. SRINIVASAN (Equity) & DINESH AHUJA (Debt)
31,20,000 18,00,000 12,00,000 6,00,000 3,60,000 1,20,0004,70,95,661 54,15,051 21,20,274 6,94,214 3,77,323 1,16,666
17.31 13.51 10.97 5.78 3.09 -5.16N.A. 12.28 11.54 9.14 7.43 -4.59
13.19 12.42 11.33 10.03 11.11 2.14
Total Amount Invested ( )Mkt Value as on February 28, 2019 ( )
Benchmark Returns (Annualised) (%) #Additional Benchmark Returns (Annualised) (%) ##
`
`
Returns (Annualised) (%)
SIP Investments
Past performance may or may not be sustained in the future. # S&P BSE 500, ## S&P BSE SENSEX, Inception Date: March 31, 1993
Returns are calculated for Regular Plan Dividend Option. It is assumed that dividends declared under the scheme have been reinvested at the prevailing NAV.
SBI Magnum Taxgain Scheme FUND MANAGER -DINESH BALACHANDRAN
29,40,000 18,00,000 12,00,000 6,00,000 3,60,000 1,20,0004,20,61,345 68,19,477 26,28,879 7,23,869 3,82,215 1,15,575
18.14 16.16 15.00 7.45 3.94 -6.82N.A. 15.61 15.03 11.32 8.48 -11.08
13.61 12.42 11.33 10.03 11.11 2.14
Total Amount Invested ( )Mkt Value as on February 28, 2019 ( )
Benchmark Returns (Annualised) (%) #Additional Benchmark Returns (Annualised) (%) ##
`
`
Returns (Annualised) (%)
Since InceptionSIP
15 YearsSIP
10 YearsSIP
5 YearsSIP
3 YearsSIP
1 YearSIPSIP Investments
Past performance may or may not be sustained in the future. # Nifty MNC, ## S&P BSE SENSEX, Inception Date: September 30, 1994
Returns are calculated for Regular Plan Dividend Option. It is assumed that dividends declared under the scheme have been reinvested at the prevailing NAV.
SBI Magnum Global Fund FUND MANAGER -ANUP UPADHYAY
17,30,000 N.A. 12,00,000 6,00,000 3,60,000 1,20,00059,49,533 N.A. 28,35,665 7,89,289 4,07,544 1,17,430
15.70 N.A. 16.41 10.93 8.25 -3.9811.82 N.A. 11.54 9.14 7.43 -4.5911.89 N.A. 11.33 10.03 11.11 2.14
Total Amount Invested ( )Mkt Value as on February 28, 2019 ( )
Benchmark Returns (Annualised) (%) #Additional Benchmark Returns (Annualised) (%) ##
`
`
Returns (Annualised) (%)
Since InceptionSIP
15 YearsSIP
10 YearsSIP
5 YearsSIP
3 YearsSIP
1 YearSIPSIP Investments
Past performance may or may not be sustained in the future. # S&P BSE 500, ## S&P BSE SENSEX, Inception Date: September 17, 2004
Returns are calculated for Regular Growth
SBI Focused Equity Fund FUND MANAGER -R. SRINIVASAN
11,40,000 N.A. N.A. 6,00,000 3,60,000 1,20,00031,08,046 N.A. N.A. 8,52,394 3,90,632 1,07,994
20.16 N.A. N.A. 14.04 5.39 -18.169.27 N.A. N.A. 4.91 -2.36 -24.16
10.98 N.A. N.A. 10.03 11.11 2.14
Total Amount Invested ( )Mkt Value as on February 28, 2019 ( )
Benchmark Returns (Annualised) (%) #Additional Benchmark Returns (Annualised) (%) ##
`
`
Returns (Annualised) (%)
SIP Investments
Past performance may or may not be sustained in the future. # S&P BSE SMALL CAP, ## S&P BSE SENSEX, Inception Date: September 09, 2009
Returns are calculated for Regular Plan Growth Option
SBI Small Cap Fund FUND MANAGER -R. SRINIVASAN
Since InceptionSIP
15 YearsSIP
10 YearsSIP
5 YearsSIP
3 YearsSIP
1 YearSIP
Since InceptionSIP
15 YearsSIP
10 YearsSIP
5 YearsSIP
3 YearsSIP
1 YearSIP
Since InceptionSIP
15 YearsSIP
10 YearsSIP
5 YearsSIP
3 YearsSIP
1 YearSIP
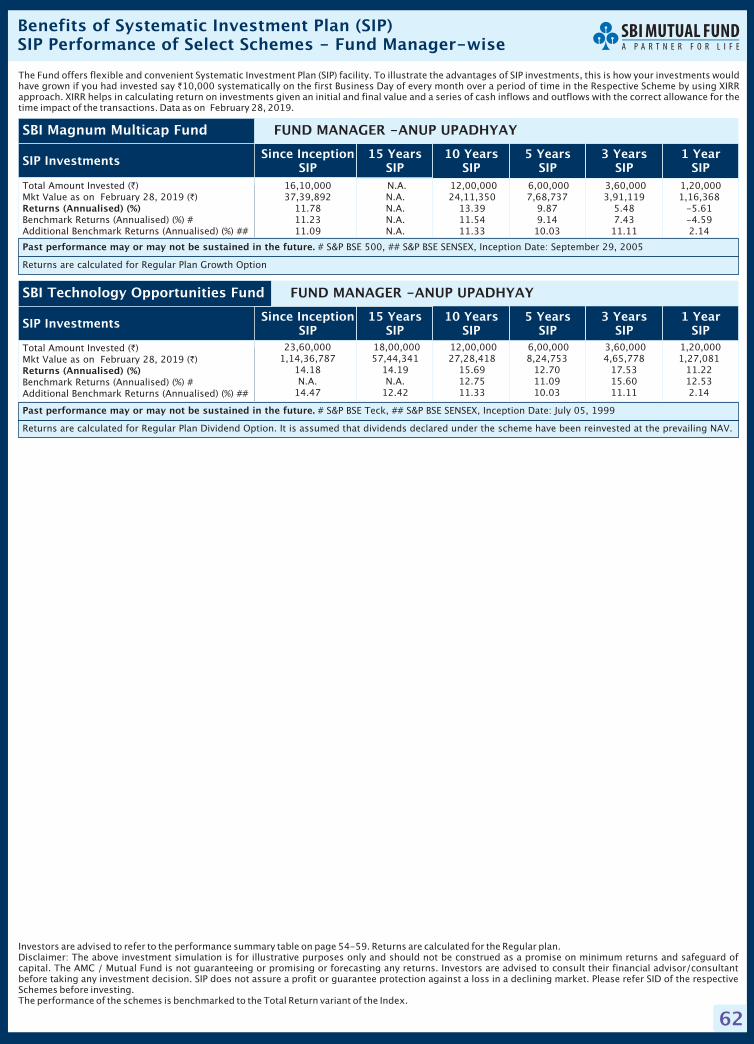
62
The Fund offers flexible and convenient Systematic Investment Plan (SIP) facility. To illustrate the advantages of SIP investments, this is how your investments wouldhave grown if you had invested say 10,000 systematically on the first Business Day of every month over a period of time in the Respective Scheme by using XIRRapproach. XIRR helps in calculating return on investments given an initial and final value and a series of cash inflows and outflows with the correct allowance for thetime impact of the transactions. Data as on February 28, 2019.
`
Investors are advised to refer to the performance summary table on page 54-59. Returns are calculated for the Regular plan.Disclaimer: The above investment simulation is for illustrative purposes only and should not be construed as a promise on minimum returns and safeguard ofcapital. The AMC / Mutual Fund is not guaranteeing or promising or forecasting any returns. Investors are advised to consult their financial advisor/consultantbefore taking any investment decision. SIP does not assure a profit or guarantee protection against a loss in a declining market. Please refer SID of the respectiveSchemes before investing.The performance of the schemes is benchmarked to the Total Return variant of the Index.
Benefits of Systematic Investment Plan (SIP)SIP Performance of Select Schemes - Fund Manager-wise
16,10,000 N.A. 12,00,000 6,00,000 3,60,000 1,20,00037,39,892 N.A. 24,11,350 7,68,737 3,91,119 1,16,368
11.78 N.A. 13.39 9.87 5.48 -5.6111.23 N.A. 11.54 9.14 7.43 -4.5911.09 N.A. 11.33 10.03 11.11 2.14
Total Amount Invested ( )Mkt Value as on February 28, 2019 ( )
Benchmark Returns (Annualised) (%) #Additional Benchmark Returns (Annualised) (%) ##
`
`
Returns (Annualised) (%)
Since InceptionSIP
15 YearsSIP
10 YearsSIP
5 YearsSIP
3 YearsSIP
1 YearSIPSIP Investments
Past performance may or may not be sustained in the future. # S&P BSE 500, ## S&P BSE SENSEX, Inception Date: September 29, 2005
Returns are calculated for Regular Plan Growth Option
SBI Magnum Multicap Fund FUND MANAGER -ANUP UPADHYAY
Total Amount Invested ( )Mkt Value as on February 28, 2019 ( )
Benchmark Returns (Annualised) (%) #Additional Benchmark Returns (Annualised) (%) ##
`
`
Returns (Annualised) (%)
Since InceptionSIP
15 YearsSIP
10 YearsSIP
5 YearsSIP
3 YearsSIP
1 YearSIPSIP Investments
Past performance may or may not be sustained in the future. # S&P BSE Teck, ## S&P BSE SENSEX, Inception Date: July 05, 1999
Returns are calculated for Regular Plan Dividend Option. It is assumed that dividends declared under the scheme have been reinvested at the prevailing NAV.
SBI Technology Opportunities Fund FUND MANAGER -ANUP UPADHYAY
23,60,000 18,00,000 12,00,000 6,00,000 3,60,000 1,20,0001,14,36,787 57,44,341 27,28,418 8,24,753 4,65,778 1,27,081
14.18 14.19 15.69 12.70 17.53 11.22N.A. N.A. 12.75 11.09 15.60 12.53
14.47 12.42 11.33 10.03 11.11 2.14
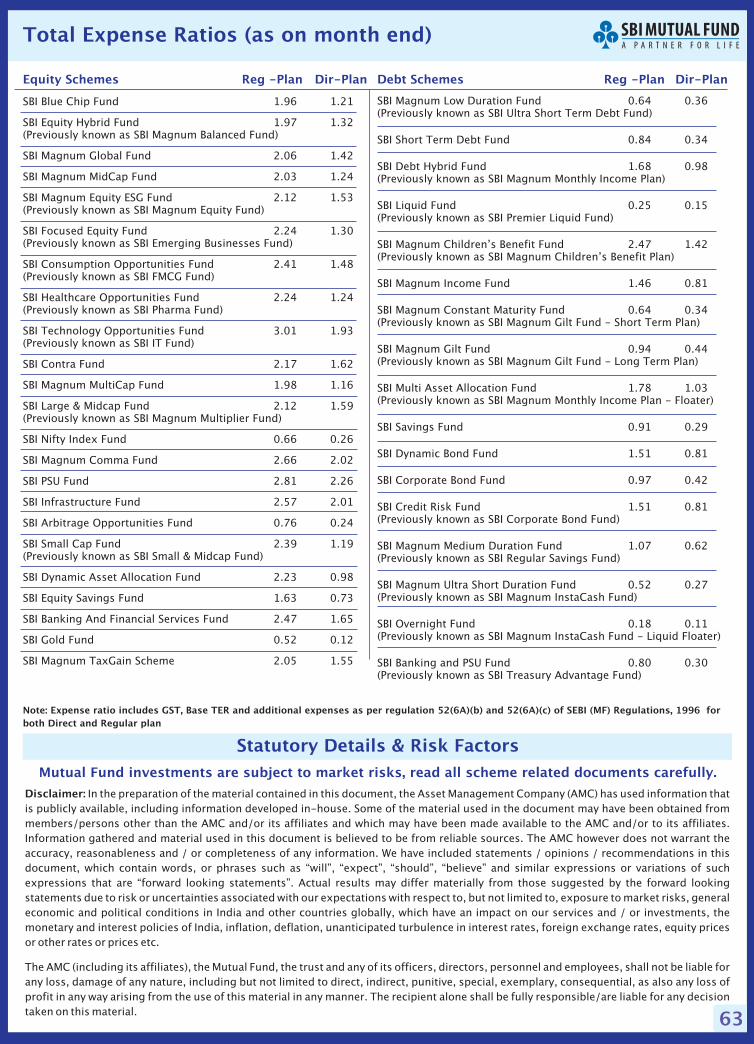
63
Statutory Details & Risk Factors
Mutual Fund investments are subject to market risks, read all scheme related documents carefully.
Disclaimer: In the preparation of the material contained in this document, the Asset Management Company (AMC) has used information thatis publicly available, including information developed in-house. Some of the material used in the document may have been obtained frommembers/persons other than the AMC and/or its affiliates and which may have been made available to the AMC and/or to its affiliates.Information gathered and material used in this document is believed to be from reliable sources. The AMC however does not warrant theaccuracy, reasonableness and / or completeness of any information. We have included statements / opinions / recommendations in thisdocument, which contain words, or phrases such as “will”, “expect”, “should”, “believe” and similar expressions or variations of suchexpressions that are “forward looking statements”. Actual results may differ materially from those suggested by the forward lookingstatements due to risk or uncertainties associated with our expectations with respect to, but not limited to, exposure to market risks, generaleconomic and political conditions in India and other countries globally, which have an impact on our services and / or investments, themonetary and interest policies of India, inflation, deflation, unanticipated turbulence in interest rates, foreign exchange rates, equity pricesor other rates or prices etc.
The AMC (including its affiliates), the Mutual Fund, the trust and any of its officers, directors, personnel and employees, shall not be liable forany loss, damage of any nature, including but not limited to direct, indirect, punitive, special, exemplary, consequential, as also any loss ofprofit in any way arising from the use of this material in any manner. The recipient alone shall be fully responsible/are liable for any decisiontaken on this material.
SBI Blue Chip Fund 1.96 1.21
SBI Equity Hybrid Fund 1.97 1.32(Previously known as SBI Magnum Balanced Fund)
SBI Magnum Global Fund 2.06 1.42
SBI Magnum MidCap Fund 2.03 1.24
SBI Magnum Equity ESG Fund 2.12 1.53(Previously known as SBI Magnum Equity Fund)
SBI Focused Equity Fund 2.24 1.30(Previously known as SBI Emerging Businesses Fund)
SBI Consumption Opportunities Fund 2.41 1.48(Previously known as SBI FMCG Fund)
SBI Healthcare Opportunities Fund 2.24 1.24(Previously known as SBI Pharma Fund)
SBI Technology Opportunities Fund 3.01 1.93(Previously known as SBI IT Fund)
SBI Contra Fund 2.17 1.62
SBI Magnum MultiCap Fund 1.98 1.16
SBI Large & Midcap Fund 2.12 1.59(Previously known as SBI Magnum Multiplier Fund)
SBI Nifty Index Fund 0.66 0.26
SBI Magnum Comma Fund 2.66 2.02
SBI PSU Fund 2.81 2.26
SBI Infrastructure Fund 2.57 2.01
SBI Arbitrage Opportunities Fund 0.76 0.24
SBI Small Cap Fund 2.39 1.19(Previously known as SBI Small & Midcap Fund)
SBI Dynamic Asset Allocation Fund 2.23 0.98
SBI Equity Savings Fund 1.63 0.73
SBI Banking And Financial Services Fund 2.47 1.65
SBI Gold Fund 0.52 0.12
SBI Magnum TaxGain Scheme 2.05 1.55
SBI Magnum Low Duration Fund 0.64 0.36(Previously known as SBI Ultra Short Term Debt Fund)
SBI Short Term Debt Fund 0.84 0.34
SBI Debt Hybrid Fund 1.68 0.98(Previously known as SBI Magnum Monthly Income Plan)
SBI Liquid Fund 0.25 0.15(Previously known as SBI Premier Liquid Fund)
SBI Magnum Children’s Benefit Fund 2.47 1.42(Previously known as SBI Magnum Children’s Benefit Plan)
SBI Magnum Income Fund 1.46 0.81
SBI Magnum Constant Maturity Fund 0.64 0.34(Previously known as SBI Magnum Gilt Fund - Short Term Plan)
SBI Magnum Gilt Fund 0.94 0.44(Previously known as SBI Magnum Gilt Fund - Long Term Plan)
SBI Multi Asset Allocation Fund 1.78 1.03(Previously known as SBI Magnum Monthly Income Plan - Floater)
SBI Savings Fund 0.91 0.29
SBI Dynamic Bond Fund 1.51 0.81
SBI Corporate Bond Fund 0.97 0.42
SBI Credit Risk Fund 1.51 0.81(Previously known as SBI Corporate Bond Fund)
SBI Magnum Medium Duration Fund 1.07 0.62(Previously known as SBI Regular Savings Fund)
SBI Magnum Ultra Short Duration Fund 0.52 0.27(Previously known as SBI Magnum InstaCash Fund)
SBI Overnight Fund 0.18 0.11(Previously known as SBI Magnum InstaCash Fund - Liquid Floater)
SBI Banking and PSU Fund 0.80 0.30(Previously known as SBI Treasury Advantage Fund)
Equity Schemes Reg -Plan Dir-Plan Debt Schemes Reg -Plan Dir-Plan
Note: Expense ratio includes GST, Base TER and additional expenses as per regulation 52(6A)(b) and 52(6A)(c) of SEBI (MF) Regulations, 1996 forboth Direct and Regular plan
Total Expense Ratios (as on month end)
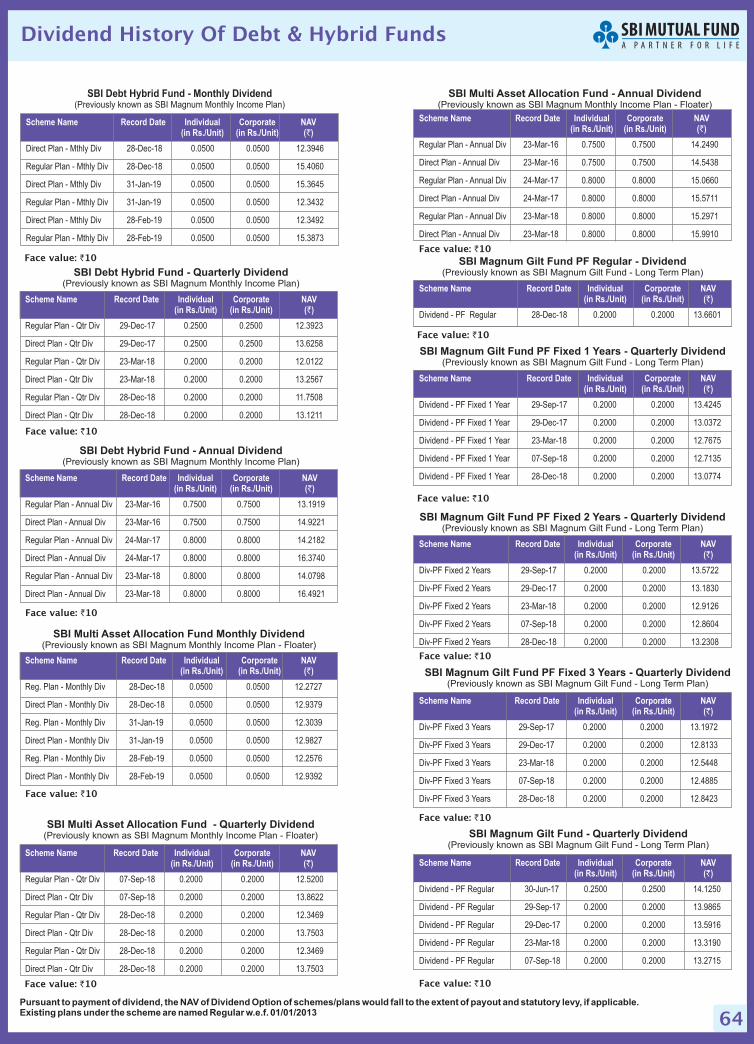
64
SBI Debt Hybrid Fund - Monthly Dividend(Previously known as SBI Magnum Monthly Income Plan)
28-Dec-18 0.0500 0.0500 12.3946
28-Dec-18 0.0500 0.0500 15.4060
31-Jan-19 0.0500 0.0500 15.3645
31-Jan-19 0.0500 0.0500 12.3432
28-Feb-19 0.0500 0.0500 12.3492
28-Feb-19 0.0500 0.0500 15.3873
Scheme Name Record Date Individual Corporate NAV(in Rs./Unit) (in Rs./Unit) ( )`
Direct Plan - Mthly Div
Regular Plan - Mthly Div
Direct Plan - Mthly Div
Regular Plan - Mthly Div
Regular Plan - Mthly Div
Direct Plan - Mthly Div
Face value: 10`
SBI Debt Hybrid Fund - Quarterly Dividend(Previously known as SBI Magnum Monthly Income Plan)
Scheme Name Record Date Individual Corporate NAV(in Rs./Unit) (in Rs./Unit) ( )`
Regular Plan - Qtr Div
Direct Plan - Qtr Div
Regular Plan - Qtr Div
Direct Plan - Qtr Div
Regular Plan - Qtr Div
Direct Plan - Qtr Div
Face value: 10`
29-Dec-17 0.2500 0.2500 12.3923
29-Dec-17 0.2500 0.2500 13.6258
23-Mar-18 0.2000 0.2000 12.0122
23-Mar-18 0.2000 0.2000 13.2567
28-Dec-18 0.2000 0.2000 11.7508
28-Dec-18 0.2000 0.2000 13.1211
SBI Debt Hybrid Fund - Annual Dividend(Previously known as SBI Magnum Monthly Income Plan)
23-Mar-16 0.7500 0.7500 13.1919
23-Mar-16 0.7500 0.7500 14.9221
24-Mar-17 0.8000 0.8000 14.2182
24-Mar-17 0.8000 0.8000 16.3740
23-Mar-18 0.8000 0.8000 14.0798
23-Mar-18 0.8000 0.8000 16.4921
Scheme Name Record Date Individual Corporate NAV(in Rs./Unit) (in Rs./Unit) ( )`
Regular Plan - Annual Div
Direct Plan - Annual Div
Regular Plan - Annual Div
Direct Plan - Annual Div
Regular Plan - Annual Div
Direct Plan - Annual Div
Face value: 10`
SBI Multi Asset Allocation Fund Monthly Dividend(Previously known as SBI Magnum Monthly Income Plan - Floater)
28-Dec-18 0.0500 0.0500 12.2727
28-Dec-18 0.0500 0.0500 12.9379
31-Jan-19 0.0500 0.0500 12.3039
31-Jan-19 0.0500 0.0500 12.9827
28-Feb-19 0.0500 0.0500 12.2576
28-Feb-19 0.0500 0.0500 12.9392
Scheme Name Record Date Individual Corporate NAV(in Rs./Unit) (in Rs./Unit) ( )`
Reg. Plan - Monthly Div
Direct Plan - Monthly Div
Reg. Plan - Monthly Div
Direct Plan - Monthly Div
Reg. Plan - Monthly Div
Direct Plan - Monthly Div
Face value: 10`
SBI Multi Asset Allocation Fund - Quarterly Dividend(Previously known as SBI Magnum Monthly Income Plan - Floater)
07-Sep-18 0.2000 0.2000 12.5200
07-Sep-18 0.2000 0.2000 13.8622
28-Dec-18 0.2000 0.2000 12.3469
28-Dec-18 0.2000 0.2000 13.7503
28-Dec-18 0.2000 0.2000 12.3469
28-Dec-18 0.2000 0.2000 13.7503
Scheme Name Record Date Individual Corporate NAV(in Rs./Unit) (in Rs./Unit) ( )`
Regular Plan - Qtr Div
Direct Plan - Qtr Div
Regular Plan - Qtr Div
Direct Plan - Qtr Div
Regular Plan - Qtr Div
Direct Plan - Qtr Div
Face value: 10`
Pursuant to payment of dividend, the NAV of Dividend Option of schemes/plans would fall to the extent of payout and statutory levy, if applicable.Existing plans under the scheme are named Regular w.e.f. 01/01/2013
SBI Multi Asset Allocation Fund - Annual Dividend(Previously known as SBI Magnum Monthly Income Plan - Floater)
23-Mar-16 0.7500 0.7500 14.2490
23-Mar-16 0.7500 0.7500 14.5438
24-Mar-17 0.8000 0.8000 15.0660
24-Mar-17 0.8000 0.8000 15.5711
23-Mar-18 0.8000 0.8000 15.2971
23-Mar-18 0.8000 0.8000 15.9910
Scheme Name Record Date Individual Corporate NAV(in Rs./Unit) (in Rs./Unit) ( )`
Regular Plan - Annual Div
Direct Plan - Annual Div
Regular Plan - Annual Div
Direct Plan - Annual Div
Regular Plan - Annual Div
Direct Plan - Annual Div
Face value: 10`
SBI Magnum Gilt Fund PF Fixed 1 Years - Quarterly Dividend(Previously known as SBI Magnum Gilt Fund - Long Term Plan)
29-Sep-17 0.2000 0.2000 13.4245
29-Dec-17 0.2000 0.2000 13.0372
23-Mar-18 0.2000 0.2000 12.7675
07-Sep-18 0.2000 0.2000 12.7135
28-Dec-18 0.2000 0.2000 13.0774
Scheme Name Record Date Individual Corporate NAV(in Rs./Unit) (in Rs./Unit) ( )`
Dividend - PF Fixed 1 Year
Dividend - PF Fixed 1 Year
Dividend - PF Fixed 1 Year
Dividend - PF Fixed 1 Year
Dividend - PF Fixed 1 Year
Face value: 10`
SBI Magnum Gilt Fund PF Regular - Dividend(Previously known as SBI Magnum Gilt Fund - Long Term Plan)
28-Dec-18 0.2000 0.2000 13.6601
Scheme Name Record Date Individual Corporate NAV(in Rs./Unit) (in Rs./Unit) ( )`
Dividend - PF Regular
Face value: 10`
29-Sep-17 0.2000 0.2000 13.5722
29-Dec-17 0.2000 0.2000 13.1830
23-Mar-18 0.2000 0.2000 12.9126
07-Sep-18 0.2000 0.2000 12.8604
28-Dec-18 0.2000 0.2000 13.2308
Scheme Name Record Date Individual Corporate NAV(in Rs./Unit) (in Rs./Unit) ( )`
Div-PF Fixed 2 Years
Div-PF Fixed 2 Years
Div-PF Fixed 2 Years
Div-PF Fixed 2 Years
Div-PF Fixed 2 Years
SBI Magnum Gilt Fund PF Fixed 2 Years - Quarterly Dividend(Previously known as SBI Magnum Gilt Fund - Long Term Plan)
Face value: 10`
SBI Magnum Gilt Fund Quarterly DividendPF Fixed 3 Years -(Previously known as SBI Magnum Gilt Fund - Long Term Plan)
29-Sep-17 0.2000 0.2000 13.1972
29-Dec-17 0.2000 0.2000 12.8133
23-Mar-18 0.2000 0.2000 12.5448
07-Sep-18 0.2000 0.2000 12.4885
28-Dec-18 0.2000 0.2000 12.8423
Scheme Name Record Date Individual Corporate NAV(in Rs./Unit) (in Rs./Unit) ( )`
Div-PF Fixed 3 Years
Div-PF Fixed 3 Years
Div-PF Fixed 3 Years
Div-PF Fixed 3 Years
Div-PF Fixed 3 Years
Face value: 10`
30-Jun-17 0.2500 0.2500 14.1250
29-Sep-17 0.2000 0.2000 13.9865
29-Dec-17 0.2000 0.2000 13.5916
23-Mar-18 0.2000 0.2000 13.3190
07-Sep-18 0.2000 0.2000 13.2715
Scheme Name Record Date Individual Corporate NAV(in Rs./Unit) (in Rs./Unit) ( )`
Dividend - PF Regular
Dividend - PF Regular
Dividend - PF Regular
Dividend - PF Regular
Dividend - PF Regular
SBI Magnum Gilt Fund - Quarterly Dividend(Previously known as SBI Magnum Gilt Fund - Long Term Plan)
Face value: 10`
Dividend History Of Debt & Hybrid Funds
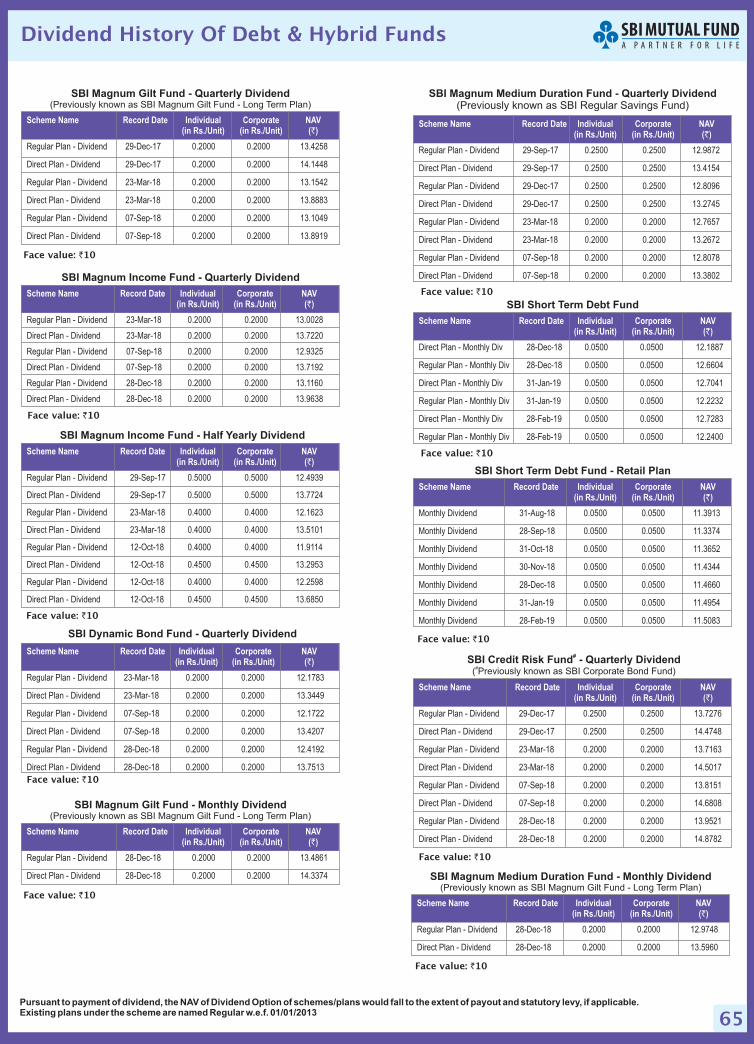
65Pursuant to payment of dividend, the NAV of Dividend Option of schemes/plans would fall to the extent of payout and statutory levy, if applicable.Existing plans under the scheme are named Regular w.e.f. 01/01/2013
SBI Magnum Income Fund - Quarterly Dividend
23-Mar-18 0.2000 0.2000 13.0028
23-Mar-18 0.2000 0.2000 13.7220
07-Sep-18 0.2000 0.2000 12.9325
07-Sep-18 0.2000 0.2000 13.7192
28-Dec-18 0.2000 0.2000 13.1160
28-Dec-18 0.2000 0.2000 13.9638
Scheme Name Record Date Individual Corporate NAV(in Rs./Unit) (in Rs./Unit) ( )`
Regular Plan - Dividend
Direct Plan - Dividend
Regular Plan - Dividend
Direct Plan - Dividend
Regular Plan - Dividend
Direct Plan - Dividend
Face value: 10`
SBI Magnum Income Fund - Half Yearly Dividend
29-Sep-17 0.5000 0.5000 12.4939
29-Sep-17 0.5000 0.5000 13.7724
23-Mar-18 0.4000 0.4000 12.1623
23-Mar-18 0.4000 0.4000 13.5101
12-Oct-18 0.4000 0.4000 11.9114
12-Oct-18 0.4500 0.4500 13.2953
12-Oct-18 0.4000 0.4000 12.2598
12-Oct-18 0.4500 0.4500 13.6850
Scheme Name Record Date Individual Corporate NAV(in Rs./Unit) (in Rs./Unit) ( )`
Regular Plan - Dividend
Direct Plan - Dividend
Regular Plan - Dividend
Direct Plan - Dividend
Regular Plan - Dividend
Direct Plan - Dividend
Regular Plan - Dividend
Direct Plan - Dividend
Face value: 10`
23-Mar-18 0.2000 0.2000 12.1783
23-Mar-18 0.2000 0.2000 13.3449
07-Sep-18 0.2000 0.2000 12.1722
07-Sep-18 0.2000 0.2000 13.4207
28-Dec-18 0.2000 0.2000 12.4192
28-Dec-18 0.2000 0.2000 13.7513
Scheme Name Record Date Individual Corporate NAV(in Rs./Unit) (in Rs./Unit) ( )`
Regular Plan - Dividend
Direct Plan - Dividend
Regular Plan - Dividend
Direct Plan - Dividend
Regular Plan - Dividend
Direct Plan - Dividend
SBI Dynamic Bond Fund - Quarterly Dividend
Face value: 10`
SBI Magnum Medium Duration Fund - Quarterly Dividend(Previously known as SBI Regular Savings Fund)
29-Sep-17 0.2500 0.2500 12.9872
29-Sep-17 0.2500 0.2500 13.4154
29-Dec-17 0.2500 0.2500 12.8096
29-Dec-17 0.2500 0.2500 13.2745
23-Mar-18 0.2000 0.2000 12.7657
23-Mar-18 0.2000 0.2000 13.2672
07-Sep-18 0.2000 0.2000 12.8078
07-Sep-18 0.2000 0.2000 13.3802
Scheme Name Record Date Individual Corporate NAV(in Rs./Unit) (in Rs./Unit) ( )`
Regular Plan - Dividend
Direct Plan - Dividend
Regular Plan - Dividend
Direct Plan - Dividend
Regular Plan - Dividend
Direct Plan - Dividend
Regular Plan - Dividend
Direct Plan - Dividend
Face value: 10`
SBI Short Term Debt Fund
28-Dec-18 0.0500 0.0500 12.1887
28-Dec-18 0.0500 0.0500 12.6604
31-Jan-19 0.0500 0.0500 12.7041
31-Jan-19 0.0500 0.0500 12.2232
28-Feb-19 0.0500 0.0500 12.7283
28-Feb-19 0.0500 0.0500 12.2400
Scheme Name Record Date Individual Corporate NAV(in Rs./Unit) (in Rs./Unit) ( )`
Direct Plan - Monthly Div
Regular Plan - Monthly Div
Direct Plan - Monthly Div
Regular Plan - Monthly Div
Direct Plan - Monthly Div
Regular Plan - Monthly Div
Face value: 10`
SBI Short Term Debt Fund - Retail Plan
31-Aug-18 0.0500 0.0500 11.3913
28-Sep-18 0.0500 0.0500 11.3374
31-Oct-18 0.0500 0.0500 11.3652
30-Nov-18 0.0500 0.0500 11.4344
28-Dec-18 0.0500 0.0500 11.4660
31-Jan-19 0.0500 0.0500 11.4954
28-Feb-19 0.0500 0.0500 11.5083
Scheme Name Record Date Individual Corporate NAV(in Rs./Unit) (in Rs./Unit) ( )`
Monthly Dividend
Monthly Dividend
Monthly Dividend
Monthly Dividend
Monthly Dividend
Monthly Dividend
Monthly Dividend
Face value: 10`
SBI Magnum Gilt Fund - Quarterly Dividend(Previously known as SBI Magnum Gilt Fund - Long Term Plan)
SBI Magnum Gilt Fund - Monthly Dividend(Previously known as SBI Magnum Gilt Fund - Long Term Plan)
SBI Magnum Medium Duration Fund - Monthly Dividend(Previously known as SBI Magnum Gilt Fund - Long Term Plan)
Scheme Name Record Date Individual Corporate NAV(in Rs./Unit) (in Rs./Unit) ( )`
Scheme Name Record Date Individual Corporate NAV(in Rs./Unit) (in Rs./Unit) ( )`
Scheme Name Record Date Individual Corporate NAV(in Rs./Unit) (in Rs./Unit) ( )`
29-Dec-17 0.2000 0.2000 13.4258
29-Dec-17 0.2000 0.2000 14.1448
23-Mar-18 0.2000 0.2000 13.1542
23-Mar-18 0.2000 0.2000 13.8883
07-Sep-18 0.2000 0.2000 13.1049
07-Sep-18 0.2000 0.2000 13.8919
28-Dec-18 0.2000 0.2000 13.4861
28-Dec-18 0.2000 0.2000 14.3374
28-Dec-18 0.2000 0.2000 12.9748
28-Dec-18 0.2000 0.2000 13.5960
Face value: 10`
Face value: 10`
Face value: 10`
Regular Plan - Dividend
Direct Plan - Dividend
Regular Plan - Dividend
Direct Plan - Dividend
Regular Plan - Dividend
Direct Plan - Dividend
Regular Plan - Dividend
Direct Plan - Dividend
Regular Plan - Dividend
Direct Plan - Dividend
29-Dec-17 0.2500 0.2500 13.7276
29-Dec-17 0.2500 0.2500 14.4748
23-Mar-18 0.2000 0.2000 13.7163
23-Mar-18 0.2000 0.2000 14.5017
07-Sep-18 0.2000 0.2000 13.8151
07-Sep-18 0.2000 0.2000 14.6808
28-Dec-18 0.2000 0.2000 13.9521
28-Dec-18 0.2000 0.2000 14.8782
Scheme Name Record Date Individual Corporate NAV(in Rs./Unit) (in Rs./Unit) ( )`
Regular Plan - Dividend
Direct Plan - Dividend
Regular Plan - Dividend
Direct Plan - Dividend
Regular Plan - Dividend
Direct Plan - Dividend
Regular Plan - Dividend
Direct Plan - Dividend
SBI Credit Risk Fund - Quarterly Dividend#
(#Previously known as SBI Corporate Bond Fund)
Face value: 10`
Dividend History Of Debt & Hybrid Funds
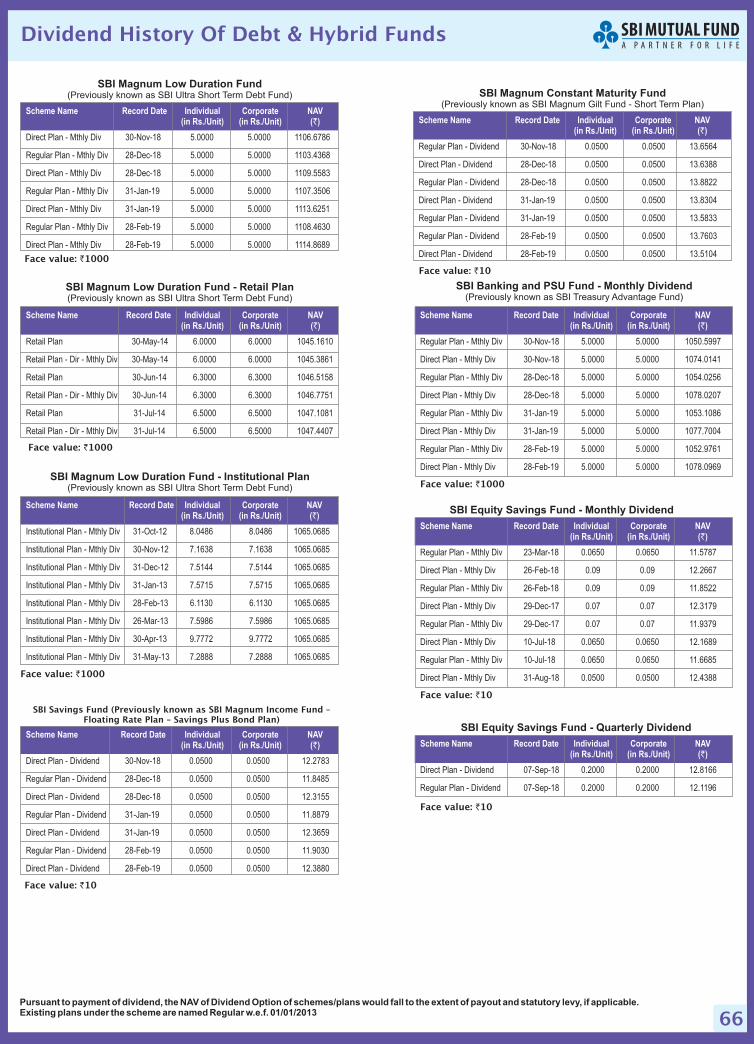
66Pursuant to payment of dividend, the NAV of Dividend Option of schemes/plans would fall to the extent of payout and statutory levy, if applicable.Existing plans under the scheme are named Regular w.e.f. 01/01/2013
30-Nov-18 5.0000 5.0000 1106.6786
28-Dec-18 5.0000 5.0000 1103.4368
28-Dec-18 5.0000 5.0000 1109.5583
31-Jan-19 5.0000 5.0000 1107.3506
31-Jan-19 5.0000 5.0000 1113.6251
28-Feb-19 5.0000 5.0000 1108.4630
28-Feb-19 5.0000 5.0000 1114.8689
Scheme Name Record Date Individual Corporate NAV(in Rs./Unit) (in Rs./Unit) ( )`
Direct Plan - Mthly Div
Regular Plan - Mthly Div
Direct Plan - Mthly Div
Regular Plan - Mthly Div
Direct Plan - Mthly Div
Mthly Div
Mthly Div
Regular Plan -
Direct Plan -
SBI Magnum Low Duration Fund(Previously known as SBI Ultra Short Term Debt Fund)
Face value: 1000`
SBI Magnum Low Duration Fund - Retail Plan(Previously known as SBI Ultra Short Term Debt Fund)
31-Jul-14 6.5000 6.5000 1047.1081
31-Jul-14 6.5000 6.5000 1047.4407
30-May-14 6.0000 6.0000 1045.1610
30-May-14 6.0000 6.0000 1045.3861
30-Jun-14 6.3000 6.3000 1046.5158
30-Jun-14 6.3000 6.3000 1046.7751
Scheme Name Record Date Individual Corporate NAV(in Rs./Unit) (in Rs./Unit) ( )`
Retail Plan
Retail Plan - Dir - Mthly Div
Retail Plan
Retail Plan - Dir - Mthly Div
Retail Plan
Retail Plan - Dir - Mthly Div
Face value: 1000`
SBI Magnum Low Duration Fund - Institutional Plan(Previously known as SBI Ultra Short Term Debt Fund)
31-Oct-12 8.0486 8.0486 1065.0685
30-Nov-12 7.1638 7.1638 1065.0685
31-Dec-12 7.5144 7.5144 1065.0685
31-Jan-13 7.5715 7.5715 1065.0685
28-Feb-13 6.1130 6.1130 1065.0685
26-Mar-13 7.5986 7.5986 1065.0685
30-Apr-13 9.7772 9.7772 1065.0685
31-May-13 7.2888 7.2888 1065.0685
Scheme Name Record Date Individual Corporate NAV(in Rs./Unit) (in Rs./Unit) ( )`
Institutional Plan - Mthly Div
Institutional Plan - Mthly Div
Institutional Plan - Mthly Div
Institutional Plan - Mthly Div
Institutional Plan - Mthly Div
Institutional Plan - Mthly Div
Institutional Plan - Mthly Div
Institutional Plan - Mthly Div
Face value: 1000`
SBI Banking and PSU Fund - Monthly Dividend(Previously known as SBI Treasury Advantage Fund)
SBI Equity Savings Fund - Monthly Dividend
30-Nov-18 5.0000 5.0000 1050.5997
30-Nov-18 5.0000 5.0000 1074.0141
28-Dec-18 5.0000 5.0000 1054.0256
28-Dec-18 5.0000 5.0000 1078.0207
31-Jan-19 5.0000 5.0000 1053.1086
31-Jan-19 5.0000 5.0000 1077.7004
28-Feb-19 5.0000 5.0000 1052.9761
28-Feb-19 5.0000 5.0000 1078.0969
23-Mar-18 0.0650 0.0650 11.5787
26-Feb-18 0.09 0.09 12.2667
26-Feb-18 0.09 0.09 11.8522
29-Dec-17 0.07 0.07 12.3179
29-Dec-17 0.07 0.07 11.9379
10-Jul-18 0.0650 0.0650 12.1689
10-Jul-18 0.0650 0.0650 11.6685
31-Aug-18 0.0500 0.0500 12.4388
Scheme Name Record Date Individual Corporate NAV(in Rs./Unit) (in Rs./Unit) ( )`
Scheme Name Record Date Individual Corporate NAV(in Rs./Unit) (in Rs./Unit) ( )`
Regular Plan - Mthly Div
Direct Plan - Mthly Div
Regular Plan - Mthly Div
Direct Plan - Mthly Div
Regular Plan - Mthly Div
Direct Plan - Mthly Div
Regular Plan - Mthly Div
Direct Plan - Mthly Div
Regular Plan - Mthly Div
Direct Plan - Mthly Div
Regular Plan - Mthly Div
Direct Plan - Mthly Div
Regular Plan - Mthly Div
Direct Plan - Mthly Div
Regular Plan - Mthly Div
Direct Plan - Mthly Div
Face value: 1000`
Face value: 10`
Face value: 10`
SBI Equity Savings Fund - Quarterly Dividend
07-Sep-18 0.2000 0.2000 12.8166
07-Sep-18 0.2000 0.2000 12.1196
Scheme Name Record Date Individual Corporate NAV(in Rs./Unit) (in Rs./Unit) ( )`
Direct Plan - Dividend
DividendRegular Plan -
SBI Magnum Constant Maturity Fund(Previously known as SBI Magnum Gilt Fund - Short Term Plan)
30-Nov-18 0.0500 0.0500 13.6564
28-Dec-18 0.0500 0.0500 13.6388
28-Dec-18 0.0500 0.0500 13.8822
31-Jan-19 0.0500 0.0500 13.8304
31-Jan-19 0.0500 0.0500 13.5833
28-Feb-19 0.0500 0.0500 13.7603
28-Feb-19 0.0500 0.0500 13.5104
Scheme Name Record Date Individual Corporate NAV(in Rs./Unit) (in Rs./Unit) ( )`
Regular Plan - Dividend
Direct Plan - Dividend
Regular Plan - Dividend
Direct Plan - Dividend
Regular Plan - Dividend
Regular Plan - Dividend
Direct Plan - Dividend
Face value: 10`
SBI Savings Fund (Previously known as SBI Magnum Income Fund –Floating Rate Plan – Savings Plus Bond Plan)
30-Nov-18 0.0500 0.0500 12.2783
28-Dec-18 0.0500 0.0500 11.8485
28-Dec-18 0.0500 0.0500 12.3155
31-Jan-19 0.0500 0.0500 11.8879
31-Jan-19 0.0500 0.0500 12.3659
28-Feb-19 0.0500 0.0500 11.9030
28-Feb-19 0.0500 0.0500 12.3880
Scheme Name Record Date Individual Corporate NAV(in Rs./Unit) (in Rs./Unit) ( )`
Direct Plan - Dividend
Regular Plan - Dividend
Direct Plan - Dividend
Regular Plan - Dividend
Direct Plan - Dividend
Regular Plan - Dividend
Direct Plan - Dividend
Face value: 10`
Dividend History Of Debt & Hybrid Funds
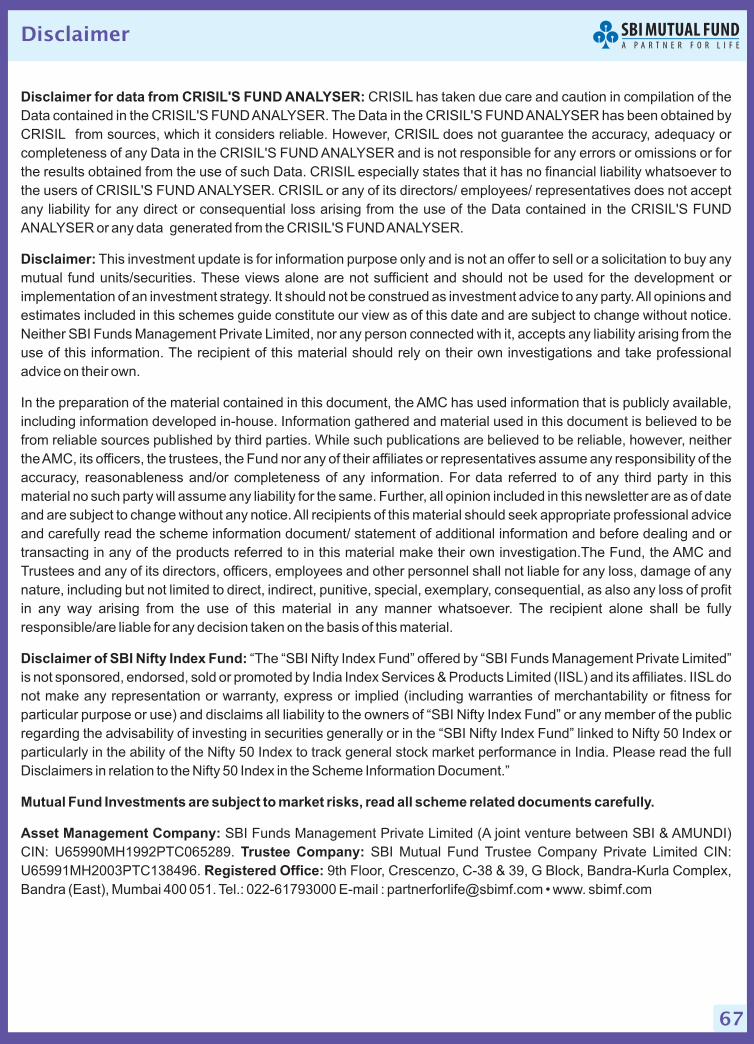
67
Disclaimer for data from CRISIL'S FUND ANALYSER:
Disclaimer:
Disclaimer of SBI Nifty Index Fund:
Mutual Fund Investments are subject to market risks, read all scheme related documents carefully.
Asset Management Company:
Trustee Company:
Registered Office:
CRISIL has taken due care and caution in compilation of the
Data contained in the CRISIL'S FUNDANALYSER. The Data in the CRISIL'S FUNDANALYSER has been obtained by
CRISIL from sources, which it considers reliable. However, CRISIL does not guarantee the accuracy, adequacy or
completeness of any Data in the CRISIL'S FUND ANALYSER and is not responsible for any errors or omissions or for
the results obtained from the use of such Data. CRISIL especially states that it has no financial liability whatsoever to
the users of CRISIL'S FUND ANALYSER. CRISIL or any of its directors/ employees/ representatives does not accept
any liability for any direct or consequential loss arising from the use of the Data contained in the CRISIL'S FUND
ANALYSER or any data generated from the CRISIL'S FUNDANALYSER.
This investment update is for information purpose only and is not an offer to sell or a solicitation to buy any
mutual fund units/securities. These views alone are not sufficient and should not be used for the development or
implementation of an investment strategy. It should not be construed as investment advice to any party.All opinions and
estimates included in this schemes guide constitute our view as of this date and are subject to change without notice.
Neither SBI Funds Management Private Limited, nor any person connected with it, accepts any liability arising from the
use of this information. The recipient of this material should rely on their own investigations and take professional
advice on their own.
In the preparation of the material contained in this document, the AMC has used information that is publicly available,
including information developed in-house. Information gathered and material used in this document is believed to be
from reliable sources published by third parties. While such publications are believed to be reliable, however, neither
theAMC, its officers, the trustees, the Fund nor any of their affiliates or representatives assume any responsibility of the
accuracy, reasonableness and/or completeness of any information. For data referred to of any third party in this
material no such party will assume any liability for the same. Further, all opinion included in this newsletter are as of date
and are subject to change without any notice.All recipients of this material should seek appropriate professional advice
and carefully read the scheme information document/ statement of additional information and before dealing and or
transacting in any of the products referred to in this material make their own investigation.The Fund, the AMC and
Trustees and any of its directors, officers, employees and other personnel shall not liable for any loss, damage of any
nature, including but not limited to direct, indirect, punitive, special, exemplary, consequential, as also any loss of profit
in any way arising from the use of this material in any manner whatsoever. The recipient alone shall be fully
responsible/are liable for any decision taken on the basis of this material.
“The “SBI Nifty Index Fund” offered by “SBI Funds Management Private Limited”
is not sponsored, endorsed, sold or promoted by India Index Services & Products Limited (IISL) and its affiliates. IISLdo
not make any representation or warranty, express or implied (including warranties of merchantability or fitness for
particular purpose or use) and disclaims all liability to the owners of “SBI Nifty Index Fund” or any member of the public
regarding the advisability of investing in securities generally or in the “SBI Nifty Index Fund” linked to Nifty 50 Index or
particularly in the ability of the Nifty 50 Index to track general stock market performance in India. Please read the full
Disclaimers in relation to the Nifty 50 Index in the Scheme Information Document.”
SBI Funds Management Private Limited (A joint venture between SBI & AMUNDI)
CIN: U65990MH1992PTC065289. SBI Mutual Fund Trustee Company Private Limited
9th Floor, Crescenzo, C-38 & 39, G Block, Bandra-Kurla Complex,
Bandra (East), Mumbai 400 051. Tel.: 022-61793000 E-mail : [email protected] • www. sbimf.com
CIN:
U65991MH2003PTC138496.
Disclaimer
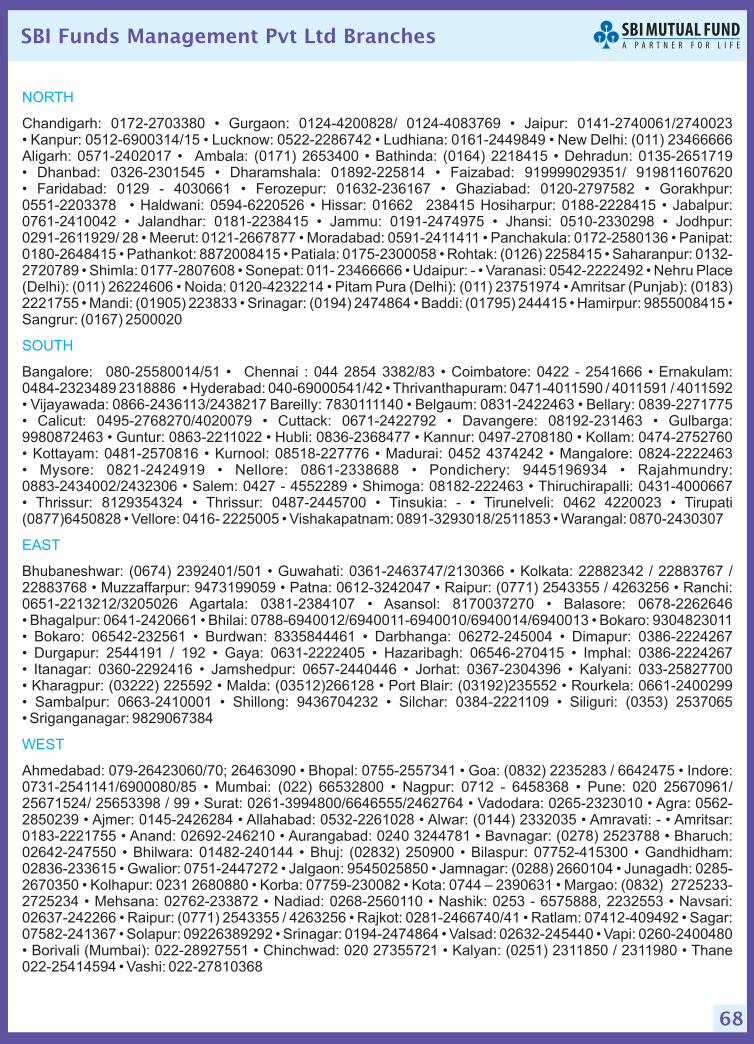
68
NORTH
SOUTH
EAST
WEST
Chandigarh: 0172-2703380 • Gurgaon: 0124-4200828/ 0124-4083769 • Jaipur: 0141-2740061/2740023• Kanpur: 0512-6900314/15 • Lucknow: 0522-2286742 • Ludhiana: 0161-2449849 • New Delhi: (011) 23466666Aligarh: 0571-2402017 • Ambala: (0171) 2653400 • Bathinda: (0164) 2218415 • Dehradun: 0135-2651719• Dhanbad: 0326-2301545 • Dharamshala: 01892-225814 • Faizabad: 919999029351/ 919811607620• Faridabad: 0129 - 4030661 • Ferozepur: 01632-236167 • Ghaziabad: 0120-2797582 Gorakhpur:0551-2203378 • Haldwani: 0594-6220526 • Hissar: 01662 238415 Hosiharpur: 0188-2228415 • Jabalpur:0761-2410042 • Jalandhar: 0181-2238415 • Jammu: 0191-2474975 • Jhansi: 0510-2330298 • Jodhpur:0291-2611929/ 28 • Meerut: 0121-2667877 • Moradabad: 0591-2411411 • Panchakula: 0172-2580136 • Panipat:0180-2648415 • Pathankot: 8872008415 • Patiala: 0175-2300058 • Rohtak: (0126) 2258415 • Saharanpur: 0132-2720789 • Shimla: 0177-2807608 • Sonepat: 011- 23466666 • Udaipur: - • Varanasi: 0542-2222492 • Nehru Place(Delhi): (011) 26224606 • Noida: 0120-4232214 • Pitam Pura (Delhi): (011) 23751974
Bangalore: 080-25580014/51 • Chennai : 044 2854 3382/83 • Coimbatore: 0422 - 2541666 • Ernakulam:0484-2323489 2318886 • Hyderabad: 040-69000541/42 • Thrivanthapuram: 0471-4011590 / 4011591 / 4011592• Vijayawada: 0866-2436113/2438217 Bareilly: 7830111140 • Belgaum: 0831-2422463 • Bellary: 0839-2271775• Calicut: 0495-2768270/4020079 • Cuttack: 0671-2422792 • Davangere: 08192-231463
• Guntur: 0863-2211022 • Hubli: 0836-2368477 • Kannur: 0497-2708180 • Kollam: 0474-2752760• Kottayam: 0481-2570816 • Kurnool: 08518-227776 • Madurai: 0452 4374242 • Mangalore: 0824-2222463• Mysore: 0821-2424919 • Nellore: 0861-2338688 • Pondichery: 9445196934 • Rajahmundry:0883-2434002/2432306 • Salem: 0427 - 4552289 • Shimoga: 08182-222463 • Thiruchirapalli: 0431-4000667• Thrissur: 8129354324 • Thrissur: 0487-2445700 • Tinsukia: - • Tirunelveli: 0462 4220023 • Tirupati(0877)6450828 • Vellore: 0416- 2225005 • Vishakapatnam: 0891-3293018/2511853 • Warangal: 0870-2430307
Bhubaneshwar: (0674) 2392401/501 • Guwahati: 0361-2463747/2130366 • Kolkata: 22882342 / 22883767 /22883768 • Patna: 0612-3242047 • Raipur: (0771) 2543355 / 4263256 • Ranchi:0651-2213212/3205026 Agartala: 0381-2384107 • Asansol: 8170037270 • Balasore: 0678-2262646• Bhagalpur: 0641-2420661 • Bhilai: 0788-6940012/6940011-6940010/6940014/6940013 • Bokaro: 9304823011• Bokaro: 06542-232561 • Burdwan: 8335844461 • Darbhanga: 06272-245004 • Dimapur: 0386-2224267• Durgapur: 2544191 / 192 • Gaya: 0631-2222405 • Hazaribagh: 06546-270415 • Imphal: 0386-2224267• Itanagar: 0360-2292416 • Jamshedpur: 0657-2440446 • Jorhat: 0367-2304396 • Kalyani: 033-25827700• Kharagpur: (03222) 225592 • Malda: (03512)266128 • Port Blair: (03192)235552 • Rourkela: 0661-2400299• Sambalpur: 0663-2410001 • Shillong: 9436704232 • Silchar: 0384-2221109 • Siliguri: (0353) 2537065• Sriganganagar: 9829067384
Ahmedabad: 079-26423060/70; 26463090 • Bhopal: 0755-2557341 • Goa: (0832) 2235283 / 6642475 • Indore:0731-2541141/6900080/85 • Mumbai: (022) 66532800 • Nagpur: 0712 - 6458368 • Pune: 020 25670961/25671524/ 25653398 / 99 • Surat: 0261-3994800/6646555/2462764 • Vadodara: 0265-2323010 Agra: 0562-2850239 • Ajmer: 0145-2426284 • Allahabad: 0532-2261028 • Alwar: (0144) 2332035 • Amravati: - • Amritsar:0183-2221755 • Anand: 02692-246210 • Aurangabad: 0240 3244781 • Bavnagar: (0278) 2523788 • Bharuch:02642-247550 • Bhilwara: 01482-240144 • Bhuj: (02832) 250900 • Bilaspur: 07752-415300 • Gandhidham:02836-233615 • Gwalior: 0751-2447272 • Jalgaon: 9545025850 • Jamnagar: (0288) 2660104 • Junagadh: 0285-2670350 • Kolhapur: 0231 2680880 • Korba: 07759-230082 • Kota: 0744 – 2390631 • Margao: (0832) 2725233-2725234 • Mehsana: 02762-233872 • Nadiad: 0268-2560110 • Nashik: 0253 - 6575888, 2232553 • Navsari:02637-242266 • Raipur: (0771) 2543355 / 4263256 • Rajkot: 0281-2466740/41 • Ratlam: 07412-409492 • Sagar:07582-241367 • Solapur: 09226389292 • Srinagar: 0194-2474864 • Valsad: 02632-245440 • Vapi: 0260-2400480• Borivali (Mumbai): 022-28927551 • Chinchwad: 020 27355721 • Kalyan: (0251) 2311850 / 2311980 • Thane022-25414594 • Vashi: 022-27810368
•
• Amritsar (Punjab): (0183)2221755 • Mandi: (01905) 223833 • Srinagar: (0194) 2474864 • Baddi: (01795) 244415 • Hamirpur: 9855008415 •Sangrur: (0167) 2500020
• Gulbarga:9980872463
• Muzzaffarpur: 9473199059
•
SBI Funds Management Pvt Ltd Branches
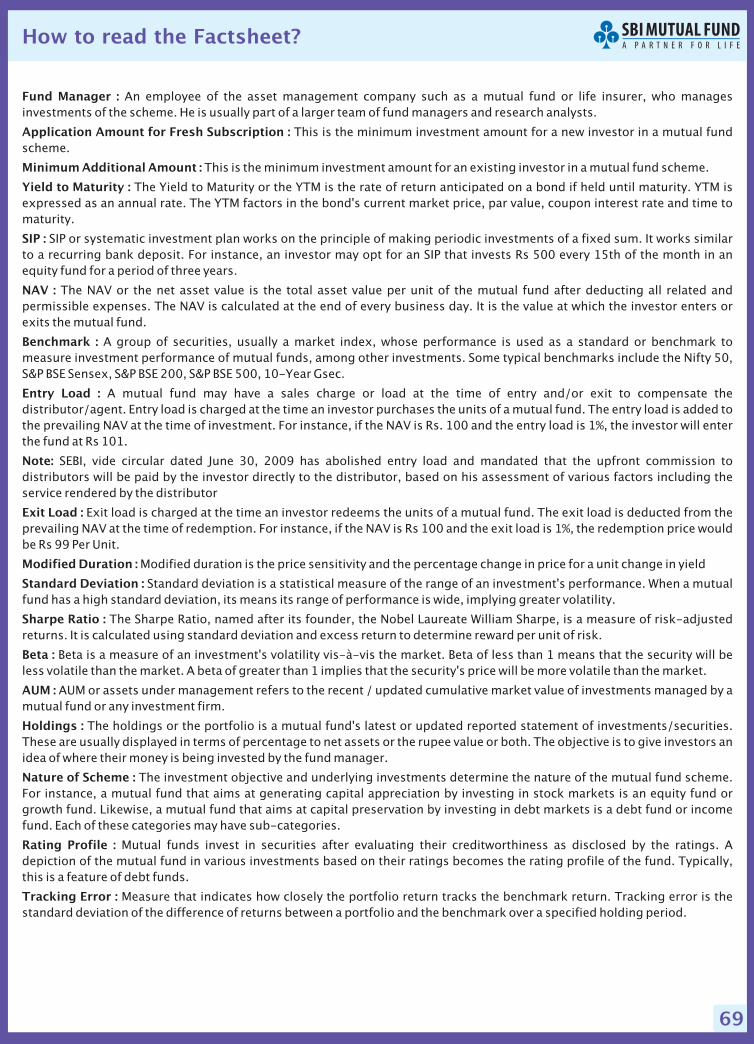
69
Fund Manager :
Application Amount for Fresh Subscription :
Minimum Additional Amount :
Yield to Maturity :
SIP :
NAV :
Benchmark :
Entry Load :
Note:
Exit Load :
Modified Duration :
Standard Deviation :
Sharpe Ratio :
Beta :
AUM :
Holdings :
Nature of Scheme :
Rating Profile :
Tracking Error :
An employee of the asset management company such as a mutual fund or life insurer, who managesinvestments of the scheme. He is usually part of a larger team of fund managers and research analysts.
This is the minimum investment amount for a new investor in a mutual fundscheme.
This is the minimum investment amount for an existing investor in a mutual fund scheme.
The Yield to Maturity or the YTM is the rate of return anticipated on a bond if held until maturity. YTM isexpressed as an annual rate. The YTM factors in the bond's current market price, par value, coupon interest rate and time tomaturity.
SIP or systematic investment plan works on the principle of making periodic investments of a fixed sum. It works similarto a recurring bank deposit. For instance, an investor may opt for an SIP that invests Rs 500 every 15th of the month in anequity fund for a period of three years.
The NAV or the net asset value is the total asset value per unit of the mutual fund after deducting all related andpermissible expenses. The NAV is calculated at the end of every business day. It is the value at which the investor enters orexits the mutual fund.
A group of securities, usually a market index, whose performance is used as a standard or benchmark tomeasure investment performance of mutual funds, among other investments. Some typical benchmarks include the Nifty 50,S&P BSE Sensex, BSE 200, BSE 500, 10-Year Gsec.
A mutual fund may have a sales charge or load at the time of entry and/or exit to compensate thedistributor/agent. Entry load is charged at the time an investor purchases the units of a mutual fund. The entry load is added tothe prevailing NAV at the time of investment. For instance, if the NAV is Rs. 100 and the entry load is 1%, the investor will enterthe fund at Rs 101.
SEBI, vide circular dated June 30, 2009 has abolished entry load and mandated that the upfront commission todistributors will be paid by the investor directly to the distributor, based on his assessment of various factors including theservice rendered by the distributor
Exit load is charged at the time an investor redeems the units of a mutual fund. The exit load is deducted from theprevailing NAV at the time of redemption. For instance, if the NAV is Rs 100 and the exit load is 1%, the redemption price wouldbe Rs 99 Per Unit.
Modified duration is the price sensitivity and the percentage change in price for a unit change in yield
Standard deviation is a statistical measure of the range of an investment's performance. When a mutualfund has a high standard deviation, its means its range of performance is wide, implying greater volatility.
The Sharpe Ratio, named after its founder, the Nobel Laureate William Sharpe, is a measure of risk-adjustedreturns. It is calculated using standard deviation and excess return to determine reward per unit of risk.
Beta is a measure of an investment's volatility vis-à-vis the market. Beta of less than 1 means that the security will beless volatile than the market. A beta of greater than 1 implies that the security's price will be more volatile than the market.
AUM or assets under management refers to the recent / updated cumulative market value of investments managed by amutual fund or any investment firm.
The holdings or the portfolio is a mutual fund's latest or updated reported statement of investments/securities.These are usually displayed in terms of percentage to net assets or the rupee value or both. The objective is to give investors anidea of where their money is being invested by the fund manager.
The investment objective and underlying investments determine the nature of the mutual fund scheme.For instance, a mutual fund that aims at generating capital appreciation by investing in stock markets is an equity fund orgrowth fund. Likewise, a mutual fund that aims at capital preservation by investing in debt markets is a debt fund or incomefund. Each of these categories may have sub-categories.
Mutual funds invest in securities after evaluating their creditworthiness as disclosed by the ratings. Adepiction of the mutual fund in various investments based on their ratings becomes the rating profile of the fund. Typically,this is a feature of debt funds.
Measure that indicates how closely the portfolio return tracks the benchmark return. Tracking error is thestandard deviation of the difference of returns between a portfolio and the benchmark over a specified holding period.
S&P S&P
How to read the Factsheet?