mapping the potential ranges of major plant invaders in south africa, lesotho and swaziland using...
TRANSCRIPT
© 2004 Blackwell Publishing Ltd www.blackwellpublishing.com/ddi
475
Diversity and Distributions, (Diversity Distrib.)
(2004)
10
, 475–484
BIODIVERSITYRESEARCH
ABSTRACT
Most national or regional initiatives aimed at managing biological invasions lackobjective protocols for prioritizing invasive species and areas based on likely futuredimensions of spread. South Africa has one of the most ambitious national pro-grammes for managing plant invasions in the world. There is, however, no protocolfor assessing the likely future spread patterns needed to inform medium- to long-term planning. This paper presents an assessment of the climatic correlates of distri-bution of 71 important invasive alien plants, and an analysis of the implications ofthese findings for future invasions in different vegetation types in South Africa,Lesotho and Swaziland over the next few decades. We used a variant of climatic enve-lope models (CEMs) based on the Mahalanobis distance to derive climatic suitabilitysurfaces for each species. CEMs were developed using the first three principal com-ponents derived from an analysis of seven climatic variables. Most species are cur-rently confined to 10% or less of the region, but could potentially invade up to 40%.Depending on the species, between 2% and 79% of the region is climatically suitablefor species to invade, and some areas were suitable for up to 45 plant invaders. Overone third of the modelled species have limited potential to substantially expand theirdistribution. About 20% of the vegetation types have low invasion potential wherefewer than five species can invade, and about 10% have high invasion potential,being potentially suitable for more than 25 of the plant invaders. Our results suggestthat management of the invasive plant species that are currently most widespreadshould focus on reducing densities, for example through biological control pro-grammes, rather than controlling range expansions. We also identify areas of theregion that may require additional management focus in the future.
Keywords
Bioclimatic modelling, biological invasions, Mahalanobis distance, predictive
models, spatial distribution, Working for Water programme.
INTRODUCTION
Biological invasions are a major threat to biodiversity and ecosys-
tem functioning worldwide (Mack
et al
., 2001). Many important
management initiatives have been initiated in different parts of
the world, particularly in the last two decades. Such programmes
target invasions in many different ways and focus at spatial scales
ranging from global, through national and regional, to local
(Wittenberg & Cock, 2001). This paper addresses the need for
better information to inform national policy on the management
of alien plant invasions in South Africa.
South Africa has been invaded by many species with well-
documented ecological and economic impacts (Richardson
et al
.,
1997; Versfeld
et al
., 1998; Le Maitre
et al
., 2000; Richardson
& van Wilgen, 2004; Van Wilgen, 2004). The country has a
long history of research on, and management of, biological
invasions, especially relating to invasive alien plants (Macdonald
et al
., 1986). A milestone in the management of alien plant inva-
sions in South Africa was the initiation in 1995 of the national-
scale Working for Water Programme (Van Wilgen
et al
., 1996;
Van Wilgen
et al
., 1998; Van Wilgen, 2004). This programme has
been widely lauded for its success in merging social, political,
economic and environmental considerations (e.g. Hobbs, 2004).
One of its biggest achievements has been the coordination of
previously separate management initiatives (Van Wilgen, 2004).
Despite its successes on many fronts, many challenges still
1
National Botanical Institute, Kirstenbosch
Research Centre, Private Bag X7, Claremont
7735, South Africa, E-mail: [email protected];
2
Institute for Plant Conservation, Botany
Department, University of Cape Town, 7701
Rondebosch, South Africa; and
3
CSIR,
Environmentek, PO Box 320, Stellenbosch, 7599,
South Africa
*Correspondence: Mathieu Rouget, National Botanical Institute, Kirstenbosch Research Centre, Private Bag X7, Claremont 7735, South Africa. Tel.: + 27 21 799 8749. Fax.: + 27 21 797 6903. E-mail: [email protected]
Blackwell Publishing, Ltd.
Mapping the potential ranges of major plant invaders in South Africa, Lesotho and Swaziland using climatic suitability
Mathieu Rouget
1
*, David M. Richardson
2
, Jeanne L. Nel
3
, David C. Le Maitre
3
,
Benis Egoh
1
and Theresa Mgidi
3
M. Rouget
et al.
476
Diversity and Distributions
,
10
, 475–484, © 2004 Blackwell Publishing Ltd
confront the programme (Macdonald, 2004). One of these is the
need to prioritize areas and species to maximize the cost effec-
tiveness of control operations.
Systematic medium-term planning for a programme such as
Working for Water that deals with many invasive species over a
very large area demands an objective assessment of priorities for
both species and areas. As a first step in this process, a classifica-
tion of invasive alien plant species into major and emerging
invaders for South Africa, Lesotho and Swaziland was recently
proposed (Nel
et al
., 2004). This study highlighted the need for
management to consider three categories of invaders: those
species that are already widespread and abundant in the country,
those that have only recently started to invade, and those that
have not yet shown any sign of invasiveness or that are not yet
present in the country but could pose a threat if introduced.
Work is currently underway to improve our understanding of the
extent of invasion (Versfeld
et al
., 1998) and dynamics (Robert-
son
et al
., 2003; Nel
et al
., 2004; Olckers, 2004; Robertson
et al
.,
2004) of species in all these categories.
In this paper we present an approach for exploring the poten-
tial of important plant invaders to invade new areas in the region
(South Africa, Lesotho and Swaziland). The analysis is based on
a broad-brush assessment of climatic similarity between areas
currently invaded and those not yet invaded. Many techniques
have been proposed for understanding and modelling species-
environment relationships (Franklin, 1995; Guisan & Zimmer-
mann, 2000). Climate envelope models (CEMs), one type of
predictive model, generate maps of potential species distribution
using climatic characteristics where the species occurs. Major
advantages of CEMs are their ability to cope with ‘presence only’
data, and their simplicity. Due to the relatively large number of
plant invaders, a simple modelling technique, applicable to dif-
ferent taxa with a wide range of environmental requirements,
was required, and CEMs were considered to be appropriate. The
objectives of this study were to (a) develop climatic envelopes for
major plant invaders; (b) map invasion potential for the whole
country; and (c) assess the invasion potential of the region’s
vegetation types.
METHODS
Selecting invasive alien plant species
The Southern African Plant Invaders Atlas (SAPIA) is the best
source of data on the distribution of invasive alien plants in
South Africa, Lesotho and Swaziland. The SAPIA database
contains records for over 500 species with information on their
distribution, abundance, habitat preferences, and time of
introduction (Henderson, 1998, 1999, 2001). Records are geo-
referenced based on a quarter-degree grid system (hereafter
quarter-degree squares or ‘QDS’, 15
′
latitude
×
15
′
longitude,
representing roughly 25
×
27 km). Nel
et al
. (2004) used species
distribution and abundance data from SAPIA to identify 126
major plant invaders — species recorded as either widespread, or
localized but abundant. Our analyses focused only on those
major plant invaders with at least 50 records in SAPIA. Aquatic
species were also excluded because their distribution is deter-
mined more by water availability than by climatic factors. The 71
major plant invaders selected for study are listed in Appendix S1.
Environmental modelling
Modelling the potential distribution of invasive species is always
subject to uncertainties. For instance, the role of climate in con-
trolling distribution is not the same for all species, and other
factors such as disturbance regimes and biotic interactions may
override climatic factors (Richardson & Bond, 1991; Hulme,
2003). Furthermore, the distribution of invasive species might
not be in equilibrium with the environment because the geo-
graphical range of the species might still be expanding. Impor-
tantly, the majority of the species selected for study (Appendix
S1) were introduced more than 100 years ago, allowing them
time to sample a wide range of available habitats. An important
assumption of our study is thus that the current distribution of
the species in the region provides a good indication of their
potential range in the region. We realize that potential distribu-
tions for some species (those for which human-aided dissemina-
tion has not afforded them opportunity to sample all potentially
invasible habitats) may be underestimated. Similarly, for those
species that have a scattered distribution over a large part of the
region and/or where distribution is associated with human-
induced disturbance more than inherent features of the environ-
ment, the potential distribution based on our assessments of
climatic conditions is probably overestimated.
Despite these limitations, CEMs are very useful at a broad
scale to develop a general picture of where species are most likely
to invade, especially in this region with marked climatic gradi-
ents. For example, the mean annual rainfall exceeds 500 mm in
the southern and eastern parts of the region but is less than
250 mm in the north-west and central interior (Schulze
et al
.,
1997). Likewise, growing conditions in the interior are strongly
influenced by cold winters and a higher frequency of frost than in
coastal areas. Previous studies have also shown that, at the scale
of the whole region, climatic factors were the best environmental
variables for predicting the distribution of two important in-
vaders in South Africa (Rouget & Richardson, 2003).
The predictive ability of CEMs, however, is highly dependent
on the choice of climatic factors. We investigated the use of a
range of climatic variables developed by Schulze
et al
. (1997).
Preliminary analyses suggested that the relative importance of
climatic factors was species-specific, making it difficult to
identify a few ‘generic’ climatic variables, which could be applied
for all our species. We therefore reduced the large number of
possible explanatory variables to three components (principal
component axes 1, 2 and 3) using Principal Component Analysis
(PCA, Mardia
et al
., 1979). The first three components of the
resulting PCA explained over 95% of the initial variation, based
on the seven climatic variables with the greatest influence on
plant species distribution (see Table 1; Fig. 1). We then used
these three climatic indices to derive the CEMs.
Most CEMs have used a rectilinear envelope based on minima
and maxima of each climatic factor considered, and assign
Plant invaders in Southern Africa
Diversity and Distributions
,
10
, 475–484, © 2004 Blackwell Publishing Ltd
477
equal climatic suitability within the boundaries of the climatic
envelope (Austin
et al
., 1990; Busby, 1991). In this study, we used
a variant of CEMs based on an oblique ellipse model, which
calculates the Mahalanobis distance to the ‘optimal’ climate con-
ditions (Farber & Kadmon, 2003). Niche theory supports the use
of such models because they assume the existence of optimal
environmental conditions for a species and that any deviation
from this optimum is associated with a lower climatic suitability.
These models are an improvement on traditional CEMs in that a
continuous range of climatic suitability values can be equated
with probability of occurrence.
For each species, the following procedure was followed. We
extracted the QDS records where the species occurs, and deter-
mined the climate characteristics of each QDS based on the
three principal components. As climatic data were available at a
finer resolution (1 minute) than the species distribution data
(15 min), we used the mean value of the principal components
for each of the 225 cells within the QDS. We followed the
approach by Farber & Kadmon (2003) and calculated the mean
vector (
m
) of the three principal components, which represents
the ‘optimum’ climatic condition. We also calculated the covari-
ance matrix (
C
) from a matrix whose rows represent the QDS
where the species was recorded and whose columns represent the
corresponding values of the three principal components. Next,
each 1-minute cell was assigned a Mahalanobis distance using
m
and
C
, defined as:
d
2
=
(
x
−
m
)
T
C
−
1
(
x
−
m
)
where
x
represents the set of climatic conditions in each 1-
minute cell, and
d
is the Mahalanobis distance from which we
derived a climatic suitability index (see below).
Climatic variables I component II component III component
Growth days per year 0.53 0.07 0.25
Minimum soil water stress –0.49 −−−−0.04 0.22
Frost duration −0.11 –0.60 0.25
Growth temperature −0.22 0.42 0.64
Mean temperature of the hottest month −0.40 0.39 0.10
Mean temperature of the coldest month 0.17 0.55 –0.38
Mean annual precipitation 0.48 0.08 0.51
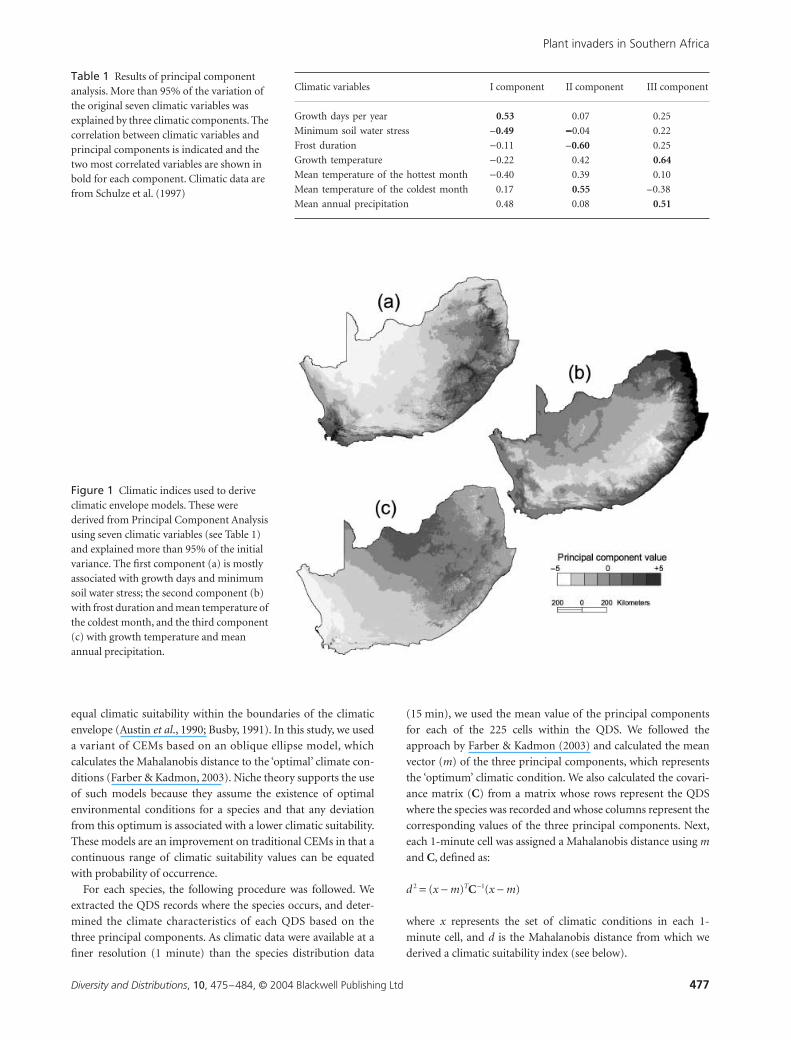
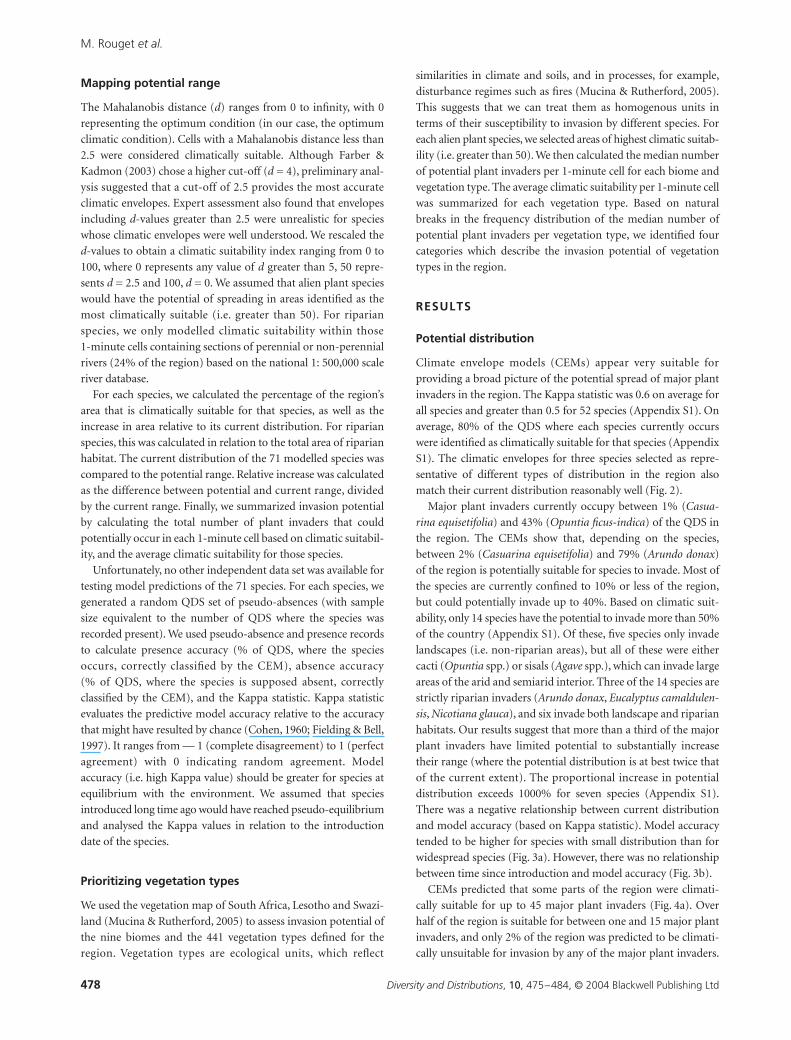
Table 1 Results of principal component analysis. More than 95% of the variation of the original seven climatic variables was explained by three climatic components. The correlation between climatic variables and principal components is indicated and the two most correlated variables are shown in bold for each component. Climatic data are from Schulze et al. (1997)
Figure 1 Climatic indices used to derive climatic envelope models. These were derived from Principal Component Analysis using seven climatic variables (see Table 1) and explained more than 95% of the initial variance. The first component (a) is mostly associated with growth days and minimum soil water stress; the second component (b) with frost duration and mean temperature of the coldest month, and the third component (c) with growth temperature and mean annual precipitation.
M. Rouget
et al.
478
Diversity and Distributions
,
10
, 475–484, © 2004 Blackwell Publishing Ltd
Mapping potential range
The Mahalanobis distance (
d
) ranges from 0 to infinity, with 0
representing the optimum condition (in our case, the optimum
climatic condition). Cells with a Mahalanobis distance less than
2.5 were considered climatically suitable. Although Farber &
Kadmon (2003) chose a higher cut-off (
d
= 4), preliminary anal-
ysis suggested that a cut-off of 2.5 provides the most accurate
climatic envelopes. Expert assessment also found that envelopes
including
d
-values greater than 2.5 were unrealistic for species
whose climatic envelopes were well understood. We rescaled the
d
-values to obtain a climatic suitability index ranging from 0 to
100, where 0 represents any value of
d
greater than 5, 50 repre-
sents
d
= 2.5 and 100,
d
= 0. We assumed that alien plant species
would have the potential of spreading in areas identified as the
most climatically suitable (i.e. greater than 50). For riparian
species, we only modelled climatic suitability within those
1-minute cells containing sections of perennial or non-perennial
rivers (24% of the region) based on the national 1: 500,000 scale
river database.
For each species, we calculated the percentage of the region’s
area that is climatically suitable for that species, as well as the
increase in area relative to its current distribution. For riparian
species, this was calculated in relation to the total area of riparian
habitat. The current distribution of the 71 modelled species was
compared to the potential range. Relative increase was calculated
as the difference between potential and current range, divided
by the current range. Finally, we summarized invasion potential
by calculating the total number of plant invaders that could
potentially occur in each 1-minute cell based on climatic suitabil-
ity, and the average climatic suitability for those species.
Unfortunately, no other independent data set was available for
testing model predictions of the 71 species. For each species, we
generated a random QDS set of pseudo-absences (with sample
size equivalent to the number of QDS where the species was
recorded present). We used pseudo-absence and presence records
to calculate presence accuracy (% of QDS, where the species
occurs, correctly classified by the CEM), absence accuracy
(% of QDS, where the species is supposed absent, correctly
classified by the CEM), and the Kappa statistic. Kappa statistic
evaluates the predictive model accuracy relative to the accuracy
that might have resulted by chance (Cohen, 1960; Fielding & Bell,
1997). It ranges from — 1 (complete disagreement) to 1 (perfect
agreement) with 0 indicating random agreement. Model
accuracy (i.e. high Kappa value) should be greater for species at
equilibrium with the environment. We assumed that species
introduced long time ago would have reached pseudo-equilibrium
and analysed the Kappa values in relation to the introduction
date of the species.
Prioritizing vegetation types
We used the vegetation map of South Africa, Lesotho and Swazi-
land (Mucina & Rutherford, 2005) to assess invasion potential of
the nine biomes and the 441 vegetation types defined for the
region. Vegetation types are ecological units, which reflect
similarities in climate and soils, and in processes, for example,
disturbance regimes such as fires (Mucina & Rutherford, 2005).
This suggests that we can treat them as homogenous units in
terms of their susceptibility to invasion by different species. For
each alien plant species, we selected areas of highest climatic suitab-
ility (i.e. greater than 50). We then calculated the median number
of potential plant invaders per 1-minute cell for each biome and
vegetation type. The average climatic suitability per 1-minute cell
was summarized for each vegetation type. Based on natural
breaks in the frequency distribution of the median number of
potential plant invaders per vegetation type, we identified four
categories which describe the invasion potential of vegetation
types in the region.
RESULTS
Potential distribution
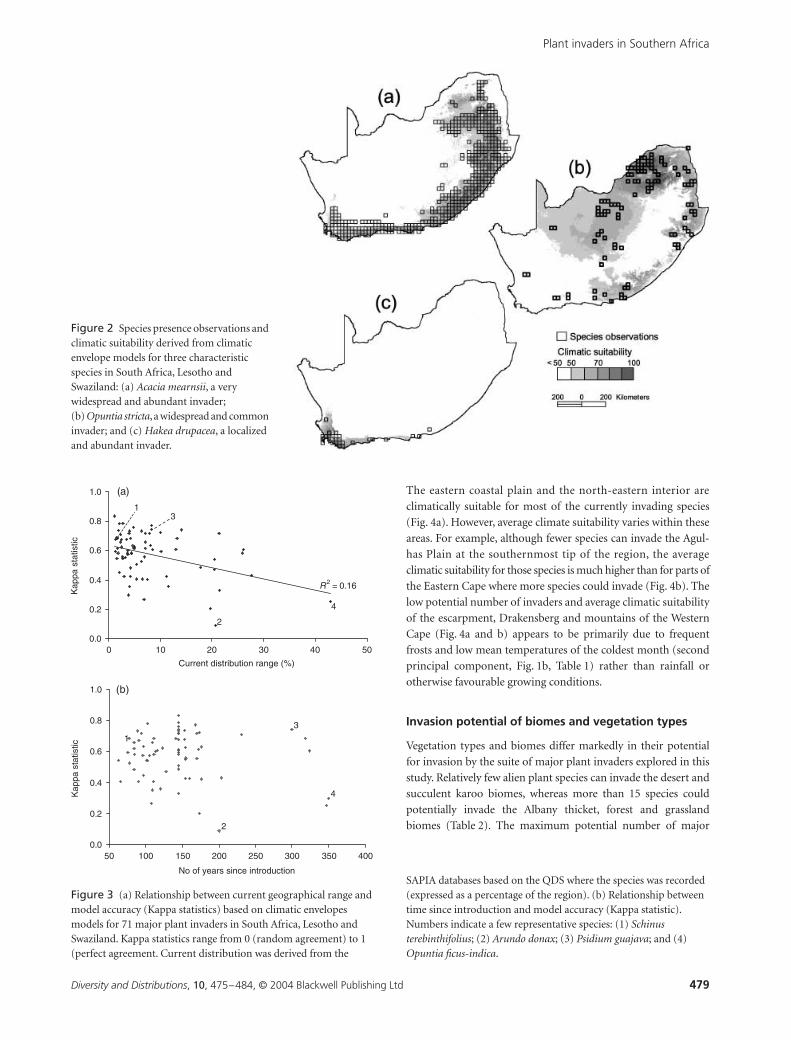
Climate envelope models (CEMs) appear very suitable for
providing a broad picture of the potential spread of major plant
invaders in the region. The Kappa statistic was 0.6 on average for
all species and greater than 0.5 for 52 species (Appendix S1). On
average, 80% of the QDS where each species currently occurs
were identified as climatically suitable for that species (Appendix
S1). The climatic envelopes for three species selected as repre-
sentative of different types of distribution in the region also
match their current distribution reasonably well (Fig. 2).
Major plant invaders currently occupy between 1% (
Casua-
rina equisetifolia
) and 43% (
Opuntia ficus-indica
) of the QDS in
the region. The CEMs show that, depending on the species,
between 2% (
Casuarina equisetifolia
) and 79% (
Arundo donax
)
of the region is potentially suitable for species to invade. Most of
the species are currently confined to 10% or less of the region,
but could potentially invade up to 40%. Based on climatic suit-
ability, only 14 species have the potential to invade more than 50%
of the country (Appendix S1). Of these, five species only invade
landscapes (i.e. non-riparian areas), but all of these were either
cacti (
Opuntia
spp.) or sisals (
Agave
spp.), which can invade large
areas of the arid and semiarid interior. Three of the 14 species are
strictly riparian invaders (
Arundo donax
,
Eucalyptus camaldulen-
sis
,
Nicotiana glauca
), and six invade both landscape and riparian
habitats. Our results suggest that more than a third of the major
plant invaders have limited potential to substantially increase
their range (where the potential distribution is at best twice that
of the current extent). The proportional increase in potential
distribution exceeds 1000% for seven species (Appendix S1).
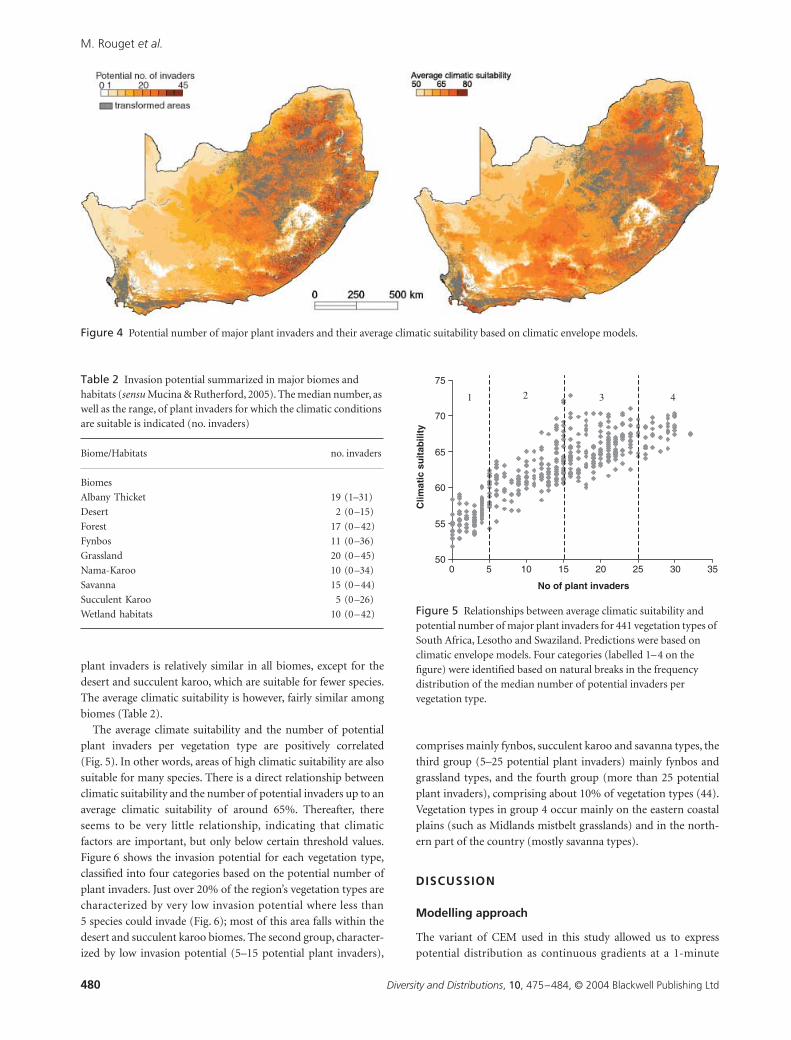
There was a negative relationship between current distribution
and model accuracy (based on Kappa statistic). Model accuracy
tended to be higher for species with small distribution than for
widespread species (Fig. 3a). However, there was no relationship
between time since introduction and model accuracy (Fig. 3b).
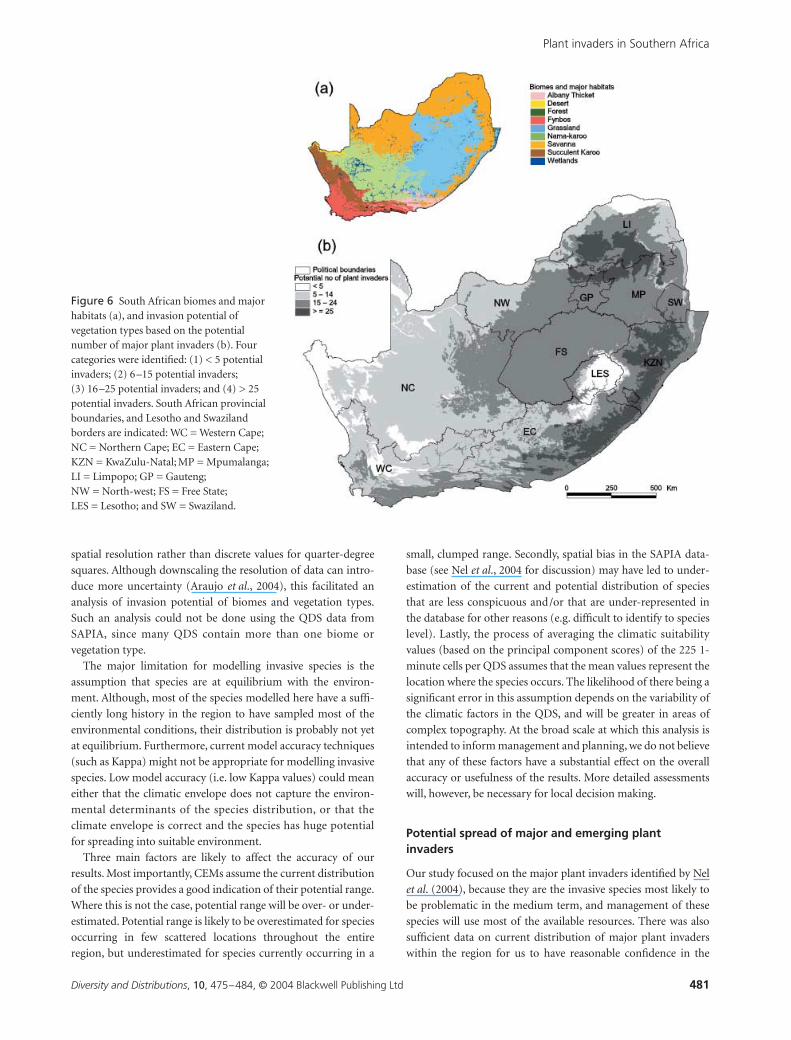
CEMs predicted that some parts of the region were climati-
cally suitable for up to 45 major plant invaders (Fig. 4a). Over
half of the region is suitable for between one and 15 major plant
invaders, and only 2% of the region was predicted to be climati-
cally unsuitable for invasion by any of the major plant invaders.
Plant invaders in Southern Africa
Diversity and Distributions
,
10
, 475–484, © 2004 Blackwell Publishing Ltd
479
The eastern coastal plain and the north-eastern interior are
climatically suitable for most of the currently invading species
(Fig. 4a). However, average climate suitability varies within these
areas. For example, although fewer species can invade the Agul-
has Plain at the southernmost tip of the region, the average
climatic suitability for those species is much higher than for parts of
the Eastern Cape where more species could invade (Fig. 4b). The
low potential number of invaders and average climatic suitability
of the escarpment, Drakensberg and mountains of the Western
Cape (Fig. 4a and b) appears to be primarily due to frequent
frosts and low mean temperatures of the coldest month (second
principal component, Fig. 1b, Table 1) rather than rainfall or
otherwise favourable growing conditions.
Invasion potential of biomes and vegetation types
Vegetation types and biomes differ markedly in their potential
for invasion by the suite of major plant invaders explored in this
study. Relatively few alien plant species can invade the desert and
succulent karoo biomes, whereas more than 15 species could
potentially invade the Albany thicket, forest and grassland
biomes (Table 2). The maximum potential number of major
Figure 2 Species presence observations and climatic suitability derived from climatic envelope models for three characteristic species in South Africa, Lesotho and Swaziland: (a) Acacia mearnsii, a very widespread and abundant invader; (b) Opuntia stricta, a widespread and common invader; and (c) Hakea drupacea, a localized and abundant invader.
Figure 3
(a) Relationship between current geographical range and model accuracy (Kappa statistics) based on climatic envelopes models for 71 major plant invaders in South Africa, Lesotho and Swaziland. Kappa statistics range from 0 (random agreement) to 1 (perfect agreement. Current distribution was derived from the
SAPIA databases based on the QDS where the species was recorded (expressed as a percentage of the region). (b) Relationship between time since introduction and model accuracy (Kappa statistic). Numbers indicate a few representative species: (1)
Schinus terebinthifolius
; (2)
Arundo donax
; (3)
Psidium guajava
; and (4)
Opuntia ficus-indica
.
M. Rouget
et al.
480
Diversity and Distributions
,
10
, 475–484, © 2004 Blackwell Publishing Ltd
plant invaders is relatively similar in all biomes, except for the
desert and succulent karoo, which are suitable for fewer species.
The average climatic suitability is however, fairly similar among
biomes (Table 2).
The average climate suitability and the number of potential
plant invaders per vegetation type are positively correlated
(Fig. 5). In other words, areas of high climatic suitability are also
suitable for many species. There is a direct relationship between
climatic suitability and the number of potential invaders up to an
average climatic suitability of around 65%. Thereafter, there
seems to be very little relationship, indicating that climatic
factors are important, but only below certain threshold values.
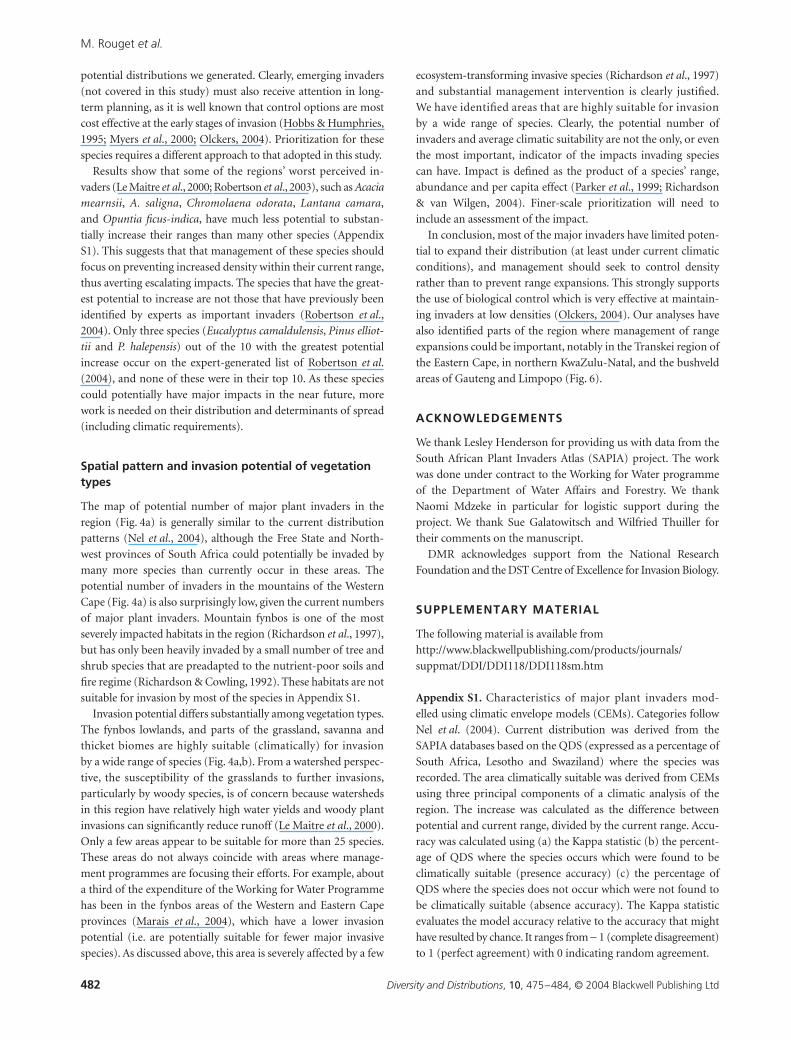
Figure 6 shows the invasion potential for each vegetation type,
classified into four categories based on the potential number of
plant invaders. Just over 20% of the region’s vegetation types are
characterized by very low invasion potential where less than
5 species could invade (Fig. 6); most of this area falls within the
desert and succulent karoo biomes. The second group, character-
ized by low invasion potential (5–15 potential plant invaders),
comprises mainly fynbos, succulent karoo and savanna types, the
third group (5–25 potential plant invaders) mainly fynbos and
grassland types, and the fourth group (more than 25 potential
plant invaders), comprising about 10% of vegetation types (44).
Vegetation types in group 4 occur mainly on the eastern coastal
plains (such as Midlands mistbelt grasslands) and in the north-
ern part of the country (mostly savanna types).
DISCUSSION
Modelling approach
The variant of CEM used in this study allowed us to express
potential distribution as continuous gradients at a 1-minute
Figure 4 Potential number of major plant invaders and their average climatic suitability based on climatic envelope models.
Table 2 Invasion potential summarized in major biomes and habitats (sensu Mucina & Rutherford, 2005). The median number, as well as the range, of plant invaders for which the climatic conditions are suitable is indicated (no. invaders)
Biome/Habitats no. invaders
Biomes
Albany Thicket 19 (1–31)
Desert 2 (0–15)
Forest 17 (0–42)
Fynbos 11 (0–36)
Grassland 20 (0–45)
Nama-Karoo 10 (0–34)
Savanna 15 (0–44)
Succulent Karoo 5 (0–26)
Wetland habitats 10 (0–42) Figure 5 Relationships between average climatic suitability and potential number of major plant invaders for 441 vegetation types of South Africa, Lesotho and Swaziland. Predictions were based on climatic envelope models. Four categories (labelled 1–4 on the figure) were identified based on natural breaks in the frequency distribution of the median number of potential invaders per vegetation type.
Plant invaders in Southern Africa
Diversity and Distributions
,
10
, 475–484, © 2004 Blackwell Publishing Ltd
481
spatial resolution rather than discrete values for quarter-degree
squares. Although downscaling the resolution of data can intro-
duce more uncertainty (Araujo
et al
., 2004), this facilitated an
analysis of invasion potential of biomes and vegetation types.
Such an analysis could not be done using the QDS data from
SAPIA, since many QDS contain more than one biome or
vegetation type.
The major limitation for modelling invasive species is the
assumption that species are at equilibrium with the environ-
ment. Although, most of the species modelled here have a suffi-
ciently long history in the region to have sampled most of the
environmental conditions, their distribution is probably not yet
at equilibrium. Furthermore, current model accuracy techniques
(such as Kappa) might not be appropriate for modelling invasive
species. Low model accuracy (i.e. low Kappa values) could mean
either that the climatic envelope does not capture the environ-
mental determinants of the species distribution, or that the
climate envelope is correct and the species has huge potential
for spreading into suitable environment.
Three main factors are likely to affect the accuracy of our
results. Most importantly, CEMs assume the current distribution
of the species provides a good indication of their potential range.
Where this is not the case, potential range will be over- or under-
estimated. Potential range is likely to be overestimated for species
occurring in few scattered locations throughout the entire
region, but underestimated for species currently occurring in a
small, clumped range. Secondly, spatial bias in the SAPIA data-
base (see Nel
et al
., 2004 for discussion) may have led to under-
estimation of the current and potential distribution of species
that are less conspicuous and/or that are under-represented in
the database for other reasons (e.g. difficult to identify to species
level). Lastly, the process of averaging the climatic suitability
values (based on the principal component scores) of the 225 1-
minute cells per QDS assumes that the mean values represent the
location where the species occurs. The likelihood of there being a
significant error in this assumption depends on the variability of
the climatic factors in the QDS, and will be greater in areas of
complex topography. At the broad scale at which this analysis is
intended to inform management and planning, we do not believe
that any of these factors have a substantial effect on the overall
accuracy or usefulness of the results. More detailed assessments
will, however, be necessary for local decision making.
Potential spread of major and emerging plant invaders
Our study focused on the major plant invaders identified by Nel
et al
. (2004), because they are the invasive species most likely to
be problematic in the medium term, and management of these
species will use most of the available resources. There was also
sufficient data on current distribution of major plant invaders
within the region for us to have reasonable confidence in the
Figure 6 South African biomes and major habitats (a), and invasion potential of vegetation types based on the potential number of major plant invaders (b). Four categories were identified: (1) < 5 potential invaders; (2) 6–15 potential invaders; (3) 16–25 potential invaders; and (4) > 25 potential invaders. South African provincial boundaries, and Lesotho and Swaziland borders are indicated: WC = Western Cape; NC = Northern Cape; EC = Eastern Cape; KZN = KwaZulu-Natal; MP = Mpumalanga; LI = Limpopo; GP = Gauteng; NW = North-west; FS = Free State; LES = Lesotho; and SW = Swaziland.
M. Rouget
et al.
482
Diversity and Distributions
,
10
, 475–484, © 2004 Blackwell Publishing Ltd
potential distributions we generated. Clearly, emerging invaders
(not covered in this study) must also receive attention in long-
term planning, as it is well known that control options are most
cost effective at the early stages of invasion (Hobbs & Humphries,
1995; Myers
et al
., 2000; Olckers, 2004). Prioritization for these
species requires a different approach to that adopted in this study.
Results show that some of the regions’ worst perceived in-
vaders (Le Maitre
et al
., 2000; Robertson
et al
., 2003), such as
Acacia
mearnsii
,
A. saligna
,
Chromolaena odorata
,
Lantana camara
,
and Opuntia ficus-indica, have much less potential to substan-
tially increase their ranges than many other species (Appendix
S1). This suggests that that management of these species should
focus on preventing increased density within their current range,
thus averting escalating impacts. The species that have the great-
est potential to increase are not those that have previously been
identified by experts as important invaders (Robertson et al.,
2004). Only three species (Eucalyptus camaldulensis, Pinus elliot-
tii and P. halepensis) out of the 10 with the greatest potential
increase occur on the expert-generated list of Robertson et al.
(2004), and none of these were in their top 10. As these species
could potentially have major impacts in the near future, more
work is needed on their distribution and determinants of spread
(including climatic requirements).
Spatial pattern and invasion potential of vegetation types
The map of potential number of major plant invaders in the
region (Fig. 4a) is generally similar to the current distribution
patterns (Nel et al., 2004), although the Free State and North-
west provinces of South Africa could potentially be invaded by
many more species than currently occur in these areas. The
potential number of invaders in the mountains of the Western
Cape (Fig. 4a) is also surprisingly low, given the current numbers
of major plant invaders. Mountain fynbos is one of the most
severely impacted habitats in the region (Richardson et al., 1997),
but has only been heavily invaded by a small number of tree and
shrub species that are preadapted to the nutrient-poor soils and
fire regime (Richardson & Cowling, 1992). These habitats are not
suitable for invasion by most of the species in Appendix S1.
Invasion potential differs substantially among vegetation types.
The fynbos lowlands, and parts of the grassland, savanna and
thicket biomes are highly suitable (climatically) for invasion
by a wide range of species (Fig. 4a,b). From a watershed perspec-
tive, the susceptibility of the grasslands to further invasions,
particularly by woody species, is of concern because watersheds
in this region have relatively high water yields and woody plant
invasions can significantly reduce runoff (Le Maitre et al., 2000).
Only a few areas appear to be suitable for more than 25 species.
These areas do not always coincide with areas where manage-
ment programmes are focusing their efforts. For example, about
a third of the expenditure of the Working for Water Programme
has been in the fynbos areas of the Western and Eastern Cape
provinces (Marais et al., 2004), which have a lower invasion
potential (i.e. are potentially suitable for fewer major invasive
species). As discussed above, this area is severely affected by a few
ecosystem-transforming invasive species (Richardson et al., 1997)
and substantial management intervention is clearly justified.
We have identified areas that are highly suitable for invasion
by a wide range of species. Clearly, the potential number of
invaders and average climatic suitability are not the only, or even
the most important, indicator of the impacts invading species
can have. Impact is defined as the product of a species’ range,
abundance and per capita effect (Parker et al., 1999; Richardson
& van Wilgen, 2004). Finer-scale prioritization will need to
include an assessment of the impact.
In conclusion, most of the major invaders have limited poten-
tial to expand their distribution (at least under current climatic
conditions), and management should seek to control density
rather than to prevent range expansions. This strongly supports
the use of biological control which is very effective at maintain-
ing invaders at low densities (Olckers, 2004). Our analyses have
also identified parts of the region where management of range
expansions could be important, notably in the Transkei region of
the Eastern Cape, in northern KwaZulu-Natal, and the bushveld
areas of Gauteng and Limpopo (Fig. 6).
ACKNOWLEDGEMENTS
We thank Lesley Henderson for providing us with data from the
South African Plant Invaders Atlas (SAPIA) project. The work
was done under contract to the Working for Water programme
of the Department of Water Affairs and Forestry. We thank
Naomi Mdzeke in particular for logistic support during the
project. We thank Sue Galatowitsch and Wilfried Thuiller for
their comments on the manuscript.
DMR acknowledges support from the National Research
Foundation and the DST Centre of Excellence for Invasion Biology.
SUPPLEMENTARY MATERIAL
The following material is available from
http://www.blackwellpublishing.com/products/journals/
suppmat/DDI/DDI118/DDI118sm.htm
Appendix S1. Characteristics of major plant invaders mod-
elled using climatic envelope models (CEMs). Categories follow
Nel et al. (2004). Current distribution was derived from the
SAPIA databases based on the QDS (expressed as a percentage of
South Africa, Lesotho and Swaziland) where the species was
recorded. The area climatically suitable was derived from CEMs
using three principal components of a climatic analysis of the
region. The increase was calculated as the difference between
potential and current range, divided by the current range. Accu-
racy was calculated using (a) the Kappa statistic (b) the percent-
age of QDS where the species occurs which were found to be
climatically suitable (presence accuracy) (c) the percentage of
QDS where the species does not occur which were not found to
be climatically suitable (absence accuracy). The Kappa statistic
evaluates the model accuracy relative to the accuracy that might
have resulted by chance. It ranges from − 1 (complete disagreement)
to 1 (perfect agreement) with 0 indicating random agreement.
Plant invaders in Southern Africa
Diversity and Distributions, 10, 475–484, © 2004 Blackwell Publishing Ltd 483
REFERENCES
Araujo, M.B., Thuiller, W., Williams, P.H. & Reginster, I. (2004)
Downscaling European species atlas distributions to a finer
resolution: implications for conservation planning. Global
Ecology and Biogeography, in press.
Austin, M.P., Nicholls, A.O. & Margules, C.R. (1990) Measure-
ment of the realized qualitative niche-environmental niches of
5 eucalyptus species. Ecological Monographs, 60, 161–177.
Busby, J.R. (1991) BIOCLIM — a bioclimatic analysis and predic-
tion system. In: Nature conservation (ed. by C.R. Margules and
M.P. Austin), pp. 64–68. CSIRO, Canberra.
Cohen, J. (1960) A coefficient of agreement of nominal scales.
Educational and Psychological Measurement, 20, 37–46.
Farber, O. & Kadmon, R. (2003) Assessment of alternative
approaches for bioclimatic modelling with special emphasis
on the Mahalanobis distance. Ecological Modelling, 160,
115–130.
Fielding, A.H. & Bell, J.F. (1997) A review of methods for the
assessment of prediction errors in conservation presence/
absence models. Environmental Conservation, 24, 38–49.
Franklin, J. (1995) Predictive vegetation mapping: geographic
modelling of biospatial patterns in relation to environmental
gradients. Progress in Physical Geography, 19, 474–499.
Guisan, A. & Zimmermann, N.E. (2000) Predictive habitat distri-
bution models in ecology. Ecological Modelling, 135, 147–186.
Henderson, L. (1998) Southern African Plant Invaders Atlas
(SAPIA). Applied Plant Science, 12, 31–32.
Henderson, L. (1999) The Southern African Plant Invaders Atlas
(SAPIA) and its contribution to biological weed control.
African Entomology, 1, 159–163.
Henderson, L. (2001) Alien weeds and invasive plants: a complete
guide to declared weeds and invaders in South Africa. ARC-
PPRI, PPRI Handbook no. 12, Pretoria, South Africa.
Hobbs, R.J. (2004) The Working for Water program in South
Africa: the science behind the success. Diversity and Distribu-
tions, 10, 501–503.
Hobbs, R.J. & Humphries, S.E. (1995) An integrated approach to
the ecology and management of plant invasions. Conservation
Biology, 9, 761–770.
Hulme, P.E. (2003) Winning the science battles but losing the
conservation war? Oryx, 37, 178–193.
Le Maitre, D.C., Versfeld, D.B. & Chapman, R.A. (2000) The
impact of invading alien plants on surface water resources
in South Africa: a preliminary assessment. Water SA, 26,
397–408.
Macdonald, I.A.W. (2004) Recent research on alien plant inva-
sions and their management in South Africa: a review of the
inaugural research symposium of the Working for Water
Programme. South African Journal of Science, 100, 21–26.
Macdonald, I.A.W., Kruger, F.J. & Ferrar, A.A., eds. (1986) The
ecology and management of biological invasions in southern
Africa. Oxford University Press, Cape Town.
Mack, R.N., Simberloff, D., Lonsdale, M., Evans, H., Clout, M. &
Bazzaz, F. (2001) Biotic invasions: causes, epidemiology, global
consequences, and control. Ecological Applications, 10, 689–710.
Marais, C., van Wilgen, B.W. & Stevens, D. (2004) The clearing of
invasive alien plants in South Africa: a preliminary assessment of
costs and progress. South African Journal of Science, 100, 97–103.
Mardia, K.V., Kent, J.T. & Bibby, J.M. (1979) Multivariate analy-
sis. Academic Press, London.
Mucina, L. & Rutherford, M.C. (2005) Vegetation map of South
Africa, Lesotho and Swaziland. Strelitzia, in press.
Myers, J.H., Simberloff, D., Kuris, A.M. & Carey, J.K. (2000)
Eradication revisited: dealing with exotic species. Trends in
Ecology and Evolution, 15, 316–320.
Nel, J.L., Richardson, D.M., Rouget, M., Mgidi, T., Mdzeke, N.,
Le Maitre, D.C., van Wilgen, B.W., Schonegevel, L., Henderson,
L. & Neser, S. (2004) A proposed classification of invasive
plant species in South Africa: towards prioritizing species and
areas for management action. South African Journal of Science,
100, 53–64.
Olckers, T. (2004) Targeting emerging weeds for biological con-
trol in South Africa: the benefits of halting the spread of alien
plants at an early stage of their invasion. South African Journal
of Science, 100, 64–68.
Parker, I.M., Simberloff, D., Lonsdale, W.M., Goodell, K.,
Wonham, M., Kareiva, P.M., Williamson, M., von Holle, B.,
Moyle, P.B., Byers, J.E. & Goldwasser, L. (1999) Impact: towards
a framework for understanding the ecological effects of in-
vaders. Biological Invasions, 1, 3–19.
Richardson, D.M. & Bond, W.J. (1991) Determinants of plant
distribution: evidence from pine invasions. American Natural-
ist, 137, 639–668.
Richardson, D.M. & Cowling, R.M. (1992) Why is mountain fyn-
bos invasible and which species invade? Fire in South African
Mountain Fynbos (ed. by B.W. van Wilgen, D.M. Richardson,
F.J. Kruger and H.J. van Hensbergen), pp. 161–181. Springer-
Verlag, Berlin.
Richardson, D.M., Macdonald, I.A.W., Hoffmann, J.H. &
Henderson, L. (1997) Alien plant invasions. In: Vegetation of
Southern Africa (ed. by R.M. Cowling, D.M. Richardson
and S.M. Pierce), pp. 535–570. Cambridge University Press,
Cambridge.
Richardson, D.M. & van Wilgen, B.W. (2004) Invasive alien
plants in South Africa: How well do we understand the ecolog-
ical impacts? South African Journal of Science, 100, 45–52.
Robertson, M.P., Villet, M.H., Fairbanks, D.H.K., Henderson, L.,
Higgins, S.I., Hoffmann, J.H., Le Maitre, D.C., Palmer, A.R.,
Riggs, I., Shackleton, C.M. & Zimmermann, H.G. (2003) A
proposed prioritization system for the management of invasive
alien plants in South Africa. South African Journal of Science,
99, 37–43.
Robertson, M.P., Villet, M.H. & Palmer, A.R. (2004) A fuzzy
classification technique for predicting species’ distributions: an
implementation using alien plants and indigenous insects.
Diversity and Distributions, 10, in press.
Rouget, M. & Richardson, D.M. (2003) Understanding patterns
of plant invasion at different spatial scales: quantifying the
roles of environment and propagule pressure. In: Plant
invasions: ecological threats and management solutions (ed. by
L.E. Child, J.H. Brock, G. Brundu, K. Prach, P. Pysek, P.M. Wade
M. Rouget et al.
484 Diversity and Distributions, 10, 475–484, © 2004 Blackwell Publishing Ltd
and M. Williamson), pp. 3–15. Backhuys Publishers, Leiden,
The Netherlands.
Schulze, R.E., Maharaj, M., Lynch, S.D., Howe, B.J. & Melvil-
Thomson, B. (1997) South African atlas of agrohydrology and
climatology. Water Research Commission, Pretoria.
Van Wilgen, B.W. (2004) Scientific challenges in the field of invasive
alien plant management. South African Journal of Science, 100,
19–20.
Van Wilgen, B.W., Cowling, R.M. & Burgers, C.J. (1996) Valua-
tion of ecosystem services. A case study from South African
fynbos ecosystems. Bioscience, 46, 184–189.
Van Wilgen, B.W., Le Maitre, D.C. & Cowling, R.M. (1998) Ecosystem
services, efficiency, sustainability and equity: South Africa’s
Working for Water programme. Trends in Ecology and Evolu-
tion, 13, 378.
Versfeld, D.B., Le Maitre, D.C. & Chapman, R.A. (1998) Alien
invading plants and water resources in South Africa: a prelimi-
nary assessment. Report no. TT 99/98, Water Research Com-
mission, Pretoria.
Wittenberg, R. & Cock, M.J.W., eds (2001) Invasive alien species:
a toolkit of best prevention and management practices. CAB
International, Wallingford, Oxon, U.K.