mammalian y chromosomes retain widely expressed dosage-sensitive regulators
TRANSCRIPT
ARTICLEdoi:10.1038/nature13206
Mammalian Y chromosomes retain widelyexpressed dosage-sensitive regulatorsDaniel W. Bellott1, Jennifer F. Hughes1, Helen Skaletsky1, Laura G. Brown1, Tatyana Pyntikova1, Ting-Jan Cho1, Natalia Koutseva1,Sara Zaghlul1, Tina Graves2, Susie Rock2, Colin Kremitzki2, Robert S. Fulton2, Shannon Dugan3, Yan Ding3, Donna Morton3,Ziad Khan3, Lora Lewis3, Christian Buhay3, Qiaoyan Wang3, Jennifer Watt3, Michael Holder3, Sandy Lee3, Lynne Nazareth3,Steve Rozen1, Donna M. Muzny3, Wesley C. Warren2, Richard A. Gibbs3, Richard K. Wilson2 & David C. Page1
The human X and Y chromosomes evolved from an ordinary pair of autosomes, but millions of years ago genetic decayravaged the Y chromosome, and only three per cent of its ancestral genes survived. We reconstructed the evolution of theY chromosome across eight mammals to identify biases in gene content and the selective pressures that preserved thesurviving ancestral genes. Our findings indicate that survival was nonrandom, and in two cases, convergent acrossplacental and marsupial mammals. We conclude that the gene content of the Y chromosome became specialized throughselection to maintain the ancestral dosage of homologous X–Ygene pairs that function as broadly expressed regulators oftranscription, translation and protein stability. We propose that beyond its roles in testis determination and spermato-genesis, the Y chromosome is essential for male viability, and has unappreciated roles in Turner’s syndrome and in phe-notypic differences between the sexes in health and disease.
The human X and Y chromosomes evolved from autosomes over thepast 300 million years1. Only 3% of ancestral genes survive on the humanY chromosome2,3, compared to 98% on the X chromosome4. Y-chromosomedecay was initially rapid but has virtually halted over the last 25 millionyears, leaving a stable set of ancestral genes5–7. Mathematical models ofY-chromosome decay assume all ancestral genes are equally likely tosurvive. However, our initial studies of the human Y chromosome sug-gested that its gene content is functionally coherent8, leading us to askwhether mammalian Y chromosomes preferentially retained a subsetof ancestral genes, and, if so, what qualities these surviving genes share.
Our earlier analyses8 of the human Y chromosome were hamperedby limited knowledge of the gene content of the ancestral autosomes.Our recent cross-species comparisons enabled us to reconstruct their genecontent and identify acquired genes on the X and Y chromosomes. Thehuman X chromosome acquired and amplified testis-expressed genefamilies2,4. Similarly, our comparisons of the human, chimpanzee andrhesus Y chromosomes indicated recent acquisition and amplificationof testis-specific genes3,5,6. Thus, both the human X and Y chromosomesgained a specialization for male reproduction by acquiring genes thatwere not present on the ancestral autosomes2–4.
We excluded acquired genes to independently examine ancestral Y-linked genes for characteristics that distinguished surviving genes fromgenes lost to decay. Because the human, chimpanzee and rhesus Y chro-mosomes share nearly identical ancestral gene content, we analysed fiveadditional mammals to enhance our ability to detect biases in the decayand survival of ancestral genes. We produced finished sequence of theancestral portions of the Y chromosomes of marmoset (Callithrix jac-chus), mouse (Mus musculus), rat (Rattus norvegicus), bull (Bos taurus)and opossum (Monodelphis domestica) and compared them to the pub-lished sequences of the human, chimpanzee (Pan trogolodytes) and rhe-sus macaque (Macaca mulatta) Y chromosomes, all eight correspondingX chromosomes and the orthologous chicken (Gallus gallus) autosomesas an outgroup to mammalian X and Y chromosomes. Using this ex-panded tree of species, we reconstructed the evolution of mammalian
Y chromosomes from their origin to the present. We concluded thatsurviving Y-linked genes form a functionally coherent group enrichedfor dosage-sensitive, broadly expressed regulators of transcription, trans-lation and protein stability.
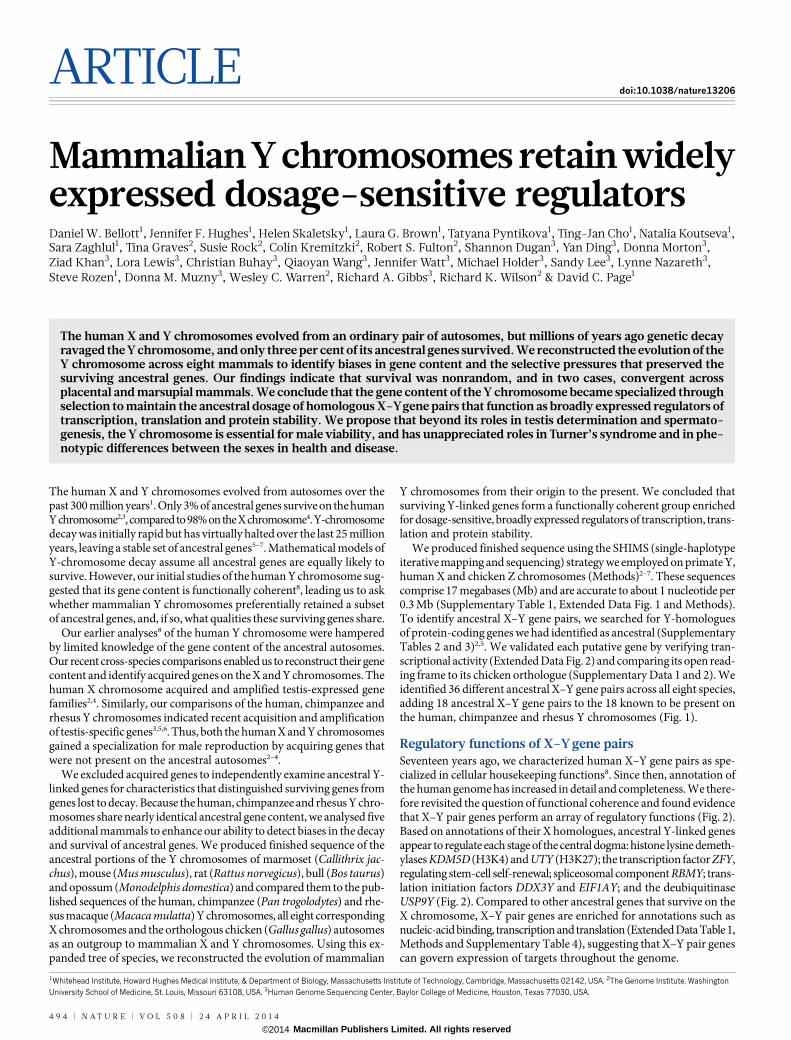
We produced finished sequence using the SHIMS (single-haplotypeiterative mapping and sequencing) strategy we employed on primate Y,human X and chicken Z chromosomes (Methods)2–7. These sequencescomprise 17 megabases (Mb) and are accurate to about 1 nucleotide per0.3 Mb (Supplementary Table 1, Extended Data Fig. 1 and Methods).To identify ancestral X–Y gene pairs, we searched for Y-homologuesof protein-coding genes we had identified as ancestral (SupplementaryTables 2 and 3)2,5. We validated each putative gene by verifying tran-scriptional activity (Extended Data Fig. 2) and comparing its open read-ing frame to its chicken orthologue (Supplementary Data 1 and 2). Weidentified 36 different ancestral X–Y gene pairs across all eight species,adding 18 ancestral X–Y gene pairs to the 18 known to be present onthe human, chimpanzee and rhesus Y chromosomes (Fig. 1).
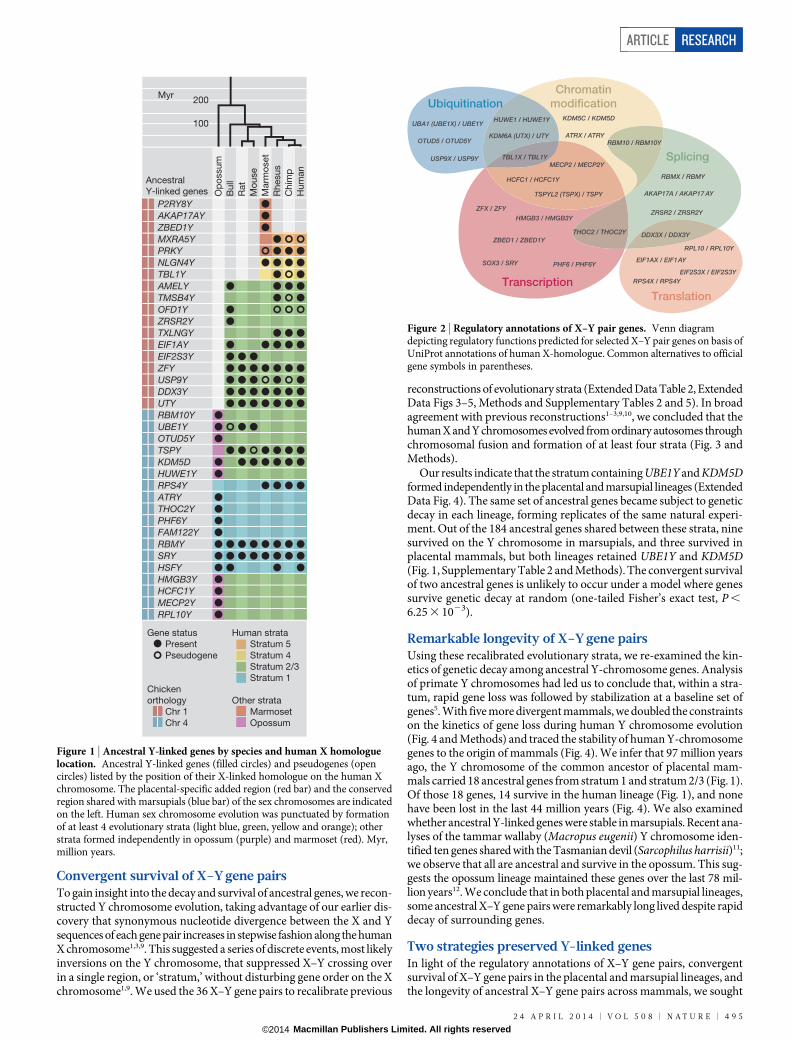
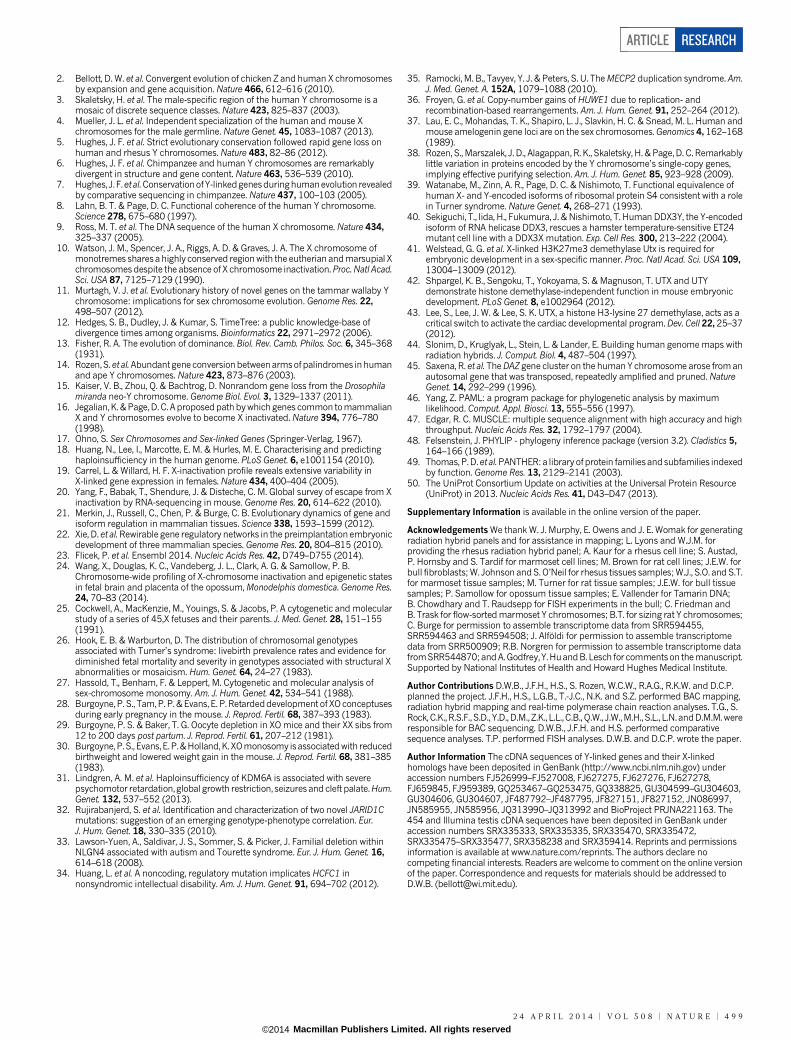
Regulatory functions of X–Y gene pairsSeventeen years ago, we characterized human X–Y gene pairs as spe-cialized in cellular housekeeping functions8. Since then, annotation ofthe human genome has increased in detail and completeness. We there-fore revisited the question of functional coherence and found evidencethat X–Y pair genes perform an array of regulatory functions (Fig. 2).Based on annotations of their X homologues, ancestral Y-linked genesappear to regulate each stage of the central dogma: histone lysine demeth-ylases KDM5D (H3K4) and UTY (H3K27); the transcription factor ZFY,regulating stem-cell self-renewal; spliceosomal component RBMY; trans-lation initiation factors DDX3Y and EIF1AY; and the deubiquitinaseUSP9Y (Fig. 2). Compared to other ancestral genes that survive on theX chromosome, X–Y pair genes are enriched for annotations such asnucleic-acid binding, transcription and translation (Extended Data Table 1,Methods and Supplementary Table 4), suggesting that X–Y pair genescan govern expression of targets throughout the genome.
1Whitehead Institute, Howard Hughes Medical Institute, & Department of Biology, Massachusetts Institute of Technology, Cambridge, Massachusetts 02142, USA. 2The Genome Institute, WashingtonUniversity School of Medicine, St. Louis, Missouri 63108, USA. 3Human Genome Sequencing Center, Baylor College of Medicine, Houston, Texas 77030, USA.
4 9 4 | N A T U R E | V O L 5 0 8 | 2 4 A P R I L 2 0 1 4
Macmillan Publishers Limited. All rights reserved©2014
Convergent survival of X–Y gene pairsTo gain insight into the decay and survival of ancestral genes, we recon-structed Y chromosome evolution, taking advantage of our earlier dis-covery that synonymous nucleotide divergence between the X and Ysequences of each gene pair increases in stepwise fashion along the humanX chromosome1,3,9. This suggested a series of discrete events, most likelyinversions on the Y chromosome, that suppressed X–Y crossing overin a single region, or ‘stratum,’ without disturbing gene order on the Xchromosome1,9. We used the 36 X–Y gene pairs to recalibrate previous
reconstructions of evolutionary strata (Extended Data Table 2, ExtendedData Figs 3–5, Methods and Supplementary Tables 2 and 5). In broadagreement with previous reconstructions1–3,9,10, we concluded that thehuman X and Y chromosomes evolved from ordinary autosomes throughchromosomal fusion and formation of at least four strata (Fig. 3 andMethods).
Our results indicate that the stratum containing UBE1Y and KDM5Dformed independently in the placental and marsupial lineages (ExtendedData Fig. 4). The same set of ancestral genes became subject to geneticdecay in each lineage, forming replicates of the same natural experi-ment. Out of the 184 ancestral genes shared between these strata, ninesurvived on the Y chromosome in marsupials, and three survived inplacental mammals, but both lineages retained UBE1Y and KDM5D(Fig. 1, Supplementary Table 2 and Methods). The convergent survivalof two ancestral genes is unlikely to occur under a model where genessurvive genetic decay at random (one-tailed Fisher’s exact test, P ,6.25 3 1023).
Remarkable longevity of X–Y gene pairsUsing these recalibrated evolutionary strata, we re-examined the kin-etics of genetic decay among ancestral Y-chromosome genes. Analysisof primate Y chromosomes had led us to conclude that, within a stra-tum, rapid gene loss was followed by stabilization at a baseline set ofgenes5. With five more divergent mammals, we doubled the constraintson the kinetics of gene loss during human Y chromosome evolution(Fig. 4 and Methods) and traced the stability of human Y-chromosomegenes to the origin of mammals (Fig. 4). We infer that 97 million yearsago, the Y chromosome of the common ancestor of placental mam-mals carried 18 ancestral genes from stratum 1 and stratum 2/3 (Fig. 1).Of those 18 genes, 14 survive in the human lineage (Fig. 1), and nonehave been lost in the last 44 million years (Fig. 4). We also examinedwhether ancestral Y-linked genes were stable in marsupials. Recent ana-lyses of the tammar wallaby (Macropus eugenii) Y chromosome iden-tified ten genes shared with the Tasmanian devil (Sarcophilus harrisii)11;we observe that all are ancestral and survive in the opossum. This sug-gests the opossum lineage maintained these genes over the last 78 mil-lion years12. We conclude that in both placental and marsupial lineages,some ancestral X–Y gene pairs were remarkably long lived despite rapiddecay of surrounding genes.
Two strategies preserved Y-linked genesIn light of the regulatory annotations of X–Y gene pairs, convergentsurvival of X–Y gene pairs in the placental and marsupial lineages, andthe longevity of ancestral X–Y gene pairs across mammals, we sought
200
100
Myr
Ancestral
Y-linked genes
Human strata
Stratum 5
Stratum 4
Stratum 2/3
Stratum 1
Other strata
Marmoset
Opossum
Gene status
Present
Pseudogene
Chicken
orthology
Chr 1
Chr 4
P2RY8YAKAP17AYZBED1YMXRA5YPRKYNLGN4YTBL1YAMELYTMSB4YOFD1YZRSR2YTXLNGYEIF1AYEIF2S3YZFYUSP9YDDX3YUTYRBM10YUBE1YOTUD5Y
FAM122Y
TSPYKDM5DHUWE1YRPS4YATRYTHOC2YPHF6Y
RBMYSRYHSFYHMGB3YHCFC1YMECP2YRPL10Y
Op
ossu
m
Bu
ll
Rat
Mo
use
Marm
oset
Rh
esu
s
Ch
imp
Hu
man
Figure 1 | Ancestral Y-linked genes by species and human X homologuelocation. Ancestral Y-linked genes (filled circles) and pseudogenes (opencircles) listed by the position of their X-linked homologue on the human Xchromosome. The placental-specific added region (red bar) and the conservedregion shared with marsupials (blue bar) of the sex chromosomes are indicatedon the left. Human sex chromosome evolution was punctuated by formationof at least 4 evolutionary strata (light blue, green, yellow and orange); otherstrata formed independently in opossum (purple) and marmoset (red). Myr,million years.
SOX3 / SRY
RBMX / RBMY
Transcription
Chromatin
modification
Splicing
Translation
Ubiquitination
ZFX / ZFY
DDX3X / DDX3Y
KDM6A (UTX) / UTY
KDM5C / KDM5D
TSPYL2 (TSPX) / TSPY
USP9X / USP9Y
EIF1AX / EIF1AY
RPS4X / RPS4YEIF2S3X / EIF2S3Y
UBA1 (UBE1X) / UBE1Y
ATRX / ATRY
THOC2 / THOC2Y
PHF6 / PHF6Y
RBM10 / RBM10YOTUD5 / OTUD5Y
HUWE1 / HUWE1Y
HMGB3 / HMGB3Y
HCFC1 / HCFC1Y
MECP2 / MECP2Y
RPL10 / RPL10Y
TBL1X / TBL1Y
AKAP17A / AKAP17 AY
ZBED1 / ZBED1Y
ZRSR2 / ZRSR2Y
Figure 2 | Regulatory annotations of X–Y pair genes. Venn diagramdepicting regulatory functions predicted for selected X–Y pair genes on basis ofUniProt annotations of human X-homologue. Common alternatives to officialgene symbols in parentheses.
ARTICLE RESEARCH
2 4 A P R I L 2 0 1 4 | V O L 5 0 8 | N A T U R E | 4 9 5
Macmillan Publishers Limited. All rights reserved©2014
the evolutionary pressures that drove their survival. We had previouslyspeculated that biases in the gene content of the human Y chromosomecould arise through two evolutionary strategies: retention and amp-lification of testis-specific gene families, and conservation of ancestralX–Y gene pairs to maintain comparable expression between males andfemales8. Using the set of 639 ancestral genes reconstructed through cross-species comparisons of the human X chromosome and orthologous chick-en autosomes2,4,5, we tested whether these hypotheses account for the36 ancestral X–Y pair genes found on eight present-day Y chromosomes.
The Y chromosome was predicted to accumulate genes that enhancemale reproductive fitness13, which depends upon sperm production inthe adult testis. In each species we studied, ancestral genes that are ampli-fied into multi-copy families are expressed exclusively or predomi-nantly in the testis (Extended Data Fig. 2). However, many such geneshave broadly expressed single-copy homologues on orthologous chickenautosomes, on mammalian X chromosomes, and in cases like DDX3Y,EIF1AY, UBE1Y and ZFY, on other Y chromosomes (Extended DataFig. 2 and Supplementary Table 2). This suggests that adoption of testis-specific function preceded gene amplification.
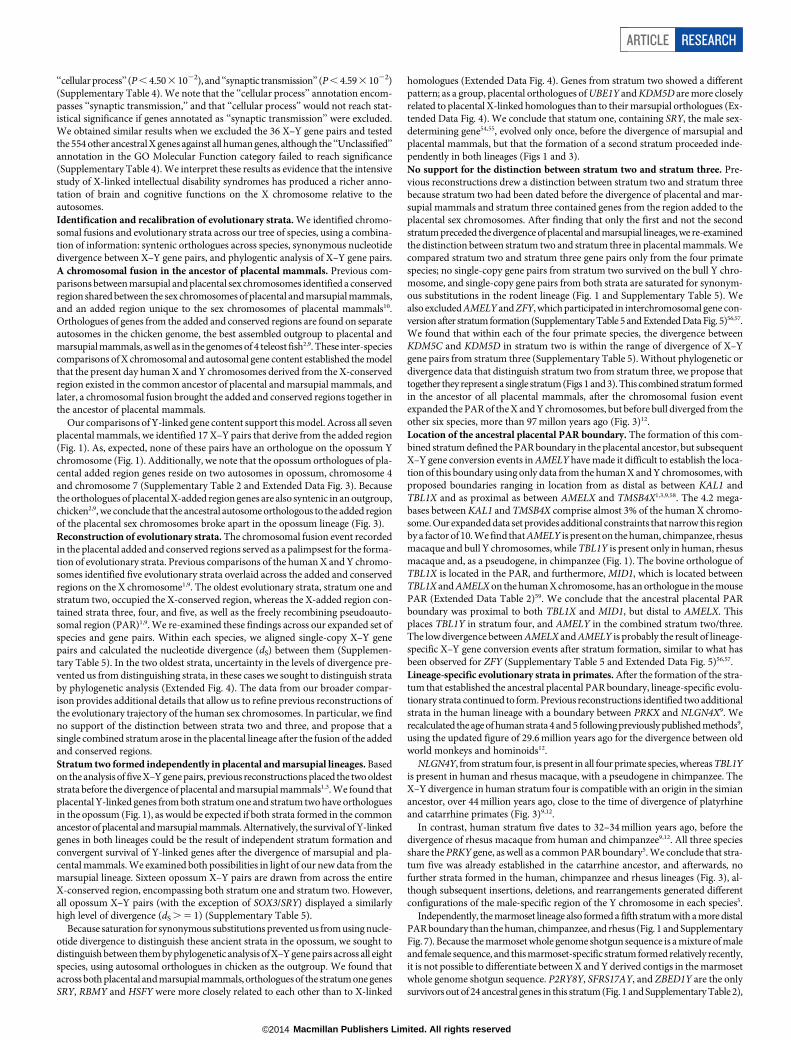
In light of evidence that intrachromosomal gene conversion preservedtestis-specific gene families in primate Y-chromosome palindromes14,we speculated that gene amplification contributed to longevity. We rankedsurviving Y-linked genes by total branch length across our tree of eightspecies (Fig. 5a)12. Genes that are amplified in at least one species havea significantly greater branch length than those that are single copyin every species (one-tailed Mann–Whitney U-test, P , 4.27 3 1025)(Fig. 5a). This correlation remains robust when the opossum lineage,with a large number of unique single-copy genes, is excluded (one-tailedMann–Whitney U-test, P , 5.54 3 1024). Gene families in tandemarrays show high intraspecies identity and interspecies divergence, asign that gene conversion is more frequent than mutation in these struc-tures (Extended Data Fig. 6). Two pairs of Y-linked genes, RPS4Y1and RPS4Y2 in primates and Zfy1 and Zfy2 in mouse, are exceptions.
Both are physically dispersed and show no sign of recent Y–Y geneconversion (Extended Data Fig. 6). We conclude that genes specializedfor male reproduction avoided genetic decay through intrachromoso-mal gene conversion among members of a Y-linked, multi-copy genefamily.
Next, we examined whether single-copy genes on the Y chromo-some survived owing to selection to preserve the correct dosage of broadlyexpressed genes critical to both sexes3,8,15. Most genes on the Y chromo-some were lost to genetic decay, and the X chromosome evolved mech-anisms to compensate for the lost dosage of Y-linked genes in males8,16,17.The Y chromosome might preferentially retain genes for which the tran-sition state of this process, with a non-functional Y-linked gene anda functional but non-dosage-compensated X-linked homologue, wasdisadvantageous. Dosage-sensitive genes functioning in many tissuesand cell types might be particularly sensitive to these pressures15. Were-analysed published data sets for evidence that our set of 36 X–Y pairgenes systematically differ from the 603 other ancestral genes on the Xchromosome with regard to dosage sensitivity18–20, breadth of expression21,22
and intensity of purifying selection23.We examined whether X–Y pair genes show signs of dosage sens-
itivity. In humans, gene-by-gene estimates predict a greater likelihoodof haploinsufficiency18 for ancestral X-linked genes with surviving Yhomologues compared to those lacking Y homologues (one-tailed Mann–Whitney U-test, P , 6.59 3 1023) (Fig. 5b). If surviving X–Y gene pairsmaintain ancestral gene dosage, then X-linked genes with survivingY-linked homologues should escape X inactivation. In human19, mouse20,and opossum24, data on allele-specific expression in females is inform-ative for a subset of ancestral genes (Supplementary Table 2). In eachspecies, a higher proportion of X-linked genes with surviving Y-linkedhomologues escape X-inactivation compared to those without surviv-ing Y-linked homologues (Supplementary Table 2), and X–Y gene pairsin which the X-homologue is subject to X-inactivation have Y-homologuesthat show signs of functional differentiation. In humans, 12 of 14 informative
SRY
MSY
1
XAR/YAR
2/3
4 5
2
2
5
Chicken Opossum Marmoset
A
A
A
A
Y
A
X
A
YX
Chr 1
Chr 4
Chr 7
Chr 4
Genetic sex
determination
Inversion
stratum 1
Fusion
XAR / YAR
Inversion
stratum 2/3
Inversion
stratum 4
Inversion
stratum 5
4497176310
Autosomes
XCR / YCR
Amniote
ancestor
Therian
ancestor
Eutherian
ancestor
Simian
ancestor
Human
Chimpanzee
Rhesus
PAR
PAR
Mouse
and rat
Bull
4
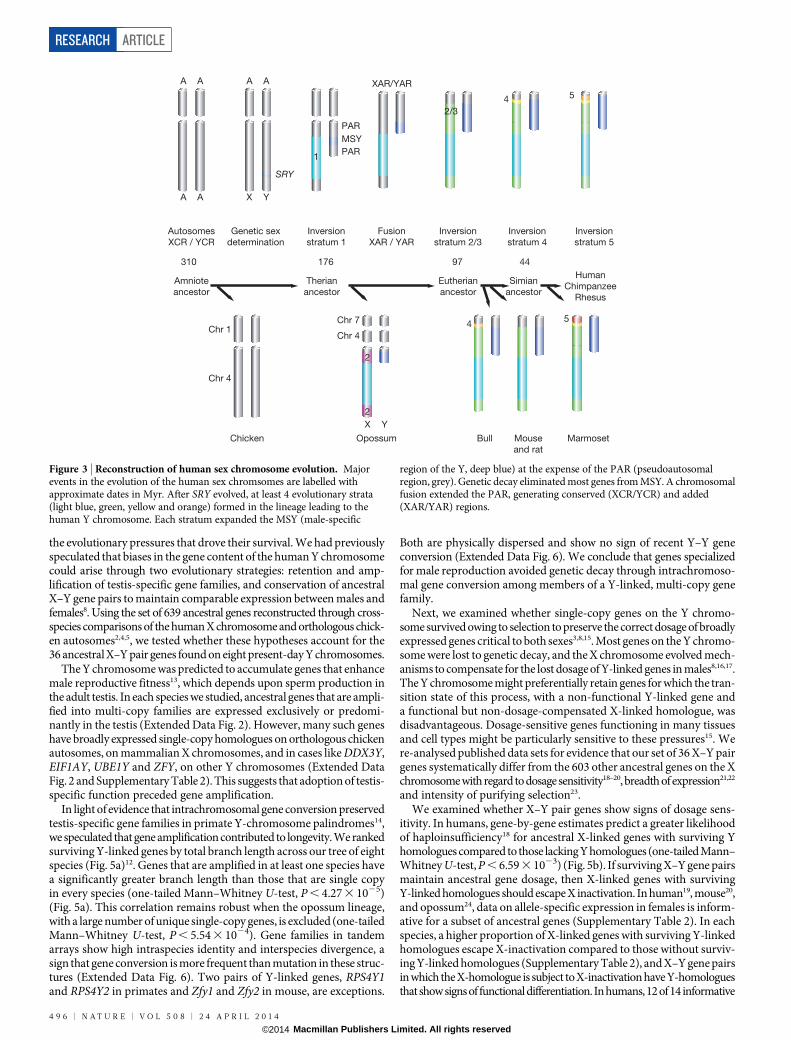
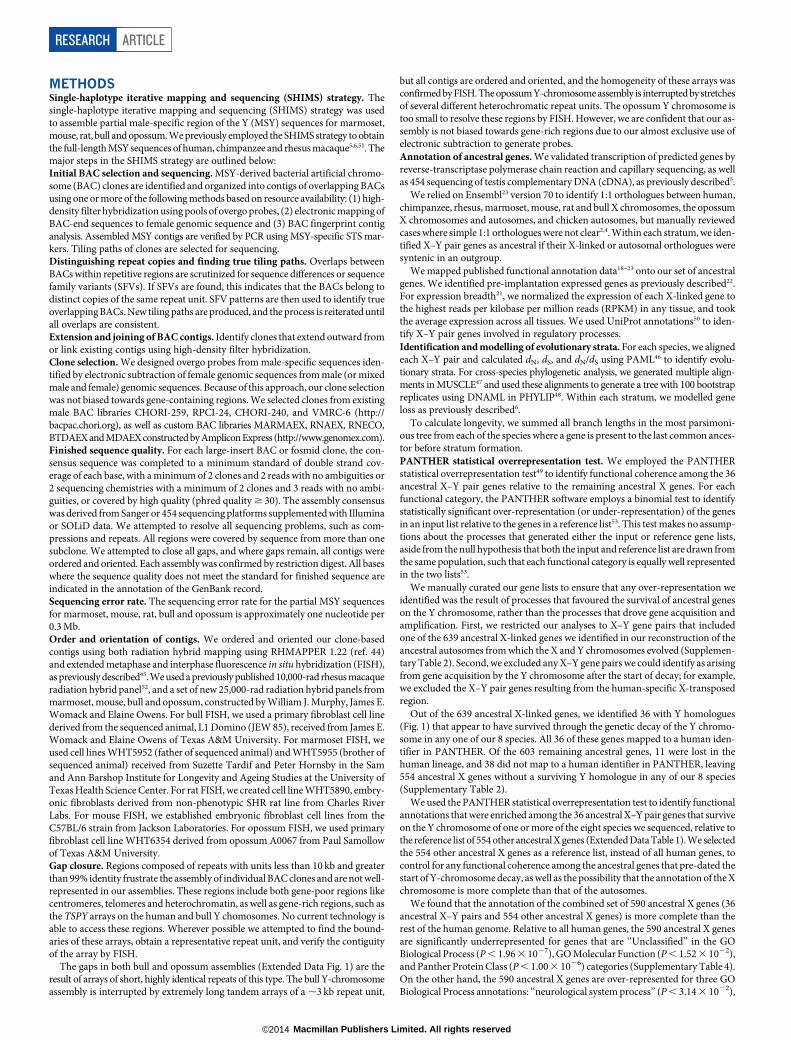
Figure 3 | Reconstruction of human sex chromosome evolution. Majorevents in the evolution of the human sex chromsomes are labelled withapproximate dates in Myr. After SRY evolved, at least 4 evolutionary strata(light blue, green, yellow and orange) formed in the lineage leading to thehuman Y chromosome. Each stratum expanded the MSY (male-specific
region of the Y, deep blue) at the expense of the PAR (pseudoautosomalregion, grey). Genetic decay eliminated most genes from MSY. A chromosomalfusion extended the PAR, generating conserved (XCR/YCR) and added(XAR/YAR) regions.
RESEARCH ARTICLE
4 9 6 | N A T U R E | V O L 5 0 8 | 2 4 A P R I L 2 0 1 4
Macmillan Publishers Limited. All rights reserved©2014
X–Y pair genes escape X inactivation, but only 168 of 385 remainingancestral X genes escape (one-tailed Fisher’s exact test, P , 1.89 3 1023)(Supplementary Table 2). The two exceptions, TSPY and RBMY, areamplified into testis-specific gene families (Extended Data Figs 2 and 6).In mouse, in which X chromosome inactivation is more complete20,four of nine informative X–Y pair genes escape X inactivation, whereasonly five of 344 remaining ancestral genes escape (one-tailed Fisher’sexact test, P , 2.36 3 1025) (Supplementary Table 2). All five exceptions(Sry, Rbmy, Ube1y, Usp9y and Zfy) evolved testis-specific expressionin mouse (Extended Data Fig. 2). Despite differences in the mechan-isms of X inactivation between placental and marsupial mammals, alleight informative opossum X–Y pair genes escape X inactivation, butonly 15 of 138 remaining ancestral genes escape (one-tailed Fisher’s exacttest, P , 1.17 3 1027) (Supplementary Table 2).
The Turner’s syndrome phenotype (classically associated with a 45,X karyotype, or monosomy X) suggests a strict dosage requirement forone or more sex-linked genes in humans. If dosage of X–Y pair genes ispartially responsible for the Turner’s syndrome phenotype, it could explainthe differing features of monosomy X in humans and mice. MonosomyX in humans results in poor in utero viability. Less than 1 in 100 45,X
conceptuses survive to term25,26. Those that do survive are often mosaicfor all or part of a second sex chromosome26,27, so that variability in theTurner’s syndrome phenotype may reflect variability in dosage of X–Ypair genes among tissues as well as individuals. The mouse phenotypeof monosomy X is less severe; animals are small but viable and havereduced fertility28–30. This milder phenotype may reflect a dearth of geneson the mouse X chromosome that require two doses: only nine ances-tral genes survive onthe mouse Y chromosome (compared to 17 in human),and fewer X-linked genes escape inactivation.
Finally, human X-linked intellectual disability syndromes provideevidence for the dosage sensitivity of specific X–Y pair genes. UTX (alsoknown as KMD6A), KDM5C and NLGN4X all have Y homologues, escapeX inactivation, and appear to be haploinsufficient (Supplementary Table 2).Mutations in UTX cause Kabuki syndrome; both duplications and dele-tions result in multiple congenital anomalies and intellectual disabilityin males and females31. KDM5C is associated with X-linked intellec-tual disability in hemizygous males, and heterozygous females with mildintellectual disability have been reported in several families32. In bothhemizygous males and heterozygous females, NLGN4X mutations areassociated with autism spectrum disorders and learning disabilitiesreminiscent of the cognitive and behavioural phenotypes of Turner’ssyndrome33. Even the human X-homologues of X–Y gene pairs iden-tified only in the opossum (HCFC1, HUWE1 and MECP2) still displayacute sensitivity to gene dosage. In humans each of these X-linked geneshas no Y homologue and is subject to X inactivation19 (Supplementary
Nu
mb
ers
of
an
cestr
al g
en
es
Time (Myr BP)
Stratum 1
Stratum 2/3
Stratum 4
Stratum 5
1
10
1
10
100
1
10
100
1,000
325 176 97 91 44 30 601
10
100
1,000
Linear decayExponential decayExponential decay plus a constant baseline
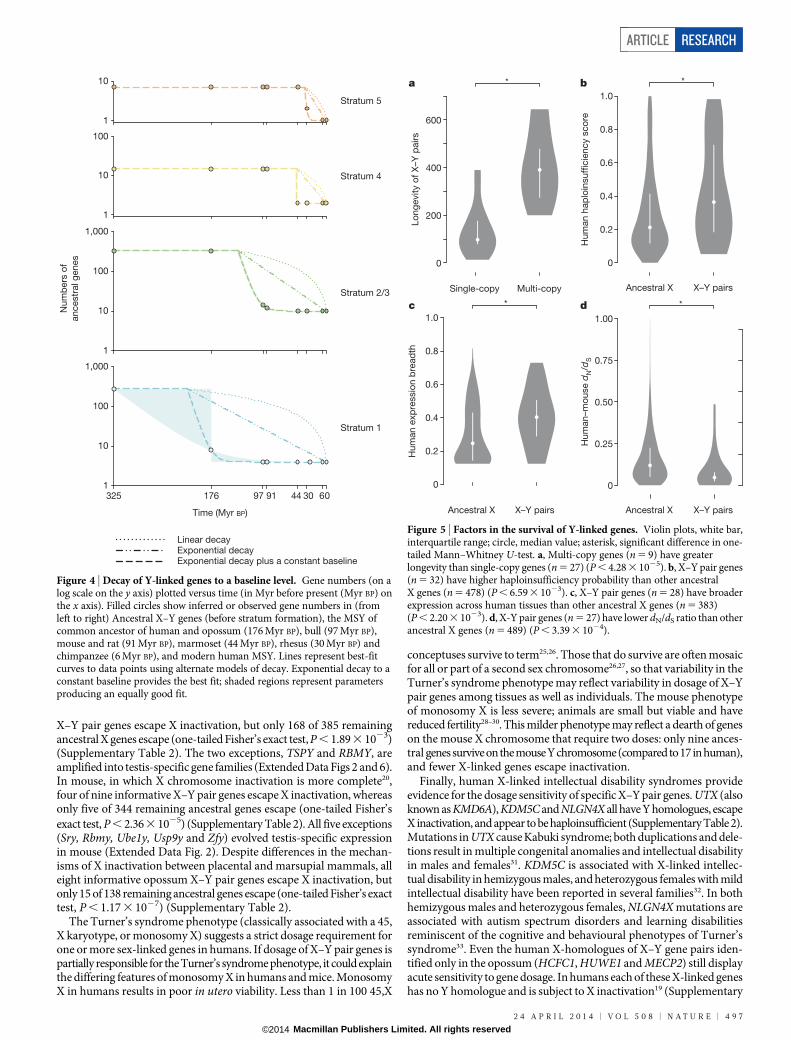
Figure 4 | Decay of Y-linked genes to a baseline level. Gene numbers (on alog scale on the y axis) plotted versus time (in Myr before present (Myr BP) onthe x axis). Filled circles show inferred or observed gene numbers in (fromleft to right) Ancestral X–Y genes (before stratum formation), the MSY ofcommon ancestor of human and opossum (176 Myr BP), bull (97 Myr BP),mouse and rat (91 Myr BP), marmoset (44 Myr BP), rhesus (30 Myr BP) andchimpanzee (6 Myr BP), and modern human MSY. Lines represent best-fitcurves to data points using alternate models of decay. Exponential decay to aconstant baseline provides the best fit; shaded regions represent parametersproducing an equally good fit.
0
0.2
0.4
0.6
0.8
1.0
Ancestral X X–Y pairs
Hu
man
hap
loin
su
fficie
ncy s
co
re
*
0
0.25
0.50
0.75
1.00
Ancestral X X–Y pairs
*
Hum
an–m
ouse d
N/d
S
Single-copy Multi-copy
0
200
400
600
Lo
ng
evity o
f X
–Y
pairs
*
0
0.2
0.4
0.6
0.8
1.0
Ancestral X X–Y pairs
Hum
an e
xp
ressio
n b
read
th
*
a b
c d
Figure 5 | Factors in the survival of Y-linked genes. Violin plots, white bar,interquartile range; circle, median value; asterisk, significant difference in one-tailed Mann–Whitney U-test. a, Multi-copy genes (n 5 9) have greaterlongevity than single-copy genes (n 5 27) (P , 4.28 3 1025). b, X–Y pair genes(n 5 32) have higher haploinsufficiency probability than other ancestralX genes (n 5 478) (P , 6.59 3 1023). c, X–Y pair genes (n 5 28) have broaderexpression across human tissues than other ancestral X genes (n 5 383)(P , 2.20 3 1023). d, X-Y pair genes (n 5 27) have lower dN/dS ratio than otherancestral X genes (n 5 489) (P , 3.39 3 1024).
ARTICLE RESEARCH
2 4 A P R I L 2 0 1 4 | V O L 5 0 8 | N A T U R E | 4 9 7
Macmillan Publishers Limited. All rights reserved©2014
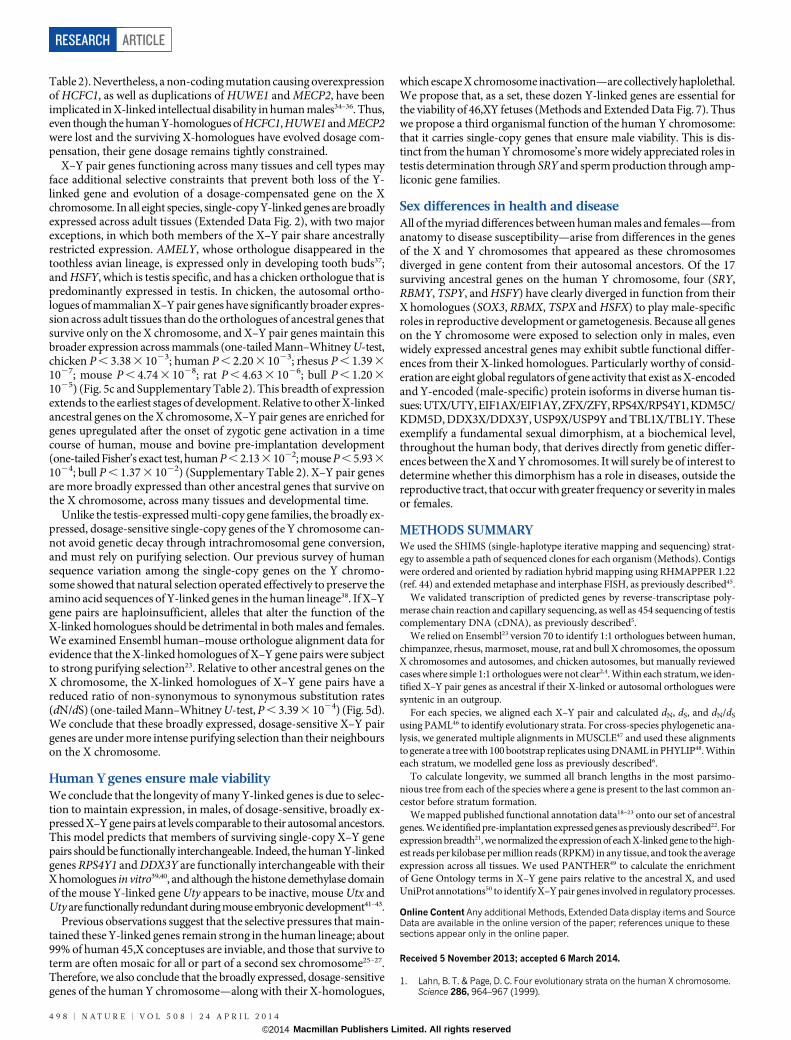
Table 2). Nevertheless, a non-coding mutation causing overexpressionof HCFC1, as well as duplications of HUWE1 and MECP2, have beenimplicated in X-linked intellectual disability in human males34–36. Thus,even though the human Y-homologues of HCFC1, HUWE1 and MECP2were lost and the surviving X-homologues have evolved dosage com-pensation, their gene dosage remains tightly constrained.
X–Y pair genes functioning across many tissues and cell types mayface additional selective constraints that prevent both loss of the Y-linked gene and evolution of a dosage-compensated gene on the Xchromosome. In all eight species, single-copy Y-linked genes are broadlyexpressed across adult tissues (Extended Data Fig. 2), with two majorexceptions, in which both members of the X–Y pair share ancestrallyrestricted expression. AMELY, whose orthologue disappeared in thetoothless avian lineage, is expressed only in developing tooth buds37;and HSFY, which is testis specific, and has a chicken orthologue that ispredominantly expressed in testis. In chicken, the autosomal ortho-logues of mammalian X–Y pair genes have significantly broader expres-sion across adult tissues than do the orthologues of ancestral genes thatsurvive only on the X chromosome, and X–Y pair genes maintain thisbroader expression across mammals (one-tailed Mann–Whitney U-test,chicken P , 3.38 3 1023; human P , 2.20 3 1023; rhesus P , 1.39 3
1027; mouse P , 4.74 3 1028; rat P , 4.63 3 1026; bull P , 1.20 3
1025) (Fig. 5c and Supplementary Table 2). This breadth of expressionextends to the earliest stages of development. Relative to other X-linkedancestral genes on the X chromosome, X–Y pair genes are enriched forgenes upregulated after the onset of zygotic gene activation in a timecourse of human, mouse and bovine pre-implantation development(one-tailed Fisher’s exact test, human P , 2.133 1022; mouse P , 5.933
1024; bull P , 1.37 3 1022) (Supplementary Table 2). X–Y pair genesare more broadly expressed than other ancestral genes that survive onthe X chromosome, across many tissues and developmental time.
Unlike the testis-expressed multi-copy gene families, the broadly ex-pressed, dosage-sensitive single-copy genes of the Y chromosome can-not avoid genetic decay through intrachromosomal gene conversion,and must rely on purifying selection. Our previous survey of humansequence variation among the single-copy genes on the Y chromo-some showed that natural selection operated effectively to preserve theamino acid sequences of Y-linked genes in the human lineage38. If X–Ygene pairs are haploinsufficient, alleles that alter the function of theX-linked homologues should be detrimental in both males and females.We examined Ensembl human–mouse orthologue alignment data forevidence that the X-linked homologues of X–Y gene pairs were subjectto strong purifying selection23. Relative to other ancestral genes on theX chromosome, the X-linked homologues of X–Y gene pairs have areduced ratio of non-synonymous to synonymous substitution rates(dN/dS) (one-tailed Mann–Whitney U-test, P , 3.39 3 1024) (Fig. 5d).We conclude that these broadly expressed, dosage-sensitive X–Y pairgenes are under more intense purifying selection than their neighbourson the X chromosome.
Human Y genes ensure male viabilityWe conclude that the longevity of many Y-linked genes is due to selec-tion to maintain expression, in males, of dosage-sensitive, broadly ex-pressed X–Y gene pairs at levels comparable to their autosomal ancestors.This model predicts that members of surviving single-copy X–Y genepairs should be functionally interchangeable. Indeed, the human Y-linkedgenes RPS4Y1 and DDX3Y are functionally interchangeable with theirX homologues in vitro39,40, and although the histone demethylase domainof the mouse Y-linked gene Uty appears to be inactive, mouse Utx andUty are functionally redundant during mouse embryonic development41–43.
Previous observations suggest that the selective pressures that main-tained these Y-linked genes remain strong in the human lineage; about99% of human 45,X conceptuses are inviable, and those that survive toterm are often mosaic for all or part of a second sex chromosome25–27.Therefore, we also conclude that the broadly expressed, dosage-sensitivegenes of the human Y chromosome—along with their X-homologues,
which escape X chromosome inactivation—are collectively haplolethal.We propose that, as a set, these dozen Y-linked genes are essential forthe viability of 46,XY fetuses (Methods and Extended Data Fig. 7). Thuswe propose a third organismal function of the human Y chromosome:that it carries single-copy genes that ensure male viability. This is dis-tinct from the human Y chromosome’s more widely appreciated roles intestis determination through SRY and sperm production through amp-liconic gene families.
Sex differences in health and diseaseAll of the myriad differences between human males and females—fromanatomy to disease susceptibility—arise from differences in the genesof the X and Y chromosomes that appeared as these chromosomesdiverged in gene content from their autosomal ancestors. Of the 17surviving ancestral genes on the human Y chromosome, four (SRY,RBMY, TSPY, and HSFY) have clearly diverged in function from theirX homologues (SOX3, RBMX, TSPX and HSFX) to play male-specificroles in reproductive development or gametogenesis. Because all geneson the Y chromosome were exposed to selection only in males, evenwidely expressed ancestral genes may exhibit subtle functional differ-ences from their X-linked homologues. Particularly worthy of consid-eration are eight global regulators of gene activity that exist as X-encodedand Y-encoded (male-specific) protein isoforms in diverse human tis-sues: UTX/UTY, EIF1AX/EIF1AY, ZFX/ZFY, RPS4X/RPS4Y1, KDM5C/KDM5D, DDX3X/DDX3Y, USP9X/USP9Y and TBL1X/TBL1Y. Theseexemplify a fundamental sexual dimorphism, at a biochemical level,throughout the human body, that derives directly from genetic differ-ences between the X and Y chromosomes. It will surely be of interest todetermine whether this dimorphism has a role in diseases, outside thereproductive tract, that occur with greater frequency or severity in malesor females.
METHODS SUMMARYWe used the SHIMS (single-haplotype iterative mapping and sequencing) strat-egy to assemble a path of sequenced clones for each organism (Methods). Contigswere ordered and oriented by radiation hybrid mapping using RHMAPPER 1.22(ref. 44) and extended metaphase and interphase FISH, as previously described45.
We validated transcription of predicted genes by reverse-transcriptase poly-merase chain reaction and capillary sequencing, as well as 454 sequencing of testiscomplementary DNA (cDNA), as previously described5.
We relied on Ensembl23 version 70 to identify 1:1 orthologues between human,chimpanzee, rhesus, marmoset, mouse, rat and bull X chromosomes, the opossumX chromosomes and autosomes, and chicken autosomes, but manually reviewedcases where simple 1:1 orthologues were not clear2,4. Within each stratum, we iden-tified X–Y pair genes as ancestral if their X-linked or autosomal orthologues weresyntenic in an outgroup.
For each species, we aligned each X–Y pair and calculated dN, dS, and dN/dS
using PAML46 to identify evolutionary strata. For cross-species phylogenetic ana-lysis, we generated multiple alignments in MUSCLE47 and used these alignmentsto generate a tree with 100 bootstrap replicates using DNAML in PHYLIP48. Withineach stratum, we modelled gene loss as previously described6.
To calculate longevity, we summed all branch lengths in the most parsimo-nious tree from each of the species where a gene is present to the last common an-cestor before stratum formation.
We mapped published functional annotation data18–23 onto our set of ancestralgenes. We identified pre-implantation expressed genes as previously described22. Forexpression breadth21, we normalized the expression of each X-linked gene to the high-est reads per kilobase per million reads (RPKM) in any tissue, and took the averageexpression across all tissues. We used PANTHER49 to calculate the enrichmentof Gene Ontology terms in X–Y gene pairs relative to the ancestral X, and usedUniProt annotations50 to identify X–Y pair genes involved in regulatory processes.
Online Content Any additional Methods, Extended Data display items and SourceData are available in the online version of the paper; references unique to thesesections appear only in the online paper.
Received 5 November 2013; accepted 6 March 2014.
1. Lahn, B. T. & Page, D. C. Four evolutionary strata on the human X chromosome.Science 286, 964–967 (1999).
RESEARCH ARTICLE
4 9 8 | N A T U R E | V O L 5 0 8 | 2 4 A P R I L 2 0 1 4
Macmillan Publishers Limited. All rights reserved©2014
2. Bellott, D. W. et al. Convergent evolution of chicken Z and human X chromosomesby expansion and gene acquisition. Nature 466, 612–616 (2010).
3. Skaletsky, H. et al. The male-specific region of the human Y chromosome is amosaic of discrete sequence classes. Nature 423, 825–837 (2003).
4. Mueller, J. L. et al. Independent specialization of the human and mouse Xchromosomes for the male germline. Nature Genet. 45, 1083–1087 (2013).
5. Hughes, J. F. et al. Strict evolutionary conservation followed rapid gene loss onhuman and rhesus Y chromosomes. Nature 483, 82–86 (2012).
6. Hughes, J. F. et al. Chimpanzee and human Y chromosomes are remarkablydivergent in structure and gene content. Nature 463, 536–539 (2010).
7. Hughes, J. F.et al.ConservationofY-linkedgenesduringhumanevolution revealedby comparative sequencing in chimpanzee. Nature 437, 100–103 (2005).
8. Lahn, B. T. & Page, D. C. Functional coherence of the human Y chromosome.Science 278, 675–680 (1997).
9. Ross, M. T. et al. The DNA sequence of the human X chromosome. Nature 434,325–337 (2005).
10. Watson, J. M., Spencer, J. A., Riggs, A. D. & Graves, J. A. The X chromosome ofmonotremes shares a highly conserved region with the eutherian and marsupial Xchromosomes despite the absence of X chromosome inactivation. Proc. Natl Acad.Sci. USA 87, 7125–7129 (1990).
11. Murtagh, V. J. et al. Evolutionary history of novel genes on the tammar wallaby Ychromosome: implications for sex chromosome evolution. Genome Res. 22,498–507 (2012).
12. Hedges, S. B., Dudley, J. & Kumar, S. TimeTree: a public knowledge-base ofdivergence times among organisms. Bioinformatics 22, 2971–2972 (2006).
13. Fisher, R. A. The evolution of dominance. Biol. Rev. Camb. Philos. Soc. 6, 345–368(1931).
14. Rozen, S. et al. Abundantgene conversion between armsof palindromes inhumanand ape Y chromosomes. Nature 423, 873–876 (2003).
15. Kaiser, V. B., Zhou, Q. & Bachtrog, D. Nonrandom gene loss from the Drosophilamiranda neo-Y chromosome. Genome Biol. Evol. 3, 1329–1337 (2011).
16. Jegalian, K. & Page, D. C. A proposed path by which genes common to mammalianX and Y chromosomes evolve to become X inactivated. Nature 394, 776–780(1998).
17. Ohno, S. Sex Chromosomes and Sex-linked Genes (Springer-Verlag, 1967).18. Huang, N., Lee, I., Marcotte, E. M. & Hurles, M. E. Characterising and predicting
haploinsufficiency in the human genome. PLoS Genet. 6, e1001154 (2010).19. Carrel, L. & Willard, H. F. X-inactivation profile reveals extensive variability in
X-linked gene expression in females. Nature 434, 400–404 (2005).20. Yang, F., Babak, T., Shendure, J. & Disteche, C. M. Global survey of escape from X
inactivation by RNA-sequencing in mouse. Genome Res. 20, 614–622 (2010).21. Merkin, J., Russell, C., Chen, P. & Burge, C. B. Evolutionary dynamics of gene and
isoform regulation in mammalian tissues. Science 338, 1593–1599 (2012).22. Xie, D. et al. Rewirable gene regulatory networks in the preimplantation embryonic
development of three mammalian species. Genome Res. 20, 804–815 (2010).23. Flicek, P. et al. Ensembl 2014. Nucleic Acids Res. 42, D749–D755 (2014).24. Wang, X., Douglas, K. C., Vandeberg, J. L., Clark, A. G. & Samollow, P. B.
Chromosome-wide profiling of X-chromosome inactivation and epigenetic statesin fetal brain and placenta of the opossum, Monodelphis domestica. Genome Res.24, 70–83 (2014).
25. Cockwell, A., MacKenzie, M., Youings, S. & Jacobs, P. A cytogenetic and molecularstudy of a series of 45,X fetuses and their parents. J. Med. Genet. 28, 151–155(1991).
26. Hook, E. B. & Warburton, D. The distribution of chromosomal genotypesassociated with Turner’s syndrome: livebirth prevalence rates and evidence fordiminished fetal mortality and severity in genotypes associated with structural Xabnormalities or mosaicism. Hum. Genet. 64, 24–27 (1983).
27. Hassold, T., Benham, F. & Leppert, M. Cytogenetic and molecular analysis ofsex-chromosome monosomy. Am. J. Hum. Genet. 42, 534–541 (1988).
28. Burgoyne, P. S., Tam, P. P. & Evans, E. P. Retarded development of XO conceptusesduring early pregnancy in the mouse. J. Reprod. Fertil. 68, 387–393 (1983).
29. Burgoyne, P. S. & Baker, T. G. Oocyte depletion in XO mice and their XX sibs from12 to 200 days post partum. J. Reprod. Fertil. 61, 207–212 (1981).
30. Burgoyne,P.S., Evans, E. P.& Holland, K.XOmonosomy isassociatedwith reducedbirthweight and lowered weight gain in the mouse. J. Reprod. Fertil. 68, 381–385(1983).
31. Lindgren, A. M. et al. Haploinsufficiency of KDM6A is associated with severepsychomotor retardation, global growth restriction, seizures and cleft palate. Hum.Genet. 132, 537–552 (2013).
32. Rujirabanjerd, S. et al. Identification and characterization of two novel JARID1Cmutations: suggestion of an emerging genotype-phenotype correlation. Eur.J. Hum. Genet. 18, 330–335 (2010).
33. Lawson-Yuen, A., Saldivar, J. S., Sommer, S. & Picker, J. Familial deletion withinNLGN4 associated with autism and Tourette syndrome. Eur. J. Hum. Genet. 16,614–618 (2008).
34. Huang, L. et al. A noncoding, regulatory mutation implicates HCFC1 innonsyndromic intellectual disability. Am. J. Hum. Genet. 91, 694–702 (2012).
35. Ramocki, M. B., Tavyev, Y. J. & Peters, S. U. The MECP2 duplication syndrome. Am.J. Med. Genet. A. 152A, 1079–1088 (2010).
36. Froyen, G. et al. Copy-number gains of HUWE1 due to replication- andrecombination-based rearrangements. Am. J. Hum. Genet. 91, 252–264 (2012).
37. Lau, E. C., Mohandas, T. K., Shapiro, L. J., Slavkin, H. C. & Snead, M. L. Human andmouse amelogenin gene loci are on the sex chromosomes. Genomics 4, 162–168(1989).
38. Rozen, S., Marszalek, J. D., Alagappan, R. K., Skaletsky, H. & Page, D. C. Remarkablylittle variation in proteins encoded by the Y chromosome’s single-copy genes,implying effective purifying selection. Am. J. Hum. Genet. 85, 923–928 (2009).
39. Watanabe, M., Zinn, A. R., Page, D. C. & Nishimoto, T. Functional equivalence ofhuman X- and Y-encoded isoforms of ribosomal protein S4 consistent with a rolein Turner syndrome. Nature Genet. 4, 268–271 (1993).
40. Sekiguchi, T., Iida, H., Fukumura, J. & Nishimoto, T. Human DDX3Y, the Y-encodedisoform of RNA helicase DDX3, rescues a hamster temperature-sensitive ET24mutant cell line with a DDX3X mutation. Exp. Cell Res. 300, 213–222 (2004).
41. Welstead, G. G. et al. X-linked H3K27me3 demethylase Utx is required forembryonic development in a sex-specific manner. Proc. Natl Acad. Sci. USA 109,13004–13009 (2012).
42. Shpargel, K. B., Sengoku, T., Yokoyama, S. & Magnuson, T. UTX and UTYdemonstrate histone demethylase-independent function in mouse embryonicdevelopment. PLoS Genet. 8, e1002964 (2012).
43. Lee, S., Lee, J. W. & Lee, S. K. UTX, a histone H3-lysine 27 demethylase, acts as acritical switch to activate the cardiac developmental program. Dev. Cell 22, 25–37(2012).
44. Slonim, D., Kruglyak, L., Stein, L. & Lander, E. Building human genome maps withradiation hybrids. J. Comput. Biol. 4, 487–504 (1997).
45. Saxena, R. et al. The DAZ gene cluster on the human Y chromosome arose from anautosomal gene that was transposed, repeatedly amplified and pruned. NatureGenet. 14, 292–299 (1996).
46. Yang, Z. PAML: a program package for phylogenetic analysis by maximumlikelihood. Comput. Appl. Biosci. 13, 555–556 (1997).
47. Edgar, R. C. MUSCLE: multiple sequence alignment with high accuracy and highthroughput. Nucleic Acids Res. 32, 1792–1797 (2004).
48. Felsenstein, J. PHYLIP - phylogeny inference package (version 3.2). Cladistics 5,164–166 (1989).
49. Thomas, P.D. et al. PANTHER: a library of protein families andsubfamilies indexedby function. Genome Res. 13, 2129–2141 (2003).
50. The UniProt Consortium Update on activities at the Universal Protein Resource(UniProt) in 2013. Nucleic Acids Res. 41, D43–D47 (2013).
Supplementary Information is available in the online version of the paper.
Acknowledgements We thank W. J. Murphy, E. Owens and J. E. Womak for generatingradiation hybrid panels and for assistance in mapping; L. Lyons and W.J.M. forproviding the rhesus radiation hybrid panel; A. Kaur for a rhesus cell line; S. Austad,P. Hornsby and S. Tardif for marmoset cell lines; M. Brown for rat cell lines; J.E.W. forbull fibroblasts; W. Johnson and S. O’Neil for rhesus tissues samples; W.J., S.O. and S.T.for marmoset tissue samples; M. Turner for rat tissue samples; J.E.W. for bull tissuesamples; P. Samollow for opossum tissue samples; E. Vallender for Tamarin DNA;B. Chowdhary and T. Raudsepp for FISH experiments in the bull; C. Friedman andB. Trask for flow-sorted marmoset Y chromosomes; B.T. for sizing rat Y chromosomes;C. Burge for permission to assemble transcriptome data from SRR594455,SRR594463 and SRR594508; J. Alfoldi for permission to assemble transcriptomedata from SRR500909; R.B. Norgren for permission to assemble transcriptome datafromSRR544870;and A. Godfrey,Y.Huand B. Lesch for commentson the manuscript.Supported by National Institutes of Health and Howard Hughes Medical Institute.
Author Contributions D.W.B., J.F.H., H.S., S. Rozen, W.C.W., R.A.G., R.K.W. and D.C.P.planned the project. J.F.H., H.S., L.G.B., T.-J.C., N.K. and S.Z. performed BAC mapping,radiation hybrid mapping and real-time polymerase chain reaction analyses. T.G., S.Rock, C.K., R.S.F., S.D., Y.D., D.M., Z.K., L.L., C.B., Q.W., J.W., M.H., S.L., L.N. andD.M.M. wereresponsible for BAC sequencing. D.W.B., J.F.H. and H.S. performed comparativesequence analyses. T.P. performed FISH analyses. D.W.B. and D.C.P. wrote the paper.
Author Information The cDNA sequences of Y-linked genes and their X-linkedhomologs have been deposited in GenBank (http://www.ncbi.nlm.nih.gov) underaccession numbers FJ526999–FJ527008, FJ627275, FJ627276, FJ627278,FJ659845, FJ959389, GQ253467–GQ253475, GQ338825, GU304599–GU304603,GU304606, GU304607, JF487792–JF487795, JF827151, JF827152, JN086997,JN585955, JN585956, JQ313990–JQ313992 and BioProject PRJNA221163. The454 and Illumina testis cDNA sequences have been deposited in GenBank underaccession numbers SRX335333, SRX335335, SRX335470, SRX335472,SRX335475–SRX335477, SRX358238 and SRX359414. Reprints and permissionsinformation is available at www.nature.com/reprints. The authors declare nocompeting financial interests. Readers are welcome to comment on the online versionof the paper. Correspondence and requests for materials should be addressed toD.W.B. ([email protected]).
ARTICLE RESEARCH
2 4 A P R I L 2 0 1 4 | V O L 5 0 8 | N A T U R E | 4 9 9
Macmillan Publishers Limited. All rights reserved©2014
METHODSSingle-haplotype iterative mapping and sequencing (SHIMS) strategy. Thesingle-haplotype iterative mapping and sequencing (SHIMS) strategy was usedto assemble partial male-specific region of the Y (MSY) sequences for marmoset,mouse, rat, bull and opossum. We previously employed the SHIMS strategy to obtainthe full-length MSY sequences of human, chimpanzee and rhesus macaque5,6,51. Themajor steps in the SHIMS strategy are outlined below:Initial BAC selection and sequencing. MSY-derived bacterial artificial chromo-some (BAC) clones are identified and organized into contigs of overlapping BACsusing one or more of the following methods based on resource availability: (1) high-density filter hybridization using pools of overgo probes, (2) electronic mapping ofBAC-end sequences to female genomic sequence and (3) BAC fingerprint contiganalysis. Assembled MSY contigs are verified by PCR using MSY-specific STS mar-kers. Tiling paths of clones are selected for sequencing.Distinguishing repeat copies and finding true tiling paths. Overlaps betweenBACs within repetitive regions are scrutinized for sequence differences or sequencefamily variants (SFVs). If SFVs are found, this indicates that the BACs belong todistinct copies of the same repeat unit. SFV patterns are then used to identify trueoverlapping BACs. New tiling paths are produced, and the process is reiterated untilall overlaps are consistent.Extension and joining of BAC contigs. Identify clones that extend outward fromor link existing contigs using high-density filter hybridization.Clone selection. We designed overgo probes from male-specific sequences iden-tified by electronic subtraction of female genomic sequences from male (or mixedmale and female) genomic sequences. Because of this approach, our clone selectionwas not biased towards gene-containing regions. We selected clones from existingmale BAC libraries CHORI-259, RPCI-24, CHORI-240, and VMRC-6 (http://bacpac.chori.org), as well as custom BAC libraries MARMAEX, RNAEX, RNECO,BTDAEX and MDAEX constructed by Amplicon Express (http://www.genomex.com).Finished sequence quality. For each large-insert BAC or fosmid clone, the con-sensus sequence was completed to a minimum standard of double strand cov-erage of each base, with a minimum of 2 clones and 2 reads with no ambiguities or2 sequencing chemistries with a minimum of 2 clones and 3 reads with no ambi-guities, or covered by high quality (phred quality $ 30). The assembly consensuswas derived from Sanger or 454 sequencing platforms supplemented with Illuminaor SOLiD data. We attempted to resolve all sequencing problems, such as com-pressions and repeats. All regions were covered by sequence from more than onesubclone. We attempted to close all gaps, and where gaps remain, all contigs wereordered and oriented. Each assembly was confirmed by restriction digest. All baseswhere the sequence quality does not meet the standard for finished sequence areindicated in the annotation of the GenBank record.Sequencing error rate. The sequencing error rate for the partial MSY sequencesfor marmoset, mouse, rat, bull and opossum is approximately one nucleotide per0.3 Mb.Order and orientation of contigs. We ordered and oriented our clone-basedcontigs using both radiation hybrid mapping using RHMAPPER 1.22 (ref. 44)and extended metaphase and interphase fluorescence in situ hybridization (FISH),as previously described45. We used a previously published 10,000-rad rhesus macaqueradiation hybrid panel52, and a set of new 25,000-rad radiation hybrid panels frommarmoset, mouse, bull and opossum, constructed by William J. Murphy, James E.Womack and Elaine Owens. For bull FISH, we used a primary fibroblast cell linederived from the sequenced animal, L1 Domino (JEW 85), received from James E.Womack and Elaine Owens of Texas A&M University. For marmoset FISH, weused cell lines WHT5952 (father of sequenced animal) and WHT5955 (brother ofsequenced animal) received from Suzette Tardif and Peter Hornsby in the Samand Ann Barshop Institute for Longevity and Ageing Studies at the University ofTexas Health Science Center. For rat FISH, we created cell line WHT5890, embry-onic fibroblasts derived from non-phenotypic SHR rat line from Charles RiverLabs. For mouse FISH, we established embryonic fibroblast cell lines from theC57BL/6 strain from Jackson Laboratories. For opossum FISH, we used primaryfibroblast cell line WHT6354 derived from opossum A0067 from Paul Samollowof Texas A&M University.Gap closure. Regions composed of repeats with units less than 10 kb and greaterthan 99% identity frustrate the assembly of individual BAC clones and are not well-represented in our assemblies. These regions include both gene-poor regions likecentromeres, telomeres and heterochromatin, as well as gene-rich regions, such asthe TSPY arrays on the human and bull Y chomosomes. No current technology isable to access these regions. Wherever possible we attempted to find the bound-aries of these arrays, obtain a representative repeat unit, and verify the contiguityof the array by FISH.
The gaps in both bull and opossum assemblies (Extended Data Fig. 1) are theresult of arrays of short, highly identical repeats of this type. The bull Y-chromosomeassembly is interrupted by extremely long tandem arrays of a ,3 kb repeat unit,
but all contigs are ordered and oriented, and the homogeneity of these arrays wasconfirmed by FISH. The opossum Y-chromosome assembly is interrupted by stretchesof several different heterochromatic repeat units. The opossum Y chromosome istoo small to resolve these regions by FISH. However, we are confident that our as-sembly is not biased towards gene-rich regions due to our almost exclusive use ofelectronic subtraction to generate probes.Annotation of ancestral genes. We validated transcription of predicted genes byreverse-transcriptase polymerase chain reaction and capillary sequencing, as wellas 454 sequencing of testis complementary DNA (cDNA), as previously described5.
We relied on Ensembl23 version 70 to identify 1:1 orthologues between human,chimpanzee, rhesus, marmoset, mouse, rat and bull X chromosomes, the opossumX chromosomes and autosomes, and chicken autosomes, but manually reviewedcases where simple 1:1 orthologues were not clear2,4. Within each stratum, we iden-tified X–Y pair genes as ancestral if their X-linked or autosomal orthologues weresyntenic in an outgroup.
We mapped published functional annotation data18–23 onto our set of ancestralgenes. We identified pre-implantation expressed genes as previously described22.For expression breadth21, we normalized the expression of each X-linked gene tothe highest reads per kilobase per million reads (RPKM) in any tissue, and tookthe average expression across all tissues. We used UniProt annotations50 to iden-tify X–Y pair genes involved in regulatory processes.Identification and modelling of evolutionary strata. For each species, we alignedeach X–Y pair and calculated dN, dS, and dN/dS using PAML46 to identify evolu-tionary strata. For cross-species phylogenetic analysis, we generated multiple align-ments in MUSCLE47 and used these alignments to generate a tree with 100 bootstrapreplicates using DNAML in PHYLIP48. Within each stratum, we modelled geneloss as previously described6.
To calculate longevity, we summed all branch lengths in the most parsimoni-ous tree from each of the species where a gene is present to the last common ances-tor before stratum formation.PANTHER statistical overrepresentation test. We employed the PANTHERstatistical overrepresentation test49 to identify functional coherence among the 36ancestral X–Y pair genes relative to the remaining ancestral X genes. For eachfunctional category, the PANTHER software employs a binomial test to identifystatistically significant over-representation (or under-representation) of the genesin an input list relative to the genes in a reference list53. This test makes no assump-tions about the processes that generated either the input or reference gene lists,aside from the null hypothesis that both the input and reference list are drawn fromthe same population, such that each functional category is equally well representedin the two lists53.
We manually curated our gene lists to ensure that any over-representation weidentified was the result of processes that favoured the survival of ancestral geneson the Y chromosome, rather than the processes that drove gene acquisition andamplification. First, we restricted our analyses to X–Y gene pairs that includedone of the 639 ancestral X-linked genes we identified in our reconstruction of theancestral autosomes from which the X and Y chromosomes evolved (Supplemen-tary Table 2). Second, we excluded any X–Y gene pairs we could identify as arisingfrom gene acquisition by the Y chromosome after the start of decay; for example,we excluded the X–Y pair genes resulting from the human-specific X-transposedregion.
Out of the 639 ancestral X-linked genes, we identified 36 with Y homologues(Fig. 1) that appear to have survived through the genetic decay of the Y chromo-some in any one of our 8 species. All 36 of these genes mapped to a human iden-tifier in PANTHER. Of the 603 remaining ancestral genes, 11 were lost in thehuman lineage, and 38 did not map to a human identifier in PANTHER, leaving554 ancestral X genes without a surviving Y homologue in any of our 8 species(Supplementary Table 2).
We used the PANTHER statistical overrepresentation test to identify functionalannotations that were enriched among the 36 ancestral X–Y pair genes that surviveon the Y chromosome of one or more of the eight species we sequenced, relative tothe reference list of 554 other ancestral X genes (Extended Data Table 1). We selectedthe 554 other ancestral X genes as a reference list, instead of all human genes, tocontrol for any functional coherence among the ancestral genes that pre-dated thestart of Y-chromosome decay, as well as the possibility that the annotation of the Xchromosome is more complete than that of the autosomes.
We found that the annotation of the combined set of 590 ancestral X genes (36ancestral X–Y pairs and 554 other ancestral X genes) is more complete than therest of the human genome. Relative to all human genes, the 590 ancestral X genesare significantly underrepresented for genes that are ‘‘Unclassified’’ in the GOBiological Process (P , 1.96 3 1027), GO Molecular Function (P , 1.52 3 1022),and Panther Protein Class (P , 1.00 3 1026) categories (Supplementary Table 4).On the other hand, the 590 ancestral X genes are over-represented for three GOBiological Process annotations: ‘‘neurological system process’’ (P , 3.14 3 1022),
RESEARCH ARTICLE
Macmillan Publishers Limited. All rights reserved©2014
‘‘cellular process’’ (P , 4.50 3 1022), and ‘‘synaptic transmission’’ (P , 4.59 3 1022)(Supplementary Table 4). We note that the ‘‘cellular process’’ annotation encom-passes ‘‘synaptic transmission,’’ and that ‘‘cellular process’’ would not reach stat-istical significance if genes annotated as ‘‘synaptic transmission’’ were excluded.We obtained similar results when we excluded the 36 X–Y gene pairs and testedthe 554 other ancestral X genes against all human genes, although the ‘‘Unclassified’’annotation in the GO Molecular Function category failed to reach significance(Supplementary Table 4). We interpret these results as evidence that the intensivestudy of X-linked intellectual disability syndromes has produced a richer anno-tation of brain and cognitive functions on the X chromosome relative to theautosomes.Identification and recalibration of evolutionary strata. We identified chromo-somal fusions and evolutionary strata across our tree of species, using a combina-tion of information: syntenic orthologues across species, synonymous nucleotidedivergence between X–Y gene pairs, and phylogentic analysis of X–Y gene pairs.A chromosomal fusion in the ancestor of placental mammals. Previous com-parisons between marsupial and placental sex chromosomes identified a conservedregion shared between the sex chromosomes of placental and marsupial mammals,and an added region unique to the sex chromosomes of placental mammals10.Orthologues of genes from the added and conserved regions are found on separateautosomes in the chicken genome, the best assembled outgroup to placental andmarsupial mammals, as well as in the genomes of 4 teleost fish2,9. These inter-speciescomparisons of X chromosomal and autosomal gene content established the modelthat the present day human X and Y chromosomes derived from the X-conservedregion existed in the common ancestor of placental and marsupial mammals, andlater, a chromosomal fusion brought the added and conserved regions together inthe ancestor of placental mammals.
Our comparisons of Y-linked gene content support this model. Across all sevenplacental mammals, we identified 17 X–Y pairs that derive from the added region(Fig. 1). As, expected, none of these pairs have an orthologue on the opossum Ychromosome (Fig. 1). Additionally, we note that the opossum orthologues of pla-cental added region genes reside on two autosomes in opossum, chromosome 4and chromosome 7 (Supplementary Table 2 and Extended Data Fig. 3). Becausethe orthologues of placental X-added region genes are also syntenic in an outgroup,chicken2,9, we conclude that the ancestral autosome orthologous to the added regionof the placental sex chromosomes broke apart in the opossum lineage (Fig. 3).Reconstruction of evolutionary strata. The chromosomal fusion event recordedin the placental added and conserved regions served as a palimpsest for the forma-tion of evolutionary strata. Previous comparisons of the human X and Y chromo-somes identified five evolutionary strata overlaid across the added and conservedregions on the X chromosome1,9. The oldest evolutionary strata, stratum one andstratum two, occupied the X-conserved region, whereas the X-added region con-tained strata three, four, and five, as well as the freely recombining pseudoauto-somal region (PAR)1,9. We re-examined these findings across our expanded set ofspecies and gene pairs. Within each species, we aligned single-copy X–Y genepairs and calculated the nucleotide divergence (dS) between them (Supplemen-tary Table 5). In the two oldest strata, uncertainty in the levels of divergence pre-vented us from distinguishing strata, in these cases we sought to distinguish strataby phylogenetic analysis (Extended Fig. 4). The data from our broader compar-ison provides additional details that allow us to refine previous reconstructions ofthe evolutionary trajectory of the human sex chromosomes. In particular, we findno support of the distinction between strata two and three, and propose that asingle combined stratum arose in the placental lineage after the fusion of the addedand conserved regions.Stratum two formed independently in placental and marsupial lineages. Basedon the analysis of five X–Y gene pairs, previous reconstructions placed the two oldeststrata before the divergence of placental and marsupial mammals1,3. We found thatplacental Y-linked genes from both stratum one and stratum two have orthologuesin the opossum (Fig. 1), as would be expected if both strata formed in the commonancestor of placental and marsupial mammals. Alternatively, the survival of Y-linkedgenes in both lineages could be the result of independent stratum formation andconvergent survival of Y-linked genes after the divergence of marsupial and pla-cental mammals. We examined both possibilities in light of our new data from themarsupial lineage. Sixteen opossum X–Y pairs are drawn from across the entireX-conserved region, encompassing both stratum one and stratum two. However,all opossum X–Y pairs (with the exception of SOX3/SRY) displayed a similarlyhigh level of divergence (dS . 5 1) (Supplementary Table 5).
Because saturation for synonymous substitutions prevented us from using nucle-otide divergence to distinguish these ancient strata in the opossum, we sought todistinguish between them by phylogenetic analysis of X–Y gene pairs across all eightspecies, using autosomal orthologues in chicken as the outgroup. We found thatacross both placental and marsupial mammals, orthologues of the stratum one genesSRY, RBMY and HSFY were more closely related to each other than to X-linked
homologues (Extended Data Fig. 4). Genes from stratum two showed a differentpattern; as a group, placental orthologues of UBE1Y and KDM5D are more closelyrelated to placental X-linked homologues than to their marsupial orthologues (Ex-tended Data Fig. 4). We conclude that statum one, containing SRY, the male sex-determining gene54,55, evolved only once, before the divergence of marsupial andplacental mammals, but that the formation of a second stratum proceeded inde-pendently in both lineages (Figs 1 and 3).No support for the distinction between stratum two and stratum three. Pre-vious reconstructions drew a distinction between stratum two and stratum threebecause stratum two had been dated before the divergence of placental and mar-supial mammals and stratum three contained genes from the region added to theplacental sex chromosomes. After finding that only the first and not the secondstratum preceded the divergence of placental and marsupial lineages, we re-examinedthe distinction between stratum two and stratum three in placental mammals. Wecompared stratum two and stratum three gene pairs only from the four primatespecies; no single-copy gene pairs from stratum two survived on the bull Y chro-mosome, and single-copy gene pairs from both strata are saturated for synonym-ous substitutions in the rodent lineage (Fig. 1 and Supplementary Table 5). Wealso excluded AMELY and ZFY, which participated in interchromosomal gene con-version after stratum formation (Supplementary Table 5 and Extended Data Fig. 5)56,57.We found that within each of the four primate species, the divergence betweenKDM5C and KDM5D in stratum two is within the range of divergence of X–Ygene pairs from stratum three (Supplementary Table 5). Without phylogenetic ordivergence data that distinguish stratum two from stratum three, we propose thattogether they represent a single stratum (Figs 1 and 3). This combined stratum formedin the ancestor of all placental mammals, after the chromosomal fusion eventexpanded the PAR of the X and Y chromosomes, but before bull diverged from theother six species, more than 97 millon years ago (Fig. 3)12.Location of the ancestral placental PAR boundary. The formation of this com-bined stratum defined the PAR boundary in the placental ancestor, but subsequentX–Y gene conversion events in AMELY have made it difficult to establish the loca-tion of this boundary using only data from the human X and Y chromosomes, withproposed boundaries ranging in location from as distal as between KAL1 andTBL1X and as proximal as between AMELX and TMSB4X1,3,9,58. The 4.2 mega-bases between KAL1 and TMSB4X comprise almost 3% of the human X chromo-some. Our expanded data set provides additional constraints that narrow this regionby a factor of 10. We find that AMELY is present on the human, chimpanzee, rhesusmacaque and bull Y chromosomes, while TBL1Y is present only in human, rhesusmacaque and, as a pseudogene, in chimpanzee (Fig. 1). The bovine orthologue ofTBL1X is located in the PAR, and furthermore, MID1, which is located betweenTBL1X and AMELX on the human X chromosome, has an orthologue in the mousePAR (Extended Data Table 2)59. We conclude that the ancestral placental PARboundary was proximal to both TBL1X and MID1, but distal to AMELX. Thisplaces TBL1Y in stratum four, and AMELY in the combined stratum two/three.The low divergence between AMELX and AMELY is probably the result of lineage-specific X–Y gene conversion events after stratum formation, similar to what hasbeen observed for ZFY (Supplementary Table 5 and Extended Data Fig. 5)56,57.Lineage-specific evolutionary strata in primates. After the formation of the stra-tum that established the ancestral placental PAR boundary, lineage-specific evolu-tionary strata continued to form. Previous reconstructions identified two additionalstrata in the human lineage with a boundary between PRKX and NLGN4X9. Werecalculated the age of human strata 4 and 5 following previously published methods9,using the updated figure of 29.6 million years ago for the divergence between oldworld monkeys and hominoids12.
NLGN4Y, from stratum four, is present in all four primate species, whereas TBL1Yis present in human and rhesus macaque, with a pseudogene in chimpanzee. TheX–Y divergence in human stratum four is compatible with an origin in the simianancestor, over 44 million years ago, close to the time of divergence of platyrhineand catarrhine primates (Fig. 3)9,12.
In contrast, human stratum five dates to 32–34 million years ago, before thedivergence of rhesus macaque from human and chimpanzee9,12. All three speciesshare the PRKY gene, as well as a common PAR boundary5. We conclude that stra-tum five was already established in the catarrhine ancestor, and afterwards, nofurther strata formed in the human, chimpanzee and rhesus lineages (Fig. 3), al-though subsequent insertions, deletions, and rearrangements generated differentconfigurations of the male-specific region of the Y chromosome in each species5.
Independently, the marmoset lineage also formed a fifth stratum with a more distalPAR boundary than the human, chimpanzee, and rhesus (Fig. 1 and SupplementaryFig. 7). Because the marmoset whole genome shotgun sequence is a mixture of maleand female sequence, and this marmoset-specific stratum formed relatively recently,it is not possible to differentiate between X and Y derived contigs in the marmosetwhole genome shotgun sequence. P2RY8Y, SFRS17AY, and ZBED1Y are the onlysurvivors out of 24 ancestral genes in this stratum (Fig. 1 and Supplementary Table 2),
ARTICLE RESEARCH
Macmillan Publishers Limited. All rights reserved©2014
demonstrating that, at least while strata are young, genetic decay is both swift andextensive5,60.Modelling kinetics of Y-chromosome decay. We modelled the numbers of ances-tral genes within individual MSY strata as a function of time in millions of yearsbefore the present by fitting a one-phase exponential decay model with a baselineconstant (below) to our data using nonlinear regression analysis in GraphPad Prism5.0. Parameters for each stratum are given in the Source Data for Fig. 4. This one-phase exponential decay model gives the number of genes at time t, N(t):
N(t) 5 (N02b)e2Kt 1 b
Where N0 is the number of genes within a given stratum in ancestral autosomal/pseudoautosomal portion of genome at the start of stratum formation, K is thedecay constant, and b is the baseline (approximated by the number of active ances-tral genes within that stratum on the human Y chromosome).Haplolethality of broadly expressed, dosage-sensitive X–Y pair genes. We pro-pose that the broadly expressed, dosage-sensitive genes of the human Y chromo-some, along with their X homologues that escape X chromosome inactivation, arecollectively haplolethal. Twelve human XY gene pairs meet this criterion: RPS4X/RPS4Y1, ZFX/ZFY, TBL1X/TBL1Y, PRKX/PRKY, USP9X/USP9Y, DDX3X/ DDX3Y,UTX/ UTY, TMSB4X/ TMSB4Y, NLGN4X/ NLGN4Y, TXLNG/CYORF15, KDM5C/KDM5D and EIF1AX/EIF1AY.
We compiled a list of cases with non-mosaic partial-Y deletions removing oneor more of these genes to determine if any single gene was haplolethal. We foundthat the Y-homologue of each X–Y gene pair was deleted in one or more cases (Ex-tended Data Fig. 7 and Extended Data Table 3). Thus, we attribute the inviability of45,X conceptuses to a collective haplolethality for several X–Y gene pairs, and notto any single gene pair. Supporting the notion that these gene pairs are dosage-sensitive, TBL1Y and PRKY, two genes deleted in the rare J2e1*/M241 Y chromo-some haplotype61, are the only 2 of these 12 gene pairs with X-linked homologuesthat do not always escape X-inactivation19.
We also searched the literature for reports of structurally variant X chromo-somes in females, where one X chromosome was deleted for one or more of these12 genes (Extended Data Fig. 7 and Extended Data Table 3). These reports are notinconsistent with a collective haplolethality for X–Y gene pairs, but the interpreta-tion of these cases is complicated by viability effects mediated by the X-inactivationcentre (XIC), and a possible critical region for ovarian failure near USP9X62.
We found cases where a variant X chromosome has been transmitted from motherto daughter, and which are therefore unlikely to be mosaic, that delete as many as7 genes (PRKX, NLGN4X, TBL1X, TMSB4X, TXLNG, EIF1AX and ZFX)63–69.
We also found reports of extensive de novo deletions that eliminate 11 of these12 genes, leaving only RPS4X on the long arm66,69. However, we cannot excludethe possibility that these cases are mosaic for 46,XX cells in a cell lineage otherthan the blood. The absence of familial cases of deletions of this type may becauseof a critical region for ovarian failure on the short arm of the X chromosome; bothZFX and USP9X have been proposed as candidate genes62.
We could not find any reports of deletions of RPS4X. RPS4X is located on thelong arm, between the centromere and the XIC. We believe that the absence ofreports of X chromosome variants deleted for RPS4X reflects the proximity ofRPS4X to the XIC rather than haplolethality of RPS4X.
51. Kuroda-Kawaguchi, T. et al. The AZFc region of the Y chromosome featuresmassive palindromes and uniform recurrent deletions in infertile men. NatureGenet. 29, 279–286 (2001).
52. Karere, G. M., Froenicke, L., Millon, L., Womack, J. E. & Lyons, L. A. A high-resolutionradiation hybrid map of rhesus macaque chromosome 5 identifiesrearrangements in the genome assembly. Genomics 92, 210–218 (2008).
53. Mi, H., Muruganujan, A., Casagrande, J. T. & Thomas, P. D. Large-scale genefunction analysis with the PANTHER classification system. Nature Protocols 8,1551–1566 (2013).
54. Gubbay, J. et al. A gene mapping to the sex-determining region of the mouse Ychromosome is a member of a novel family of embryonically expressed genes.Nature 346, 245–250 (1990).
55. Sinclair, A. H. et al. A gene from the human sex-determining region encodes aprotein with homology to a conserved DNA-binding motif. Nature 346, 240–244(1990).
56. Hayashida, H., Kuma, K. & Miyata, T. Interchromosomal gene conversion as apossible mechanism for explaining divergence patterns of ZFY-related genes.J. Mol. Evol. 35, 181–183 (1992).
57. Marais, G. & Galtier, N. Sex chromosomes: how X-Y recombination stops. Curr. Biol.13, R641–R643 (2003).
58. Iwase,M.et al. Theamelogenin loci spananancientpseudoautosomal boundary indiverse mammalian species. Proc. Natl Acad. Sci. USA 100, 5258–5263 (2003).
59. Dal Zotto, L. et al. The mouse Mid1 gene: implications for the pathogenesis of Opitzsyndrome and the evolution of the mammalian pseudoautosomal region. Hum.Mol. Genet. 7, 489–499 (1998).
60. Bachtrog, D. The temporal dynamics of processes underlying Y chromosomedegeneration. Genetics 179, 1513–1525 (2008).
61. Jobling, M. A. et al. Structural variation on the short arm of the human Ychromosome: recurrent multigene deletions encompassing Amelogenin Y. Hum.Mol. Genet. 16, 307–316 (2007).
62. Jones, M. H. et al. The Drosophila developmental gene fat facets has a humanhomologue in Xp11.4 which escapes X-inactivation and has related sequences onYq11.2. Hum. Mol. Genet. 5, 1695–1701 (1996).
63. Adachi, M., Tachibana, K., Asakura, Y., Muroya, K. & Del Ogata, T. Del(X)(p21.1) in amother and two daughters: genotype-phenotype correlation of Turner features.Hum. Genet. 106, 306–310 (2000).
64. Chocholska, S., Rossier, E., Barbi, G. & Kehrer-Sawatzki, H. Molecular cytogeneticanalysis of a familial interstitial deletion Xp22.2-22.3 with a highly variablephenotype in female carriers. Am. J. Med. Genet. A. 140A, 604–610 (2006).
65. Good, C. D. et al. Dosage-sensitive X-linked locus influences the development ofamygdala and orbitofrontal cortex, and fear recognition in humans. Brain 126,2431–2446 (2003).
66. James, R. S. et al. A study of females with deletions of the short arm of the Xchromosome. Hum. Genet. 102, 507–516 (1998).
67. Massa, G., Vanderschueren-Lodeweyckx, M. & Fryns, J. P. Deletion of the short armof the X chromosome: a hereditary form of Turner syndrome. Eur. J. Pediatr. 151,893–894 (1992).
68. Zinn, A. R. et al. Del (X)(p21.2) in a mother and two daughters with variable ovarianfunction. Clin. Genet. 52, 235–239 (1997).
69. Zinn, A. R. et al. Evidence for a Turner syndrome locus or loci at Xp11.2-p22.1. Am.J. Hum. Genet. 63, 1757–1766 (1998).
RESEARCH ARTICLE
Macmillan Publishers Limited. All rights reserved©2014
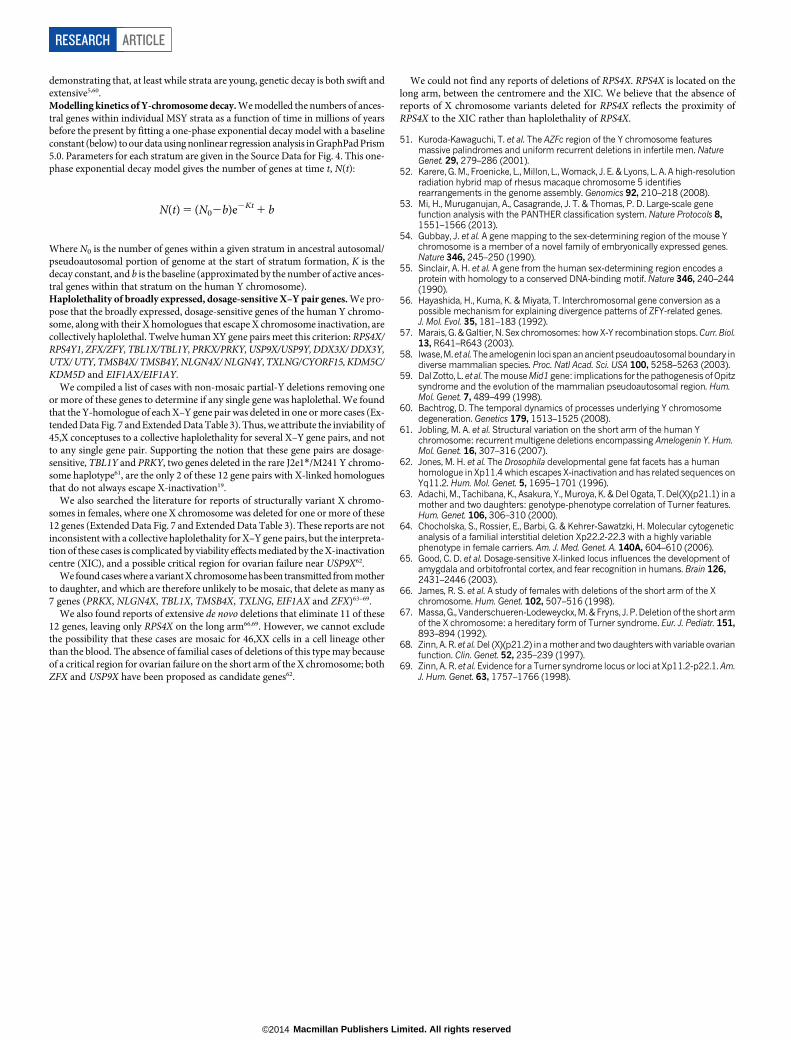
Extended Data Figure 1 | Annotated sequence contigs from the MSY of fivespecies. All sequence features and BACs drawn to scale. a–e, Marmoset MSY.f–j, Mouse MSY. k–o, Rat MSY. p–t, Bull MSY. u–y, Opossum MSY.a, f, k, p, u, Schematic representation of assembled contigs and sequence classes:X-degenerate (yellow); ampliconic (blue); pseudoautosomal (green);heterochromatic (pink). Gaps shown in white. b, g, l, q, v, Positions of all intact,actively transcribed genes. Plus (1) strand above, minus (2) strand below.c, h, m, r, w, G 1 C content (%) calculated in a 100-kb sliding window with 1-kbsteps. d, i, n, s, x, Alu (red), LINE (green), and endogenous retrovirus (blue)content (%) calculated in a 200-kb sliding window with 1-kb steps.
e, j, o, t, y, Sequenced MSY BACs. Each bar represents the size and position ofone BAC clone, labelled with the library identifier. e, BAC clones with no prefixare from the CHORI-259 library; BAC clones with ‘‘A’’ prefix are from theMARMAEX (Amplicon Express) library. j, All BAC clones are from theRPCI-24 library. o, BAC clones without prefix are from the RNAEX library;BAC clones with ‘‘E’’ prefix are from the RNECO library (both from AmpliconExpress). t, BAC clones without prefix are from the CHORI-240 library;BAC clones with ‘‘E’’ prefix are from the BTDAEX library (both fromAmplicon Express). y, BAC clones with no prefix are from the VMRC6 library;BAC clones with ‘‘A’’ prefix are from the MDAEX (Amplicon Express) library.
ARTICLE RESEARCH
Macmillan Publishers Limited. All rights reserved©2014
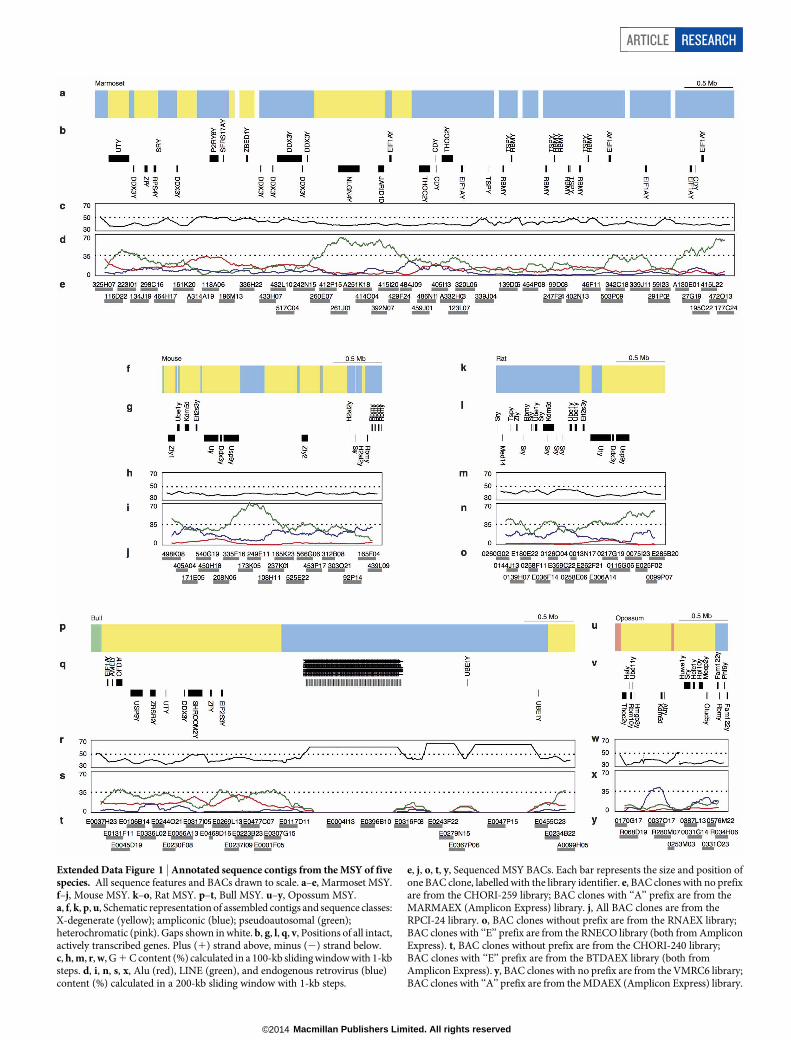
Extended Data Figure 2 | Expression of Y-linked genes across tissues andspecies. Within each species, the relative expression of each Y-linked gene isshown as a heat map normalized to the male tissue with the highest level ofexpression of that gene. Expression was calculated from RNA-seq data as readsper kilobase of transcript per million mapped reads. For each gene and species,
tissues are arranged in alphabetical order from left to right: brain, cerebellum,colon, heart, kidney, liver, lung, skeletal muscle, spleen and testis. Mostsingle-copy genes (red) are broadly expressed across male tissues, whereasY-linked genes in multi-copy families (blue) are predominantly or exclusivelyexpressed in testes.
RESEARCH ARTICLE
Macmillan Publishers Limited. All rights reserved©2014
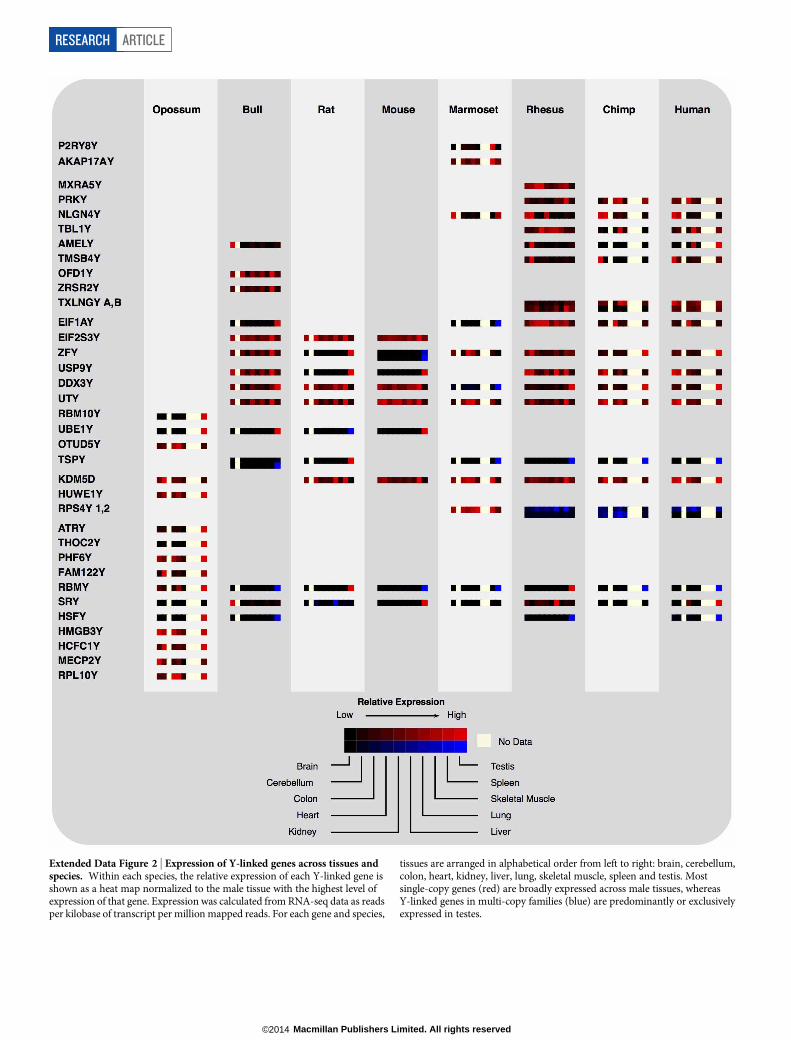
Extended Data Figure 3 | Dot plot of human X orthologues in opossumand chicken. Rectangular dot plots show chromosomal locations ofX-orthologous genes in other species. The human X chromosome is composed
of a conserved region, orthologous to the opossum X chromosome and a regionof chicken chromosome 4, as well as an added region, orthologous to chickenchromosome 1, which has broken in two in the opossum lineage.
ARTICLE RESEARCH
Macmillan Publishers Limited. All rights reserved©2014
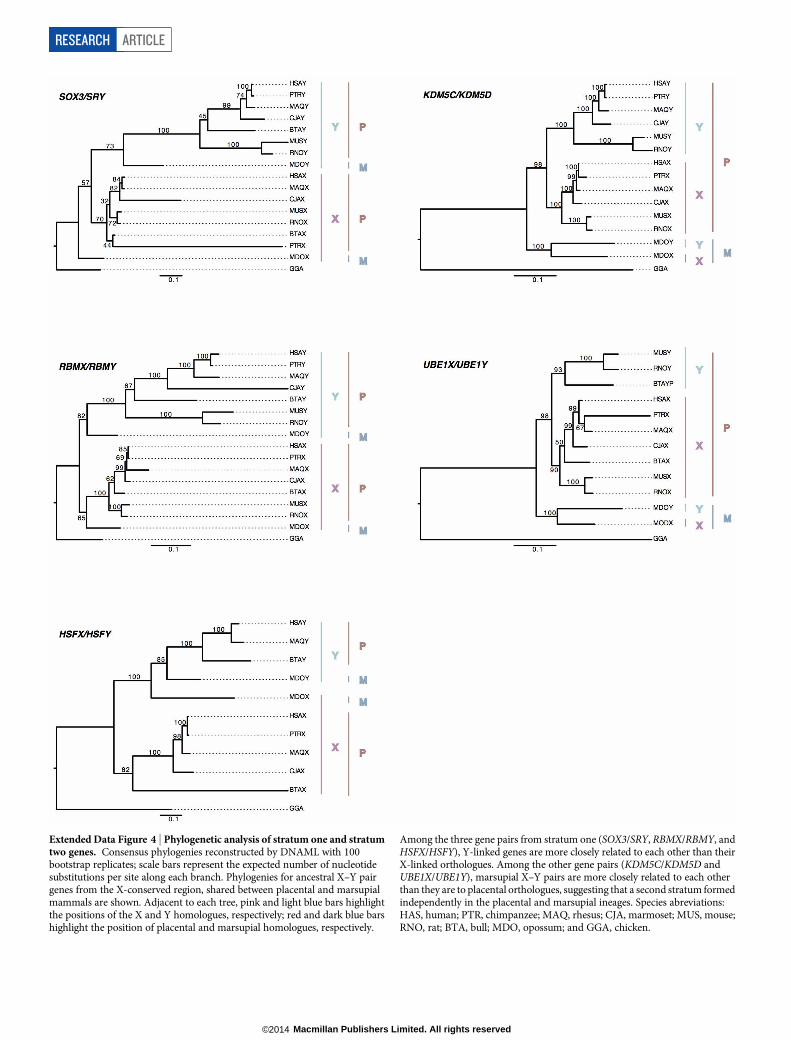
Extended Data Figure 4 | Phylogenetic analysis of stratum one and stratumtwo genes. Consensus phylogenies reconstructed by DNAML with 100bootstrap replicates; scale bars represent the expected number of nucleotidesubstitutions per site along each branch. Phylogenies for ancestral X–Y pairgenes from the X-conserved region, shared between placental and marsupialmammals are shown. Adjacent to each tree, pink and light blue bars highlightthe positions of the X and Y homologues, respectively; red and dark blue barshighlight the position of placental and marsupial homologues, respectively.
Among the three gene pairs from stratum one (SOX3/SRY, RBMX/RBMY, andHSFX/HSFY), Y-linked genes are more closely related to each other than theirX-linked orthologues. Among the other gene pairs (KDM5C/KDM5D andUBE1X/UBE1Y), marsupial X–Y pairs are more closely related to each otherthan they are to placental orthologues, suggesting that a second stratum formedindependently in the placental and marsupial ineages. Species abreviations:HAS, human; PTR, chimpanzee; MAQ, rhesus; CJA, marmoset; MUS, mouse;RNO, rat; BTA, bull; MDO, opossum; and GGA, chicken.
RESEARCH ARTICLE
Macmillan Publishers Limited. All rights reserved©2014
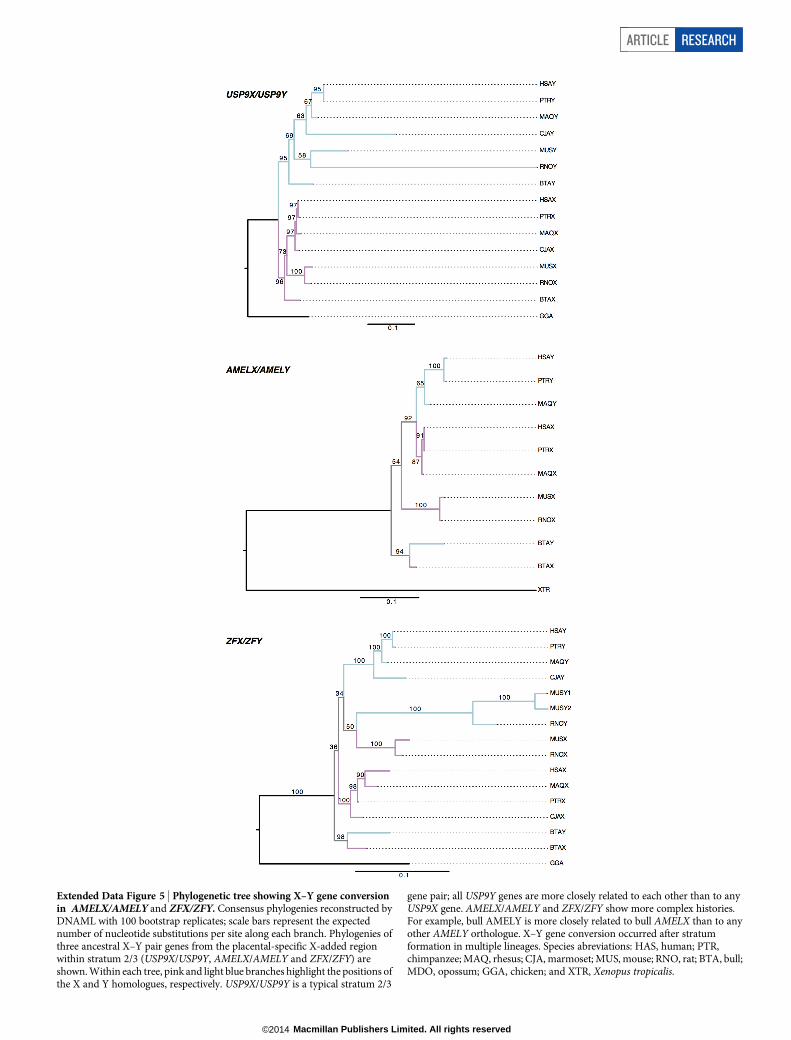
Extended Data Figure 5 | Phylogenetic tree showing X–Y gene conversionin AMELX/AMELY and ZFX/ZFY. Consensus phylogenies reconstructed byDNAML with 100 bootstrap replicates; scale bars represent the expectednumber of nucleotide substitutions per site along each branch. Phylogenies ofthree ancestral X–Y pair genes from the placental-specific X-added regionwithin stratum 2/3 (USP9X/USP9Y, AMELX/AMELY and ZFX/ZFY) areshown. Within each tree, pink and light blue branches highlight the positions ofthe X and Y homologues, respectively. USP9X/USP9Y is a typical stratum 2/3
gene pair; all USP9Y genes are more closely related to each other than to anyUSP9X gene. AMELX/AMELY and ZFX/ZFY show more complex histories.For example, bull AMELY is more closely related to bull AMELX than to anyother AMELY orthologue. X–Y gene conversion occurred after stratumformation in multiple lineages. Species abreviations: HAS, human; PTR,chimpanzee; MAQ, rhesus; CJA, marmoset; MUS, mouse; RNO, rat; BTA, bull;MDO, opossum; GGA, chicken; and XTR, Xenopus tropicalis.
ARTICLE RESEARCH
Macmillan Publishers Limited. All rights reserved©2014
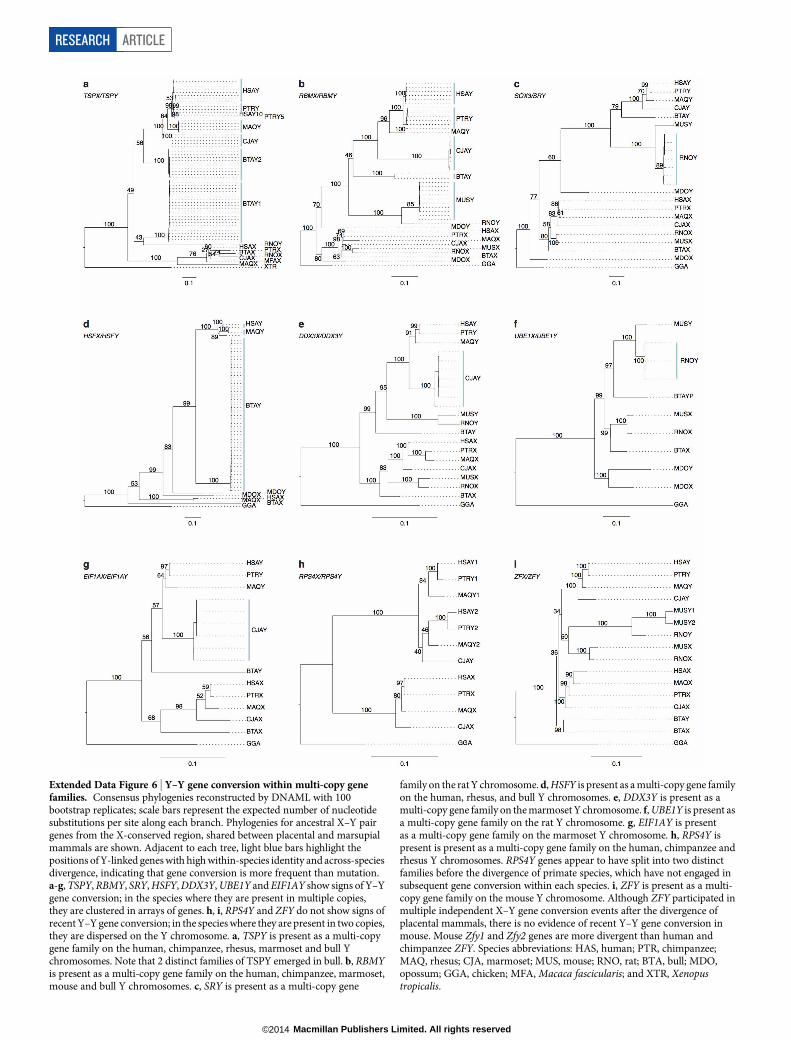
Extended Data Figure 6 | Y–Y gene conversion within multi-copy genefamilies. Consensus phylogenies reconstructed by DNAML with 100bootstrap replicates; scale bars represent the expected number of nucleotidesubstitutions per site along each branch. Phylogenies for ancestral X–Y pairgenes from the X-conserved region, shared between placental and marsupialmammals are shown. Adjacent to each tree, light blue bars highlight thepositions of Y-linked genes with high within-species identity and across-speciesdivergence, indicating that gene conversion is more frequent than mutation.a-g, TSPY, RBMY, SRY, HSFY, DDX3Y, UBE1Y and EIF1AY show signs of Y–Ygene conversion; in the species where they are present in multiple copies,they are clustered in arrays of genes. h, i, RPS4Y and ZFY do not show signs ofrecent Y–Y gene conversion; in the species where they are present in two copies,they are dispersed on the Y chromosome. a, TSPY is present as a multi-copygene family on the human, chimpanzee, rhesus, marmoset and bull Ychromosomes. Note that 2 distinct families of TSPY emerged in bull. b, RBMYis present as a multi-copy gene family on the human, chimpanzee, marmoset,mouse and bull Y chromosomes. c, SRY is present as a multi-copy gene
family on the rat Y chromosome. d, HSFY is present as a multi-copy gene familyon the human, rhesus, and bull Y chromosomes. e, DDX3Y is present as amulti-copy gene family on the marmoset Y chromosome. f, UBE1Y is present asa multi-copy gene family on the rat Y chromosome. g, EIF1AY is presentas a multi-copy gene family on the marmoset Y chromosome. h, RPS4Y ispresent is present as a multi-copy gene family on the human, chimpanzee andrhesus Y chromosomes. RPS4Y genes appear to have split into two distinctfamilies before the divergence of primate species, which have not engaged insubsequent gene conversion within each species. i, ZFY is present as a multi-copy gene family on the mouse Y chromosome. Although ZFY participated inmultiple independent X–Y gene conversion events after the divergence ofplacental mammals, there is no evidence of recent Y–Y gene conversion inmouse. Mouse Zfy1 and Zfy2 genes are more divergent than human andchimpanzee ZFY. Species abbreviations: HAS, human; PTR, chimpanzee;MAQ, rhesus; CJA, marmoset; MUS, mouse; RNO, rat; BTA, bull; MDO,opossum; GGA, chicken; MFA, Macaca fascicularis; and XTR, Xenopustropicalis.
RESEARCH ARTICLE
Macmillan Publishers Limited. All rights reserved©2014
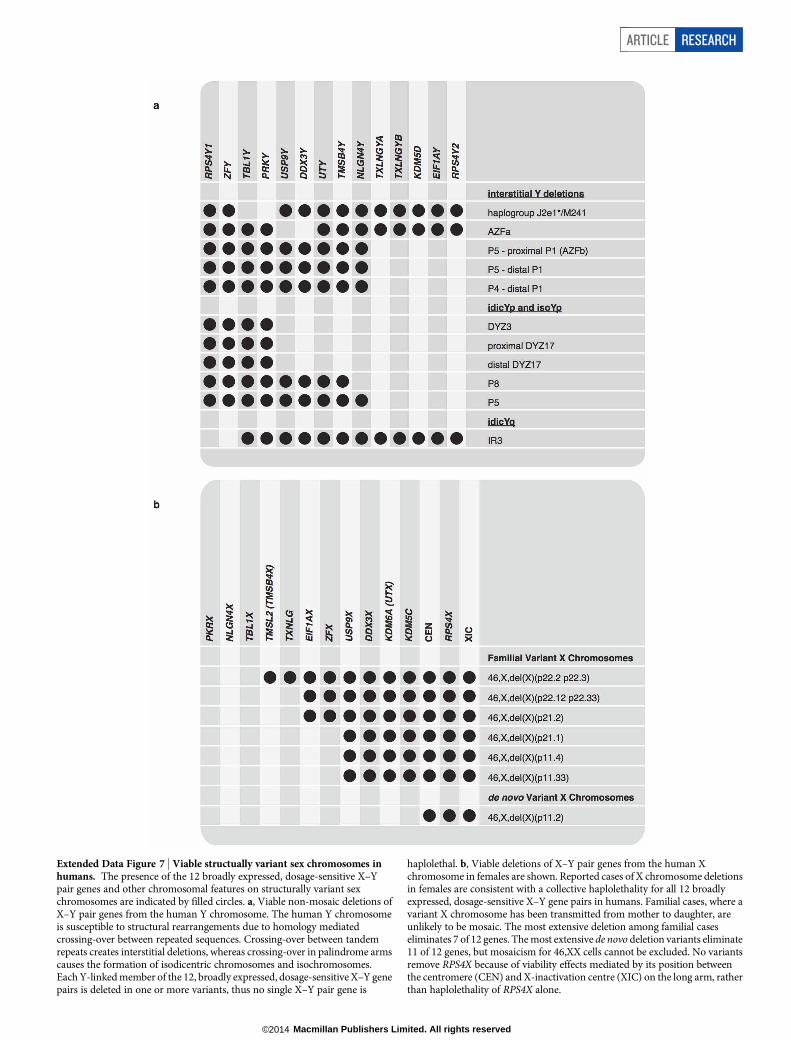
Extended Data Figure 7 | Viable structually variant sex chromosomes inhumans. The presence of the 12 broadly expressed, dosage-sensitive X–Ypair genes and other chromosomal features on structurally variant sexchromosomes are indicated by filled circles. a, Viable non-mosaic deletions ofX–Y pair genes from the human Y chromosome. The human Y chromosomeis susceptible to structural rearrangements due to homology mediatedcrossing-over between repeated sequences. Crossing-over between tandemrepeats creates interstitial deletions, whereas crossing-over in palindrome armscauses the formation of isodicentric chromosomes and isochromosomes.Each Y-linked member of the 12, broadly expressed, dosage-sensitive X–Y genepairs is deleted in one or more variants, thus no single X–Y pair gene is
haplolethal. b, Viable deletions of X–Y pair genes from the human Xchromosome in females are shown. Reported cases of X chromosome deletionsin females are consistent with a collective haplolethality for all 12 broadlyexpressed, dosage-sensitive X–Y gene pairs in humans. Familial cases, where avariant X chromosome has been transmitted from mother to daughter, areunlikely to be mosaic. The most extensive deletion among familial caseseliminates 7 of 12 genes. The most extensive de novo deletion variants eliminate11 of 12 genes, but mosaicism for 46,XX cells cannot be excluded. No variantsremove RPS4X because of viability effects mediated by its position betweenthe centromere (CEN) and X-inactivation centre (XIC) on the long arm, ratherthan haplolethality of RPS4X alone.
ARTICLE RESEARCH
Macmillan Publishers Limited. All rights reserved©2014
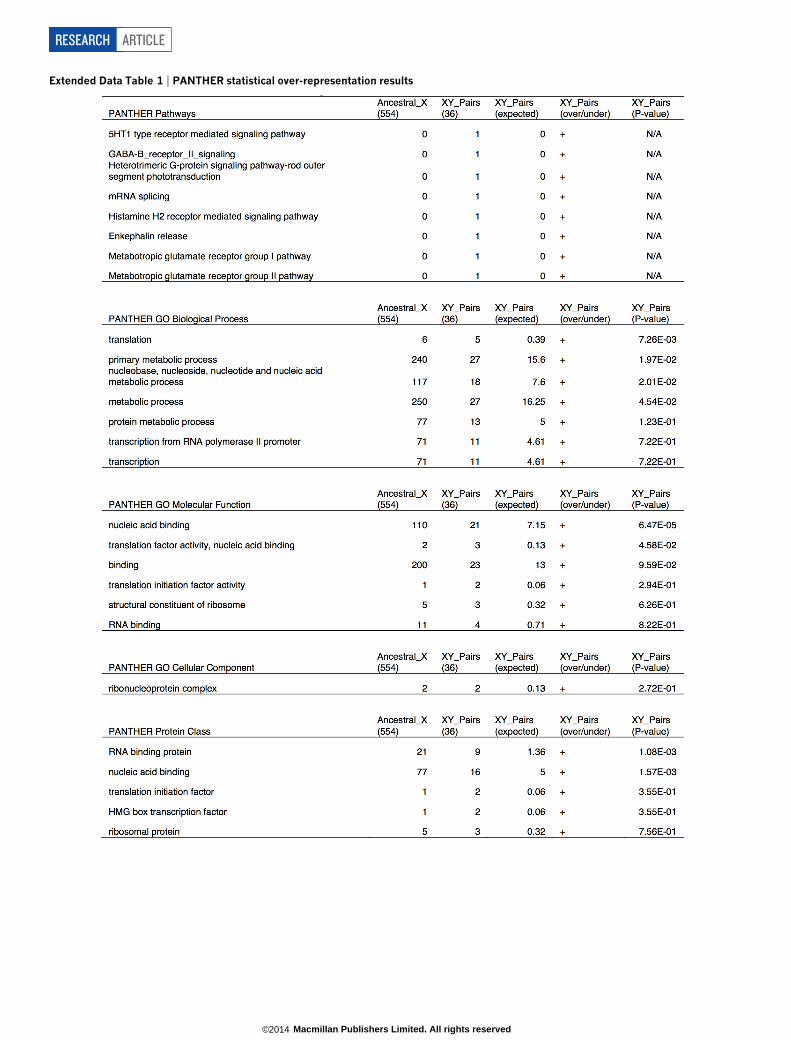
Extended Data Table 1 | PANTHER statistical over-representation results
RESEARCH ARTICLE
Macmillan Publishers Limited. All rights reserved©2014

Extended Data Table 2 | Accession numbers of mouse pseudoautosomal region genes
ARTICLE RESEARCH
Macmillan Publishers Limited. All rights reserved©2014
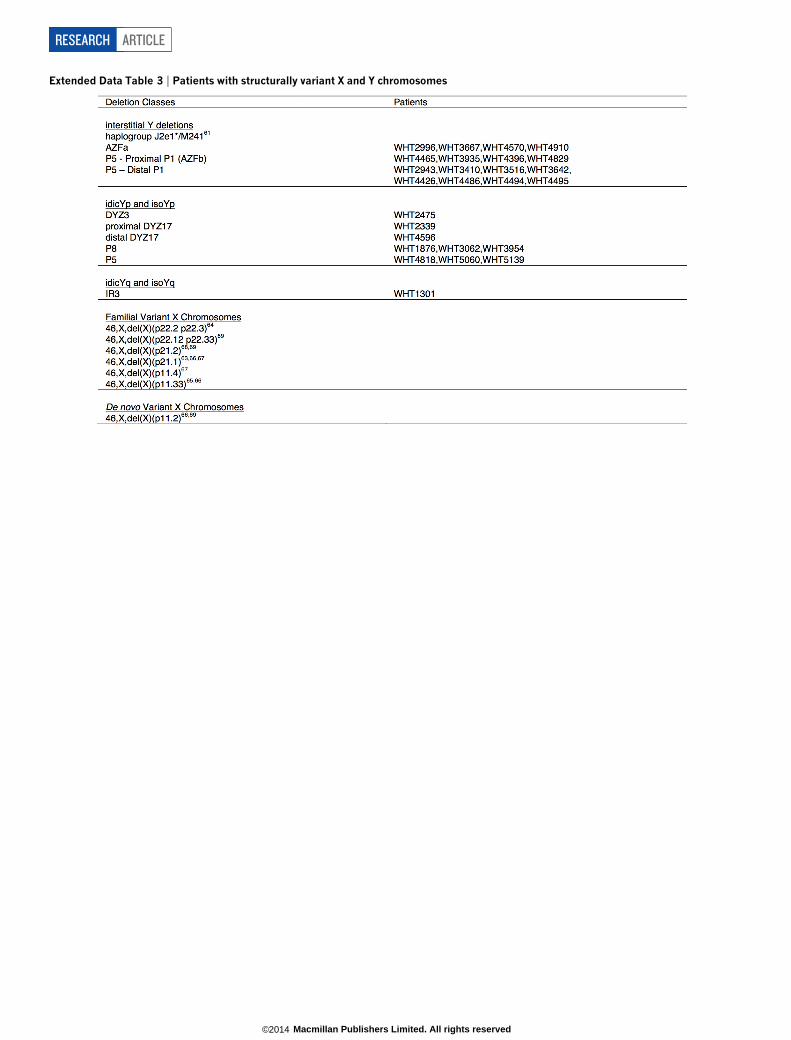
Extended Data Table 3 | Patients with structurally variant X and Y chromosomes
RESEARCH ARTICLE
Macmillan Publishers Limited. All rights reserved©2014