malthusian assumptions, boserupian response in transition
TRANSCRIPT
Chapter 6Malthusian Assumptions, Boserupian Responsein Transition to Agriculture Models
Carsten Lemmen
Keywords Sociometabolic transition · Population pressure · Innovation · Develop-ment framework
6.1 Transitions to Agriculture
The relationship between humans and their environment underwent a radical changeduring the last 10,000 years: from mobile and small groups of foragers to sedentaryextensive cultivators and on to high-density intensive agriculture-based modern soci-ety; these transitions fundamentally transformed the formerly predominantly passivehuman user of the environment into an active component of the Earth system. Themost striking impacts of these global transitions have only become visible and mea-surable during the last 150 years (Crutzen 2002; Crutzen and Stoermer 2000). Priorto this time frame, the use of forest resources for metal smelting in early Romantimes and the extensive medieval agricultural system had already changed the land-scape (Barker 2011; Kaplan et al. 2009); the global climate effects of these earlyextensive cultivation and harvesting practices are still under debate (Kaplan et al.2011; Lemmen 2010; Ruddiman 2003; Stocker et al. 2011).
Transitions to agriculture occurred in almost every region of the world, withthe earliest instances occurring in China and the Near East over 9,000 years ago(Kuijt and Goring-Morris 2002; Londo et al. 2006). More recent transitions occurredseveral 100 years ago in Australia and Oceania with the arrival of Polynesian andEuropean immigrants (Diamond and Bellwood 2003). While each local transitioncan be considered revolutionary, the many diverse mechanisms, environments, andcultural contexts of each agricultural transition make it difficult to speak of one‘Neolithic revolution’, as the transition to farming and herding was termed by V. G.Childe almost a century ago (Childe 1925). The transitions from foraging to farmingwere not simply one big step, but may have consisted of intermediary stages. Bogaard(2005) examines such transitions in terms of the land use system: she classifies the
C. Lemmen (�)Helmholtz-Zentrum Geesthacht, Institute for Coastal Research—SystemAnalysis & Modeling, Ecosystem Modeling (KSE), Helmholtz-Zentrum Geesthacht,Max-Planck-Strasse 1, 21502 Geesthacht, Germanye-mail: [email protected]
M. Fischer-Kowalski et al. (eds.), Ester Boserup’s Legacy on Sustainability, 87Human-Environment Interactions 4, DOI 10.1007/978-94-017-8678-2_6,© The Author(s) 2014
brought to you by COREView metadata, citation and similar papers at core.ac.uk
provided by Springer - Publisher Connector
88 C. Lemmen
progression as comprising inadvertent cultivation, horticulture, simple agriculture,and then advanced agriculture. Boserup (1965), however, classifies these stagesby management practice: forest, bush, short fallow, annual cropping, and multicropping.
In contemporary hunting-gathering societies, much less time is devoted to procur-ing food from hunting and gathering as compared to agriculture and herding (e.g.,Sahlins 1972). In addition, less labour is required for long fallow systems comparedto intensive multi-cropping agriculture (Boserup 1965). These phenomena raisethe question: Why farm? Different explanations from archaeology (Barker 2011),demography (Turchin and Nefedov 2009), historical economy (Weisdorf 2005), andecosystem modelling (Wirtz and Lemmen 2003), suggest that the answer lies in pro-cesses such as social reorganisation, the value of leisure, changing resources, andcoevolutionary thresholds.
Malthus (1798) proposed what is arguably the simplest relationship, namely thatmore production sustains larger populations. With larger populations, more produc-tion is possible, thereby constituting a positive feedback loop, which ideally resultsin ever-increasing (geometric) growth and productivity. This ideal increase does notapply in a world with finite resources, as expressed by Malthus (1798, p. 4), whostated that: “Population, when unchecked, increases at a geometrical ratio. Subsis-tence increases only in an arithmetical ratio. A slight acquaintance with numberswill show the immensity of the first power in comparison with the second”. Malthusidentifies the need for positive and preventive checks to balance population increaseswith a limited capacity of resources.
It is important to note the reasons for productivity increases. First, the input ofmore labour increases productivity (Malthus 1798, p. 11), subject to the constraintsof finite resources and diminishing returns. However, whereas Malthus focuses onextensive productivity increases, Boserup (1965) highlights the intensification com-ponent of productivity increases. Investments in a more intensive production systemrequire significant additional labour, and the benefits of such investments are oftensmall. To stimulate an investment in more intensive agriculture, Boserup requirespopulation pressure.
Both Malthus (1798, 1826) and Boserup (1965, 1981) concentrate on the role oflabour (and, later, division of labour and social/family organisation) and innovationsthat increase area productivity (such as storage or tools, requiring relatively morelabour for harvesting, building, and tool processing). Both authors neglect the roleof labour-independent innovation, or innovations that increase both area and labourproductivity. These are innovations in the resources themselves, such as cultivation ofhigher-yielding grains or imported high yield varieties, or types of management suchas water rights. Although this distinction may be ambiguous for certain innovations,it is used here conceptually. Labour-independent innovation can be stimulated bypopulation diversity and density, both of which are positively related to populationsize. Darwin (1859, p. 156) wrote “The more diversified [. . .], by so much will theybe better enabled to seize on many and widely diversified places in the polity ofnature”. Translated into the realm of innovation, Darwin’s “seizing of places”, orniche occupation, would be the realisation of technical and scientific opportunities.
6 Malthusian Assumptions, Boserupian Response in Transition . . . 89
Regarding density as a stimulus of innovation, aggregation is understood to con-stitute a vehicle for technological and cultural change (Boyd and Richerson 1995;Smith 1776)1.
6.2 Models of Population, Production, and Innovation
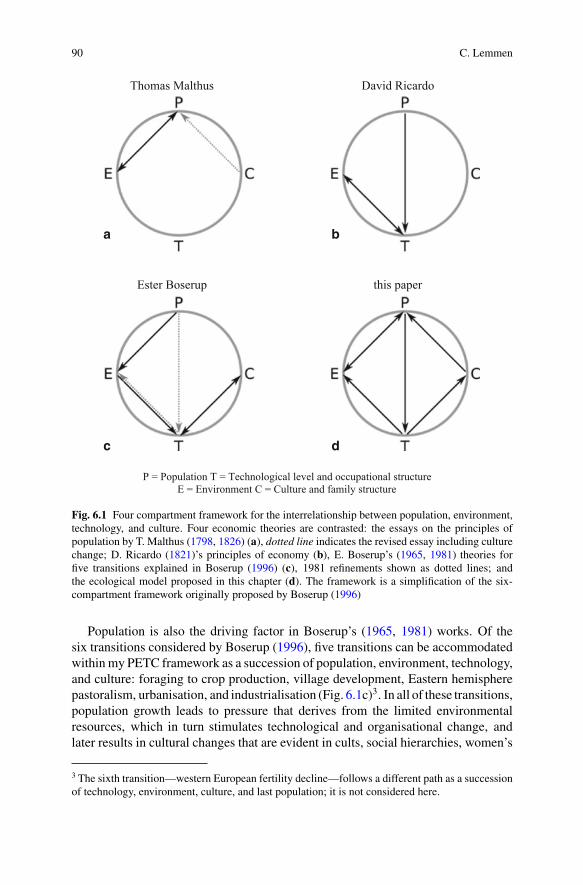
In 1996, Ester Boserup reflected on the problems arising from the differences interminology and methodology when comparing different models of developmenttheories (Boserup 1996). She suggested a common framework to facilitate inter-disciplinary cooperation based on six structures: Environment (E), Population (P),technology, occupational structure, family structure and culture. In this framework,she then interpreted the major works of Adam Smith, Thomas Malthus, Max Weber,Karl Marx, David Ricardo, and Neomalthusian thinking, as well as her ownperspective on different stages of the developmental process.
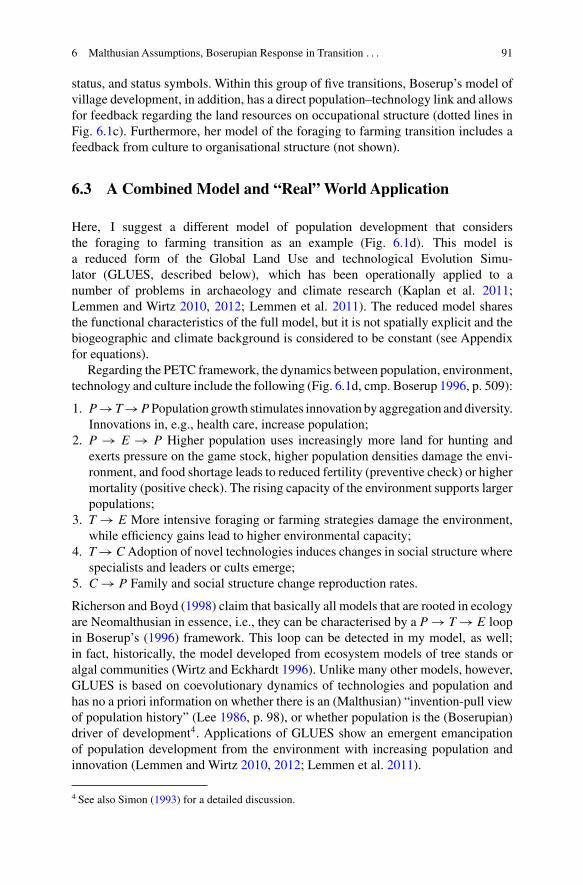
For many of the theories and models discussed by Boserup in this framework,the partitioning into six structures can be simplified by (a) aggregating technologyand occupational structure into a single entity technology (T), and by (b) aggregatingculture and family structure into a single entity culture (C). Aggregating technologyand occupational structure means that I assume here that changes in technology areequivalent to changes in organisation and that the location of technological changeis the occupational sector. By aggregating family structure and culture, I assumethat values and social conventions penetrate from the society into the family and aregoverned by similar dynamics. The reduced framework then consists of the followingcompartments: population, environment, technology, and culture (PETC, Fig. 6.1).
In this PETC framework, the model referring to Malthus (1798) involves onlypopulation and environment. Population growth exerts pressure on the environment,and failure to provide adequate resources from the environment acts as a positivecheck on population through higher mortality (Fig. 6.1a). Technology does not playa role in this simplest Malthusian model2. Culture in the form of preventive checks—such as birth control—acts on population only in later versions of his theory (Malthus1826). At its core remains “the dependent role he assigns to population growth”(Marquette 1997). D. Ricardo (1821) proposed that the incentive to intensify anddevelop technologies comes from a stimulus in population pressure. The demand formore land (E), however, leads to declining marginal benefits of and negative feedbackon innovation (T) due to the high costs of renting the land (Fig. 6.1b). In Ricardo’swork, population is the independent variable, and technology and environment arethe dependent variables.
1 This does not, however, explain the reason for a particular choice of one innovation over another(Sober 1992).2 Malthus considered the increase of carrying capacity by autonomously occurring inventions(Lee 1986), however, this was not discussed by Boserup (1996) in her model intercomparison.
90 C. Lemmen
Thomas Malthus David Ricardo
Ester Boserup this paper
P = Population T = Technological level and occupational structureE = Environment C = Culture and family structure
a b
dc
Fig. 6.1 Four compartment framework for the interrelationship between population, environment,technology, and culture. Four economic theories are contrasted: the essays on the principles ofpopulation by T. Malthus (1798, 1826) (a), dotted line indicates the revised essay including culturechange; D. Ricardo (1821)’s principles of economy (b), E. Boserup’s (1965, 1981) theories forfive transitions explained in Boserup (1996) (c), 1981 refinements shown as dotted lines; andthe ecological model proposed in this chapter (d). The framework is a simplification of the six-compartment framework originally proposed by Boserup (1996)
Population is also the driving factor in Boserup’s (1965, 1981) works. Of thesix transitions considered by Boserup (1996), five transitions can be accommodatedwithin my PETC framework as a succession of population, environment, technology,and culture: foraging to crop production, village development, Eastern hemispherepastoralism, urbanisation, and industrialisation (Fig. 6.1c)3. In all of these transitions,population growth leads to pressure that derives from the limited environmentalresources, which in turn stimulates technological and organisational change, andlater results in cultural changes that are evident in cults, social hierarchies, women’s
3 The sixth transition—western European fertility decline—follows a different path as a successionof technology, environment, culture, and last population; it is not considered here.
6 Malthusian Assumptions, Boserupian Response in Transition . . . 91
status, and status symbols. Within this group of five transitions, Boserup’s model ofvillage development, in addition, has a direct population–technology link and allowsfor feedback regarding the land resources on occupational structure (dotted lines inFig. 6.1c). Furthermore, her model of the foraging to farming transition includes afeedback from culture to organisational structure (not shown).
6.3 A Combined Model and “Real” World Application
Here, I suggest a different model of population development that considersthe foraging to farming transition as an example (Fig. 6.1d). This model isa reduced form of the Global Land Use and technological Evolution Simu-lator (GLUES, described below), which has been operationally applied to anumber of problems in archaeology and climate research (Kaplan et al. 2011;Lemmen and Wirtz 2010, 2012; Lemmen et al. 2011). The reduced model sharesthe functional characteristics of the full model, but it is not spatially explicit and thebiogeographic and climate background is considered to be constant (see Appendixfor equations).
Regarding the PETC framework, the dynamics between population, environment,technology and culture include the following (Fig. 6.1d, cmp. Boserup 1996, p. 509):
1. P →T → P Population growth stimulates innovation by aggregation and diversity.Innovations in, e.g., health care, increase population;
2. P → E → P Higher population uses increasingly more land for hunting andexerts pressure on the game stock, higher population densities damage the envi-ronment, and food shortage leads to reduced fertility (preventive check) or highermortality (positive check). The rising capacity of the environment supports largerpopulations;
3. T → E More intensive foraging or farming strategies damage the environment,while efficiency gains lead to higher environmental capacity;
4. T → C Adoption of novel technologies induces changes in social structure wherespecialists and leaders or cults emerge;
5. C → P Family and social structure change reproduction rates.
Richerson and Boyd (1998) claim that basically all models that are rooted in ecologyare Neomalthusian in essence, i.e., they can be characterised by a P → T → E loopin Boserup’s (1996) framework. This loop can be detected in my model, as well;in fact, historically, the model developed from ecosystem models of tree stands oralgal communities (Wirtz and Eckhardt 1996). Unlike many other models, however,GLUES is based on coevolutionary dynamics of technologies and population andhas no a priori information on whether there is an (Malthusian) “invention-pull viewof population history” (Lee 1986, p. 98), or whether population is the (Boserupian)driver of development4. Applications of GLUES show an emergent emancipationof population development from the environment with increasing population andinnovation (Lemmen and Wirtz 2010, 2012; Lemmen et al. 2011).
4 See also Simon (1993) for a detailed discussion.
92 C. Lemmen
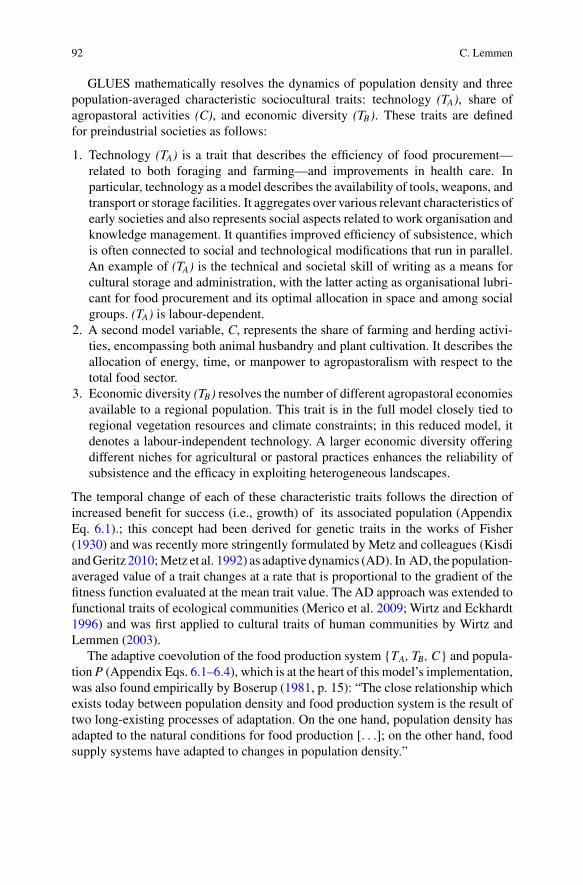
GLUES mathematically resolves the dynamics of population density and threepopulation-averaged characteristic sociocultural traits: technology (TA), share ofagropastoral activities (C), and economic diversity (TB). These traits are definedfor preindustrial societies as follows:
1. Technology (TA) is a trait that describes the efficiency of food procurement—related to both foraging and farming—and improvements in health care. Inparticular, technology as a model describes the availability of tools, weapons, andtransport or storage facilities. It aggregates over various relevant characteristics ofearly societies and also represents social aspects related to work organisation andknowledge management. It quantifies improved efficiency of subsistence, whichis often connected to social and technological modifications that run in parallel.An example of (TA) is the technical and societal skill of writing as a means forcultural storage and administration, with the latter acting as organisational lubri-cant for food procurement and its optimal allocation in space and among socialgroups. (TA) is labour-dependent.
2. A second model variable, C, represents the share of farming and herding activi-ties, encompassing both animal husbandry and plant cultivation. It describes theallocation of energy, time, or manpower to agropastoralism with respect to thetotal food sector.
3. Economic diversity (TB) resolves the number of different agropastoral economiesavailable to a regional population. This trait is in the full model closely tied toregional vegetation resources and climate constraints; in this reduced model, itdenotes a labour-independent technology. A larger economic diversity offeringdifferent niches for agricultural or pastoral practices enhances the reliability ofsubsistence and the efficacy in exploiting heterogeneous landscapes.
The temporal change of each of these characteristic traits follows the direction ofincreased benefit for success (i.e., growth) of its associated population (AppendixEq. 6.1).; this concept had been derived for genetic traits in the works of Fisher(1930) and was recently more stringently formulated by Metz and colleagues (Kisdiand Geritz 2010; Metz et al. 1992) as adaptive dynamics (AD). In AD, the population-averaged value of a trait changes at a rate that is proportional to the gradient of thefitness function evaluated at the mean trait value. The AD approach was extended tofunctional traits of ecological communities (Merico et al. 2009; Wirtz and Eckhardt1996) and was first applied to cultural traits of human communities by Wirtz andLemmen (2003).
The adaptive coevolution of the food production system {TA, TB , C} and popula-tion P (Appendix Eqs. 6.1–6.4), which is at the heart of this model’s implementation,was also found empirically by Boserup (1981, p. 15): “The close relationship whichexists today between population density and food production system is the result oftwo long-existing processes of adaptation. On the one hand, population density hasadapted to the natural conditions for food production [. . .]; on the other hand, foodsupply systems have adapted to changes in population density.”
6 Malthusian Assumptions, Boserupian Response in Transition . . . 93
PET trajectories
a b
Innovativity vs. pressure
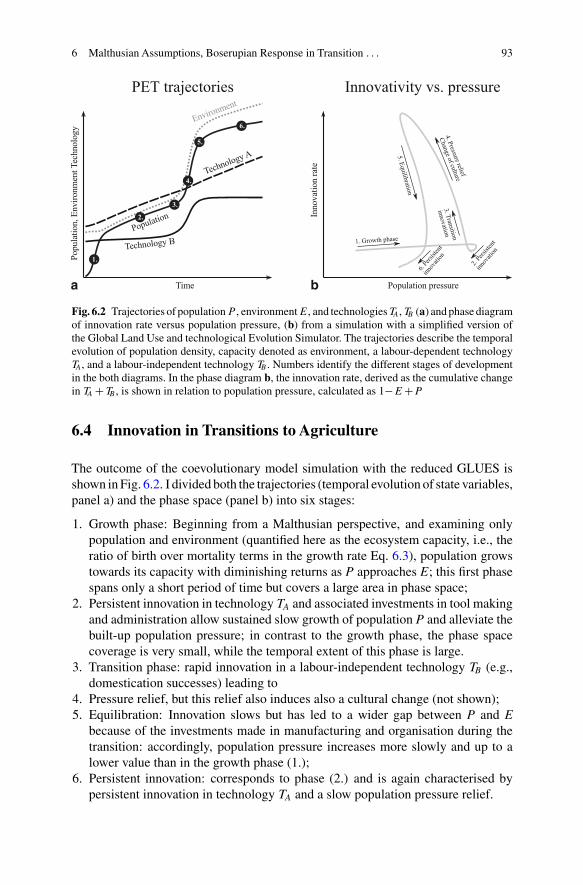
Fig. 6.2 Trajectories of population P , environment E, and technologies TA, TB (a) and phase diagramof innovation rate versus population pressure, (b) from a simulation with a simplified version ofthe Global Land Use and technological Evolution Simulator. The trajectories describe the temporalevolution of population density, capacity denoted as environment, a labour-dependent technologyTA, and a labour-independent technology TB . Numbers identify the different stages of developmentin the both diagrams. In the phase diagram b, the innovation rate, derived as the cumulative changein TA + TB , is shown in relation to population pressure, calculated as 1− E + P
6.4 Innovation in Transitions to Agriculture
The outcome of the coevolutionary model simulation with the reduced GLUES isshown in Fig. 6.2. I divided both the trajectories (temporal evolution of state variables,panel a) and the phase space (panel b) into six stages:
1. Growth phase: Beginning from a Malthusian perspective, and examining onlypopulation and environment (quantified here as the ecosystem capacity, i.e., theratio of birth over mortality terms in the growth rate Eq. 6.3), population growstowards its capacity with diminishing returns as P approaches E; this first phasespans only a short period of time but covers a large area in phase space;
2. Persistent innovation in technology TA and associated investments in tool makingand administration allow sustained slow growth of population P and alleviate thebuilt-up population pressure; in contrast to the growth phase, the phase spacecoverage is very small, while the temporal extent of this phase is large.
3. Transition phase: rapid innovation in a labour-independent technology TB (e.g.,domestication successes) leading to
4. Pressure relief, but this relief also induces also a cultural change (not shown);5. Equilibration: Innovation slows but has led to a wider gap between P and E
because of the investments made in manufacturing and organisation during thetransition: accordingly, population pressure increases more slowly and up to alower value than in the growth phase (1.);
6. Persistent innovation: corresponds to phase (2.) and is again characterised bypersistent innovation in technology TA and a slow population pressure relief.
94 C. Lemmen
Figure 6.2 provides key insight. What can be learned about the relationship betweenpopulation pressure and innovation? (i) Innovation is greatest at high populationpressure. (ii) In this model, innovation always occurs; at no time, the technologychange is negative. (iii) The relationship between innovation and population pressurechanges profoundly during the foraging-farming transition; three different regimescan be identified: (i) a positive relationship where acceleration of innovation corre-sponds to population pressure increases (phases 1, 2, 6), (ii) a negative relationshipwith pressure relief during accelerating innovation (phase 3, 4), and (iii) a negativerelationship with deceleration of innovation at increasing pressure (phase 5).
A superficial analysis would find that population pressure is the motor of in-novation in this example: population increases seemingly precede the stepwisetechnological change (Fig. 6.2a). Only a detailed examination of the phase space(Fig. 6.2b)—especially at the transition phases 2 and 3—shows that innovation de-celerates at very high population pressure and that the largest innovation occursslightly below the highest population pressure. In fact, the driver in the transitiondepicted here is not population, but technology5. Only the different coevolutionarytime scales of population growth (fast) and innovation (slow) yield the seeminglyBoserupian, i.e., population driven, response.
The same mathematical model—plus spatial and biogeographic aspects—havebeen used to successfully simulate the many transitions to agriculture in NeolithicEurope (Lemmen et al. 2011), in good agreement with the radiocarbon record. Addi-tionally, the transitions appear to be Boserupian with critical innovations occurringat high population pressure. If the numerical analysis had not been available (andproved that this phenomenon is in fact technology driven), as shown in the discretelysampled data from observations of technological change, one might erroneouslyconclude that this type of innovation was population driven.
6.5 Conclusion
I presented a reduced version of the Global Land Use and technological Evo-lution Simulator—a numerical model that is capable of realistically simulatingregional foraging-farming transitions worldwide. The simulated—and possibly alsoobserved—transitions are seemingly Boserupian, i.e., population driven: innovationis greatest when population pressure is high. Analytical examination of the model,however, shows that technological change is the driver of these phenomena and that,in the context of a simplified version of Boserup’s (1996) framework in developmenttheory, the model should be classified as Neomalthusian. I thus demonstrated thatBoserupian appearance may be based on Malthusian assumptions; I caution not toinfer too quickly a Boserupian mechanism for an observed real world system whenits dynamics appears to be driven by population pressure.
5 There would be no evolution of T without P due to the coevolutionary definition of the system.The dynamics of T, however, leads the dynamics of P at the foraging-farming transition.
6 Malthusian Assumptions, Boserupian Response in Transition . . . 95
Acknowledgments This study was partly funded by the German National Science Foundation(DFG priority project 1266 Interdynamik) and by the PACES program of the Helmholtz Gemein-schaft. The paper received great stimulus from discussions during the Ester Boserup Conference2010—A Centennial Tribute: Long-term trajectories in population, gender relations, land use, andthe environment, November 15–17, 2010 in Vienna, Austria. I received helpful comments fromtwo anonymous reviewers. GLUES is free and open source software and can be obtained fromhttp://glues.sourceforge.net/.
Appendix: The Reduced GLUES Model
A coevolutionary system of population P and characteristic traits X ∈ {TA, TB , C} isdefined by the evolution equations
dP
dt= P · r , (6.1)
dX
dt= δX · ∂r
∂X, (6.2)
where r denotes the specific growth rate of population P, and the δX are variabilitymeasures for each X. Growth rate r is defined as
r = μ · (1 − ωTA) ·(
1 − γ√
TAP)
· SI − ρ · T −1A · P , (6.3)
with coefficients μ, ρ, ω, and γ . In this formulation, the positive term includingfood production SI is modulated by labour loss for administration (−ωTA) and byoverexploitation of the environment
(−γ√
TAP). Food production depends on the
cultural system C and available technologies as follows:
SI = (1 − C) · √TA + C · TA · TB , (6.4)
where the left summand denotes foraging activities and the right summand agropas-toral practice. To produce the results for Fig. 6.2, I assumed the following parametervalues: μ = ρ = 0.004, ω = 0.04, γ = 0.12, δTA
= 0.025, δTB= 0.9, a vari-
able δC = C · (1 − C), and initial values P0 = 0.01, TA,0 = 1.0, TB,0 = 0.8, andC0 = 0.04.
Open Access This chapter is distributed under the terms of the Creative CommonsAttribution Noncommercial License, which permits any noncommercial use, distri-bution, and reproduction in any medium, provided the original author(s) and sourceare credited.
References
Barker, G. (2011). Archaeology: The cost of cultivation. Nature, 473, 163–164. http://dx.doi.org/10.1038/473163a.
Bogaard, A. (2005). Garden agriculture and the nature of early farming in Europe and the NearEast. World Archaeology, 37(2), 177–196. http://dx.doi.org/10.1080/00438240500094572.
96 C. Lemmen
Boserup, E. (1965). The conditions of agricultural growth: The economics of agrarian changeunder population pressure. Chicago: Aldine.
Boserup, E. (1981). Population and technological change: A study of long-term trends. Chicago:University of Chicago Press.
Boserup, E. (1996). Development theory: An analytical framework and selected application.Population and Development Review, 22(3), 505–515.
Boyd, R., & Richerson, P. J. (1995). Why does culture increase human adaptability? Ethology andSociobiology, 16, 125–143. http://dx.doi.org/10.1016/0162-3095(94)00073-G.
Childe, V. G. (1925). The dawn of European civilization. London: Kegan Paul, Trench, Trubner.Crutzen, P. J. (2002). Geology of mankind. Nature, 415, 23. http://dx.doi.org/10.1038/415023a.Crutzen, P. J., & Stoermer, E. F. (2000). The anthropocene. IGBP Newsletter, 41(1), 17–18.Darwin, C. (1859). The origin of species (repr. 1958). Hayes Barton Press.Diamond, J., & Bellwood, P. (2003). Farmers and their languages: The first expansions. Science,
300(5619), 597–603. http://dx.doi.org/10.1126/science.1078208.Fisher, R. A. (1930). The genetical theory of natural selection. Oxford: Clarendon Press.Kaplan, J. O., Krumhardt, K. M., & Zimmermann, N. (2009). The prehistoric and prein-
dustrial deforestation of Europe. Quaternary Science Reviews, 28(27/28), 3016–3034.http://dx.doi.org/10.1016/j.quascirev.2009.09.028.
Kaplan, J. O., Krumhardt, K. M., Ellis, E. C., Ruddiman, W. F., Lemmen, C., & Klein Goldewijk,K. (2011). Holocene carbon emissions as a result of anthropogenic land cover change. TheHolocene, 21(5), 775–791. http://dx.doi.org/10.1177/0959683610386983.
Kisdi, É., & Geritz, S. A. H. (2010). Adaptive dynamics: A framework to model evolutionin the ecological theatre. Journal of Mathematical Biology, 61(1), 165–169. http://dx.doi.org/10.1007/s00285-009-0300-9.
Kuijt, I., & Goring-Morris, N. (2002). Foraging, farming, and social complexity in the pre-potteryNeolithic of the southern Levant: A review and synthesis. Journal of World Prehistory, 16(4),361–440. http://dx.doi.org/10.1023/A:1022973114090.
Lee, R. (1986). Malthus and Boserup: A dynamic synthesis. In D. Coleman & R. Schofield (Eds.),The state of population theory: Forward from Malthus (pp. 96–130). Oxford: B. Blackwell.
Lemmen, C. (2010). World distribution of land cover changes during pre- and protohistoric timesand estimation of induced carbon releases. Géomorphologie: Relief, Processus, Environnement,2009(4), 303–312. http://dx.doi.org/10.4000/geomorphologie.7756.
Lemmen, C., & Wirtz, K. W. (2010). Socio-technological revolutions and migration waves: Re-examining early world history with a mathematical model. In D. Gronenborn & J. Petrasch(Eds.), The spread of the Neolithic to Central Europe, RGZM Tagungen (Vol. 4, pp. 25–38).Mainz: Römisch-Germanisches Zentralmuseum.
Lemmen, C., & Wirtz, K. W. (2012). On the sensitivity of the simulated EuropeanNeolithic transition to climate extremes. Journal of Archaeological Science, http://dx.doi.org/10.1016/j.jas.2012.10.023. (online first).
Lemmen, C., Gronenborn, D., & Wirtz, K. W. (2011). A simulation of the Neolithic transi-tion in Western Eurasia. Journal of Archaeological Science, 38, 3459–3470. http://dx.doi.org/10.1016/j.jas.2011.08.008.
Londo, J. P., Chiang, Y.-C., Hung, K.-H., Chiang, T.-Y., & Schaal, B. A. (2006). Phylogeographyof asian wild rice, Oryza rufipogon, reveals multiple independent domestications of cultivatedrice, Oryza sativa. PNAS, 103, 9578–9583. http://dx.doi.org/10.1073/pnas.0603152103.
Malthus, T. (1798). An essay on the principle of population. In F. Elwell (Ed.), A commentary onMalthus’ 1798 essay on the principle of population as social theory (pp. 127–294). Lewiston:Mellen Press. (Commentary printed in 2001).
Malthus, T. (1826). An essay on the principle of population. Cambridge: Cambridge UniversityPress (Edited by Patricia James [1989]).
Marquette, C. (1997). Turning but not toppling Malthus: Boserupian theory on population andthe environment relationships. Working papers in development studies and human rights 16,Bergen. Norway: Chr. Michelsen Institute.
6 Malthusian Assumptions, Boserupian Response in Transition . . . 97
Merico, A., Bruggeman, J., & Wirtz, K. W. (2009). A trait-based approach for downscal-ing complexity in plankton ecosystem models. Ecological Modelling, 220(21), 3001–3010.http://dx.doi.org/10.1016/j.ecolmodel.2009.05.005.
Metz, J. A. J., Nisbet, R. M., & Geritz, S. A. H. (1992). How should we define “fitness” forgeneral ecological scenarios. Trends in Ecology and Evolution, 7, 198–202. http://dx.doi.org/10.1016/0169-5347(92)90073-K.
Ricardo, D. (1821). Principles of political economy (3rd ed.). London: John Murray.Richerson, P., & Boyd, R. (1998). Homage to Malthus, Ricardo, and Boserup: Toward a general the-
ory of population, economic growth, environmental deterioration, wealth, and poverty. HumanEcology Review, 4, 85–90.
Ruddiman, W. F. (2003). The anthropogenic greenhouse era began thousands of years ago. ClimaticChange, 61(3), 261–293. http://dx.doi.org/10.1023/B:CLIM.0000004577.17928.fa.
Sahlins, M. (1972). Stone age economics. New York: Aldine de Gruyter.Simon, J. L. (1993). Economic thought about population consequences: Some reflections. Journal
of Population Economics, 6(2), 137–152. http://dx.doi.org/10.1007/BF00178558.Smith, A. (1776). The wealth of nations (repr. 1937). New York: Modern Library.Sober, E. R. (1992). Darwin’s nature. In J. Torrance (Ed.), The concept of nature (pp. 84–96).
Oxford: Clarendon Press.Stocker, B. D., Strassmann, K., & Joos, F. (2011). Sensitivity of holocene atmospheric CO2 and
the modern carbon budget to early human land use: Analyses with a process-based model.Biogeosciences, 8, 69–88. http://dx.doi.org/10.5194/bg-8-69-2011.
Turchin, P., & Nefedov, S. (2009). Secular cycles. Princeton: Princeton University Press.Weisdorf, J. L. (2005). From foraging to farming: Explaining the neolithic revolution. Journal of
Economic Surveys, 19(4), 561–586. http://dx.doi.org/10.1111/j.0950-0804.2005.00259.x.Wirtz, K. W., & Eckhardt, B. (1996). Effective variables in ecosystem models with an application
to phytoplankton succession. Ecological Modelling, 92, 33–53. http://dx.doi.org/10.1016/0304-3800(95)00196-4.
Wirtz, K. W., & Lemmen, C. (2003). A global dynamic model for the neolithic transition. ClimaticChange, 59(3), 333–367. http://dx.doi.org/10.1023/A:1024858532005.