major and trace element geochemistry in the upper niger river (mali): physical and chemical...
TRANSCRIPT
Major and trace element geochemistry in the upper Niger river
(Mali): physical and chemical weathering rates and
CO2 consumption
Cecile Picouet a,*, Bernard Dupre b, Didier Orange c, Michel Valladon b
aInstitut de Recherche pour le Developpement, IRD-Hydrologie, B.P. 5045, 34032 Montpellier cedex, FrancebLaboratoire d’etude des mecanismes de transfert en Geologie/LMTG-UMR5563, 38 rue des 36 ponts, 31400 Toulouse, FrancecIRD, Laboratoire de Biogeochimie Isotopique, Universite Paris VI, Case 120, 4 place Jussieu, 75252 Paris cedex 05, France
Received 1 February 2001; accepted 5 October 2001
Abstract
This study describes the chemistry of the upper Niger river system upstream of the inland delta in Mali. It constitutes the first
geochemical investigation of suspended and dissolved loads of this region of the world. The Niger, on its way between Banankoro
and Ke-Macina and its tributary, the Bani river at Douna, were sampled during eight hydrological years (from 1991/1992 to 1997/
1998). Major elements were determined for all 8 years and trace elements during 2 years (1996/1997 and 1997/1998). The total
period of investigation is representative of the hydrological fluctuations over the last 25 years. Dissolved concentrations show that
in comparison with other rivers, the upper Niger rivers are among the least mineralised and are strongly influenced by silicate
rocks, which underlie almost the totality of the basin. The contribution of atmospheric precipitation to the rivers’ chemistry (using
the technique of marine contribution) appears very low. Normalised to the upper crust, the chemical composition of the different
phases shows that in each tributary, suspended sediment and dissolved load are chemically complementary for the most soluble
elements (Ca, Na, Sr, K, Ba, Rb andU). The depletion of these elements in the suspended phase (and the corresponding enrichment
in the dissolved phase) is related to their high chemical mobility during silicate weathering. The variability over the hydrological
year of trace elements in suspended matter has been attributed to the mixing between inputs of clay minerals and quartz. The
distribution of the dissolved particulate ratio in the upper Niger basin leads to the conclusion that for the majority of elements, the
sediment content controls the quantity of elements in the dissolved phase. As carbonate outcrops are insignificant in the upper
Niger basin, it is possible to calculate chemical denudation rates by correcting water quality for atmospheric inputs. For the studied
period, the denudation rates found range from 0.2 to 1.9�106 tons/year, corresponding to 26�103 to 100�103 mol CO2/km2/year.
Physical denudation rates were also estimated and range from 3.9 to 8.2 tons/km2/year. It appears that the low values of these
chemical and physical denudation rates are related to a number of factors such as the lithology (silicate rocks), the lack of tectonism
(permitting thick soil formation that limits bedrock weathering) and low precipitation (limiting runoff). Finally, a simple steady
state model has been applied to the chemical composition of dissolved and solid products of silicate weathering. This model shows
a good agreement between the modelled and the measured values of the suspended sediment concentrations, thus confirming the
existence of steady state conditions in this tropical area. D 2002 Elsevier Science B.V. All rights reserved.
Keywords: Geochemistry; Chemical and physical denudation rates; Steady state; River Niger
0009-2541/02/$ - see front matter D 2002 Elsevier Science B.V. All rights reserved.
PII: S0009 -2541 (01 )00398 -9
* Corresponding author. Blancherie 32, CH-1022 Chavannes pres Renens, Switzerland. Tel.: +41-21-634-5032; fax: +41-21-693-3739.
E-mail address: [email protected] (C. Picouet).
www.elsevier.com/locate/chemgeo
Chemical Geology 185 (2002) 93–124
1. Introduction
Large rivers are the major pathways for the transport
of erosion products from the continents to the oceans.
They are studied by geochemists to estimate the fluxes
of continental material supplied to the oceans, to in-
vestigate the erosion processes on a global scale and to
calculate chemical and physical denudation rates. They
also provide important information on CO2 consump-
tion through the acid degradation of continental rocks
(e.g., Stallard and Edmond, 1983; Milliman and
Meade, 1983; Meybeck, 1987; Negrel et al., 1993;
Probst et al., 1992; Summerfield and Hulton, 1994;
Boeglin and Probst, 1998; Gaillardet et al., 1995, 1997,
1999a; Roy et al., 1999). Such studies also enable
important information concerning the average chem-
ical and isotopic characteristics of the earth’s continen-
tal crust to be deduced (Taylor and McLennan, 1985;
Gaillardet et al., 1995; Dupre et al., 1996, Ramesh et
al., 2000) and the processes which govern elemental
distribution between particulate and solution phases in
rivers (e.g., Goldstein and Jacobsen, 1988, Zhang et al.,
1994; Dupre et al., 1996; Gaillardet et al., 1997; Elbaz-
Poulichet et al., 1999; Tricca et al., 1999).
This paper presents the results of a major research
programme on the Niger basin upstream of the inland
delta (upper Niger) to determine the presence of trace
and major elements in the dissolved and solid phases.
The study was carried out by IRD (Institut de Re-
cherche pour le Developpement, France) during the
period 1991/1992 to 1997/1998 (e.g., Olivry et al.,
1995b; Bricquet et al., 1997a; Olivry, 1998) and only
from 1996/1997 to 1997/1998 for trace elements
(Picouet, 1999). The purpose of this paper is to elu-
cidate the origin and behaviour of major and trace ele-
ments in these rivers and to determine their distribution
patterns. Additionally, it estimates the present rock
weathering rate and the flux of atmospheric/soil CO2
consumption in the upper Niger basin.
2. Main features of the Niger basin upstream of the
inland delta
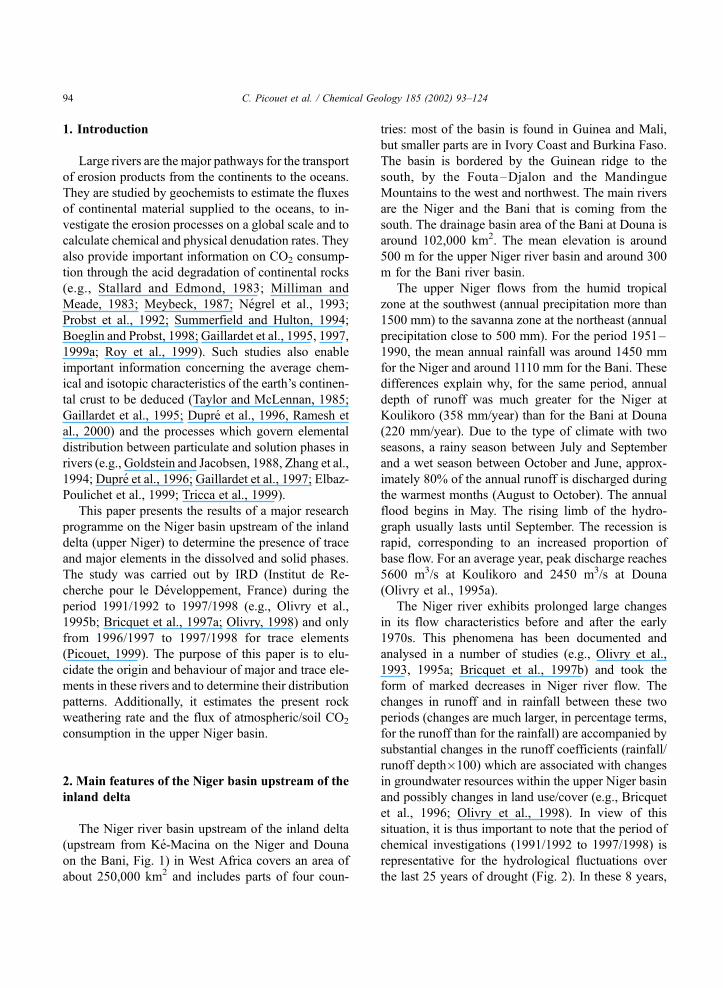
The Niger river basin upstream of the inland delta
(upstream from Ke-Macina on the Niger and Douna
on the Bani, Fig. 1) in West Africa covers an area of
about 250,000 km2 and includes parts of four coun-
tries: most of the basin is found in Guinea and Mali,
but smaller parts are in Ivory Coast and Burkina Faso.
The basin is bordered by the Guinean ridge to the
south, by the Fouta–Djalon and the Mandingue
Mountains to the west and northwest. The main rivers
are the Niger and the Bani that is coming from the
south. The drainage basin area of the Bani at Douna is
around 102,000 km2. The mean elevation is around
500 m for the upper Niger river basin and around 300
m for the Bani river basin.
The upper Niger flows from the humid tropical
zone at the southwest (annual precipitation more than
1500 mm) to the savanna zone at the northeast (annual
precipitation close to 500 mm). For the period 1951–
1990, the mean annual rainfall was around 1450 mm
for the Niger and around 1110 mm for the Bani. These
differences explain why, for the same period, annual
depth of runoff was much greater for the Niger at
Koulikoro (358 mm/year) than for the Bani at Douna
(220 mm/year). Due to the type of climate with two
seasons, a rainy season between July and September
and a wet season between October and June, approx-
imately 80% of the annual runoff is discharged during
the warmest months (August to October). The annual
flood begins in May. The rising limb of the hydro-
graph usually lasts until September. The recession is
rapid, corresponding to an increased proportion of
base flow. For an average year, peak discharge reaches
5600 m3/s at Koulikoro and 2450 m3/s at Douna
(Olivry et al., 1995a).
The Niger river exhibits prolonged large changes
in its flow characteristics before and after the early
1970s. This phenomena has been documented and
analysed in a number of studies (e.g., Olivry et al.,
1993, 1995a; Bricquet et al., 1997b) and took the
form of marked decreases in Niger river flow. The
changes in runoff and in rainfall between these two
periods (changes are much larger, in percentage terms,
for the runoff than for the rainfall) are accompanied by
substantial changes in the runoff coefficients (rainfall/
runoff depth�100) which are associated with changes
in groundwater resources within the upper Niger basin
and possibly changes in land use/cover (e.g., Bricquet
et al., 1996; Olivry et al., 1998). In view of this
situation, it is thus important to note that the period of
chemical investigations (1991/1992 to 1997/1998) is
representative for the hydrological fluctuations over
the last 25 years of drought (Fig. 2). In these 8 years,
C. Picouet et al. / Chemical Geology 185 (2002) 93–12494
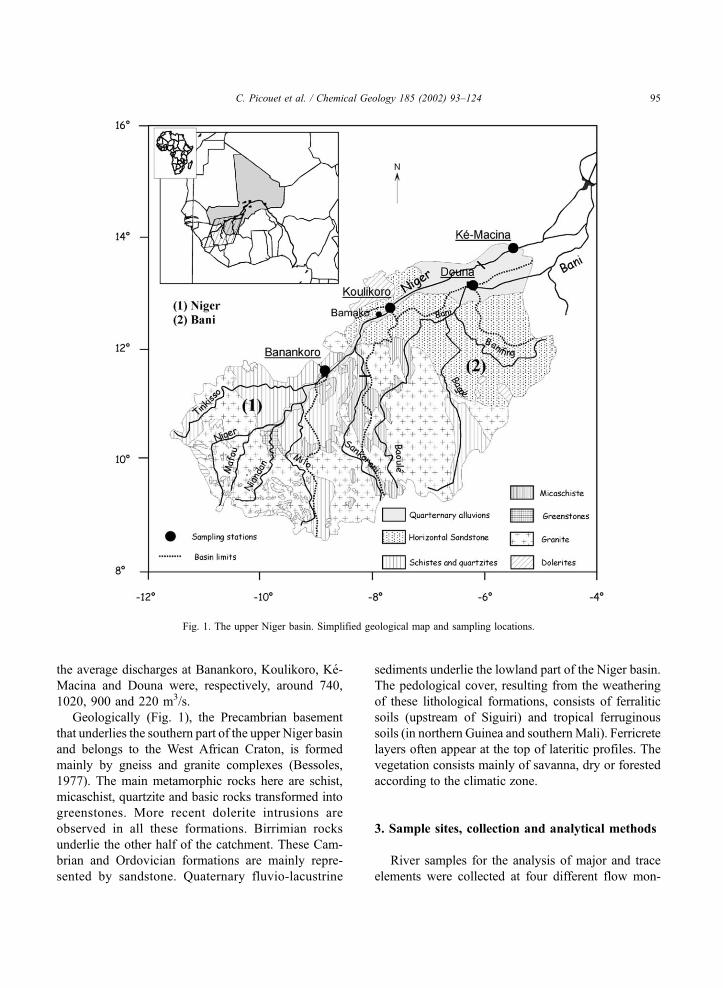
the average discharges at Banankoro, Koulikoro, Ke-
Macina and Douna were, respectively, around 740,
1020, 900 and 220 m3/s.
Geologically (Fig. 1), the Precambrian basement
that underlies the southern part of the upper Niger basin
and belongs to the West African Craton, is formed
mainly by gneiss and granite complexes (Bessoles,
1977). The main metamorphic rocks here are schist,
micaschist, quartzite and basic rocks transformed into
greenstones. More recent dolerite intrusions are
observed in all these formations. Birrimian rocks
underlie the other half of the catchment. These Cam-
brian and Ordovician formations are mainly repre-
sented by sandstone. Quaternary fluvio-lacustrine
sediments underlie the lowland part of the Niger basin.
The pedological cover, resulting from the weathering
of these lithological formations, consists of ferralitic
soils (upstream of Siguiri) and tropical ferruginous
soils (in northern Guinea and southernMali). Ferricrete
layers often appear at the top of lateritic profiles. The
vegetation consists mainly of savanna, dry or forested
according to the climatic zone.
3. Sample sites, collection and analytical methods
River samples for the analysis of major and trace
elements were collected at four different flow mon-
Fig. 1. The upper Niger basin. Simplified geological map and sampling locations.
C. Picouet et al. / Chemical Geology 185 (2002) 93–124 95
itoring stations: Banankoro, Koulikoro and Ke-Mac-
ina are located on the Niger and Douna on the Bani
(Fig. 1). Discharge, concentration of suspended sedi-
ment and major dissolved elements were analysed
during eight hydrological years (1991/1992 to 1997/
1998). Trace elements in the dissolved and suspended
phases were only monitored for two hydrological
years (1996/1997 and 1997/1998).
3.1. Major elements
Samples from the subsurface (at 40 cm depth and in
the middle of the river) were collected twice a month.
After collection, the samples were stored in the dark at
each sampling location. Every 2 months, these samples
of 1 l each were brought back to the Bamako laboratory
where they were filtered with 0.2 mm cellulosic nitrate
filters. Suspended sediments were isolated. Further
chemical analysis was performed at the IRD laboratory
in France. Between 1991 and 1996, the concentrations
of SO42�, NO3
� and Cl� were determined by ionic
chromatography with a detection limit of 0.5 mg/l. The
cations Ca2+, Mg2+, Na+ and K+ were analysed by
atomic absorption with a detection limit of 0.001 mg/l.
Dissolved silica was measured by plasma spectropho-
tometry, with a detection limit of 1 mmol/l. From 1997,
both cations and anions were measured by ionic chro-
matography. The detection limits for the cations were:
Ca: 0.1 mg/l; Mg: 0.05 mg/l; K: 0.025 mg/l; Na: 0.05
mg/l; NH4: 0.05 mg/l; for the anions: 0.05 mg/l.
Sampling methods and analytical methods were
described in more detail in Gourcy (1994) and Picouet
(1999).
3.2. Trace elements
3.2.1. Sampling and filtration
For the determination of trace elements, eight or
nine samples were collected at each gauging station at
different river stages. Acid-washed polyethylene con-
tainers were used (250 ml). Samples were collected by
hand from the subsurface water (40 cm depth and in
the middle of the river). The acid-washed polyethy-
lene containers were closed into the stream. Two
groups of samples were collected: bulk samples (for
total phase analyses) and filtration samples (for the
dissolved phase analyses). Immediately after collec-
tion, the second group of samples was filtered on-site
through a 0.2-mm cellulose acetate filter. The filtration
was performed with a pressurised Sartorus1 teflon
unit enclosed in a plastic chamber (homemade in
Mali) to minimize the potential for introducing air-
borne contaminants. Filtered stream samples were
then stored in polypropylene acid-washed bottles.
Filtration blanks were run on the field before the
stream sample filtrations. During the field trip, all
the equipment used to prepare and preserve the stream
samples for laboratory analyses is placed in clean
plastic bags and then in a plastic box. All working
procedures (sampling, filtration, storing) were carried
out within standard guidelines in order to minimise
contamination.
3.2.2. Analyses
Trace elements were analysed in the dissolved
phase obtained after filtration (see above) and in the
total phase (bulk sample) obtained after evaporation
and attack with HF/HNO3. The choice of using the
total phase is based on the fact that the concentration
of suspended sediment is very low. The concentration
of trace elements in the particulate phase can be then
obtained with the following equation:
CP ¼CT � CD
SSMð1Þ
where CP is the concentration in ppm of trace element
in the particulate phase; CT, the concentration in ppb
of trace element in the total phase; CD, the concen-
Fig. 2. Annual water discharge at the Koulikoro gauging station
(Niger River) from 1970 to 1999. Average discharge for the period
1970–1997.
C. Picouet et al. / Chemical Geology 185 (2002) 93–12496
tration in ppb of trace element in the dissolved phases;
and SSM, the suspended sediment matter in mg/l.
A procedure similar to the one used by Freydier et
al. (1998) was applied to the bulk sample before the
analyses. An aliquot of the sample (10 ml) was evapo-
rated in a Teflon beaker at 40–50 �C. The residue wastreated with 1:1 HF/HNO3 and evaporated during 12 h
at 80 �C. The HF/HNO3 solution was then evaporated
(40–50 �C) and diluted in 10 ml distilled water with
2% HNO3. These operations were performed under a
laminar airflow bench. Blanks with deionised water
were submitted to the same treatment as the sample.
Concentrations observed in the blanks were negligible
compared to river sample concentrations.
The concentrations of trace elements in the dis-
solved and total phases were measured by Inductively
Coupled Plasma-Mass Spectrometry (ICP-MS). Sam-
ples were analysed in a Perkin–Elmer ELAN 5000
ICP-MS equipped with a standard pneumatic nebu-
lizer and an automatic sampler (AS-80) and using the
internal standard method with Indium (Dupre et al.,
1996). The samples, reference samples for the internal
standard method and blanks were treated with 2%
HNO3 solutions. The accuracy and precision of the
analytical method were tested using the SLRS-3 stan-
dard (National Research Council Canada), which has
certified concentrations for certain elements (Mg, V,
Cr, Mn, Co, Ni, Zn, Rb, Sr, Ba, Pb, U, Al, Fe). The es-
timated uncertainties for trace elements are two sta-
ndard deviations of the concentrations. For Mg, Mn,
Rb, Sr, Ba, U, Al and Fe, concentrations were found
to be in agreement with the certified values at approx-
imately 10%. Greater uncertainties were estimated for
Ni (11%), V (12%), Cu (14%), Pb (14%), Co (20%),
Cr (24%) and above all Zn (42%). Detection limits
(Table 2a) were calculated according to normal con-
ventions (Vandecasteele and Block, 1993) with 12
HNO3 blanks.
Concentrations in the blanks were not significant
for any of the elements when compared to the concen-
tration of the river samples. Potential contamination
during filtration due to containers or environmental
features was also tested using filtration blanks, both in
the laboratory and in the field. The comparison bet-
ween these two filtration blanks showed that the differ-
ences in concentration are not significant for any of the
elements except for Zn which was therefore excluded
from further analysis. Mg, Al and Mn presented very
low concentrations in the blanks probably due to the
filter and/or the environment of the filtration in the
field.
4. Results
4.1. Dissolved load
4.1.1. Major elements
The mean chemical composition (volume weighted
mean concentrations) for the different gauging sta-
tions is shown in Table 1. The total cation charge (R+),
the total anion charge (R�), the charge balance
defined in percentage as R+�R�%=200�(R+�R�)/
(R++R�), the total dissolved load (TDS) and the
suspended sediment concentration (SSM) are also
given. The Niger and its tributary, the Bani, have very
low mineralisation (300<R+<430 meq/l). The least
mineralised site is on the Niger at Banankoro, while
the Bani at Douna is the most mineralised. These
values are very low compared to the mean total cation
charge of other unpolluted rivers of the world (800
meq/l, Meybeck et al., 1996). TDS values, ranging
from 38 to 49 mg/l, are in agreement with data on the
Niger presented by Gourcy (1994) and Boeglin and
Probst (1996). They are also similar to the values
obtained in other West African rivers: 36.4 mg/l for
the Congo at Brazzaville (Laraque et al., 1995), 48
mg/l for the Oubangui at Bangui (Orange et al., 1995),
42 mg/l for the Senegal at Bakel (Gac, 1986), 44 mg/l
for the Gambia (Meybeck et al., 1987) and about 33.0
mg/l for tributaries of the upper Niger river in the
Fouta Djalon (Orange, 1992).
Table 1 shows some other characteristics of the
Niger.
(1) The concentration of anions follows the order
HCO3>Cl>NO3>SO4. HCO3 is the most abundant
anion in each river; it accounts for 90% of the dissolved
ions (in meq/l). Among the cations, Na is slightly
dominant for the Niger at Banankoro, accounting for
about 30% of the total cations (in meq/l). Concentra-tions of cations vary in the order Na>Ca>Mg=K in this
river. For the Bani at Douna, Ca is dominant (in meq/l).Here, the concentration of cations follows the order
Ca>Na>Mg>K. Variations in bedrock composition
lead to the differences in stream water chemistry
observed between the Niger and the Bani rivers. This
C. Picouet et al. / Chemical Geology 185 (2002) 93–124 97
slight difference corresponds to the fact that there are
more sandstone formations in the Bani catchment than
in the Niger catchment where granitic formations
dominate. Indeed, it has been known for a long time
that lithology is a key factor for most major dissolved
elements in streamwater: for example, the abundance
of Na (in meq/l) is greater for the monolithologic
catchments characterized by granite rock type than
for the monolithologic catchments characterized by
sandstone rock type and conversely for Ca (Meybeck,
1987; Meybeck, 1994). However, weathering is only
one of several geochemical processes that release Ca to
soil solution and then to stream water: displacement of
Ca from soil exchange sites and mineralization of Ca
associated with soil organic matter may also contribute
to solution Ca fluxes (Likens et al., 1998).
(2) The difference between total cations and anions,
that is, R+�R�% (R+�R�%=200�(R+�R�)/(R++
R�)), is generally less than 5% and nowhere exceeds
10%. This result indicates that organic anions (not
measured in this study) are not abundant in the Niger
when compared, e.g., to the rich organic water of the
Congo (Probst et al., 1992; Dupre et al., 1996; Orange,
1996) and Amazon (Guyot, 1993; Gaillardet et al.,
1997). The dissolved organic carbon concentration was
determined by Picouet (1999) and ranged from 0.9 to 7
mg/l in all gauging stations. These values are in agree-
ment with the world average of 4.2 mg/l estimated by
Meybeck et al. (1996) and are significantly lower than
the values measured in humid tropical sites: e.g., 10 to
20 mg/l on the Mengong in Cameroon (Viers et al.,
1997) and 10.5 mg/l on the Congo at Brazzaville
(Seyler et al., 1995). The upper Niger rivers are there-
fore non-organic rivers.
(3) A major feature of the Niger rivers is that the
dissolved load is dominated by SiO2 and HCO3 which
represent 78% to 81% of the total dissolved load (26%
to 32% of TDS for SiO2 and 49% to 53% for HCO3).
The concentrations of dissolved SiO2, of which the
interannual mean ranges from 203 to 224 mmol/l (11.9
to 13.5 mg/l), are explained by the quantity of silicate
rocks that underlie the catchment. These values are
close to the world average concentration, which is
equal to 10.8 mg/l (Meybeck et al., 1996).
The concentrations of major elements in the upper
Niger stream water show a large variability during the
year in relation with the hydrological cycle (Fig. 3). For
the upper Niger rivers, the total dissolved solids (TDS)
decline in concentration with increased discharge and
vice versa. Such variability, common to most of the
rivers, has been reported by numerous authors (e.g.,
Walling and Foster, 1975; Walling and Webb, 1980;
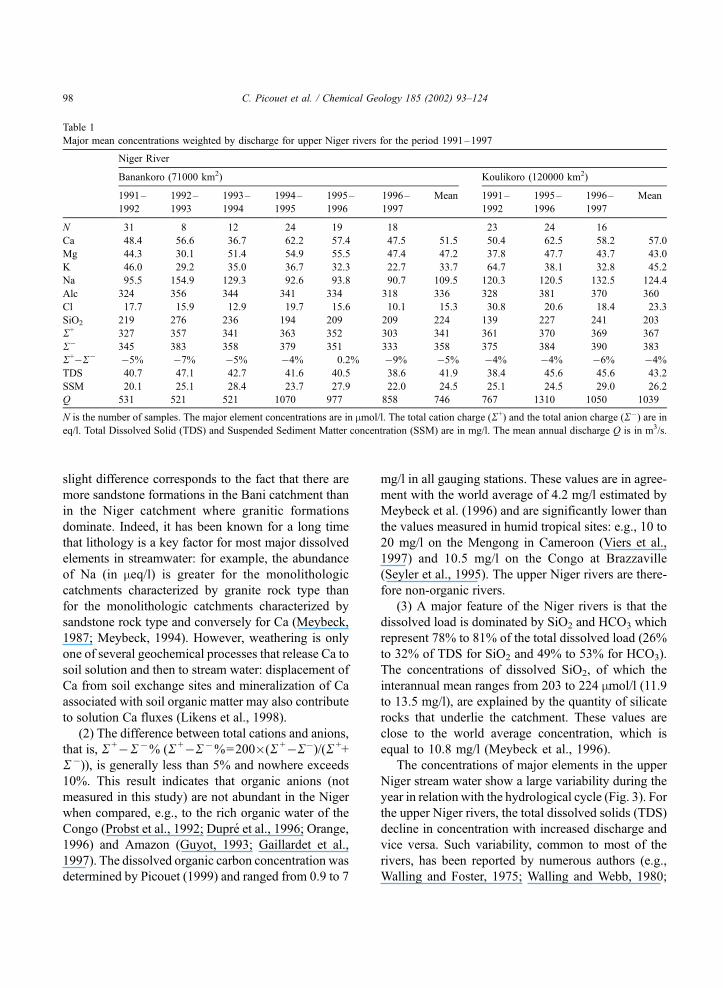
Table 1
Major mean concentrations weighted by discharge for upper Niger rivers for the period 1991–1997
Niger River
Banankoro (71000 km2) Koulikoro (120000 km2)
1991–
1992
1992–
1993
1993–
1994
1994–
1995
1995–
1996
1996–
1997
Mean 1991–
1992
1995–
1996
1996–
1997
Mean
N 31 8 12 24 19 18 23 24 16
Ca 48.4 56.6 36.7 62.2 57.4 47.5 51.5 50.4 62.5 58.2 57.0
Mg 44.3 30.1 51.4 54.9 55.5 47.4 47.2 37.8 47.7 43.7 43.0
K 46.0 29.2 35.0 36.7 32.3 22.7 33.7 64.7 38.1 32.8 45.2
Na 95.5 154.9 129.3 92.6 93.8 90.7 109.5 120.3 120.5 132.5 124.4
Alc 324 356 344 341 334 318 336 328 381 370 360
Cl 17.7 15.9 12.9 19.7 15.6 10.1 15.3 30.8 20.6 18.4 23.3
SiO2 219 276 236 194 209 209 224 139 227 241 203
R+ 327 357 341 363 352 303 341 361 370 369 367
R� 345 383 358 379 351 333 358 375 384 390 383
R+�R� �5% �7% �5% �4% 0.2% �9% �5% �4% �4% �6% �4%
TDS 40.7 47.1 42.7 41.6 40.5 38.6 41.9 38.4 45.6 45.6 43.2
SSM 20.1 25.1 28.4 23.7 27.9 22.0 24.5 25.1 24.5 29.0 26.2
Q 531 521 521 1070 977 858 746 767 1310 1050 1039
N is the number of samples. The major element concentrations are in mmol/l. The total cation charge (R+) and the total anion charge (R�) are in
eq/l. Total Dissolved Solid (TDS) and Suspended Sediment Matter concentration (SSM) are in mg/l. The mean annual discharge Q is in m3/s.
C. Picouet et al. / Chemical Geology 185 (2002) 93–12498
Davis and Keller, 1983; Kattan and Probst, 1986;
Probst et al., 1992; Meybeck et al., 1996). It can be
explained by a conservative mixing relationship
between a high-solute-concentration component, base
flow (groundwater input) and a low-solute-concen-
tration component, runoff (rainwater input). The re-
lationships between dissolved concentration and dis-
charge, which take the form of a linear equation or a
power function, express a dilution of the river waters
by rain and surface waters. The high evaporation
occurring at the end of the rainy season also leads to
increasing concentrations. Hysteresis in the relation-
ship between discharge and concentration can be
recognised for some elements, hydrological years and
gauging stations: the concentration at a given discharge
on the rising limb of the hydrograph differs from that at
the same discharge on the falling limb. Anticlockwise
hysteresis loops are observed for elements such as Na,
Ca, Mg and HCO3, whereas clockwise hysteresis loops
are observed for K. The clockwise hysteresis loops for
K is due to the fact that K is leached from organic
material and is therefore more concentrated in surface
water than in groundwater, contrary to the other ele-
ments (e.g., Pierson and Taylor, 1994). These kinds of
cycles are well illustrated for the Bani river, where the
minimum dissolved concentration appears distinctly
earlier than the peak of water discharge (see examples
of hysteresis loops in Fig. 4 for Banankoro and Douna
gauging stations). This hysteresis in the episode con-
centration/discharge has been observed by many
authors and is commonly explained by a difference in
the relative timing or form of solute and discharge
responses (e.g., Walling and Foster, 1975; Walling and
Webb, 1980; Davis and Keller, 1983; Ewans and
Davies, 1998). Assuming that dissolved elements and
water are transported at the same speed, these hyste-
resis loops could be explained by three main factors:
early episode flushing of soluble material, variable
seasonal contribution of different reservoirs (rainwater,
subsuperficial runoff water, runoff water, groundwater,
soil water. . .) and different spatial contributions of
different tributaries. However, additional works and
modelling would be required to use solutes as hydro-
logic tracers in the upper Niger basin.
Finally, the specific dissolved loads are calculated
from the total dissolved loads (TDS) and expressed in
tons/km2/year (Picouet, 1999). The upper Niger rivers
are then characterised by low chemical denudation
rates: values vary from 9.6 to 19.8 tons/km2/year for
the Niger at Banankoro, from 7.7 to 17.5 tons/km2/
year at Koulikoro, from 6.7 to 17.7 tons/km2/year at
Ke-Macina and from 2.0 to 7.7 tons/km2/year for the
Bani River
Ke-Macina (141000 km2) Douna (102000 km2)
1991–
1992
1992–
1993
1993–
1994
1994–
1995
1995–
1996
1996–
1997
Mean 1991–
1992
1992–
1993
1993–
1994
1994–
1995
1995–
1996
1996–
1997
Mean
24 12 15 22 26 14 36 12 17 21 19 7
50.6 48.4 54.4 65.5 68.6 66.9 59.1 60.4 69.9 64.8 81.4 70.1 68.1 69.1
36.6 27.2 55.8 47.1 47.8 45.7 43.4 48.8 38.5 57.4 57.0 53.0 51.5 51.0
30.0 44.4 42.1 38.1 37.8 37.3 38.3 55.7 56.6 55.7 57.5 48.9 47.6 53.7
122.7 150.3 156.9 106.4 117.1 124.2 129.6 104.2 156.9 104.9 92.7 110.5 105.5 112.5
314 319 372 369 398 401 362 359 389 400 424 390 375 389
9.4 37.7 31.3 14.4 15.2 14.7 20.4 23.5 22.0 11.8 16.2 13.0 12.8 16.6
226 243 246 154 230 232 222 192 255 210 151 – 223 206
327 346 419 370 388 387 373 378 430 405 427 406 392 406
332 366 403 384 413 421 386 398 449 414 446 406 411 421
�2% �5% 4% �4% �6% �8% �4% �5% �4% �2% �4% 0% �5% �3%
40.4 43.6 47.8 40.5 47.7 47.3 44.5 43.2 46.1 46.1 45.7 – 46.8 45.6
– 32.9 33.3 50.6 45.9 54.2 43.4 42.8 52.3 74.1 50.3 55.1 66.9 56.9
686 681 647 1320 1180 929 907 190 139 135 459 224 200 225
C. Picouet et al. / Chemical Geology 185 (2002) 93–124 99
Bani at Douna. Low annual runoff is the main factor
explaining the lack of dissolved loads observed on the
Bani catchment. Because of a large number of reasons
(atmospheric inputs, differences in rock solubility,
non-conservative behaviour of elements, contribution
of human activities, etc.), these specific dissolved
loads should not be considered as weathering rates.
These will be estimated in Section 6.
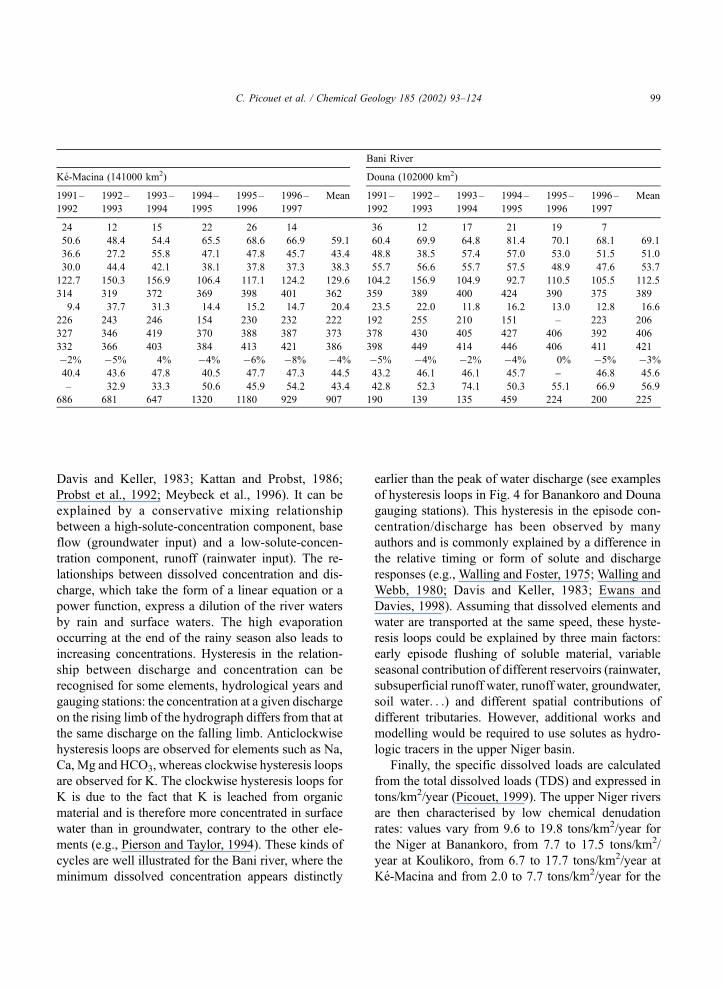
Fig. 3. Time evolution of discharge (Q) and Total Dissolved Solid concentration (TDS—Dashed line) at Banankoro and Douna gauging stations
(for the period 1991 to 1996). The discharge data are recorded daily whereas the concentrations are usually recorded at 1-month intervals. The
period from May to April represents one hydrological year.
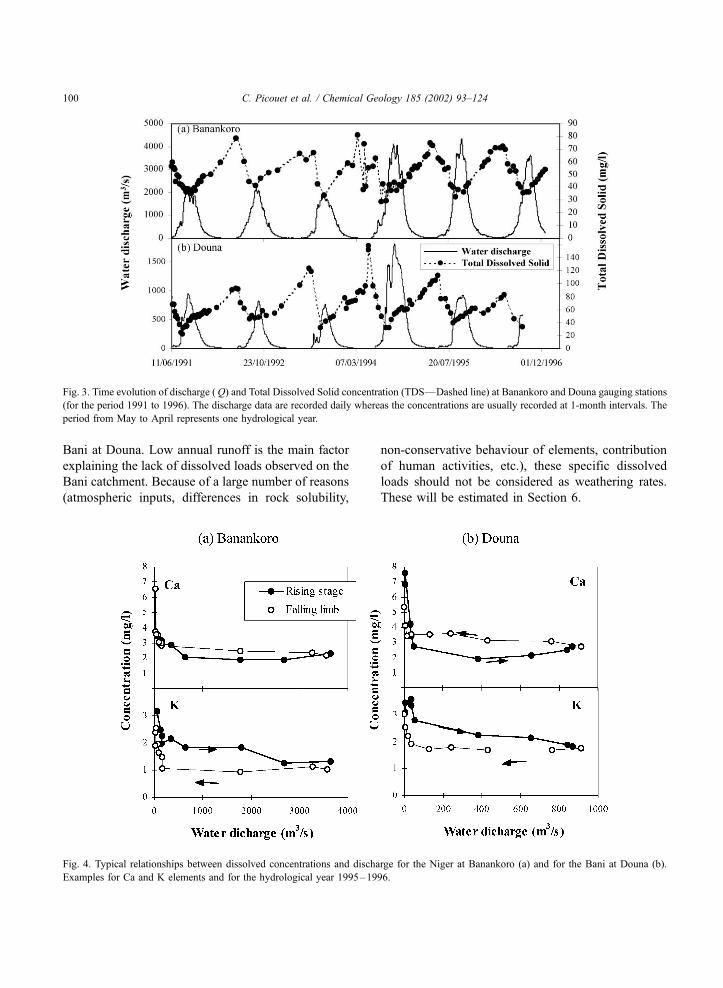
Fig. 4. Typical relationships between dissolved concentrations and discharge for the Niger at Banankoro (a) and for the Bani at Douna (b).
Examples for Ca and K elements and for the hydrological year 1995–1996.
C. Picouet et al. / Chemical Geology 185 (2002) 93–124100
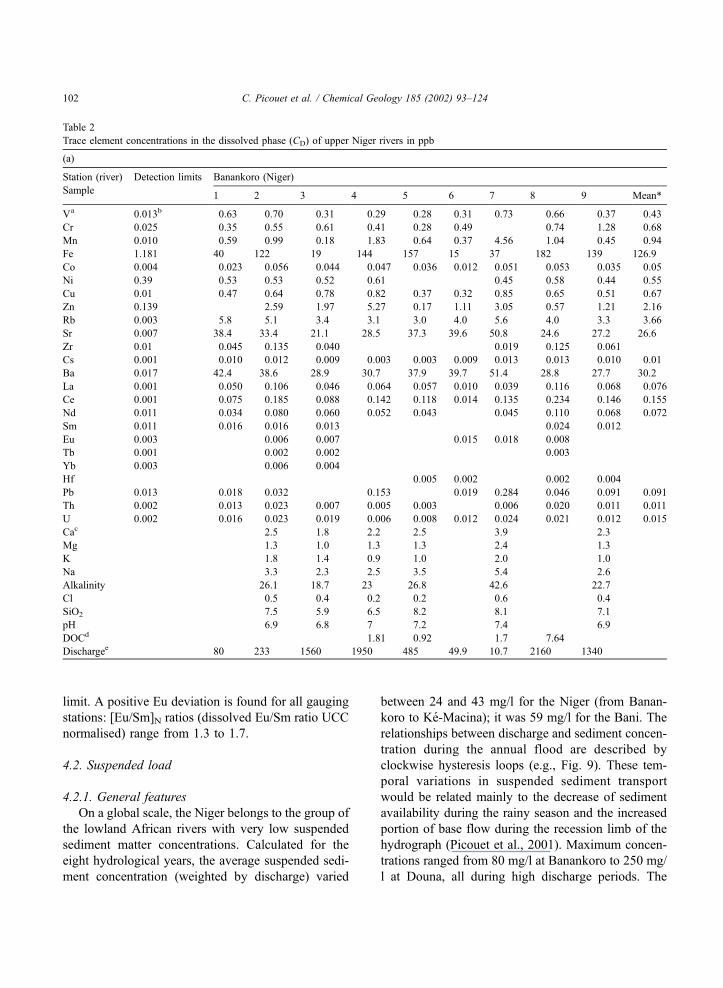
4.1.2. Trace elements
No data exist for the upper Niger rivers in Mali,
although dissolved trace element data exist for other
unpolluted tropical hydrosystems like the Congo (e.g.,
Negrel et al., 1993; Dupre et al., 1996) and the Amazon
(e.g., Gaillardet et al., 1997) systems.
Similar to what was found for the major elements,
the Niger and the Bani show slight differences in
absolute concentrations of trace elements (Table 2):
Rb, U, La, Ce, Zr and Sm are higher, whereas Pb, Ba,
Cr and Ni are lower in the Niger at Banankoro than in
the Bani at Douna. The other elements present similar
concentrations in the two rivers. In general, these
concentrations are within the range found in other large
rivers. When compared to the Amazon and Congo
(Negrel et al., 1993; Dupre et al., 1996; Gaillardet et
al., 1997), differences are found for Sr and Ba. For
example, the concentration of Ba varies from 12.9 to
60.9 ppb, while in the Amazon and Congo basins,
values of 6.1 to 28 ppb were measured.
In order to investigate the relations between the
elements in the dissolved phase, a correlation matrix
was calculated. For all gauging stations, the results
lead to the same conclusions (all for concentrations).
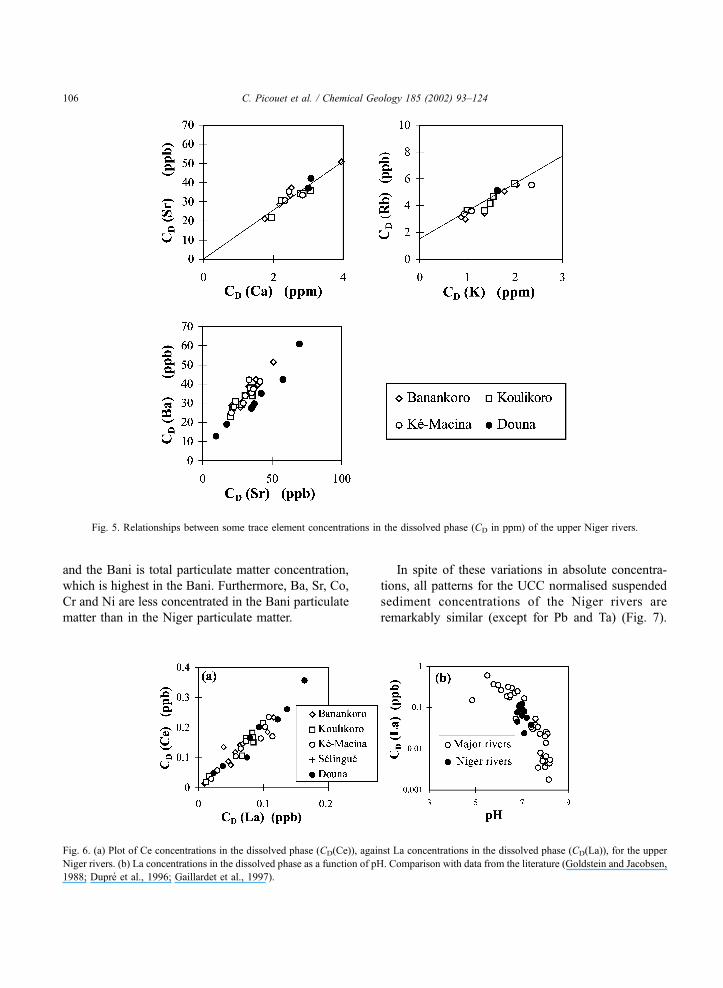
(1) Sr and Ba are strongly correlated with the major
elements Na, Ca, Mg and alkalinity (Fig. 5). These
elements generally decrease with discharge as do major
elements.
(2) Rb and U are slightly correlated with these same
major elements. This indicates that Rb and U partic-
ipate in or are controlled by processes other than those
that control the quantity of major ion chemistry. For
example, the close correlation observed between Rb
and K (Fig. 5) could be explained by their closely
linked behaviour in the vegetation cycle. The same
clockwise hysteresis in the relationship between dis-
charge and concentration for K can be recognised for
Rb (Fig. 5).
(3) All other trace elements do not show systematic
relations with Na, Mg, Ca, alkalinity and water dis-
charge. Th and Co are more or less well correlated
with rare earth elements.
For rare earth elements (REE), absolute concentra-
tions in the dissolved phase fluctuate widely but are
generally lower than those observed in the Congo and
Amazon basins. For example, at Banankoro, individ-
ual concentrations range from 0.0095 to 0.116 ppb
(Table 2) with a mean of 0.076 ppb. Increasing con-
centrations were observed going from the Niger at
Banankoro to the Bani at Douna for most of the rare
earth elements. As a result, all REE concentrations
show a high correlation, with a majority of coefficients
greater than r=0.9 (e.g., La and Ce in Fig. 6a). As pH
values are similar for the samples, a possible depend-
ence on pH of the REEs in the dissolved phase could
not be detected. However, compared to the world’s
major rivers (Fig. 6b), the upper Niger river concen-
trations of La are in good agreement with the La
concentration for water with pH near neutrality. As
suggested by many authors, the general decrease of
dissolved REE concentrations with increasing pH
indicates that pH is a major factor controlling the
REE quantities and the shape of REE distribution
patterns in the dissolved load (Goldstein and Jacobsen,
1988; Dupre et al., 1996; Gaillardet et al., 1997; Tricca
et al., 1999).
In order to get information on the upper continental
crust composition in this large African basin, the data
were normalised to the mean upper crust composition
(UCC) as proposed by Taylor and McLennan (1985)
(Figs. 7 and 8). Such a representation has previously
been used for the Congo basin by Dupre et al. (1996)
and for the Amazon Basin by Gaillardet et al. (1997).
In these diagrams, the order of elements corresponds
to the progressive enrichment from Ni to Cs of
elements in the upper continental crust compared to
the mantle of the earth. In spite of variations in
absolute concentrations, the observed patterns are
remarkably similar, but they are neither linear nor
regular. All elements are strongly deficient with
respect to the upper continental crust. Fig. 7 presents
these UCC normalised patterns for the average of
water samples. These graphs indicate the differences
between the elements Rb, U, Ba, Sr, Zr, Hf and the
other elements: the elements Rb, Ba, Sr and Ca,
known as soluble, are all enriched in the dissolved
phase relative to the neighbouring element, whereas
Th, Pb, Fe, Co, Ni and REEs are depleted. The ele-
ment Zr and Hf are also strongly depleted in the
dissolved phase of the Niger rivers. The same was
described for the Congo and Amazon systems (Dupre
et al., 1996; Gaillardet et al., 1997).
In Fig. 8, the mean dissolved REE concentrations
display a more or less pronounced upward convexity
centered on the intermediate REEs (Sm, Eu and Gd).
Values for heavy REEs are often under the detection
C. Picouet et al. / Chemical Geology 185 (2002) 93–124 101
limit. A positive Eu deviation is found for all gauging
stations: [Eu/Sm]N ratios (dissolved Eu/Sm ratio UCC
normalised) range from 1.3 to 1.7.
4.2. Suspended load
4.2.1. General features
On a global scale, the Niger belongs to the group of
the lowland African rivers with very low suspended
sediment matter concentrations. Calculated for the
eight hydrological years, the average suspended sedi-
ment concentration (weighted by discharge) varied
between 24 and 43 mg/l for the Niger (from Banan-
koro to Ke-Macina); it was 59 mg/l for the Bani. The
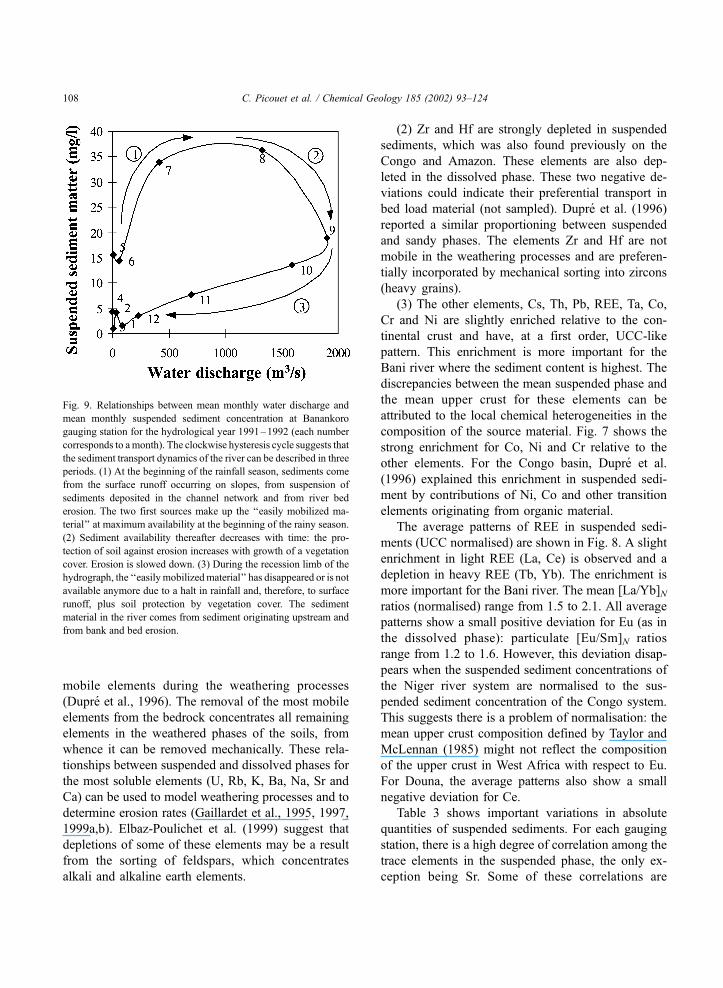
relationships between discharge and sediment concen-
tration during the annual flood are described by
clockwise hysteresis loops (e.g., Fig. 9). These tem-
poral variations in suspended sediment transport
would be related mainly to the decrease of sediment
availability during the rainy season and the increased
portion of base flow during the recession limb of the
hydrograph (Picouet et al., 2001). Maximum concen-
trations ranged from 80 mg/l at Banankoro to 250 mg/
l at Douna, all during high discharge periods. The
Table 2
Trace element concentrations in the dissolved phase (CD) of upper Niger rivers in ppb
(a)
Station (river) Detection limits Banankoro (Niger)
Sample1 2 3 4 5 6 7 8 9 Mean*
Va 0.013b 0.63 0.70 0.31 0.29 0.28 0.31 0.73 0.66 0.37 0.43
Cr 0.025 0.35 0.55 0.61 0.41 0.28 0.49 0.74 1.28 0.68
Mn 0.010 0.59 0.99 0.18 1.83 0.64 0.37 4.56 1.04 0.45 0.94
Fe 1.181 40 122 19 144 157 15 37 182 139 126.9
Co 0.004 0.023 0.056 0.044 0.047 0.036 0.012 0.051 0.053 0.035 0.05
Ni 0.39 0.53 0.53 0.52 0.61 0.45 0.58 0.44 0.55
Cu 0.01 0.47 0.64 0.78 0.82 0.37 0.32 0.85 0.65 0.51 0.67
Zn 0.139 2.59 1.97 5.27 0.17 1.11 3.05 0.57 1.21 2.16
Rb 0.003 5.8 5.1 3.4 3.1 3.0 4.0 5.6 4.0 3.3 3.66
Sr 0.007 38.4 33.4 21.1 28.5 37.3 39.6 50.8 24.6 27.2 26.6
Zr 0.01 0.045 0.135 0.040 0.019 0.125 0.061
Cs 0.001 0.010 0.012 0.009 0.003 0.003 0.009 0.013 0.013 0.010 0.01
Ba 0.017 42.4 38.6 28.9 30.7 37.9 39.7 51.4 28.8 27.7 30.2
La 0.001 0.050 0.106 0.046 0.064 0.057 0.010 0.039 0.116 0.068 0.076
Ce 0.001 0.075 0.185 0.088 0.142 0.118 0.014 0.135 0.234 0.146 0.155
Nd 0.011 0.034 0.080 0.060 0.052 0.043 0.045 0.110 0.068 0.072
Sm 0.011 0.016 0.016 0.013 0.024 0.012
Eu 0.003 0.006 0.007 0.015 0.018 0.008
Tb 0.001 0.002 0.002 0.003
Yb 0.003 0.006 0.004
Hf 0.005 0.002 0.002 0.004
Pb 0.013 0.018 0.032 0.153 0.019 0.284 0.046 0.091 0.091
Th 0.002 0.013 0.023 0.007 0.005 0.003 0.006 0.020 0.011 0.011
U 0.002 0.016 0.023 0.019 0.006 0.008 0.012 0.024 0.021 0.012 0.015
Cac 2.5 1.8 2.2 2.5 3.9 2.3
Mg 1.3 1.0 1.3 1.3 2.4 1.3
K 1.8 1.4 0.9 1.0 2.0 1.0
Na 3.3 2.3 2.5 3.5 5.4 2.6
Alkalinity 26.1 18.7 23 26.8 42.6 22.7
Cl 0.5 0.4 0.2 0.2 0.6 0.4
SiO2 7.5 5.9 6.5 8.2 8.1 7.1
pH 6.9 6.8 7 7.2 7.4 6.9
DOCd 1.81 0.92 1.7 7.64
Dischargee 80 233 1560 1950 485 49.9 10.7 2160 1340
C. Picouet et al. / Chemical Geology 185 (2002) 93–124102
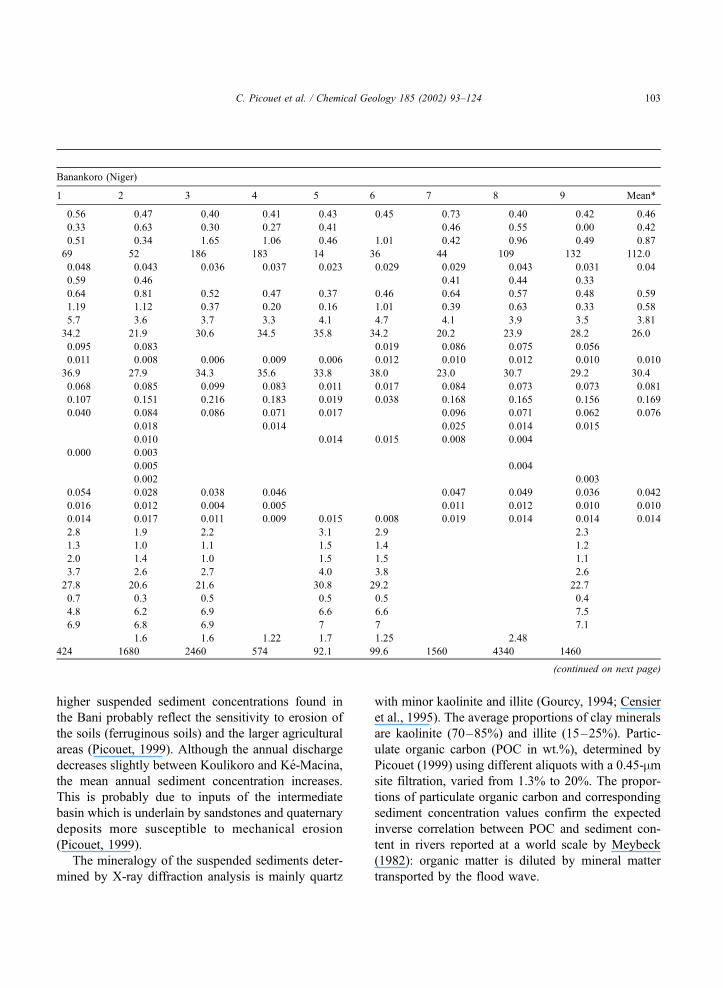
higher suspended sediment concentrations found in
the Bani probably reflect the sensitivity to erosion of
the soils (ferruginous soils) and the larger agricultural
areas (Picouet, 1999). Although the annual discharge
decreases slightly between Koulikoro and Ke-Macina,
the mean annual sediment concentration increases.
This is probably due to inputs of the intermediate
basin which is underlain by sandstones and quaternary
deposits more susceptible to mechanical erosion
(Picouet, 1999).
The mineralogy of the suspended sediments deter-
mined by X-ray diffraction analysis is mainly quartz
with minor kaolinite and illite (Gourcy, 1994; Censier
et al., 1995). The average proportions of clay minerals
are kaolinite (70–85%) and illite (15–25%). Partic-
ulate organic carbon (POC in wt.%), determined by
Picouet (1999) using different aliquots with a 0.45-mmsite filtration, varied from 1.3% to 20%. The propor-
tions of particulate organic carbon and corresponding
sediment concentration values confirm the expected
inverse correlation between POC and sediment con-
tent in rivers reported at a world scale by Meybeck
(1982): organic matter is diluted by mineral matter
transported by the flood wave.
Banankoro (Niger)
1 2 3 4 5 6 7 8 9 Mean*
0.56 0.47 0.40 0.41 0.43 0.45 0.73 0.40 0.42 0.46
0.33 0.63 0.30 0.27 0.41 0.46 0.55 0.00 0.42
0.51 0.34 1.65 1.06 0.46 1.01 0.42 0.96 0.49 0.87
69 52 186 183 14 36 44 109 132 112.0
0.048 0.043 0.036 0.037 0.023 0.029 0.029 0.043 0.031 0.04
0.59 0.46 0.41 0.44 0.33
0.64 0.81 0.52 0.47 0.37 0.46 0.64 0.57 0.48 0.59
1.19 1.12 0.37 0.20 0.16 1.01 0.39 0.63 0.33 0.58
5.7 3.6 3.7 3.3 4.1 4.7 4.1 3.9 3.5 3.81
34.2 21.9 30.6 34.5 35.8 34.2 20.2 23.9 28.2 26.0
0.095 0.083 0.019 0.086 0.075 0.056
0.011 0.008 0.006 0.009 0.006 0.012 0.010 0.012 0.010 0.010
36.9 27.9 34.3 35.6 33.8 38.0 23.0 30.7 29.2 30.4
0.068 0.085 0.099 0.083 0.011 0.017 0.084 0.073 0.073 0.081
0.107 0.151 0.216 0.183 0.019 0.038 0.168 0.165 0.156 0.169
0.040 0.084 0.086 0.071 0.017 0.096 0.071 0.062 0.076
0.018 0.014 0.025 0.014 0.015
0.010 0.014 0.015 0.008 0.004
0.000 0.003
0.005 0.004
0.002 0.003
0.054 0.028 0.038 0.046 0.047 0.049 0.036 0.042
0.016 0.012 0.004 0.005 0.011 0.012 0.010 0.010
0.014 0.017 0.011 0.009 0.015 0.008 0.019 0.014 0.014 0.014
2.8 1.9 2.2 3.1 2.9 2.3
1.3 1.0 1.1 1.5 1.4 1.2
2.0 1.4 1.0 1.5 1.5 1.1
3.7 2.6 2.7 4.0 3.8 2.6
27.8 20.6 21.6 30.8 29.2 22.7
0.7 0.3 0.5 0.5 0.5 0.4
4.8 6.2 6.9 6.6 6.6 7.5
6.9 6.8 6.9 7 7 7.1
1.6 1.6 1.22 1.7 1.25 2.48
424 1680 2460 574 92.1 99.6 1560 4340 1460
(continued on next page)
C. Picouet et al. / Chemical Geology 185 (2002) 93–124 103
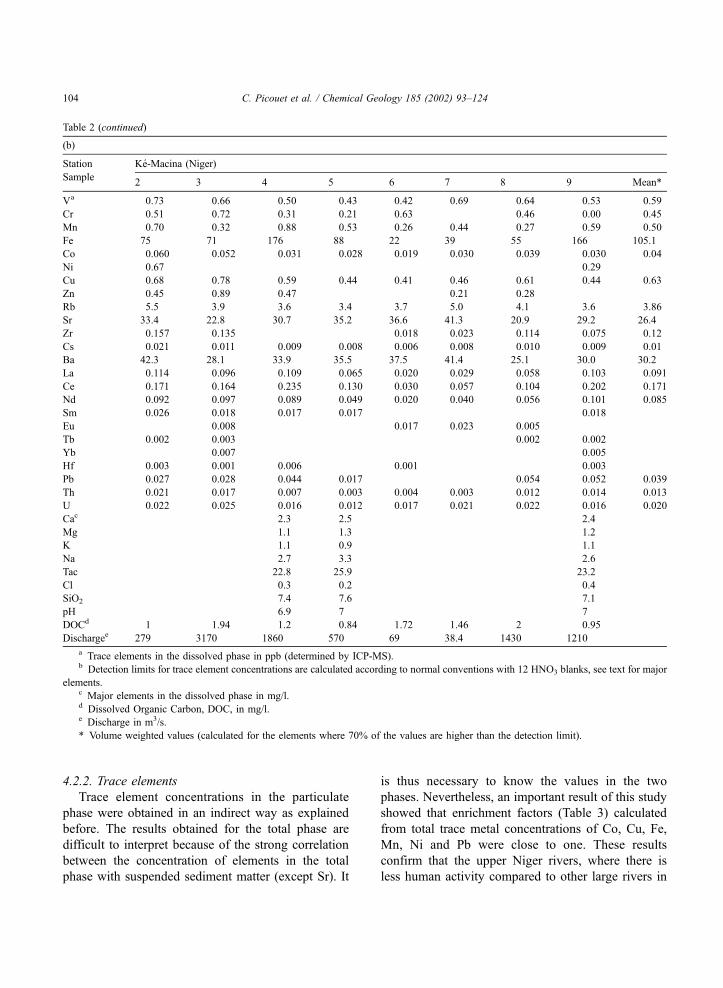
4.2.2. Trace elements
Trace element concentrations in the particulate
phase were obtained in an indirect way as explained
before. The results obtained for the total phase are
difficult to interpret because of the strong correlation
between the concentration of elements in the total
phase with suspended sediment matter (except Sr). It
is thus necessary to know the values in the two
phases. Nevertheless, an important result of this study
showed that enrichment factors (Table 3) calculated
from total trace metal concentrations of Co, Cu, Fe,
Mn, Ni and Pb were close to one. These results
confirm that the upper Niger rivers, where there is
less human activity compared to other large rivers in
Table 2 (continued)
(b)
Station Ke-Macina (Niger)
Sample2 3 4 5 6 7 8 9 Mean*
Va 0.73 0.66 0.50 0.43 0.42 0.69 0.64 0.53 0.59
Cr 0.51 0.72 0.31 0.21 0.63 0.46 0.00 0.45
Mn 0.70 0.32 0.88 0.53 0.26 0.44 0.27 0.59 0.50
Fe 75 71 176 88 22 39 55 166 105.1
Co 0.060 0.052 0.031 0.028 0.019 0.030 0.039 0.030 0.04
Ni 0.67 0.29
Cu 0.68 0.78 0.59 0.44 0.41 0.46 0.61 0.44 0.63
Zn 0.45 0.89 0.47 0.21 0.28
Rb 5.5 3.9 3.6 3.4 3.7 5.0 4.1 3.6 3.86
Sr 33.4 22.8 30.7 35.2 36.6 41.3 20.9 29.2 26.4
Zr 0.157 0.135 0.018 0.023 0.114 0.075 0.12
Cs 0.021 0.011 0.009 0.008 0.006 0.008 0.010 0.009 0.01
Ba 42.3 28.1 33.9 35.5 37.5 41.4 25.1 30.0 30.2
La 0.114 0.096 0.109 0.065 0.020 0.029 0.058 0.103 0.091
Ce 0.171 0.164 0.235 0.130 0.030 0.057 0.104 0.202 0.171
Nd 0.092 0.097 0.089 0.049 0.020 0.040 0.056 0.101 0.085
Sm 0.026 0.018 0.017 0.017 0.018
Eu 0.008 0.017 0.023 0.005
Tb 0.002 0.003 0.002 0.002
Yb 0.007 0.005
Hf 0.003 0.001 0.006 0.001 0.003
Pb 0.027 0.028 0.044 0.017 0.054 0.052 0.039
Th 0.021 0.017 0.007 0.003 0.004 0.003 0.012 0.014 0.013
U 0.022 0.025 0.016 0.012 0.017 0.021 0.022 0.016 0.020
Cac 2.3 2.5 2.4
Mg 1.1 1.3 1.2
K 1.1 0.9 1.1
Na 2.7 3.3 2.6
Tac 22.8 25.9 23.2
Cl 0.3 0.2 0.4
SiO2 7.4 7.6 7.1
pH 6.9 7 7
DOCd 1 1.94 1.2 0.84 1.72 1.46 2 0.95
Dischargee 279 3170 1860 570 69 38.4 1430 1210
a Trace elements in the dissolved phase in ppb (determined by ICP-MS).b Detection limits for trace element concentrations are calculated according to normal conventions with 12 HNO3 blanks, see text for major
elements.c Major elements in the dissolved phase in mg/l.d Dissolved Organic Carbon, DOC, in mg/l.e Discharge in m3/s.
* Volume weighted values (calculated for the elements where 70% of the values are higher than the detection limit).
C. Picouet et al. / Chemical Geology 185 (2002) 93–124104
the world, are still unpolluted with respect to heavy
metals.
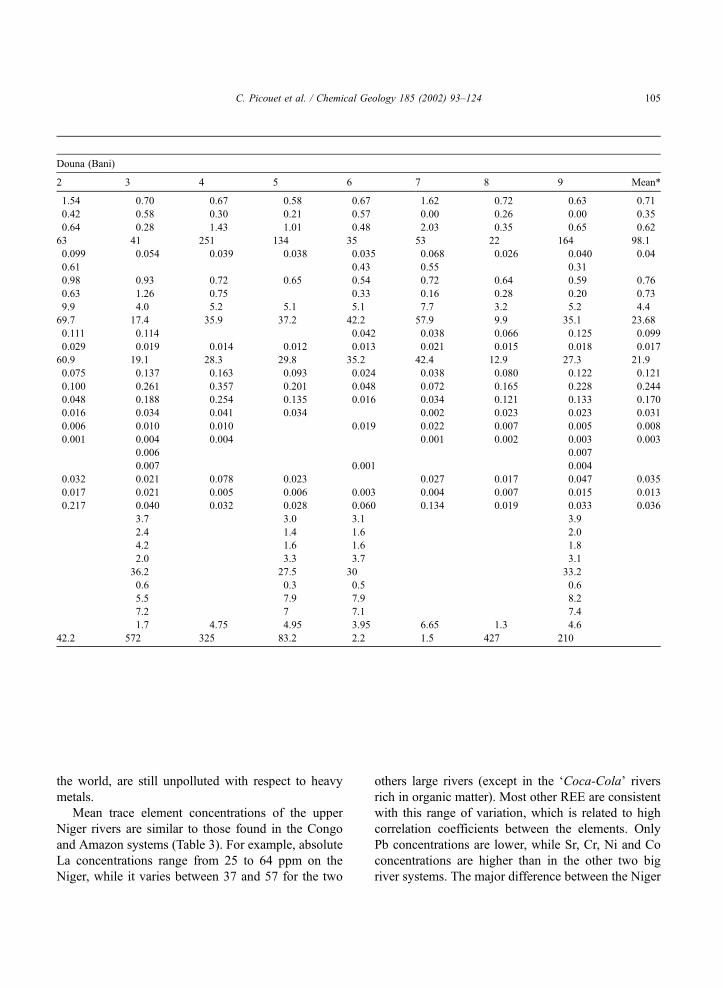
Mean trace element concentrations of the upper
Niger rivers are similar to those found in the Congo
and Amazon systems (Table 3). For example, absolute
La concentrations range from 25 to 64 ppm on the
Niger, while it varies between 37 and 57 for the two
others large rivers (except in the ‘Coca-Cola’ rivers
rich in organic matter). Most other REE are consistent
with this range of variation, which is related to high
correlation coefficients between the elements. Only
Pb concentrations are lower, while Sr, Cr, Ni and Co
concentrations are higher than in the other two big
river systems. The major difference between the Niger
Douna (Bani)
2 3 4 5 6 7 8 9 Mean*
1.54 0.70 0.67 0.58 0.67 1.62 0.72 0.63 0.71
0.42 0.58 0.30 0.21 0.57 0.00 0.26 0.00 0.35
0.64 0.28 1.43 1.01 0.48 2.03 0.35 0.65 0.62
63 41 251 134 35 53 22 164 98.1
0.099 0.054 0.039 0.038 0.035 0.068 0.026 0.040 0.04
0.61 0.43 0.55 0.31
0.98 0.93 0.72 0.65 0.54 0.72 0.64 0.59 0.76
0.63 1.26 0.75 0.33 0.16 0.28 0.20 0.73
9.9 4.0 5.2 5.1 5.1 7.7 3.2 5.2 4.4
69.7 17.4 35.9 37.2 42.2 57.9 9.9 35.1 23.68
0.111 0.114 0.042 0.038 0.066 0.125 0.099
0.029 0.019 0.014 0.012 0.013 0.021 0.015 0.018 0.017
60.9 19.1 28.3 29.8 35.2 42.4 12.9 27.3 21.9
0.075 0.137 0.163 0.093 0.024 0.038 0.080 0.122 0.121
0.100 0.261 0.357 0.201 0.048 0.072 0.165 0.228 0.244
0.048 0.188 0.254 0.135 0.016 0.034 0.121 0.133 0.170
0.016 0.034 0.041 0.034 0.002 0.023 0.023 0.031
0.006 0.010 0.010 0.019 0.022 0.007 0.005 0.008
0.001 0.004 0.004 0.001 0.002 0.003 0.003
0.006 0.007
0.007 0.001 0.004
0.032 0.021 0.078 0.023 0.027 0.017 0.047 0.035
0.017 0.021 0.005 0.006 0.003 0.004 0.007 0.015 0.013
0.217 0.040 0.032 0.028 0.060 0.134 0.019 0.033 0.036
3.7 3.0 3.1 3.9
2.4 1.4 1.6 2.0
4.2 1.6 1.6 1.8
2.0 3.3 3.7 3.1
36.2 27.5 30 33.2
0.6 0.3 0.5 0.6
5.5 7.9 7.9 8.2
7.2 7 7.1 7.4
1.7 4.75 4.95 3.95 6.65 1.3 4.6
42.2 572 325 83.2 2.2 1.5 427 210
C. Picouet et al. / Chemical Geology 185 (2002) 93–124 105
and the Bani is total particulate matter concentration,
which is highest in the Bani. Furthermore, Ba, Sr, Co,
Cr and Ni are less concentrated in the Bani particulate
matter than in the Niger particulate matter.
In spite of these variations in absolute concentra-
tions, all patterns for the UCC normalised suspended
sediment concentrations of the Niger rivers are
remarkably similar (except for Pb and Ta) (Fig. 7).
Fig. 6. (a) Plot of Ce concentrations in the dissolved phase (CD(Ce)), against La concentrations in the dissolved phase (CD(La)), for the upper
Niger rivers. (b) La concentrations in the dissolved phase as a function of pH. Comparison with data from the literature (Goldstein and Jacobsen,
1988; Dupre et al., 1996; Gaillardet et al., 1997).
Fig. 5. Relationships between some trace element concentrations in the dissolved phase (CD in ppm) of the upper Niger rivers.
C. Picouet et al. / Chemical Geology 185 (2002) 93–124106
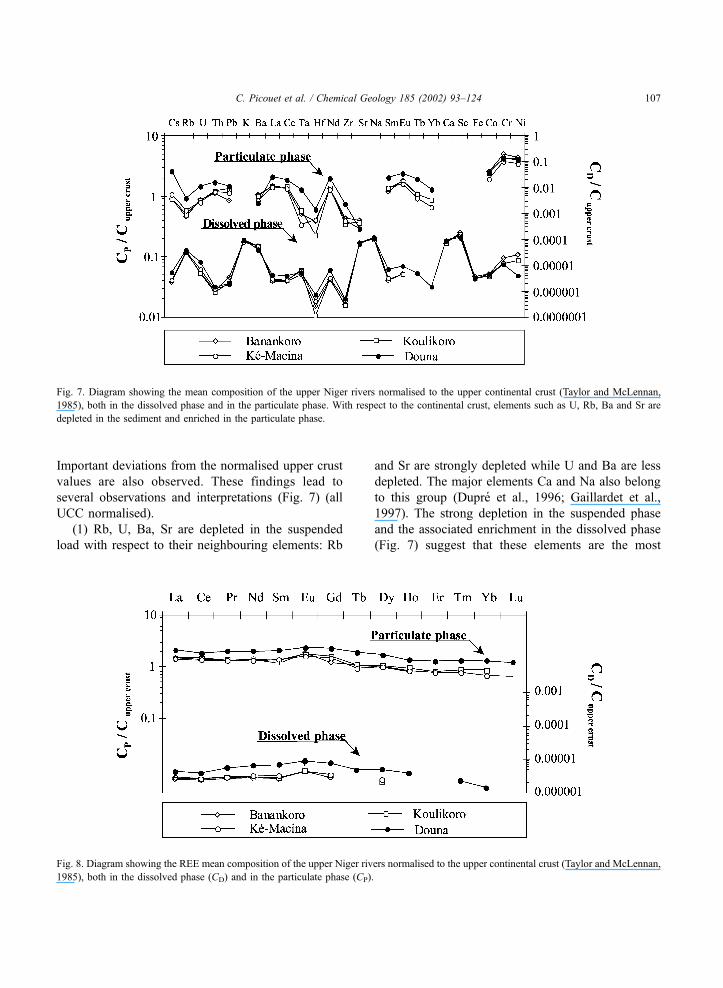
Important deviations from the normalised upper crust
values are also observed. These findings lead to
several observations and interpretations (Fig. 7) (all
UCC normalised).
(1) Rb, U, Ba, Sr are depleted in the suspended
load with respect to their neighbouring elements: Rb
and Sr are strongly depleted while U and Ba are less
depleted. The major elements Ca and Na also belong
to this group (Dupre et al., 1996; Gaillardet et al.,
1997). The strong depletion in the suspended phase
and the associated enrichment in the dissolved phase
(Fig. 7) suggest that these elements are the most
Fig. 8. Diagram showing the REE mean composition of the upper Niger rivers normalised to the upper continental crust (Taylor and McLennan,
1985), both in the dissolved phase (CD) and in the particulate phase (CP).
Fig. 7. Diagram showing the mean composition of the upper Niger rivers normalised to the upper continental crust (Taylor and McLennan,
1985), both in the dissolved phase and in the particulate phase. With respect to the continental crust, elements such as U, Rb, Ba and Sr are
depleted in the sediment and enriched in the particulate phase.
C. Picouet et al. / Chemical Geology 185 (2002) 93–124 107
mobile elements during the weathering processes
(Dupre et al., 1996). The removal of the most mobile
elements from the bedrock concentrates all remaining
elements in the weathered phases of the soils, from
whence it can be removed mechanically. These rela-
tionships between suspended and dissolved phases for
the most soluble elements (U, Rb, K, Ba, Na, Sr and
Ca) can be used to model weathering processes and to
determine erosion rates (Gaillardet et al., 1995, 1997,
1999a,b). Elbaz-Poulichet et al. (1999) suggest that
depletions of some of these elements may be a result
from the sorting of feldspars, which concentrates
alkali and alkaline earth elements.
(2) Zr and Hf are strongly depleted in suspended
sediments, which was also found previously on the
Congo and Amazon. These elements are also dep-
leted in the dissolved phase. These two negative de-
viations could indicate their preferential transport in
bed load material (not sampled). Dupre et al. (1996)
reported a similar proportioning between suspended
and sandy phases. The elements Zr and Hf are not
mobile in the weathering processes and are preferen-
tially incorporated by mechanical sorting into zircons
(heavy grains).
(3) The other elements, Cs, Th, Pb, REE, Ta, Co,
Cr and Ni are slightly enriched relative to the con-
tinental crust and have, at a first order, UCC-like
pattern. This enrichment is more important for the
Bani river where the sediment content is highest. The
discrepancies between the mean suspended phase and
the mean upper crust for these elements can be
attributed to the local chemical heterogeneities in the
composition of the source material. Fig. 7 shows the
strong enrichment for Co, Ni and Cr relative to the
other elements. For the Congo basin, Dupre et al.
(1996) explained this enrichment in suspended sedi-
ment by contributions of Ni, Co and other transition
elements originating from organic material.
The average patterns of REE in suspended sedi-
ments (UCC normalised) are shown in Fig. 8. A slight
enrichment in light REE (La, Ce) is observed and a
depletion in heavy REE (Tb, Yb). The enrichment is
more important for the Bani river. The mean [La/Yb]Nratios (normalised) range from 1.5 to 2.1. All average
patterns show a small positive deviation for Eu (as in
the dissolved phase): particulate [Eu/Sm]N ratios
range from 1.2 to 1.6. However, this deviation disap-
pears when the suspended sediment concentrations of
the Niger river system are normalised to the sus-
pended sediment concentration of the Congo system.
This suggests there is a problem of normalisation: the
mean upper crust composition defined by Taylor and
McLennan (1985) might not reflect the composition
of the upper crust in West Africa with respect to Eu.
For Douna, the average patterns also show a small
negative deviation for Ce.
Table 3 shows important variations in absolute
quantities of suspended sediments. For each gauging
station, there is a high degree of correlation among the
trace elements in the suspended phase, the only ex-
ception being Sr. Some of these correlations are
Fig. 9. Relationships between mean monthly water discharge and
mean monthly suspended sediment concentration at Banankoro
gauging station for the hydrological year 1991–1992 (each number
corresponds to amonth). The clockwise hysteresis cycle suggests that
the sediment transport dynamics of the river can be described in three
periods. (1) At the beginning of the rainfall season, sediments come
from the surface runoff occurring on slopes, from suspension of
sediments deposited in the channel network and from river bed
erosion. The two first sources make up the ‘‘easily mobilized ma-
terial’’ at maximum availability at the beginning of the rainy season.
(2) Sediment availability thereafter decreases with time: the pro-
tection of soil against erosion increases with growth of a vegetation
cover. Erosion is slowed down. (3) During the recession limb of the
hydrograph, the ‘‘easilymobilizedmaterial’’ has disappeared or is not
available anymore due to a halt in rainfall and, therefore, to surface
runoff, plus soil protection by vegetation cover. The sediment
material in the river comes from sediment originating upstream and
from bank and bed erosion.
C. Picouet et al. / Chemical Geology 185 (2002) 93–124108
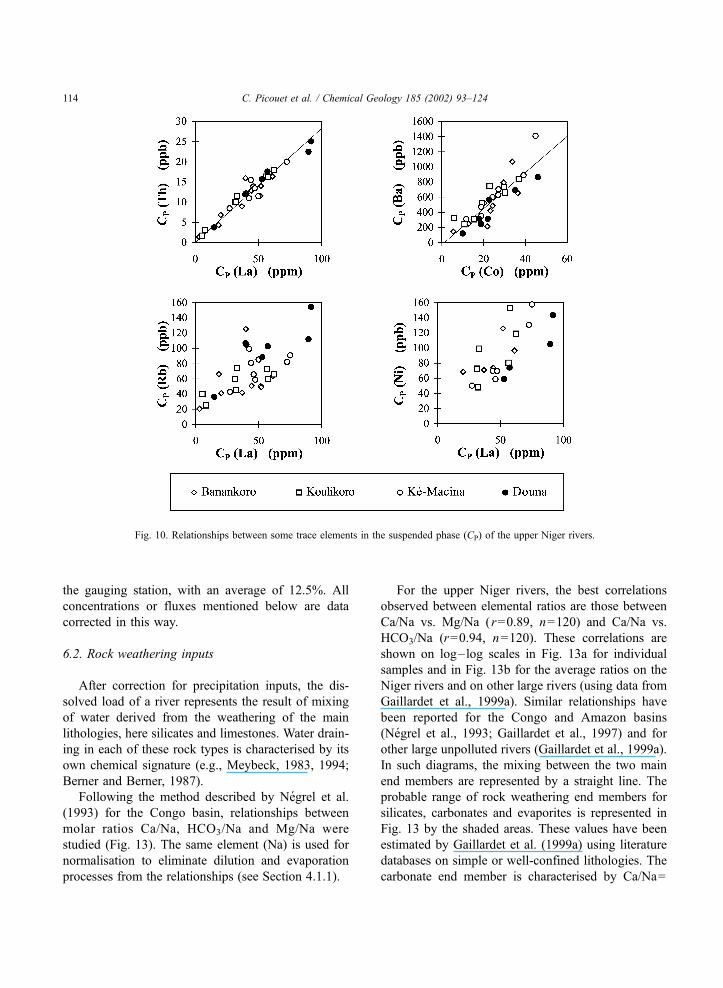
illustrated in Fig. 10. The highest correlation exists
between REE, Th, U, Ba and Co. The correlation
coefficient is 0.96 between Cp(Th) and Cp(La) and
0.86 between Cp(Ba) and Cp(Co). For the other
elements (Rb, U, Pb, Zr, Mn, Cu and Ni), the
correlations are more varied. The correlations also
depend on the gauging station. For example, the
correlation coefficient between Cp(Ni) and Cp(La) is
0.56 using all data, while it is 0.93 with Douna data
only, 0.91 with Ke-Macina data, 0.56 with Koulikoro
data and not significant with Banankoro data. The plot
of trace elements in the suspended phase passes
through the origin of the axes, which suggests a
dilution due to the variable quantity of quartz. This
trend is a common feature in suspended sediment in
many rivers and lakes. Deviations from this trend are
mainly due to the low concentrations observed during
the period of base flow.
Because of the effects caused by dilution due to the
presence of organic material and quartz, element ratios
should be used to model the weathering processes and
to determine erosion rates.
5. Partitioning of elements
The partionning of elements in the dissolved and
the particulate phases in the upper Niger (S%) can be
estimated with the following formula:
S% ¼ 100� CD
CT
ð2Þ
where S% is the proportion of total concentration in
the dissolved phase and CD and CT are the dissolved
and total concentration in ppb for the element.
For each gauging station, these percentages were
calculated for the samples where values are higher
than five times the detection limit (Fig. 11). The
volume weighted mean percentages are also plotted.
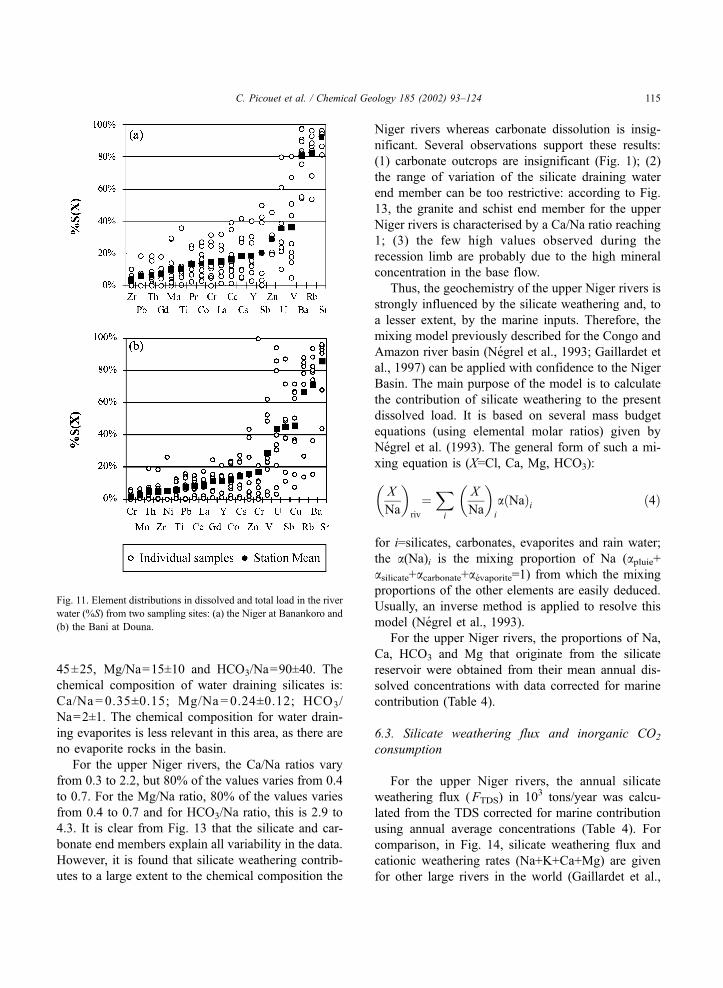
The elements are separated into three groups. (1) A
first group with the highest S% values (�70%) is the
set of most soluble elements (Sr, Ba, Rb). These
elements are enriched in the dissolved phase with
respect to the suspended phase. (2) A second group
with the lowest S% values (S%<50%) is the elements
less mobile during weathering (e.g., REE, Sc, Th,
Cr. . .). (3) A third group shows very irregular S%
values (V, U, Cu and Sb).
Similar to the results obtained for absolute con-
centrations, considerable variability is observed bet-
ween samples for all elements. Although samples
were obtained at different stages of the hydrological
cycle, pH values are similar and near neutrality.
However, suspended sediment concentrations and
particulate organic carbon values (POC) (Picouet,
1999) vary widely from one sample to another.
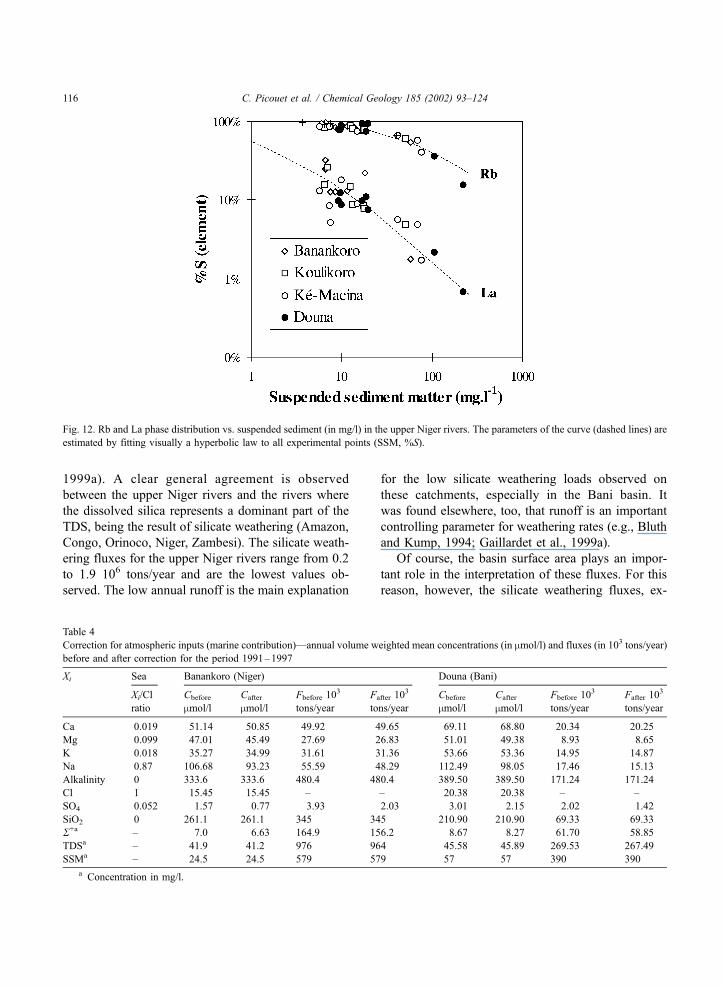
Therefore, the relationships between S% and sus-
pended sediment concentration were studied. For
example, in Fig. 12, S% of Rb and La are plotted
versus suspended sediment concentration. Similar
results are obtained when S% is plotted against
POC (in %) because of the good inverse correlation
between POC and suspended sediment matter (Pi-
couet, 1999).
The proportion of total concentration in the dis-
solved phase generally decreases with the increase of
the sediment load and follows a hyperbolic law (e.g.,
Rb and La in Fig. 12). This trend is clearly observed
for Sr, Ba, Rb, Co, V, U and La. For Sb, Cu, Pb, Cr,
Mn and Th, the lowest values are more scattered but
the trend is still visible. The lowest values of S% are
therefore explained by the highest values of sus-
pended load. During the peak discharges, this contains
many suspended bed load minerals, principally quartz.
These relationships may imply that the three gauging
stations of the upper Niger (Banankoro, Koulikoro,
Ke-Macina), which present the lowest variability of
sediment load, always show more stables values of
S%, relative to the Bani where the sediment load
varies more than 200 mg/l during the rising stage.
Both for the lowest values of suspended sediment
matter and for the insoluble elements (REE, Sc, Th,
Cr), S% values are more scattered. This is probably
linked to the fact that the lowest sediment concen-
trations are observed during the recession curve and
during base flow. In the first case, the suspended
sediment concentration is diluted by water originating
from the groundwater, which is poor in sediment. In
the second case, suspended sediments in the river
could have other origins such as plankton develop-
ment and diatom blooms; the organic matter could
also represent an important proportion of the partic-
ulate matter (POC% is high). It is also possible that
the presence of less soluble elements (like REE) in the
C. Picouet et al. / Chemical Geology 185 (2002) 93–124 109
dissolved phase is due to the combination of a ‘true’
dissolved phase with a colloidal phase when measur-
ing. The composition of the latter is similar to the
suspended sediment phase. Ultra-filtration experi-
ments carried out by Viers et al. (1997) confirmed
this filtration artefact. Analytical errors and propaga-
tion of these errors due to the low values of suspended
matter concentrations (<10 mg/l) are also possible.
Because of the low volumes discharged, data collected
during base flow hardly participate in the overall
average concentrations and in the element budgets.
6. Chemical weathering
The following analysis focuses on the Niger at
Banankoro and the Bani at Douna. These two gauging
stations have a more natural flow regime and the best
data set.
6.1. Atmospheric input to river chemistry
The importance of atmospheric input for the
chemical composition of rivers has been emphasised
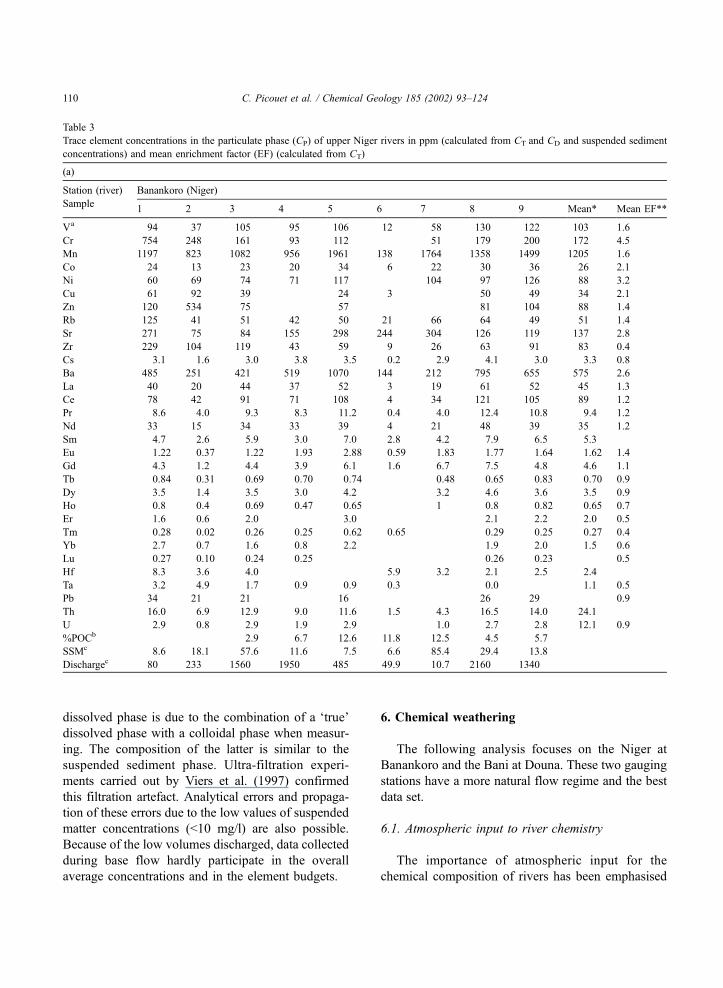
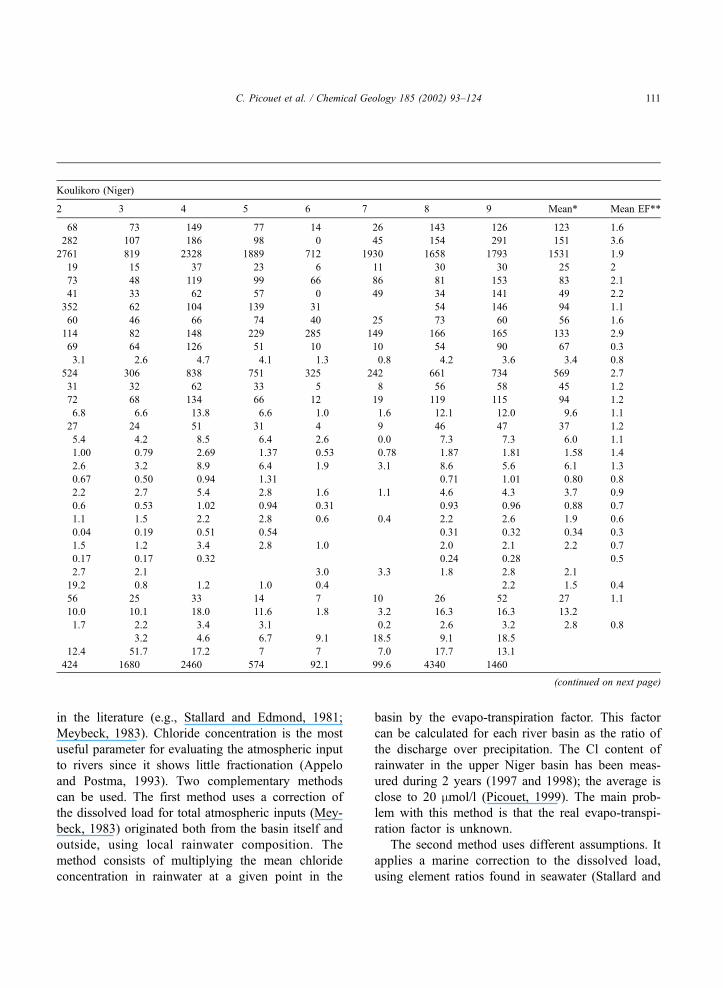
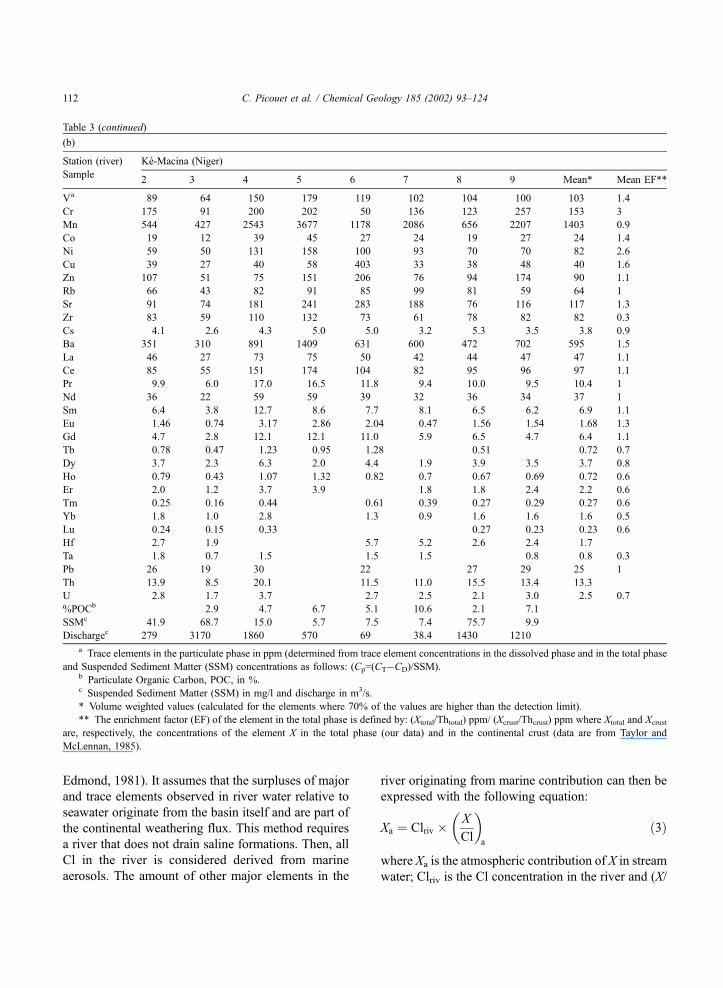
Table 3
Trace element concentrations in the particulate phase (CP) of upper Niger rivers in ppm (calculated from CT and CD and suspended sediment
concentrations) and mean enrichment factor (EF) (calculated from CT)
(a)
Station (river) Banankoro (Niger)
Sample1 2 3 4 5 6 7 8 9 Mean* Mean EF**
Va 94 37 105 95 106 12 58 130 122 103 1.6
Cr 754 248 161 93 112 51 179 200 172 4.5
Mn 1197 823 1082 956 1961 138 1764 1358 1499 1205 1.6
Co 24 13 23 20 34 6 22 30 36 26 2.1
Ni 60 69 74 71 117 104 97 126 88 3.2
Cu 61 92 39 24 3 50 49 34 2.1
Zn 120 534 75 57 81 104 88 1.4
Rb 125 41 51 42 50 21 66 64 49 51 1.4
Sr 271 75 84 155 298 244 304 126 119 137 2.8
Zr 229 104 119 43 59 9 26 63 91 83 0.4
Cs 3.1 1.6 3.0 3.8 3.5 0.2 2.9 4.1 3.0 3.3 0.8
Ba 485 251 421 519 1070 144 212 795 655 575 2.6
La 40 20 44 37 52 3 19 61 52 45 1.3
Ce 78 42 91 71 108 4 34 121 105 89 1.2
Pr 8.6 4.0 9.3 8.3 11.2 0.4 4.0 12.4 10.8 9.4 1.2
Nd 33 15 34 33 39 4 21 48 39 35 1.2
Sm 4.7 2.6 5.9 3.0 7.0 2.8 4.2 7.9 6.5 5.3
Eu 1.22 0.37 1.22 1.93 2.88 0.59 1.83 1.77 1.64 1.62 1.4
Gd 4.3 1.2 4.4 3.9 6.1 1.6 6.7 7.5 4.8 4.6 1.1
Tb 0.84 0.31 0.69 0.70 0.74 0.48 0.65 0.83 0.70 0.9
Dy 3.5 1.4 3.5 3.0 4.2 3.2 4.6 3.6 3.5 0.9
Ho 0.8 0.4 0.69 0.47 0.65 1 0.8 0.82 0.65 0.7
Er 1.6 0.6 2.0 3.0 2.1 2.2 2.0 0.5
Tm 0.28 0.02 0.26 0.25 0.62 0.65 0.29 0.25 0.27 0.4
Yb 2.7 0.7 1.6 0.8 2.2 1.9 2.0 1.5 0.6
Lu 0.27 0.10 0.24 0.25 0.26 0.23 0.5
Hf 8.3 3.6 4.0 5.9 3.2 2.1 2.5 2.4
Ta 3.2 4.9 1.7 0.9 0.9 0.3 0.0 1.1 0.5
Pb 34 21 21 16 26 29 0.9
Th 16.0 6.9 12.9 9.0 11.6 1.5 4.3 16.5 14.0 24.1
U 2.9 0.8 2.9 1.9 2.9 1.0 2.7 2.8 12.1 0.9
%POCb 2.9 6.7 12.6 11.8 12.5 4.5 5.7
SSMc 8.6 18.1 57.6 11.6 7.5 6.6 85.4 29.4 13.8
Dischargec 80 233 1560 1950 485 49.9 10.7 2160 1340
C. Picouet et al. / Chemical Geology 185 (2002) 93–124110
in the literature (e.g., Stallard and Edmond, 1981;
Meybeck, 1983). Chloride concentration is the most
useful parameter for evaluating the atmospheric input
to rivers since it shows little fractionation (Appelo
and Postma, 1993). Two complementary methods
can be used. The first method uses a correction of
the dissolved load for total atmospheric inputs (Mey-
beck, 1983) originated both from the basin itself and
outside, using local rainwater composition. The
method consists of multiplying the mean chloride
concentration in rainwater at a given point in the
basin by the evapo-transpiration factor. This factor
can be calculated for each river basin as the ratio of
the discharge over precipitation. The Cl content of
rainwater in the upper Niger basin has been meas-
ured during 2 years (1997 and 1998); the average is
close to 20 mmol/l (Picouet, 1999). The main prob-
lem with this method is that the real evapo-transpi-
ration factor is unknown.
The second method uses different assumptions. It
applies a marine correction to the dissolved load,
using element ratios found in seawater (Stallard and
Koulikoro (Niger)
2 3 4 5 6 7 8 9 Mean* Mean EF**
68 73 149 77 14 26 143 126 123 1.6
282 107 186 98 0 45 154 291 151 3.6
2761 819 2328 1889 712 1930 1658 1793 1531 1.9
19 15 37 23 6 11 30 30 25 2
73 48 119 99 66 86 81 153 83 2.1
41 33 62 57 0 49 34 141 49 2.2
352 62 104 139 31 54 146 94 1.1
60 46 66 74 40 25 73 60 56 1.6
114 82 148 229 285 149 166 165 133 2.9
69 64 126 51 10 10 54 90 67 0.3
3.1 2.6 4.7 4.1 1.3 0.8 4.2 3.6 3.4 0.8
524 306 838 751 325 242 661 734 569 2.7
31 32 62 33 5 8 56 58 45 1.2
72 68 134 66 12 19 119 115 94 1.2
6.8 6.6 13.8 6.6 1.0 1.6 12.1 12.0 9.6 1.1
27 24 51 31 4 9 46 47 37 1.2
5.4 4.2 8.5 6.4 2.6 0.0 7.3 7.3 6.0 1.1
1.00 0.79 2.69 1.37 0.53 0.78 1.87 1.81 1.58 1.4
2.6 3.2 8.9 6.4 1.9 3.1 8.6 5.6 6.1 1.3
0.67 0.50 0.94 1.31 0.71 1.01 0.80 0.8
2.2 2.7 5.4 2.8 1.6 1.1 4.6 4.3 3.7 0.9
0.6 0.53 1.02 0.94 0.31 0.93 0.96 0.88 0.7
1.1 1.5 2.2 2.8 0.6 0.4 2.2 2.6 1.9 0.6
0.04 0.19 0.51 0.54 0.31 0.32 0.34 0.3
1.5 1.2 3.4 2.8 1.0 2.0 2.1 2.2 0.7
0.17 0.17 0.32 0.24 0.28 0.5
2.7 2.1 3.0 3.3 1.8 2.8 2.1
19.2 0.8 1.2 1.0 0.4 2.2 1.5 0.4
56 25 33 14 7 10 26 52 27 1.1
10.0 10.1 18.0 11.6 1.8 3.2 16.3 16.3 13.2
1.7 2.2 3.4 3.1 0.2 2.6 3.2 2.8 0.8
3.2 4.6 6.7 9.1 18.5 9.1 18.5
12.4 51.7 17.2 7 7 7.0 17.7 13.1
424 1680 2460 574 92.1 99.6 4340 1460
(continued on next page)
C. Picouet et al. / Chemical Geology 185 (2002) 93–124 111
Edmond, 1981). It assumes that the surpluses of major
and trace elements observed in river water relative to
seawater originate from the basin itself and are part of
the continental weathering flux. This method requires
a river that does not drain saline formations. Then, all
Cl in the river is considered derived from marine
aerosols. The amount of other major elements in the
river originating from marine contribution can then be
expressed with the following equation:
Xa ¼ Clriv �X
Cl
� �a
ð3Þ
where Xa is the atmospheric contribution of X in stream
water; Clriv is the Cl concentration in the river and (X/
Table 3 (continued)
(b)
Station (river) Ke-Macina (Niger)
Sample2 3 4 5 6 7 8 9 Mean* Mean EF**
Va 89 64 150 179 119 102 104 100 103 1.4
Cr 175 91 200 202 50 136 123 257 153 3
Mn 544 427 2543 3677 1178 2086 656 2207 1403 0.9
Co 19 12 39 45 27 24 19 27 24 1.4
Ni 59 50 131 158 100 93 70 70 82 2.6
Cu 39 27 40 58 403 33 38 48 40 1.6
Zn 107 51 75 151 206 76 94 174 90 1.1
Rb 66 43 82 91 85 99 81 59 64 1
Sr 91 74 181 241 283 188 76 116 117 1.3
Zr 83 59 110 132 73 61 78 82 82 0.3
Cs 4.1 2.6 4.3 5.0 5.0 3.2 5.3 3.5 3.8 0.9
Ba 351 310 891 1409 631 600 472 702 595 1.5
La 46 27 73 75 50 42 44 47 47 1.1
Ce 85 55 151 174 104 82 95 96 97 1.1
Pr 9.9 6.0 17.0 16.5 11.8 9.4 10.0 9.5 10.4 1
Nd 36 22 59 59 39 32 36 34 37 1
Sm 6.4 3.8 12.7 8.6 7.7 8.1 6.5 6.2 6.9 1.1
Eu 1.46 0.74 3.17 2.86 2.04 0.47 1.56 1.54 1.68 1.3
Gd 4.7 2.8 12.1 12.1 11.0 5.9 6.5 4.7 6.4 1.1
Tb 0.78 0.47 1.23 0.95 1.28 0.51 0.72 0.7
Dy 3.7 2.3 6.3 2.0 4.4 1.9 3.9 3.5 3.7 0.8
Ho 0.79 0.43 1.07 1.32 0.82 0.7 0.67 0.69 0.72 0.6
Er 2.0 1.2 3.7 3.9 1.8 1.8 2.4 2.2 0.6
Tm 0.25 0.16 0.44 0.61 0.39 0.27 0.29 0.27 0.6
Yb 1.8 1.0 2.8 1.3 0.9 1.6 1.6 1.6 0.5
Lu 0.24 0.15 0.33 0.27 0.23 0.23 0.6
Hf 2.7 1.9 5.7 5.2 2.6 2.4 1.7
Ta 1.8 0.7 1.5 1.5 1.5 0.8 0.8 0.3
Pb 26 19 30 22 27 29 25 1
Th 13.9 8.5 20.1 11.5 11.0 15.5 13.4 13.3
U 2.8 1.7 3.7 2.7 2.5 2.1 3.0 2.5 0.7
%POCb 2.9 4.7 6.7 5.1 10.6 2.1 7.1
SSMc 41.9 68.7 15.0 5.7 7.5 7.4 75.7 9.9
Dischargec 279 3170 1860 570 69 38.4 1430 1210
a Trace elements in the particulate phase in ppm (determined from trace element concentrations in the dissolved phase and in the total phase
and Suspended Sediment Matter (SSM) concentrations as follows: (Cp=(CT�CD)/SSM).b Particulate Organic Carbon, POC, in %.c Suspended Sediment Matter (SSM) in mg/l and discharge in m3/s.
* Volume weighted values (calculated for the elements where 70% of the values are higher than the detection limit).
** The enrichment factor (EF) of the element in the total phase is defined by: (Xtotal/Thtotal) ppm/ (Xcrust/Thcrust) ppm where Xtotal and Xcrust
are, respectively, the concentrations of the element X in the total phase (our data) and in the continental crust (data are from Taylor and
McLennan, 1985).
C. Picouet et al. / Chemical Geology 185 (2002) 93–124112
Cl)a, the element ratio normalised to Cl in the atmos-
phere (seawater ratio).
No salt rocks or evaporites are known in the upper
Niger basin. The proposed correction of river water
composition for atmospheric inputs can thus be applied
since it can be assumed that all chloride measured in the
river originates from atmospheric precipitation. In this
paper, a marine correction was applied to all data (Table
4). The marine normalised ratio for Cl was deduced
using element ratios of seawater from Berner and
Berner (1987).
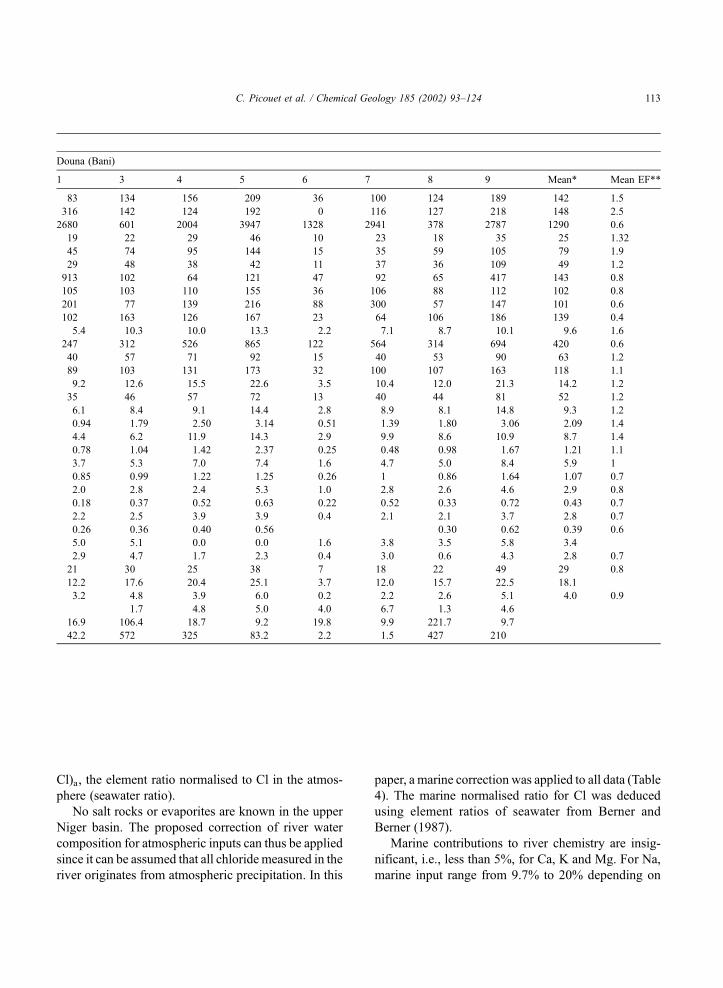
Marine contributions to river chemistry are insig-
nificant, i.e., less than 5%, for Ca, K and Mg. For Na,
marine input range from 9.7% to 20% depending on
Douna (Bani)
1 3 4 5 6 7 8 9 Mean* Mean EF**
83 134 156 209 36 100 124 189 142 1.5
316 142 124 192 0 116 127 218 148 2.5
2680 601 2004 3947 1328 2941 378 2787 1290 0.6
19 22 29 46 10 23 18 35 25 1.32
45 74 95 144 15 35 59 105 79 1.9
29 48 38 42 11 37 36 109 49 1.2
913 102 64 121 47 92 65 417 143 0.8
105 103 110 155 36 106 88 112 102 0.8
201 77 139 216 88 300 57 147 101 0.6
102 163 126 167 23 64 106 186 139 0.4
5.4 10.3 10.0 13.3 2.2 7.1 8.7 10.1 9.6 1.6
247 312 526 865 122 564 314 694 420 0.6
40 57 71 92 15 40 53 90 63 1.2
89 103 131 173 32 100 107 163 118 1.1
9.2 12.6 15.5 22.6 3.5 10.4 12.0 21.3 14.2 1.2
35 46 57 72 13 40 44 81 52 1.2
6.1 8.4 9.1 14.4 2.8 8.9 8.1 14.8 9.3 1.2
0.94 1.79 2.50 3.14 0.51 1.39 1.80 3.06 2.09 1.4
4.4 6.2 11.9 14.3 2.9 9.9 8.6 10.9 8.7 1.4
0.78 1.04 1.42 2.37 0.25 0.48 0.98 1.67 1.21 1.1
3.7 5.3 7.0 7.4 1.6 4.7 5.0 8.4 5.9 1
0.85 0.99 1.22 1.25 0.26 1 0.86 1.64 1.07 0.7
2.0 2.8 2.4 5.3 1.0 2.8 2.6 4.6 2.9 0.8
0.18 0.37 0.52 0.63 0.22 0.52 0.33 0.72 0.43 0.7
2.2 2.5 3.9 3.9 0.4 2.1 2.1 3.7 2.8 0.7
0.26 0.36 0.40 0.56 0.30 0.62 0.39 0.6
5.0 5.1 0.0 0.0 1.6 3.8 3.5 5.8 3.4
2.9 4.7 1.7 2.3 0.4 3.0 0.6 4.3 2.8 0.7
21 30 25 38 7 18 22 49 29 0.8
12.2 17.6 20.4 25.1 3.7 12.0 15.7 22.5 18.1
3.2 4.8 3.9 6.0 0.2 2.2 2.6 5.1 4.0 0.9
1.7 4.8 5.0 4.0 6.7 1.3 4.6
16.9 106.4 18.7 9.2 19.8 9.9 221.7 9.7
42.2 572 325 83.2 2.2 1.5 427 210
C. Picouet et al. / Chemical Geology 185 (2002) 93–124 113
the gauging station, with an average of 12.5%. All
concentrations or fluxes mentioned below are data
corrected in this way.
6.2. Rock weathering inputs
After correction for precipitation inputs, the dis-
solved load of a river represents the result of mixing
of water derived from the weathering of the main
lithologies, here silicates and limestones. Water drain-
ing in each of these rock types is characterised by its
own chemical signature (e.g., Meybeck, 1983, 1994;
Berner and Berner, 1987).
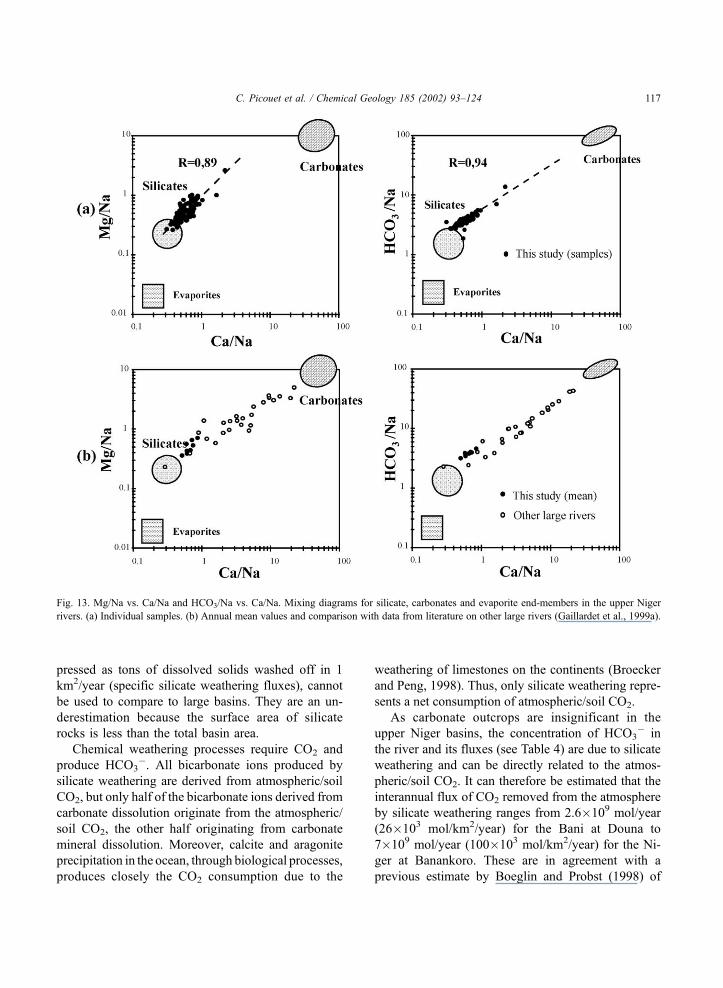
Following the method described by Negrel et al.
(1993) for the Congo basin, relationships between
molar ratios Ca/Na, HCO3/Na and Mg/Na were
studied (Fig. 13). The same element (Na) is used for
normalisation to eliminate dilution and evaporation
processes from the relationships (see Section 4.1.1).
For the upper Niger rivers, the best correlations
observed between elemental ratios are those between
Ca/Na vs. Mg/Na (r=0.89, n=120) and Ca/Na vs.
HCO3/Na (r=0.94, n=120). These correlations are
shown on log–log scales in Fig. 13a for individual
samples and in Fig. 13b for the average ratios on the
Niger rivers and on other large rivers (using data from
Gaillardet et al., 1999a). Similar relationships have
been reported for the Congo and Amazon basins
(Negrel et al., 1993; Gaillardet et al., 1997) and for
other large unpolluted rivers (Gaillardet et al., 1999a).
In such diagrams, the mixing between the two main
end members are represented by a straight line. The
probable range of rock weathering end members for
silicates, carbonates and evaporites is represented in
Fig. 13 by the shaded areas. These values have been
estimated by Gaillardet et al. (1999a) using literature
databases on simple or well-confined lithologies. The
carbonate end member is characterised by Ca/Na=
Fig. 10. Relationships between some trace elements in the suspended phase (CP) of the upper Niger rivers.
C. Picouet et al. / Chemical Geology 185 (2002) 93–124114
45±25, Mg/Na=15±10 and HCO3/Na=90±40. The
chemical composition of water draining silicates is:
Ca/Na = 0.35±0.15; Mg/Na = 0.24±0.12; HCO3/
Na=2±1. The chemical composition for water drain-
ing evaporites is less relevant in this area, as there are
no evaporite rocks in the basin.
For the upper Niger rivers, the Ca/Na ratios vary
from 0.3 to 2.2, but 80% of the values varies from 0.4
to 0.7. For the Mg/Na ratio, 80% of the values varies
from 0.4 to 0.7 and for HCO3/Na ratio, this is 2.9 to
4.3. It is clear from Fig. 13 that the silicate and car-
bonate end members explain all variability in the data.
However, it is found that silicate weathering contrib-
utes to a large extent to the chemical composition the
Niger rivers whereas carbonate dissolution is insig-
nificant. Several observations support these results:
(1) carbonate outcrops are insignificant (Fig. 1); (2)
the range of variation of the silicate draining water
end member can be too restrictive: according to Fig.
13, the granite and schist end member for the upper
Niger rivers is characterised by a Ca/Na ratio reaching
1; (3) the few high values observed during the
recession limb are probably due to the high mineral
concentration in the base flow.
Thus, the geochemistry of the upper Niger rivers is
strongly influenced by the silicate weathering and, to
a lesser extent, by the marine inputs. Therefore, the
mixing model previously described for the Congo and
Amazon river basin (Negrel et al., 1993; Gaillardet et
al., 1997) can be applied with confidence to the Niger
Basin. The main purpose of the model is to calculate
the contribution of silicate weathering to the present
dissolved load. It is based on several mass budget
equations (using elemental molar ratios) given by
Negrel et al. (1993). The general form of such a mi-
xing equation is (X=Cl, Ca, Mg, HCO3):
X
Na
� �riv
¼Xi
X
Na
� �i
aðNaÞi ð4Þ
for i=silicates, carbonates, evaporites and rain water;
the a(Na)i is the mixing proportion of Na (apluie+asilicate+acarbonate+aevaporite=1) from which the mixing
proportions of the other elements are easily deduced.
Usually, an inverse method is applied to resolve this
model (Negrel et al., 1993).
For the upper Niger rivers, the proportions of Na,
Ca, HCO3 and Mg that originate from the silicate
reservoir were obtained from their mean annual dis-
solved concentrations with data corrected for marine
contribution (Table 4).
6.3. Silicate weathering flux and inorganic CO2
consumption
For the upper Niger rivers, the annual silicate
weathering flux (FTDS) in 103 tons/year was calcu-
lated from the TDS corrected for marine contribution
using annual average concentrations (Table 4). For
comparison, in Fig. 14, silicate weathering flux and
cationic weathering rates (Na+K+Ca+Mg) are given
for other large rivers in the world (Gaillardet et al.,
Fig. 11. Element distributions in dissolved and total load in the river
water (%S) from two sampling sites: (a) the Niger at Banankoro and
(b) the Bani at Douna.
C. Picouet et al. / Chemical Geology 185 (2002) 93–124 115
1999a). A clear general agreement is observed
between the upper Niger rivers and the rivers where
the dissolved silica represents a dominant part of the
TDS, being the result of silicate weathering (Amazon,
Congo, Orinoco, Niger, Zambesi). The silicate weath-
ering fluxes for the upper Niger rivers range from 0.2
to 1.9 106 tons/year and are the lowest values ob-
served. The low annual runoff is the main explanation
for the low silicate weathering loads observed on
these catchments, especially in the Bani basin. It
was found elsewhere, too, that runoff is an important
controlling parameter for weathering rates (e.g., Bluth
and Kump, 1994; Gaillardet et al., 1999a).
Of course, the basin surface area plays an impor-
tant role in the interpretation of these fluxes. For this
reason, however, the silicate weathering fluxes, ex-
Fig. 12. Rb and La phase distribution vs. suspended sediment (in mg/l) in the upper Niger rivers. The parameters of the curve (dashed lines) are
estimated by fitting visually a hyperbolic law to all experimental points (SSM, %S).
Table 4
Correction for atmospheric inputs (marine contribution)—annual volume weighted mean concentrations (in mmol/l) and fluxes (in 103 tons/year)
before and after correction for the period 1991–1997
Xi Sea Banankoro (Niger) Douna (Bani)
Xi/Cl
ratio
Cbefore
mmol/l
Cafter
mmol/l
Fbefore 103
tons/year
Fafter 103
tons/year
Cbefore
mmol/l
Cafter
mmol/l
Fbefore 103
tons/year
Fafter 103
tons/year
Ca 0.019 51.14 50.85 49.92 49.65 69.11 68.80 20.34 20.25
Mg 0.099 47.01 45.49 27.69 26.83 51.01 49.38 8.93 8.65
K 0.018 35.27 34.99 31.61 31.36 53.66 53.36 14.95 14.87
Na 0.87 106.68 93.23 55.59 48.29 112.49 98.05 17.46 15.13
Alkalinity 0 333.6 333.6 480.4 480.4 389.50 389.50 171.24 171.24
Cl 1 15.45 15.45 – – 20.38 20.38 – –
SO4 0.052 1.57 0.77 3.93 2.03 3.01 2.15 2.02 1.42
SiO2 0 261.1 261.1 345 345 210.90 210.90 69.33 69.33
R+a – 7.0 6.63 164.9 156.2 8.67 8.27 61.70 58.85
TDSa – 41.9 41.2 976 964 45.58 45.89 269.53 267.49
SSMa – 24.5 24.5 579 579 57 57 390 390
a Concentration in mg/l.
C. Picouet et al. / Chemical Geology 185 (2002) 93–124116
pressed as tons of dissolved solids washed off in 1
km2/year (specific silicate weathering fluxes), cannot
be used to compare to large basins. They are an un-
derestimation because the surface area of silicate
rocks is less than the total basin area.
Chemical weathering processes require CO2 and
produce HCO3�. All bicarbonate ions produced by
silicate weathering are derived from atmospheric/soil
CO2, but only half of the bicarbonate ions derived from
carbonate dissolution originate from the atmospheric/
soil CO2, the other half originating from carbonate
mineral dissolution. Moreover, calcite and aragonite
precipitation in the ocean, through biological processes,
produces closely the CO2 consumption due to the
weathering of limestones on the continents (Broecker
and Peng, 1998). Thus, only silicate weathering repre-
sents a net consumption of atmospheric/soil CO2.
As carbonate outcrops are insignificant in the
upper Niger basins, the concentration of HCO3� in
the river and its fluxes (see Table 4) are due to silicate
weathering and can be directly related to the atmos-
pheric/soil CO2. It can therefore be estimated that the
interannual flux of CO2 removed from the atmosphere
by silicate weathering ranges from 2.6�109 mol/year
(26�103 mol/km2/year) for the Bani at Douna to
7�109 mol/year (100�103 mol/km2/year) for the Ni-
ger at Banankoro. These are in agreement with a
previous estimate by Boeglin and Probst (1998) of
Fig. 13. Mg/Na vs. Ca/Na and HCO3/Na vs. Ca/Na. Mixing diagrams for silicate, carbonates and evaporite end-members in the upper Niger
rivers. (a) Individual samples. (b) Annual mean values and comparison with data from literature on other large rivers (Gaillardet et al., 1999a).
C. Picouet et al. / Chemical Geology 185 (2002) 93–124 117
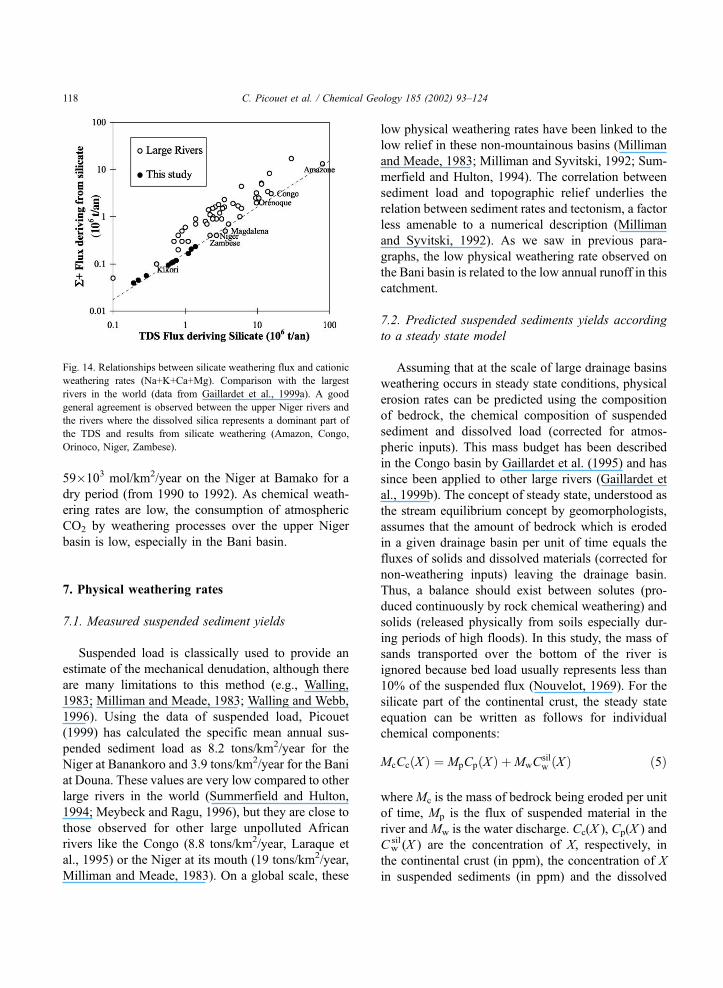
59�103 mol/km2/year on the Niger at Bamako for a
dry period (from 1990 to 1992). As chemical weath-
ering rates are low, the consumption of atmospheric
CO2 by weathering processes over the upper Niger
basin is low, especially in the Bani basin.
7. Physical weathering rates
7.1. Measured suspended sediment yields
Suspended load is classically used to provide an
estimate of the mechanical denudation, although there
are many limitations to this method (e.g., Walling,
1983; Milliman and Meade, 1983; Walling and Webb,
1996). Using the data of suspended load, Picouet
(1999) has calculated the specific mean annual sus-
pended sediment load as 8.2 tons/km2/year for the
Niger at Banankoro and 3.9 tons/km2/year for the Bani
at Douna. These values are very low compared to other
large rivers in the world (Summerfield and Hulton,
1994; Meybeck and Ragu, 1996), but they are close to
those observed for other large unpolluted African
rivers like the Congo (8.8 tons/km2/year, Laraque et
al., 1995) or the Niger at its mouth (19 tons/km2/year,
Milliman and Meade, 1983). On a global scale, these
low physical weathering rates have been linked to the
low relief in these non-mountainous basins (Milliman
and Meade, 1983; Milliman and Syvitski, 1992; Sum-
merfield and Hulton, 1994). The correlation between
sediment load and topographic relief underlies the
relation between sediment rates and tectonism, a factor
less amenable to a numerical description (Milliman
and Syvitski, 1992). As we saw in previous para-
graphs, the low physical weathering rate observed on
the Bani basin is related to the low annual runoff in this
catchment.
7.2. Predicted suspended sediments yields according
to a steady state model
Assuming that at the scale of large drainage basins
weathering occurs in steady state conditions, physical
erosion rates can be predicted using the composition
of bedrock, the chemical composition of suspended
sediment and dissolved load (corrected for atmos-
pheric inputs). This mass budget has been described
in the Congo basin by Gaillardet et al. (1995) and has
since been applied to other large rivers (Gaillardet et
al., 1999b). The concept of steady state, understood as
the stream equilibrium concept by geomorphologists,
assumes that the amount of bedrock which is eroded
in a given drainage basin per unit of time equals the
fluxes of solids and dissolved materials (corrected for
non-weathering inputs) leaving the drainage basin.
Thus, a balance should exist between solutes (pro-
duced continuously by rock chemical weathering) and
solids (released physically from soils especially dur-
ing periods of high floods). In this study, the mass of
sands transported over the bottom of the river is
ignored because bed load usually represents less than
10% of the suspended flux (Nouvelot, 1969). For the
silicate part of the continental crust, the steady state
equation can be written as follows for individual
chemical components:
McCcðX Þ ¼ MpCpðX Þ þMwCsilw ðX Þ ð5Þ
whereMc is the mass of bedrock being eroded per unit
of time, Mp is the flux of suspended material in the
river and Mw is the water discharge. Cc(X ), Cp(X ) and
Cwsil (X ) are the concentration of X, respectively, in
the continental crust (in ppm), the concentration of X
in suspended sediments (in ppm) and the dissolved
Fig. 14. Relationships between silicate weathering flux and cationic
weathering rates (Na+K+Ca+Mg). Comparison with the largest
rivers in the world (data from Gaillardet et al., 1999a). A good
general agreement is observed between the upper Niger rivers and
the rivers where the dissolved silica represents a dominant part of
the TDS and results from silicate weathering (Amazon, Congo,
Orinoco, Niger, Zambese).
C. Picouet et al. / Chemical Geology 185 (2002) 93–124118
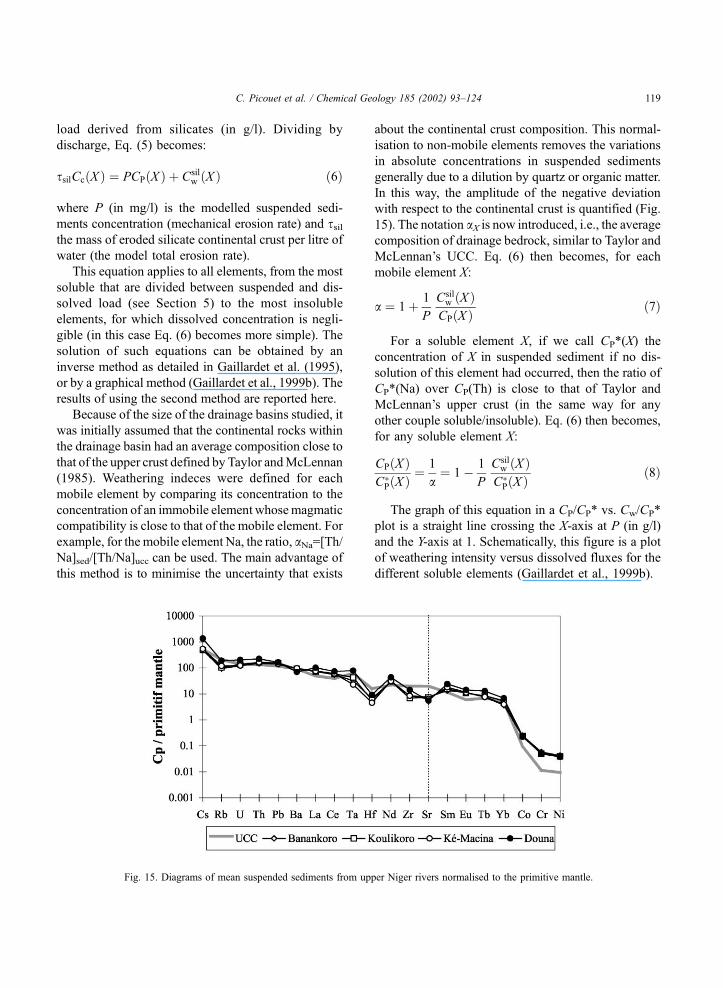
load derived from silicates (in g/l). Dividing by
discharge, Eq. (5) becomes:
ssilCcðX Þ ¼ PCPðX Þ þ Csilw ðX Þ ð6Þ
where P (in mg/l) is the modelled suspended sedi-
ments concentration (mechanical erosion rate) and ssilthe mass of eroded silicate continental crust per litre of
water (the model total erosion rate).
This equation applies to all elements, from the most
soluble that are divided between suspended and dis-
solved load (see Section 5) to the most insoluble
elements, for which dissolved concentration is negli-
gible (in this case Eq. (6) becomes more simple). The
solution of such equations can be obtained by an
inverse method as detailed in Gaillardet et al. (1995),
or by a graphical method (Gaillardet et al., 1999b). The
results of using the second method are reported here.
Because of the size of the drainage basins studied, it
was initially assumed that the continental rocks within
the drainage basin had an average composition close to
that of the upper crust defined by Taylor andMcLennan
(1985). Weathering indeces were defined for each
mobile element by comparing its concentration to the
concentration of an immobile element whosemagmatic
compatibility is close to that of the mobile element. For
example, for the mobile element Na, the ratio, aNa=[Th/Na]sed/[Th/Na]ucc can be used. The main advantage of
this method is to minimise the uncertainty that exists
about the continental crust composition. This normal-
isation to non-mobile elements removes the variations
in absolute concentrations in suspended sediments
generally due to a dilution by quartz or organic matter.
In this way, the amplitude of the negative deviation
with respect to the continental crust is quantified (Fig.
15). The notation aX is now introduced, i.e., the average
composition of drainage bedrock, similar to Taylor and
McLennan’s UCC. Eq. (6) then becomes, for each
mobile element X:
a ¼ 1þ 1
P
Csilw ðX Þ
CPðX Þ ð7Þ
For a soluble element X, if we call CP*(X) the
concentration of X in suspended sediment if no dis-
solution of this element had occurred, then the ratio of
CP*(Na) over CP(Th) is close to that of Taylor and
McLennan’s upper crust (in the same way for any
other couple soluble/insoluble). Eq. (6) then becomes,
for any soluble element X:
CPðX ÞC�PðX Þ ¼
1
a¼ 1� 1
P
Csilw ðX Þ
C�PðX Þ ð8Þ
The graph of this equation in a CP/CP* vs. Cw/CP*
plot is a straight line crossing the X-axis at P (in g/l)
and the Y-axis at 1. Schematically, this figure is a plot
of weathering intensity versus dissolved fluxes for the
different soluble elements (Gaillardet et al., 1999b).
Fig. 15. Diagrams of mean suspended sediments from upper Niger rivers normalised to the primitive mantle.
C. Picouet et al. / Chemical Geology 185 (2002) 93–124 119
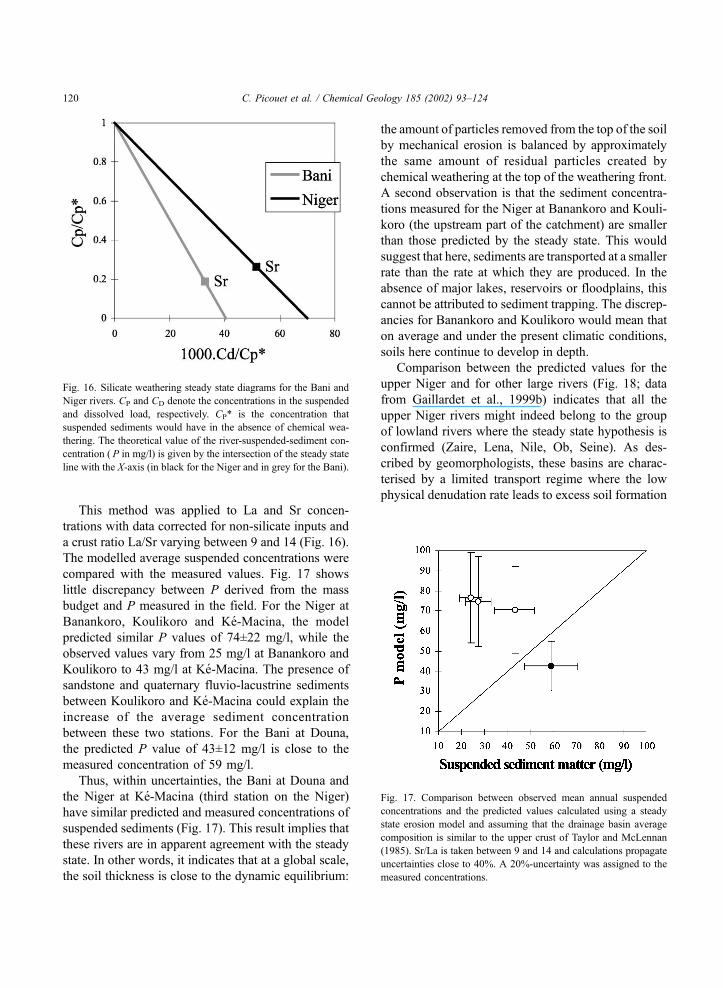
This method was applied to La and Sr concen-
trations with data corrected for non-silicate inputs and
a crust ratio La/Sr varying between 9 and 14 (Fig. 16).
The modelled average suspended concentrations were
compared with the measured values. Fig. 17 shows
little discrepancy between P derived from the mass
budget and P measured in the field. For the Niger at
Banankoro, Koulikoro and Ke-Macina, the model
predicted similar P values of 74±22 mg/l, while the
observed values vary from 25 mg/l at Banankoro and
Koulikoro to 43 mg/l at Ke-Macina. The presence of
sandstone and quaternary fluvio-lacustrine sediments
between Koulikoro and Ke-Macina could explain the
increase of the average sediment concentration
between these two stations. For the Bani at Douna,
the predicted P value of 43±12 mg/l is close to the
measured concentration of 59 mg/l.
Thus, within uncertainties, the Bani at Douna and
the Niger at Ke-Macina (third station on the Niger)
have similar predicted and measured concentrations of
suspended sediments (Fig. 17). This result implies that
these rivers are in apparent agreement with the steady
state. In other words, it indicates that at a global scale,
the soil thickness is close to the dynamic equilibrium:
the amount of particles removed from the top of the soil
by mechanical erosion is balanced by approximately
the same amount of residual particles created by
chemical weathering at the top of the weathering front.
A second observation is that the sediment concentra-
tions measured for the Niger at Banankoro and Kouli-
koro (the upstream part of the catchment) are smaller
than those predicted by the steady state. This would
suggest that here, sediments are transported at a smaller
rate than the rate at which they are produced. In the
absence of major lakes, reservoirs or floodplains, this
cannot be attributed to sediment trapping. The discrep-
ancies for Banankoro and Koulikoro would mean that
on average and under the present climatic conditions,
soils here continue to develop in depth.
Comparison between the predicted values for the
upper Niger and for other large rivers (Fig. 18; data
from Gaillardet et al., 1999b) indicates that all the
upper Niger rivers might indeed belong to the group
of lowland rivers where the steady state hypothesis is
confirmed (Zaire, Lena, Nile, Ob, Seine). As des-
cribed by geomorphologists, these basins are charac-
terised by a limited transport regime where the low
physical denudation rate leads to excess soil formation
Fig. 16. Silicate weathering steady state diagrams for the Bani and
Niger rivers. CP and CD denote the concentrations in the suspended
and dissolved load, respectively. CP* is the concentration that
suspended sediments would have in the absence of chemical wea-
thering. The theoretical value of the river-suspended-sediment con-
centration ( P in mg/l) is given by the intersection of the steady state
line with the X-axis (in black for the Niger and in grey for the Bani).
Fig. 17. Comparison between observed mean annual suspended
concentrations and the predicted values calculated using a steady
state erosion model and assuming that the drainage basin average
composition is similar to the upper crust of Taylor and McLennan
(1985). Sr/La is taken between 9 and 14 and calculations propagate
uncertainties close to 40%. A 20%-uncertainty was assigned to the
measured concentrations.
C. Picouet et al. / Chemical Geology 185 (2002) 93–124120
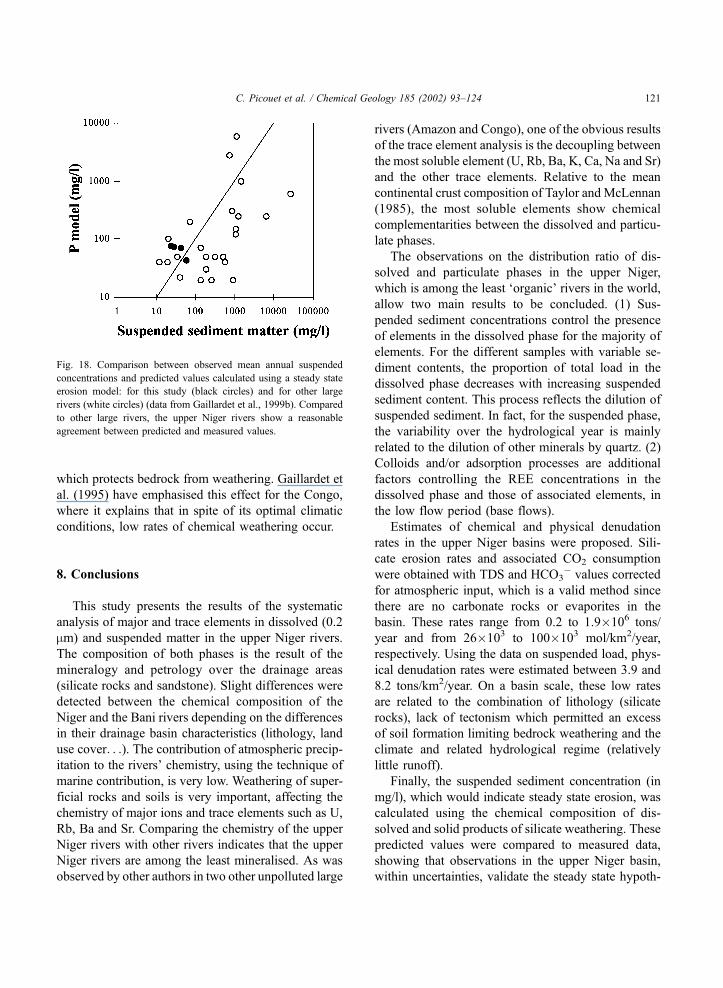
which protects bedrock from weathering. Gaillardet et
al. (1995) have emphasised this effect for the Congo,
where it explains that in spite of its optimal climatic
conditions, low rates of chemical weathering occur.
8. Conclusions
This study presents the results of the systematic
analysis of major and trace elements in dissolved (0.2
mm) and suspended matter in the upper Niger rivers.
The composition of both phases is the result of the
mineralogy and petrology over the drainage areas
(silicate rocks and sandstone). Slight differences were
detected between the chemical composition of the
Niger and the Bani rivers depending on the differences
in their drainage basin characteristics (lithology, land
use cover. . .). The contribution of atmospheric precip-
itation to the rivers’ chemistry, using the technique of
marine contribution, is very low. Weathering of super-
ficial rocks and soils is very important, affecting the
chemistry of major ions and trace elements such as U,
Rb, Ba and Sr. Comparing the chemistry of the upper
Niger rivers with other rivers indicates that the upper
Niger rivers are among the least mineralised. As was
observed by other authors in two other unpolluted large
rivers (Amazon and Congo), one of the obvious results
of the trace element analysis is the decoupling between
the most soluble element (U, Rb, Ba, K, Ca, Na and Sr)
and the other trace elements. Relative to the mean
continental crust composition of Taylor and McLennan
(1985), the most soluble elements show chemical
complementarities between the dissolved and particu-
late phases.
The observations on the distribution ratio of dis-
solved and particulate phases in the upper Niger,
which is among the least ‘organic’ rivers in the world,
allow two main results to be concluded. (1) Sus-
pended sediment concentrations control the presence
of elements in the dissolved phase for the majority of
elements. For the different samples with variable se-
diment contents, the proportion of total load in the
dissolved phase decreases with increasing suspended
sediment content. This process reflects the dilution of
suspended sediment. In fact, for the suspended phase,
the variability over the hydrological year is mainly
related to the dilution of other minerals by quartz. (2)
Colloids and/or adsorption processes are additional
factors controlling the REE concentrations in the
dissolved phase and those of associated elements, in
the low flow period (base flows).
Estimates of chemical and physical denudation
rates in the upper Niger basins were proposed. Sili-
cate erosion rates and associated CO2 consumption
were obtained with TDS and HCO3� values corrected
for atmospheric input, which is a valid method since
there are no carbonate rocks or evaporites in the
basin. These rates range from 0.2 to 1.9�106 tons/
year and from 26�103 to 100�103 mol/km2/year,
respectively. Using the data on suspended load, phys-
ical denudation rates were estimated between 3.9 and
8.2 tons/km2/year. On a basin scale, these low rates
are related to the combination of lithology (silicate
rocks), lack of tectonism which permitted an excess
of soil formation limiting bedrock weathering and the
climate and related hydrological regime (relatively
little runoff).
Finally, the suspended sediment concentration (in
mg/l), which would indicate steady state erosion, was
calculated using the chemical composition of dis-
solved and solid products of silicate weathering. These
predicted values were compared to measured data,
showing that observations in the upper Niger basin,
within uncertainties, validate the steady state hypoth-
Fig. 18. Comparison between observed mean annual suspended
concentrations and predicted values calculated using a steady state
erosion model: for this study (black circles) and for other large
rivers (white circles) (data from Gaillardet et al., 1999b). Compared
to other large rivers, the upper Niger rivers show a reasonable
agreement between predicted and measured values.
C. Picouet et al. / Chemical Geology 185 (2002) 93–124 121
esis. This basin is therefore characterised, like other
lowlands rivers, by a ‘transport limited regime’.
Acknowledgements
This work was carried out in a PhD study (Picouet,
1999) supported by the French Research Institute for
Development (IRD) and part of the PEGI program on
the geochemistry of tropical rivers (Programme sur
l’Environnement de la Geosphere Intertropicale).
Special thanks are due to members of IRD hydrology
team of Bamako and especially to J.C. Olivry and J.P.
Bricquet, for providing the essential discharge and
suspended sediment data used in this study. H.
Etcheber is thanked for analytical assistance with
organic carbon analyses. F. Sondag and the IRD
laboratory team in Bondy (Laboratoire des Forma-
tions Superficielles) are acknowledged for major
element analysis. Thanks to S. Pombo for her English
corrections. Many thanks to A. Wesselink for her
valuable comments on the last manuscript.
References
Appelo, C.A., Postma, D., 1993. In: Balkema, A.A. (Ed.), Geo-
chemistry, Groundwater and Pollution, A.A. Balkema, Rotter-
dam, Brookfield, 536 pp.
Berner, E., Berner, R., 1987. The Global Water Cycle: Geochemis-
try and Environment. Prentice-Hall, Englewood Cliffs, USA,
397 pp.
Bessoles, B., 1977. Geologie de l’Afrique. Le craton ouest-africain,
vol. 88, Memoire BRGM, France, 402 pp.
Bluth, G.J.S., Kump, L.R., 1994. Lithologic and climatologic con-
trols of river chemistry. Geochim. Cosmochim. Acta 58, 2341–
2359.
Boeglin, J.-L., Probst, J.L., 1996. Transports fluviaux de matieres
dissoutes et particulaires sur un bassin versant en region tropi-
cale: le bassin amont du Niger au cours de la periode 1990–
1993. Sci. Geol., Bull. 49, 25–45.
Boeglin, J.-L., Probst, J.L., 1998. Physical and chemical weathering
rates and CO2 consumption in a tropical lateritic environment:
the upper Niger basin. Chem. Geol. 148, 137–156.
Bricquet, J.P., Mahe, G., Bamba, F., Diarra, M., Mahieux, A., Des
Tureaux, T., Orange, D., Picouet, C., Olivry, J.C., 1997a. Ero-
sion et transport particulaire par le Niger: du bassin superieur a
l’exutoire du delta interieur (bilan de cinq annees d’observa-
tion). IAHS Publ. 246, 335–345.
Bricquet, J.P., Bamba, F., Mahe, G., Toure, M., Olivry, J.C., 1997b.
Evolution recente des ressources en eau de l’Afrique atlantique.
Rev. Sci. Eau 3, 321–337.
Broecker, W.S., Peng, T.-H., 1998. Greenhouse Puzzles, Part III,
Walker’s World: CO2, Chemical Traffic Controller? Eldigio
Press, Lamont–Doherty Earth Observatory of Columbia Uni-
versity, Palisades, NY, 93 pp.
Censier, C., Olivry, J.C., Briquet, J.P., 1995. Les apports detritiques
terrigenes dans la cuvette lacustre du Niger entre Mopti et Kona
(Mali). In: Olivry, J.C., Boulegue, J. (Eds.), Grands Bassins
Flaviaux Periatlantiques: Congo Niger, Amazone; Collection
Collaque and Seminaire, ORSTOM, Paris, 305–315.
Davis, J., Keller, H., 1983. Dissolved load in streams and rivers:
discharge and seasonally related variations. Proceedings of the
Hamburg Symposium. IAHS Publ., vol. 141, pp. 79–89.
Dupre, B., Gaillardet, J., Rousseau, D., Allegre, J.C., 1996. Major
and trace elements of river-borne material: the Congo Basin.
Geochim. Cosmochim. Acta 60, 1301–1321.
Elbaz-Poulichet, F., Seyler, P., Maurice-Bourgoin, L., Guyot, J.L.,
Dupuy, C., 1999. Trace element geochemistry in the upper Am-
azon drainage basin (Bolivia). Chem. Geol. 157, 319–334.
Ewans, C., Davies, T.D., 1998. Causes of concentration/discharge
hysteresis and its potential as a tool for analysis of episode
hydrochemistry. Water Resour. Res. 34, 129–137.
Freydier, R., Dupre, B., Lacaux, J.P., 1998. Precipitation chemistry
in Intertropical Africa. Atmos. Environ. 32, 749–765.
Gac, J.Y., 1986. Le fleuve Senegal: I. Bilan hydrologique et flux
continentaux de matieres particulaires a l’embouchure. Sci.
Geol., Bull. 39 (1), 99–130.
Gaillardet, J., Dupre, B., Allegre, J.C., 1995. A global geochemical
mass budget applied to the Congo Basin rivers: erosion rates and
continental crust composition. Geochim. Cosmochim. Acta 59,
3469–3485.
Gaillardet, J., Dupre, B., Allegre, J.C., Negrel, P., 1997. Chemical
and physical denudation in the Amazon River Basin. Chem.
Geol. 142, 141–173.
Gaillardet, J., Dupre, B., Louvat, P., Allegre, J.C., 1999a. Global
silicate weathering and CO2 consumption deduced from chem-
istry of large rivers. Chem. Geol. 159, 3–30.
Gaillardet, J., Dupre, B., Allegre, C.J., 1999b. Geochemistry of
large river suspended sediments: silicate weathering or recycling
tracer? Geochim. Cosmochim. Acta 23–24 (63), 4037–4051.
Goldstein, S.J., Jacobsen, S.B., 1988. Rare earth element in river
waters. Earth Planet. Sci. Lett. 89, 35–47.
Gourcy, L., 1994. Fonctionnement hydrogeochimique de la cuvette
lacustre du fleuve Niger (Mali). PhD Thesis, Univ. Paris XI,
France, 271 pp.
Guyot, J.L., 1993. Hydrogeochimie des fleuves de l’Amazonie bo-
livienne. Etudes and Theses, ORSTOM, Paris, 261 pp.
Kattan, Z., Probst, J.L., 1986. Transport en suspension et en solution
par la Moselle en periodes de crues. In: Coordonne par Hum-
bert, J., Cloots, A.R., Maire, G. (Eds.), Colloque ’Genese des
crues et inondations’ de Strasbourg 16–18 octobre 1986, ULP–
CEREG 191–215.
Laraque, A., Bricquet, J.P., Olivry, J.C., Berthelot, M., 1995. Trans-
ports solides et dissous du fleuve Congo (bilan de six annees
d’observation). In: Olivry, J.C., Boulegue, J. (Eds.), Grands
Bassins Fluviaux Periatlantiques: Congo, Niger, Amazone; Col-
lection Colloque and Seminaire, ORSTOM, Paris, 133–145.
Likens, G.E., Driscoll, C.T., Buso, D.C., Siccama, T.G., Johnson,
C.E., Lovett, G.M., Ryan, D.F., Fahey, T., Reiners, W.A., 1998.
C. Picouet et al. / Chemical Geology 185 (2002) 93–124122
The biogeochemistry of calcium at Hubbard Brook. Biogeo-
chemistry 41, 89–173.
Meybeck, M., 1982. Carbon, nitrogen and phosphorus transport by
world rivers. Am. J. Sci. 282, 401–450.
Meybeck, M., 1983. Atmospheric inputs and river transport of dis-
solved substances. Proceedings of the Hamburg Symposium.
IAHS Publ., vol. 141, pp. 173–192.
Meybeck, M., 1994. Origin and variable composition of present day
riverborne material. Material Fluxes on the Surface of the Earth.
National Academy Press, Washington, DC, pp. 61–73.
Meybeck, M., Ragu, A., 1996. River discharges to the oceans. An
assessment of suspended solids, major ions and nutrients. Envi-
ronmental Information and Assessment. UNEP/WHO, UNEP,
Nairobi, 245 pp.
Meybeck, M., Lo, H.M., Cauwet, G., Gac, J.Y., 1987. Geochemistry
of the sahelian Gambia river during the 1983 high-water stage.
Mitt. Geol.-Palaeontol. Inst. Univ. Hamburg, vol. 64, pp. 461–
473.
Meybeck, M., 1987. Global chemical weathering of surficial rocks
estimated from river dissolved loads. Amer. J. Sci. 287, 401–428.
Meybeck, M., Friedrich, G., Thomas, R., Chapman, D., 1996. Riv-
ers. In: Water quality assessments, a guide to the use of biota,
sediments and water in environmental monitoring, 2nd edn.
Chapman and Hall, London, pp. 243–318.2.
Milliman, J.D., Meade, R.H., 1983. World-wide delivery of river
sediment to the oceans. J. Geol. 91 (1), 1–21.
Milliman, J.D., Syvitski, J.P.M., 1992. Geomorphic/tectonic control
of sediment discharge to the ocean: the importance of small
mountainous rivers. J. Geol. 100, 25–544.
Negrel, P., Allegre, J.C., Dupre, B., Lewin, E., 1993. Erosion sour-
ces determined by inversion of major and trace element ratios
and strontium isotopic ratios in river water: the Congo Basin
case. Earth Planet. Sci. Lett. 120, 59–76.
Nouvelot, J.F., 1969. Mesure et etude des transports solides en
suspension au Cameroun. Cah. ORSTOM, Ser. Hydrol. 6 (4),
43–85.
Olivry, J.C., 1998. Hydrologie et geochimie du bassin soudano—
sahelien du fleuve Niger. In: et Seminaires, C. (Ed.), Hydrologie
et Geochimie Isotopique. ORSTOM, pp. 73–95.
Olivry, J.C., Bricquet, J.P., Mahe, G., 1993. Vers un appauvrisse-
ment durable des ressources en eau de l’Afrique humide? IAHS
Publ. 216, 67–78.
Olivry, J.C., Bricquet, J.P., Bamba, F., Diara, M., 1995a. Le regime
hydrologique du Niger superieur et le deficit des deux dernieres
decennies. In: Olivry, J.C., Boulegue, J. (Eds.), Grands Bassins
Fluviaux Periatlantiques: Congo, Niger, Amazone; Collection
Colloque and Seminaire, ORSTOM, Paris, pp. 251–266.
Olivry, J.C., Gourcy, L., Toure, M., 1995b. Premiers resultats sur la
mesure des flux de matieres dissoutes et particulaires dans les
apports du Niger au Sahel. In: Olivry, J.C., Boulegue, J. (Eds.),
Grands Bassins Fluviaux Periatlantiques: Congo, Niger, Ama-
zone; Collection Colloque and Seminaire, ORSTOM, Paris, pp.
281–292.
Orange, D., 1992. Hydroclimatologie du Fouta Djalon et dynamique
actuelle d’un vieux paysage lateritique. Sci. Geol., Mem. 93
Strasbourg, 198 pp.
Orange, D., Olivry, J.C., Censier, C., 1995. Variations et bilans des
flux de matieres particulaires et dissoutes de l’Oubangui a Ban-
gui (de 1987 a 1992). In: Olivry, J.C., Boulegue, J. (Eds.),
Grands Bassins Fluviaux Periatlantiques: Congo, Niger, Ama-
zone; Collection Colloque and Seminaire, ORSTOM, Paris, pp.
147–158.
Picouet, C., 1999. Geodynamique d’un hydrosysteme tropical peu
anthropise, le bassin superieur du Niger et son delta interieur.
PhD Thesis, Univ. Montpellier, France.
Picouet, C., Hingray, B., Olivry, J.C., 2001. Empirical and concep-
tual modelling of the suspened sediment dynamics in a large
tropical African river: the upper Niger river Basin. J. Hydrol.
250, 19–39.
Pierson, D.C., Taylor, C.H., 1994. The role of surface and sub-sur-
face runoff processes in controlling cation export from a wetland
watershed. Aquat. Sci. 56 (1), 80–96.
Probst, J.L., Nkounkou, R.R., Krempp, G., Bricquet, J.P., Thiebaux,
J.C., Olivry, J.C., 1992. Dissolved major elements exported by
the Congo and the Ubangui rivers during the period 1987–
1989. J. Hydrol. 135, 237–257.
Ramesh, R., Ramanathan, Al., Ramesh, S., Purvaja, R., Subrama-
nian, V., 2000. Distribution of rare earth elements and heavy
metals in the surficial sediments in the Himalayan river system.
Geochem. J. 34, 295–319.
Roy, S., Gaillardet, J., Allegre, C.J., 1999. Geochemistry of dis-
solved and suspended loads of the Seine River, France: anthro-
pogenic impact, carbonate and silicate weathering. Geochim.
Cosmochim. Acta 63 (9), 1277–1292.
Seyler, P., Etcheber, H., Orange, D., Laraque, A., Sigha-Nkamdjou,
L., Olivry, J.C., 1995. Concentrations, fluctuations saisonnieres
et flux de carbone dans le bassin du Congo. In: Olivry, J.C.,
Boulegue, J. (Eds.), Grands Bassins Fluviaux Periatlantiques:
Congo, Niger, Amazone; Collection Colloque and Seminaire,
ORSTOM, Paris, 217–228.
Stallard, R.F., Edmond, J.M., 1981. Geochemistry of the Amazon: I.
Precipitation chemistry and the marine contribution to the dis-
solved load at the time of the peak discharge. J. Geophys. Res.
86, 9844–9858.
Stallard, R.F., Edmond, J.M., 1983. Geochemistry of the Amazon:
II. The influence of the geology and weathering environment in
the dissolved load. J. Geophys. Res. 88, 9671–9688.
Summerfield, D.M.A., Hulton, N.J., 1994. Natural controls of flu-
vial denudation rates in major world drainage basins. J. Geo-
phys. Res. 99 (B7), 13871–13883.
Taylor, S.R., McLennan, S.M., 1985. The Continental Crust: Its
Composition and Evolution. Blackwell, Oxford, 312 pp.
Tricca, A., Stille, P., Steinmann, M., Kiefel, B., Samuel, J., Eiken-
berg, J., 1999. Rare earth elements and Sr and Nd isotopic
compositions of dissolved and suspended loads from small river
systems in the Vosges mountains (France), the river Rhine. Geo-
chim. Cosmochim. Acta 63 (9), 1277–1292.
Vandecasteele, C., Block, C.B., 1993. Modern Methods for Trace
Element Determination. Wiley, Chichester.
Viers, J., Dupre, B., Polve, M., Schott, J., Dandurand, J.L., Braun,
J.J., 1997. Chemical weathering in the drainage basin of a trop-
ical watershed (Nsimi–Zoetele site, Cameroon): comparison
between organic-poor and organic-rich waters. Chem. Geol.
140, 181–206.
C. Picouet et al. / Chemical Geology 185 (2002) 93–124 123

Walling, D.E., 1983. The sediment delivery problem. J. Hydrol. 65,
209–237.
Walling, D.E., Foster, I.D.L., 1975. Variations in the natural chem-
ical concentration of water during floods flows and the lag
effect: some further comments. J. Hydrol. 26, 237–244.
Walling, D.E., Webb, B.W., 1980. The spatial dimension in the
interpretation of stream solute behaviour. J. Hydrol. 47, 129–
149.
Walling, D.E., Webb, B.W., 1996. Erosion and sediment yield: a
global overview. Proc. of the Exeter Symposium, July 1996.
IAHS Publ., vol. 236, pp. 3–19.
Zhang, J., Huang, W.W., Wang, J.H., 1994. Trace-metal chemistry
of the Huange (Yellow River), China—examination of the data
from in situ measurements and laboratory approach. Chem.
Geol. 114, 83–94.
C. Picouet et al. / Chemical Geology 185 (2002) 93–124124