macroeconomic determinants of fdi inflows in cambodia
TRANSCRIPT
54
Vol. 38, No. 1, January – Aprill 2020 Page [54-72]
Macroeconomic Determinants of FDI Inflows in
Cambodia, Laos, Myanmar and Vietnam: Panel
Data Analysis
Xin-Lin Soo Faculty of Economics and Business, Universiti Malaysia Sarawak, Malaysia
Jerome Kueh*
Faculty of Economics and Business, Universiti Malaysia Sarawak, Malaysia
Received 7 August 2019, Received in revised form 29 December 2019,
Accepted 7 January 2020, Available online 16 March 2020
_________________________________________________________________________
Abstract
The main objective of this study is to examine the macroeconomics determinants
of FDI inflows in Cambodia, Laos, Myanmar, and Vietnam. There are many factors
obstruct the ability in attracting investments into developing countries. The selected
macroeconomics determinants are market size, inflation rate, openness, real effective
exchange rate and labor force. This study covered from 2000 to 2016 using annually data.
The methods adopted are panel unit root tests, panel cointegration tests, Fully-Modified
Ordinary Least Square (FMOLS) and panel Granger causality. The study findings indicate
that all the exogenous variables are cointegrated and significant in influencing FDI inflow.
However, in the short run, there is only unidirectional causal relationship.
Keywords: Foreign Direct Investment, Fully-Modified Ordinary Least Square, Panel
Granger Causality, Openness, Exchange Rate
JEL Classifications: C23, F21, F23, O50
* Correspondence author: Address: Jalan Datuk Mohammad Musa, 94300 Kota Samarahan, Sarawak,
Malaysia. Email: [email protected]
Thailand and The World Economy | Vol. 38, No.1, January - April 2020 | 55
1. Introduction
Foreign direct investment (FDI) refers to an investment made by investors from one
country into another that involves the long term interest. The investment is directly due that
the investment is done on purchasing income-generating assets in a foreign market. FDI
can be differentiated into three main types, which is horizontal, vertical, and conglomerate.
Horizontal FDI occurs when same businesses or activities are done aboard the same way as
at home. A vertical FDI occurs when added different stages of activities abroad. Vertical
FDI can be divided into forward and backward. Forward vertical FDI is where FDI takes
the firm nearer to the market. FDIs are often seen to be a healthy way for less-developed
and developing countries to overcome their saving-investment gap, which limits the level
of domestic investments. In this research study, the countries being investigated are
Cambodia, Lao PDR (Laos), Myanmar, and Vietnam. These four countries are the
members of ASEAN. In the past few years, these countries are having similar experiences
with FDI inflows. Since foreign private capital was generally not permitted into the four
countries in the years preceding their ‘opening up’, the governments of these countries
have experienced a steep learning curve; learning how to attract, retain, sustain, manage,
harness, and monitor FDI inflows (Hseih & Hong, 2005). Based on the statistics from
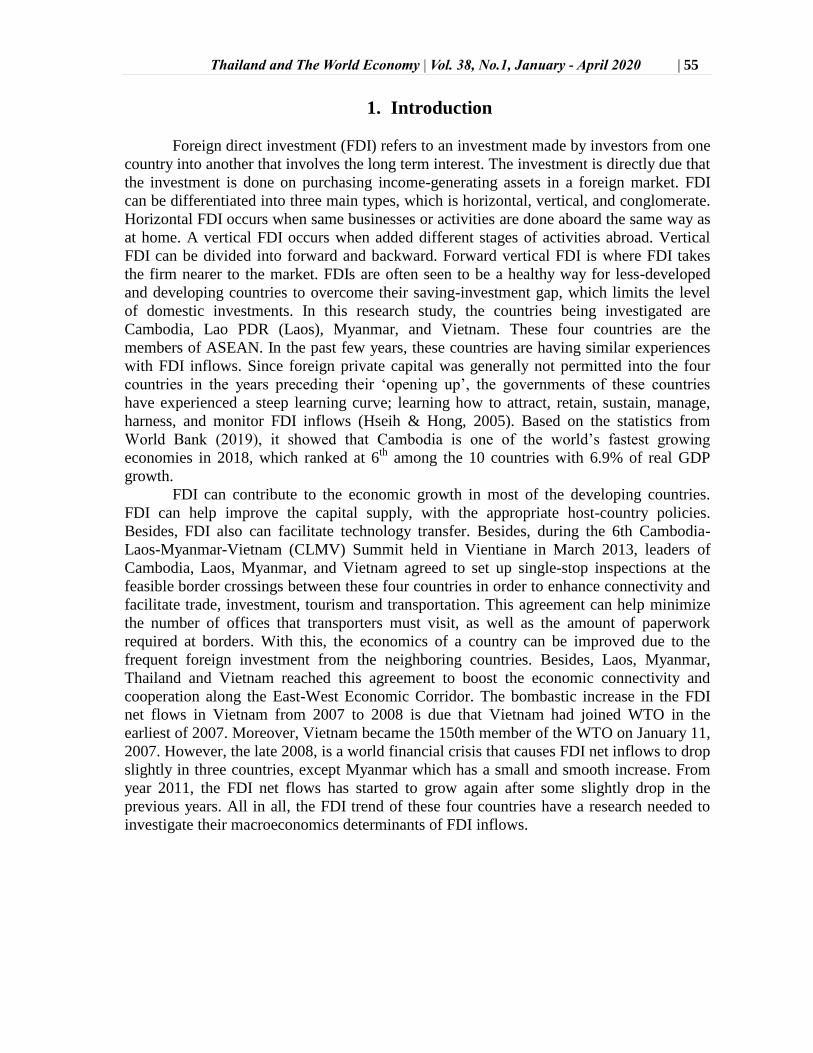
World Bank (2019), it showed that Cambodia is one of the world’s fastest growing
economies in 2018, which ranked at 6th
among the 10 countries with 6.9% of real GDP
growth.
FDI can contribute to the economic growth in most of the developing countries.
FDI can help improve the capital supply, with the appropriate host-country policies.
Besides, FDI also can facilitate technology transfer. Besides, during the 6th Cambodia-
Laos-Myanmar-Vietnam (CLMV) Summit held in Vientiane in March 2013, leaders of
Cambodia, Laos, Myanmar, and Vietnam agreed to set up single-stop inspections at the
feasible border crossings between these four countries in order to enhance connectivity and
facilitate trade, investment, tourism and transportation. This agreement can help minimize
the number of offices that transporters must visit, as well as the amount of paperwork
required at borders. With this, the economics of a country can be improved due to the
frequent foreign investment from the neighboring countries. Besides, Laos, Myanmar,
Thailand and Vietnam reached this agreement to boost the economic connectivity and
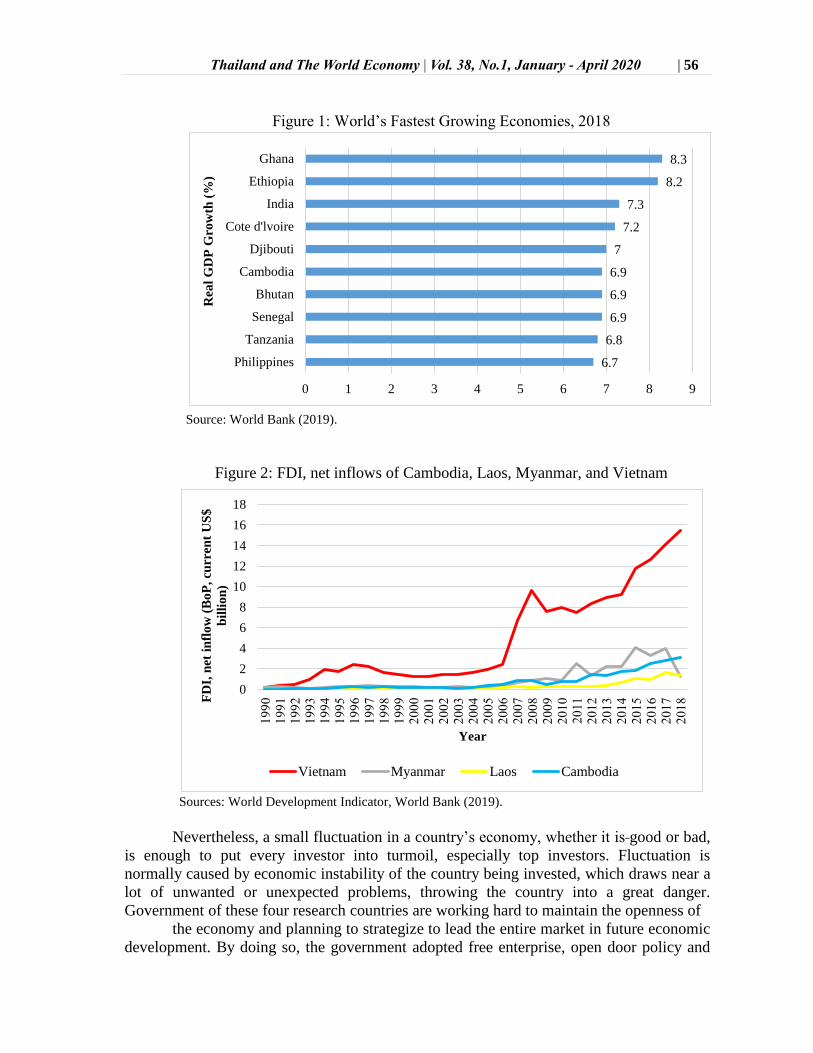
cooperation along the East-West Economic Corridor. The bombastic increase in the FDI
net flows in Vietnam from 2007 to 2008 is due that Vietnam had joined WTO in the
earliest of 2007. Moreover, Vietnam became the 150th member of the WTO on January 11,
2007. However, the late 2008, is a world financial crisis that causes FDI net inflows to drop
slightly in three countries, except Myanmar which has a small and smooth increase. From
year 2011, the FDI net flows has started to grow again after some slightly drop in the
previous years. All in all, the FDI trend of these four countries have a research needed to
investigate their macroeconomics determinants of FDI inflows.
Thailand and The World Economy | Vol. 38, No.1, January - April 2020 | 56
6.7
6.8
6.9
6.9
6.9
7
7.2
7.3
8.2
8.3
0 1 2 3 4 5 6 7 8 9
Philippines
Tanzania
Senegal
Bhutan
Cambodia
Djibouti
Cote d'lvoire
India
Ethiopia
Ghana
Rea
l G
DP
Gro
wth
(%
)
0
2
4
6
8
10
12
14
16
18
19
90
1
99
1
19
92
1
99
3
19
94
1
99
5
19
96
1
99
7
19
98
1
99
9
20
00
2
00
1
20
02
2
00
3
20
04
2
00
5
20
06
2
00
7
20
08
2
00
9
20
10
2
011
2
01
2
20
13
2
01
4
20
15
2
01
6
20
17
2
01
8 FD
I, n
et i
nfl
ow
(B
oP
, cu
rren
t U
S$
bil
lio
n)
Year
Vietnam Myanmar Laos Cambodia
Figure 1: World’s Fastest Growing Economies, 2018
Source: World Bank (2019).
Figure 2: FDI, net inflows of Cambodia, Laos, Myanmar, and Vietnam
Sources: World Development Indicator, World Bank (2019).
Nevertheless, a small fluctuation in a country’s economy, whether it is good or bad,
is enough to put every investor into turmoil, especially top investors. Fluctuation is
normally caused by economic instability of the country being invested, which draws near a
lot of unwanted or unexpected problems, throwing the country into a great danger.
Government of these four research countries are working hard to maintain the openness of
the economy and planning to strategize to lead the entire market in future economic
development. By doing so, the government adopted free enterprise, open door policy and
Thailand and The World Economy | Vol. 38, No.1, January - April 2020 | 57
so on to attract foreign investors. As such, these countries’ exports and foreign direct
investment (FDI) increased years by years. This is clearly made an argument that they play
an important role in the economy market. Each investor is putting their trust into this small
country believed to be of great potential in economic growth. At the same time, higher
inflation brings a few more economic challenges. Moreover, there is also a possibility of
housing bubble and emerging-market weakness. These factors have shaken economic base
as well as the investors’. Investors will start to think over and over again to make sure they
do not invest in a wrong country, which in turns affecting the FDI inflow of Cambodia,
Laos, Myanmar, and Vietnam. Moreover, these four countries broadly opened up to foreign
investment at roughly the same time, issuing and subsequently improving quite liberal
foreign investment laws and implementing regulations, where the FDI reacts quickly to the
promulgation of foreign investment laws in these countries, and thus the aggregate FDI
inflows have been quiet admirable (Hsieh & Hong, 2005).
In recent years, there are many international enterprises build up their factories in
Cambodia, Laos, Myanmar, and Vietnam. Some firms newly launch their factories in these
countries, while some are expanding in number of factories. MASCOT is one of the
company that builds its factory in Laos. MASCOT opens up the new factory in Laos in
2013 (Mascot workwear, 2014). MASCOT is Denmark’s largest manufacturer of work
wear, where this company is 100 percent foreign owned enterprise. On the other hand,
according to Bhatnagar, Rathore, Moreno, and Kanungo (2003) Nike Inc. is another
example that shows number of factories built in Vietnam. Nike Inc. is a US company that
focuses on industry of apparel, accessories, and footwear. Nike is ranked second highest
number of factories in Vietnam among all factories of Nike over the world. Besides, the
factories in Vietnam own the highest number of workers among other factories. The first
factory of Nike Inc. in Vietnam is established in 1995, then the number of factories are
being increase until today. Moreover, Stangler (2015) mentioned that H&M is one of the
western clothing companies that built many factories, about 65 large factories in Cambodia
that involved in manufacturing and processing. All these global enterprises open up their
factories in these four countries because the countries are rich in labor force. In addition,
these countries have great advantages in easy access to ASEAN markets.
Furthermore, Hsieh and Hong (2005) mentioned that market size which is measured
by GDP per capita is the most important determinant of FDI when compares with other
macroeconomics variables. Normally, when the market size increases, FDI inflows will
increase likewise. However, this situation does not happen all the time. As an example,
Cambodia, Laos, Myanmar, and Vietnam faced the same problem where the FDI inflows
and GDP per capita do not show a positive relationship in certain period of years.
Therefore, this research is to investigate the macroeconomics determinants of FDI in 4
ASEAN countries, and also inspect the relationship between variables in the short run and
the long run.
Furthermore, many researchers investigate the determinants of FDI are mostly on in
those European developed countries, for example Biswas (2002); Bevan and Estrin (2004);
Sharma and Bandara (2010). However, the developing countries are less frequent been
attracted to the foreign investors. This may due to the instability condition, for example
political instability, and the fluctuation of currency value in many countries. On the other
hand, the data obtained must be complete without occurring of missing data. In other
words, the data must be balanced data. This can ensure higher accuracy in research work.
Thailand and The World Economy | Vol. 38, No.1, January - April 2020 | 58
On the other hand, this research can also provide useful insight to the policy makers
to develop appropriate policies and strategies to attract sustainable inflow of FDI. The
macroeconomics determinants of FDI is such important as reference to these countries in
order to better up their FDI. It can be said that it is beneficial for these countries to
introduce new policy to encourage the growth of FDI. Meanwhile, the encouragement of
FDI inflows can be achieved at the end of the agreement, which depends on the interests of
both the investors and the host country. Additionally, the risk of each investment in a
particular country can be measured by every investor before the decision is made by
referring to this research study. This research study is also advantageous for the investors
to evaluate and find out the possible factors that will drive their investments to have profit
if they wish to expand the business to particular countries. Furthermore, this research study
is also able to provide a more recent insight for policy makers in determining the potential
of a country to be invested.
In addition, the research on this topic will enhance the effectiveness and efficiency
in the process of attracting or absorbing FDI into host countries. In orderly, this can highly
stimulate the economic growth of those countries and also directly contribute to the
developing process of a country. Besides, this can also allow the host countries access to
new and modern technology along with the one brought in by multinational co-operations
who invest in host countries. Meanwhile, indirectly, FDI’s inflows creates employment
chances for the nationals of the host countries too.
2. Literature Review
Foreign direct investment (FDI) is important for a country to be in a good balance
situation and hence improves the growth. The previous studies on the macroeconomics
determinants of FDI are reviewed. Market size is the most important macroeconomics
factor (Hussain & Kimuli, 2012) and has most influential effect on the FDI which is
according to most of the researchers that had done the researches on the same topic. Market
size can be categorized through national income, and hence following the previous
researchers Wahid, Sawkut, and Seetanah (2006) to use GDP per capita to proxy for
market size. It has high potential in FDI development. According to Cuyvers, Soeng,
Plasmans, and Bulcke (2011), the larger market size tends to induce more FDI to the host
country. This is because investors will have more interest to invest in large market size
rather than in a small and no invest gain market. Based on Hsieh and Hong (2005), their
research is done in Cambodia, Laos, Myanmar, and Vietnam from year 1990 to 2001,
which apply on a dynamic panel data model. They found that market size which used GDP
per capita as proxy is the most important determinants that has significantly contributed to
attract FDI. Moreover, Hoang (2006) conducted a research on factors affecting FDI inflows
too. However, Vietnam is the selected country in the research. Hoang (2006) found that
GDP presents a positive impact on FDI inflows between 1988 and 2005 when the data is
recorded quarterly. Next, Ang (2008) mentioned that real GDP has a positive impact on
FDI inflows. This research result is based on Malaysia, a developing country, from the year
1960 to 2005 by using time series data, unrestricted error-correction model, and 2SLS
approach. In addition, panel data analysis is used to estimate the determinants of FDI
inflows in 61 provinces of Vietnam from the year 1996 to 2005 (Anwar & Nguyen, 2010).
Anwar and Nguyen (2010) found that market size plays an important role which has
positive and significant effect on attracting large number of FDI inflows. Cuyvers et al.
Thailand and The World Economy | Vol. 38, No.1, January - April 2020 | 59
(2011) also mentioned that market size has positively significant impact to FDI inflows in
Cambodia from the year 1995 to 2005. They concluded that larger market size of the home
country tends to induce FDI from the home country to Cambodia.
Inflation rate is one of the macroeconomics determinants of FDI inflows of
countries. Inflation rate plays a role that will affect the country’s overall financial
performance and it relates to macroeconomic mismanagement, which deter FDI inflows to
countries (Farazmand & Moradi, 2014). The research on 38 developing countries is done
with average value of data from 2000 to 2004 (Demirhan & Masca, 2008). In this research
study, OLS regression is adopted to estimate the results. The results shown that inflation
rate is statistically significant, but is in negative relationship with FDI inflows. Next,
according to Farazmand and Moradi (2014), they adopted panel data analysis, which
covered the dataset from 1990 to 2012 annually. They investigated the factors affecting
FDI inflows in Malaysia, Philippines, Singapore, Thailand, and also Turkey with panel unit
root test, Pedroni cointegration test, Hausman test, heteroscedasticity, and GLS technique.
They concluded that inflation rate has negative effect on FDI inflows.
Trade openness plays an important role in motivate the investment of foreign
investors to the country. The trade barrier of a country will directly affect the FDI inflows.
Therefore, a low import barrier will reduce the tariff-jumping of the FDI. However, it may
stimulate vertical FDI by facilitating the imports of inputs or machinery (Jaumotte, 2004).
Besides, the FDI inflows will be affected by the degree of openness too. According to
Onyeiwu and Shrestha (2004), they used panel analysis approach to determine the factors
of FDI inflows in 29 African countries. The time period for their research is from 1975 to
1999, which is in annual data. In panel analysis, they adopted fixed and random effects
models. Openness shows statistically significant results in both models. In other words,
openness will deter the foreign investment to a host country. Moreover, Hsieh and Hong
(2005) found that the research on Cambodia, Laos, Myanmar, and Vietnam from the year
1990 to 2001 by using dynamic panel data model, degree of openness has significantly
contributed to attracting FDI inflows. They also mentioned that the degree of openness is
one of the most important determinants to attract FDI. Next, Vietnam’s openness shows a
statistically significant and positive effects to FDI inflows (Hoang, 2006). Hoang (2006)
chose to estimate the time series model by using OLS regression. The time period for the
model is from 1988 and 2005, which is recorded quarterly. In addition, a research is done
on Malaysia, Philippine, Singapore, Thailand, and Turkey, which are developing countries
from the year 1990 to 2012 by Farazmand and Moradi (2014). They used panel data
analysis and found that openness is positively and significantly correlated to FDI in their
five researched countries.
Exchange rate is another important variable in determine FDI inflows of a country.
Normally, exchange rate is related to appreciation and depreciation that is very concerned
by foreign investors. The appreciation and deprecation of an exchange rate will definitely
influence the decisions of investors to invest in foreign countries. Hence, the FDI inflows
will be affected too. As a reference to the research done by Kaur and Sharma (2013), it is
based on India from the year 1990 to 2011, which is in quarterly data frequency. They
found that exchange rate is a significant variable which has negative impact on FDI.
Narayan (2014) research is done on India too, which is the same as Kaur and Sharma
(2013). However, the different is the time period, where Narayan (2014) chose the time
period from 1991 to 2013, in two-year data frequency. However, the result in Narayan
(2014) research showed that the real effective exchange rate is positively correlated to FDI
inflows in India. In addition, Gharaibeh (2015) conducted a research on examine the
Thailand and The World Economy | Vol. 38, No.1, January - April 2020 | 60
factors that influence FDI inflows in Bahrain. The time period of the research covered from
1980 to 2013 by adopting OLS regression analysis. The results indicated that exchange rate
is having positive insignificant relationship with FDI inflows.
On the other hand, labor force is the main asset of a country in order to expand the
country’s economy. Labor force is classified as the total number of workers, both skilled
and unskilled. Foreign investors like to invest in a country that is rich in number of labor
force. This is because a large number of workers can indicate higher productivity and
efficiency. According to Gharaibeh (2015), he chose labor force as one of the indicators to
examine the factors affecting FDI inflows in Bahrain. The time period of the research
covered from 1980 to 2013, which is recorded yearly. In order to test the model, OLS
regression is adopted. The results show that labor force is statistically significant and
positive relationship to FDI inflows at 1% of significant level. This suggests that an
increase in labor force increases the amount of FDI inflows into the country, too
(Gharaibeh, 2015). Hence, in the research, it concluded that labor force is a determinant
factor of the FDI inflows.
3. Data and Methodology
The purpose of this research is to examine the macroeconomics determinants of
FDI in 4 ASEAN countries, which are Cambodia, Laos, Myanmar, and Vietnam that will
influence the economy of each country from the year 2000 to the year 2016, a panel data
analysis will be carried out with balanced panel data, which covered 68 observations. The
dependent variable is FDI inflows of the 4 CLMV countries and the explanatory variables
are market size, inflation rate, trade openness, real effective exchange rate, and total labor
force. In order to make the research clear, following is the explanation on dependent and
independent variables.
Foreign Direct Investment (FDI)
FDI inflows is the dependent variable in this research, where it is important for the
growth of a country. The FDI inflows of countries are measured by FDI inward flow of
stock in US dollars at current prices and current exchange rate. The data is obtained from
UNCTAD statistics database.
Market size (SIZE)
The market size variable is measured by real GDP per capita as proxy. This is to
show the strength of economic condition of a country. Real GDP per capita is calculated by
total population of a country divided by GDP. The measurement for GDP per capita is US
dollars at constant prices (2005) and constant exchange rate (2005) per capita. The data of
market size variable is obtained from World Development Indicators, World Bank (2017).
Inflation Rate (INF)
Inflation is defined as a sustained increase in the general level of prices of goods
and services. It is measured as an annual percentage increase; therefore, it is called inflation
rate. As inflation rises, every dollar owns to buy a smaller percentage of goods or services.
The measurement of inflation rate is CPI in based 2005. The data of inflation rate is
obtained from UNCTAD stat (2017).
Thailand and The World Economy | Vol. 38, No.1, January - April 2020 | 61
Trade Openness (OPEN)
Trade openness is important for foreign direct investors who are motivated by the
export market (Wahid et al., 2006). Trade openness is calculated by the summation of
imports and exports divides by GDP of a country. Imports, exports, and GDP are measured
in USD at current prices and current exchange rates. Trade openness is expected to have
positive sign, too. The variables data are obtained from UNCTAD stat (2017).
Real Effective Exchange Rate (REER)
Real effective exchange rate is concerned by mostly of the foreign investors
regarding its appreciation and depreciation. REER is the weighted average of a country’s
currency relative to an index or a basket of other major currencies which is adjusted for the
effects of inflation, for example USD, Yen, Euro. In this study, REER is measured by CPI
with index base of the year 2005. The data is obtained from UNCTAD stat (2017).
Total Labor Force (TLF)
According to Gharaibeh (2015), labor force is a variable that seldom considered by
past researchers. Nowadays, labor force is the important assets for companies to run their
factories. A greater number of labor force can enhance productivity. The measurement for
total labor force is in the absolute value. The data for total labor force also is obtained from
UNCTAD stat (2017).
The main reason for this study to proceed with the methodology of panel unit root,
panel cointegration, fully modified OLS, and panel Granger causality, is because N is
smaller than T. N denotes the number of individuals, and T denotes the number of time
periods. In this study on examining the macroeconomics determinants of FDI inflows, N is
equal to 4 (Cambodia, Laos, Myanmar, and Vietnam) and T is equal to 17 (the year 2000 to
2016). Instead, macro panel is characterized by having a relatively large T and a relatively
small N. In this study, as N<T, thus the study is said to be macro panel. As a consequence,
this is the main reason why this study has to be proceeded with selected methodologies.
(1)
However, this balanced panel model is a linear function with the degree of
coefficients and variables exactly equal to one. In order for the model to get the best fit
model, the variables in the model is applied to log form. Hence, the equation applied with
logarithm, and the equation is expressed as follow.
(1)
Panel Unit Root Tests
A unit root test is used to test the stationary of a process that changes with time.
Stationary is essential in testing for variables to find out the validity of standard
assumptions for asymptomatic analysis. In this study, Levin, Lin, and Chu (2002) and Im,
Pesaran, and Shin (2003) panel unit root and stationary tests are adopted. This is to obtain
conclusive evidence with regard to the order of integration of the series under investigation
(Jayaraman & Lau, 2008). For Levin and Lim (1993); Levin et al. (2002); Im et al. (1997,
2003), the hypothesis test is shown.
Thailand and The World Economy | Vol. 38, No.1, January - April 2020 | 62
Unit root exists (non-stationary)
No unit root (stationary)
Stationary of variables normally will happen at first difference, I(1), seldom in level
form. The rejection rule for those tests are if the t-statistics value is greater than the
significance value, is rejected, which means that the variable is stationary vice versa.
Panel Cointegration Tests
Panel cointegration test is normally used to investigate the long run equilibrium
relationship between variables. In cointegration test, the Pedroni (1999, 2001, 2004) and
Kao (1999) tests are utilised. Both tests have different requirements in continue the tests,
however both tests have the same .
No cointegration (no long run)
Cointegration exists (has long run)
Firstly, Pedroni (1999, 2001, 2004) test is determined by taking the majority
number on which the variables is reject or do not reject. After that, Kao (1999) test is
carried out to support the results in Pedroni (1999, 2001, 2004) test. Pedroni (1999) shows
that under appropriate standardization based on the moments of vector of Brownian motion
function, each of these statistics converges weakly to a standard normal distribution when
both the T and N of the panel grow large. Jayaraman and Lau (2008) mentioned that for
Kao (1999) test, cross-section specific intercepts and homogeneous coefficients on first-
stage regressors are specified. Therefore, the panel regression model for Kao (1999) is
stated as:
(3)
where and are I(1) and non-cointegrated. Kao (1999) also suggests that ADF-type
unit root tests for is null hypothesis no cointegration.
Panel Fully Modified OLS (FMOLS) Estimates
In this study, the econometric approach, fully modified OLS (FMOLS), is
employed for the estimation, which is to provide optimal estimates of linear cointegrating
regressions. Phillips and Hansen (1990) proposed an estimator that employs a semi-
parametric correction to remove the issues caused by the long run correlation between the
cointegrating equation and stochastic regressor innovations. Moreover, FMOLS estimator
is asymptotically unbiased and has fully efficient mixture normal asymptotic allowing for
standard Wald tests using asymptotic Chi-square statistical inference. The FMOLS comes
out to be more reliable at extracting strong signal-to-noise ratios throughout the samples
and is preferred. Additionally, the FMOLS procedure accommodates the heterogeneity that
is typically presented both in the transitional serial correlation dynamics and in the long run
cointegrating relationships (Jayaraman & Lau, 2008).
Granger Causality Test
Thailand and The World Economy | Vol. 38, No.1, January - April 2020 | 63
According to Holtz-Eakin, Newey, and Rosen (1988, 1989), estimation on a panel
based vector error correction model (VECM) with a dynamic error correction term is
adopted to test for panel causality. Whereby, the causal relationship can be classified into
unidirectional causal, bi-directional causality relationship, and indirect causal relationship.
4. Empirical Findings and Results Analysis
The empirical tests that are covered under this model are panel unit root test, panel
cointegration test, fully-modified OLS estimation (FMOLS), VECM, and panel Granger
causality test. The empirical analyses of panel data in this study comprise the following
steps. First, the stationary of data is examined by panel unit root tests. Under panel unit
root tests, Levin et al. (2002) and Im et al. (2003) are adopted. Second, tests for
cointegration among panel data were the panel cointegration test developed by Pedroni
(1999, 2004), and Kao (1999). Next, is the estimation of long run on FMOLS. Fourth,
proceed to VECM. Lastly, once the results of VECM is obtained, the panel Granger
causality is employed to find out the short run causality among variables. While on the
empirical results, the variables that emphasized are market size that used GDP per capita as
proxy, inflation rate, trade openness, real effective exchange rate (REER), and total labor
force.
Panel Unit Root Tests
According to Farazmand and Moradi (2014), Breitung (2000) and Levin et al.
(2002) began to study on panel unit root with heterogeneous dynamics, fixed effects, and
an individual specific determinant trend. However, they assumed the present of a
homogeneous autoregressive root under the alternative. Whereas Im et al. (2003) allowed
the between-group panel unit root tests that permit heterogeneity of the autoregressive root
under the alternative. The null hypotheses of all unit root tests are to have a unit root in a
series. Nevertheless, there is a great deal of research been committed to the use of unit root
tests. In other words, Levin et al. (2002) and Im et al. (2003) are the most popular
approaches used by researchers in unit root tests. Therefore, in my research study, I
adopted both approaches to examine the stationary of data.
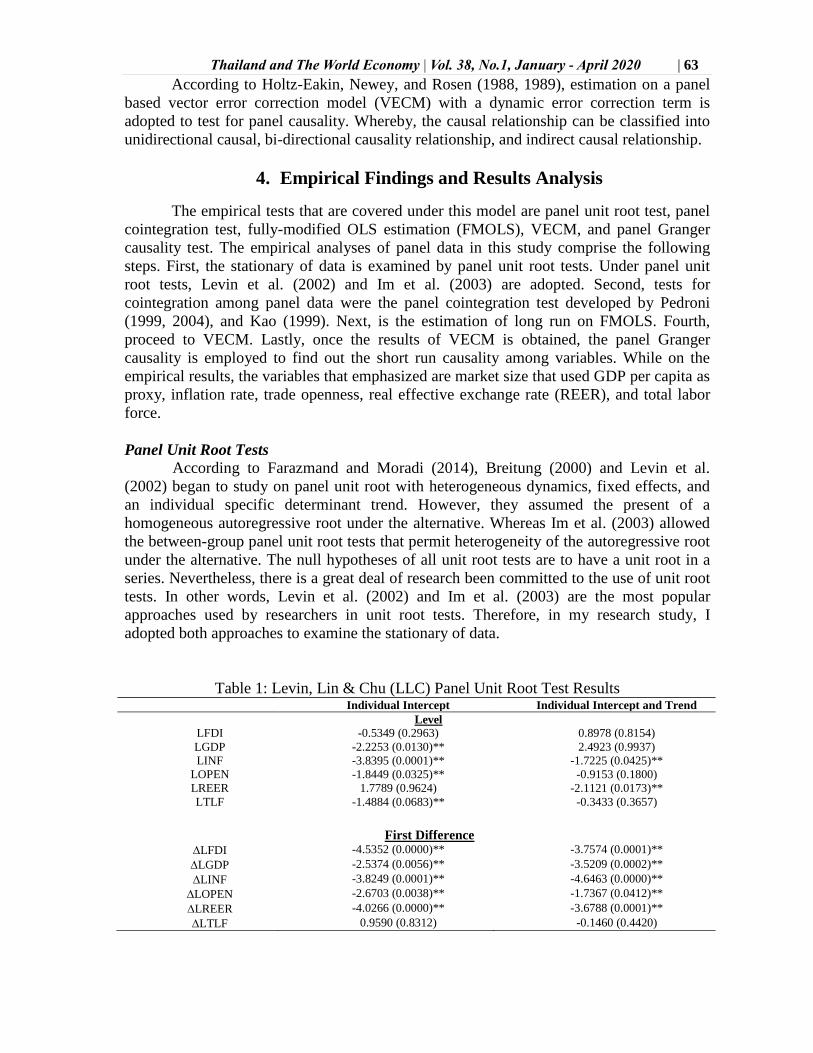
Table 1: Levin, Lin & Chu (LLC) Panel Unit Root Test Results Individual Intercept Individual Intercept and Trend
Level
LFDI -0.5349 (0.2963) 0.8978 (0.8154)
LGDP -2.2253 (0.0130)** 2.4923 (0.9937)
LINF -3.8395 (0.0001)** -1.7225 (0.0425)**
LOPEN -1.8449 (0.0325)** -0.9153 (0.1800)
LREER 1.7789 (0.9624) -2.1121 (0.0173)**
LTLF -1.4884 (0.0683)** -0.3433 (0.3657)
First Difference
LFDI -4.5352 (0.0000)** -3.7574 (0.0001)**
LGDP -2.5374 (0.0056)** -3.5209 (0.0002)**
LINF -3.8249 (0.0001)** -4.6463 (0.0000)**
LOPEN -2.6703 (0.0038)** -1.7367 (0.0412)**
LREER -4.0266 (0.0000)** -3.6788 (0.0001)**
LTLF 0.9590 (0.8312) -0.1460 (0.4420)
Thailand and The World Economy | Vol. 38, No.1, January - April 2020 | 64
Notes: LLC indicated the Levin et al. (2002) panel unit root and stationary tests. The LLC examines the null
hypothesis of non-stationary of variables. The parenthesized values are the probability of rejection. Asterisks
(**) indicates statistically significant at 10 percent level. All the variables are in logarithm form.
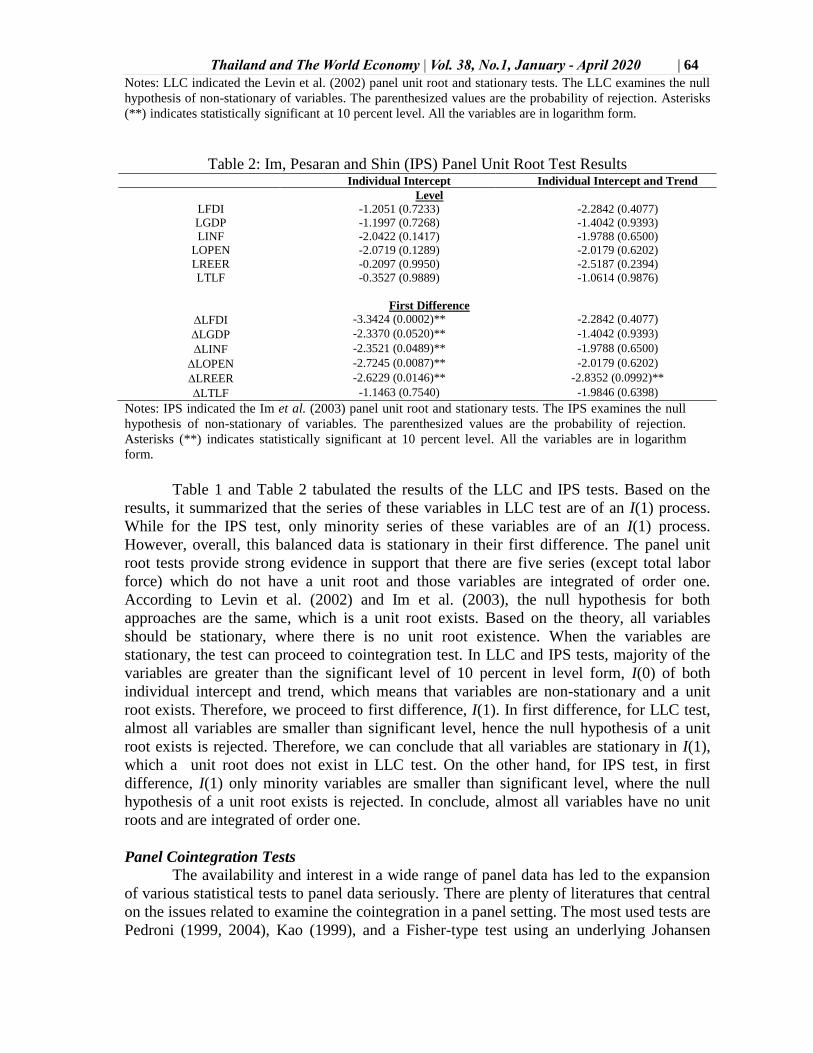
Table 2: Im, Pesaran and Shin (IPS) Panel Unit Root Test Results Individual Intercept Individual Intercept and Trend
Level
LFDI -1.2051 (0.7233) -2.2842 (0.4077)
LGDP -1.1997 (0.7268) -1.4042 (0.9393)
LINF -2.0422 (0.1417) -1.9788 (0.6500)
LOPEN -2.0719 (0.1289) -2.0179 (0.6202)
LREER -0.2097 (0.9950) -2.5187 (0.2394)
LTLF -0.3527 (0.9889) -1.0614 (0.9876)
First Difference
LFDI -3.3424 (0.0002)** -2.2842 (0.4077)
LGDP -2.3370 (0.0520)** -1.4042 (0.9393)
LINF -2.3521 (0.0489)** -1.9788 (0.6500)
LOPEN -2.7245 (0.0087)** -2.0179 (0.6202)
LREER -2.6229 (0.0146)** -2.8352 (0.0992)**
LTLF -1.1463 (0.7540) -1.9846 (0.6398)
Notes: IPS indicated the Im et al. (2003) panel unit root and stationary tests. The IPS examines the null
hypothesis of non-stationary of variables. The parenthesized values are the probability of rejection.
Asterisks (**) indicates statistically significant at 10 percent level. All the variables are in logarithm
form.
Table 1 and Table 2 tabulated the results of the LLC and IPS tests. Based on the
results, it summarized that the series of these variables in LLC test are of an I(1) process.
While for the IPS test, only minority series of these variables are of an I(1) process.
However, overall, this balanced data is stationary in their first difference. The panel unit
root tests provide strong evidence in support that there are five series (except total labor
force) which do not have a unit root and those variables are integrated of order one.
According to Levin et al. (2002) and Im et al. (2003), the null hypothesis for both
approaches are the same, which is a unit root exists. Based on the theory, all variables
should be stationary, where there is no unit root existence. When the variables are
stationary, the test can proceed to cointegration test. In LLC and IPS tests, majority of the
variables are greater than the significant level of 10 percent in level form, I(0) of both
individual intercept and trend, which means that variables are non-stationary and a unit
root exists. Therefore, we proceed to first difference, I(1). In first difference, for LLC test,
almost all variables are smaller than significant level, hence the null hypothesis of a unit
root exists is rejected. Therefore, we can conclude that all variables are stationary in I(1),
which a unit root does not exist in LLC test. On the other hand, for IPS test, in first
difference, I(1) only minority variables are smaller than significant level, where the null
hypothesis of a unit root exists is rejected. In conclude, almost all variables have no unit
roots and are integrated of order one.
Panel Cointegration Tests
The availability and interest in a wide range of panel data has led to the expansion
of various statistical tests to panel data seriously. There are plenty of literatures that central
on the issues related to examine the cointegration in a panel setting. The most used tests are
Pedroni (1999, 2004), Kao (1999), and a Fisher-type test using an underlying Johansen
Thailand and The World Economy | Vol. 38, No.1, January - April 2020 | 65
methodology (Maddala & Wu, 1999). As overall, Pedroni (1999, 2001, 2004) and Kao
(1999) panel cointegration test. There are two sets of tests recommended in Pedroni (1999,
2001, 2004), which are within dimension approach and between dimension approach. In
within dimension approach, there are four types of test statistics, v-statictics, rho-statistics,
PP-statistics, and ADF-statistics. These statistics are basically for different country from
pooled regression on coefficients unit root test estimation residuals. Besides, common time
factors and heterogeneity across country are considered too. Whereas, for between
dimension approach, it included group rho-statistics, PP-statistics, and ADF-statistics.
These statistics are based on the average of individual autoregressive coefficients
associated with the unit root tests of the residuals for each country in the panel.
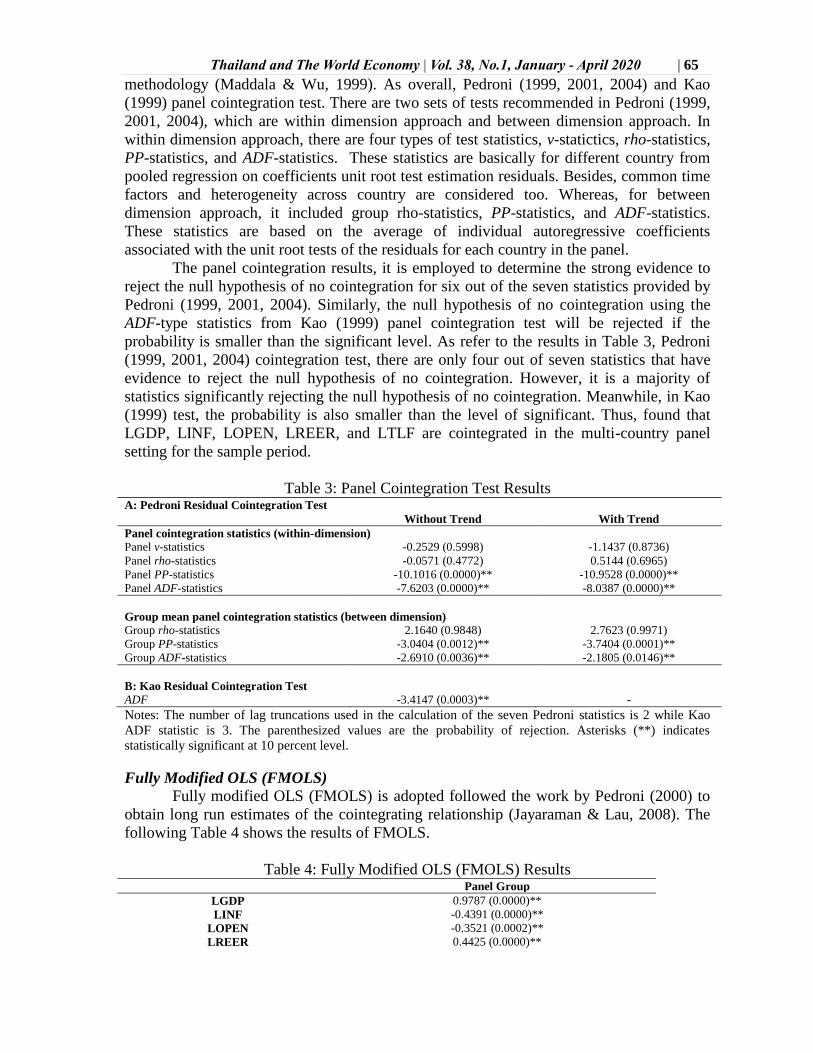
The panel cointegration results, it is employed to determine the strong evidence to
reject the null hypothesis of no cointegration for six out of the seven statistics provided by
Pedroni (1999, 2001, 2004). Similarly, the null hypothesis of no cointegration using the
ADF-type statistics from Kao (1999) panel cointegration test will be rejected if the
probability is smaller than the significant level. As refer to the results in Table 3, Pedroni
(1999, 2001, 2004) cointegration test, there are only four out of seven statistics that have
evidence to reject the null hypothesis of no cointegration. However, it is a majority of
statistics significantly rejecting the null hypothesis of no cointegration. Meanwhile, in Kao
(1999) test, the probability is also smaller than the level of significant. Thus, found that
LGDP, LINF, LOPEN, LREER, and LTLF are cointegrated in the multi-country panel
setting for the sample period.
Table 3: Panel Cointegration Test Results A: Pedroni Residual Cointegration Test
Without Trend With Trend
Panel cointegration statistics (within-dimension)
Panel v-statistics -0.2529 (0.5998) -1.1437 (0.8736)
Panel rho-statistics -0.0571 (0.4772) 0.5144 (0.6965)
Panel PP-statistics -10.1016 (0.0000)** -10.9528 (0.0000)**
Panel ADF-statistics -7.6203 (0.0000)** -8.0387 (0.0000)**
Group mean panel cointegration statistics (between dimension)
Group rho-statistics 2.1640 (0.9848) 2.7623 (0.9971)
Group PP-statistics -3.0404 (0.0012)** -3.7404 (0.0001)**
Group ADF-statistics -2.6910 (0.0036)** -2.1805 (0.0146)**
B: Kao Residual Cointegration Test
ADF -3.4147 (0.0003)** -
Notes: The number of lag truncations used in the calculation of the seven Pedroni statistics is 2 while Kao
ADF statistic is 3. The parenthesized values are the probability of rejection. Asterisks (**) indicates
statistically significant at 10 percent level.
Fully Modified OLS (FMOLS)
Fully modified OLS (FMOLS) is adopted followed the work by Pedroni (2000) to
obtain long run estimates of the cointegrating relationship (Jayaraman & Lau, 2008). The
following Table 4 shows the results of FMOLS.
Table 4: Fully Modified OLS (FMOLS) Results Panel Group
LGDP 0.9787 (0.0000)**
LINF -0.4391 (0.0000)**
LOPEN -0.3521 (0.0002)**
LREER 0.4425 (0.0000)**
Thailand and The World Economy | Vol. 38, No.1, January - April 2020 | 66
LTLF 3.7377 (0.0000)**
Notes: The values in parentheses are t-statistics. Asterisk (**) shows significance at 10 percent level.
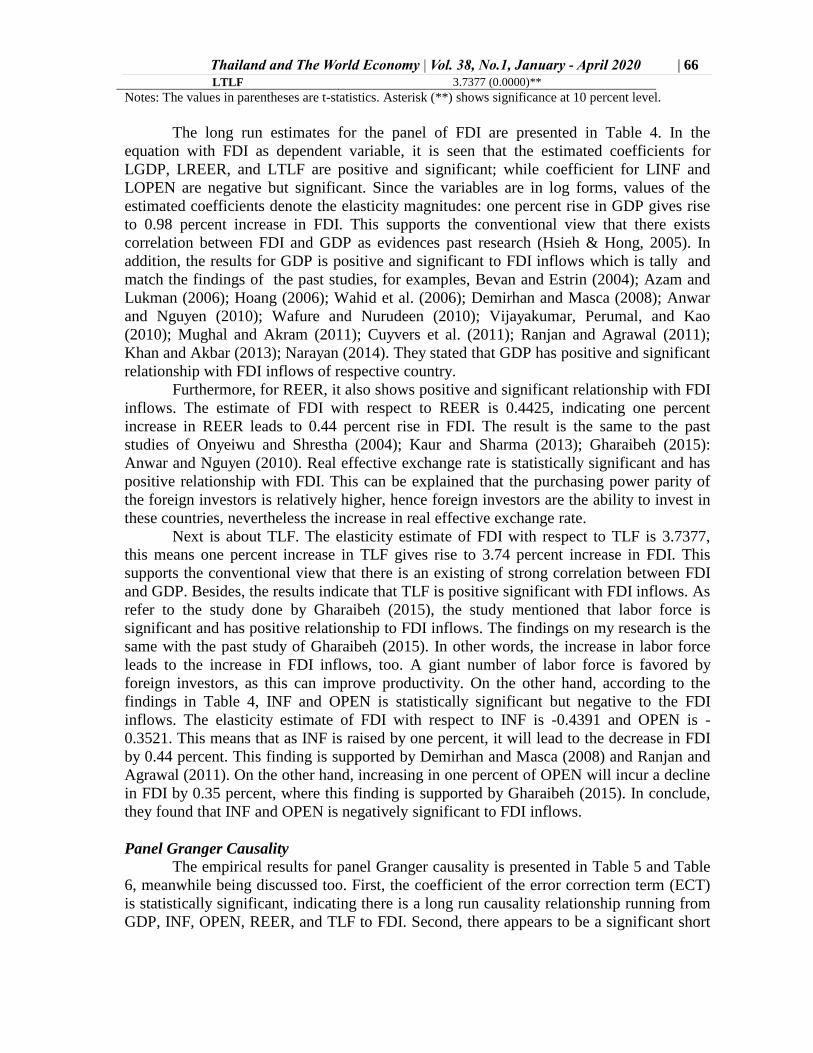
The long run estimates for the panel of FDI are presented in Table 4. In the
equation with FDI as dependent variable, it is seen that the estimated coefficients for
LGDP, LREER, and LTLF are positive and significant; while coefficient for LINF and
LOPEN are negative but significant. Since the variables are in log forms, values of the
estimated coefficients denote the elasticity magnitudes: one percent rise in GDP gives rise
to 0.98 percent increase in FDI. This supports the conventional view that there exists
correlation between FDI and GDP as evidences past research (Hsieh & Hong, 2005). In
addition, the results for GDP is positive and significant to FDI inflows which is tally and
match the findings of the past studies, for examples, Bevan and Estrin (2004); Azam and
Lukman (2006); Hoang (2006); Wahid et al. (2006); Demirhan and Masca (2008); Anwar
and Nguyen (2010); Wafure and Nurudeen (2010); Vijayakumar, Perumal, and Kao
(2010); Mughal and Akram (2011); Cuyvers et al. (2011); Ranjan and Agrawal (2011);
Khan and Akbar (2013); Narayan (2014). They stated that GDP has positive and significant
relationship with FDI inflows of respective country.
Furthermore, for REER, it also shows positive and significant relationship with FDI
inflows. The estimate of FDI with respect to REER is 0.4425, indicating one percent
increase in REER leads to 0.44 percent rise in FDI. The result is the same to the past
studies of Onyeiwu and Shrestha (2004); Kaur and Sharma (2013); Gharaibeh (2015):
Anwar and Nguyen (2010). Real effective exchange rate is statistically significant and has
positive relationship with FDI. This can be explained that the purchasing power parity of
the foreign investors is relatively higher, hence foreign investors are the ability to invest in
these countries, nevertheless the increase in real effective exchange rate.
Next is about TLF. The elasticity estimate of FDI with respect to TLF is 3.7377,
this means one percent increase in TLF gives rise to 3.74 percent increase in FDI. This
supports the conventional view that there is an existing of strong correlation between FDI
and GDP. Besides, the results indicate that TLF is positive significant with FDI inflows. As
refer to the study done by Gharaibeh (2015), the study mentioned that labor force is
significant and has positive relationship to FDI inflows. The findings on my research is the
same with the past study of Gharaibeh (2015). In other words, the increase in labor force
leads to the increase in FDI inflows, too. A giant number of labor force is favored by
foreign investors, as this can improve productivity. On the other hand, according to the
findings in Table 4, INF and OPEN is statistically significant but negative to the FDI
inflows. The elasticity estimate of FDI with respect to INF is -0.4391 and OPEN is -
0.3521. This means that as INF is raised by one percent, it will lead to the decrease in FDI
by 0.44 percent. This finding is supported by Demirhan and Masca (2008) and Ranjan and
Agrawal (2011). On the other hand, increasing in one percent of OPEN will incur a decline
in FDI by 0.35 percent, where this finding is supported by Gharaibeh (2015). In conclude,
they found that INF and OPEN is negatively significant to FDI inflows.
Panel Granger Causality
The empirical results for panel Granger causality is presented in Table 5 and Table
6, meanwhile being discussed too. First, the coefficient of the error correction term (ECT)
is statistically significant, indicating there is a long run causality relationship running from
GDP, INF, OPEN, REER, and TLF to FDI. Second, there appears to be a significant short
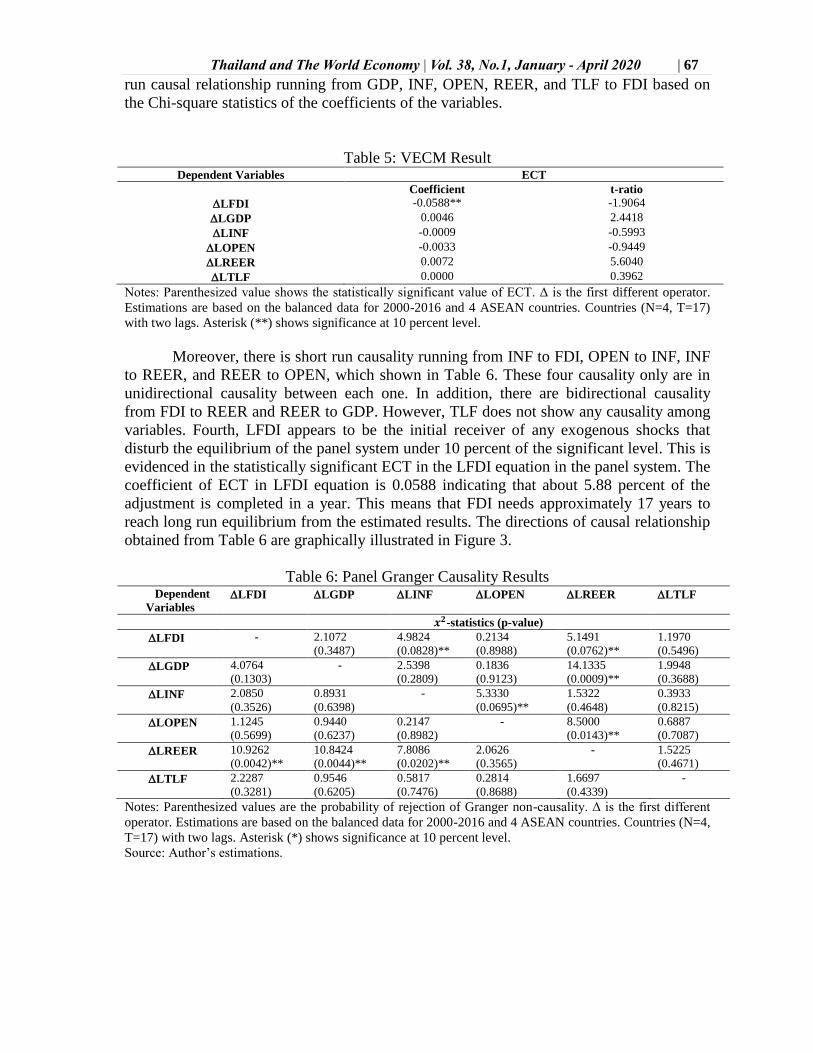
Thailand and The World Economy | Vol. 38, No.1, January - April 2020 | 67
run causal relationship running from GDP, INF, OPEN, REER, and TLF to FDI based on
the Chi-square statistics of the coefficients of the variables.
Table 5: VECM Result Dependent Variables ECT
Coefficient t-ratio
LFDI -0.0588** -1.9064
LGDP 0.0046 2.4418
LINF -0.0009 -0.5993
LOPEN -0.0033 -0.9449
LREER 0.0072 5.6040
LTLF 0.0000 0.3962
Notes: Parenthesized value shows the statistically significant value of ECT. Δ is the first different operator.
Estimations are based on the balanced data for 2000-2016 and 4 ASEAN countries. Countries (N=4, T=17)
with two lags. Asterisk (**) shows significance at 10 percent level.
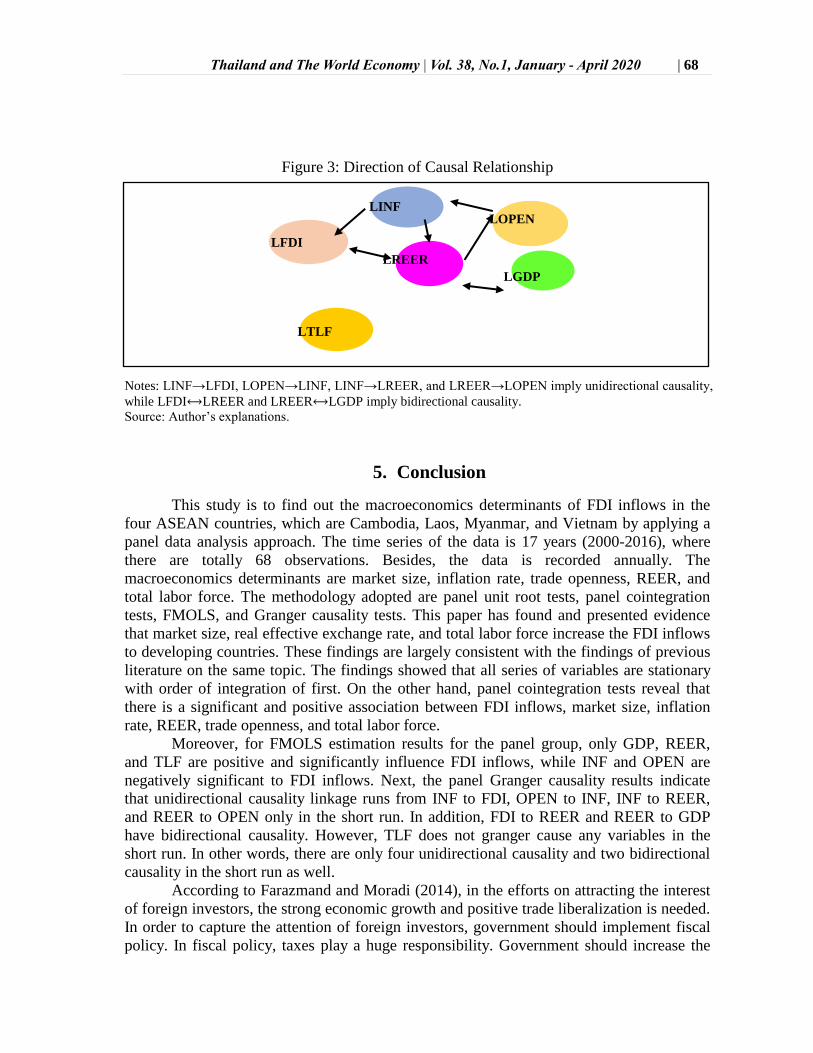
Moreover, there is short run causality running from INF to FDI, OPEN to INF, INF
to REER, and REER to OPEN, which shown in Table 6. These four causality only are in
unidirectional causality between each one. In addition, there are bidirectional causality
from FDI to REER and REER to GDP. However, TLF does not show any causality among
variables. Fourth, LFDI appears to be the initial receiver of any exogenous shocks that
disturb the equilibrium of the panel system under 10 percent of the significant level. This is
evidenced in the statistically significant ECT in the LFDI equation in the panel system. The
coefficient of ECT in LFDI equation is 0.0588 indicating that about 5.88 percent of the
adjustment is completed in a year. This means that FDI needs approximately 17 years to
reach long run equilibrium from the estimated results. The directions of causal relationship
obtained from Table 6 are graphically illustrated in Figure 3.
Table 6: Panel Granger Causality Results Dependent
Variables LFDI LGDP LINF LOPEN LREER LTLF
-statistics (p-value)
LFDI - 2.1072
(0.3487)
4.9824
(0.0828)**
0.2134
(0.8988)
5.1491
(0.0762)**
1.1970
(0.5496)
LGDP 4.0764
(0.1303)
- 2.5398
(0.2809)
0.1836
(0.9123)
14.1335
(0.0009)**
1.9948
(0.3688)
LINF 2.0850
(0.3526)
0.8931
(0.6398)
- 5.3330
(0.0695)**
1.5322
(0.4648)
0.3933
(0.8215)
LOPEN 1.1245
(0.5699)
0.9440
(0.6237)
0.2147
(0.8982)
- 8.5000
(0.0143)**
0.6887
(0.7087)
LREER 10.9262
(0.0042)**
10.8424
(0.0044)**
7.8086
(0.0202)**
2.0626
(0.3565)
- 1.5225
(0.4671)
LTLF 2.2287
(0.3281)
0.9546
(0.6205)
0.5817
(0.7476)
0.2814
(0.8688)
1.6697
(0.4339)
-
Notes: Parenthesized values are the probability of rejection of Granger non-causality. Δ is the first different
operator. Estimations are based on the balanced data for 2000-2016 and 4 ASEAN countries. Countries (N=4,
T=17) with two lags. Asterisk (*) shows significance at 10 percent level.
Source: Author’s estimations.
Thailand and The World Economy | Vol. 38, No.1, January - April 2020 | 68
Figure 3: Direction of Causal Relationship
Notes: LINF→LFDI, LOPEN→LINF, LINF→LREER, and LREER→LOPEN imply unidirectional causality,
while LFDI⟷LREER and LREER⟷LGDP imply bidirectional causality.
Source: Author’s explanations.
5. Conclusion
This study is to find out the macroeconomics determinants of FDI inflows in the
four ASEAN countries, which are Cambodia, Laos, Myanmar, and Vietnam by applying a
panel data analysis approach. The time series of the data is 17 years (2000-2016), where
there are totally 68 observations. Besides, the data is recorded annually. The
macroeconomics determinants are market size, inflation rate, trade openness, REER, and
total labor force. The methodology adopted are panel unit root tests, panel cointegration
tests, FMOLS, and Granger causality tests. This paper has found and presented evidence
that market size, real effective exchange rate, and total labor force increase the FDI inflows
to developing countries. These findings are largely consistent with the findings of previous
literature on the same topic. The findings showed that all series of variables are stationary
with order of integration of first. On the other hand, panel cointegration tests reveal that
there is a significant and positive association between FDI inflows, market size, inflation
rate, REER, trade openness, and total labor force.
Moreover, for FMOLS estimation results for the panel group, only GDP, REER,
and TLF are positive and significantly influence FDI inflows, while INF and OPEN are
negatively significant to FDI inflows. Next, the panel Granger causality results indicate
that unidirectional causality linkage runs from INF to FDI, OPEN to INF, INF to REER,
and REER to OPEN only in the short run. In addition, FDI to REER and REER to GDP
have bidirectional causality. However, TLF does not granger cause any variables in the
short run. In other words, there are only four unidirectional causality and two bidirectional
causality in the short run as well.
According to Farazmand and Moradi (2014), in the efforts on attracting the interest
of foreign investors, the strong economic growth and positive trade liberalization is needed. In order to capture the attention of foreign investors, government should implement fiscal
policy. In fiscal policy, taxes play a huge responsibility. Government should increase the
LFDI
LINF LOPEN
LGDP
LREER
LTLF
Thailand and The World Economy | Vol. 38, No.1, January - April 2020 | 69
spending, and hence reduce the taxes. Foreign investors favor countries with low tariffs, as
this can help them earn more money. The government can sign contracts with the
neighboring countries to have zero taxes if their investors invest in the host country.
Furthermore, one country should join more global organizations, for example TPP,
to gain benefits from that. As an example, investors can freely move in the countries to
invest without any extra charges or taxes. This is one of the benefits. Along with these
efforts, the FDI inflows will experience huge increase and hence the economy will grew
faster too. As an example, Vietnam joins WTO in 2007, where in that year, Vietnam gains
a bombastic expand in the FDI inflows. Moreover, this can help improve the openness of a
country. For Cambodia, Laos, and Myanmar, they are less open on trade as compare to
Vietnam. Hence, the FDI inflows of those three countries are still in a starting pace.
Government should open up their markets globally. Joining global organization is one of
the best choice.
Acknowledgement
Financial support from UNIMAS F01/SpMYRA/1687/2018 is gratefully
acknowledged. All remaining flaws are the responsibility of the authors.
Thailand and The World Economy | Vol. 38, No.1, January - April 2020 | 70
References
Ang, J. B. (2008). Determinants of foreign direct investment in Malaysia. Journal of policy
modeling, 30, 185-189.
Anwar, S., & Nguyen, L. P. (2010). Foreign direct investment and economic growth in
Vietnam. Asia Pacific Business Review, 16(1-2), 183-202.
Azam, M. & Lukman, L. (2006). Determinants of foreign direct investment in India,
Indonesia and Pakistan: A quantitative approach. Journal of Managerial Sciences,
4(1), 31-44.
Bevan, A. A., & Estrin, S. (2004). The determinants of foreign direct investment into
European transition economies. Journal of Comparative Economics, 32(4), 775-787.
Bhatnagar, D., Rathore, A., Moreno, M., & Kanungo, P. (2003). Nike in Vietnam: The Tae
Kwang Vina Factory. working paper, Washington, DC: The World Bank.
Biswas, R. (2002). Determinants of foreign direct investment. Review of Development
Economics, 6(3), 492–504.
Breitung, J. (2000). The local power of some unit root tests for panel data. Advances in
econometrics, Vol. 15: Nonstationary panels, panel cointegration, and dynamic
panels (pp. 161-178). Amsterdam, Netherlands: JAI Press.
Cheng, L. K., & Kwan, Y. K. (1999). What are the determinants of the location of foreign
direct investment? The Chinese experience. (Unpublished master’s thesis). Hong
Kong University of Science and Technology, Clear Water Bay, Hong Kong.
Cuyvers, L., Soeng, R., Plasmans, J., & Bulcke, D. V. D. (2011). Determinants of foreign
direct investment in Cambodia. Journal of Asian Economics, 22, 222-234.
Demirhan, E., & Masca, M. (2008). Determinants of foreign direct investment flows to
developing countries: A cross-sectional analysis. Prague Economic Papers, 4, 356-
369.
Farazmand, H., & Moradi, M. (2014). Determinants of FDI: Does democracy matter?.
Journal of Business Systems, Governance and Ethnics, 9(2), 40-50.
Gharaibeh, A. M. O. (2015). The determinants of foreign direct investment – Empirical
evidence from Bahrain. International Journal of Business and Social Science, 6(8),
94-106.
Hoang, T. T. (2006). Determinants of foreign direct investment in Vietnam. Retrieved from
http://citeseerx.ist.psu.edu/viewdoc/download?doi=10.1.1.535.747&rep=rep1&type
Holtz-Eakin. D., Newey. W., & Rosen, H. (1989). The revenues-expenditure nexus:
Evidence from local government data, International Economic Review, 30, 415-429.
Holtz-Eakin. D., Newey. W., & Rosen. H. (1988). Estimating vector autoregressions with
panel data, Econometrica, 56, 1371 – 1395.
Hsieh, W. J., & Hong, M. C. (2005). The determinants of foreign direct investment in
Southeast Asian transition economies. National Cheng Kung University.
Hussain, F., & Kimuli, C. K. (2012). Determinants of foreign direct investment flows to
developing countries. SBP Research Bulletin, 8(1), 13-31.
Im, K.S., Pesaran, M.H., & Shin, Y. (2003). Testing for unit roots in heterogeneous panels.
Journal of Econometircs, 115, 53-74.
Thailand and The World Economy | Vol. 38, No.1, January - April 2020 | 71
Im, K.S., Pesaran, M.H., and Shin, Y. (1997). Testing for unit roots in heterogenous panel.
DAE, working paper No.9526, University of Cambridge.
Jaumotte, F. (2004). Foreign direct investment and regional trade agreements: The market
size effect revisited. IMF working paper No. WP/04/206. International Monetary
Fund.
Jayaraman, T. K., & Lau, E. (2008). Causal relationships between current account
imbalances and budget deficits in Pacific Island countries: A panel cointegration
survey. School of Economics, University of the South Pacific. Fiji Islands.
Kao, C. (1999). Spurious regression and residual-based tests for cointegration in panel data.
Journal of Econometrics, 90, 1-44.
Kaur, M., & Sharma, R. (2013). Determinants of foreign direct investment in India: An
empirical analysis. Decision, 40(1-2), 57-67.
Khan, M. M., & Akbar, M. I. (2013). The Impact of Political Risk on Foreign Direct
Investment. Retrieved from http://mpra.ub.uni-muenchen.de/47283/
Levin, A. and Lin, C.F. (1993). Unit root test in panel data: New results. University of
California at San Diego, Discussion Paper, 93-56.
Levin, A., Lin, C.F., and Chu, C.S.J. (2002). Unit root test in panel data: Asymptotic and
finite sample properties, Journal of Econometrics, 108, 1-24.
Maddala, G.S. and Wu, S. (1999). A comparative study of unit root tests with panel data
and a new simple test. Oxford Bulletin of Economics and Statistics, special issue,
631- 652.
Mascot workwear. (2014). Mascot opens new workwear factory in Laos. Retrieved from
https://jclao.com/mascot-opens-new-workwear-factory-laos/
Mughal, M. M., & Akram, M. (2011). Does market size affect FDI? The case of Pakistan.
Interdisciplinary Journal of Contemporary Research in Business, 2(9), 237-247.
Narayan, L. (2014). Determinants of foreign direct investment in India. International
Journal of Research, 1(7), 815-823.
Onyeiwu, S., & Shrestha, H. (2004). Determinants of foreign direct investment in Africa.
Journal of Developing Societies, 20(1-2), 89-106.
Pedroni, P. (1999). Critical values for cointegration tests in heterogeneous panels with
multiple regressors. Oxford Bulletin of Economics and Statistics, 61, 653-670.
Pedroni, P. (2000). Fully modified OLS for heterogeneous cointegrated panels. Advances
in Econometrics, 15(JAI), 93-130.
Pedroni, P. (2001). Panel cointegration; Asymptotic and finite sample properties of pooled
time series tests, with an application to the PPP hypothesis. Econometric Theory,
20()
Pedroni, P. (2001). Purchasing power parity tests in cointegrated panels. Review of
Economics and Statistics, 83(4), 727 – 731.
Pedroni, P. (2004). Panel cointegration: Asymptotic and finite sample properties of pooled
time series tests with an application to the PPP hypothesis. Econometric Theory,
20(3), 597–625.
Phillips, P. C. B. (1995). Fully modified least squares and vector autoregression.
Econometrica, 63(5), 1023-1078.
Phillips, P. C. B., & Hansen, B. E. (1990). Statistical inference in instrumental variables
regression with I(1) processes. Review of Economic Studies, 57(1), 99-125.
Ranjan, V., & Agrawal, G. (2011). FDI inflow determinants in BRIC countries: A panel
data analysis. International Business Research, 4(4), 255-263.
Thailand and The World Economy | Vol. 38, No.1, January - April 2020 | 72
Sharma, K., & Bandara, Y. (2010). Trends, patterns and determinants of Australian foreign
direct investment. Journal of Economic Issues, 44(3), 661-676.
Stangler, C. (2015). In Myanmar, garment factories that source popular brand-name
clothing retailers aim to defeat a 40-cent hourly minimum wage. Retrieved from
http://www.ibtimes.com/myanmar-garment-factories-source-popular-brand-name-
clothing-retailers-aim-defeat-40-2010505
UNCTAD. (2017).
Vijayakumar, N., Perumal, S., & Rao, K. C. S. (2010). Determinants of FDI in BRICS
countries: A panel analysis. Int. Journal of Business Science and Applied
Management, 5(3), 1-13.
Wafure, O. G., & Nurudeen, A. (2010). Determinants of foreign direct investment in
Nigeria: An empirical analysis. Global Journal of Human Social Science, 10(1), 26-
34.
Wahid, A. N. M., Sawkut, R., & Seetanah, R. (2006). Determinants of foreign direct
investment (FDI): Lessons from the African economies. Journal of Applied
Business and Economics, 9(1), 70-80.
World Development Indicators, World Bank. (2019).