machine learning based wearable multi-channel
TRANSCRIPT
HAL Id: tel-03543121https://tel.archives-ouvertes.fr/tel-03543121
Submitted on 25 Jan 2022
HAL is a multi-disciplinary open accessarchive for the deposit and dissemination of sci-entific research documents, whether they are pub-lished or not. The documents may come fromteaching and research institutions in France orabroad, or from public or private research centers.
L’archive ouverte pluridisciplinaire HAL, estdestinée au dépôt et à la diffusion de documentsscientifiques de niveau recherche, publiés ou non,émanant des établissements d’enseignement et derecherche français ou étrangers, des laboratoirespublics ou privés.
Machine learning based wearable multi-channelelectromyography : application to bionics and biometrics
Sherif Mohamed Said
To cite this version:Sherif Mohamed Said. Machine learning based wearable multi-channel electromyography : appli-cation to bionics and biometrics. Bioengineering. Université Paris-Est, 2020. English. �NNT :2020PESC0086�. �tel-03543121�

THÈSE de DOCTORAT
Présentée par
Sherif Mohamed Roshdy SAID
Pour l’obtention du
GRADE DE DOCTEUR
De
L'Université Paris-Est Créteil
Ecole Doctorale MATHÉMATIQUES ET STIC (ED 532)
Spécialité de doctorat : Signal, Image, Automatique
Machine Learning-based Wearable Multi-channel
Electromyography: Application to Bionics and Biometrics
Apprentissage Machine d’un Modèle d’électromyographie de
Surface: Application en Bionique et en Biométrie
Le 15 Décembre 2020, devant le jury composé de
Prof. Mouloud ADEL Aix-Marseille Université Rapporteur
Prof. Régine Le Bouquin JEANNES Université de Rennes 1 Rapporteur
Prof. Patrick SIARRY Université Paris-Est Créteil Examinateur
Ass. Prof. Samer ALKORK American Univ. of the Middle East (Koweit) Examinateur/ Co-encadrant
Prof. Amine NAIT-ALI Université Paris-Est Créteil Directeur

2
Abstract Over the last few decades, wearable technologies have several bioengineering applications. In this
thesis, a Multi-channel surface electromyography (sEMG) wearable armband has been used: (1) to
control a 3D bionic arm, and we have designed (2) for an access control system in biometrics. The
first application is related to bionics, whereas the second application is related to the security field.
Regarding our first contribution, 920 EMG signals have been collected from 23 volunteer
subjects where the purpose was to train an EMG based gesture recognition model. The bionic
control approach has been validated and optimized for a right arm amputee. In terms of processing,
numerous Machine-Learning classifiers have been applied. It has been found that the Support
Vector Machine classifier exhibit 90.5% success rate.
On the other hand, in the second contribution, we explored new experiments where the
application consists of using EMG signals for both verification and identification purposes. More
specifically, each subject is asked to perform a sequence of specific hand gestures. Each hand
gesture allows the generation of one character of a global signature (i.e., password). Therefore,
when considering verification mode, features are extracted from the EMG signals in both frequency
and time domains. Three classifiers have been used, namely: K-nearest Neighbors (KNN), Linear
Discernment Analysis (LDA), and Ensemble of Classifiers. Results show that the KNN classifier
allows performance of 97.4%. While in the user’s identification system, three previous classifiers
have been considered as well. Experiments show that best performance (accuracy is 86.01%) have
been obtained using KNN.
In this thesis, the Deep-learning approach has been considered by achieving what is known as
“Data augmentation”. Therefore, Convolutional Neural Network (CNN) is used to train the model
from EMG scalograms. When considering verification mode, performances of 98.31% has been
reached. On the other hand, in the identification case, two CNN structures have been evaluated,
namely squeeze-net structure and Alex-net structure. Results show that squeeze-net allows a
promising performance of 81.84%.
Keywords
Wearable technologies, Bionic arm, Gestures recognition, Biometrics, Identification, Verification,
sEMG signal, Features Extraction, CNN
3
Résumé Les technologies portables ont été largement utilisées au cours des dernières décennies dans les
applications de bio-ingénierie. Dans le cadre de nos travaux de thèse, un bracelet portable
permettant l’acquisition sans fils de signaux d’électromyogramme de surface (sEMG) a été utilisé
dans une étude de recherche, afin de : (1) contrôler une prothèse bionique que nous avons nous-
même conçue, (2) contrôler, entre autres, les accès aux ressources par vérification biométrique. La
première contribution est liée au domaine de la santé, alors que la deuxième contribution relève de
l’aspect sécuritaire.
Dans le contexte de l’application bionique, nos expérimentations nous ont menés à collecter chez
23 sujets sains, des signaux sEMG (920 au total) servant à entraîner un modèle de reconnaissance
de gestes que l’on a validé sur un sujet présentant un handicap (bras amputé). En termes de
traitement de données, de nombreux classifieurs d'apprentissage automatique ont été évalués.
Ainsi, le classifieur de machine à vecteur de support (SVM) s'est avéré prometteur au regard du
taux de classification atteint (90,5%).
Par ailleurs, dans la deuxième contribution, nous avons étudié la possibilité d’utiliser les signaux
sEMG multicanaux (collectés par bracelet EMG sans fils) comme modalité biométrique pour la
vérification et l’identification des individus. Dans ce contexte, nous avons construit une base de
données de signaux sEMG multicanaux (8960 au total) en impliquant 56 sujets volontaires. Chaque
sujet effectue une combinaison spécifique de gestes de la main générant ainsi des signaux EMG
dont le code permet de former un mot de passe. Lorsque l’on considère la vérification des
utilisateurs, des signatures sont extraites, à la fois du domaine fréquentiel et du domaine temporel.
Ainsi, dans nos travaux, trois classifieurs ont été considérés, à savoir : K-plus proches voisins
(KNN), analyse de discernement linéaire (LDA) et méthodes ensemblistes. Les résultats montrent
que le KNN présente une précision de 97,4%.
Quant à l’identification biométrique, trois classifieurs sont également utilisés pour classer les
données : KNN, LDA et méthodes ensemblistes. Le meilleur résultat en termes de performance
moyenne atteint 86,01% pour KNN.
Dans la dernière partie de cette thèse, nous avons considéré des approches d’apprentissage
profond en procédant à l'augmentation des données. Ainsi, les Réseaux de Neurones Convolutifs
(CNN) sont entraînés à partir de scalogrammes d’EMG, conduisant ainsi, en mode vérification à
une performance de 98,3%. Enfin, en mode identification, deux architectures CNN ont été
appliquées (squeeze-net et structure Alex-net). Les résultats nous ont permis d’atteindre 81,84%
avec (squeeze-net).
Mots clés
Technologies portables, Bras Bionique, Reconnaissance des gestes, Identification, Vérification,
Biométrique, Signal sEMG, CNN, Classification.
4
Publications
Journal publications
• Said, S., Boulkaibet, I., Sheikh, M., Karar, A. S., Alkork, S., & Nait-ali, A. (2020).
Machine-Learning-Based Muscle Control of a 3D-Printed Bionic Arm. Sensors,
20(11), 3144.
• Said, S.; Karar, A.S.; Beyrouthy, T.; Alkork, S.; Nait-ali, A. (2020). Biometrics
Verification Modality Using Multi-Channel sEMG Wearable Bracelet. Applied
Sciences, 10, 6960.
International Conferences
• Said, S., Sheikh, M., Al-Rashidi, F., Lakys, Y., Beyrouthy, T., & Nait-ali, A. (2019,
April). A Customizable Wearable Robust 3D Printed Bionic Arm: Muscle Controlled.
In 2019 3rd International Conference on Bio-engineering for Smart Technologies
(BioSMART) (pp. 1-6). IEEE.
Book Chapters
• Said, S., Al Kork, S., & Nait-Ali, A. (2019). Wearable Technologies in Biomedical and
Biometric Applications. In Biometrics under Biomedical Considerations (pp. 211-
227). Springer, Singapore.
• Brahim, I., Dhibou, I., Makni, L., Said, S., & Nait-ali, A. (2020). Wearable Multi-
channel EMG Biometrics: Concepts. In Hidden Biometrics (pp. 91-100). Springer,
Singapore.
Awards
• Best Entrepreneurial-ship Project in RoboRave 2019 Competition, USA.

5
ACKNOWLEDGEMENT
My Supervisor: I would like to express my sincere gratitude to my supervisor Prof. Amine
NAIT-ALI, who has guided and taught me a lot throughout the journey of studying for the
Ph.D., which allowed me to learn and acquire the spirit of scientific research and much more.
Lab Director: I would like to thank Prof. Yacine AMIRAT, the director of LISSI Lab, for all
the support he offered to me during the Doctorate study period.
Defense Committee: I would like to thank all jury members for offering valuable time to
review my thesis and examine my defense. Many thanks to them for their helpful comments,
questions, and insightful remarks.
My Parents: I would like to designate the entire fruitful outcome of this work to my father,
who has been waiting for so long to see the result of his son’s work, to my mother, who hasn’t
stopped praying for this work to be done.
My Family: I would like to thank my wife, who has stood by me through all my travels, my
absences, and my fits of pique. She supported the family during much of my graduate studies.
Along with her, I want to acknowledge my daughter, Jomana, and my son Mohamed ; they are
the source of love and joyful time always spent with them.
My thankfulness and appreciation to my extended family, particularly brother and sister, for
their support, encouragement, patience and praying for me during the time of my study.
My Colleagues: Nevertheless, I cannot forget the support of my colleagues especially Dr.
Samer AlKORK, Dr. Abdullah KARAR, and Mr. Murtaza SHEIKH, who always
supported me as brothers. They worked with me a lot, supported me, and encouraged me to
work hard. Thanks to anyone who has ever supported me even with a word during this journey,
which contains many values and lessons to learn.
6
Contents 1 Chapter 1 Generalities about Wearable Technology systems ................................... 23
1.1 Introduction ............................................................................................................... 24
1.2 Wearable systems on the market ............................................................................... 25
1.2.1 BITalino Kit ....................................................................................................... 25
1.2.2 MySignals Kit .................................................................................................... 26
1.2.3 Myo Armband .................................................................................................... 27
1.3 EMG Signal ............................................................................................................... 28
1.4 Wearable Technologies in Bionic arm ...................................................................... 29
1.5 Wearable Technologies in Biometrics ...................................................................... 30
1.6 Conclusion ................................................................................................................. 33
2 Chapter 2 State of the Art on sEMG Control Systems............................................... 34
2.1 Introduction ............................................................................................................... 35
2.2 State of the Art on EMG Gesture Recognition System and Bionic Arm .................. 35
2.2.1 Review of EMG Gesture Recognition System .................................................. 35
2.2.2 Review of 3D printed Bionic Arm ..................................................................... 41
2.3 State of the Art of EMG biometrics system .............................................................. 44
2.4 Conclusion ................................................................................................................. 47
3 Chapter 3 Design and Implementation of a 3-D Printed Bionic Arm Controlled by
Machine Learning Based Algorithm .................................................................................... 49
3.1 Introduction ............................................................................................................... 51
3.2 Bionic Arm ................................................................................................................ 52
3.2.1 Methodology ...................................................................................................... 52
3.2.2 Acquisition of sEMG signal............................................................................... 53
3.2.3 Bionic Arm Mechanical Design ......................................................................... 54
3.2.4 Electronics and Control...................................................................................... 59
7
3.3 Feature Extraction and Classification ....................................................................... 61
3.3.1 Data Collection Protocol .................................................................................... 61
3.3.2 Data Processing .................................................................................................. 62
3.3.3 Features Extraction ............................................................................................ 63
3.3.4 Classification...................................................................................................... 64
3.4 Results ....................................................................................................................... 66
3.5 Real-time Implementation ......................................................................................... 68
3.6 Conclusion ................................................................................................................. 70
4 Chapter 4 EMG based Biometrics Modality for Users Verification ......................... 71
4.1 Introduction ............................................................................................................... 72
4.2 Database Collection Protocol .................................................................................... 73
4.3 Features Extraction for sEMG Users Verification .................................................... 76
4.4 Machine Learning Models ........................................................................................ 79
4.5 Results ....................................................................................................................... 81
4.6 Conclusion ................................................................................................................. 86
5 Chapter 5 sEMG Machine-learning based Biometrics Modality for Users
Identification .......................................................................................................................... 88
5.1 Introduction ............................................................................................................... 89
5.2 Features Extraction .................................................................................................... 91
5.3 Machine Learning Models ........................................................................................ 93
5.4 Results ....................................................................................................................... 94
5.5 Conclusion ................................................................................................................. 97
6 Chapter 6 Deep Learning for sEMG Biometrics System ........................................... 98
6.1 Introduction ............................................................................................................. 100
6.2 Deep Learning for Biometrics Users Verification System...................................... 103
6.2.1 Input Generation .............................................................................................. 103
6.2.2 Continuous Wavelet Transform (CWT) .......................................................... 104
8
6.2.3 Data Augmentation .......................................................................................... 106
6.2.4 Convolutional Neural Network Structure and Training................................... 106
6.2.5 Testing and Results .......................................................................................... 109
6.3 Deep Learning for Biometrics Users Identification System ................................... 112
6.3.1 Input Generation .............................................................................................. 113
6.3.2 Wavelet-Based Denoising ................................................................................ 114
6.3.3 Data Augmentation .......................................................................................... 115
6.3.4 CNN Architecture and Training ....................................................................... 115
6.3.5 Testing and Results .......................................................................................... 116
6.4 Conclusion ............................................................................................................... 117
7 Chapter 7 Conclusion & Perspectives ........................................................................ 118
8 Bibliography ................................................................................................................. 123
9
List of Figures
Figure 1-1 Myo armband structure ......................................................................................... 28
Figure 1-2 sEMG signal generated by Myo Armband ............................................................ 28
Figure 1-3 Wearable Armband for biometrics verification .................................................... 32
Figure 2-1 Basic Steps of Hand Gesture Recognition (Yasen, M., and Jusoh, S., 2019) ....... 37
Figure 2-2 Models of 3D printed upper limb (Jelle ten Kate, Gerwin Smit & Paul Breedveld,
2017) (a) Andrianesis’ Hand: an externally powered forearm prosthesis,(b) Body-powered
hand prosthesis, (c) Scand: a passive adjustable forearm prosthesis,(d) IVIANA 2.0: a passive
forearm prosthesis, (e) Adams Arm: EMG controlled Bionic Arm......................................... 43
Figure 3-1 Amputation case with the user wearing a Myo armband ...................................... 52
Figure 3-2 Schematic chart of the process for bionic arm control .......................................... 53
Figure 3-3 Eight (sEMG) sensors raw data for wave-out hand action .................................... 54
Figure 3-4 Bionic arm 3D model on computer-aided design (CAD) software. ...................... 55
Figure 3-5 Case 1: Stress results at 3.350 Kg load ................................................................. 57
Figure 3-6 Case 1: Displacement results at 3.350 Kg load ..................................................... 57
Figure 3-7 Case 1: Strain Result at 3.350 kg load .................................................................. 58
Figure 3-8 Case 2: Stress result at 2.350 combined load ........................................................ 58
Figure 3-9 Case 2: Displacement results at 2.350 kg combined load ..................................... 58
Figure 3-10 Case 2: Strain result at 2.350 kg combined load ................................................. 58
Figure 3-11 Bionic Arm load test ........................................................................................... 59
Figure 3-12 Amputee wearing the bionic arm ........................................................................ 59
Figure 3-13 Chestnut board controller .................................................................................... 61
Figure 3-14 Flowchart of controlling the bionic arm .............................................................. 61
Figure 3-15 Filtered and rectified EMG signal (a) Raw sEMG signal, (b) Mean value
removed sEMG signal, (c) Filtered and rectified sEMG signal, (d) sEMG envelope signal .. 63
Figure 3-16 (a)Writing with the pen (two fingers closed action); (b) holding of a notebook
(one finger closed action); (c) using the PC mouse (one finger closed action); (d) holding a
ball (fist action). ....................................................................................................................... 69
Figure 3-17 Success rate of hand actions. ............................................................................... 70
Figure 4-1 EMG Authentication System Schematic Chart ..................................................... 74
Figure 4-2 Acquisition of sEMG data of a user to create the database (Enrolment) .............. 75
10
Figure 4-3 PSD of EMG signal ............................................................................................... 78
Figure 4-4 Segmentation of EMG signal ................................................................................ 78
Figure 4-5 Average Testing Accuracy of Verification System ............................................... 83
Figure 4-6 FAR and FRR of the Three Classifiers ................................................................. 83
Figure 5-1 Biometrics Identification System Schematic Chart .............................................. 91
Figure 5-2 Absolute and log absolute value of EMG signal ................................................... 93
Figure 6-1 Schematic diagram of ConvNet architecture (Chen, L., Fu, J., Wu, Y., Li, H., &
Zheng, B., 2020) .................................................................................................................... 102
Figure 6-2 Schematic Chart of Users verification System using Deep Learning ................. 103
Figure 6-3 Generated Scalograms of 6 different sEMG signals for different users, (a)User
1,(b)User 2, (c)User 3, (d)User 4, (e)User 5, (f)User 6.......................................................... 105
Figure 6-4 Organization of Fire Modules in the Convolutional Layer ................................. 108
Figure 6-5 Schematic Chart of Users Identification System using Deep Learning .............. 113
Figure 6-6 Denoised Signal using Different Threshold Values ............................................ 115
Figure 6-7 Scalograms of Denoised Signal using Different Threshold Values .................... 116
11
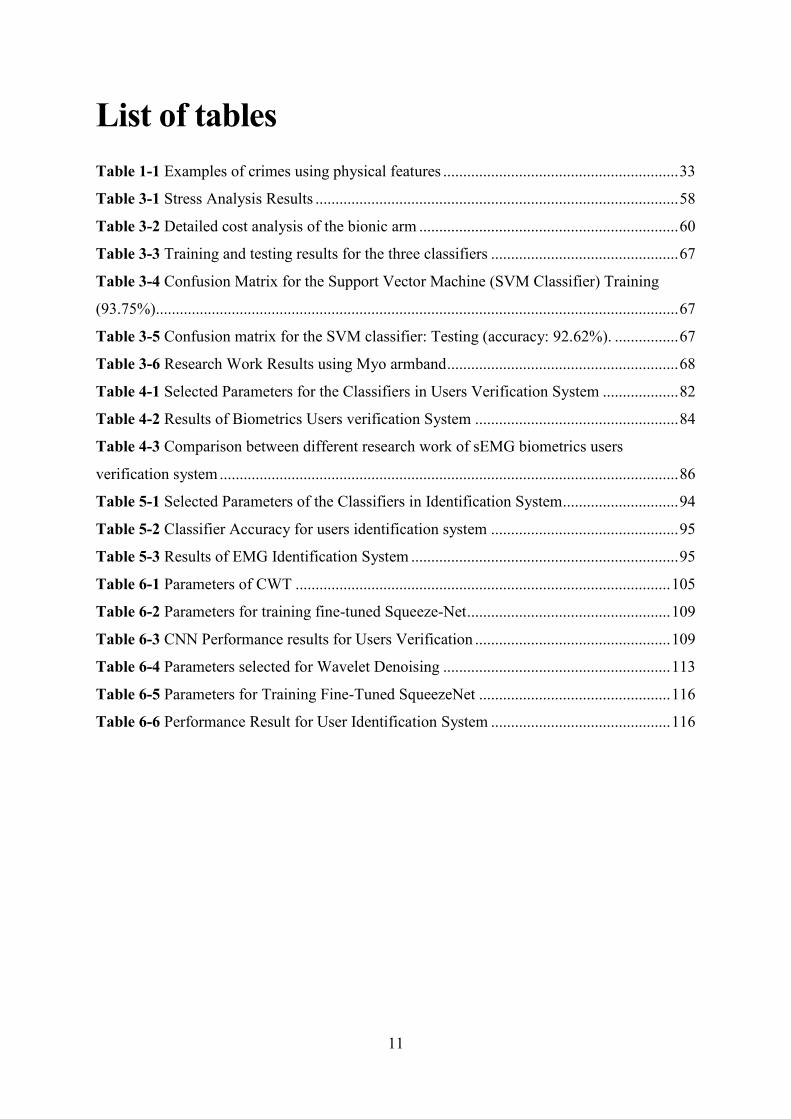
List of tables
Table 1-1 Examples of crimes using physical features ........................................................... 33
Table 3-1 Stress Analysis Results ........................................................................................... 58
Table 3-2 Detailed cost analysis of the bionic arm ................................................................. 60
Table 3-3 Training and testing results for the three classifiers ............................................... 67
Table 3-4 Confusion Matrix for the Support Vector Machine (SVM Classifier) Training
(93.75%)................................................................................................................................... 67
Table 3-5 Confusion matrix for the SVM classifier: Testing (accuracy: 92.62%). ................ 67
Table 3-6 Research Work Results using Myo armband .......................................................... 68
Table 4-1 Selected Parameters for the Classifiers in Users Verification System ................... 82
Table 4-2 Results of Biometrics Users verification System ................................................... 84
Table 4-3 Comparison between different research work of sEMG biometrics users
verification system ................................................................................................................... 86
Table 5-1 Selected Parameters of the Classifiers in Identification System ............................. 94
Table 5-2 Classifier Accuracy for users identification system ............................................... 95
Table 5-3 Results of EMG Identification System ................................................................... 95
Table 6-1 Parameters of CWT .............................................................................................. 105
Table 6-2 Parameters for training fine-tuned Squeeze-Net ................................................... 109
Table 6-3 CNN Performance results for Users Verification ................................................. 109
Table 6-4 Parameters selected for Wavelet Denoising ......................................................... 113
Table 6-5 Parameters for Training Fine-Tuned SqueezeNet ................................................ 116
Table 6-6 Performance Result for User Identification System ............................................. 116
12
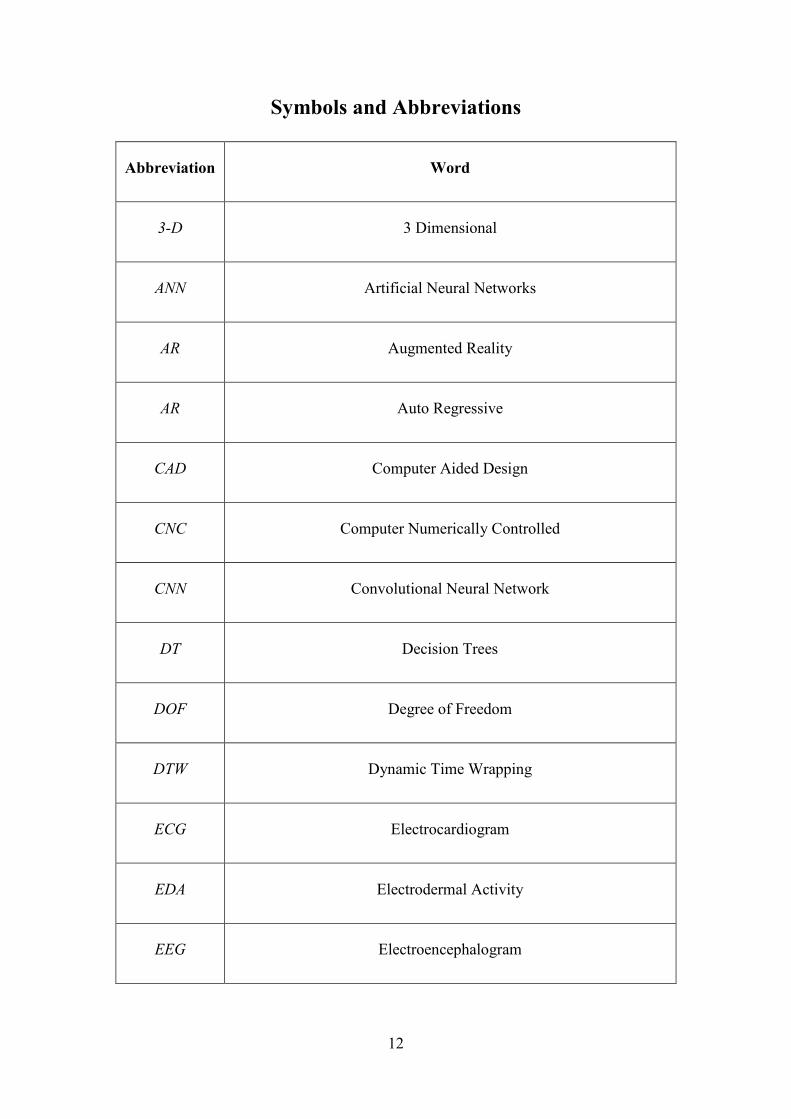
Symbols and Abbreviations
Abbreviation Word
3-D 3 Dimensional
ANN Artificial Neural Networks
AR Augmented Reality
AR Auto Regressive
CAD Computer Aided Design
CNC Computer Numerically Controlled
CNN Convolutional Neural Network
DT Decision Trees
DOF Degree of Freedom
DTW Dynamic Time Wrapping
ECG Electrocardiogram
EDA Electrodermal Activity
EEG Electroencephalogram

13
EMG Electromyography
FAR False Acceptance Rate
FRR False Rejection Rate
FEA Finite Element Analysis
FEA Finite Element Analysis
GMM Gaussian Mixture Model
GUI Graphical User Interface
HGR Hand Gesture Recognition
HW Hardware
HMM Hidden Markov Model
HCI Human-Computer Interaction
IMU Inertial Measurement Unit
IP Internet Protocol
imEMG intramuscular EMG
KNN K-nearest neighbour

14
LBFGS Limited-memory Broyden–Fletcher–Goldfarb–Shanno
LDA Linear Discriminant Analysis
LDA Linear Discriminant Analysis
MAV Mean Absolute Value
MCU Microcontroller Unit
MEMS Micro Electro-Mechanical Systems
MLP Multi-Layer Perceptron’s
MLP Multi-layer Perceptrons
NB Naive Bayes
OS Operating System
PLA Polylactic Acid
PLA Polylactic Acid
PSD Power Spectral Density
PCA Principal Component Analysis
RNN Recurrent Neural Network

15
SNR Signal-to-Noise Ratio
SDK Software Development Kit
SD Standard Deviation
SVM Support Vector Machine
sEMG Surface Electromyography
TPU Thermoplastic polyurethane
VAR Variance
WL Waveform Length
WAMP Willison Amplitude
ZC Zero-Crossing
16
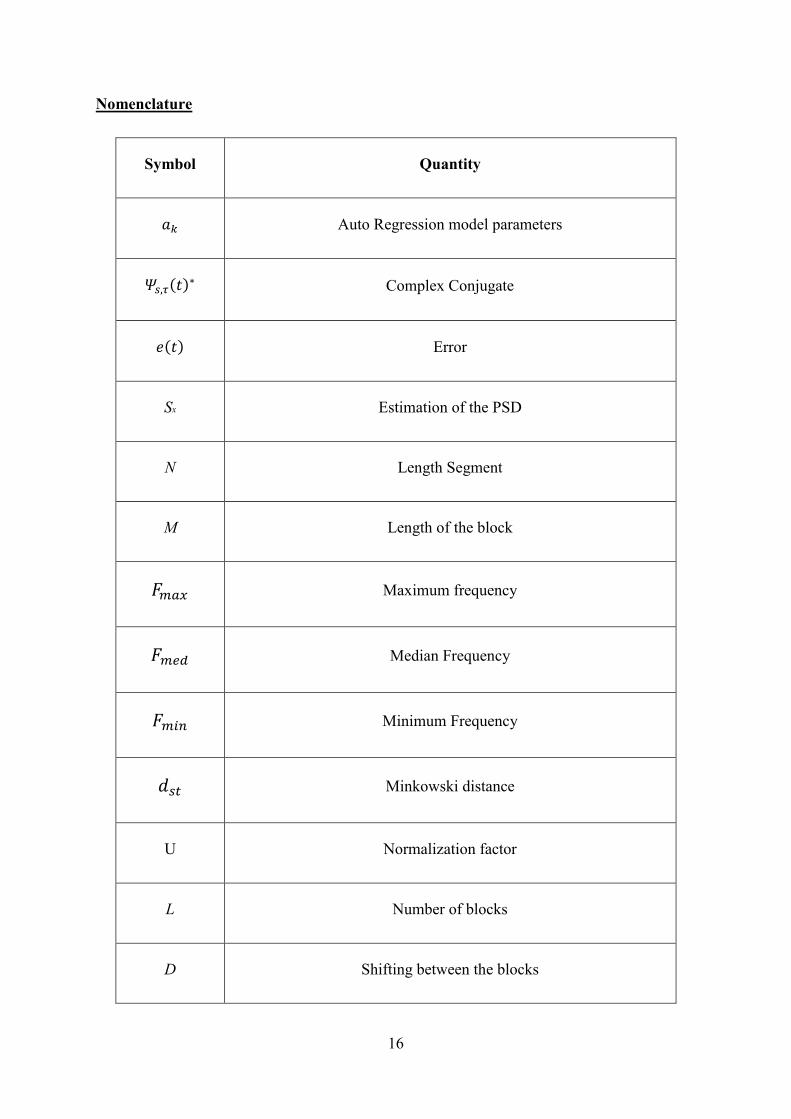
Nomenclature
Symbol Quantity
𝑎𝑘 Auto Regression model parameters
𝛹𝑠,𝜏(𝑡)∗ Complex Conjugate
𝑒(𝑡) Error
Sx Estimation of the PSD
N Length Segment
M Length of the block
𝐹𝑚𝑎𝑥 Maximum frequency
𝐹𝑚𝑒𝑑 Median Frequency
𝐹𝑚𝑖𝑛 Minimum Frequency
𝑑𝑠𝑡 Minkowski distance
U Normalization factor
L Number of blocks
D Shifting between the blocks
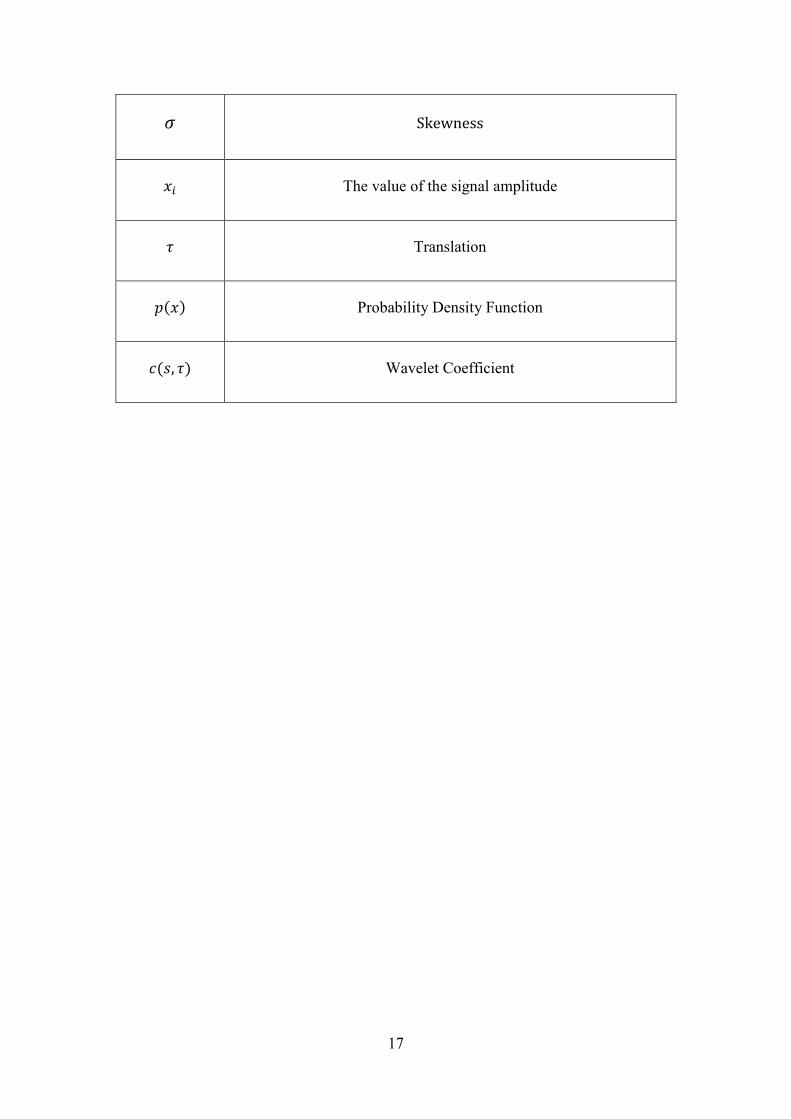
17
𝜎 Skewness
𝑥𝑖 The value of the signal amplitude
𝜏 Translation
𝑝(𝑥) Probability Density Function
𝑐(𝑠, 𝜏) Wavelet Coefficient

18
Introduction Wearable technologies are new technology raised in the last decades. With the advancement in
this technology, its applications are immersed in several fields includes sports, health
monitoring, biomedical and biometrics applications. In this thesis, the research focuses on
using a wearable multi-channel armband in bionic arm control and biometrics applications.
Myo armband is a wearable armband that includes eight dry sEMG electrodes. The sEMG
signal measures the electrical potential of the muscles.
It has been reported that the amputee cases are rising, and there are around 50 million arm
amputees in the world, around 40 million arm amputees in the developing nations. The arm
amputees are suffering in doing their primary daily life activities. The prices of a functional
bionic arm range around 25000$. The research in bionics aims to detail designing a
customizable sEMG-controlled wearable 3D printed bionic arm for an arm amputee. For this
purpose, a 3D printed bionic arm is wholly designed, simulated, and implemented considering
the bionic arm's cost and weight. Machine learning classifiers are optimized to achieve an
accurate gesture recognition system to control the bionic arm.
On the other hand, it is known that electrical bio-signals can be used as biometric traits due
to their hidden nature and ability to facilitate liveness detection. As a second application of this
thesis, the viability of utilizing the sEMG signal as a hidden-biometric modality for user
verification and identification is investigated. Several classifiers are applied in a trial to
establish an accurate anti-spoofing biometrics system based on combinations of hand actions.
Specifically, in the field of electromyography-based biometrics systems, deep learning
algorithms are seldom employed as they require an unreasonable amount of effort from a single
person to generate tens of thousands of examples. In this work, data augmentation is used to
extend the classical machine learning approach's database by augmenting multiple users'
signals, thus reducing the recording burden. Convolutional Neural Network (CNN) is used to
train the users in the EMG biometrics system. Squeeze net neural network structure is selected
due to its faster training time as it requires fewer parameters while maintaining the accuracy
level. Continuous wavelet transforms (CWT) are applied to the database to estimate the EMG
signals' scalograms.

19
Objectives of the Thesis
The thesis focuses on the application of wearable 8-channel sEMG armband in Bionic arm
control and biometrics applications.
The objective of the research conducted in the bionic arm:
• Detail a design of an affordable price 3D printed bionic arm for upper limb amputees.
• Design of adjustable socket to be attached with an amputee's arm with a maximum
comfortable feeling.
• Construct a gesture recognition system based on sEMG signals.
• Create a database of sEMG signals represent gestures for the generic control scheme of
the bionic arm.
• Extract the features of sEMG signals to detect four hand gestures (Fist, Open, Wave-
in, and Wave-out)
• Optimize the Machine Learning algorithm's accuracy and select the best model to be
used with the sEMG database.
• Perform testing on the bionic arm design and the algorithm used in the control of the
bionic arm.
The design of the bionic arm should fulfill these points to ensure its success
• Affordable: The systems should be accessible for amputees since the selling price is
one of the main factors to be considered during the design phase. The bionic arms
available in the market are expensive compared to the 3D printed arm.
• Portable: The designed arm should be comfortable to wear for amputee cases.
• Lightweight: The lightweight design has been achieved by optimizing the system and
using 3D printing technology in the arm's manufacturing process.
• Generic: To develop a bionic arm used by different amputees, database collected from
different users, and machine learning algorithms applied.
Biometric authentication includes verification, and identification of users from sEMG signals
has been studied. The thesis focuses on biometric systems' behavioral approach by defining a
new hidden biometric system based on sEMG signals.
The objective of the research conducted in the biometric system:

20
• Verify the users from their hand actions as a new biometric system.
• Use the hidden biometric approach based on users’ muscle actions to define an anti-
spoofing biometric system.
• Construct a database from 8-channels sEMG signals. The database consists of hand
gestures defining a password for each user.
• Extract the sEMG signals' main features to verify users from their hand action after
declaring their identity.
• Optimize the accuracy of sEMG signals machine learning model and compare the
accuracy of different machine learning models.
• Identify the users from sEMG signals without declaring their identity by extracting
the main features from the sEMG signals.
• Optimize the accuracy of the machine learning models in the identification system.
• Apply deep learning algorithm after augmenting the sEMG data to find a technique
of applying machine learning without extracting the features from sEMG signals, the
proposed system to be used in biometrics verification and identification.
• Analyze the performance of the biometric system by calculating the false acceptance
rate and false rejection rate to find the equal error rate of each proposed system.
• Accurate: The system must be accurate in the result. For biometrics verification, the
result is access granted or denied, while in identification, the result is the user's
identity. Therefore, the most precise algorithms to be chosen, and the success rate
have been demonstrated after testing and calculating the False Acceptance Rate
(FAR) and False Rejection Rate (FRR).
Thesis Contribution
The main contributions of this thesis are mentioned as follows:
• Affordable price, lightweight, and 3-D printed bionic arm controlled by gestures:
Detailed design of an affordable price and lightweight bionic arm that comes with a
bionic hand for right arm amputee cases. The bionic arm is equipped with four linear
actuators that make it able to close the fingers to perform several grasping requirements.
The 3D printed bionic arm was designed, simulated, and implemented for an affordable
price and lightweight. The control of the bionic arm is performed by sEMG signals that
are generated by the arm muscles.

21
• Biometrics verification and identification system based on hand actions:
Due to its live detection nature and anti-spoofing behavior, a biometrics system based
on hand actions is optimized for the user’s verification and identification. The database
is created from 56 able-bodied users. Features are extracted in the frequency domain
and time domain to optimize the results. Several classifiers based on K-nearest
Neighbours (KNN), Linear Discernment Analysis (LDA), and Ensemble of Classifiers
are constructed, trained, and statistically compared. False acceptance rate (FAR) and
False Rejection Rate (FRR) are calculated for each classifier to evaluate the biometrics
verification system's performance. In the user’s identification system, features are
extracted in the time domain from the signals to identify between the users from their
biometrics identity without declaring their identity. The same three classifiers are used
to classify the data; KNN, LDA, and Ensemble of Classifiers are constructed, trained,
and statistically compared. The results obtained from the KNN classifier proved the
concept of using the sEMG for user’s verification and identification.
• Deep Learning Algorithm for Biometrics system: Recently, deep learning
algorithms have become increasingly prominent for their unparalleled ability to learn
from large amounts of data automatically. In this thesis, data augmentation is used to
create a giant database out of a smaller database used in the classical machine learning
approach by augmenting multiple users' signals, thus reducing the recording burden
while enhancing the recognition rate. Convolutional Neural Network (CNN) is used to
train the users in the EMG biometrics system. Squeeze net neural network is selected
due to its faster training time as it requires fewer parameters while maintaining the
accuracy level. Continuous wavelet transforms (CWT) are applied to the database to
estimate the EMG signals' scalograms. In the identification system, five wavelet
denoting levels have been applied to the raw data to augment the data.
Thesis Structure
The thesis starts with generalities about the nature of the sEMG signal and the wearable
technology systems available on the market in chapter 1. Literature survey about results of the
research done in wearable technologies, gesture recognition system based on sEMG signals,
and biometric system based on behavioral of users in Chapter 2. Chapter 3 focuses on the
detailed description of the bionic arm, including the detailed design of the arm, the amputee
case involved in the study, the data collection of sEMG signals defining gestures, and the
22
application of machine learning models. Chapter 4 explains the verification process of users
from the sEMG signal represents a hidden biometric system. The features extraction parameters
will be mentioned in detail. Machine learning models and discussion of the results obtained are
presented. Chapter 5 will discuss the Identification approach, including the features extraction
process and the identification system results utilizing the same dataset used for the verification
approach. Chapter 6 details the application of deep learning in the biometrics system in
verification and identification approaches after augmenting the users' sEMG signals. Data
augmentation is a technique that helps to increase the database of sEMG signals to avoid data
acquisition from more users and more samples from each user. The sEMG signals are converted
into images by applying continuous wavelet transform. These images are augmented to provide
more data to be fed into the deep neural network. The biometrics systems result in using deep
learning will be presented. Chapter 7 presents the conclusion and perspectives of the thesis.
23
1 Chapter 1 Generalities about Wearable
Technology systems
Chapter Content
1.1 Introduction ............................................................................................................... 24
1.2 Wearable systems on the market ............................................................................... 25
1.2.1 BITalino Kit ....................................................................................................... 25
1.2.2 MySignals Kit .................................................................................................... 26
1.2.3 Myo Armband .................................................................................................... 27
1.3 EMG Signal ............................................................................................................... 28
1.4 Wearable Technologies in Bionic arm ...................................................................... 29
1.5 Wearable Technologies in Biometrics ...................................................................... 30
1.6 Conclusion ................................................................................................................. 33
Summary: The chapter briefly introduces the wearable technologies applications in biomedical,
biometrics research, and biomechatronic applications. The wearable devices nowadays are equipped
with multiple biosensors. Research in prosthetic devices has generated great attraction in the last
decade as the number of amputees is increasing. The advances in wearable devices help in the
development of bionic devices. Utilizing the fact that the wearable devices are made to be always with
the owner, this makes wearable systems can effectively perform the biometrics rule of authenticating a
user. The chapter offers a brief introduction about different wearable systems available in the market
that offer the user the ability to acquire different bio-signals. The chapter focused on the definition of
EMG signal used in this work by acquiring it using Myo armband, which is explained in this chapter.
First, an introduction to wearable technologies is presented in section 1.1 and followed by studying
the available systems on the market that offer a wearable system in section 1.2. The EMG signal selected
to be studied in detail in this thesis is explained in section 1.3. The wearable technologies in the bionic
arm and biometrics are described in sections 1.4 and 1.5. The chapter ended by listing the thesis's
objective, thesis contribution, and thesis structure in sections 1.6, 1.7, and 1.8.
24
1.1 Introduction
Wearable technologies applications in the biomedical, biometrics research, biomechatronic,
and different fields are gaining significant interest over the last years (V. Enzo, P. Scilingo and
Gaetano, 2017). Comfortable to wear, optimum size, and lightweight monitoring systems with
smart-power consumption for collecting physiological and behavioral data in ecological
scenarios (e.g., at home, during daily activities like driving or sleep, during specific tasks, while
driving) with comfort for different users. As a result, the quality of life can be improved by the
patients monitoring care, especially for patients with chronic disease, possibly preventing the
habit of going to hospitals and paying unnecessary costs.
Within this context, wearable systems have reached a level to be ready for clinical
applications (P. Bonato, 2003). Many companies are investing funds for the research and
development department to focus on a wearable system for clinical application. They are
encouraging researchers in that field to focus more and more on improving people’s life. This
technology grows in a stable trend, showing a promising result that wearable systems will soon
be part of everyone's daily life.
The enthusiasm for wearable frameworks starts from the need to observe people over broad
timeframes. This case emerges when doctors need to screen people whose incessant condition
incorporates the danger of sudden intense occasions. Wearable technology opens the door to
different applications.
Research in prosthetic and medical devices has generated significant attraction in the last
decade because of the increasing demand for robust bionic arm, fulfilling the patient’s need to
perform various tasks. Generally, gesture recognition techniques enabled the manufacturer to
improve both the accuracy and functionality of bionic hands, allow the patient control over
delicate operations in dangerous situations, or help patients with movement disorders and
disabilities, as well as in the rehabilitation training process. The application of wearable sensors
allows a more compact design and a more straightforward implementation of upper limbs.
Wearables that are equipped with embedded bio-sensors are very well suited for biometric
verification and offer advantages compared to traditional biometric systems. A significant
advantage is that the wearable systems are made to be always with the owner; at the same time,
conventional biometric systems are installed generally at a fixed location. Wearable biometric
systems can effectively perform continuous verification of the user. Another advantage is that
25
the owners shouldn’t share their biometric traits, generally considered compassionate
information, with a third party for storage since all data can be stored inside the wearable
device.
1.2 Wearable systems on the market
There are many systems available on the market that offer the user the ability to acquire bio-
signals. Several requirements and criteria differentiate between these systems. The cost of the
system is one of the most important criteria. The connectivity with the processor either wireless
or with wires. The accuracy of the bio-sensors in the system. The battery consumption rate
gives the system the ability to stay powered for a long time. The Software Development Kit
(SDK) is available with the design, allowing the researchers to quickly develop their systems
and access the raw signals for further development.
1.2.1 BITalino Kit
BITalino development bio-medical kit is one of the most potent kits available on the market. It
gives the user the ability to work on physiological data. This kit comes with an sEMG sensor
that monitors the muscle activation using three wet bipolar surface electrodes (plus a ground
lead), Measuring the electrical activity in muscles and nerves. Surface electromyography
(sEMG) is a technique that is used in many clinical and biomedical applications in areas like
HCI, neurology, rehabilitation, orthopedics, ergonomics, and sports. It is widely used as a
biofeedback tool to assess muscle fatigue; disorders of motor control and low-back pain is also
possible with the EMG sensor. Sensing isometric muscular activity, where no movement is
produced, enables a definition of classes of subtle motionless gestures to control interfaces
without being noticed and without disrupting the surrounding environment. These signals can
be used to control prosthetic devices such as prosthetic hands, arms, and lower limbs or as a
control signal for an electronic device such as a mobile phone.
Conduction of action potentials through the heart generates electrical currents that can be
picked up by electrodes placed on the skin. A recording of the electrical changes that
accompany the heartbeat is called an electrocardiogram (ECG). Variations in the size and
duration of the waves of an ECG are useful in diagnosing abnormal cardiac rhythms and
conduction patterns. The ECG works mostly by detecting and amplifying the tiny electrical
changes on the skin that are caused during the heart muscle cycle during each heartbeat. The
26
ECG sensor provided by BITalino uses only two electrodes to acquire the signal. The essential
ECG sensor applications focus on the patient's wellness and include heart rate and stress
monitoring, biometric verification, and live monitoring.
Electrodermal Activity (EDA) is defined as a transient change in the skin's electrical
properties associated with the sweat gland activity and elicited by any stimulus that evokes an
arousal or orienting response. The EDA sensor can measure skin activity with high sensitivity
measurement power in a miniaturized form factor. With low noise signal conditioning and
amplification circuitry, the EDA sensor provides accurate sensing capability and detects even
the feeblest electrodermal skin response events using two electrodes. Some of this sensor's
applications include the detection of changes in the conservative, cognitive, and emotional
states. EDA sensors were also used for relaxation biofeedback, sympathetic nervous system
reaction detection, among many others.
The triaxial accelerometer is based on MEMS (Micro-Electro-Mechanical Systems)
technology and has been developed for biomedical applications where kinematic and motion
measurements are required. This sensor can measure accelerations relative to free fall, and the
model available can detect the magnitude and direction of this same acceleration as a vector
quantity. This resulting vector can then be used to sense position, vibration, shock, and fall.
Attaching the accelerometer to a limb, for example, acceleration can be measured within the
sensor's dynamic range.
The revolutionary kit comes with a Microcontroller Unit (MCU) in a tiny size that can
connect all the sensors. The MCU has six analog input ports 4 (10-bit), 2 (6-bit), and it has
eight digital ports, four ports digital input (1-bit), four ports digital output (1-bit). All acquired
signals can be transmitted wirelessly using Bluetooth V2.0.
The BITalino kit has some advantages in terms of the number of sensors embedded inside it
and the wireless communication with the central processor. Also, the size of the sensors is tiny
to be embedded inside any wearable device. This system's shortcoming is that the electrodes
are wet since it needs a gel and are connected via wires to the human skin, making
uncomfortable feeling to the user. (S. Said, S. Alkork, T. Beyrouthy, and M. Fayek, 2017)
1.2.2 MySignals Kit
MySignals is a development platform for medical devices and eHealth applications. It is used
to develop eHealth web or even to build new medical wearable devices. MySignals hardware
27
(HW) Complete Kit includes seventeen sensors that allow the user to measure 20 different
biometric parameters. The parameters are oxygen in the blood, pulse rate, breath rate, oxygen
in the blood, electrocardiogram signals, blood pressure, muscle electromyography signals,
glucose levels, galvanic skin response, lung capacity, snore waves, patient position, airflow,
and body scale parameters (weight, bone mass, body fat, muscle mass, body water, visceral fat,
Basal Metabolic Rate, and Body Mass Index). With all the sensors and features allow
MySignals Kit to be the complete eHealth platform in the market. All the data acquired by
MySignals is encrypted for personal information security and sent to the user's private account
at Libelium Cloud through Wi-Fi or Bluetooth. The data can be visualized in any smart devices
ranging from smartphones to PCs.
1.2.3 Myo Armband
Myo Armband is the basic concept of Human-Computer Interaction (HCI) in which humans
interact with computers and design technologies that let humans interact with computers
interactively. Hence Myo is a new way that is used to control the real-life applications by the
human. The structure of Myo consists of the EMG (electromyography) sensor and an Inertial
Measurement Unit (IMU), which includes a gyroscope, accelerometer, and a magnetometer (S.
Rawat, S. Vats and P. Kumar, 2016) (Myo Armband, n.d.).
Thalamic Labs developed Myo Armband. Myo is an armband that can be worn on the forearm
below the elbow controlled by human gestures and movements. With Myo's help, many tasks
are done easily, like controlling lights, robots, drones, and change slides of the presentation by
just waving a hand in lectures. Myo can be used to interface with software and electronics by
their gestures and hands movement. Myo plays a vital role in the medical field; doctors can
examine the EMG reports and control their electronic devices (S. Rawat, S. Vats and P. Kumar,
2016).
Myo Armband detects the electrical activity in forearm muscles just below the elbow. The
human forearm has different types of muscles, each of which has another arrangement, and
these muscles control the movement of the wrist, such as moving fingers, making a fist, turning
left or right.
Myo armband is designed in a wearable way. It can fit in the human forearm easily. Sizing
clips are available, which allow for a more constrained grip, better suited for smaller arms. The
sizing clips enable it to expand between 7.5 - 13 inches (19 - 34 cm) forearm circumference.
28
Unlike other EMG sensors, the Myo armband does not require the wearer to shave the area
around which the armband electrodes will be worn. This allows for more comfortable setup
procedures in real-world environments. The Myo armband weighs 93 grams, which gave it the
ability to be wearable for a long time without uncomfortable feeling to the wearer. The Myo
armband design is thin with a thickness of 0.45 inches (1.14 cm), which allows it to be worn
under the shirts.
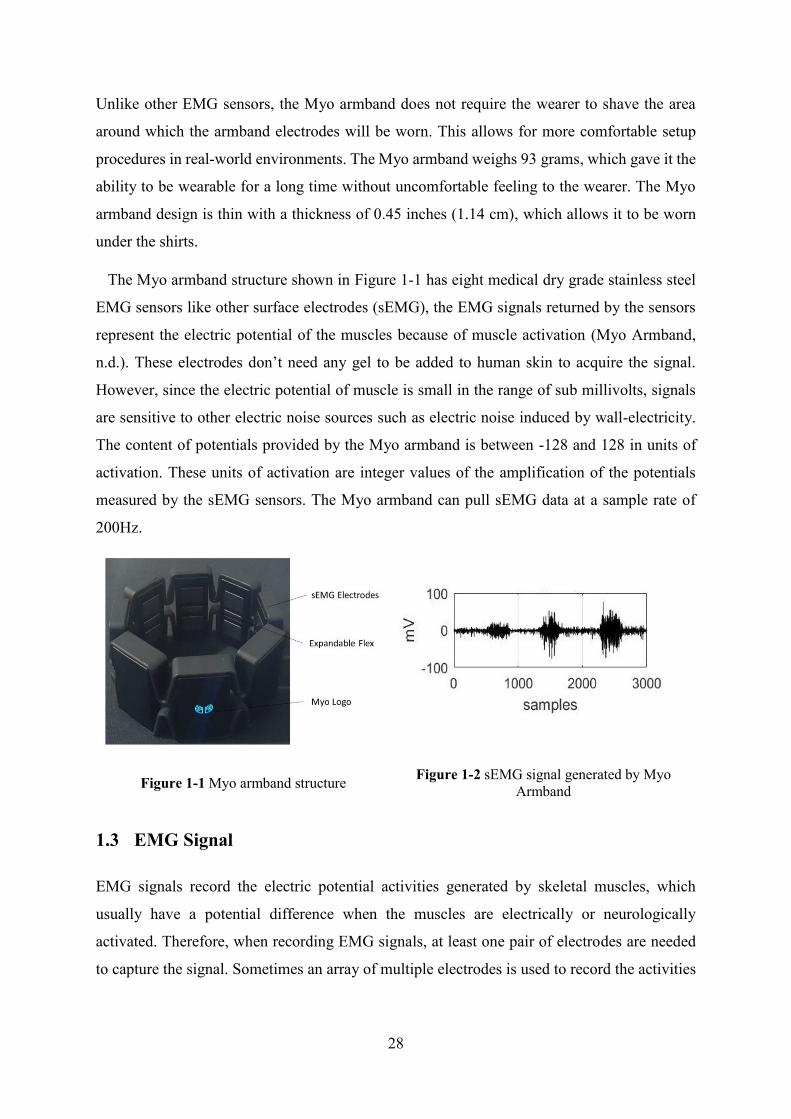
The Myo armband structure shown in Figure 1-1 has eight medical dry grade stainless steel
EMG sensors like other surface electrodes (sEMG), the EMG signals returned by the sensors
represent the electric potential of the muscles because of muscle activation (Myo Armband,
n.d.). These electrodes don’t need any gel to be added to human skin to acquire the signal.
However, since the electric potential of muscle is small in the range of sub millivolts, signals
are sensitive to other electric noise sources such as electric noise induced by wall-electricity.
The content of potentials provided by the Myo armband is between -128 and 128 in units of
activation. These units of activation are integer values of the amplification of the potentials
measured by the sEMG sensors. The Myo armband can pull sEMG data at a sample rate of
200Hz.
Figure 1-1 Myo armband structure Figure 1-2 sEMG signal generated by Myo
Armband
1.3 EMG Signal
EMG signals record the electric potential activities generated by skeletal muscles, which
usually have a potential difference when the muscles are electrically or neurologically
activated. Therefore, when recording EMG signals, at least one pair of electrodes are needed
to capture the signal. Sometimes an array of multiple electrodes is used to record the activities
29
of more than one muscle simultaneously. (Qingqing Li, Penghui Dong and Jun Zheng, 2020)
(Robertson, D. G. E., Caldwell, G. E., Hamill, J., Kamen, G., and Whittlesey, 2014).
There are two types of EMG: surface EMG (sEMG) and intramuscular EMG (imEMG).
sEMG signals which are used in this work are obtained by measuring muscle activities on the
skin surface. On the other hand, imEMG signals are recorded from the muscle tissue acquired
by percutaneous wire needle electrodes inserted into a muscle with a surface electrode on the
skin as a reference. Compared with imEMG, sEMG is a way more convenient to acquire and
is non-invasive. In this study, sEMG signals are recorded from the forearm muscle as the
biometric information for user verification. The sEMG signals are obtained using the 8-channel
wearable bracelet. Figure 1-2 shows the raw sEMG signal from one electrode acquired by Myo
armband, while the user performs three hand gestures before signal processing.
1.4 Wearable Technologies in Bionic arm
Many people have difficulty in their lives because of disability, which stops them from
performing their daily activities. The statistics study stated that 15% of the world’s population
having some forms of disability. Amputee’s number is around 10 million out of the world’s
population, of which 30% of them are arm amputees (Hawking, 2011). The total number of
amputees and limb dysfunction patients are increasing due to many reasons. Arm amputation
is classified as either born without an arm or portion of it or wholly lost of the arm due to
disease or accident. Both cases are suffering while performing their daily life activities, indeed
help from others (S. Hasan, K. Al-Kandari, E. Al-Awadhi, A. Jaafar, B. Al-Farhan, M. Hassan,
S. Said, and S. AlKork, 2018).
There are different solutions to help the amputees, but these solutions have some drawbacks
like being costly to the point that not everyone can afford it or hard to install or maintain or
require surgical operations. Surgical arms rely on the nerves, which, might be damaged, in
some cases (Junhua Li, Gong Chen, Pavithra Thangavel, Haoyong Yu, Nitish Thakor,
Anastasios Bezerianos, and Yu Sun, 2016). The mind-controlled made of the 3D printed
material arm has the requirements to help amputees perform many of their daily activities,
provide a better life, and improve the quality of life. Besides, it uses brain-signals and thoughts
to allow amputees to control the arm actuators. There are also several existing solutions, such
as surgical arm, myoelectric-controlled arm, and cosmetic restoration. Each type has
advantages and drawbacks. One of the solutions for amputees is having a prosthetic arm. The
30
prosthetic arm needs to be customized to the patient's needs. The second solution is the surgical
limbs, where the patient will have to undergo a surgical operation to attach the arm to the bones
and nerves. The surgical method is very costly. Some problems may happen due to the surgical
arm. For example, sometimes the nerves may cause a problem when they are damaged totally,
making it hard to perform surgery. Also, the surgical method causes heart disease and back
pain in some patients. The amputees face nociceptive and neuropathic pain due to bone and
soft tissue injury.
On the other hand, the prosthetic arm has fewer problems when compared to the surgical arm.
Prosthetic arm avoids many medical issues that may result from the surgery procedure. There
are many techniques to control a robotic arm. One method is to use an electroencephalogram
(EEG) device. The EEG is a headset that records the brain waves when the person thinks of
action or implements a facial expression. The EEG will read signals and then convert them to
commands to send them to the arm. The second technique is to use Muscle Activity Sensors
called surface electromyography (sEMG) sensors. The signals can be analyzed to detect
medical abnormalities, activation levels, or recruitment orders or analyze humans'
biomechanics. sEMG signals are processed for multiple hand gestures and movement
recognition. EMG monitors the electrical signals under human skin that are produced by the
muscles.
Myo Armband has been used in a very efficient way by researchers at Johns Hopkins
University (2016) to control a prosthetic limb using electric impulses transmitted from an
amputee’s mind to his limb. The armband works by reading the electromyographically (EMG)
impulses triggered by a thought from a person’s brain, sending a signal to a limb, which causes
a movement. A transradial myoelectric prosthesis based on an innovative mechanism called
Adam’s hand has been developed. It can actuate five three-phalanx fingers (15 degrees of
freedom). Adam's Hand fingertips are provided with temperature and pressure sensors, while
the myoelectric user signals are acquired wirelessly employing the Myo armband (Gaetani, F.,
Primiceri, P., Zappatore, G. A., and Visconti, P., 2018).
1.5 Wearable Technologies in Biometrics
The growing popularity of wearable devices leads to new ways to interact with the environment
(J. Blasco, T. M. Chen, J. Tapiador and P. Peris-Lopez, 2016), with other smart devices, and
with other people. Wearables equipped with an array of sensors can capture the owner’s

31
physiological and behavioral traits, thus are well suited for biometric systems to control other
devices or digital access services. However, wearable biometrics have substantial differences
from traditional biometrics for computer systems, such as fingerprints, eye features, or voice.
Biometric recognition can be viewed as a pattern recognition problem in which a user who
wants to be authenticated provides a set of physiological and behavioral characteristics to
match a previously registered signature (or reference). Biometrics takes advantage of the fact
that humans have natural diversity and certain traits are unique for everyone. Biometric
systems, whether traditional or not, are usually composed of the three main functional
components:
(i) Sensor or set of sensors that capture raw biometric signals (r).
(ii) A signal-processing unit that pre-processes and extracts feature vectors from the
signals.
(iii) Recognition system, which usually includes a signature (or template) database and
implements a pattern recognition function. The physical features include
fingerprint, face recognition, and eye (Iris) scan. While the behavioral ones have
gait recognition, voice recognition, Electrocardiography (ECG), Electromyography
(EMG), and an electroencephalogram (EEG) (Moon, K. Y., 2005) (Bailey, K. O.,
Okolica, J. S., and Peterson, G. L, 2014).
The matching phase depends on the mode of operation, either verification or identification.
Biometric verification systems are configured by a sole user to verify the user’s identity later.
In biometric identification, the system is presented with a biometric signal and must decide
who is the owner of that signal from a pool of registered users
A biometric system should fulfill the following requirements:
● Performance: The system should respond promptly to queries with satisfactory
accuracy
● Acceptance: The system must be accepted by its intended users to be practical. If a
sensor or device is not comfortable enough, it will not be used.
● Circumvention: The system should not be easy to circumvent. This implies that the
system should be protected against unauthorized access to any of its components.
32
The wearable biometric system in which its primary user controls all the system components,
including the signature database. A wearable biometric system requires owners to wear the
sensor that captures their biosignals continuously. The signal processing and recognition units
can also be embedded in the same wearable device or a different smart device (e.g., a
smartphone, pc). The resources unlocked when the wearable successfully recognizes the use
right include the rest of the services provided by the wearable or a cryptographic key that can
be used to prove the identity of the user to other systems (Rathgeb, C., and Uhl, A, 2011). In
any case, the process triggered after verification is out of the scope of this survey.
In this configuration, wearable sensors are capable of reading signals from the subject at any
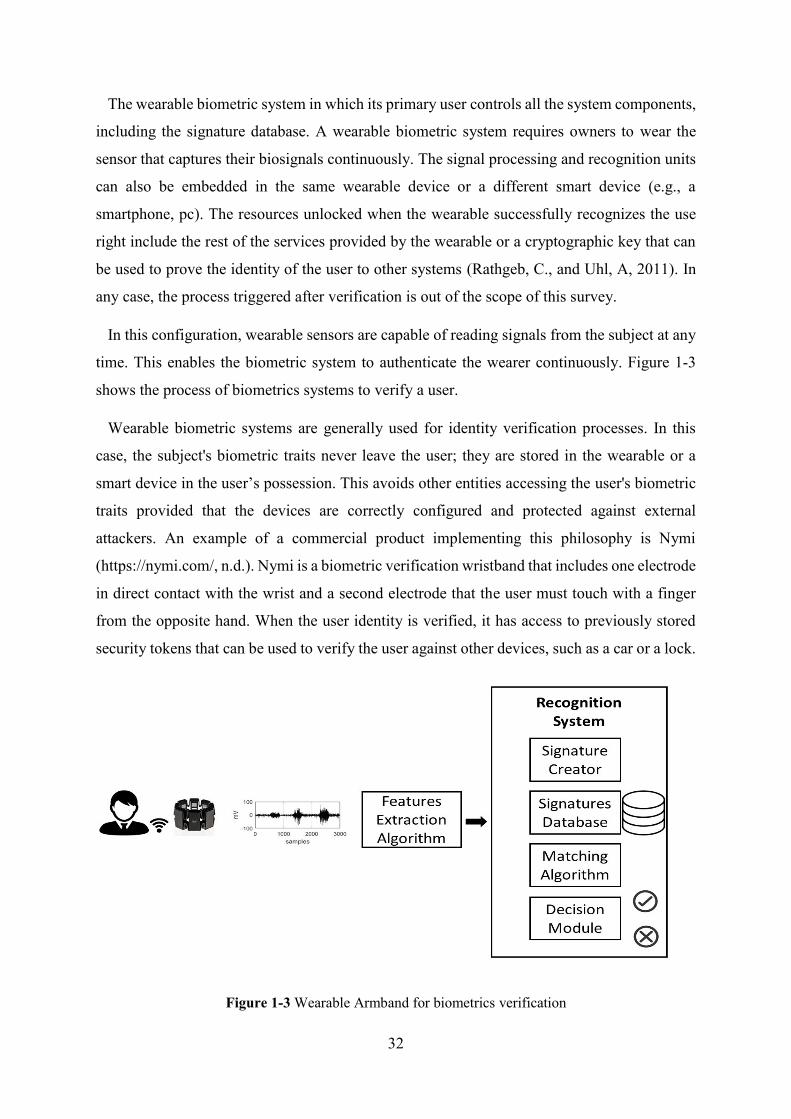
time. This enables the biometric system to authenticate the wearer continuously. Figure 1-3
shows the process of biometrics systems to verify a user.
Wearable biometric systems are generally used for identity verification processes. In this
case, the subject's biometric traits never leave the user; they are stored in the wearable or a
smart device in the user’s possession. This avoids other entities accessing the user's biometric
traits provided that the devices are correctly configured and protected against external
attackers. An example of a commercial product implementing this philosophy is Nymi
(https://nymi.com/, n.d.). Nymi is a biometric verification wristband that includes one electrode
in direct contact with the wrist and a second electrode that the user must touch with a finger
from the opposite hand. When the user identity is verified, it has access to previously stored
security tokens that can be used to verify the user against other devices, such as a car or a lock.
Figure 1-3 Wearable Armband for biometrics verification
33
With advancements in biometrics technology nowadays, some biometric systems don’t meet
security levels' requirements to support their operations in different scenarios. Among the
existing difficulties are the sensitivity to spoofing persons who act as others to get illegal access
to protected information, services, or facilities (Abdenour Hadid, Nicholas Evans, Sébastien
Marcel, and Julian Fierrez, 2015) (Evans, 2019). While the study of spoofing, or rather anti-
spoofing, has attracted growing interest in recent years, the problem is still requiring more
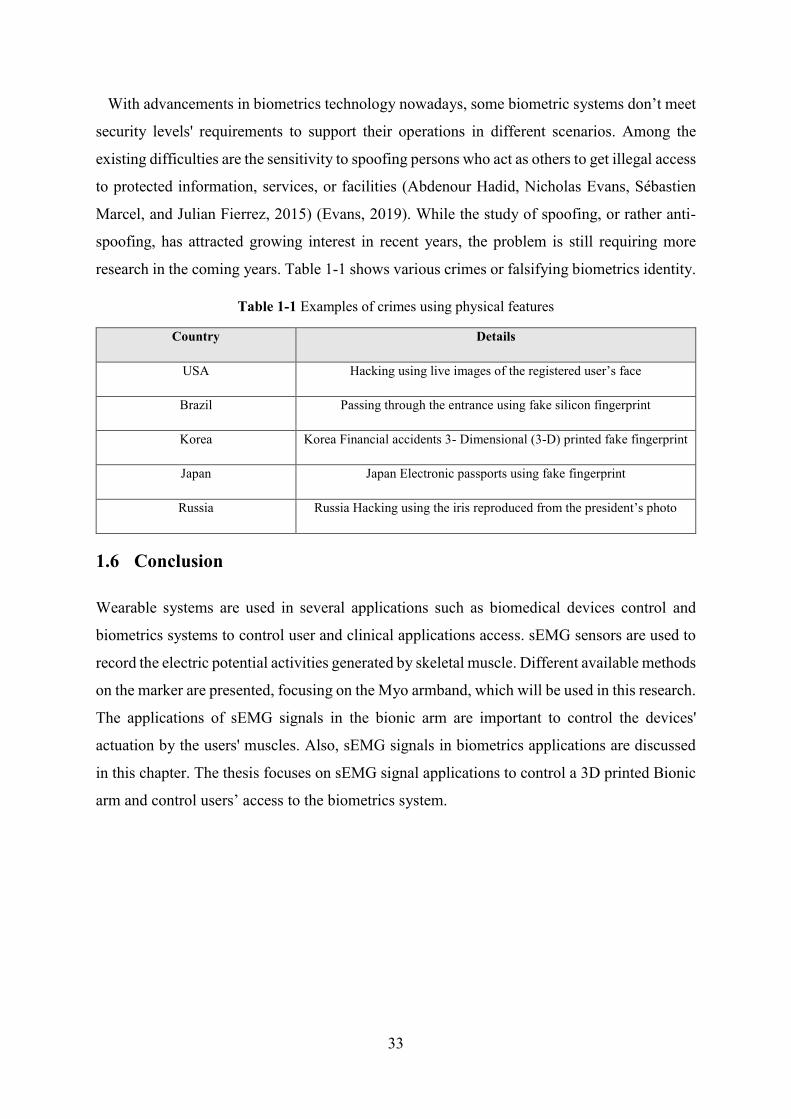
research in the coming years. Table 1-1 shows various crimes or falsifying biometrics identity.
Table 1-1 Examples of crimes using physical features
Country Details
USA Hacking using live images of the registered user’s face
Brazil Passing through the entrance using fake silicon fingerprint
Korea Korea Financial accidents 3- Dimensional (3-D) printed fake fingerprint
Japan Japan Electronic passports using fake fingerprint
Russia Russia Hacking using the iris reproduced from the president’s photo
1.6 Conclusion
Wearable systems are used in several applications such as biomedical devices control and
biometrics systems to control user and clinical applications access. sEMG sensors are used to
record the electric potential activities generated by skeletal muscle. Different available methods
on the marker are presented, focusing on the Myo armband, which will be used in this research.
The applications of sEMG signals in the bionic arm are important to control the devices'
actuation by the users' muscles. Also, sEMG signals in biometrics applications are discussed
in this chapter. The thesis focuses on sEMG signal applications to control a 3D printed Bionic
arm and control users’ access to the biometrics system.
34
2 Chapter 2 State of the Art on sEMG Control
Systems
Chapter Content
2.1 Introduction ............................................................................................................... 35
2.2 State of the Art on EMG Gesture Recognition System and Bionic Arm .................. 35
2.2.1 Review of EMG Gesture Recognition System .................................................. 35
• Gesture Acquisition Systems ................................................................................. 38
• Features Extraction Techniques for Gestures Recognition System ....................... 39
• Classifiers for sEMG Gestures Recognition System ............................................. 40
2.2.2 Review of 3D printed Bionic Arm ..................................................................... 41
2.3 State of the Art of EMG biometrics system .............................................................. 44
2.4 Conclusion ................................................................................................................. 47
Summary: This chapter shows a detailed state of the art on the applications of the sEMG signal in the
control system. The chapter states different types of machine learning algorithms applied in gesture
recognition systems in general and specifically in the control of bionic arms.
The EMG signal is used in the biometrics verification system due to its live detection and hidden nature.
Several kinds of research conducted in that field with different machine learning and deep learning
applications are stated in the chapter to provide the reader with the previous study conducted in the
area.
The chapter starts with a general introduction about the EMG signals application in the bionic arm
and biometrics system in section 2.1. A detailed literature study about the gesture recognition system
in section 2.2. Different 3D printed research work utilizing the technology of 3D printers is in section
2.2.2. The state of the art on the sEMG biometrics system is written in section 2.3.
35
2.1 Introduction
Wearable technologies, consisting of a smart device that is to be worn by the users and
equipped with biosensors embedded inside them, are the focus of the majority of researchers
in this modern era. Smart-textile or contactless electrodes and algorithms that are effective for
signal processing in embedded systems, along with sensing platforms and machine learning
algorithms, are a short glimpse of examples of such technologies. Few types of research results
will be stated in the wearable systems field in this chapter.
Moreover, in biosensors or wireless body sensors networks, special efforts have been made
for harvesting energy and small-scale integration of analog and digital sensor signal
conditioning. Published researches during the last few decades also confirm the massive impact
of wearable technologies.
This chapter focused on the state-of-the-art in the fields of applications of the wearable sEMG
sensors. sEMG based bionic arm for amputee cases and biometrics identity based on the sEMG
signals.
2.2 State of the Art on EMG Gesture Recognition System and Bionic Arm
2.2.1 Review of EMG Gesture Recognition System
The increase in computing power has brought the presence of many computing devices in
human beings' daily lives. A broad spectrum of applications and interfaces have been
developed so that humans can interact with them. The interaction with these systems is more
comfortable when they tend to be performed naturally (i.e., just as humans interact with each
other using voice or gestures). Hand Gesture Recognition (HGR) is a significant element of
Human-Computer Interaction (HCI), which studies computer technology designed to interpret
commands given by humans.
Hand gestures are communication tools considered non-verbal. The communication is
through the human hand combinations of actions. This modality is used either independently
or with other communication methods such as speech (Kendon, 2004). Hand gestures are
extensively used on different applications, varying from human applications' safety, for
example, using hand gestures to direct flight operations to applications that are made for
36
controlling purposes, like using hand actions in controlling electronics devices (Yasen, M., and
Jusoh, S., 2019).
The increase in computing power has brought the presence of many computing devices in
human beings' daily lives. A broad spectrum of applications and interfaces have been
developed so that humans can interact with them. The interaction with these systems is more
comfortable when they tend to be performed naturally (i.e., just as humans interact with each
other using voice or gestures). Hand Gesture Recognition (HGR) is a significant element of
Human-Computer Interaction (HCI), which studies computer technology designed to interpret
commands given by humans. Hand gestures, one of the most famous human-computer
interaction applications (Aashni, H., Archanasri, S., Nivedhitha, A., Shristi, P., and Jyothi, S.
N., 2017). It does have a wide range of applications that grant the speed of communication with
the computer, provide a user-friendly environment to attract users, provide private use of the
computer from a distance for user safety and comfort, and control complex and virtual
environments more efficiently.
Hand gesture applications require the user to undergo training to be an expert at
understanding and employing the mapping of different gestures (Yasen, M., and Jusoh, S.,
2019). There are countless numbers of combinations of hand gestures; therefore, for each
particular application, a diverse group of gestures is used to perform its functions.
The PC can recognize different users. It can also detect the other environmental factors
affecting its surrounding. Hand gesture recognition is a considered perceptual computing user
interface used in HCI to provide the computers with the capability to interpret and capture hand
gestures and execute commands according to the understanding made for a particular gesture.
(Panwar, M., and Mehra, P. S., 2011).
Hand gesture recognition requires steps to accomplish it that vary based on the desired
application from simple to complex applications. These steps are categorized: first-hand
gesture frame acquisition, followed by hand tracking, then feature extraction, and at the end
classification to reach the detect the gesture.
Hand gesture frame acquisition is to record the human hand gesture and store it on the
computer. Hand tracking is the computer's ability to recognize the hand and separate it from
other items' background in image processing. The extracted features differ from one application
to another (Sharrma, A., Khandelwal, A., Kaur, K., Joshi, S., Upadhyay, R., and Prabhu, S.,
37
2017). In artificial intelligence, machine learning aims to allow the computers to learn without
being pre-programmed to adapt to new input and make decisions according to the trained
model. There are two types of learning; supervised machine learning, in which the algorithms
reflect the gestures that have been learned in advance in the training phase to new gestures, and
unsupervised machine learning, in which the algorithms draw inferences from the gestures.
Classification aims to build a model to classify new hand gestures based on previous training
gestures.
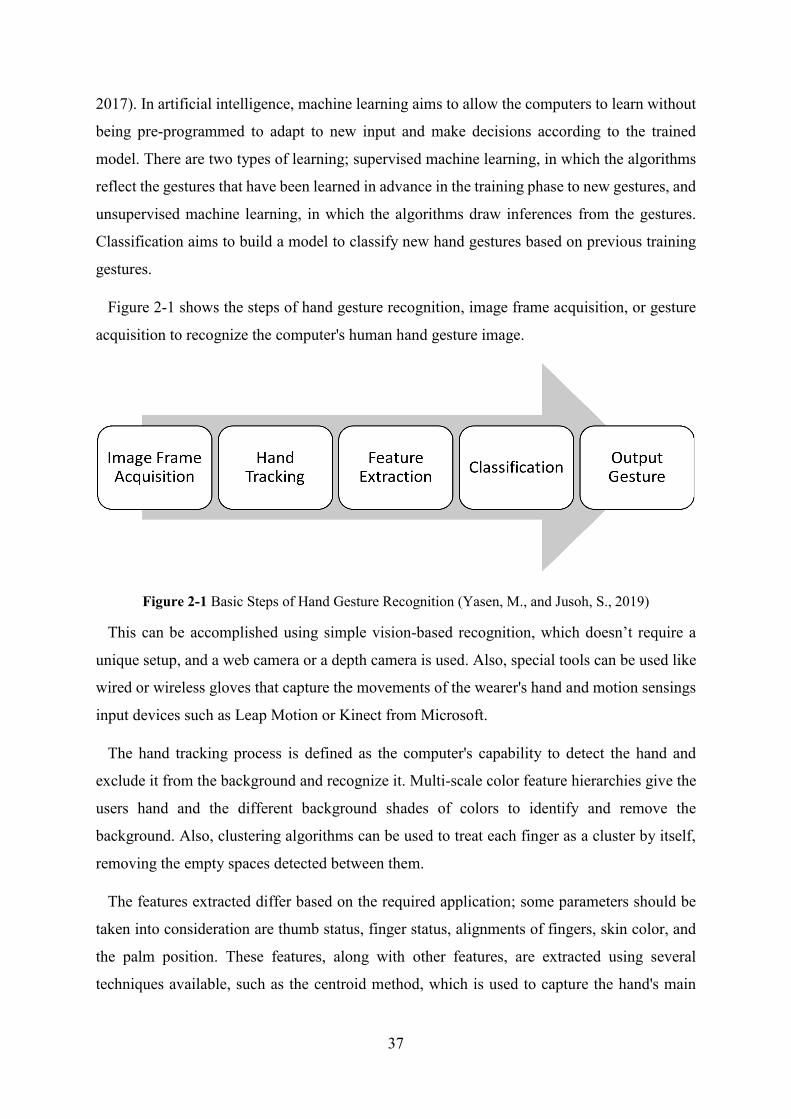
Figure 2-1 shows the steps of hand gesture recognition, image frame acquisition, or gesture
acquisition to recognize the computer's human hand gesture image.
Figure 2-1 Basic Steps of Hand Gesture Recognition (Yasen, M., and Jusoh, S., 2019)
This can be accomplished using simple vision-based recognition, which doesn’t require a
unique setup, and a web camera or a depth camera is used. Also, special tools can be used like
wired or wireless gloves that capture the movements of the wearer's hand and motion sensings
input devices such as Leap Motion or Kinect from Microsoft.
The hand tracking process is defined as the computer's capability to detect the hand and
exclude it from the background and recognize it. Multi-scale color feature hierarchies give the
users hand and the different background shades of colors to identify and remove the
background. Also, clustering algorithms can be used to treat each finger as a cluster by itself,
removing the empty spaces detected between them.
The features extracted differ based on the required application; some parameters should be
taken into consideration are thumb status, finger status, alignments of fingers, skin color, and
the palm position. These features, along with other features, are extracted using several
techniques available, such as the centroid method, which is used to capture the hand's main

38
structure, or the Fourier descriptor method, which captures the palm, the fingers, and the
fingertips (Matsumoto, Y., and Zelinsky, A., 2000).
The extracted features are input to training and testing the classification algorithm (such as),
K-nearest neighbor (KNN), Artificial Neural Networks (ANN), Support Vector Machine
(SVM), Naive Bayes (NB)) to detect the output gesture.
• Gesture Acquisition Systems
Several hand acquisition systems have been proposed aiming to detect hand gestures. The work
in (Gunawardane, P. D. S. H., and Medagedara, N. T., 2017) compared to the Leap Motion
Controller's use to track the human hand's motion with a data glove using flex sensors,
gyroscopes, and vision data. The results showed that the Leap Motion Controller had high
potential and high repeatability for soft finger type applications. Researches showed that the
Leap Motion controller is used to detected gestures (Pramunanto, E., Sumpeno, S., and
Legowo, R. S., 2017) (Canavan, S., Keyes, W., Mccormick, R., Kunnumpurath, J., Hoelzel,
T., and Yin, L., 2017).
Siji Rani et al. (Rani, S. S., Dhrisya, K. J., and Ahalyadas, M., 2017) used a new Hand Gesture
Control in the Augmented Reality System (HGCARS). A secondary camera is used in gesture
recognition, and the reality is recorded using an Internet Protocol (IP) camera. The video
obtained from the IP camera is fed with a virtual object and controlled using the position and
depth of hand, measured using a webcam.
Hafiz et al. (2017) (H. M. Abdul-Rashid, L. Kiran, M. D. Mirrani and M. N. Maraaj, 2017)
proposed a CMSWVHG (Control MS Windows via hand Gesture). An internal or external
camera is used for taking input instead of a mouse by performing numerous windows actions
using hand gestures. This system controls OS on the projected screen for a virtual mouse
system without the hardware requirement rather than a camera.
A wearable hand gesture recognition system in real-time, which receives data from surface
electromyography (sEMG) has been extensively used in hand gesture recognition system by
most of the researchers within the last three years (J. Zhao, J. Mao, G. Wang, H. Yang and B.
Zhao, 2017) (Yang, J., Pan, J., and Li, J., 2017) (Redrovan, D. V., and Kim, D., 2018) (Lian,
K. Y., Chiu, C. C., Hong, Y. J., and Sung, W. T., 2017) (Tomczyński, J., Mańkowski, T., &
Kaczmarek, P., 2017). The commercial wearable sEMG wristband, which is placed in the
forearm of a human, has been used extensively for real-time hand gestures recognition systems

39
(M. E. Benalcázar, A. G. Jaramillo, Jonathan, A. Zea, A. Páez and V. H. Andaluz, 2017)
(Krishnan, K. S., Saha, A., Ramachandran, S., and Kumar, S., 2017). It achieved high accuracy
in hand gestures recognition-based systems (Sapienza, 2018).
• Features Extraction Techniques for Gestures Recognition System
Generally, the feature extraction and pattern recognition stages are crucial for the gesture
recognition systems to capture gestures well. In the feature extraction stage (Liu, J.; Zhou, P.,
2013), the eigenvalues and the feature vectors for each sEMG sample are selected for
classifying the gestures. This procedure can be achieved using several approaches, such as
time-domain, frequency-domain, and time–frequency-domain features. Li et al. (Li, X., Fu, J.,
Xiong, L., Shi, Y., Davoodi, R., and Li, Y., 2015, September) combined force prediction with
finger motion recognition, which the time domain and autoregressive methods were both used
to extract features along with a principal component analysis (PCA) approach, was used for
further dimensionality reduction. Khezri et al. (Khezri, M., and Jahed, M., 2007) proposed a
system based on the adaptive neuro-fuzzy inference system to recognize six hand gestures. For
the feature extractions, the time and frequency domains, and their combination were used to
extract eigenvectors, and the system provided a recognition rate of 92%.
Similarly, Chu et al. (Chu, J. U., Moon, I., and Mun, M. S., 2006) used a wavelet packet
transform to extract the feature vectors, and then a dimensional reduction was performed using
the PCA algorithm. The results show that the eigenvector extraction procedure has more impact
on recognition accuracy than the classifiers' ability. Huang et al. (Huang, Y., Englehart, K. B.,
Hudgins, B., & Chan, A. D., 2005) proposed a system for multi-limb movements using the
Gaussian mixture model (GMM). The obtained results indicated that the GMM algorithm has
a reasonable classification recognition rate at a low computational cost. Noce et al. (Noce, E.,
Bellingegni, A. D., Ciancio, A. L., Sacchetti, R., Davalli, A., Guglielmelli, E., and Zollo, L.,
(2019)) introduced a new approach for neural control of hand prostheses. This approach is
based on pattern recognition applied to the envelope of neural signals. In this approach, sEMG
signals were simultaneously recorded from one human amputee, and the envelope of the sEMG
signals was computed. The results obtained in this study showed that well-known techniques
of sEMG pattern recognition could be used to process the neural signal and pave the way to
applying neural gesture decoding in upper limb prosthetics. Shi et al. (Shi, W. T., Lyu, Z. J.,
Tang, S. T., Chia, T. L., and Yang, C. Y., 2018) proposed a bionic hand controlled by hand
gestures, while the gestures were recognized based on surface EMG signals. The proposed
40
approach was based on extracting multiple features, such as absolute value, zero crossings,
slope sign change, and waveform length. The results show that the KNN classifier was able to
recognize four different hand postures.
• Classifiers for sEMG Gestures Recognition System
The classifier plays an essential role in the pattern recognition block. The features extracted
(such as Artificial Neural Networks (ANN), K-nearest neighbor (KNN), Naive Bayes (NB),
Support Vector Machine (SVM)) to be able to classify the gestures.
Chun-Jen et al. (C. Tsai, Y. Tsai, S. Hsu, and Y. Wu,, 2017) proposed a 3D hand gesture
identification using a synthetically-trained neural network. The training phase of a deep-
learning neural network required a large amount of training data. Chenyang, Xin et al. (C. Li,
X. Zhang and L. Jin, 2017) proposed using the LPSNet, an end-to-end deep neural network for
hand gesture recognition with novel log path signature features. Some researchers depend on
deep neural networks for hand gestures classification.
Sungho et al. (Shin, S., and Sung, W., 2016) developed two techniques for dynamic hand
gesture recognition applying low complexity recurrent neural network (RNN) algorithms
utilizing wearable devices, the first approach is based on video signal using convolutional
neural network (CNN) with RNN for classification, and the other system utilizing
accelerometer data and applied RNN for classification. Also, Xinghao et al. (Chen, X., Guo,
H., Wang, G., and Zhang, L., 2017) used a bidirectional recurrent neural network (RNN) with
the skeleton sequence to augment the motion features for RNN.
Aditya et al. (Aditya T, Bertram T, Frederic G, and Didier S., 2017) tried to enhance the
gesture detection rate by correcting the probability estimate of a Long-Short-Term Memory
(LSTM) network by pose prediction performed by CNN. They applied Principal Component
Analysis (PCA) as a training procedure to reduce the dimensionality of the labeled data of hand
pose classification to improve CNN's initialization of weights.
Support vector machine (SVM) was used for classification in hand gestures recognition
system (Zhu, Y., Jiang, S., and Shull, P. B., 2018) (Sugiura, Y., Nakamura, F., Kawai, W.,
Kikuchi, T., & Sugimoto, M., 2017) (R. A. Bhuiyan, A. K. Tushar, A. Ashiquzzaman, J. Shin
and M. R. Islam, 2017) (Tian, Z., Wang, J., Yang, X., and Zhou, M., 2018). Jian et al. (J. Zhao,
41
J. Mao, G. Wang, H. Yang and B. Zhao, 2017) recognized the pattern of hand gestures using a
modified deep forest algorithm.
In the research conducted by Jinxing, Jianhong et al. (Yang, J., Pan, J., and Li, J., 2017), the
hand gesture was modeled and decomposed using Gaussian Mixture Model-Hidden Markov
Models (GMMHMM); GMMs are used as sub-states of HMMs to decode the sEMG feature of
gesture.
Whereas Marco et al. (Benalcázar, M. E., Jaramillo, A. G., Zea, A., Páez, A., and Andaluz,
V. H., 2017) used the dynamic time warping algorithm along with the k-nearest neighbor rule
together for the classification. Naive Bayes is applied as the training method for classification
(Pramunanto, E., Sumpeno, S., and Legowo, R. S., 2017). Multiple linear discriminant analysis
(LDA) classifier was adopted to classify different hand gestures (Bulugu, I., Ye, Z., and Banzi,
J., 2017).
2.2.2 Review of 3D printed Bionic Arm
3D printing of upper limb prostheses has been significantly developed over the last five years.
All over the world, people customize the designs and printing new devices that can easily fit
an amputee's arm. Several kinds of research have been published in 3D-printed upper-limb
prostheses (Gretsch, K. F., Lather, H. D., Peddada, K. V., Deeken, C. R., Wall, L. B., and
Goldfarb, C. A., 2016) (O’Neill C., 2014).
The cost of a commercial body-powered prosthetic hand ranges from $4000 to $10,000
(Resnik, L., Meucci, M. R., Lieberman-Klinger, S., Fantini, C., Kelty, D. L., Disla, R., and
Sasson, N., 2012) while the cost of an externally powered prosthetic hand can range from
$25,000 to $75,000 (van der Riet, D., Stopforth, R., Bright, G., and Diegel, O., 2013). The
development of a 3D-printed hand prosthesis aimed to offer an affordable low-cost commercial
prosthesis for people who cannot afford an expensive prosthesis.
3D-printing is categorized as an additive manufacturing technique. The products are built up
layer by layer, which is different from other manufacturing processes based on removing
material from a large piece of material, such as in Computer Numerically Controlled (CNC)
milling. 3D-printing has several benefits in comparison with other manufacturing techniques
(Doubrovski Z, Verlinden JC, and Geraedts JMP., 2011):
• No assembly is required since it is possible to build up products out of one part.

42
• With the flexibility in the design, therefore, highly complex geometries can be made.
• The designs can be modified and personalized; there is no need to change the machine.
• Parts can be produced quickly and easily from conceptual design to the final product,
giving rapid prototyping and design improvements.
Different specifications of the fingers' prostheses and mechanical specifications should be
encountered in the design of the upper limb prostheses, weight, function, actuation,
comfortability, and cost. Some examples of the 3D-printed upper limb prostheses are shown in
Figure 2-2. These can be categorized as three different levels of prostheses: Upper arm, the
amputation level is above the elbow, Forearm, the amputation level is below the elbow and
Hand, the amputation level is a partial hand.The various types of actuation for the different
types of prostheses. Most of the prostheses for people with partial hand amputation are body-
powered. There are four actuation techniques for forearm prostheses: two are passive static,
one is passively adjustable, are body-powered and externally powered. There are two
categories for externally powered prostheses: electrically powered arms and one is powered by
pressurized air. All the upper arm prostheses are externally powered, and all are electrically
powered.
The prosthetics arm's weight is one of the most critical factors that affect the device's comfort
level. The weight is the point that led to the use of the 3d printing technology in the bionic arm.
The most massive device is the Roboarm developed by Unlimited Tomorrow (Roboarm, 2015),
with a weight of 2000 g. Most of the bionic hand's weight ranging from 240 g to 450 g.
All the active hands are categorized as underactuated, which means that they have more
Degree of Freedom (DOF)’s than the number of actuators. This is because of the coupling of
the phalanges in the fingers. Most of the body-powered prostheses' fingers are composed of
three phalanges that are coupled to each other through cables or cords. The wires from all the
separate fingers are attached to one linkage, which guarantees that all the fingers move
synchronically. For externally powered prostheses, the phalanges are coupled to each other
with cables or mechanical connections and are directly connected to electric motors. The
motors control the fingers separately.
An adaptive grip is the fingers' ability to hold the object within the hand and conform to that
object's shape. In this case, the force is distributed among the fingers, which guarantees that
some fingers can still apply a force when an item halts the other fingers.

43
Figure 2-2 Models of 3D printed upper limb (Jelle ten Kate, Gerwin Smit & Paul Breedveld, 2017) (a)
Andrianesis’ Hand: an externally powered forearm prosthesis,(b) Body-powered hand prosthesis, (c)
Scand: a passive adjustable forearm prosthesis,(d) IVIANA 2.0: a passive forearm prosthesis, (e) Adams
Arm: EMG controlled Bionic Arm
The precision grip and power grip are the two basic grasps a human use (Napier, J. R., 1956).
Moreover, these basic grasps, there are four other standard methods of holds used to perform
daily living (ADLs). These four types are the hook grip, spherical grip, tripod grip, and lateral
grip (Weir, R., and Sensinger, J., 2003).
The prices from only a small number of hands are known. These prices are based on material
costs, which range to a maximum of $100. These costs can’t be compared with commercially
available non-3D-printed upper limb prostheses since these prices consist of more than only
44
the material costs. Two well-known companies are selling prosthesis as a commercial product.
Youbionic (Youbionic [Internet], [cited 2015 Jun 29]) sells its bionic arm for $1000 and Open
Bionics (Latest Bionic arm [Internet], cited 2015 Jun 24), aiming for a price of $3000 for their
latest developed Bionic Arm. These hands are both myoelectric controlled hands, which are
controlled by muscle activities. There is a vast difference in prices with the commercially
available myoelectric hands priced at $25,000 to $75,000. The development of cheap hand
prostheses can especially be a significant benefit for child prostheses. Children with amputation
need to change their hand prosthesis faster due to their growth by nature. By 3D-printing a
cheap prosthesis every time, there is no need to buy an expensive prosthesis regularly. A
prosthesis can be scaled to match the right size and 3D-printed easily.
2.3 State of the Art of EMG biometrics system
The properties of biometric systems mainly depend on the specific traits they use. Fingerprint,
iris or retina, and facial features are the three most common biometric traits (Kaur, G., Singh,
G., and Kumar, V., 2014). Systems based on these modalities have already been widely used
in our daily lives, such as mobile phones, laptops, and smart pads. These traits need to be
exposed during recognition, providing the chance to be captured, and then spoofing might
happen.
Although biometric technology has seen significant advances, some biometric systems fail
to meet security and robustness requirements in specific real-world situations. By way of an
example, the susceptibility to spoofing—persons who pretend to be others to obtain illegal
access to private information or services (Abdenour Hadid, Nicholas Evans, Sébastien Marcel,
and Julian Fierrez, 2015) (Evans, 2019) (Pinto, J. R., Cardoso, J. S., and Lourenço, A., 2018).
The study and prevention of spoofing are considered an active area of research and
development.
As wearable devices utilizing sEMG can capture the human muscles' detailed characteristics
and is thus useful in human gesture recognition applications. The information extracted from
sEMG signals obtained via a human arm is sufficient for classifying intended hand gestures
(Saponas, T.m Tan, S., Morris, D., and Balakrishnan, R, 2008). This work's primary objective
is to demonstrate the utilization of the sEMG multi-channel wearable armband in verifying
individuals' identity with the application of Machine learning algorithms.
45
Recently, there has been a growing interest in using electrical bio-signals as biometric traits,
such as electroencephalogram (EEG), electrocardiogram (ECG). The demonstration of
electrical activities related to the heart and brain (Gui, Q., Ruiz-Blondet, M. V., Laszlo, S., and
Jin, Z., 2019). The hidden nature of electrical bio-signals makes them harder to capture than
the three common modalities mentioned, synthesize, and imitate, and the inherent liveness
nature ensures their robustness in distinguishing the artifacts from the real biological targets.
Moreover, compared to extensive studies done on EEG and ECG, little attention was paid to
the application of sEMG in biometrics.
Surface electromyogram signals (sEMG) are used as a bio-signal in hand and wrist gesture
recognition (Englehart, K., and Hudgins, B., 2003). However, the high performance of gesture
recognition systems is limited to the condition that the training and testing data are acquired
from the same user. It is concluded that even with the same settings, the control performance
would drop significantly when a classifier was trained by the data from one user and used to
predict the gestures from a different individual. This is due to the existence of some differences
in sEMG features (Matsubara, T., and Morimoto, J., 2013). This small difference makes it
harder to establish calibration-free sEMG-based gesture recognition. Interestingly, such
differences also suggest the possibility of sEMG signals as a potential biometric trait.
sEMG signals have a hidden nature, and it is working correctly in live gesture detection.
Also, the high performance of sEMG signals reached when applied in gesture recognition gives
an advantage of sEMG as a biometrics modality versus EEG and ECG: the user can set their
actions based on different wrist and hand combinations gestures to form a password. In this
case, the system can provide two levels of protection, physiology-based and knowledge-based,
appealing for high-level security targeted applications.
Some researches based on the ECG/EMG sensors fusion to verify the users (Faragó, P.,
Groza, R., Ivanciu, L., and Hintea, S., 2019). Belgacem et al. (Belgacem, N., Fournier, R., Nait-
Ali, A., and Bereksi-Reguig, F., 2015) studied the usefulness of a biometric system utilizing
information obtained via ECG and EMG physiological data. A non-intrusive one-lead ECG
setup was adapted into the palm of the user to collect ECG biometric data. Subsequently, the
authors used Fourier descriptors for feature extraction. Finally, an optimum-path forest
classifier was used to distinguish between individuals.
Siho Shin et al. (Shin, S., Jung, J., & Kim, Y. T., 2017) proposed a non-contact secure private
verification based on EMG signals. A total of fifty signals were extracted from the arm of
46
subjects with a two-channel electrode system's assistance. A set of metrics, such as the mean,
length, variation, zero crossings, and median frequency, were extracted from the signals to
enhance the identification rate and formulate a machine learning algorithm. The artificial
Neural Network (ANN) algorithm showed a relatively high accuracy of 81.6%. Holi et al.
(Krishnamohan, P. G., and Holi, M. S., 2011) used vector quantization and the Gaussian
mixture model to obtain the EMG signals for biometric applications. The identification rate of
97.9% was achieved, with an average of 73.33% obtained from 49 individuals. The experiment
demonstrated that EMG signals alone could produce user distinguishable biometric data. Al-
Mulla et al. (Al-Mulla, M. R., and Sepulveda, F., 2014) presented a novel Pseudo-Wavelet
function for MMG signal extraction during dynamic fatiguing contractions. 8-electrode bio-
impedance analysis (BIA) wrist band has been used to measure to identify users. The success
rate with BIA was 85%, and by adding circumference with 1mm accuracy, they pulled up the
result to 90%. Hisaaki Yamaba et al. (Yamaba, H., Kurogi, A., Kubota, S. I., Katayama, T.,
Park, M., and Okazaki, N., 2017) presented a method that uses a list of gestures as a password
for EMG user's verification system for mobile phone access. Fourier transform has been used
to extract the features from the EMG signals. James Cannan et al. (Cannan, J., and Hu, H.,
2013) presented a method for enhancing EMG usability based on identifying a user.
Experiments were performed to identify small group sizes of 4, 10, and 19. The results show
average identification accuracies across all 11 gestures of 55.32%, 75.44%, and 90.32% for
groups of 19,10 and 4 subjects, respectively. Ryohei Shioji et al. (Shioji, R., Ito, S. I., Ito, M.,
and Fukumi, M., 2017) used eight dry sensors to measure EMG from the wrist and carry out
personal verification approach. A convolutional neural network (CNN) is used in the learning
phase for verification. Data collected from 8 individuals, 40 data for everyone. The average
accuracy of the two-class separation was 94.9 % by CNN.
Development and optimization of the sEMG feature extractions and classification for the
control of prostheses and biometrics applications is today an active research topic, even though
the analysis is mainly performed from a machine learning perspective (Benatti, S., Milosevic,
B., Farella, E., Gruppioni, E., and Benini, L., 2017) (Englehart, K., and Hudgins, B., 2003)
(Englehart, K., Hudgins, B., Parker, P. A., and Stevenson, M., 1999). The feature extraction
phase transforms the raw signal data into a valuable data structure by removing noise and
detecting the crucial data. There are three divisions of features essential in the processing of an
EMG based control system. These features might be in the time domain, frequency domain,
and the time-frequency domain (Zecca, M., Micera, S., Carrozza, M. C., and Dario, P., 2002).
47
Steps in analyzing the EMG signals have been presented by Sakshi Sharma et al. (Sharma, S.,
Farooq, H., and Chahal, N., 2016). Initially, the surface EMG signal is captured from the
subject’s forearm using a discrete wavelet transform. Then, the singular value decomposition
is used for feature extraction.
Moreover, classifiers based on fuzzy-logic are used to recognize various hand gestures in the
context of linguistic terms. Zainal Arief et al. (Arief, Z., Sulistijono, I. A., and Ardiansyah, R.
A., 2015) used Myo armband with eight channels electromyography (EMG) located on forearm
muscles and extracted five different features to obtain significant differences in hand gestures.
The time-series features extraction that evaluated are Mean Absolute Value (MAV), Variance
(VAR), Willison Amplitude (WAMP), Waveform Length (WL), and Zero Crossing (ZC).
MAV and WL are found to be giving a better recognition rate. Chantaf et al. (S. Chantaf, A.
Naït-Ali, P. Karasinski, and M. Khalil, 2010) captured EMG signals from the BIOPAC system.
Then, seven frequency domain features (e.g., average frequency, kurtosis, median frequency)
are extracted and classified using a Radial Basis Function (RBF) network. The system accuracy
estimated was 80%. Yamaba et al. presented a method that is based on a list of gestures as a
pass-gesture (i.e., password). They manifested that the same gestures obtained from the same
person are similar in behavior, but they are different from those of other persons (Yamaba, H.,
Kurogi, T., Aburada, K., Kubota, S. I., Katayama, T., Park, M., and Okazaki, N., 2018). To
identify pass-gestures, four time-domain features were extracted, a maximum and minimum
value of raw s-EMG and their associated time t-min and t-max. SVM classifier is used in the
classification of each subject, which were trained under these four features, and cross-
validation was carried out using the same raw data.
2.4 Conclusion
The research on the applications of wearable technologies in the biomedical field and
biometrics field has been increased over the last decades. The research in bionic arms
controlled by arm gestures is of great importance. The gesture recognition system can be
accomplished in several ways, vision-based systems, wearable gloves, and sEMG signals. The
control of the bionic arm using gesture recognition system based on sEMG signal needs
specific steps database of sEMG signals represents arm gestures, followed by signal
preprocessing, features extraction, then the classification of signals using machine learning
approaches. Several researches showed that the different sEMG signals acquisition varies from
single-channel to multi-channel. The database is different from one research to another

48
research. The research showed different machine learning classifiers in sEMG gesture
recognition systems such as KNN, SVM, ANN, and DT.
3D printing technology offers significant advantages in manufacturing complex shapes,
prototyping is easy with 3-D printing, and the flexibility of change the design and reproduce
the parts is a way more efficienct when using 3-D printing techniques. The prices of producing
parts with 3D printing technology decrease the cost of manufacturing the parts and ease the
processes. All these advantages are utilized in the production of bionic arms and hands. The
3D printed hands and arms are equipped with actuators to be able to perform grasping actions.
Small-scaled sensors and actuators are essential in the advancement of bionics.
The thesis proposes a detailed design of a 3-D printed bionic arm with an artificial hand. The
bionic arm is implemented and tested on an amputee case. According to the state-of-the-art
systems, a gesture recognition based on sEMG signals has been implemented. A database of
sEMG was created for generic control of a bionic arm. 3-D printing technology offered an
affordable price solution. Real-time testing of a bionic arm with a gesture recognition system
is presented. Machine learning classifiers are tested, and results are compared to find the
optimum algorithm to be used with sEMG data.
The biosignals are introduced as biometrics identities in research. In this work, the sEMG
signals are studied as a biometrics identity for user verification. The sEMG signals have a
hidden nature, which can be treated as hidden biometrics. In the review on sEMG biometrics
system review, different sEMG systems have been applied, such as the single-channel and
multi-channel. The researchers tested the system on limited users for verification purposes.
Several machine learning have been presented in the researches about sEMG signals as
biometrics traits. The research presented in this works proposes a biometrics system for
verification and identification of the users. The biometric device used to acquire the sEMG
signal is a wearable multi-channel armband consisting of 8 electrodes. Multiple users
volunteered to test the biometric system. Different classifiers have been applied to optimize the
system's results. The system will grant/deny access to the user from the captured sEMG
biometrics identity as a signature-based hand gesture. Performance analysis of the biometrics
system has been presented to validate the system's capacity by estimating both the false
acceptance rate (FAR) and the false rejection rate (FRR).
49
3 Chapter 3 Design and Implementation of a 3-D
Printed Bionic Arm Controlled by Machine
Learning Based Algorithm
Chapter Content
3.1 Introduction ............................................................................................................... 51
3.2 Bionic Arm ................................................................................................................ 52
3.2.1 Methodology ...................................................................................................... 52
3.2.2 Acquisition of sEMG signal............................................................................... 53
3.2.3 Bionic Arm Mechanical Design ......................................................................... 54
3.2.4 Electronics and Control...................................................................................... 59
3.3 Feature Extraction and Classification ....................................................................... 61
3.3.1 Data Collection Protocol .................................................................................... 61
3.3.2 Data Processing .................................................................................................. 62
3.3.3 Features Extraction ............................................................................................ 63
3.3.4 Classification...................................................................................................... 64
3.4 Results ....................................................................................................................... 66
3.5 Real-time Implementation ......................................................................................... 68
3.6 Conclusion ................................................................................................................. 70
Summary: In this chapter, a customizable wearable 3D printed bionic arm is designed, fabricated, and
optimized for a right arm amputee. An experimental test has been conducted for the user, where control
of the artificial bionic hand is accomplished using surface electromyography (sEMG) signals acquired
by the multi-channel wearable armband. The 3D printed bionic arm was designed for low cost and
lightweight. sEMG signals are collected from different participants to control the hand by gestures. In
this study, several classifiers based on neural networks, support vector machine, and decision trees
were constructed, trained, and statistically compared. Real-time testing of the bionic arm with the
optimum classifier is demonstrated to show the system's robustness.
50
It starts with introducing the system and shows the specific user condition that the arm is customized to
his amputation case in section 3.1. The detailed mechanical design of the bionic arm, the EMG database
creation, and the electronic and control implemented are explained in section 3.2. section 3.3. describes
feature extraction of the EMG signal for gesture recognition and the signals' classification. The
classifier's testing results and the results of the tests conducted on the bionic arm are stated in section
3.4.

51
3.1 Introduction
Research into advanced medical and prosthetic devices has generated significant attention in
recent years due to the increasing demand for reliable bionic hands capable of manifesting
patients' intentions to perform various tasks. In general, gesture recognition techniques have
emerged as a key enabling feature for improving both the accuracy and functionality of bionic
hands, allowing the patient control over delicate operations in dangerous situations, or to help
patients with movement disorders and disabilities, as well as in the rehabilitation training
process.
The use of bionic hands is not only limited to medical use but has also found numerous
applications in industrial settings; artificial bionic hands can perform certain tasks in hazardous
or restricted environments while maintaining the user’s level of dexterity and natural response
time. Under such circumstances, vision-based gesture recognition using image detection could
be enough to provide the correct hand motion. (Ben-Arie, J., Wang, Z.; Pandit, P., and Rajaram,
S., 2002) (Kapoor, A., and Picard, R. W., 2001) (Morency, L. P., Sidner, C., Lee, C., and
Darrell, T., 2005) (Matsumoto, Y., and Zelinsky, A., 2000)
Recently, wearable devices based on sEMG have become quite attractive in the human
gesture recognition domains, as these devices are used to capture the characteristics of the
muscles. In general, the sEMG signals obtained from a human arm contain enough information
concerning the intended and performed hand gestures (Saponas, T.m Tan, S., Morris, D., and
Balakrishnan, R, 2008). Wheeler et al. (Wheeler, K. R., Chang, M. H., and Knuth, K. H., 2006)
introduced a gesture-based control system utilizing sEMG signals taken from a forearm, where
the proposed systems were successfully able to act as a joystick movement for virtual devices.
Furthermore, Saponas et al. (Saponas, T.m Tan, S., Morris, D., and Balakrishnan, R, 2008)
proposed a technique based on ten sEMG sensors worn in a narrow band around the upper
forearm to separate finger presses' position and pressure.
In this chapter, a customizable wearable 3D-printed bionic arm is designed, fabricated, and
optimized for a right arm amputee. An experimental test has been conducted for the user, where
control of the artificial bionic hand is accomplished successfully using sEMG signals acquired
by a multi-channel wearable armband. The 3D-printed bionic arm was designed for the low
cost and light-weight. To facilitate a generic control of the bionic arm, sEMG data were
collected for a set of gestures (fist, spread fingers, wave-in, wave-out) from twenty-three
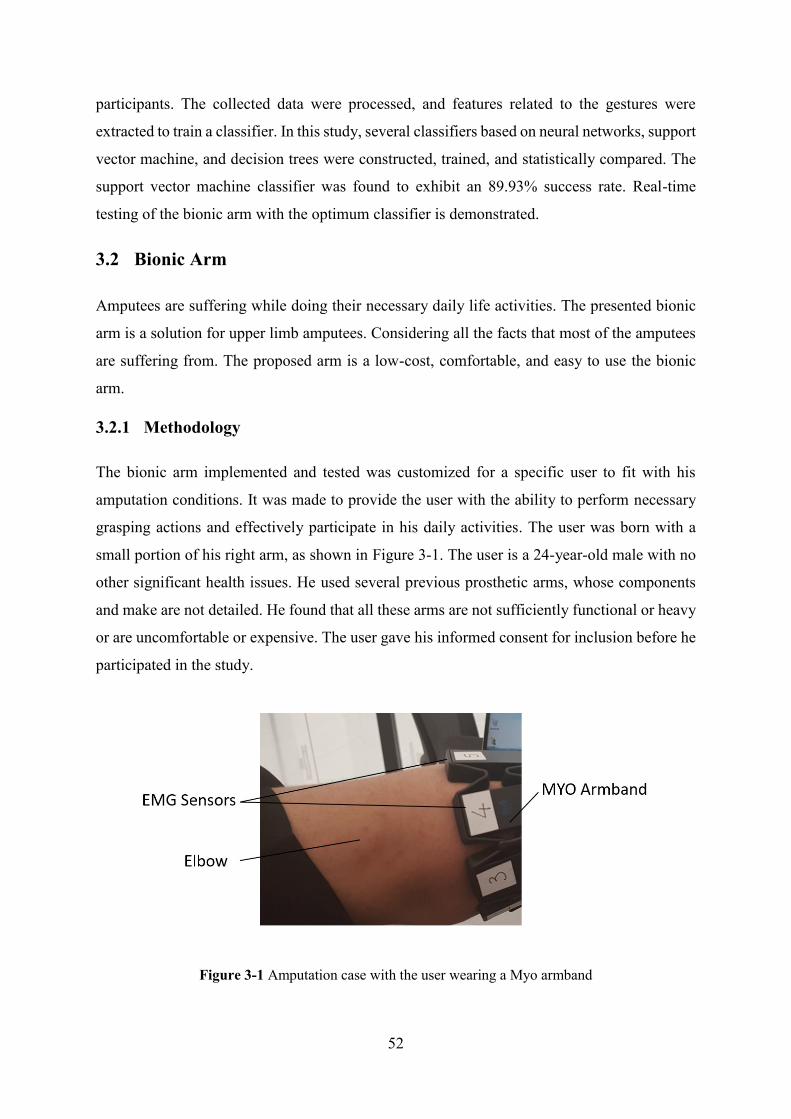
52
participants. The collected data were processed, and features related to the gestures were
extracted to train a classifier. In this study, several classifiers based on neural networks, support
vector machine, and decision trees were constructed, trained, and statistically compared. The
support vector machine classifier was found to exhibit an 89.93% success rate. Real-time
testing of the bionic arm with the optimum classifier is demonstrated.
3.2 Bionic Arm
Amputees are suffering while doing their necessary daily life activities. The presented bionic
arm is a solution for upper limb amputees. Considering all the facts that most of the amputees
are suffering from. The proposed arm is a low-cost, comfortable, and easy to use the bionic
arm.
3.2.1 Methodology
The bionic arm implemented and tested was customized for a specific user to fit with his
amputation conditions. It was made to provide the user with the ability to perform necessary
grasping actions and effectively participate in his daily activities. The user was born with a
small portion of his right arm, as shown in Figure 3-1. The user is a 24-year-old male with no
other significant health issues. He used several previous prosthetic arms, whose components
and make are not detailed. He found that all these arms are not sufficiently functional or heavy
or are uncomfortable or expensive. The user gave his informed consent for inclusion before he
participated in the study.
Figure 3-1 Amputation case with the user wearing a Myo armband
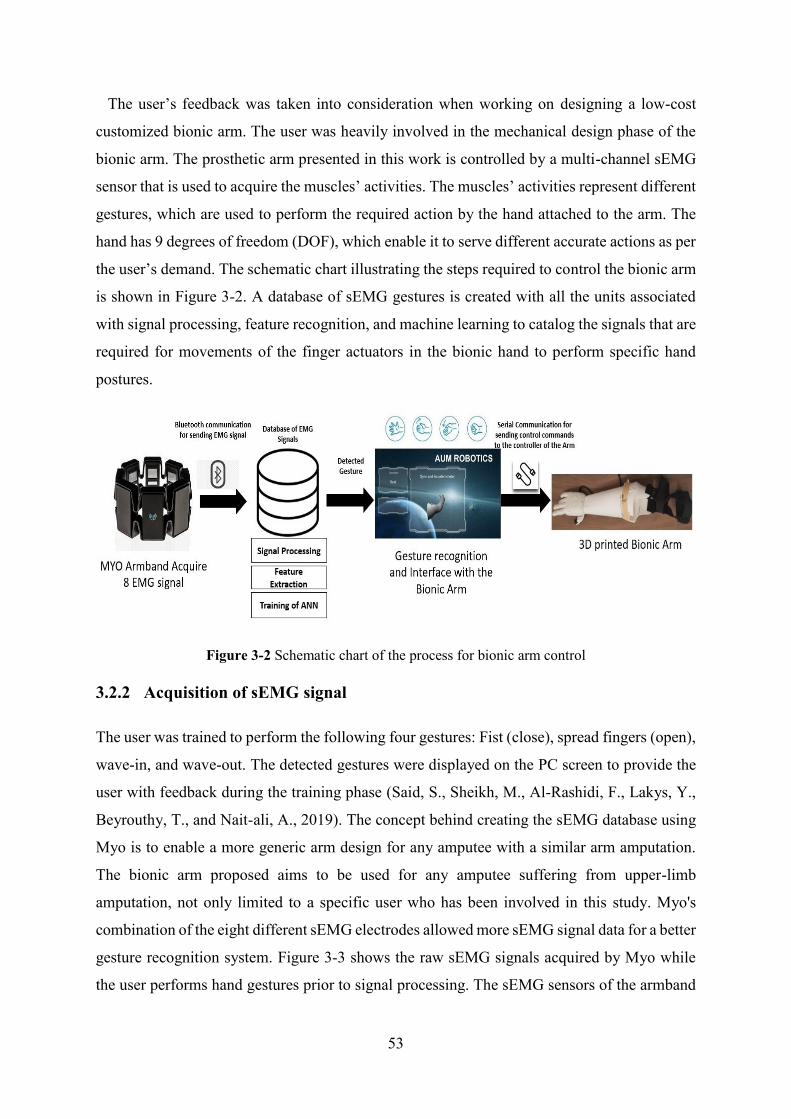
53
The user’s feedback was taken into consideration when working on designing a low-cost
customized bionic arm. The user was heavily involved in the mechanical design phase of the
bionic arm. The prosthetic arm presented in this work is controlled by a multi-channel sEMG
sensor that is used to acquire the muscles’ activities. The muscles’ activities represent different
gestures, which are used to perform the required action by the hand attached to the arm. The
hand has 9 degrees of freedom (DOF), which enable it to serve different accurate actions as per
the user’s demand. The schematic chart illustrating the steps required to control the bionic arm
is shown in Figure 3-2. A database of sEMG gestures is created with all the units associated
with signal processing, feature recognition, and machine learning to catalog the signals that are
required for movements of the finger actuators in the bionic hand to perform specific hand
postures.
Figure 3-2 Schematic chart of the process for bionic arm control
3.2.2 Acquisition of sEMG signal
The user was trained to perform the following four gestures: Fist (close), spread fingers (open),
wave-in, and wave-out. The detected gestures were displayed on the PC screen to provide the
user with feedback during the training phase (Said, S., Sheikh, M., Al-Rashidi, F., Lakys, Y.,
Beyrouthy, T., and Nait-ali, A., 2019). The concept behind creating the sEMG database using
Myo is to enable a more generic arm design for any amputee with a similar arm amputation.
The bionic arm proposed aims to be used for any amputee suffering from upper-limb
amputation, not only limited to a specific user who has been involved in this study. Myo's
combination of the eight different sEMG electrodes allowed more sEMG signal data for a better
gesture recognition system. Figure 3-3 shows the raw sEMG signals acquired by Myo while
the user performs hand gestures prior to signal processing. The sEMG sensors of the armband

54
are numbered from 1 to 8 to be able to match the signals with the muscles. Sensor 3 is placed
in the area least affected by the surrounding muscles.
Figure 3-3 Eight (sEMG) sensors raw data for wave-out hand action
3.2.3 Bionic Arm Mechanical Design
Amputees with limb amputation may be disappointed with aspects of available limbs in the
market due to their limitations. Customized design for the user through a unique design process
has been undertaken here, which has the capacity to target a design that fulfills the need of an
individual amputee case, particularly in terms of its low cost and lightweight. The current
devices are available in the market range from 4000 to 20,000 USD (Zuniga). Some researched
compiled a detailed market analysis of the cost associated with prosthetic limbs. A simple
cosmetic arm and hand may cost between 3000 and 5000 USD. The cost of a functional
prosthetic arm, on the other hand, may cost between 20,000 to 30,000 USD.
The main target is to optimize manufacturing a bionic arm to have an affordable bionic arm
for amputees costing around 295 USD. Nowadays, the advancement of and easy access to 3D-
printing technology has reduced the cost of manufacturing bionic arms and provides more
straightforward solutions for prosthetic arms customized for users. Simultaneously, the
advancement in the materials used in the 3D printing arm products allows a robust design able
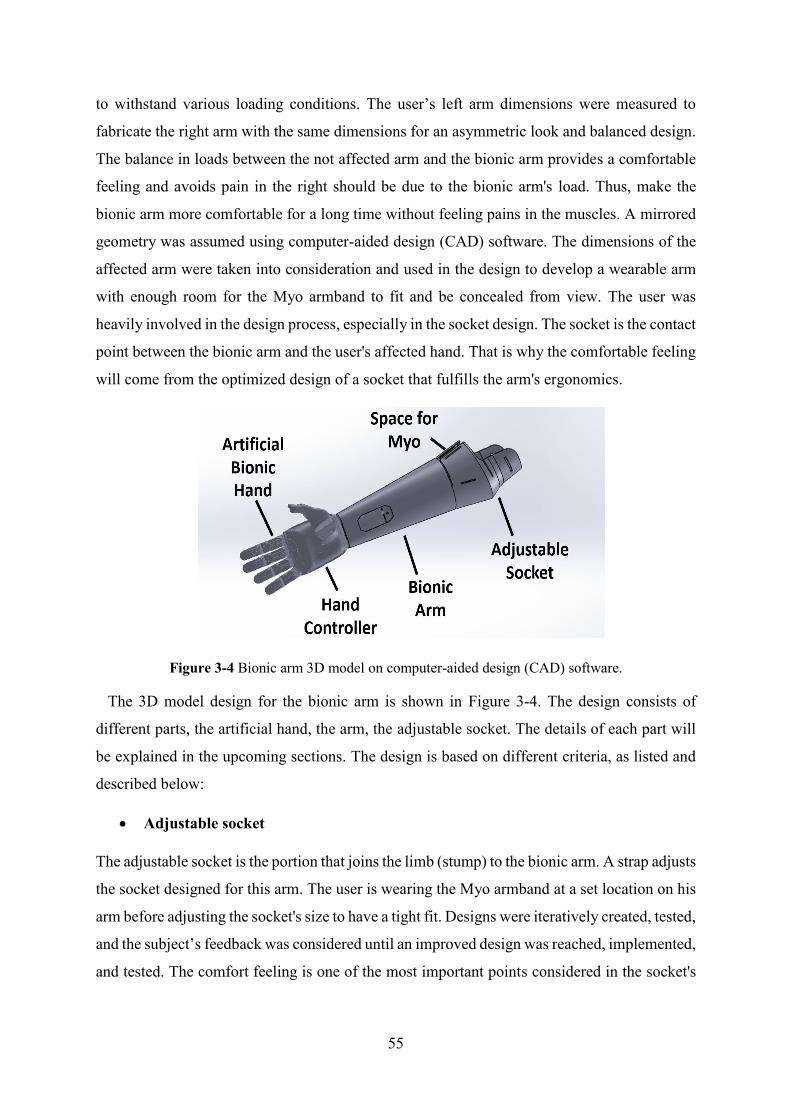
55
to withstand various loading conditions. The user’s left arm dimensions were measured to
fabricate the right arm with the same dimensions for an asymmetric look and balanced design.
The balance in loads between the not affected arm and the bionic arm provides a comfortable
feeling and avoids pain in the right should be due to the bionic arm's load. Thus, make the
bionic arm more comfortable for a long time without feeling pains in the muscles. A mirrored
geometry was assumed using computer-aided design (CAD) software. The dimensions of the
affected arm were taken into consideration and used in the design to develop a wearable arm
with enough room for the Myo armband to fit and be concealed from view. The user was
heavily involved in the design process, especially in the socket design. The socket is the contact
point between the bionic arm and the user's affected hand. That is why the comfortable feeling
will come from the optimized design of a socket that fulfills the arm's ergonomics.
Figure 3-4 Bionic arm 3D model on computer-aided design (CAD) software.
The 3D model design for the bionic arm is shown in Figure 3-4. The design consists of
different parts, the artificial hand, the arm, the adjustable socket. The details of each part will
be explained in the upcoming sections. The design is based on different criteria, as listed and
described below:
• Adjustable socket
The adjustable socket is the portion that joins the limb (stump) to the bionic arm. A strap adjusts
the socket designed for this arm. The user is wearing the Myo armband at a set location on his
arm before adjusting the socket's size to have a tight fit. Designs were iteratively created, tested,
and the subject’s feedback was considered until an improved design was reached, implemented,
and tested. The comfort feeling is one of the most important points considered in the socket's
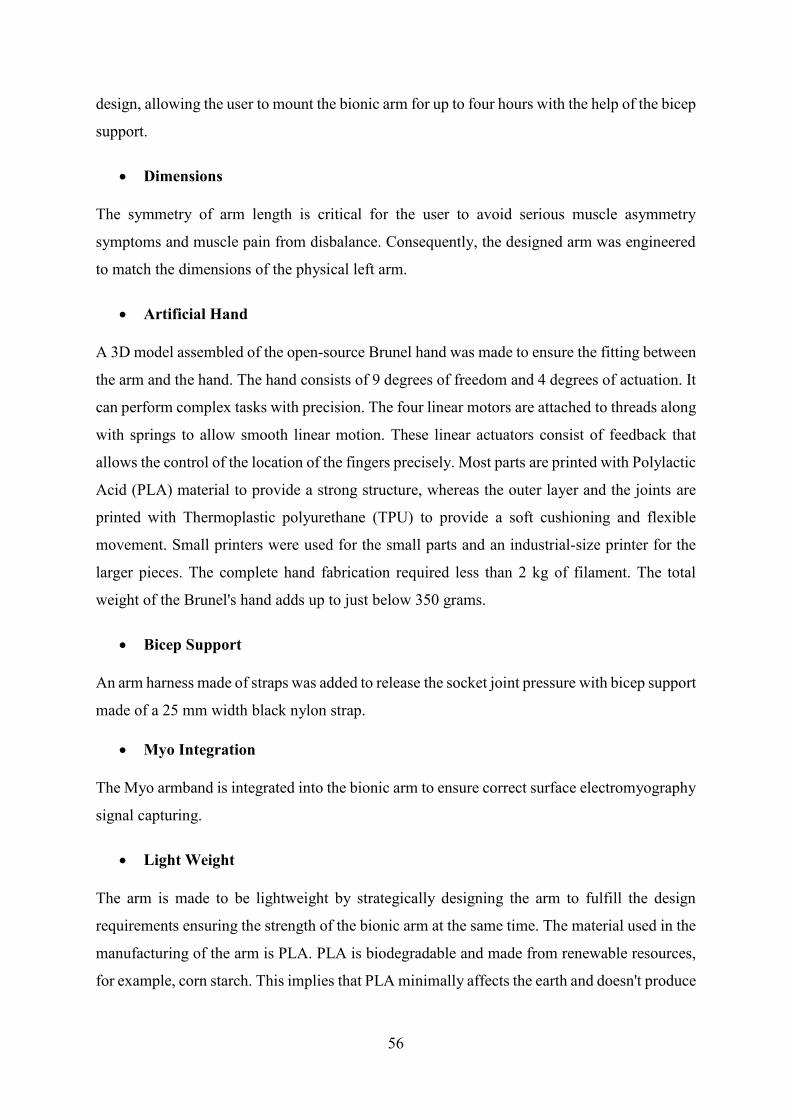
56
design, allowing the user to mount the bionic arm for up to four hours with the help of the bicep
support.
• Dimensions
The symmetry of arm length is critical for the user to avoid serious muscle asymmetry
symptoms and muscle pain from disbalance. Consequently, the designed arm was engineered
to match the dimensions of the physical left arm.
• Artificial Hand
A 3D model assembled of the open-source Brunel hand was made to ensure the fitting between
the arm and the hand. The hand consists of 9 degrees of freedom and 4 degrees of actuation. It
can perform complex tasks with precision. The four linear motors are attached to threads along
with springs to allow smooth linear motion. These linear actuators consist of feedback that
allows the control of the location of the fingers precisely. Most parts are printed with Polylactic
Acid (PLA) material to provide a strong structure, whereas the outer layer and the joints are
printed with Thermoplastic polyurethane (TPU) to provide a soft cushioning and flexible
movement. Small printers were used for the small parts and an industrial-size printer for the
larger pieces. The complete hand fabrication required less than 2 kg of filament. The total
weight of the Brunel's hand adds up to just below 350 grams.
• Bicep Support
An arm harness made of straps was added to release the socket joint pressure with bicep support
made of a 25 mm width black nylon strap.
• Myo Integration
The Myo armband is integrated into the bionic arm to ensure correct surface electromyography
signal capturing.
• Light Weight
The arm is made to be lightweight by strategically designing the arm to fulfill the design
requirements ensuring the strength of the bionic arm at the same time. The material used in the
manufacturing of the arm is PLA. PLA is biodegradable and made from renewable resources,
for example, corn starch. This implies that PLA minimally affects the earth and doesn't produce
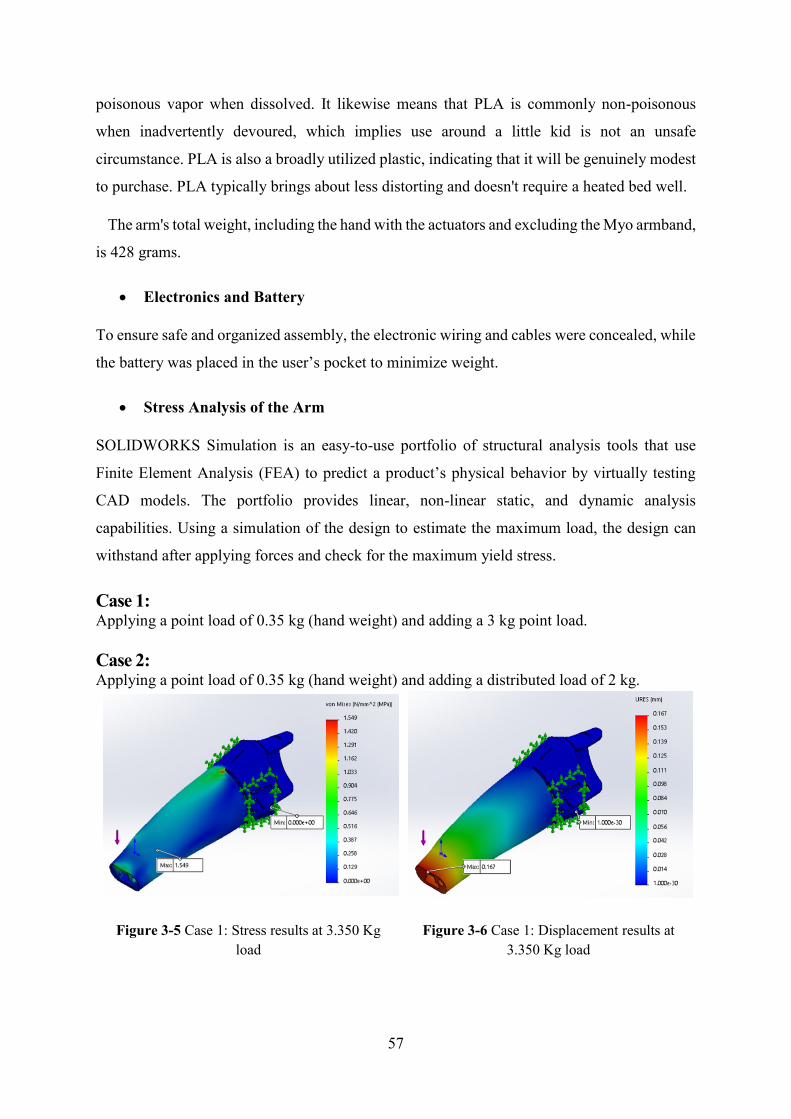
57
poisonous vapor when dissolved. It likewise means that PLA is commonly non-poisonous
when inadvertently devoured, which implies use around a little kid is not an unsafe
circumstance. PLA is also a broadly utilized plastic, indicating that it will be genuinely modest
to purchase. PLA typically brings about less distorting and doesn't require a heated bed well.
The arm's total weight, including the hand with the actuators and excluding the Myo armband,
is 428 grams.
• Electronics and Battery
To ensure safe and organized assembly, the electronic wiring and cables were concealed, while
the battery was placed in the user’s pocket to minimize weight.
• Stress Analysis of the Arm
SOLIDWORKS Simulation is an easy-to-use portfolio of structural analysis tools that use
Finite Element Analysis (FEA) to predict a product’s physical behavior by virtually testing
CAD models. The portfolio provides linear, non-linear static, and dynamic analysis
capabilities. Using a simulation of the design to estimate the maximum load, the design can
withstand after applying forces and check for the maximum yield stress.
Case 1: Applying a point load of 0.35 kg (hand weight) and adding a 3 kg point load.
Case 2: Applying a point load of 0.35 kg (hand weight) and adding a distributed load of 2 kg.
Figure 3-5 Case 1: Stress results at 3.350 Kg
load
Figure 3-6 Case 1: Displacement results at
3.350 Kg load
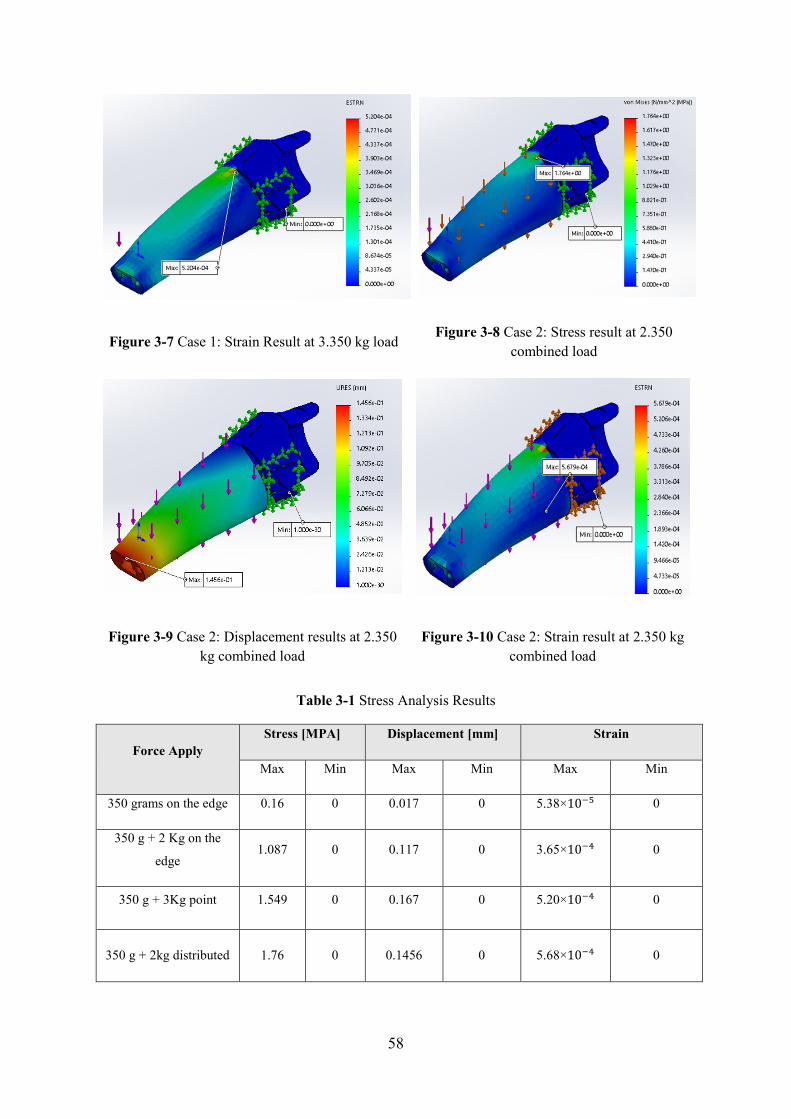
58
Figure 3-7 Case 1: Strain Result at 3.350 kg load Figure 3-8 Case 2: Stress result at 2.350
combined load
Figure 3-9 Case 2: Displacement results at 2.350
kg combined load
Figure 3-10 Case 2: Strain result at 2.350 kg
combined load
Table 3-1 Stress Analysis Results
Force Apply
Stress [MPA] Displacement [mm] Strain
Max Min Max Min Max Min
350 grams on the edge 0.16 0 0.017 0 5.38×10⁻⁵ 0
350 g + 2 Kg on the
edge 1.087 0 0.117 0 3.65×10⁻⁴ 0
350 g + 3Kg point 1.549 0 0.167 0 5.20×10⁻⁴ 0
350 g + 2kg distributed 1.76 0 0.1456 0 5.68×10⁻⁴ 0
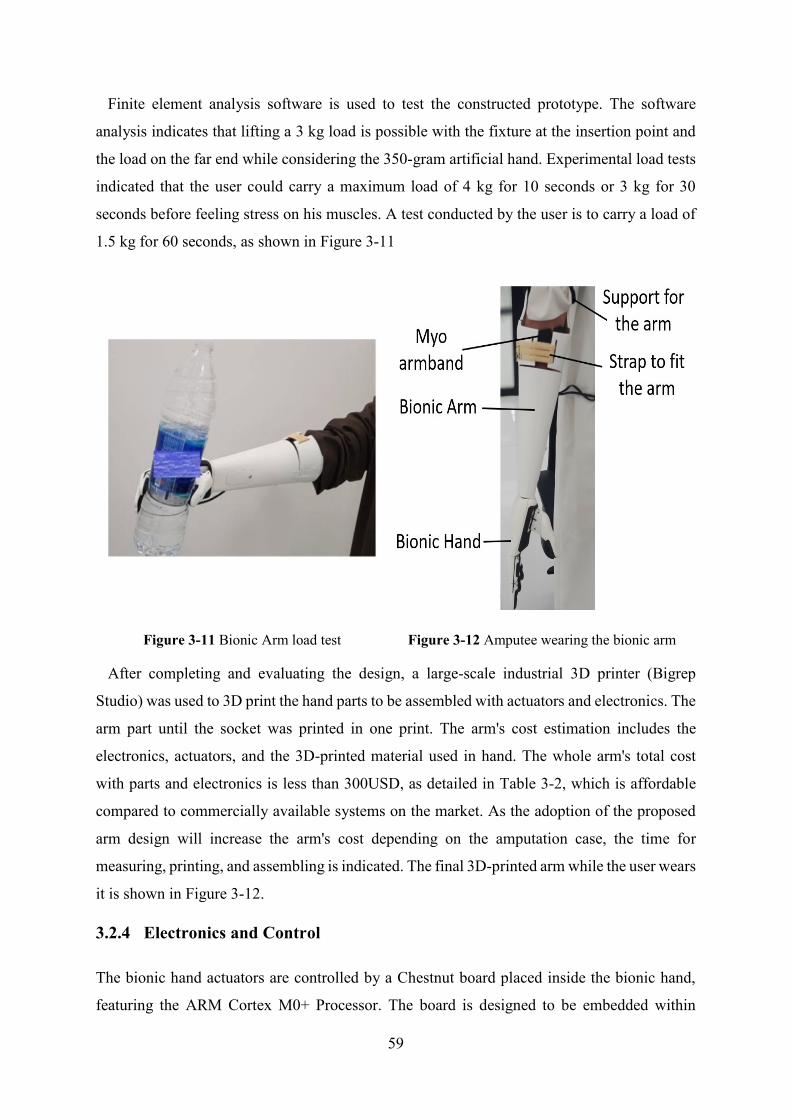
59
Finite element analysis software is used to test the constructed prototype. The software
analysis indicates that lifting a 3 kg load is possible with the fixture at the insertion point and
the load on the far end while considering the 350-gram artificial hand. Experimental load tests
indicated that the user could carry a maximum load of 4 kg for 10 seconds or 3 kg for 30
seconds before feeling stress on his muscles. A test conducted by the user is to carry a load of
1.5 kg for 60 seconds, as shown in Figure 3-11
Figure 3-11 Bionic Arm load test Figure 3-12 Amputee wearing the bionic arm
After completing and evaluating the design, a large-scale industrial 3D printer (Bigrep
Studio) was used to 3D print the hand parts to be assembled with actuators and electronics. The
arm part until the socket was printed in one print. The arm's cost estimation includes the
electronics, actuators, and the 3D-printed material used in hand. The whole arm's total cost
with parts and electronics is less than 300USD, as detailed in Table 3-2, which is affordable
compared to commercially available systems on the market. As the adoption of the proposed
arm design will increase the arm's cost depending on the amputation case, the time for
measuring, printing, and assembling is indicated. The final 3D-printed arm while the user wears
it is shown in Figure 3-12.
3.2.4 Electronics and Control
The bionic hand actuators are controlled by a Chestnut board placed inside the bionic hand,
featuring the ARM Cortex M0+ Processor. The board is designed to be embedded within

60
robotic hands. It can control up to four motors simultaneously. The board's mass 15 g, and its
dimensions are small at 57×45×9 mm shown in Figure 3-13, allowing it to fit inside the bionic
hand (Open Bionics lab, 2019).
All the data acquired by Myo armband transferred wirelessly via Bluetooth at a fixed
sampling rate of 200 Hz and transmitted serially to a PC. Each transmitted serial datum
corresponds to a gesture. These signals are compared with the trained model of gestures. A
graphical user interface (GUI) screen for interfacing with the user was developed to indicate
the detected gesture. The GUI also shows the orientation of the arm in real-time. The Myo
EMG sensors' detected gesture was mapped to perform hand movements; for example, closing
the hand, opening the hand, closing one finger, or two fingers. These actions are achieved by
precise control of the linear actuators' motion inside the bionic hand. The control signals are
transferred through the Chestnut board to actuate the linear actuators of the hand. Although the
bionic arm hardware was customized for a single user, the software was meant to be adaptable
for any user. The chestnut board is programmed by Arduino based language. Consequently,
sets of gesture data were collected from different participants to enable feature extraction and
classification, as detailed in the following section. The flowchart explains the procedure of
controlling the bionic arm shown in Figure 3-14.
Table 3-2 Detailed cost analysis of the bionic arm
Index Property Value
1 Time to print and assemble the hand 28 h
2 Time to print the arm 10 h
3 Total weight without support material 78.78 g
4 Material Cost $32.4
5 Hand print $20
6 Electronics $20
7 Actuators $240
Total Cost $295
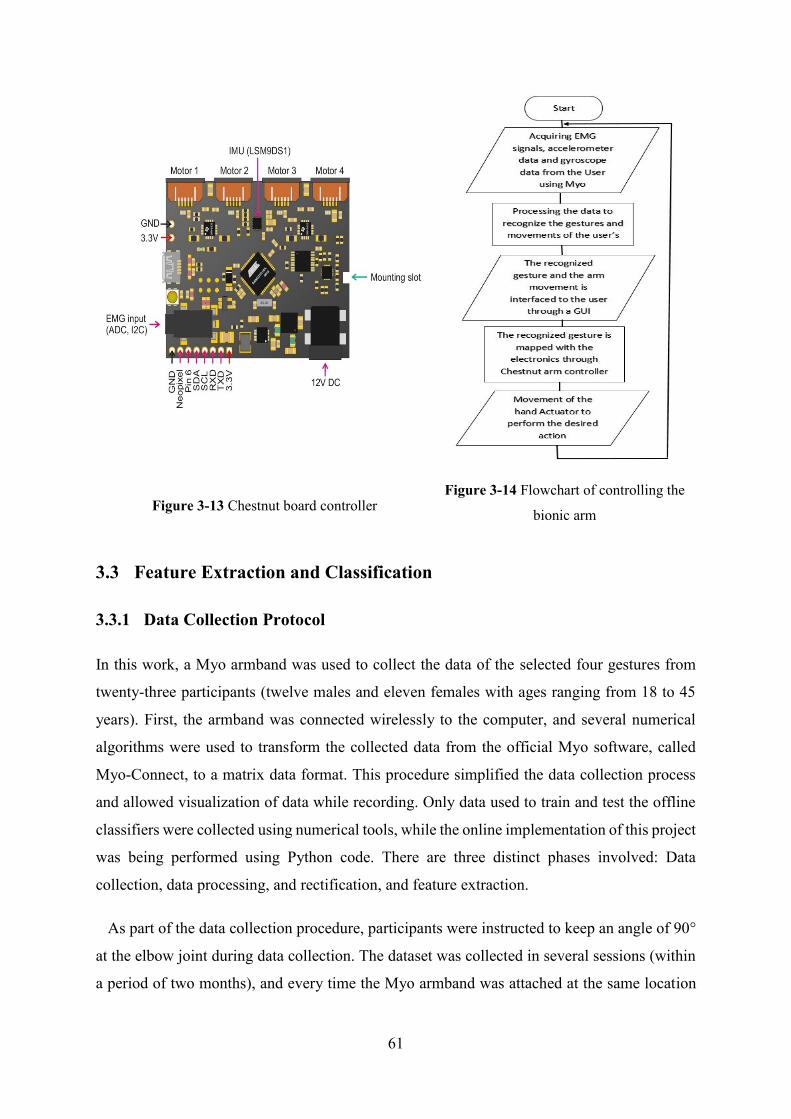
61
Figure 3-13 Chestnut board controller Figure 3-14 Flowchart of controlling the
bionic arm
3.3 Feature Extraction and Classification
3.3.1 Data Collection Protocol
In this work, a Myo armband was used to collect the data of the selected four gestures from
twenty-three participants (twelve males and eleven females with ages ranging from 18 to 45
years). First, the armband was connected wirelessly to the computer, and several numerical
algorithms were used to transform the collected data from the official Myo software, called
Myo-Connect, to a matrix data format. This procedure simplified the data collection process
and allowed visualization of data while recording. Only data used to train and test the offline
classifiers were collected using numerical tools, while the online implementation of this project
was being performed using Python code. There are three distinct phases involved: Data
collection, data processing, and rectification, and feature extraction.
As part of the data collection procedure, participants were instructed to keep an angle of 90°
at the elbow joint during data collection. The dataset was collected in several sessions (within
a period of two months), and every time the Myo armband was attached at the same location
62
around the forearm of all participants. Data were collected from participants in several sessions
in the first phase, where data associated with four hand gestures were recorded: Spread fingers,
closed hand, wave-in, and wave-out. The participants were instructed to move their hand from
the resting position to perform one of the proposed gestures and then move back to the resting
position for around four seconds. The participants repeated this procedure more than 10 times
for every single gesture. The same method was applied to all four gestures. As a result, a dataset
of 7360 files was collected, where each file contains the signals of several gestures. In the
second phase, the collected data were processed and rectified to simplify the third phase (the
feature extraction phase).
3.3.2 Data Processing
The second phase shows the processing steps of raw sEMG signals. First, the raw sEMG signal
which are acquired by a sampling rate of 200 Hz was modified by removing its mean value,
resulting in an AC coupled signal. Next, a band-pass filter was used to remove distortions and
non-EMG effects from the recorded signal. Generally, raw EMG signals have a frequency
between 6–500 Hz. However, specific fast oscillations, which are caused by unwanted
electrical noise, may appear within the signal frequency band. Furthermore, slow oscillations,
which are caused by movement artifacts or electrical networks, may also contaminate the EMG
signals. These unwanted signals can be removed from the original EMG signal using a band-
pass filter with cut-off frequencies between 20 and 450 Hz. The resulting data signals may be
further rectified by taking the absolute value of all EMG values. This step will ensure that
negative and positive values of the EMG signals will not cancel each other upon further
analysis, such as calculating the mean values of the absolute EMG signal or obtaining other
features. Finally, the second phase was be concluded by capturing the envelope of the filtered
and rectified EMG signal, as the obtained shape gives a better reflection of the forces generated
by the muscles. The signal length is 1000 samples.
Figure 3-15 summarizes phase two steps: figure (a) shows a raw EMG signal obtained in one
channel. Figure (b) illustrates the second step, in which the mean value of the signal was
deducted from the signal. Figure (c) presented in the bottom left shows the signal after a pass-
band filter was applied, and then the absolute values of the filtered signal were taken. Finally,
figure (d) shows the envelope of the processed signal. These four steps will be used to process
all sEMG signals.

63
Figure 3-15 Filtered and rectified EMG signal (a) Raw sEMG signal, (b) Mean value removed sEMG
signal, (c) Filtered and rectified sEMG signal, (d) sEMG envelope signal
3.3.3 Features Extraction
In the feature extraction procedure, which is the third phase, the dimensionality of the
processed data was reduced to simplify the classification step. Generally, sEMG data may
contain relevant and irrelevant information, and mapping sEMG data can discard irrelevant
information to another reduced space (reduced dimensionality). This step is known as feature
extraction, and the main advantage of this step is the reduction of the dimensionality of the
problem, which eventually simplifies the classification process. In this work, a combination of
two statistical features, mean absolute value (MAV) and standard deviation (SD), along with
the auto-regressive coefficients (AR) approach, is used to extract important information from
the data, which reflects the targeted gestures (Baillie, D. C., & Mathew, J., 1996) (Vu, V. H.,
Thomas, M., Lakis, A. A., and Marcouiller, L., 2011) (Akhmadeev, K., Houssein, A.,
Moussaoui, S., Høgestøl, E. A., Tutturen, I., Harbo, H. F., and Gourraud, P. A., 2018). First,
the Mean Absolute Value (MAV) method is used to extract muscle contraction levels from
sEMG data. The mathematical expression of MAV is presented as the moving average of a
rectified EMG signal:
𝑀𝐴𝑉 = 1
𝑁∑ |𝑥𝑖|𝑁
𝑖=1 (3-1)
N represents the length segment of the EMG data, 𝑥𝑖 is the value of the signal amplitude, and
𝑖 is the segment increment. Then, the standard deviation of EMG (SD), which is expressed as
64
the square root of the EMG signal's power, is used to extract features from the EMG data. The
SD is defined as:
𝑆𝐷 = √1
𝑁−1∑ (𝑥𝑖)2𝑁
𝑖=1 (3-2)
Finally, an auto-regressive coefficients (AR) approach is adopted to extract features from
sEMG data. The main idea is to use the sEMG data to fit an auto-regressive model, where the
coefficients of the model and MAV and SD values, are then considered as inputs to the
classifier for gesture recognition. For each sEMG envelope signal, the AR model is fitted, such
as:
𝑥(𝑡) − ∑ 𝑎𝑘𝑥(𝑡 − 𝑘) = 𝑒(𝑡)𝑚𝑘=1 (3-3)
where 𝑎𝑘, k = 1, ..., m, are the AR model parameters, m is the order of the model, and 𝑒(𝑡)
is the error. Then, the parameters 𝑎𝑘 , k = 1, ..., m are used to represent the EMG signal. In this
work, the value of m = 8. As a result, a vector of size ten is needed to capture the 8 AR
parameters, and both MAV and SD values. Furthermore, eight sEMG signals were involved in
the collection procedure, and the classifier inputs are reduced to eighty entries.
3.3.4 Classification
In this section, the extracted features and the corresponding known outputs are used as the input
data to train a classifier or recognition algorithms. Based on a pre-selected optimization
algorithm, the classifier is prepared to learn and identify patterns in the data and respond to the
inputs according to the given outputs. After successful training, the reliability of the classifier
is tested with a different dataset.
Training and testing classifiers help to validate the results and obtaining an accurate
classification model. In this section, three classifiers are investigated: The artificial neural
network (ANN), support vector machine (SVM), and decision trees (DT) algorithms to identify
which classifier is better suited for building the bionic hand.
• Artificial Neural Network
Artificial neural networks (ANN), also known as multi-layer perceptrons (MLP), are one of
the main pattern recognition techniques; they comprise many neurons, and these neurons are
connected in a layered manner. The training procedure of a neural network can be easily
achieved by optimizing the unknown weights to minimize a pre-selected fitness function.
65
Generally, the neuron architecture can be summarized as the following: A neuron (or node)
receives inputs, and then respective weights are applied to these inputs. Then, a bias term is
added to the linear combination of the weighted input signals. The resulting mixture is mapped
through an activation function.
Usually, the ANN consists of input and output layers and hidden layers that permit the neural
network to learn more complex features. In this work, one of the most recognized ANN
algorithms, the feed-forward neural network, is used as a supervised classifier for gesture
recognition. The feed-forward classifier is trained with data (called training data); the trained
classifier is then tested with a different dataset. Finally, the resulting ANN classifier is used to
recognize online input data (Ahsan, M. R., Ibrahimy, M. I., and Khalifa, O. O., 2011) (Zhang,
X. H., Wang, J. J., Wang, X., and Ma, X. L., 2016) (Dai, Y., Zhou, Z., Chen, X., & Yang, Y.,
2017) (Zhang, Z., Yang, K., Qian, J., and Zhang, L., 2019).
• Support Vector Machine
A support vector machine (SVM) is a multi-class classifier that has been successfully applied
in many disciplines. The SVM algorithm gained its success from its excellent empirical
performance in applications with relatively large numbers of features. In this algorithm, the
learning task involves selecting the weights and bias values based on given labeled training
data. This can be achieved by finding the weights and biases that maximize a quantity known
as the margin. Generally, the SVM algorithm was first designed for two-class classification.
However, it has been extended to multi-class classification by creating several one-against-all
classifiers (in which the algorithm solves K two-class problems, and, each time, a class is
selected and classified against the rest of the classes), or by formulating the SVM problem as
a one-against-one classification problem (in this case, K(K - 1)/2 binary classification problems
are solved by considering all classes in pairs) (Fong, S. , 2012) (Theodoridis, S., 2015). In this
work, a multi-class SVM classifier is trained, tested, and used to classify gestures based on
online data.
• Decision Tree
Recently, decision tree (DT) algorithms have become very attractive in machine learning
applications due to their low computational cost (Marsland, S., 2015) . Furthermore, DT
approaches are transparent and easy to understand since the classification process could be
visualized as following a tree-like path until a classification answer is obtained. The decision
66
tree algorithm can be summarized as follows: The classification is broken down into a set of
choices, where each alternative is about a specific feature. The algorithm then starts at the tree’s
base (root) and keeps progressing to the leaves to receive the optimized classification result.
The trees are usually easy to comprehend and can be transformed into a set of if-then rules
suitable for simplifying machine learning applications' training procedures. Generally, decision
trees use greedy heuristic approaches to perform search and optimizations, where these
algorithms evaluate their possible options at the current learning stage and select the solution
that seems optimal at that instant. In this work, a decision tree algorithm is used to train and
test a gesture dataset, and the results are compared with the SVM and ANN to select the best
model to be used with the bionic arm.
3.4 Results
After selecting three different types of classifiers, the offline procedure was used to train and
test these classifiers to select the model that will be used for the online recognition procedure.
The ANN classifier has two hidden layers, with the number of neurons used in each layer set
to 116 and 48, respectively. The tanh, which is the hyperbolic tangent function, is considered
the ANN's activation function. The training procedure is achieved using an optimizer called
the limited-memory Broyden–Fletcher–Goldfarb–Shanno (LBFGS) algorithm. In the decision
tree classifier, a Gini impurity was used to measure the split’s quality. The lowest number of
samples required to split an internal node is two, and only two samples are needed for every
leaf node. To obtain an accurate SVM classier, one should select the correct value for the
regularization parameter C, which is, in this case, C = 80, and the kernel parameter g = 0.04.
The parameter values for the three classifiers were selected after performing a cross-
validation process for each classifier. Each classifier was used to train and test the same dataset
for a different set of parameters. The best model for each version of the three classifiers was
selected based on its performance. Next, a statistical study was used to compare the testing
results to choose the best classifier among the three classifiers (ANN, SVM, and DT
classifiers). First, each classifier was run for thirty trials, and the testing accuracy for the
classification was stored in a table. The SVM classifier provided the highest classification
result with a mean value of the training data equal to 91.21% and a standard deviation of 1.92%.
Furthermore, the SVM classifier provided an average testing accuracy equal to 90.5% and a
standard deviation of 1.75%. The decision tree algorithm produced a training accuracy of
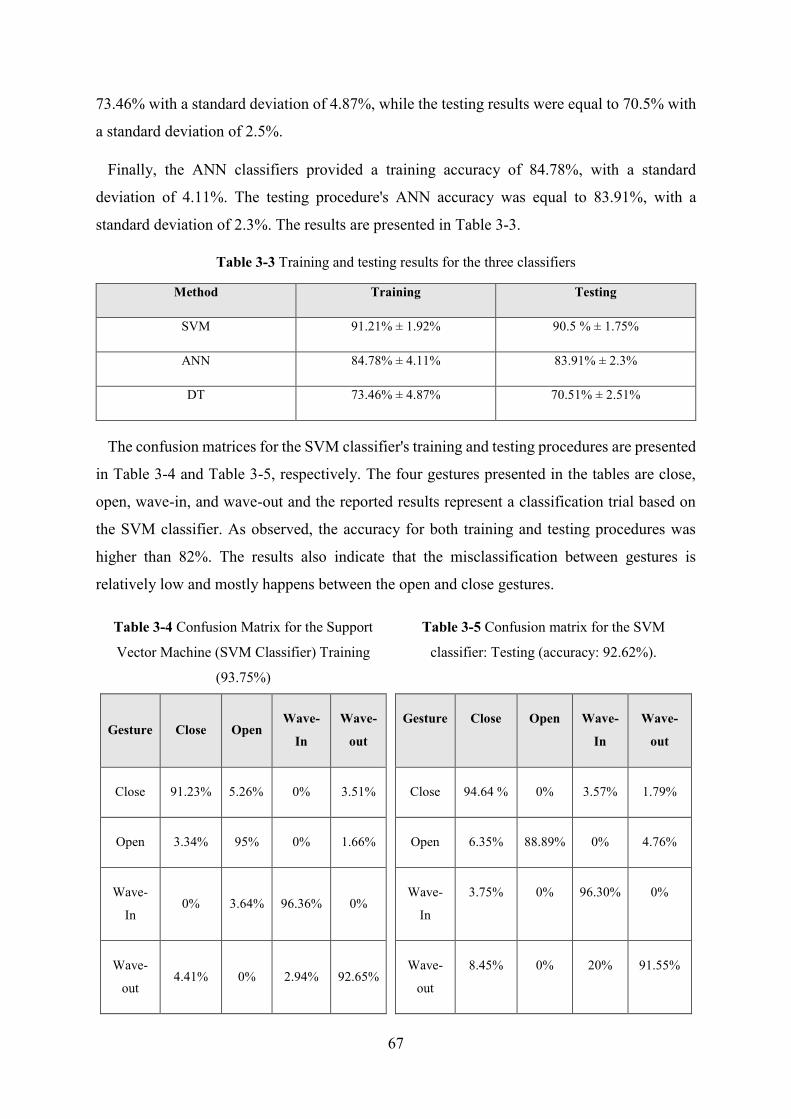
67
73.46% with a standard deviation of 4.87%, while the testing results were equal to 70.5% with
a standard deviation of 2.5%.
Finally, the ANN classifiers provided a training accuracy of 84.78%, with a standard
deviation of 4.11%. The testing procedure's ANN accuracy was equal to 83.91%, with a
standard deviation of 2.3%. The results are presented in Table 3-3.
Table 3-3 Training and testing results for the three classifiers
Method Training Testing
SVM 91.21% ± 1.92% 90.5 % ± 1.75%
ANN 84.78% ± 4.11% 83.91% ± 2.3%
DT 73.46% ± 4.87% 70.51% ± 2.51%
The confusion matrices for the SVM classifier's training and testing procedures are presented
in Table 3-4 and Table 3-5, respectively. The four gestures presented in the tables are close,
open, wave-in, and wave-out and the reported results represent a classification trial based on
the SVM classifier. As observed, the accuracy for both training and testing procedures was
higher than 82%. The results also indicate that the misclassification between gestures is
relatively low and mostly happens between the open and close gestures.
Table 3-4 Confusion Matrix for the Support
Vector Machine (SVM Classifier) Training
(93.75%)
Table 3-5 Confusion matrix for the SVM
classifier: Testing (accuracy: 92.62%).
Gesture Close Open Wave-
In
Wave-
out
Close 91.23% 5.26% 0% 3.51%
Open 3.34% 95% 0% 1.66%
Wave-
In 0% 3.64% 96.36% 0%
Wave-
out 4.41% 0% 2.94% 92.65%
Gesture Close Open Wave-
In
Wave-
out
Close 94.64 % 0% 3.57% 1.79%
Open 6.35% 88.89% 0% 4.76%
Wave-
In
3.75% 0% 96.30% 0%
Wave-
out
8.45% 0% 20% 91.55%

68
Furthermore, the t-test is used to identify a significant difference between the results of all
three classifiers. The obtained P-values were found to be relatively small (less than 5%), which
indicates that there is a significant difference between the classification results. The Holm
approach was then used in the statistical investigation to show that there are statically
substantial differences among the three classifiers' results, and the SVM classifier provides
better accuracy than both the ANN and the DT classifiers. As a result, the SVM classification
model is adopted for online classification.
In Table 3-6, various classifiers accuracies are stated to compare the results obtained with
other researchers' work.
Table 3-6 Research Work Results using Myo armband
Evaluated ML models used Myo armband Accuracy
MYO armband method (Motoche, C., and Benalcázar, M. E., 2018) 83.1 %
Model using k-NN with Dynamic Time Wrapping (DTW) (Benalcázar,
M. E., Motoche, C., Zea, J. A., Jaramillo, A. G., Anchundia, C. E.,
Zambrano, P., and Pérez, M., 2017)
89.5 %
Model using SVM (Benalcázar, M. E., Motoche, C., Zea, J. A.,
Jaramillo, A. G., Anchundia, C. E., Zambrano, P., and Pérez, M., 2017)
92 %
Model using ANN (Motoche, C., and Benalcázar, M. E., 2018) 90.7 %
Model using Naive Bayes (Wahid, M. F., Tafreshi, R., Al-Sowaidi, M.,
and Langari, R., 2018)
81.76 %
Model using Random Forest (Wahid, M. F., Tafreshi, R., Al-Sowaidi,
M., and Langari, R., 2018)
89.92 %
3.5 Real-time Implementation
Different testing protocols were proposed to the user for testing the arm design and the EMG
signal control with the optimum classifier enabled. The user practiced for one week on how to
perform different gestures and be able to control his muscles. After the training phase, the user
wore the Myo armband in his forearm and then performed the trained gestures (fist (closed),
spread fingers (open), wave-in (turn the hand inside), wave-out (turn the hand outside)) using
his muscles for 20 consecutive times .Subsequently, the user was asked to perform two
different gestures consecutively 20 times to test the daily activities that can be performed by
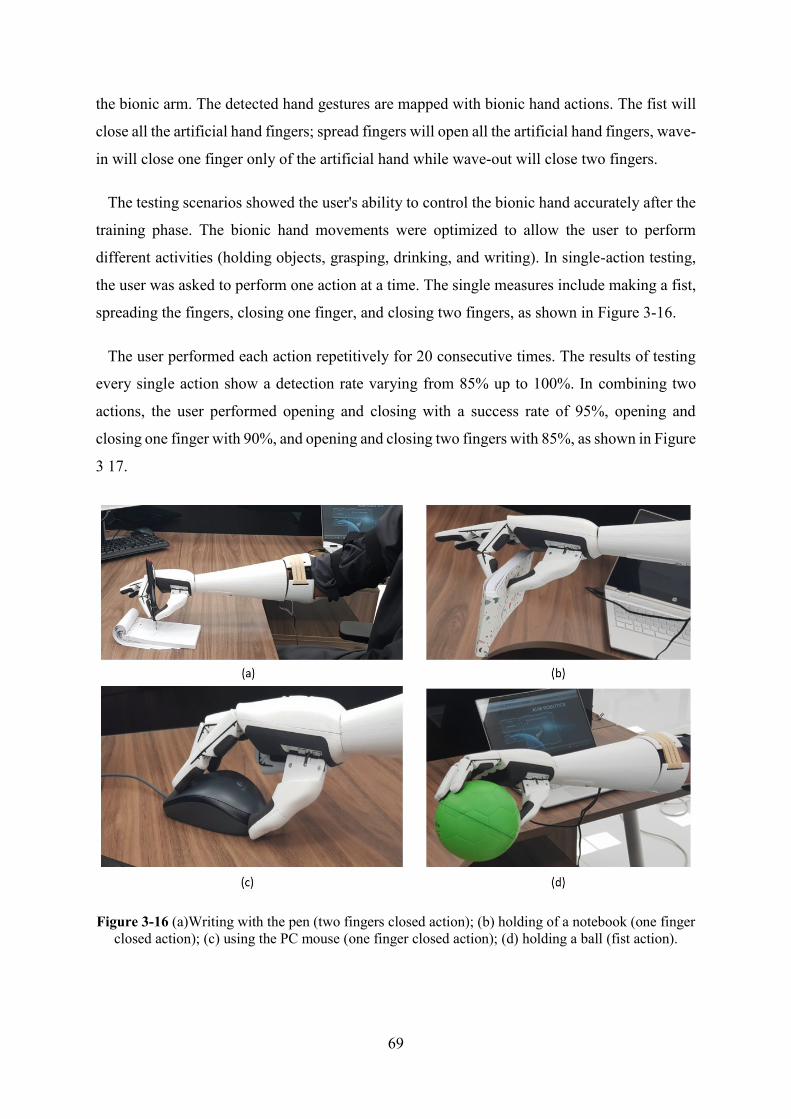
69
the bionic arm. The detected hand gestures are mapped with bionic hand actions. The fist will
close all the artificial hand fingers; spread fingers will open all the artificial hand fingers, wave-
in will close one finger only of the artificial hand while wave-out will close two fingers.
The testing scenarios showed the user's ability to control the bionic hand accurately after the
training phase. The bionic hand movements were optimized to allow the user to perform
different activities (holding objects, grasping, drinking, and writing). In single-action testing,
the user was asked to perform one action at a time. The single measures include making a fist,
spreading the fingers, closing one finger, and closing two fingers, as shown in Figure 3-16.
The user performed each action repetitively for 20 consecutive times. The results of testing
every single action show a detection rate varying from 85% up to 100%. In combining two
actions, the user performed opening and closing with a success rate of 95%, opening and
closing one finger with 90%, and opening and closing two fingers with 85%, as shown in Figure
3 17.
Figure 3-16 (a)Writing with the pen (two fingers closed action); (b) holding of a notebook (one finger
closed action); (c) using the PC mouse (one finger closed action); (d) holding a ball (fist action).

70
Figure 3-17 Success rate of hand actions.
3.6 Conclusion
A customized 3D-printed bionic arm was designed, fabricated, and tested for a right arm
amputee. The 3D-printed bionic arm was designed to have a low cost, comfort, lightweight,
durability, and appearance. sEMG data were collected for a set of four gestures (fist, spread
fingers, wave-in, wave-out) from a wide range of participants to make the bionic arm control
general for amputee cases. The collected data were processed, and feature extraction was
performed to train the classifier. The support vector machine classifier was found to out-
perform the neural network and decision tree classifiers, reaching an average of 89.93%
accuracy. Real-time testing of the bionic arm with the associated classifier software enabled
the user to perform his daily activities.
Additional features are needed to improve further the bionic arm, such as a multi-degree-of-
freedom wrist joint connector. This can be achieved by using two servo motors with brackets
or by utilizing a spherical manipulator. Furthermore, air-ducted adjustable sockets can allow
the user to mount and dismount the bionic arm with ease. Also, attaching feedback sensors to
sense the environment should be considered for further improvements.
71
4 Chapter 4 EMG based Biometrics Modality for
Users Verification
Chapter Content
4.1 Introduction ............................................................................................................... 72
4.2 Database Collection Protocol .................................................................................... 73
4.3 Features Extraction for sEMG Users Verification .................................................... 76
4.4 Machine Learning Models ........................................................................................ 79
4.5 Results ....................................................................................................................... 81
Summary: In this chapter, the viability of using surface electromyogram (sEMG) as a biometric
modality for user verification is investigated. A database of multi-channel sEMG signals is created
using a wearable armband from able-bodied users. Several features are extracted in the frequency
domain after estimating the power spectral density using Welch’s method. Time-domain features are
also extracted. Several classifiers based on K-nearest Neighbours (KNN), Linear Discernment Analysis
(LDA), and Ensemble of Classifiers are constructed, trained, and statistically compared. False
acceptance rate (FAR) and False Rejection Rate (FRR) are estimated for each classifier to determine
the biometrics verification system's effectiveness.
The chapter explains the database creation protocol in detail as this database of sEMG as a password
is collected from 56 users and will be used in the next chapters in section 4.2. The features extraction
process in the frequency domain and time domain is explained in detail in section 4.3. Three classifiers
train the sEMG signals in section 4.4. The results of the testing accuracy, FAR, and FRR are mentioned
in section 4.5.
72
4.1 Introduction
The study's primary purpose is to explore the concept of using sEMG signals in biometrics as
a potential modality that can be used to verify individuals using a multi-channel EMG
acquisition system. Using a multi-channel sEMG signal will significantly impact the accuracy
and noise reduction of the biometrics system. Also, it contains more information that helps to
detect the identity of the user. For example, in such systems, the Signal-to-Noise ratio (SNR)
can be improved using numerous signal processing approaches such as: averaging, source
separation, filtering, and decomposition techniques.
This chapter presents a detailed study using a multi-channel sEMG signal acquired by
wearable bracelet Myo armband to be used in a biometric verification system based on the
user’s hand gestures. This chapter proposes a biometrics verification system for user’s
verification. The biometric identity studied in this research is sEMG. The biometric device
used to acquire the sEMG signal is a wearable multi-channel armband consists of 8 electrodes.
Fifty-six users have been enrolled in the biometric system. The users enrolled trained to use
the sEMG biometric system before data collection. Eighteen features have been extracted from
the signals to distinguish between users, seven frequency domain features, and eleven time-
domain features. The power spectral density of each channel is estimated by periodogram using
Welch’s method first. Then, the signal's power, average frequency, kurtosis, median frequency,
deciles, coefficient of dissymmetry, and peak frequency of PSD are calculated as frequency-
domain features. The length or duration of data is calculated as a new feature Signal divided
into ten equal-length segments, and the root means square (RMS) of each segment is calculated.
K-nearest neighbors (kNN), Linear discriminant analysis classifier (LDA), an ensemble of
classifiers have been applied to optimize the system's results. The system will grant/deny access
to the user from the sEMG biometrics identity of each user. The signature of each user based
on hand gestures. Performance analysis of the biometrics system has been presented to validate
the system's capacity by calculating the False Acceptance Rate (FAR) and False Rejection Rate
(FRR).
In all biometrics systems, users must first register their identity with the system employing
recording raw biometric data. This phase is called Enrolment and is consists of three distinct
phases: Capture, Process, and Enroll (Dantcheva, A., Velardo, C., D’angelo, A., and Dugelay,
J. L., 2011).
73
In the capture phase, raw EMG signals are acquired by wearable 8-channel EMG armband.
In the process phase, features that are unique to users and distinguish individuals from one
another are extracted from the raw sEMG signals and transformed into each user's signature.
This process is done in two steps, the first one is signal preprocessing, and the second one is
feature extraction. The processed template is stored as a database in the hard disk, SD Card, or
any other storage device for later comparisons in the Enroll phase.
Once Enrollment is complete, the system can authenticate users by means of using the
prerecorded stored template (Soutar, C., Roberge, D., Stoianov, A., Gilroy, R., and Kumar, B.
V., 1998). Verification is when a new biometric sample is captured by the individual who is
authenticating with the system and compared to the stored biometric template. There are two
types of users biometrics systems Verification and Identification.
Verification involves matching the captured biometric sample with the enrolled template
saved and requires the user to present a specific identity claim such as a user name / unique
key or card (Yamaba, H., Nagatomo, S., Aburada, K., Kubota, S., Katayama, T., Park, M., and
Okazaki, N., 2015). Identification performs the process of identifying an individual from their
biometric features without declaring their identity.
The biometrics verification system aims to provide enrolled users access to the system based
on the individuals' specific features. The schematic chart illustrating the biometrics system
steps shown in Figure 4-1. There are two paths of the diagram. The first path is to enroll the
users in the system. A database of sEMG gestures that form a password of each user is created
with all the units associated with signal processing, feature extraction, and machine learning to
catalog the signals required to identify the user. The second path is to authenticate the user's
identity by matching the enrolled users' identity with the stored database. The system
grant/deny access to the users. In the biometrics verification systems, the user needs to declare
his identity first, then declaring his/her biometrics identity, which is the sEMG signal in this
system. A database of sEMG signals that forms a password is collected from 56 users able-
bodied user.
4.2 Database Collection Protocol
The database of sEMG signal is collected from different volunteers for diverse purposes. All
the volunteers are able-bodied with no health issues. Each user recorded the signals at multiple
sessions of the same biometric identity to allow for genuine attempts. Myo bracelet was used
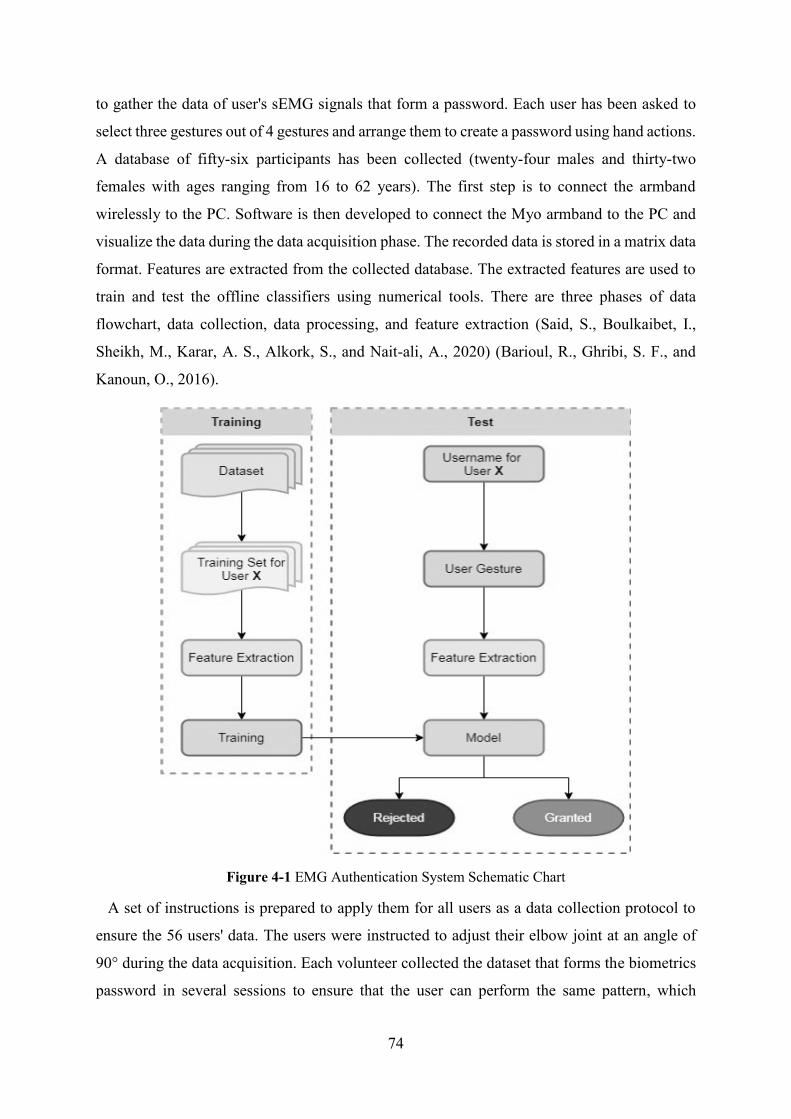
74
to gather the data of user's sEMG signals that form a password. Each user has been asked to
select three gestures out of 4 gestures and arrange them to create a password using hand actions.
A database of fifty-six participants has been collected (twenty-four males and thirty-two
females with ages ranging from 16 to 62 years). The first step is to connect the armband
wirelessly to the PC. Software is then developed to connect the Myo armband to the PC and
visualize the data during the data acquisition phase. The recorded data is stored in a matrix data
format. Features are extracted from the collected database. The extracted features are used to
train and test the offline classifiers using numerical tools. There are three phases of data
flowchart, data collection, data processing, and feature extraction (Said, S., Boulkaibet, I.,
Sheikh, M., Karar, A. S., Alkork, S., and Nait-ali, A., 2020) (Barioul, R., Ghribi, S. F., and
Kanoun, O., 2016).
Figure 4-1 EMG Authentication System Schematic Chart
A set of instructions is prepared to apply them for all users as a data collection protocol to
ensure the 56 users' data. The users were instructed to adjust their elbow joint at an angle of
90° during the data acquisition. Each volunteer collected the dataset that forms the biometrics
password in several sessions to ensure that the user can perform the same pattern, which

75
consists of a combination of hand gestures. one of the most important instructions is that the
Myo bracelet has to be attached at the same position on the forearm of all users with sensor
number 4 placed on brachioradialis muscle as shown in Figure 4-2. The users can select three
gestures from four hand gestures (Spread fingers, closed hand, wave-in, and wave-out). The
participants were instructed to move their hand from the resting position to perform one of the
proposed gestures and then move back to the resting position for around four seconds. Each
user got a training session, not recorded signals, to get used to the selected hand gestures
(signature). Once the user can produce the same pattern each time, for each user enrolled in the
system, twenty tests have been recorded. The same procedure was applied to all users.
The characteristics of the database have a significant impact on the outcome of the evaluation.
The amount of information available that could be used to characterize the features being
compared is what determines the biometrics performance later.
Figure 4-2 Acquisition of sEMG data of a user to create the database (Enrolment)
The system's training phase consists of creating a training set for each user, feature extraction,
and classifiers training. There are 56 users with 20 tests for each user. In a total of 1120 tests,
each test contains eight signals as a multi-channel wearable armband used to acquire EMG
signals. One binary-class classifier is trained for each user. This results in two-class outputs
(Access granted or Access rejected) and 56 classifiers. As a random choice, 70% of each user's
data selected for the training phase leads to 14 signals for Granted class and 770 signals for
Rejected class, making data highly unbalanced. To overcome this problem, the under-sampling
process is used. This results14 signals randomly selected for Granted class and to create a
Rejected class, one signal from each user (except valid user) is selected for the Rejected class,
making 14 signals for Granted class and 55 signals for Rejected class.
76
4.3 Features Extraction for sEMG Users Verification
In the feature extraction process, the raw data size was reduced to be able to input these
parameters to the Machine Learning (ML) classification model. In general, sEMG data contains
essential and irrelevant information. The extrinsic information should be discarded to reduce
the features vector's dimensionality by mapping sEMG data to another space. This step is
important to extract the main features from the data of each user, which aids in distinguishing
between the enrolled users (Akhmadeev, K., Houssein, A., Moussaoui, S., Høgestøl, E. A.,
Tutturen, I., Harbo, H. F., and Gourraud, P. A., 2018) (Chantaf, S., Makni, L., and Nait-ali, A.,
2020).
The calculation of the Power Spectral Density (PSD) of the sEMG signal is vital since it is
calculated by using the relevant parameters used for the authentication of users. The PSD
depicts the density of a signal regarding the frequency. The primary purpose of spectral density
calculation is to capture the spectral density of the sEMG signal from a series of time samples.
There are two different techniques used in the estimation of PSD, parametric and non-
parametric. The estimated PSD is calculated directly from the signal in the Nonparametric
methods. The most known simple method is called a periodogram. In the periodogram method,
the discrete-time Fourier transform of the sampled signal is calculated first, then the magnitude
squared of the result is calculated (Kay, 1988). In this research, the PSD is estimated by
periodogram applying Welch’s method (Proakis, 2001).
The power of the sEMG signal is estimated against frequency to reduce the noise. The signal
is converted from the time domain to the frequency domain by using PSD. It is a direct
application of using periodograms that convert a signal from the time domain to the frequency
domain (Barbé, K., Pintelon, R., and Schoukens, J., 2009). This method is applied by dividing
the time signal into successive blocks, forming the periodogram for each block, and calculating
all the blocks' average.
Each block is divided as follow (4-1):
𝑥𝑖(𝑛) = 𝑥(𝑛 + 𝑖𝐷) (4-1)
such that n = 0, 1, ...........M − 1 and i = 0, 1, ........... L-1
M is the length of the blocks after division. D is the shifting between blocks, and L is the
number of blocks.
77
The periodogram for each block is given by (4-2):
𝑆 �̂�(𝑓) =1
𝑀 𝑈|∑ 𝑥(𝑛). 𝑤(𝑛)𝑒−𝑗2𝜋𝑓𝑛𝑀−1
𝑛=0 |2 (4-2)
U is the normalization factor of the window used to divide the signal into blocks (4-3).
𝑈 =1
𝑀∑ 𝑤(𝑛)2𝑀−1
𝑛=0 (4-3)
The Welch PSD estimate is given by (4-4):
𝑆�̂�(𝑓) =1
𝐿∑ 𝑆 �̂�𝐿−1
𝑖=0 (4-4)
Upon estimating the PSD, the necessary parameters are extracted to be used to classify the
users to verify their identity. The extracted features are signal power, kurtosis, median
frequency, deciles, dissymmetry coefficient, and frequency peak.
• Power of signal
A signal's power represents the distribution of energy M0 (order 0) on the frequency axis (4-5).
𝑀𝑟 = 2 ∫ 𝑓𝑟∞
0𝑆𝑥(𝑓) 𝑑𝑓 (4-5)
With Sx the estimation of the PSD by Welch method.
• Average frequency
Average frequency represents the statistical average of the signal (4-6)
𝑀𝑃𝐹 =𝑀1
𝑀0 (4-6)
• Kurtosis
Kurtosis measures the degree of peakedness of a distribution, defined as a normalized form of
the fourth central moment μ4 M4 of a distribution (4-7).
𝐶𝐴 =𝑀4
∗
𝑀22∗ (4-7)
• Median Frequency
The median divides the spectral density into two sections: 50% of data are less than the median,
and 50% are greater. The median is calculated by (4-8):
∫ 𝑆𝑥(𝑓) 𝑑𝑓 = 𝐹𝑚𝑒𝑑
0 ∫ 𝑆𝑥(𝑓) 𝑑𝑓 𝐹𝑚𝑎𝑥
𝐹𝑚𝑖𝑛 (4-8)
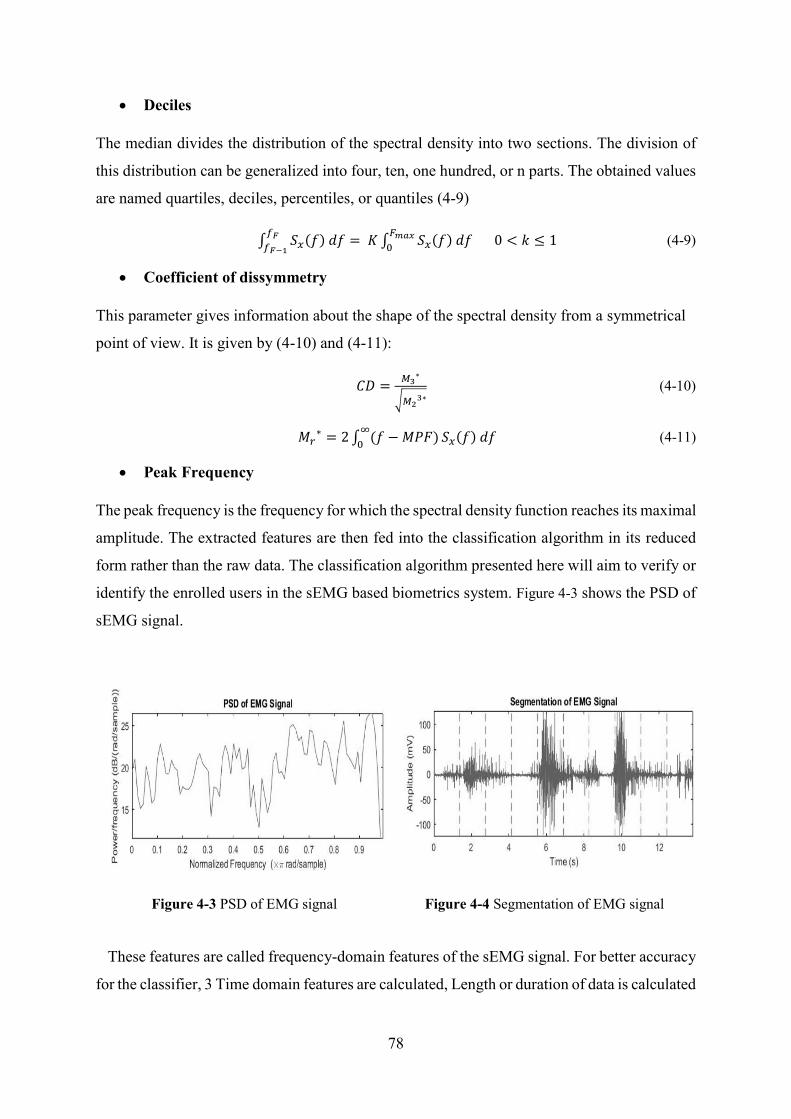
78
• Deciles
The median divides the distribution of the spectral density into two sections. The division of
this distribution can be generalized into four, ten, one hundred, or n parts. The obtained values
are named quartiles, deciles, percentiles, or quantiles (4-9)
∫ 𝑆𝑥(𝑓) 𝑑𝑓 = 𝐾𝑓𝐹
𝑓𝐹−1∫ 𝑆𝑥(𝑓) 𝑑𝑓
𝐹𝑚𝑎𝑥
0 0 < 𝑘 ≤ 1 (4-9)
• Coefficient of dissymmetry
This parameter gives information about the shape of the spectral density from a symmetrical
point of view. It is given by (4-10) and (4-11):
𝐶𝐷 =𝑀3
∗
√𝑀23∗
(4-10)
𝑀𝑟∗ = 2 ∫ (𝑓 − 𝑀𝑃𝐹)
∞
0𝑆𝑥(𝑓) 𝑑𝑓 (4-11)
• Peak Frequency
The peak frequency is the frequency for which the spectral density function reaches its maximal
amplitude. The extracted features are then fed into the classification algorithm in its reduced
form rather than the raw data. The classification algorithm presented here will aim to verify or
identify the enrolled users in the sEMG based biometrics system. Figure 4-3 shows the PSD of
sEMG signal.
Figure 4-3 PSD of EMG signal Figure 4-4 Segmentation of EMG signal
These features are called frequency-domain features of the sEMG signal. For better accuracy
for the classifier, 3 Time domain features are calculated, Length or duration of data is calculated
79
as a new feature, Signal divided into ten equal length segments as shown in and the Root mean
square (RMS) of each segment is calculated as a new feature.
4.4 Machine Learning Models
Machine-learning models are used widely in the biometrics verification system based on
wearable technology systems. The result of machine-learning algorithms executed by the
matching unit is a numerical value that estimates the similarity between the input signal and a
registered user in the system. After getting this result, a threshold value is usually set to
determine the biometrics system's final decision access granted, or access denied (Blasco, J.,
Chen, T. M., Tapiador, J., and Peris-Lopez, P, 2016). False acceptance rate (FAR) and false
rejection rate (FRR) are considered the main biometrics performance analysis parameters used
to estimate the system's accuracy. For optimization, three classifiers k-nearest neighbors
(kNN), linear discriminant analysis classifier (LDA), and an ensemble of classifier or boosted
trees were used to train this dataset and obtain the best model.
• K-nearest neighbor (KNN) Classifier
KNN classifier deals on the property that the classification of unknown instances can be
accomplished by relating the unknown to the known according to similarity/distance function
(Y. Paul, V. Goyal and R. A. Jaswal,, 2017). The unknown instance has a label with the same
class label as of the known nearest neighbor. In this research, the Minkowski distance method
has been applied in KNN algorithm applications.
The Minkowski distance is a method to find distance based on Euclidean space, defined by
𝑑𝑠𝑡 = √∑ |𝑥𝑠𝑗 − 𝑦𝑡𝑗|𝑝𝑛
𝑖=1
𝑝
(4-12)
For the particular case of Minkowski distance p = 1, the Minkowski metric gives the city
block distance, p = 2, the Minkowski metric gives the Euclidean distance, and p = ∞, the
Minkowski metric provides the Chebychev with distance.
• Linear Discriminant Analysis (LDA) Classifier
Linear discriminant analysis (LDA) classifier is extensively used in sEMG pattern recognition
for bionic arm control (Zhang, H., Zhao, Y., Yao, F., Xu, L., Shang, P., and Li, G., 2013). It
depends on the Bayes classification rule, which states that for a given vector x, assign it to the
class 𝑐𝑘 when the following inequality is satisfied
80
𝑝(𝑐𝑘|𝑥) > 𝑝(𝑐𝑗|𝑥) for all 𝑘 ≠ 𝑗 (4-13)
These posterior probabilities cannot be directly measured but can be obtained from estimates
of the prior probabilities and the distribution of the class according to the Bayes formula:
𝑝(𝑐𝑘|𝑥) =𝑝(𝑐𝑘)𝑝(𝑥|𝑐𝑘)
𝑝(𝑥) (4-14)
Where 𝑝(𝑐𝑘|𝑥) is the probability density function for the vector within 𝑘 class, 𝑝(𝑐𝑘) is the
prior probability for class 𝑘 and usually assumed to be equal for all classes, 𝑝(𝑥) is the
probability density function of the input space and is also constant over all the classes. Then
the decision rule referred to as equation (4-15) is simplified to:
𝑝(𝑥|𝑐𝑘) > 𝑝(𝑥|𝑐𝑗) for all 𝑘 ≠ 𝑗 (4-15)
In the LDA classifier implementation, the probability density functions for all the classes are
assumed to follow a multivariate Gaussian distribution.
𝑝(𝑥|𝑐𝑘) =1
√(2𝜋)𝑓𝑑𝑒𝑡 (𝐶)𝑒𝑥𝑝(−
1
2(𝑥 − 𝜇𝑘)𝑇𝐶−1(𝑥 − 𝜇𝑘)) (4-16)
where x is the vector to be classified, f is the dimension of the vector, C is the common
covariance matrix of all the classes, k and 𝜇𝑘 is the mean value of class k.
For a given training dataset, the parameters 𝜇𝑘 and C is constant, and the LDA classifier is
static. Therefore, the LDA classifier is challenging to maintain the classification accuracy
constant when the EMG recordings are changing.
• Ensemble Classifier (Gentle AdaBoost Algorithm)
In collective classifiers, more than one singular classifier is brought together to enhance the
classification performance. Algorithms such as decision trees, support vector machines, the
Naive Bayes method, linear separators, and artificial neural networks are widely used as single
classifiers [28].
Boosting is a general technique used in machine learning that aims to extract a robust
classifier from a combination of weak classifiers. The Adaboost algorithm proposed by Freund
and Schapire which was the first practical boosting algorithm (Freund, Y., and Schapire, R. E.,
1995), which serves in many fields of applications (Freund, Y., Schapire, R., and Abe, N.,
1999).
The Adaboost algorithm takes input a training set of m examples (𝑥𝑖, 𝑦𝑖), 𝑖 = 1: 𝑚, where
𝑥𝑖 ∈ 𝑋 is a vector-valued feature, 𝑦𝑖 ∈ {−1, +1} is the class label associated with 𝑥𝑖. The

81
Adaboost algorithm calls a weak classifier repeatedly in a series of rounds 𝑡 = 1, … , 𝑇. On
each round t, the distribution 𝐷𝑡 provided to weak learning algorithm over the training set. A
given weak classifier is applied to find a weak hypothesis ℎ𝑡: 𝑋 → {−1, +1} matches with the
distribution 𝐷𝑡 that indicates the necessity of examples in the data set for the classification.
The weights of each incorrectly classified example are increased or alternatively the weights
of each correctly classified example (with low weighted error 휀𝑡 relative to 𝐷𝑡) are decreased.
Once the weak hypothesis ℎ𝑡 has been received, Adaboost chooses a parameter 𝛼𝑡 which
measures the importance that is assigned to ht. For this, a coefficient 𝛼𝑡 is calculated as:
𝛼𝑡 =1
2𝑙𝑛 (
1−𝜀𝑡
𝜀𝑡) (4-17)
The final hypothesis H computes the sign of a weighted combination of weak hypotheses:
𝐻(𝑥) = 𝑠𝑖𝑔𝑛(∑ 𝛼𝑡𝑇𝑡=1 ℎ𝑡(𝑥)) (4-18)
A weak classifier should satisfy two conditions; it should do better than random guessing and
should have enough computational power to learn a problem. The simplest weak classifiers are
decision stumps, decision trees with only one decision node. A decision stump has the
following form: ℎ(𝑥) = 𝑠(𝑥𝑘 > 𝑐) , where 𝑐 ∈ 𝑅, 𝑘 ∈ {1, … , 𝐾}: 𝐾 is the dimension of 𝑥𝑘, and
𝑠 ∈ {−1,1}. In other words, the decision stump gives a prediction based on the value of a single
input.
Many variants of the Adaboost algorithm were proposed to enhance the basic algorithm, such
as Real Adaboost and Gentle Adaboost. Real Adaboost is more generalized from discrete
Adaboost, where the weak learners can output a real value ℎ𝑡(𝑥) ∈ 𝑅. The sign of this output
gives the predicted label {−1, +1} and its value provides a measure of confidence level in this
prediction. Gentle Adaboost (Friedman, J., Hastie, T., & Tibshirani, R., 2000) is a modified
version of the Real AdaBoost algorithm. It utilizes a weighting scheme that exploits a function
of margins, which decreases slower than the exponential function used by the Adaboost
algorithm. Newton steps are used to minimize the exponential loss function of Adaboost
(Mekhalfa, F., and Nacereddine, N., 2017) . Gentle AdaBoost Algorithm nowadays the most
successful boosting procedure because of its robustness and stability to noisy data.
4.5 Results
After selecting three different types of classifiers, the offline procedure was used to train and
test these classifiers to select the model that will be best used for the verification system after

82
calculating the performance analysis parameters. Testing the system has been conducted by the
data that kept for testing, representing 30% of the database. As the system is designed to be
used for user verification, the user should input the user name first and then enter the biometrics
identity.
The parameter values for the three classifiers were selected after performing a cross-
validation process for each classifier. Each classifier was used to train and test the same dataset
for a different set of parameters. Table 4-1 shows the selected parameter for each classifier
used in the training and testing of the data. The best model for each version of the three
classifiers was selected based on its performance. Next, a statistical study was used to compare
the testing results to select the best classifier among the three classifiers (KNN, LDA, and
Ensemble classifier). First, each classifier was run for thirty trials, and the testing accuracy for
the classification was stored in a table. The Ensemble classifier algorithm produced the highest
testing accuracy of 98.5%. The LDA classifier provided a testing accuracy equal to 98.3%.
Furthermore, The KNN classifier provided a mean value of the testing accuracy equal to 97.4%.
The results of the average accuracy for the three classifiers are presented in Figure 4-6.
Table 4-1 Selected Parameters for the Classifiers in Users Verification System
k-nearest Neighbors
Number of neighbors 2
Distance metric Minkowski
Distance Weight Inverse
Exponent 0.57
Linear Discriminant Analysis
Delta 0.01
Gamma 0.7
Discriminant Type PseudoLinear
Ensemble Classifier
Weak Learner Decision Tree
Method GentleBoost
Number of Learning Cycles 11
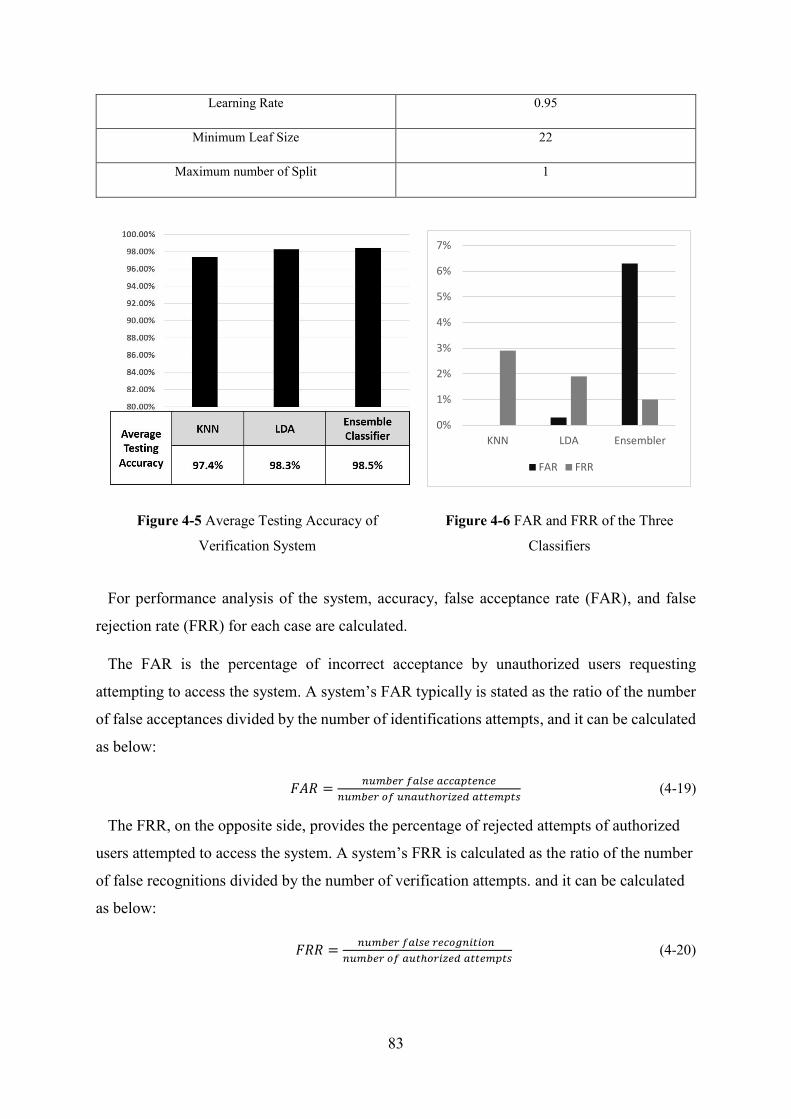
83
Learning Rate 0.95
Minimum Leaf Size 22
Maximum number of Split 1
Figure 4-5 Average Testing Accuracy of
Verification System
Figure 4-6 FAR and FRR of the Three
Classifiers
For performance analysis of the system, accuracy, false acceptance rate (FAR), and false
rejection rate (FRR) for each case are calculated.
The FAR is the percentage of incorrect acceptance by unauthorized users requesting
attempting to access the system. A system’s FAR typically is stated as the ratio of the number
of false acceptances divided by the number of identifications attempts, and it can be calculated
as below:
𝐹𝐴𝑅 =𝑛𝑢𝑚𝑏𝑒𝑟 𝑓𝑎𝑙𝑠𝑒 𝑎𝑐𝑐𝑎𝑝𝑡𝑒𝑛𝑐𝑒
𝑛𝑢𝑚𝑏𝑒𝑟 𝑜𝑓 𝑢𝑛𝑎𝑢𝑡ℎ𝑜𝑟𝑖𝑧𝑒𝑑 𝑎𝑡𝑡𝑒𝑚𝑝𝑡𝑠 (4-19)
The FRR, on the opposite side, provides the percentage of rejected attempts of authorized
users attempted to access the system. A system’s FRR is calculated as the ratio of the number
of false recognitions divided by the number of verification attempts. and it can be calculated
as below:
𝐹𝑅𝑅 =𝑛𝑢𝑚𝑏𝑒𝑟 𝑓𝑎𝑙𝑠𝑒 𝑟𝑒𝑐𝑜𝑔𝑛𝑖𝑡𝑖𝑜𝑛
𝑛𝑢𝑚𝑏𝑒𝑟 𝑜𝑓 𝑎𝑢𝑡ℎ𝑜𝑟𝑖𝑧𝑒𝑑 𝑎𝑡𝑡𝑒𝑚𝑝𝑡𝑠 (4-20)
0%
1%
2%
3%
4%
5%
6%
7%
KNN LDA Ensembler
FAR FRR
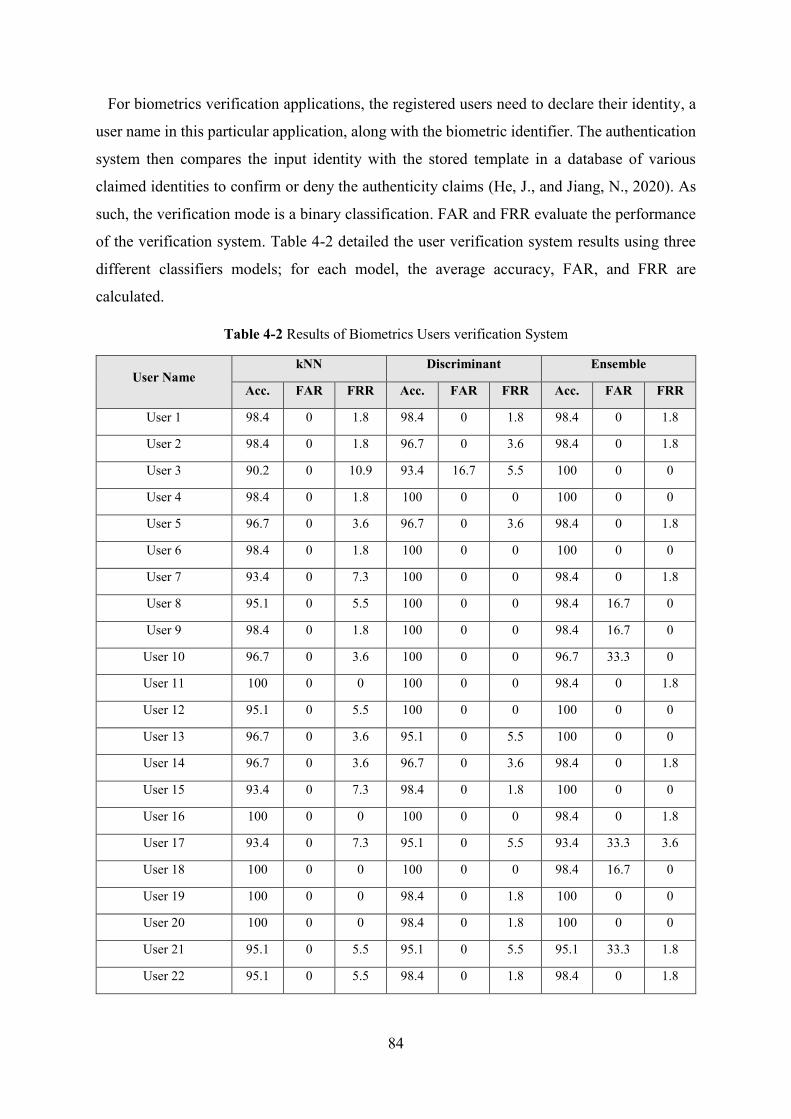
84
For biometrics verification applications, the registered users need to declare their identity, a
user name in this particular application, along with the biometric identifier. The authentication
system then compares the input identity with the stored template in a database of various
claimed identities to confirm or deny the authenticity claims (He, J., and Jiang, N., 2020). As
such, the verification mode is a binary classification. FAR and FRR evaluate the performance
of the verification system. Table 4-2 detailed the user verification system results using three
different classifiers models; for each model, the average accuracy, FAR, and FRR are
calculated.
Table 4-2 Results of Biometrics Users verification System
User Name kNN Discriminant Ensemble
Acc. FAR FRR Acc. FAR FRR Acc. FAR FRR
User 1 98.4 0 1.8 98.4 0 1.8 98.4 0 1.8
User 2 98.4 0 1.8 96.7 0 3.6 98.4 0 1.8
User 3 90.2 0 10.9 93.4 16.7 5.5 100 0 0
User 4 98.4 0 1.8 100 0 0 100 0 0
User 5 96.7 0 3.6 96.7 0 3.6 98.4 0 1.8
User 6 98.4 0 1.8 100 0 0 100 0 0
User 7 93.4 0 7.3 100 0 0 98.4 0 1.8
User 8 95.1 0 5.5 100 0 0 98.4 16.7 0
User 9 98.4 0 1.8 100 0 0 98.4 16.7 0
User 10 96.7 0 3.6 100 0 0 96.7 33.3 0
User 11 100 0 0 100 0 0 98.4 0 1.8
User 12 95.1 0 5.5 100 0 0 100 0 0
User 13 96.7 0 3.6 95.1 0 5.5 100 0 0
User 14 96.7 0 3.6 96.7 0 3.6 98.4 0 1.8
User 15 93.4 0 7.3 98.4 0 1.8 100 0 0
User 16 100 0 0 100 0 0 98.4 0 1.8
User 17 93.4 0 7.3 95.1 0 5.5 93.4 33.3 3.6
User 18 100 0 0 100 0 0 98.4 16.7 0
User 19 100 0 0 98.4 0 1.8 100 0 0
User 20 100 0 0 98.4 0 1.8 100 0 0
User 21 95.1 0 5.5 95.1 0 5.5 95.1 33.3 1.8
User 22 95.1 0 5.5 98.4 0 1.8 98.4 0 1.8

85
User 23 95.1 0 5.5 98.4 0 1.8 100 0 0
User 24 98.4 0 1.8 100 0 0 100 0 0
User 25 98.4 0 1.8 96.7 0 3.6 98.4 0 1.8
User 26 100 0 0 100 0 0 98.4 16.7 0
User 27 100 0 0 100 0 0 100 0 0
User 28 98.4 0 1.8 100 0 0 100 0 0
User 29 100 0 0 100 0 0 96.7 0 3.6
User 30 98.4 0 1.8 100 0 0 98.4 0 1.8
User 31 95.1 0 5.5 98.4 0 1.8 98.4 0 1.8
User 32 95.1 0 5.5 95.1 0 5.5 95.1 33.3 1.8
User 33 98.4 0 1.8 100 0 0 100 0 0
User 34 100 0 0 100 0 0 100 0 0
User 35 98.4 0 1.8 96.7 0 3.6 98.4 0 1.8
User 36 96.7 0 3.6 95.1 0 5.5 96.7 0 3.6
User 37 96.7 0 3.6 100 0 0 96.7 16.7 1.8
User 38 98.4 0 1.8 96.7 0 3.6 98.4 0 1.8
User 39 96.7 0 3.6 96.7 0 3.6 96.7 16.7 1.8
User 40 100 0 0 100 0 0 100 0 0
User 41 100 0 0 100 0 0 100 0 0
User 42 100 0 0 100 0 0 100 0 0
User 43 96.7 0 3.6 98.4 0 1.8 98.4 16.7 0
User 44 93.4 0 7.3 96.7 0 3.6 100 0 0
User 45 96.7 0 3.6 96.7 0 3.6 98.4 0 1.8
User 46 98.4 0 1.8 98.4 0 1.8 100 0 0
User 47 98.4 0 1.8 100 0 0 96.7 33.3 0
User 48 96.7 0 3.6 96.7 0 3.6 98.4 0 1.8
User 49 98.4 0 1.8 98.4 0 1.8 100 0 0
User 50 95.1 0 5.5 100 0 0 100 0 0
User 51 93.4 0 7.3 95.1 0 5.5 93.4 33.3 3.6
User 52 100 0 0 100 0 0 100 0 0
User 53 100 0 0 98.4 0 1.8 100 0 0
User 54 93.4 0 7.3 96.7 0 3.6 93.4 16.7 5.5
User 55 98.4 0 1.8 98.4 0 1.8 98.4 0 1.8
User 56 100 0 0 96.7 0 3.6 98.4 16.7 0

86
Mean 97.4 0 2.9 98.3 0.3 1.9 98.5 6.3 1
In all the verification scenarios and for each type of classifiers presented in this research,
FAR and FRR are calculated. For the KNN classifier, the average value of FAR is 0% means
non of the users is able to access any other user even by mimicking the hand actions, and the
FRR is 2.9%, which points out of 100 user, 2.9 users weren’t able to access the system due to
a deviation in the hand actions which represents the password of their own. For the LDA
classifier, the FAR is 0.3%, and FRR is 1.9%. While applying Ensemble Classifier gave FAR
6.3% and FRR 1%. Figure 4-6 Shows the FAR and FRR of the three classifiers.
The ensemble classifier shows the best accuracy in the three classifiers, but the KNN
classifier gave FAR of 0% and FRR of 2.9%. This makes the KNN is the best algorithm used
in the verification biometrics system presented in this chapter.
A Graphical User Interface (GUI) is developed as a tool for the users to check the system's
robustness. The system requires users to declare their identity by entering the user name. The
user name entered is case sensitive to provide a more secure biometrics system. If the user
entered the wrong user name, the system would deny access. If the user entered the correct user
name, the system would ask the user to input the biometrics password, a combination of hand
actions. The system extracts the features from the entered sEMG signals and compares the
features with the stored database of trained models for this specific user. If the users entered a
wrong password or the features didn’t match the stored features, the system will deny this user
access.
Table 4-3 Comparison between different research work of sEMG biometrics users verification system
Evaluated work on biometrics verification Accuracy
Seven frequency domain with Radial Basis Function Network using signle-channel
(S. Chantaf,2011)
80 %
CNN with 8 users using multi-channel (R. Shioji, 2018) 94.9%
Frequency domain features and time domain features classified using SVM and
KNN (Kim and Pan, 2017)
85%
4.6 Conclusion
The performance of sEMG signals as a biometric modality for user verification is investigated.
The users were able to perform a custom-set gesture code. The resulting sEMG signals were

87
captured and proceed as a form of hidden biometric identity. The results indicated that the
custom-set gesture code improves verification performance. The set of frequency and time-
domain features extracted in this study allowed for improved classifier accuracy. The KNN
classifier was found to be optimum, with an average accuracy of 97.4%. The FAR and FRR of
the KNN classifier results are 0% and 2.9%, respectively.
88
5 Chapter 5 sEMG Machine-learning based
Biometrics Modality for Users Identification
Chapter Content
5.1 Introduction ............................................................................................................... 89
5.2 Features Extraction .................................................................................................... 91
5.3 Machine Learning Model .......................................................................................... 93
5.4 Results ....................................................................................................................... 94
5.5 Conclusion ................................................................................................................. 97
Summary: In the user’s identification system, a total of 5 features are extracted from the signals to
identify between the users from their biometrics identity without declaring their identity. Three
classifiers are used to classify the data, KNN, LDA, and Ensemble of Classifiers as well. The average
accuracy of the KNN classifier proved the concept of using the sEMG for the user’s identification
system.
The chapter starts with an introduction to the identification system based on the sEMG signal in section
5.1. The five extracted features in the time-domain are explained in section 5.2. Section 5.3 describes
the three machine learning models. The results of the sEMG biometrics identification system are
presented in section 5.4.

89
5.1 Introduction
the muscle activation process produces an sEMG signal. It is usually measured through the
surface differential or double differential electrodes, as explained in the previous chapters.
sEMG signal amplitude is always measured in millivolts. sEMG signal has a wide variety of
applications. In this chapter, multi-users’ biometrics identification systems will be explained
in detail, showing the steps of implementing the system.
The physiology of the user is affecting the sEMG signal. Muscle position, orientation, shape,
and size are altered during human movement while attaching the sensors to their muscles.
While neural activity, blood flow, and skin conductivity can differ depending on the user’s
mental state. These produce variability into the sEMG signal, which same hand gestures that
look identical will always give you different EMG signals.
Everyone is different from others, and every reading is different, but ignoring which factors
causes differences in the measurement, the reason that makes sEMG contains physiological
dependent variables, provides it with the capability to be used for biometric identification
(Krishnamohan, P. G., and Holi, M. S., 2011).
EMG systems can work within four categories:
1) A single device used by a single user.
2) Multiple devices used by a single user.
3) Single device for multiple users.
4) Multiple devices for multiple users.
Systems that deal with single users using single devices are relatively advanced and have
difficulties with EMG external factors, such as skin-electrode contact, electrodeposition, limb
orientation, and temperature. If these parameters are kept unchanged, the user can train the
system and use it perfectly until physiological factors change enough to affect classification.
Using multiple devices for one user will face a problem, that single users must train various
systems. Each device might behave differently, as the training data will change every time.
Multiple users to use single devices will have the problem that each additional user enrolled in
the system might affect other users' classification, especially if there are significant

90
physiological differences between users. Category 4 contains the difficulties mentioned in
category 2 and category 3.
All categories need a training session initially, and retraining after a user’s physiological
features change significantly to the point that affects classification accuracy. Categories 2, 3,
and 4 would require additional training and calibration.
In the proposed biometrics identification system, category 3 is based on multiple users using
a single device, Myo armband, consisting of eight-channel EMG sensors. sEMG based
biometrics verification system has been analyzed and explained in detail. In this chapter, multi-
users biometrics identification system performance will be studied. The biometrics users'
identification system doesn’t require declaring the identity of the users in advance. Only the
user's password, which is formed by a combination of hand gestures, will be necessary. Myo
armband was used to collect the data of the user's sEMG signals that create a password. Each
user has been asked to select three gestures out of 4 gestures and arrange them in a way to form
a password using hand actions. A database of fifty-six participants has been collected (twenty-
four males and thirty-one females with ages ranging from 16 to 62 years). The database used
in the biometrics identification system study is the same database used in the biometrics
verification system.
The biometrics identification system aims to recognize the system's enrolled users based on
specific features of the individual’s passwords. The schematic chart illustrating the biometrics
identification system's steps is shown in Figure 5-1. There are two paths of the diagram. The
first path is to enroll the users in the system. A database of sEMG gestures that form a password
of each user is created with all the units associated with signal processing, features extraction,
and machine learning to characterize the signals required to identify the users without declaring
their identity. The second path is to the user's identity by matching the enrolled users' identity
with the stored database. The system output, in this case, is the user’s names in the biometrics
identification systems. A database of sEMG signals that form a password is collected from 56
users able-bodied users. The database collection protocol is explained in detail in the section
Database Collection Protocol. Three machine learning models have been used to train the
classifier and obtain the optimum model that produces maximum accuracy.
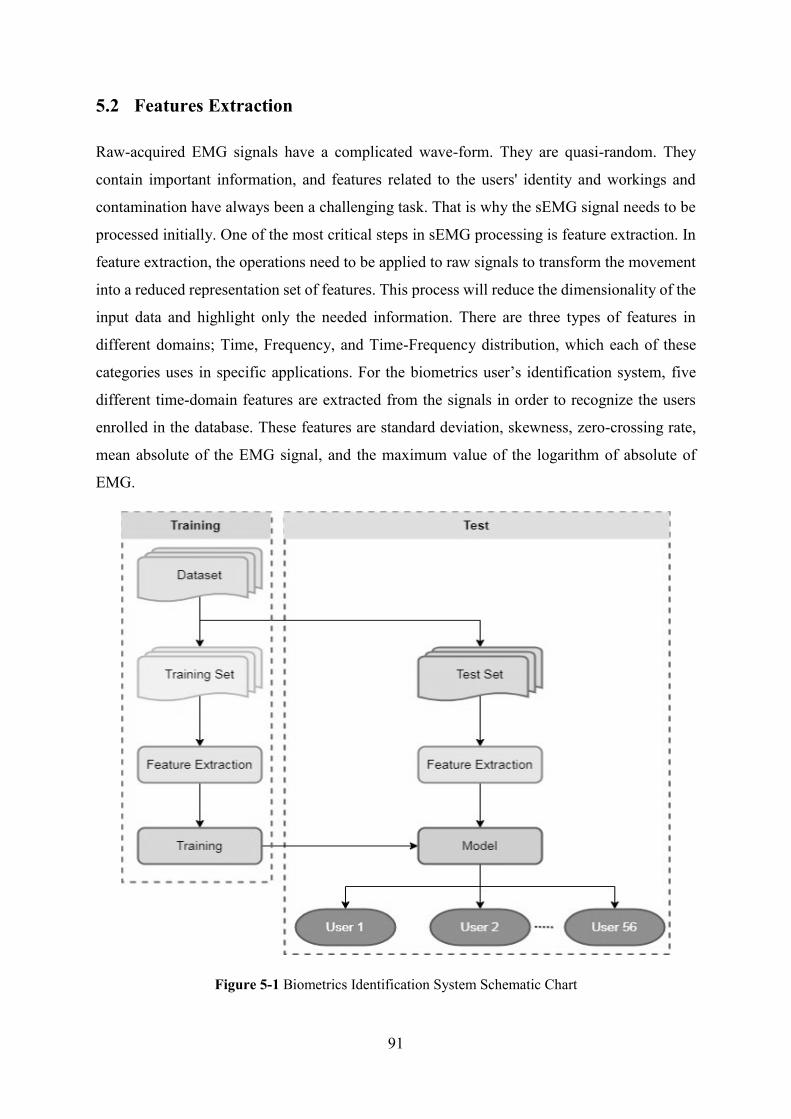
91
5.2 Features Extraction
Raw-acquired EMG signals have a complicated wave-form. They are quasi-random. They
contain important information, and features related to the users' identity and workings and
contamination have always been a challenging task. That is why the sEMG signal needs to be
processed initially. One of the most critical steps in sEMG processing is feature extraction. In
feature extraction, the operations need to be applied to raw signals to transform the movement
into a reduced representation set of features. This process will reduce the dimensionality of the
input data and highlight only the needed information. There are three types of features in
different domains; Time, Frequency, and Time-Frequency distribution, which each of these
categories uses in specific applications. For the biometrics user’s identification system, five
different time-domain features are extracted from the signals in order to recognize the users
enrolled in the database. These features are standard deviation, skewness, zero-crossing rate,
mean absolute of the EMG signal, and the maximum value of the logarithm of absolute of
EMG.
Figure 5-1 Biometrics Identification System Schematic Chart

92
• Standard deviation of EMG
One of the features that are used in the detection of movements of the muscles is the standard
deviation of the sEMG signal. SD is expressed as the square root of the EMG signal's power
and is used to extract features from the EMG data. The SD is defined as:
𝑆𝐷 = √1
𝑁−1∑ (𝑥𝑛)2𝑁
𝑛=1 (5-1)
• Coefficient of dissymmetry of EMG
Skewness is the inclination distribution of the data. It is one of the sEMG signal features that
is used in the time domain function. If the average value's location, the median value, and the
data model on a line in the curve, the data is called, they are typically distributed. But if these
values are not located in one line in the curve occurs the skewness
𝑆𝑘𝑒𝑤𝑛𝑒𝑠𝑠 =1
𝑁∑ (𝑥𝑛−𝜇)3𝑁
𝑛=1
𝜎3 (5-2)
𝜎 = √1
𝑁−1∑ (𝑥𝑛 − 𝜇)2𝑁
𝑛=1 (5-3)
𝜇 = ∑ 𝑥𝑛𝑁𝑛=1 (5-4)
• Zero crossing rate of EMG
Zero-Crossing (ZC) is one of the features that characterize the sEMG signal. It represents the
number of times the amplitude points of sEMG signal crosses zero in the x-axis. In the sEMG
feature, to avoid the background noise, a threshold condition is set. Zero-Crossing gives an
estimate of frequency domain properties. The calculation is defined as:
𝑍𝐶 = ∑ 𝑠𝑔𝑛 (𝑥𝑛 × 𝑥𝑛+1) ∩ |𝑥𝑛 − 𝑥𝑛+1| ≥ 𝑡ℎ𝑟𝑒𝑠ℎ𝑜𝑙𝑑𝑁−1𝑛=1 (5-5)
𝑠𝑔𝑛(𝑥) = {1, 𝑖𝑓 𝑥 ≥ 𝑡ℎ𝑟𝑒𝑠ℎ𝑜𝑙𝑑0, 𝑜𝑡ℎ𝑒𝑟𝑤𝑖𝑠𝑒.
• Mean absolute of EMG
Mean Absolute Value (MAV) is the same as the Average Rectified Value (ARV). MAV can
be found by applying the moving average of full-wave rectified sEMG. This means it is
estimated by calculating the average of the absolute value of the sEMG signal. It is a direct
way to detect the level of muscle contraction. It is a popular feature used in the myoelectric
control application. It is calculated as:
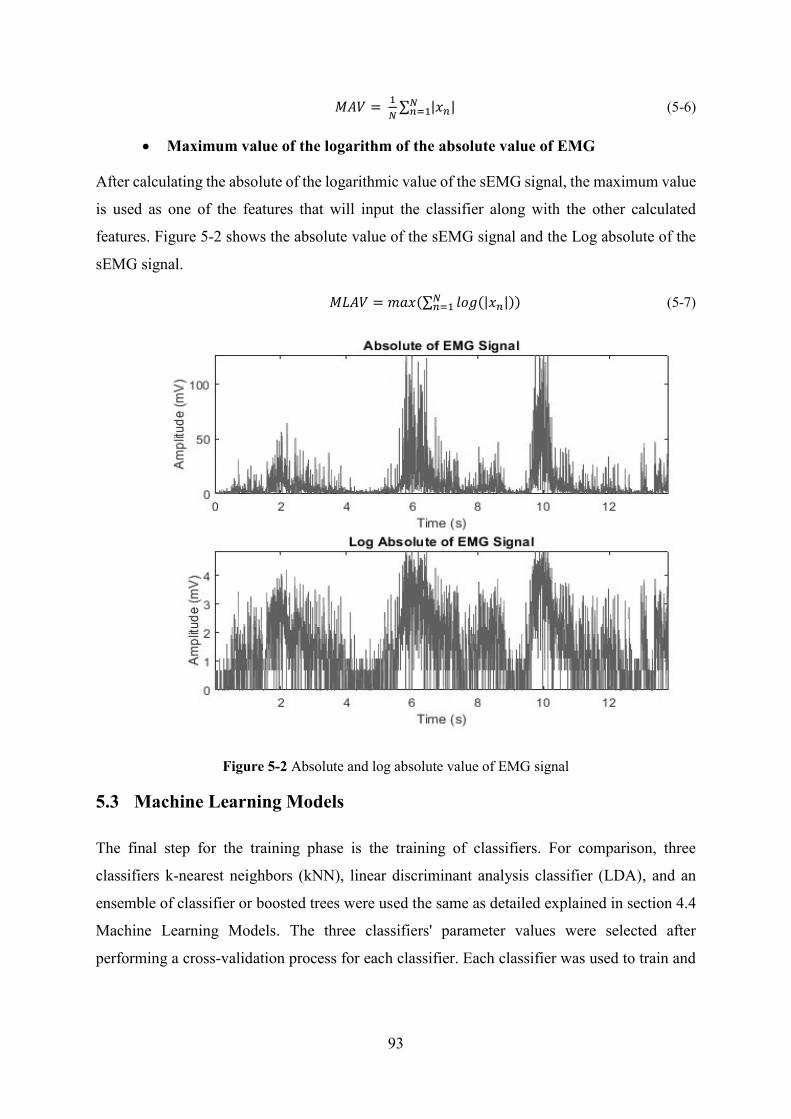
93
𝑀𝐴𝑉 = 1
𝑁∑ |𝑥𝑛|𝑁
𝑛=1 (5-6)
• Maximum value of the logarithm of the absolute value of EMG
After calculating the absolute of the logarithmic value of the sEMG signal, the maximum value
is used as one of the features that will input the classifier along with the other calculated
features. Figure 5-2 shows the absolute value of the sEMG signal and the Log absolute of the
sEMG signal.
𝑀𝐿𝐴𝑉 = 𝑚𝑎𝑥(∑ 𝑙𝑜𝑔(|𝑥𝑛|)𝑁𝑛=1 ) (5-7)
Figure 5-2 Absolute and log absolute value of EMG signal
5.3 Machine Learning Models
The final step for the training phase is the training of classifiers. For comparison, three
classifiers k-nearest neighbors (kNN), linear discriminant analysis classifier (LDA), and an
ensemble of classifier or boosted trees were used the same as detailed explained in section 4.4
Machine Learning Models. The three classifiers' parameter values were selected after
performing a cross-validation process for each classifier. Each classifier was used to train and
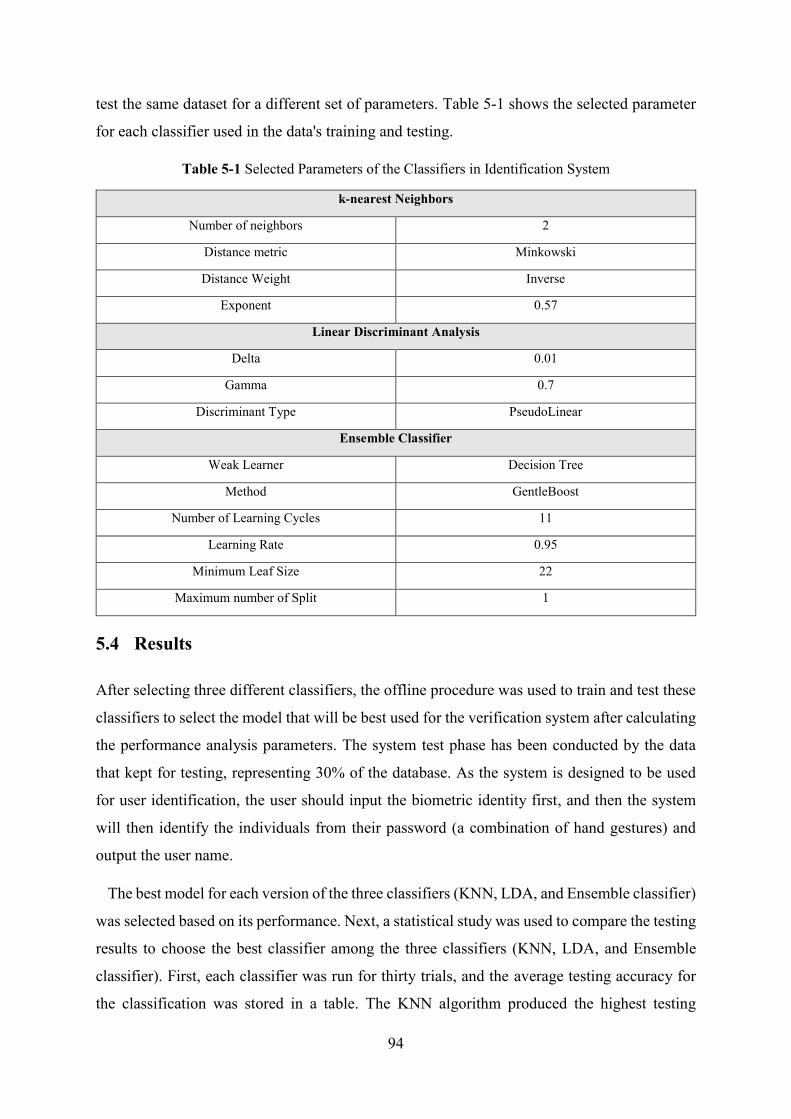
94
test the same dataset for a different set of parameters. Table 5-1 shows the selected parameter
for each classifier used in the data's training and testing.
Table 5-1 Selected Parameters of the Classifiers in Identification System
k-nearest Neighbors
Number of neighbors 2
Distance metric Minkowski
Distance Weight Inverse
Exponent 0.57
Linear Discriminant Analysis
Delta 0.01
Gamma 0.7
Discriminant Type PseudoLinear
Ensemble Classifier
Weak Learner Decision Tree
Method GentleBoost
Number of Learning Cycles 11
Learning Rate 0.95
Minimum Leaf Size 22
Maximum number of Split 1
5.4 Results
After selecting three different classifiers, the offline procedure was used to train and test these
classifiers to select the model that will be best used for the verification system after calculating
the performance analysis parameters. The system test phase has been conducted by the data
that kept for testing, representing 30% of the database. As the system is designed to be used
for user identification, the user should input the biometric identity first, and then the system
will then identify the individuals from their password (a combination of hand gestures) and
output the user name.
The best model for each version of the three classifiers (KNN, LDA, and Ensemble classifier)
was selected based on its performance. Next, a statistical study was used to compare the testing
results to choose the best classifier among the three classifiers (KNN, LDA, and Ensemble
classifier). First, each classifier was run for thirty trials, and the average testing accuracy for
the classification was stored in a table. The KNN algorithm produced the highest testing
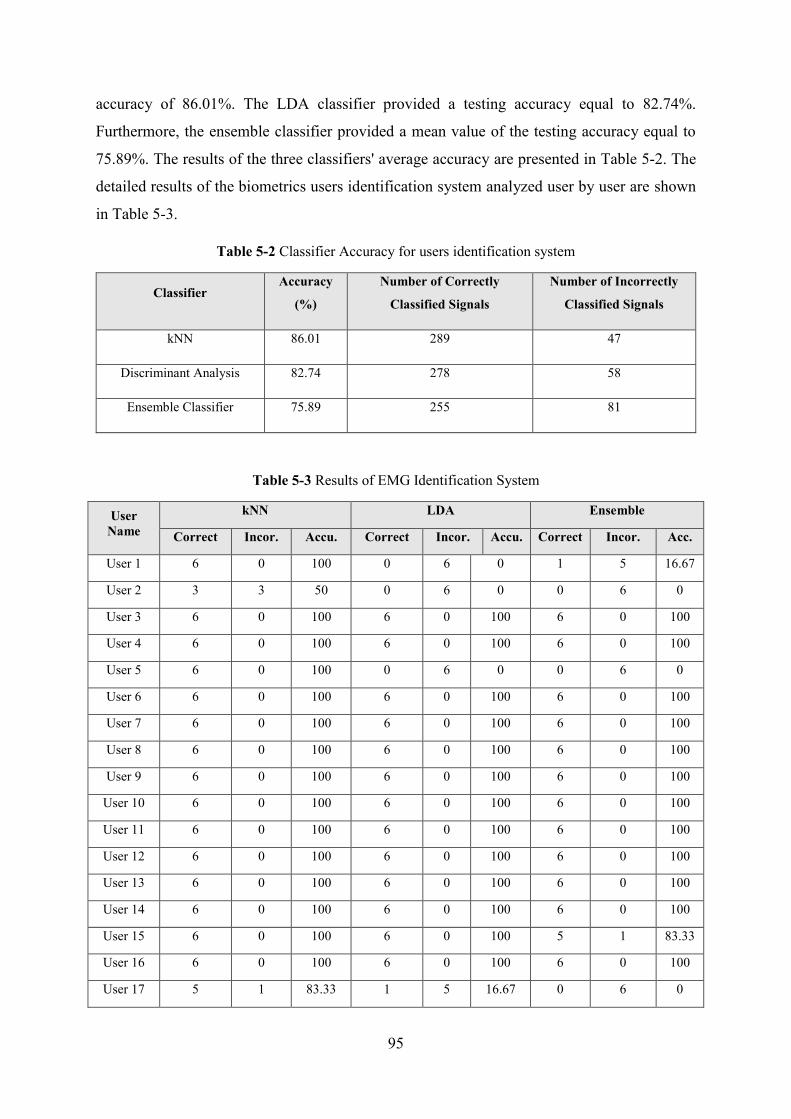
95
accuracy of 86.01%. The LDA classifier provided a testing accuracy equal to 82.74%.
Furthermore, the ensemble classifier provided a mean value of the testing accuracy equal to
75.89%. The results of the three classifiers' average accuracy are presented in Table 5-2. The
detailed results of the biometrics users identification system analyzed user by user are shown
in Table 5-3.
Table 5-2 Classifier Accuracy for users identification system
Classifier Accuracy
(%)
Number of Correctly
Classified Signals
Number of Incorrectly
Classified Signals
kNN 86.01 289 47
Discriminant Analysis 82.74 278 58
Ensemble Classifier 75.89 255 81
Table 5-3 Results of EMG Identification System
User
Name
kNN LDA Ensemble
Correct Incor. Accu. Correct Incor. Accu. Correct Incor. Acc.
User 1 6 0 100 0 6 0 1 5 16.67
User 2 3 3 50 0 6 0 0 6 0
User 3 6 0 100 6 0 100 6 0 100
User 4 6 0 100 6 0 100 6 0 100
User 5 6 0 100 0 6 0 0 6 0
User 6 6 0 100 6 0 100 6 0 100
User 7 6 0 100 6 0 100 6 0 100
User 8 6 0 100 6 0 100 6 0 100
User 9 6 0 100 6 0 100 6 0 100
User 10 6 0 100 6 0 100 6 0 100
User 11 6 0 100 6 0 100 6 0 100
User 12 6 0 100 6 0 100 6 0 100
User 13 6 0 100 6 0 100 6 0 100
User 14 6 0 100 6 0 100 6 0 100
User 15 6 0 100 6 0 100 5 1 83.33
User 16 6 0 100 6 0 100 6 0 100
User 17 5 1 83.33 1 5 16.67 0 6 0
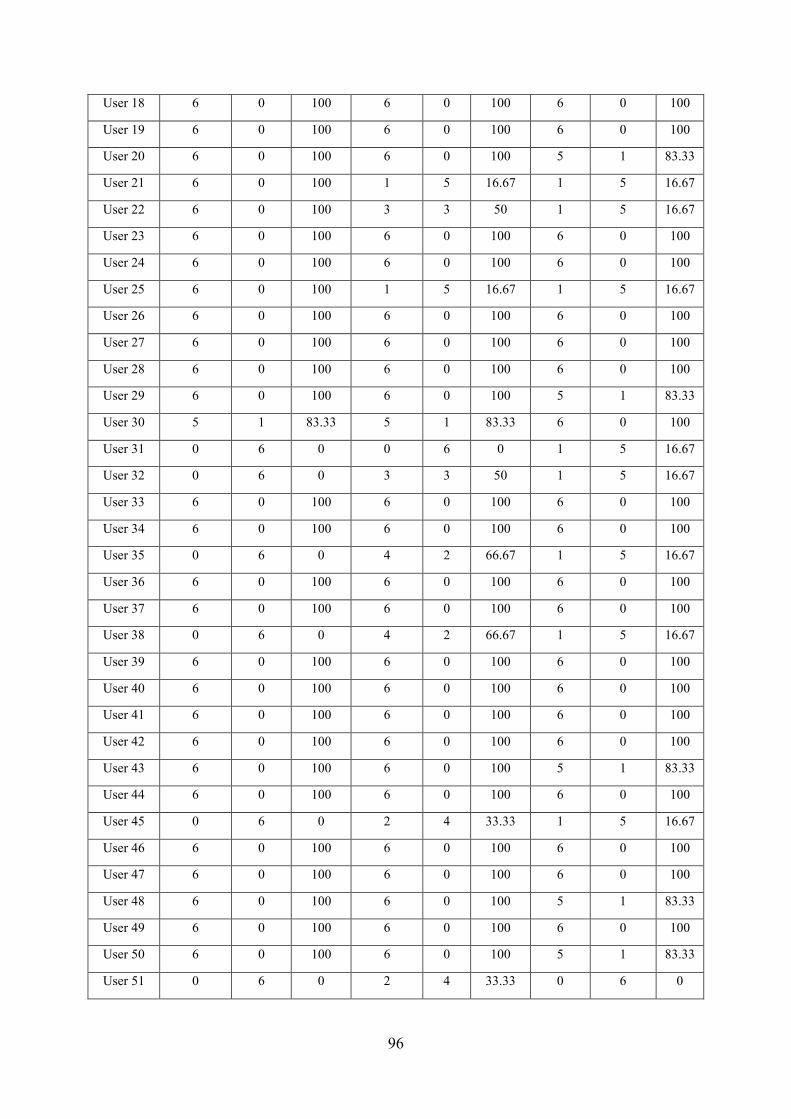
96
User 18 6 0 100 6 0 100 6 0 100
User 19 6 0 100 6 0 100 6 0 100
User 20 6 0 100 6 0 100 5 1 83.33
User 21 6 0 100 1 5 16.67 1 5 16.67
User 22 6 0 100 3 3 50 1 5 16.67
User 23 6 0 100 6 0 100 6 0 100
User 24 6 0 100 6 0 100 6 0 100
User 25 6 0 100 1 5 16.67 1 5 16.67
User 26 6 0 100 6 0 100 6 0 100
User 27 6 0 100 6 0 100 6 0 100
User 28 6 0 100 6 0 100 6 0 100
User 29 6 0 100 6 0 100 5 1 83.33
User 30 5 1 83.33 5 1 83.33 6 0 100
User 31 0 6 0 0 6 0 1 5 16.67
User 32 0 6 0 3 3 50 1 5 16.67
User 33 6 0 100 6 0 100 6 0 100
User 34 6 0 100 6 0 100 6 0 100
User 35 0 6 0 4 2 66.67 1 5 16.67
User 36 6 0 100 6 0 100 6 0 100
User 37 6 0 100 6 0 100 6 0 100
User 38 0 6 0 4 2 66.67 1 5 16.67
User 39 6 0 100 6 0 100 6 0 100
User 40 6 0 100 6 0 100 6 0 100
User 41 6 0 100 6 0 100 6 0 100
User 42 6 0 100 6 0 100 6 0 100
User 43 6 0 100 6 0 100 5 1 83.33
User 44 6 0 100 6 0 100 6 0 100
User 45 0 6 0 2 4 33.33 1 5 16.67
User 46 6 0 100 6 0 100 6 0 100
User 47 6 0 100 6 0 100 6 0 100
User 48 6 0 100 6 0 100 5 1 83.33
User 49 6 0 100 6 0 100 6 0 100
User 50 6 0 100 6 0 100 5 1 83.33
User 51 0 6 0 2 4 33.33 0 6 0
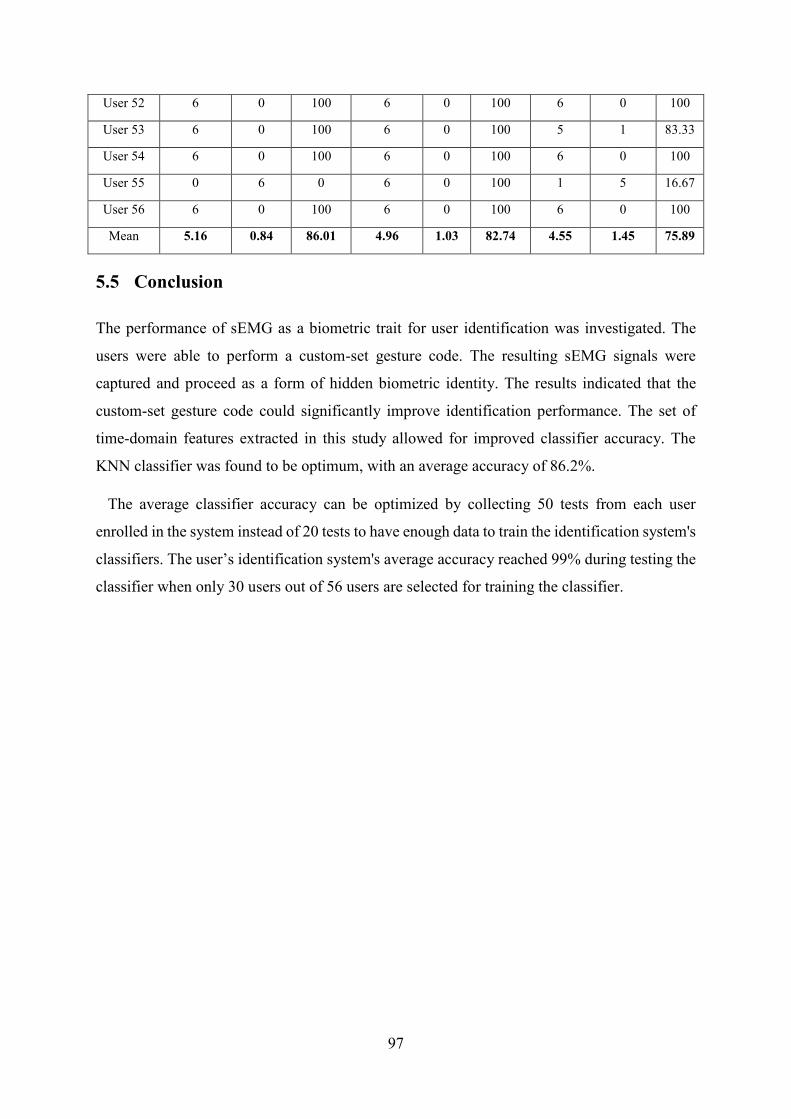
97
User 52 6 0 100 6 0 100 6 0 100
User 53 6 0 100 6 0 100 5 1 83.33
User 54 6 0 100 6 0 100 6 0 100
User 55 0 6 0 6 0 100 1 5 16.67
User 56 6 0 100 6 0 100 6 0 100
Mean 5.16 0.84 86.01 4.96 1.03 82.74 4.55 1.45 75.89
5.5 Conclusion
The performance of sEMG as a biometric trait for user identification was investigated. The
users were able to perform a custom-set gesture code. The resulting sEMG signals were
captured and proceed as a form of hidden biometric identity. The results indicated that the
custom-set gesture code could significantly improve identification performance. The set of
time-domain features extracted in this study allowed for improved classifier accuracy. The
KNN classifier was found to be optimum, with an average accuracy of 86.2%.
The average classifier accuracy can be optimized by collecting 50 tests from each user
enrolled in the system instead of 20 tests to have enough data to train the identification system's
classifiers. The user’s identification system's average accuracy reached 99% during testing the
classifier when only 30 users out of 56 users are selected for training the classifier.
98
6 Chapter 6 Deep Learning for sEMG Biometrics
System
Chapter Content
6.1 Introduction ............................................................................................................. 100
6.2 Deep Learning for Biometrics Users Verification System...................................... 103
6.2.1 Input Generation .............................................................................................. 103
6.2.2 Continuous Wavelet Transform (CWT) .......................................................... 104
6.2.3 Data Augmentation .......................................................................................... 106
6.2.4 Convolutional Neural Network Structure and Training................................... 106
6.2.5 Testing and Results .......................................................................................... 109
6.3 Deep Learning for Biometrics Users Identification System ................................... 112
6.3.1 Input Generation .............................................................................................. 113
6.3.2 Wavelet Based Denoising ................................................................................ 114
6.3.3 Data Augmentation .......................................................................................... 115
6.3.4 CNN Architecture and Training ....................................................................... 115
6.3.5 Testing and Results .......................................................................................... 116
6.4 Conclusion ............................................................................................................... 117
Summary: Recently, deep learning algorithms have become increasingly more prominent for their
unparalleled ability to learn from large amounts of data automatically. In the field of
electromyography-based biometrics systems, deep learning algorithms are seldom employed as they
require an unreasonable amount of effort from a single person to generate tens of thousands of
examples. In this chapter, data augmentation is used to create a big database out of a smaller database
used in the classical machine learning approach by augmenting multiple users' signals, thus reducing
the recording burden while enhancing the recognition rate. Convolutional Neural Network (CNN) is
used to train the users in the EMG biometrics system. Squeeze net neural network structure is selected
due to its faster training time as it requires fewer parameters while maintaining the accuracy level.
Continuous wavelet transforms (CWT) are applied to the database to estimate the EMG signals'
99
scalograms. The results of the testing accuracy, along with the FAR and FRR values, are calculated. In
the Biometrics Identification system, both raw and denoised sEMG signals are used to generate
scalograms using CWT. Two CNN structures have been applied squeeze-net structure and Alex-net
structure. The classifiers results are mentioned.
The chapter organized as follows, starting with an introduction to the deep learning for sEMG signals
as a biometrics modality in section 6.1. The biometrics verification system applying deep learning steps
are listed in section 6.2, while the biometrics identification system utilizing the deep learning approach
is explained in section 6.3. The chapter ended up with a conclusion for both systems in section 6.4.

100
6.1 Introduction
Distinguishing sEMG signals acquired from multiple users is the core part of the related
applications using sEMG signals as biometrics modality. At present, the literature on
biometrics systems based on sEMG signals primarily focuses on the time and frequency
domain feature extraction of sEMG signals, which aims to distinguish sEMG signals by feature
recognition.
As stated and explained in this thesis, some effective feature combinations have been
proposed in both the time domain and frequency domain as described and implemented in the
previous thesis chapters, and some fruitful results have been achieved with the dataset of the
users collected and explained in detail in section Database Collection Protocol. Selecting the
main features to be extracted is extremely important in that different gestures can be
distinguished by traditional methods. However, it is difficult to improve the performance of
recognition based on sEMG by conventional methods. Nevertheless, designing and selecting
features can be complicated, and the combinations of features are diverse, leading to increased
workload and dissatisfying results (Wu, Y., Zheng, B., and Zhao, Y., 2018).
Utilizing deep neural networks in the classification of sEMG signals has been proposed by
researchers. Wu et al. (Wu, Y., Zheng, B., and Zhao, Y., 2018) proposed LCNN and
CNN_LSTM models. The main advantage of these models is that it can be thought of as
autoencoders for automatic feature extraction, which does not require traditional feature
extraction. The features extraction process requires all efforts and time to optimize the
parameters to get the maximum training and testing accuracy in the classical machine learning
approaches.
In recent years, deep learning has achieved great success in the field of image recognition. A
fantastic idea was presented in (Côté-Allard, U., Fall, C. L., Drouin, A., Campeau-Lecours, A.,
Gosselin, C., Glette, K., and Gosselin, B, 2019), (Cote-Allard, U., Fall, C. L., Campeau-
Lecours, A., Gosselin, C., Laviolette, F., and Gosselin, B., 2017) ta channel's sEMG signals
can form a graph after the short-time Fourier transform or wavelet transform of sEMG signals.
This is a great concept to convert the sEMG signal into an image. This allowed for a generation
of images to represent the signals.
Researchers such as Côté-Allard et al. (Côté-Allard, U., Fall, C. L., Drouin, A., Campeau-
Lecours, A., Gosselin, C., Glette, K., and Gosselin, B, 2019), who regarded the original sEMG
101
signals as an image, constructed the ConvNet model to improve further the classification
accuracy of sEMG signals utilizing the deep-learning. However, the LCNN and CNN_LSTM
models proposed by Wu et al. (Wu, Y., Zheng, B., and Zhao, Y., 2018), and the ConvNet model
used by Côté-Allard et al. (Côté-Allard, U., Fall, C. L., Drouin, A., Campeau-Lecours, A.,
Gosselin, C., Glette, K., and Gosselin, B, 2019), contain many parameters.
In deep learning algorithms, the final test accuracy is directly proportional to the size of the
training data; one participant can’t produce tens of thousands of sEMG signals to be enough to
train the model with deep learning. Therefore, a large amount of data can be obtained by
augmenting the recorded data of multiple participants so that the model can be well pre-trained
to reduce the amount of data required to be obtained from hundreds of users. Meanwhile,
designing a compact deep neural network structure to reduce the number of parameters can
also reduce the need for big data size.
The work presented in this chapter aims to reduce the number of model parameters and
increase the training and testing accuracy of model classification utilizing the deep
convolutional neural network model for the biometrics authentication system. The target of
applying a convolutional neural network (CNN) instead of classical machine learning (ML) is
to avoid the features extraction phase needed in classical machine learning. CNN extracts the
features from input data by itself. However, the time-frequency representation of input signals
is useful when training the CNN model (Madhavan, S., Tripathy, R. K., and Pachori, R. B.,
2019).
AlexNet deep neural network proposed by Krizhevksy et al. (Krizhevsky, A., Sutskever, I.,
and Hinton, G. E., 2012) who won the ImageNet challenge in 2012, deep learning proposed
has achieved great success in speech recognition image classification, and other fields. Images
can be accurately classified by training the neural network model to learn the characteristics of
images. Nowadays, exploring network architecture has become part of deep learning.
Currently, sEMG signal classification deploying deep learning has been successfully used by
some researchers and explored several effective network frameworks (Zia ur Rehman, M.,
Waris, A., Gilani, S. O., Jochumsen, M., Niazi, I. K., Jamil, M., and Kamavuako, E. N., 2018).
Utilizing CNN to classify sEMG signals, researchers in (Atzori, M., Cognolato, M., and Müller,
H., 2016) used the raw signals as input space. The spectrograms of raw sEMG signals were
extracted by applying Short-Time Fourier Transform (STFT) and input into the convolutional
network (Conv-Nets) (Allard, U. C., Nougarou, F., Fall, C. L., Giguère, P., Gosselin, C.,
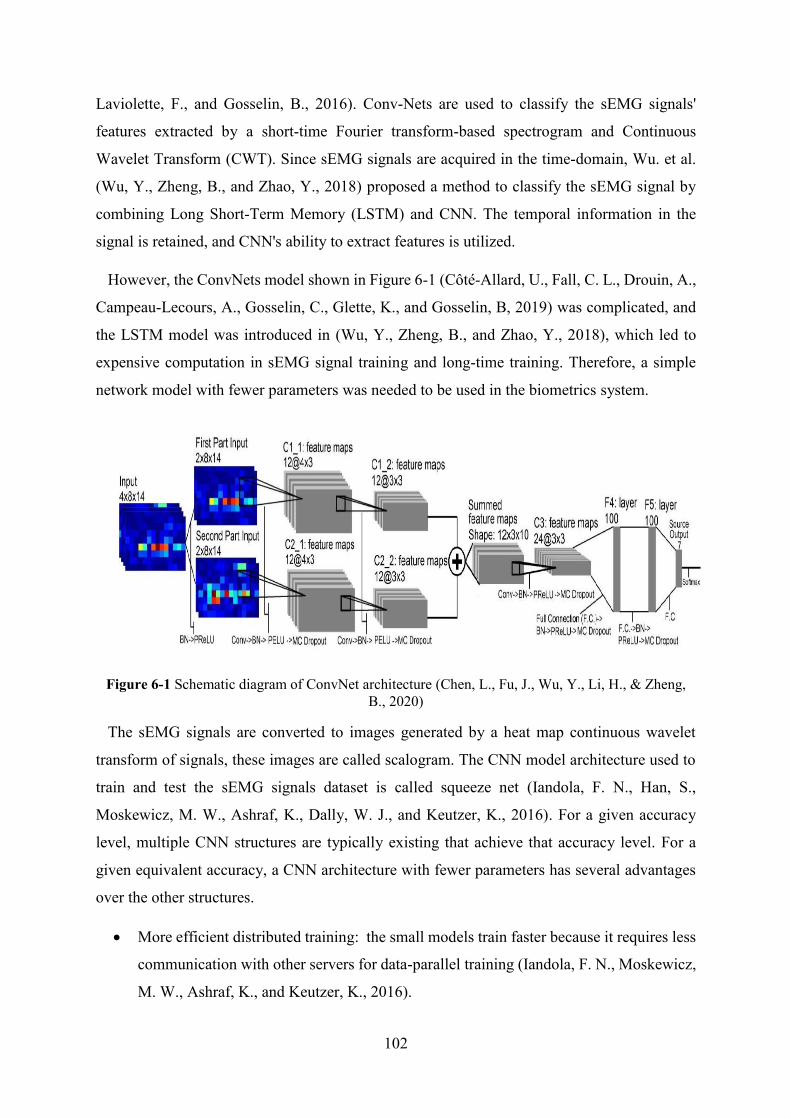
102
Laviolette, F., and Gosselin, B., 2016). Conv-Nets are used to classify the sEMG signals'
features extracted by a short-time Fourier transform-based spectrogram and Continuous
Wavelet Transform (CWT). Since sEMG signals are acquired in the time-domain, Wu. et al.
(Wu, Y., Zheng, B., and Zhao, Y., 2018) proposed a method to classify the sEMG signal by
combining Long Short-Term Memory (LSTM) and CNN. The temporal information in the
signal is retained, and CNN's ability to extract features is utilized.
However, the ConvNets model shown in Figure 6-1 (Côté-Allard, U., Fall, C. L., Drouin, A.,
Campeau-Lecours, A., Gosselin, C., Glette, K., and Gosselin, B, 2019) was complicated, and
the LSTM model was introduced in (Wu, Y., Zheng, B., and Zhao, Y., 2018), which led to
expensive computation in sEMG signal training and long-time training. Therefore, a simple
network model with fewer parameters was needed to be used in the biometrics system.
Figure 6-1 Schematic diagram of ConvNet architecture (Chen, L., Fu, J., Wu, Y., Li, H., & Zheng,
B., 2020)
The sEMG signals are converted to images generated by a heat map continuous wavelet
transform of signals, these images are called scalogram. The CNN model architecture used to
train and test the sEMG signals dataset is called squeeze net (Iandola, F. N., Han, S.,
Moskewicz, M. W., Ashraf, K., Dally, W. J., and Keutzer, K., 2016). For a given accuracy
level, multiple CNN structures are typically existing that achieve that accuracy level. For a
given equivalent accuracy, a CNN architecture with fewer parameters has several advantages
over the other structures.
• More efficient distributed training: the small models train faster because it requires less
communication with other servers for data-parallel training (Iandola, F. N., Moskewicz,
M. W., Ashraf, K., and Keutzer, K., 2016).
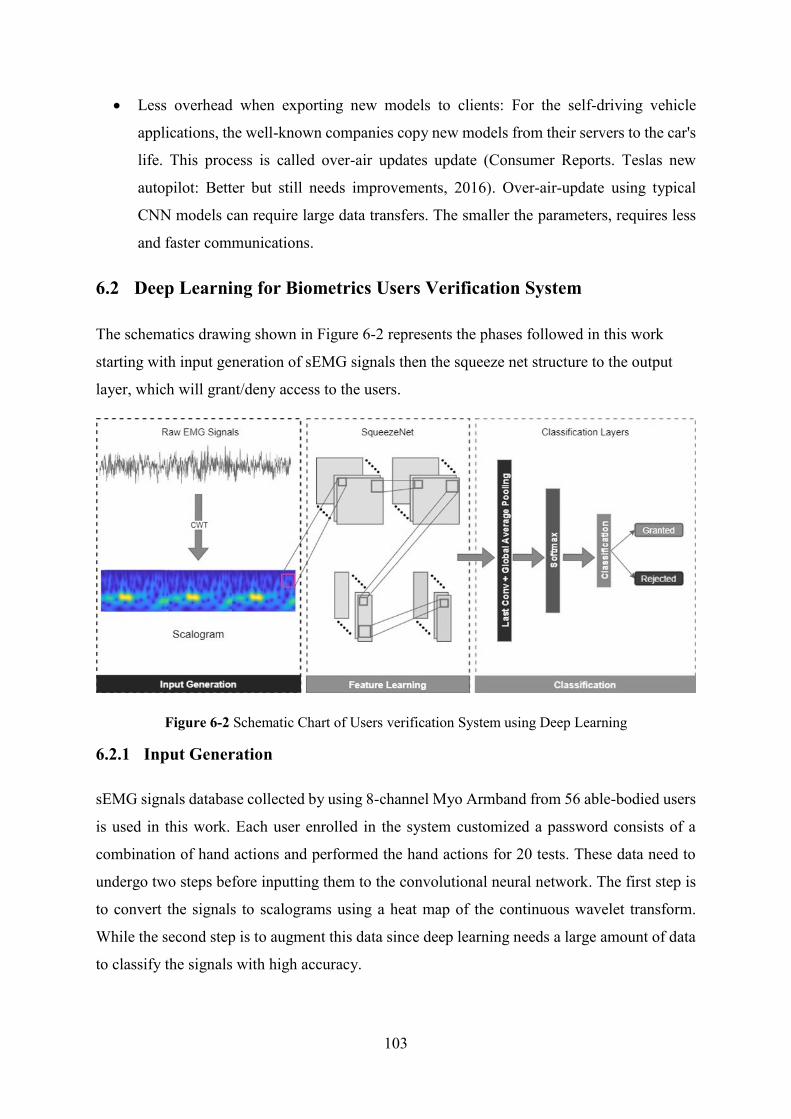
103
• Less overhead when exporting new models to clients: For the self-driving vehicle
applications, the well-known companies copy new models from their servers to the car's
life. This process is called over-air updates update (Consumer Reports. Teslas new
autopilot: Better but still needs improvements, 2016). Over-air-update using typical
CNN models can require large data transfers. The smaller the parameters, requires less
and faster communications.
6.2 Deep Learning for Biometrics Users Verification System
The schematics drawing shown in Figure 6-2 represents the phases followed in this work
starting with input generation of sEMG signals then the squeeze net structure to the output
layer, which will grant/deny access to the users.
Figure 6-2 Schematic Chart of Users verification System using Deep Learning
6.2.1 Input Generation
sEMG signals database collected by using 8-channel Myo Armband from 56 able-bodied users
is used in this work. Each user enrolled in the system customized a password consists of a
combination of hand actions and performed the hand actions for 20 tests. These data need to
undergo two steps before inputting them to the convolutional neural network. The first step is
to convert the signals to scalograms using a heat map of the continuous wavelet transform.
While the second step is to augment this data since deep learning needs a large amount of data
to classify the signals with high accuracy.
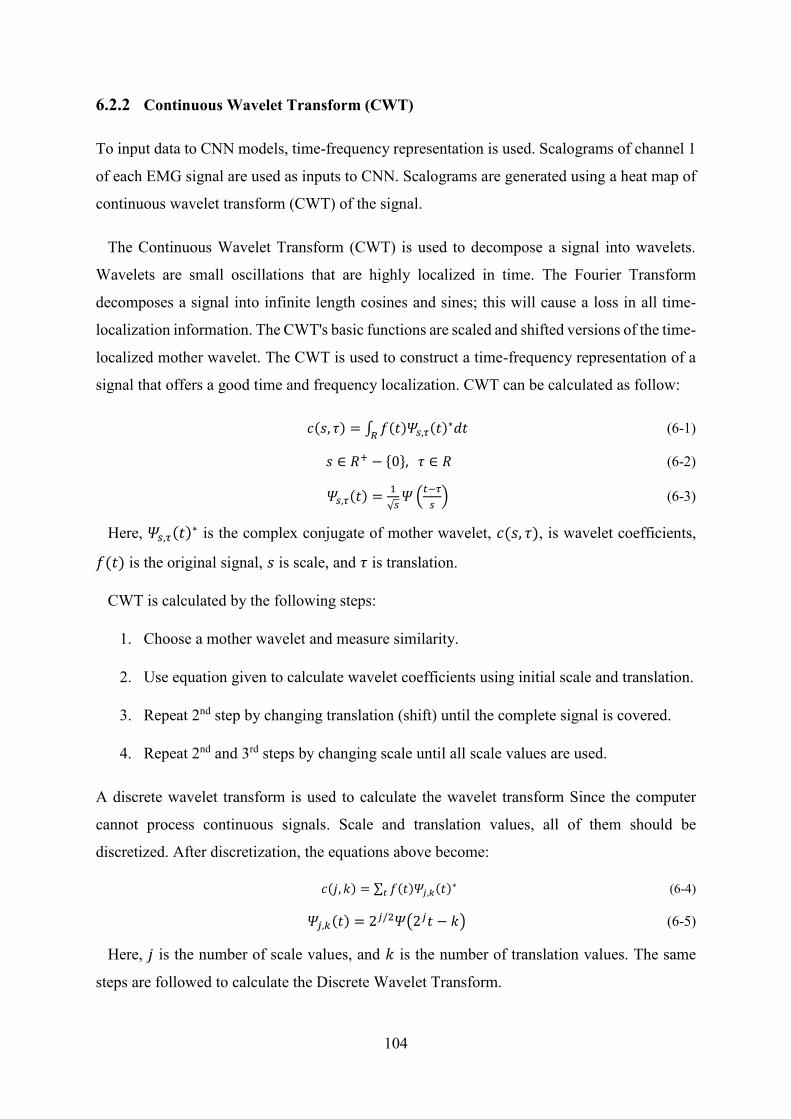
104
6.2.2 Continuous Wavelet Transform (CWT)
To input data to CNN models, time-frequency representation is used. Scalograms of channel 1
of each EMG signal are used as inputs to CNN. Scalograms are generated using a heat map of
continuous wavelet transform (CWT) of the signal.
The Continuous Wavelet Transform (CWT) is used to decompose a signal into wavelets.
Wavelets are small oscillations that are highly localized in time. The Fourier Transform
decomposes a signal into infinite length cosines and sines; this will cause a loss in all time-
localization information. The CWT's basic functions are scaled and shifted versions of the time-
localized mother wavelet. The CWT is used to construct a time-frequency representation of a
signal that offers a good time and frequency localization. CWT can be calculated as follow:
𝑐(𝑠, 𝜏) = ∫ 𝑓(𝑡)𝛹𝑠,𝜏(𝑡)∗𝑑𝑡𝑅
(6-1)
𝑠 ∈ 𝑅+ − {0}, 𝜏 ∈ 𝑅 (6-2)
𝛹𝑠,𝜏(𝑡) =1
√𝑠𝛹 (
𝑡−𝜏
𝑠) (6-3)
Here, 𝛹𝑠,𝜏(𝑡)∗ is the complex conjugate of mother wavelet, 𝑐(𝑠, 𝜏), is wavelet coefficients,
𝑓(𝑡) is the original signal, 𝑠 is scale, and 𝜏 is translation.
CWT is calculated by the following steps:
1. Choose a mother wavelet and measure similarity.
2. Use equation given to calculate wavelet coefficients using initial scale and translation.
3. Repeat 2nd step by changing translation (shift) until the complete signal is covered.
4. Repeat 2nd and 3rd steps by changing scale until all scale values are used.
A discrete wavelet transform is used to calculate the wavelet transform Since the computer
cannot process continuous signals. Scale and translation values, all of them should be
discretized. After discretization, the equations above become:
𝑐(𝑗, 𝑘) = ∑ 𝑓(𝑡)𝛹𝑗,𝑘(𝑡)∗𝑡 (6-4)
𝛹𝑗,𝑘(𝑡) = 2𝑗/2𝛹(2𝑗𝑡 − 𝑘) (6-5)
Here, 𝑗 is the number of scale values, and 𝑘 is the number of translation values. The same
steps are followed to calculate the Discrete Wavelet Transform.
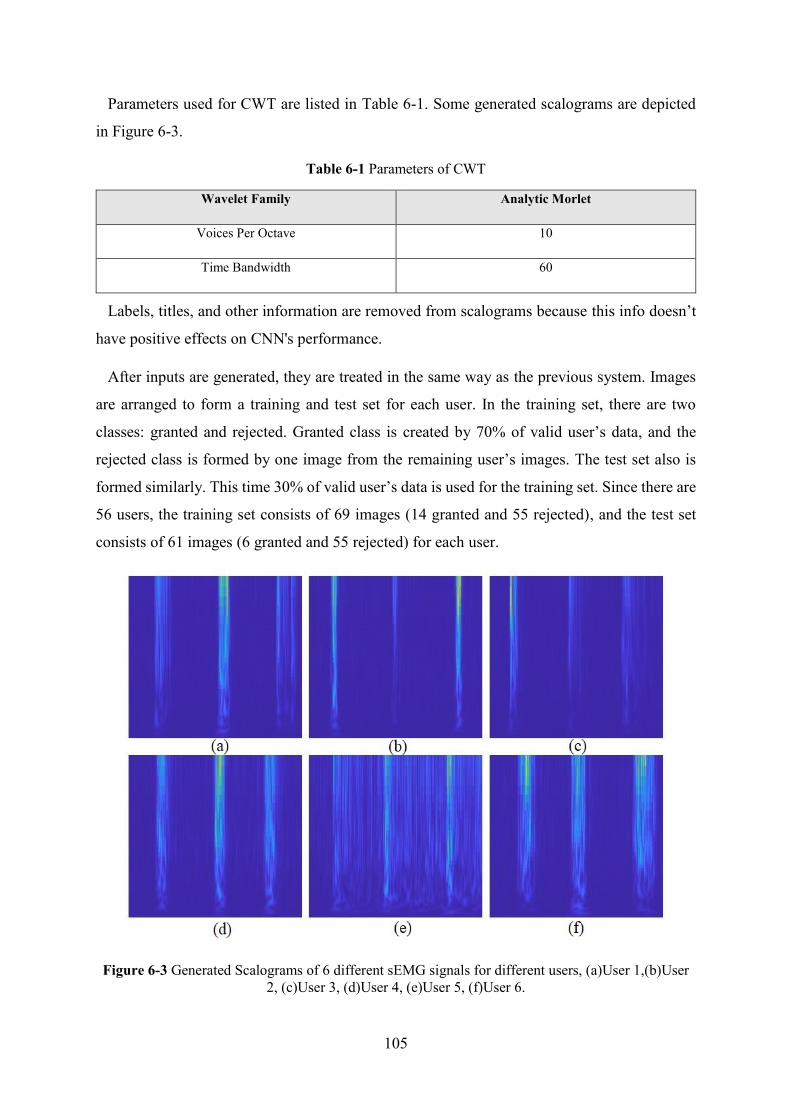
105
Parameters used for CWT are listed in Table 6-1. Some generated scalograms are depicted
in Figure 6-3.
Table 6-1 Parameters of CWT
Wavelet Family Analytic Morlet
Voices Per Octave 10
Time Bandwidth 60
Labels, titles, and other information are removed from scalograms because this info doesn’t
have positive effects on CNN's performance.
After inputs are generated, they are treated in the same way as the previous system. Images
are arranged to form a training and test set for each user. In the training set, there are two
classes: granted and rejected. Granted class is created by 70% of valid user’s data, and the
rejected class is formed by one image from the remaining user’s images. The test set also is
formed similarly. This time 30% of valid user’s data is used for the training set. Since there are
56 users, the training set consists of 69 images (14 granted and 55 rejected), and the test set
consists of 61 images (6 granted and 55 rejected) for each user.
Figure 6-3 Generated Scalograms of 6 different sEMG signals for different users, (a)User 1,(b)User
2, (c)User 3, (d)User 4, (e)User 5, (f)User 6.
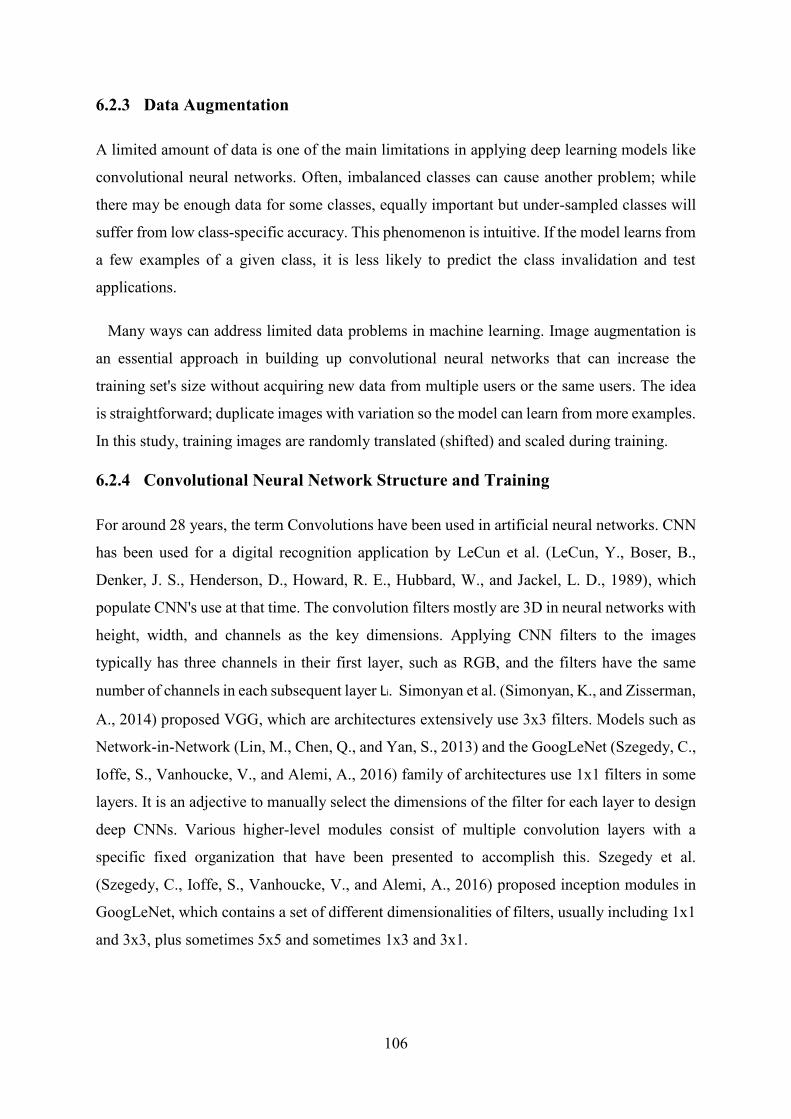
106
6.2.3 Data Augmentation
A limited amount of data is one of the main limitations in applying deep learning models like
convolutional neural networks. Often, imbalanced classes can cause another problem; while
there may be enough data for some classes, equally important but under-sampled classes will
suffer from low class-specific accuracy. This phenomenon is intuitive. If the model learns from
a few examples of a given class, it is less likely to predict the class invalidation and test
applications.
Many ways can address limited data problems in machine learning. Image augmentation is
an essential approach in building up convolutional neural networks that can increase the
training set's size without acquiring new data from multiple users or the same users. The idea
is straightforward; duplicate images with variation so the model can learn from more examples.
In this study, training images are randomly translated (shifted) and scaled during training.
6.2.4 Convolutional Neural Network Structure and Training
For around 28 years, the term Convolutions have been used in artificial neural networks. CNN
has been used for a digital recognition application by LeCun et al. (LeCun, Y., Boser, B.,
Denker, J. S., Henderson, D., Howard, R. E., Hubbard, W., and Jackel, L. D., 1989), which
populate CNN's use at that time. The convolution filters mostly are 3D in neural networks with
height, width, and channels as the key dimensions. Applying CNN filters to the images
typically has three channels in their first layer, such as RGB, and the filters have the same
number of channels in each subsequent layer Li. Simonyan et al. (Simonyan, K., and Zisserman,
A., 2014) proposed VGG, which are architectures extensively use 3x3 filters. Models such as
Network-in-Network (Lin, M., Chen, Q., and Yan, S., 2013) and the GoogLeNet (Szegedy, C.,
Ioffe, S., Vanhoucke, V., and Alemi, A., 2016) family of architectures use 1x1 filters in some
layers. It is an adjective to manually select the dimensions of the filter for each layer to design
deep CNNs. Various higher-level modules consist of multiple convolution layers with a
specific fixed organization that have been presented to accomplish this. Szegedy et al.
(Szegedy, C., Ioffe, S., Vanhoucke, V., and Alemi, A., 2016) proposed inception modules in
GoogLeNet, which contains a set of different dimensionalities of filters, usually including 1x1
and 3x3, plus sometimes 5x5 and sometimes 1x3 and 3x1.

107
The convolutional neural network is a deep neural network class principally applied to
images for classification, object detection, segmentation, and image processing (Mahajan, N.
V., Deshpande, A. S., and Satpute, S. S., 2019). A CNN can consist of several types of layers:
convolution, rectified linear unit (ReLu), pooling, dropout, fully connected (FC).
• Convolution Layer: This layer is the building block of CNN. In this layer, image or
feature maps from the previous layer are convolved with sliding kernels to extract new
features.
• ReLu Layer: This layer removes negative values from feature maps by applying
activation function 𝑓(𝑥) = max (0, 𝑥) to introduce nonlinearity in feature maps.
• Pooling Layers: This layer reduces the dimensionality of feature maps by sliding
windows, calculating the mean, max, or sum of values inside the window to make the
network invariant to small transformations.
• Dropout Layer: This layer sets input elements to zero with a given probability to reduce
overfitting.
• Fully Connected Layer: This layer is a traditional multi-layer perceptron which uses
softmax activation function in the output layer. It classifies inputs images using features
extracted by previous layers.
• Squeeze-net structure
The CNN architecture used in this work has a few parameters (Squeeze-net). It consists of a
Fire module, a new building block out of which to build CNN architectures. The squeeze-net
was constructed mainly from fire modules. The main objective of implementing squeeze-net
to maintain accuracy with CNN structure with fewer parameters. To accomplish this target,
three strategies applied in the structure of the squeeze-net:
• Use 1x1 filters instead of 3x3 filters: For an adequate number of convolution filters,
most of the filters should be 1x1 since a 1x1 filter has nine times fewer parameters
compared to a 3x3 filter.
• The number of input-channels to be reduced to 3x3 filters: A convolution layer
composed of 3x3 filters. The total number of parameters in this convolutional layer is
equal to (number of input channels) * (number of filters) * (3*3). To keep a low number

108
of parameters in a CNN, the number of 3x3 filters must be decreased and reduce the
number of input channels to the 3x3 filters.
• To increase the size of activation maps in the convolution layers by down sample late
in the network: In the network, each convolution layer produces an output activation
map with a spatial resolution that is at least 1x1 and often much larger than 1x1. The
activation maps height and width are controlled by the input data size and the choice of
layers to down-sample in the CNN architecture
The Fire module is composed of a squeeze convolution layer (which has only 1x1 filters),
inputting into an expand layer that has a combination of 1x1 and 3x3 convolution filters as
illustrated in Figure 6-4. The freedom of use of 1x1 filters in Fire modules is to reduce the
number of parameters inputting the network. In a Fire module, s1x1 is the filter number in the
squeeze layer (all 1x1), e1x1 is the number of 1x1 filters in the expand layer, and e3x3 is the
number of 3x3 filters in the expand layer. The rule here is if the fire modules set to be s1x1, it
should be less than (e1x1 + e3x3), the squeeze layer assists in eliminating the number of input
channels to the 3x3 filters.
Figure 6-4 Organization of Fire Modules in the Convolutional Layer
The Squeeze-Net starts with a separate convolution layer (conv1), then 8 Fire modules, and
finishes with a final conv layer (conv10). The number of filters increases per fire module from
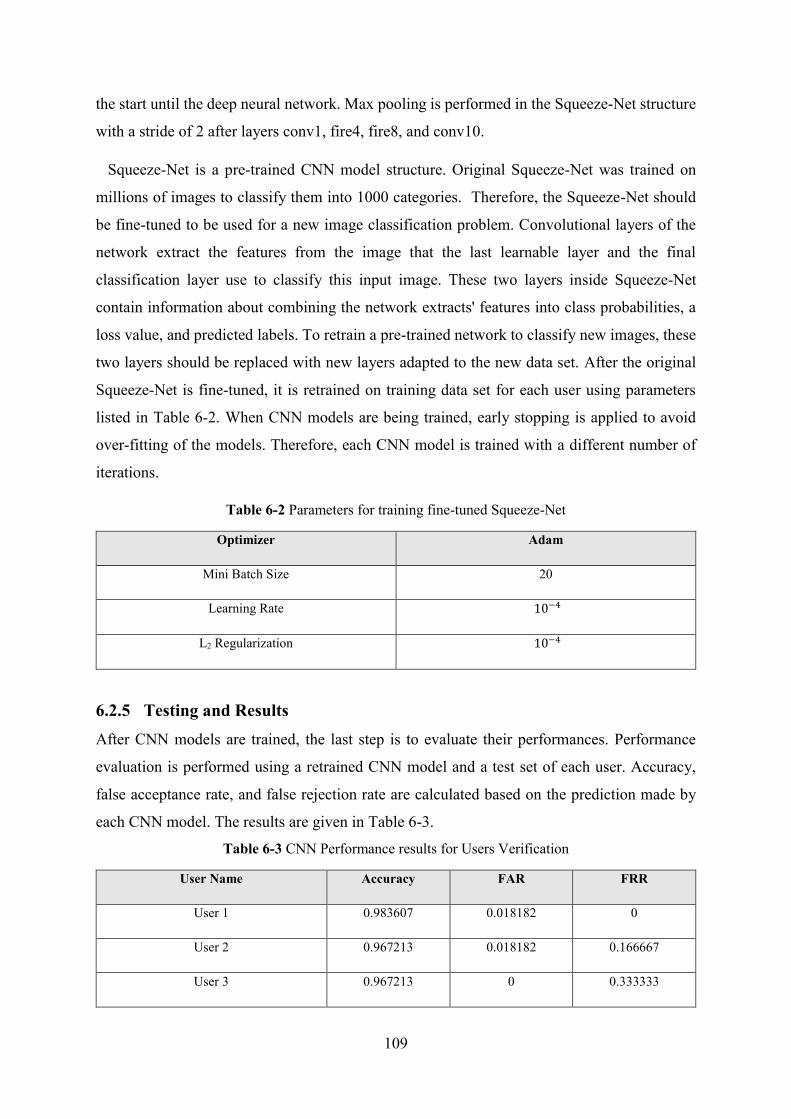
109
the start until the deep neural network. Max pooling is performed in the Squeeze-Net structure
with a stride of 2 after layers conv1, fire4, fire8, and conv10.
Squeeze-Net is a pre-trained CNN model structure. Original Squeeze-Net was trained on
millions of images to classify them into 1000 categories. Therefore, the Squeeze-Net should
be fine-tuned to be used for a new image classification problem. Convolutional layers of the
network extract the features from the image that the last learnable layer and the final
classification layer use to classify this input image. These two layers inside Squeeze-Net
contain information about combining the network extracts' features into class probabilities, a
loss value, and predicted labels. To retrain a pre-trained network to classify new images, these
two layers should be replaced with new layers adapted to the new data set. After the original
Squeeze-Net is fine-tuned, it is retrained on training data set for each user using parameters
listed in Table 6-2. When CNN models are being trained, early stopping is applied to avoid
over-fitting of the models. Therefore, each CNN model is trained with a different number of
iterations.
Table 6-2 Parameters for training fine-tuned Squeeze-Net
Optimizer Adam
Mini Batch Size 20
Learning Rate 10−4
L2 Regularization 10−4
6.2.5 Testing and Results
After CNN models are trained, the last step is to evaluate their performances. Performance
evaluation is performed using a retrained CNN model and a test set of each user. Accuracy,
false acceptance rate, and false rejection rate are calculated based on the prediction made by
each CNN model. The results are given in Table 6-3.
Table 6-3 CNN Performance results for Users Verification
User Name Accuracy FAR FRR
User 1 0.983607 0.018182 0
User 2 0.967213 0.018182 0.166667
User 3 0.967213 0 0.333333
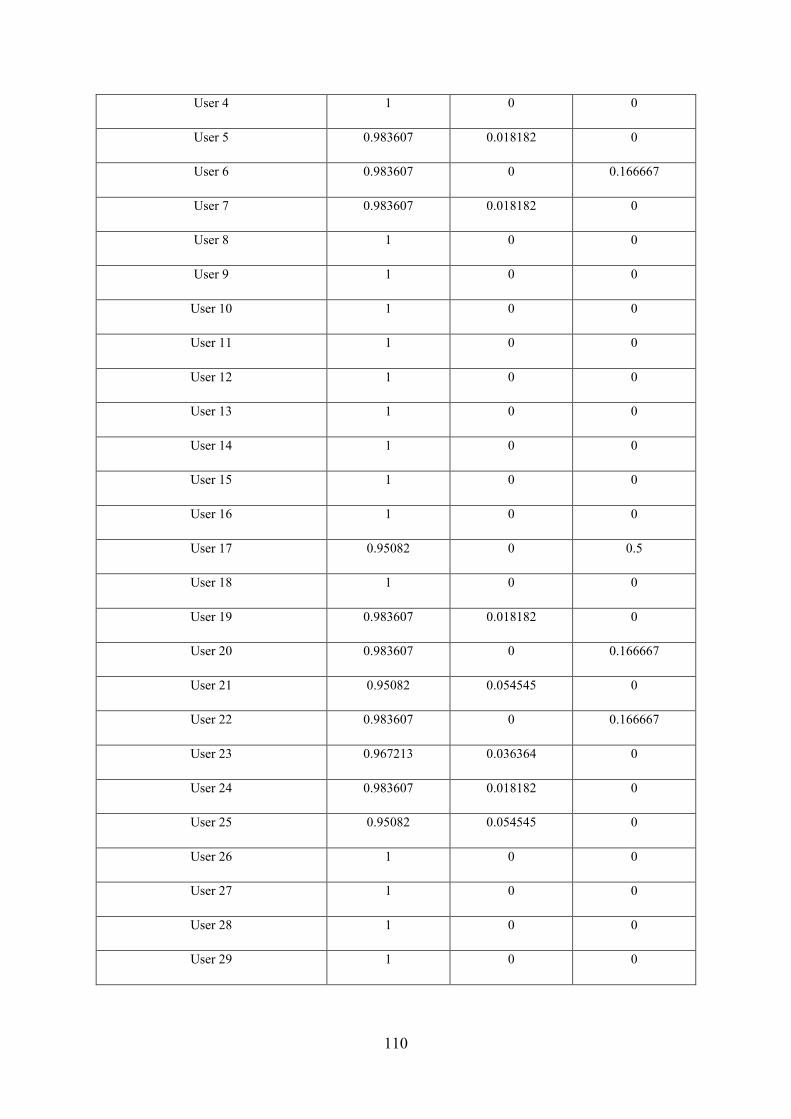
110
User 4 1 0 0
User 5 0.983607 0.018182 0
User 6 0.983607 0 0.166667
User 7 0.983607 0.018182 0
User 8 1 0 0
User 9 1 0 0
User 10 1 0 0
User 11 1 0 0
User 12 1 0 0
User 13 1 0 0
User 14 1 0 0
User 15 1 0 0
User 16 1 0 0
User 17 0.95082 0 0.5
User 18 1 0 0
User 19 0.983607 0.018182 0
User 20 0.983607 0 0.166667
User 21 0.95082 0.054545 0
User 22 0.983607 0 0.166667
User 23 0.967213 0.036364 0
User 24 0.983607 0.018182 0
User 25 0.95082 0.054545 0
User 26 1 0 0
User 27 1 0 0
User 28 1 0 0
User 29 1 0 0
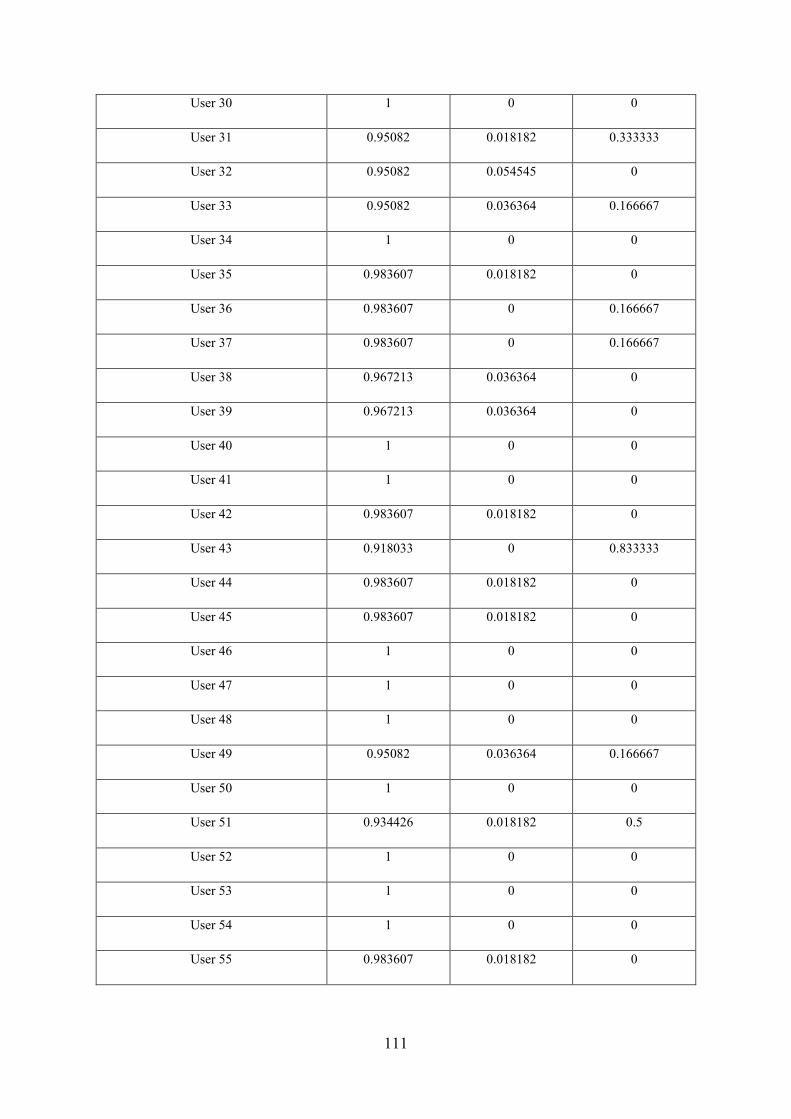
111
User 30 1 0 0
User 31 0.95082 0.018182 0.333333
User 32 0.95082 0.054545 0
User 33 0.95082 0.036364 0.166667
User 34 1 0 0
User 35 0.983607 0.018182 0
User 36 0.983607 0 0.166667
User 37 0.983607 0 0.166667
User 38 0.967213 0.036364 0
User 39 0.967213 0.036364 0
User 40 1 0 0
User 41 1 0 0
User 42 0.983607 0.018182 0
User 43 0.918033 0 0.833333
User 44 0.983607 0.018182 0
User 45 0.983607 0.018182 0
User 46 1 0 0
User 47 1 0 0
User 48 1 0 0
User 49 0.95082 0.036364 0.166667
User 50 1 0 0
User 51 0.934426 0.018182 0.5
User 52 1 0 0
User 53 1 0 0
User 54 1 0 0
User 55 0.983607 0.018182 0

112
User 56 0.983607 0 0.166667
Mean 0.983607 0.01039 0.071429
The obtained average accuracy of the CNN structure was found to be 98.3%. Next, a
statistical study was used to evaluate the performance of the system. The FAR value is 1.03%,
and the FRR value is 7.14 %. These results showed that using deep neural networks can be
used in the sEMG biometrics verification system without extracting the signals' features.
6.3 Deep Learning for Biometrics Users Identification System
The main problem in user identification that doesn’t exist in users' verification systems is that
user verification is a binary-class classification problem while user identification is a multi-
class classification problem. Therefore, although there is one classifier for each user in user
verification, only one classifier predicts the identification system's users. The system flowchart
is depicted in Figure 6-5. It consists of three phases. In the first phase, both raw and denoised
sEMG signals are used for the generation of scalograms. This is applied to training data to
increase the number of samples for training the CNN model and it can be considered as an
offline data augmentation to overcome the problem of data limitation as it is required to train
a network to identify the users by sEMG signals without extracting the features in advance.
After input generation, inputs are used for training and testing the CNN model, which is
squeeze-net. Data augmentation is applied to the generated scalograms to increase the
classifier's data input for better results.
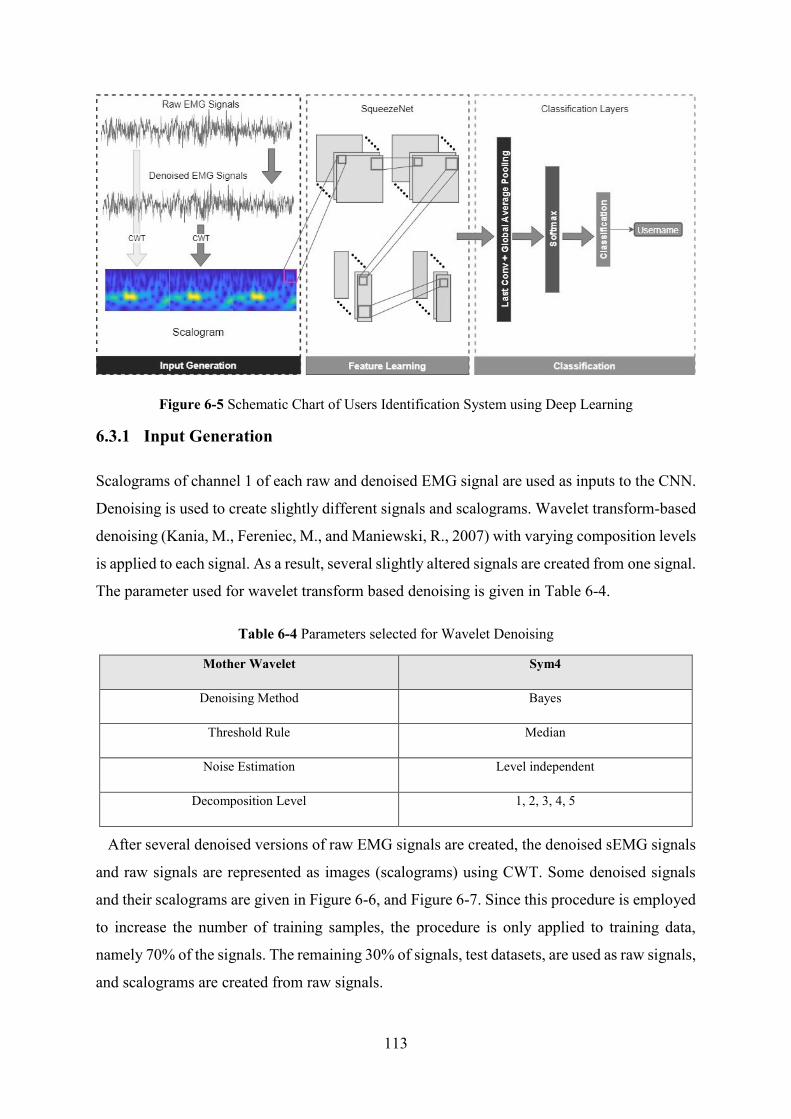
113
Figure 6-5 Schematic Chart of Users Identification System using Deep Learning
6.3.1 Input Generation
Scalograms of channel 1 of each raw and denoised EMG signal are used as inputs to the CNN.
Denoising is used to create slightly different signals and scalograms. Wavelet transform-based
denoising (Kania, M., Fereniec, M., and Maniewski, R., 2007) with varying composition levels
is applied to each signal. As a result, several slightly altered signals are created from one signal.
The parameter used for wavelet transform based denoising is given in Table 6-4.
Table 6-4 Parameters selected for Wavelet Denoising
Mother Wavelet Sym4
Denoising Method Bayes
Threshold Rule Median
Noise Estimation Level independent
Decomposition Level 1, 2, 3, 4, 5
After several denoised versions of raw EMG signals are created, the denoised sEMG signals
and raw signals are represented as images (scalograms) using CWT. Some denoised signals
and their scalograms are given in Figure 6-6, and Figure 6-7. Since this procedure is employed
to increase the number of training samples, the procedure is only applied to training data,
namely 70% of the signals. The remaining 30% of signals, test datasets, are used as raw signals,
and scalograms are created from raw signals.

114
6.3.2 Wavelet-Based Denoising
The noisy signal can be modeled as a superposition of signal and noise as follow:
𝑋(𝑘) = 𝑆(𝑘) + 𝐸(𝑘) (6-6)
where, 𝑋(𝑘) is a noisy signal, 𝑆(𝑘) is the original signal, and 𝐸(𝑘) is white Gaussian noise.
Since Wavelet transform is a linear transform, wavelet coefficient of 𝑋(𝑘) still has two
components. One component is from the original signal, and the other is from noise. Wavelet
transform can intensify signal energy on large coefficients and distribute noise energy.
Therefore, it can be assumed that those large coefficients represent the original signal, and
small coefficients represent noise. Based on this, wavelet-based denoising can be applied as
follow:
• Choose the mother wavelet and decomposition level and corresponding computing
coefficients.
• Choosing a threshold and threshold function, then calculating the estimated value of
coefficients.
• Reconstructing the signal using an inverse discrete wavelet transform based on
estimated coefficients.
Although there are many methods for determining the threshold, the universal threshold is
the most used thanks to its simplicity. The universal threshold is calculated as follow:
𝜆 = 𝜎√2𝑙𝑛 (𝑁) (6-7)
where 𝜎 is the average variance of the noise, and 𝑁 is the length of the signal. 𝜎 can be
calculated using the median estimate method. The formula is as follow:
𝜎 =𝑀𝑒𝑑𝑖𝑎𝑛(|𝑊1,𝐾|)
0.6745 (6-8)
where 𝑊1,𝐾 is all 1st level wavelet coefficients. There are two well-known thresholding
functions: hard and soft thresholding. Both functions remove small coefficients and lessen large
coefficients (Khmag, A., Al-Haddad, S. A. R., and Hashim, S. J. B., 2014).
The equation of hard thresholding is mentioned in equation (6-9), and the soft thresholding
is mentioned in equation (6-10).
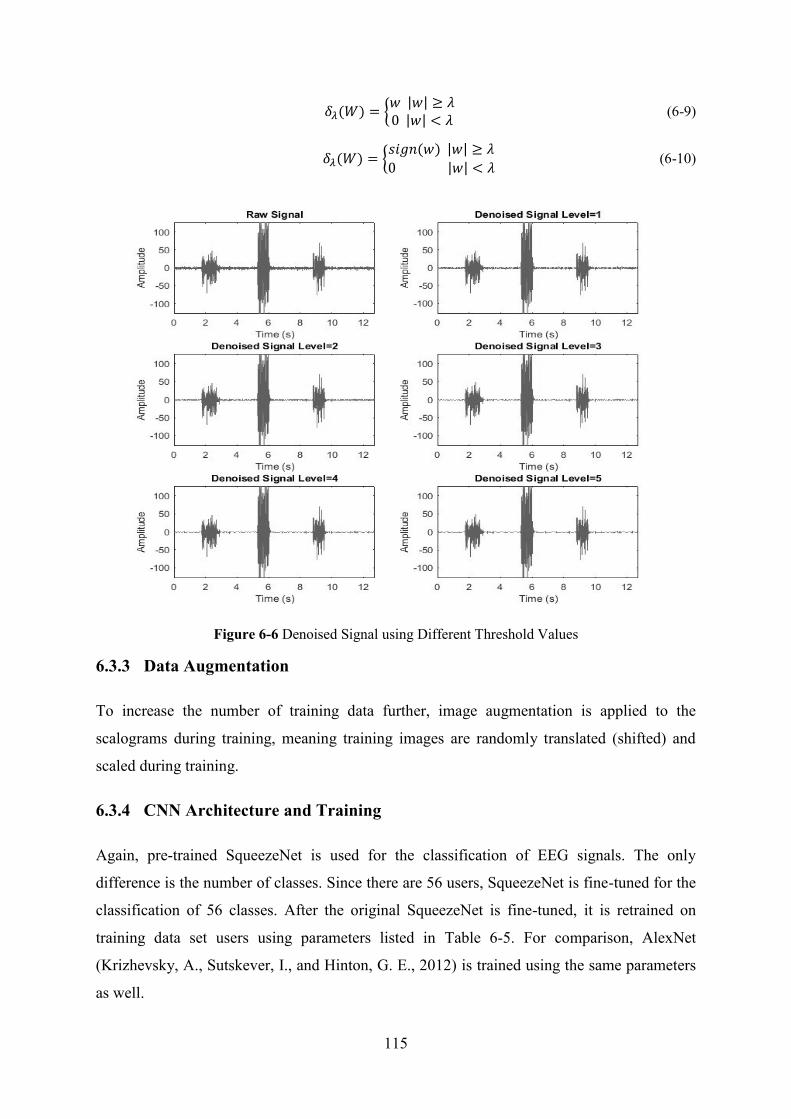
115
𝛿𝜆(𝑊) = {𝑤 |𝑤| ≥ 𝜆0 |𝑤| < 𝜆
(6-9)
𝛿𝜆(𝑊) = {𝑠𝑖𝑔𝑛(𝑤) |𝑤| ≥ 𝜆
0 |𝑤| < 𝜆 (6-10)
Figure 6-6 Denoised Signal using Different Threshold Values
6.3.3 Data Augmentation
To increase the number of training data further, image augmentation is applied to the
scalograms during training, meaning training images are randomly translated (shifted) and
scaled during training.
6.3.4 CNN Architecture and Training
Again, pre-trained SqueezeNet is used for the classification of EEG signals. The only
difference is the number of classes. Since there are 56 users, SqueezeNet is fine-tuned for the
classification of 56 classes. After the original SqueezeNet is fine-tuned, it is retrained on
training data set users using parameters listed in Table 6-5. For comparison, AlexNet
(Krizhevsky, A., Sutskever, I., and Hinton, G. E., 2012) is trained using the same parameters
as well.
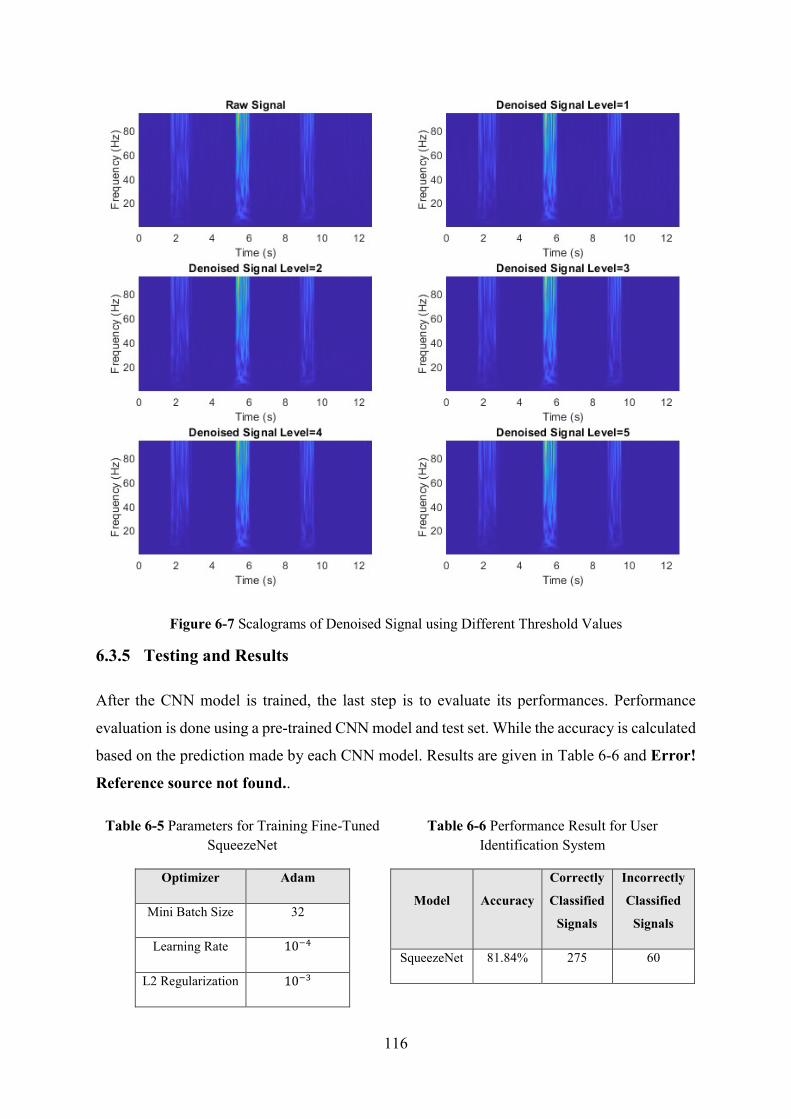
116
Figure 6-7 Scalograms of Denoised Signal using Different Threshold Values
6.3.5 Testing and Results
After the CNN model is trained, the last step is to evaluate its performances. Performance
evaluation is done using a pre-trained CNN model and test set. While the accuracy is calculated
based on the prediction made by each CNN model. Results are given in Table 6-6 and Error!
Reference source not found..
Table 6-5 Parameters for Training Fine-Tuned
SqueezeNet
Table 6-6 Performance Result for User
Identification System
Optimizer Adam
Mini Batch Size 32
Learning Rate 10−4
L2 Regularization 10−3
Model Accuracy
Correctly
Classified
Signals
Incorrectly
Classified
Signals
SqueezeNet 81.84% 275 60
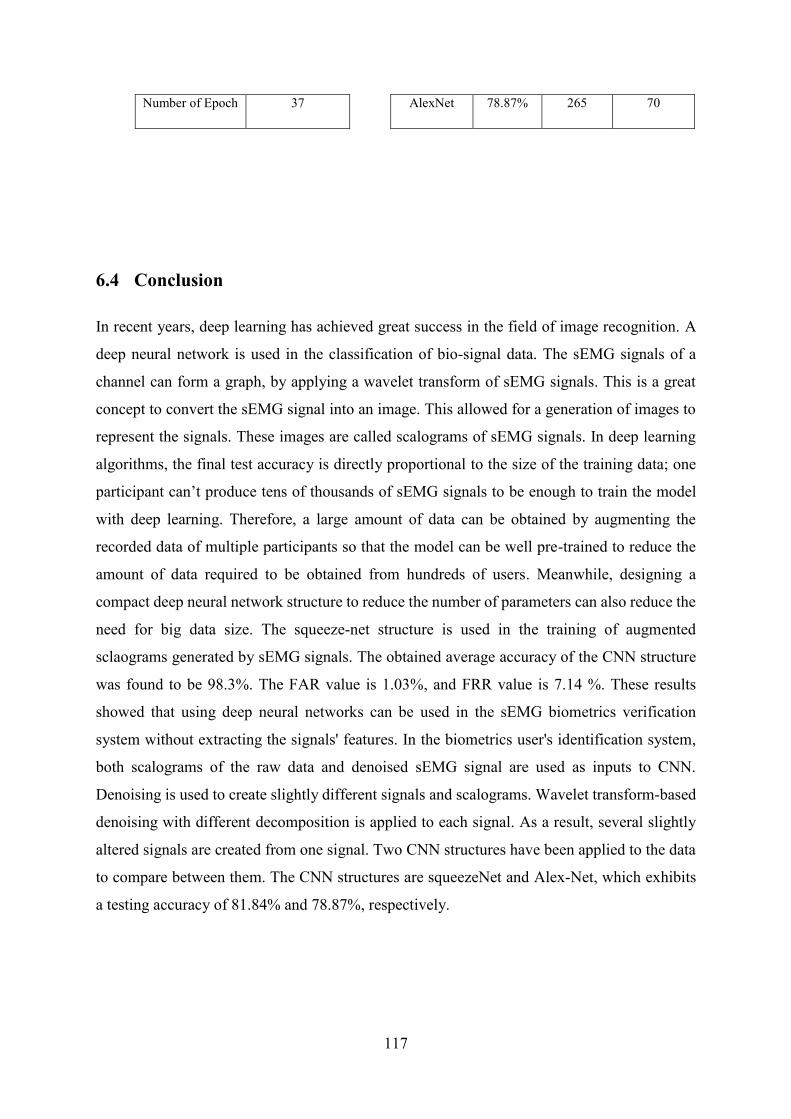
117
Number of Epoch 37
AlexNet 78.87% 265 70
6.4 Conclusion
In recent years, deep learning has achieved great success in the field of image recognition. A
deep neural network is used in the classification of bio-signal data. The sEMG signals of a
channel can form a graph, by applying a wavelet transform of sEMG signals. This is a great
concept to convert the sEMG signal into an image. This allowed for a generation of images to
represent the signals. These images are called scalograms of sEMG signals. In deep learning
algorithms, the final test accuracy is directly proportional to the size of the training data; one
participant can’t produce tens of thousands of sEMG signals to be enough to train the model
with deep learning. Therefore, a large amount of data can be obtained by augmenting the
recorded data of multiple participants so that the model can be well pre-trained to reduce the
amount of data required to be obtained from hundreds of users. Meanwhile, designing a
compact deep neural network structure to reduce the number of parameters can also reduce the
need for big data size. The squeeze-net structure is used in the training of augmented
sclaograms generated by sEMG signals. The obtained average accuracy of the CNN structure
was found to be 98.3%. The FAR value is 1.03%, and FRR value is 7.14 %. These results
showed that using deep neural networks can be used in the sEMG biometrics verification
system without extracting the signals' features. In the biometrics user's identification system,
both scalograms of the raw data and denoised sEMG signal are used as inputs to CNN.
Denoising is used to create slightly different signals and scalograms. Wavelet transform-based
denoising with different decomposition is applied to each signal. As a result, several slightly
altered signals are created from one signal. Two CNN structures have been applied to the data
to compare between them. The CNN structures are squeezeNet and Alex-Net, which exhibits
a testing accuracy of 81.84% and 78.87%, respectively.
118
7 Chapter 7 Conclusion & Perspectives
The thesis presented the advances in wearable technology systems raised during the last
decades. The wearable system that is available in the market is briefing its advantages and
disadvantages. The work presented in this thesis is based on Multi-channel sEMG signals
acquired by using Myo armband, which is a wearable bracelet contain eight dry sEMG
electrodes.
The thesis proposed a detailed design of a customized 3-D printed bionic arm with an
artificial hand. The bionic arm is implemented and tested on an amputee case with right arm
amputation from his born. According to the state-of-the-art systems, a gesture recognition
based on sEMG signals has been implemented. A database of sEMG created for generic control
of a bionic arm consists of four hand gestures (fist, spread fingers, wave-in, wave-out) from a
wide range of participants to control four hand movements. The 3-D printing technology
offered an affordable price solution for 295$. The collected data were processed, and feature
extraction was performed to training a classifier. Real-time testing of a bionic arm with a
gesture recognition system is presented. Machine learning classifiers are tested, and results are
compared to find the optimum algorithm to be used with sEMG data. The support vector
machine classifier was found to out-perform the neural network and decision tree classifiers,
reaching an average of 90.5%% accuracy. Real-time testing of the bionic arm with the
associated classifier software enabled the user to perform his daily activities
The research on biometrics systems, especially in the anti-spoofing system, showed great use
of sEMG as a biometrics modality due to its hidden biometrics natures and liveness detection.
The research work proposed a biometrics authentication system for user’s verification. The
biometric identity studied in this research is based on the EMG signal. The biometric device
used to acquire the sEMG signal is a wearable multi-channel armband consisting of 8
electrodes. A total of 56 users were enrolled in the biometric system to create a database of
sEMG signals. The users enrolled trained to use the sEMG biometric system prior to data
collection. Each user has been asked to select three gestures out of 4 gestures and arrange them
in a way to form a password using hand actions. A database of fifty-six participants has been
collected (twenty-four males and thirty-two females with ages ranging from 16 to 62 years). A
total of 18 features were extracted from the signals to distinguish between users. Seven
frequency domain features and eleven-time domain features were analyzed. Initially, each
119
channel's power spectral density (PSD) was estimated using the periodogram function,
implementing Welch’s method. Subsequently, average frequency, kurtosis, the signal's power,
median frequency, coefficient of dissymmetry, deciles, and peak frequency of PSD were
calculated as frequency-domain features.
Furthermore, data's length or duration is calculated as a new feature by dividing the signal
into ten equal length segments and calculating each segment's root mean square (RMS). The
K-nearest neighbors (kNN), linear discriminant analysis classifier (LDA), and classifier
ensemble have been applied to optimize the system's results.
The system will grant/deny access to the user from the captured sEMG biometrics identity as
a signature-based on hand gestures. Performance analysis of the biometrics system has been
presented to validate the system's capacity by estimating both the false acceptance rate (FAR)
and the false rejection rate (FRR). The performance of sEMG signals as a biometric modality
for user verification is investigated. The users were able to perform a custom-set gesture code.
The resulting sEMG signals were captured and proceed as a form of hidden biometric identity.
The results indicated that the custom-set gesture code improves verification performance. The
set of frequency and time-domain features extracted in this study allowed for improved
classifier accuracy. The KNN classifier was found to be optimum, with an average accuracy of
97.4%. The FAR and FRR of the KNN classifier results are 0% and 2.9%, respectively.
The performance of sEMG as a biometric trait for user identification was investigated as well
in the research. The users were able to perform a custom-set gesture code. The resulting sEMG
signals were captured and proceed as a form of hidden biometric identity. The results indicated
that the custom-set gesture code could significantly improve identification performance. The
set of time-domain features extracted in this study allowed for improved classifier accuracy.
The KNN classifier was found to be optimum, with an average detection accuracy of 86.2%.
The average classifier accuracy can be optimized by expanding the database by collecting 50
samples from each user enrolled in the system instead of 20 samples to have more data to train
the classifiers for an improved identification system. The user’s identification system's average
accuracy reached 99% during testing the classifier when only 30 users out of 56 users are
selected for training the classifier.
In recent years, deep learning has achieved great success in the field of image recognition. A
deep neural network is used in the classification of bio-signal data. The sEMG signals of a
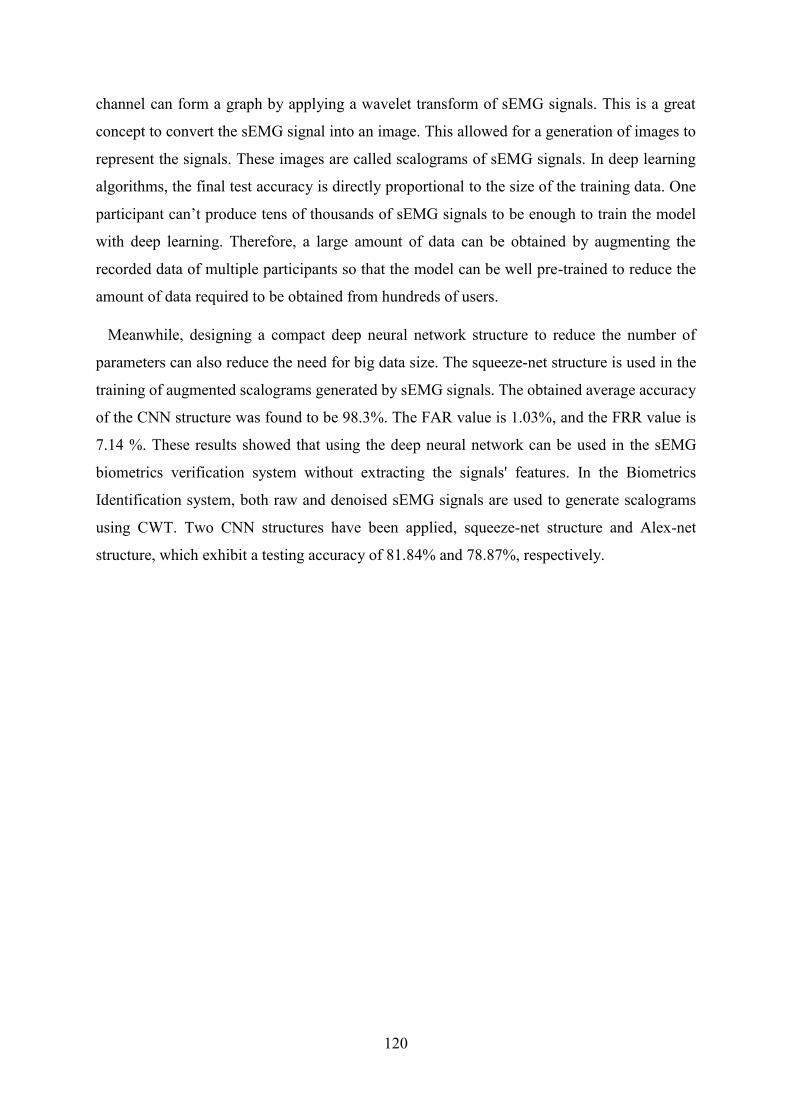
120
channel can form a graph by applying a wavelet transform of sEMG signals. This is a great
concept to convert the sEMG signal into an image. This allowed for a generation of images to
represent the signals. These images are called scalograms of sEMG signals. In deep learning
algorithms, the final test accuracy is directly proportional to the size of the training data. One
participant can’t produce tens of thousands of sEMG signals to be enough to train the model
with deep learning. Therefore, a large amount of data can be obtained by augmenting the
recorded data of multiple participants so that the model can be well pre-trained to reduce the
amount of data required to be obtained from hundreds of users.
Meanwhile, designing a compact deep neural network structure to reduce the number of
parameters can also reduce the need for big data size. The squeeze-net structure is used in the
training of augmented scalograms generated by sEMG signals. The obtained average accuracy
of the CNN structure was found to be 98.3%. The FAR value is 1.03%, and the FRR value is
7.14 %. These results showed that using the deep neural network can be used in the sEMG
biometrics verification system without extracting the signals' features. In the Biometrics
Identification system, both raw and denoised sEMG signals are used to generate scalograms
using CWT. Two CNN structures have been applied, squeeze-net structure and Alex-net
structure, which exhibit a testing accuracy of 81.84% and 78.87%, respectively.

121
Perspectives
In this thesis, we have encountered many challenges, and plenty of questions have been raised
that lead us to further improvement and future works. These future perspectives are presented
below:
• Increasing the degree of freedom of bionic arm: The bionic arm design shown in the
thesis is directly attached to an artificial hand. The artificial hand has a 9 DOF that
makes it able to perform the required grasping features. Adding a wrist joint mechanism
will enhance the arm's functionality and make it able to do roll and yaw actions that
will help perform more of the daily life activities.
• Adding feedback sensors to the bionic hand: Adding feedback sensors to the bionic
hand to make it able to feel the environment. These embedded sensors to be attached to
the fingertips and palm, such as pressure, heat to provide further feedback of the user
surrounding objects.
• Autonomous adjustable socket: The adjustable socket presented in the thesis is
adjusted by the user manually to fit his/her arm. A pressure pump with valve control
can be used to adjust the fit of the socket autonomously. This section of the bionic arm
is critical, as this is the contact point between the arm and the user's skin.
• Expand the database of sEMG signals for a password: The database collected from
56 users to propose a biometric system based on sEMG signals. Each user in the
database performed the password for 20 times. Increasing the number of enrolled users
to 100 users and each user to perform the password 50 times will increase the biometrics
system identification accuracy.
• Add more sensors with EMG sensors: The database created was based on sEMG
signals acquired by Myo armband without recording signals related to the arm's
position. The Myo armband is equipped with IMU and gyroscope. Their signals can be
acquired and recorded to get feedback about the arm's position during the acquisition
time. Adding more inputs to the training algorithm will improve the classifiers' results,
especially in the user's identification system.
• Data augmentation of the signals: In the deep learning algorithm presented in this
thesis, data augmentation is done on the scalograms as an image by shifting and scaling

122
the pictures to augment them. Augmenting the sEMG signals by using gaussian noise
has not been tested on this database.
123
8 Bibliography
(2016, January 01). (Johns Hopkins University) Retrieved from
"https://www.cantechletter.com/2016/01/thalmic-labs-myo armband-allows-amputee-
to-control-prosthetic-limb/,"
Aashni, H., Archanasri, S., Nivedhitha, A., Shristi, P., and Jyothi, S. N. (2017). S. N. .
International conference on advances in computing & communications. 115, pp. 367-
374. Science Direct.
Abdenour Hadid, Nicholas Evans, Sébastien Marcel, and Julian Fierrez. (2015). Biometrics
Systems Under Spoofing Attack. IEEE SIGNAL PROCESSING MAGAZINE , 32(5),
20-30.
Aditya T, Bertram T, Frederic G, and Didier S. (2017). A probabilistic combination of CNN
and RNN estimates for hand gesture based interaction in car. International symposium
on mixed and augmented reality ISMAR-adjunct, 1-6.
Ahsan, M. R., Ibrahimy, M. I., and Khalifa, O. O. (2011). Electromygraphy (EMG) signal
based hand gesture recognition using artificial neural network (ANN). 4th
International Conference on Mechatronics (ICOM) (pp. 1-6). Kuala Lumpur,
Malaysia: IEEE.
Akhmadeev, K., Houssein, A., Moussaoui, S., Høgestøl, E. A., Tutturen, I., Harbo, H. F., and
Gourraud, P. A. (2018). Svm-based tool to detect patients with multiple sclerosis
using a commercial emg sensor. 2018 IEEE 10th Sensor Array and Multichannel
Signal Processing Workshop (SAM) (pp. 376-379). Sheffield, UK: IEEE.
Allard, U. C., Nougarou, F., Fall, C. L., Giguère, P., Gosselin, C., Laviolette, F., and
Gosselin, B. (2016). A convolutional neural network for robotic arm guidance using
sEMG based frequency-features. IEEE/RSJ International Conference on Intelligent
Robots and Systems (IROS).
Al-Mulla, M. R., and Sepulveda, F. (2014). Novel Pseudo-Wavelet function for MMG signal
extraction during dynamic fatiguing contractions. Sensors, 14(6), 9489-9504.

124
Arief, Z., Sulistijono, I. A., and Ardiansyah, R. A. (2015). Comparison of five time series
EMG features extractions using Myo Armband. International Electronics Symposium
(IES), 11-14.
Atzori, M., Cognolato, M., and Müller, H. (2016). Deep learning with convolutional neural
networks applied to electromyography data: A resource for the classification of
movements for prosthetic hands. Frontiers in neurorobotics, 10, 9.
Bailey, K. O., Okolica, J. S., and Peterson, G. L. (2014). User identification and
authentication using multi-modal behavioral biometrics. Computers & Security, 43,
77-89.
Baillie, D. C., & Mathew, J. (1996). A comparison of autoregressive modeling techniques for
fault diagnosis of rolling element bearings. Mechanical Systems and Signal
Processing, 10(1), 1-17.
Barbé, K., Pintelon, R., and Schoukens, J. (2009). Welch method revisited: nonparametric
power spectrum estimation via circular overlap. IEEE Transactions on signal
processing, 58(2), 553-565.
Barioul, R., Ghribi, S. F., and Kanoun, O. (2016). A low cost signal acquisition board design
for myopathy's EMG database construction. 13th International Multi-Conference on
Systems, Signals & Devices (SSD). 274-279: IEEE.
Belgacem, N., Fournier, R., Nait-Ali, A., and Bereksi-Reguig, F. (2015). A novel biometric
authentication approach using ECG and EMG signals. Journal of medical engineering
& technology, 39(4), 226-238.
Benalcázar, M. E., Jaramillo, A. G., Zea, A., Páez, A., and Andaluz, V. H. (2017). Hand
gesture recognition using machine learning and the Myo armband. 25th European
Signal Processing Conference (EUSIPCO) (pp. 1040-1044). Kos, Greece: IEEE.
Benalcázar, M. E., Motoche, C., Zea, J. A., Jaramillo, A. G., Anchundia, C. E., Zambrano, P.,
and Pérez, M. (2017). Real-time hand gesture recognition using the Myo armband and
muscle activity detection. IEEE Second Ecuador Technical Chapters Meeting
(ETCM) (pp. 1-6). Salinas, Ecuador: IEEE.
125
Ben-Arie, J., Wang, Z.; Pandit, P., and Rajaram, S. (2002). Human Activity Recognition
Using Multidimensional Indexing. IEEE Trans. Pattern Anal. Mach. Intell., 24, 1091–
1104.
Benatti, S., Milosevic, B., Farella, E., Gruppioni, E., and Benini, L. (2017). A prosthetic hand
body area controller based on efficient pattern recognition control strategies. Sensors,
17(4).
Blasco, J., Chen, T. M., Tapiador, J., and Peris-Lopez, P. (2016). A survey of wearable
biometric recognition systems. ACM Computing Surveys, 49(3), 1-35.
Bulugu, I., Ye, Z., and Banzi, J. (2017). Higher-order local autocorrelation feature extraction
methodology for hand gestures recognition. 2nd International Conference on
Multimedia and Image Processing (ICMIP) (pp. 83-87). Wuhan, China: IEEE.
C. Li, X. Zhang and L. Jin. (2017). LPSNet: A Novel Log Path Signature Feature Based
Hand Gesture Recognition Framework. IEEE International Conference on Computer
Vision Workshops (ICCVW) (pp. 631-639). Venice: IEEE.
C. Tsai, Y. Tsai, S. Hsu, and Y. Wu,. (2017). Synthetic Training of Deep CNN for 3D Hand
Gesture Identification. International Conference on Control, Artificial Intelligence,
Robotics & Optimization (ICCAIRO) (pp. 165-170). Prague: IEEE.
Canavan, S., Keyes, W., Mccormick, R., Kunnumpurath, J., Hoelzel, T., and Yin, L. (2017).
Hand gesture recognition using a skeleton-based feature representation with a random
regression forest. IEEE International Conference on Image Processing (ICIP) (pp.
2364-2368). Beijing, China: IEEE.
Cannan, J., and Hu, H. (2013). Automatic user identification by using forearm biometrics.
IEEE/ASME International Conference on Advanced Intelligent Mechatronics (pp.
710-715). Wollongong, NSW, Australia: IEEE.
Chantaf, S., Makni, L., and Nait-ali, A. (2020). Single Channel Surface EMG Based
Biometrics. In Hidden Biometrics (pp. 71-90). Singapore: Springer.
Chen, L., Fu, J., Wu, Y., Li, H., & Zheng, B. (2020). Hand gesture recognition using compact
CNN via surface electromyography signals. Sensors, 20(3), 672.

126
Chen, X., Guo, H., Wang, G., and Zhang, L. (2017). Motion feature augmented recurrent
neural network for skeleton-based dynamic hand gesture recognition. IEEE
International Conference on Image Processing (ICIP) (pp. 2881-2885). Beijing,
China: IEEE.
Chu, J. U., Moon, I., and Mun, M. S. (2006). A real-time EMG pattern recognition system
based on linear-nonlinear feature projection for a multifunction myoelectric hand.
IEEE Transactions on biomedical engineering, 53(11), 2232-2239.
(2016). Consumer Reports. Teslas new autopilot: Better but still needs improvements.
http://www.consumerreports.org/tesla/tesla-new-autopilot-better-but-needs-
improvement.
Cote-Allard, U., Fall, C. L., Campeau-Lecours, A., Gosselin, C., Laviolette, F., and Gosselin,
B. (2017). Transfer learning for sEMG hand gestures recognition using convolutional
neural networks. IEEE International Conference on Systems, Man, and Cybernetics
(SMC) (pp. 1663-1668). Banff, AB, Canada: IEEE.
Côté-Allard, U., Fall, C. L., Drouin, A., Campeau-Lecours, A., Gosselin, C., Glette, K., and
Gosselin, B. (2019). Deep learning for electromyographic hand gesture signal
classification using transfer learning. IEEE Transactions on Neural Systems and
Rehabilitation Engineering, 27(4), 760-771.
Dai, Y., Zhou, Z., Chen, X., & Yang, Y. (2017). A novel method for simultaneous gesture
segmentation and recognition based on HMM. International Symposium on Intelligent
Signal Processing and Communication Systems (ISPACS) (pp. 684-688). Xiamen,
China: IEEE.
Dantcheva, A., Velardo, C., D’angelo, A., and Dugelay, J. L. (2011). Bag of soft biometrics
for person identification. Multimedia Tools and Applications, 51(2), 739-777.
Doubrovski Z, Verlinden JC, and Geraedts JMP. (2011). Optimal design for additive
manufacturing: opportunities and challenges. ASME 2011 International Design
Engineering Technical Conferences and Computers and Information in Engineering
Conference. American Society of Mechanical Engineers. Washington, DC, USA:
ASME.
127
Englehart, K., and Hudgins, B. (2003). A robust, real-time control scheme for multifunction
myoelectric control. IEEE transactions on biomedical engineering, 50(7), 848-854.
Englehart, K., Hudgins, B., Parker, P. A., and Stevenson, M. (1999). Classification of the
myoelectric signal using time-frequency based representations. Medical engineering
& physics,, 21(6-7), 431-438.
Evans, N. (2019). Handbook of Biometric Anti-spoofing: Presentation Attack Detection.
Springer.
Faragó, P., Groza, R., Ivanciu, L., and Hintea, S. (2019). A Correlation-based Biometric
Identification Technique for ECG, PPG and EMG. 42nd International Conference on
Telecommunications and Signal Processing (TSP) (pp. 716-719). Budapest, Hungary:
IEEE.
Fong, S. . (2012). Using hierarchical time series clustering algorithm and wavelet classifier
for biometric voice classification. Journal of Biomedicine and Biotechnology, 1-12.
Freund, Y., and Schapire, R. E. (1995). A desicion-theoretic generalization of on-line
learning and an application to boosting. Berlin, Heidelberg.: Springer.
Freund, Y., Schapire, R., and Abe, N. (1999). A short introduction to boosting. .Journal-
Japanese Society For Artificial Intelligence, 14(1612), 771-780.
Friedman, J., Hastie, T., & Tibshirani, R. (2000). additive logistic regression: A statistical
view of boosting. Annals of statistics, 337-374.
Gaetani, F., Primiceri, P., Zappatore, G. A., and Visconti, P. (2018). Hardware design and
software development of a motion control and driving system for transradial
prosthesis based on a wireless myoelectric armband. IET Science, Measurement &
Technology.
Gretsch, K. F., Lather, H. D., Peddada, K. V., Deeken, C. R., Wall, L. B., and Goldfarb, C. A.
(2016). Development of novel 3D-printed robotic prosthetic for transradial amputees.
Prosthetics and orthotics international, 40(3), 400-403.
Gui, Q., Ruiz-Blondet, M. V., Laszlo, S., and Jin, Z. (2019). A survey on brain biometrics.
ACM Computing Surveys (CSUR), 51(6), 1-38.

128
Gunawardane, P. D. S. H., and Medagedara, N. T. (2017). Comparison of hand gesture inputs
of leap motion controller & data glove in to a soft finger. IEEE International
Symposium on Robotics and Intelligent Sensors (IRIS) (pp. 62-68). Ottawa, ON,
Canada: IEEE.
H. M. Abdul-Rashid, L. Kiran, M. D. Mirrani and M. N. Maraaj. (2017). CMSWVHG-
control MS Windows via hand gesture. International Multi-topic Conference (INMIC)
(pp. 1-7). Lahore: IEEE.
Hawking, S. W. (2011). World Report on disability Geneva: World Health Organization.
Geneva: World Health Organization. Retrieved from Hawking, S. W., "World Report
on disability," Geneva: World Health Organization, 2011..
He, J., and Jiang, N. (2020). Biometric From Surface Electromyogram (sEMG): Feasibility of
User Verification and Identification Based on Gesture Recognition. Frontiers in
Bioengineering and Biotechnology, 8, 58.
https://nymi.com/. (n.d.). (NYMI) Retrieved June 25, 2020
Huang, Y., Englehart, K. B., Hudgins, B., & Chan, A. D. (2005). A Gaussian mixture model
based classification scheme for myoelectric control of powered upper limb prostheses.
IEEE Transactions on Biomedical Engineering, 52(11), 1801-1811.
Iandola, F. N., Han, S., Moskewicz, M. W., Ashraf, K., Dally, W. J., and Keutzer, K. (2016).
SqueezeNet: AlexNet-level accuracy with 50x fewer parameters and< 0.5 MB model
size. arXiv preprint arXiv:1602.07360.
Iandola, F. N., Moskewicz, M. W., Ashraf, K., and Keutzer, K. (2016). Firecaffe: near-linear
acceleration of deep neural network training on compute clusters. Proceedings of the
IEEE Conference on Computer Vision and Pattern Recognition (pp. 2592-2600). Las
Vegas, NV, USA: IEEE.
J. Blasco, T. M. Chen, J. Tapiador and P. Peris-Lopez. (2016). A Survey of Wearable
Biometric Recognition Systems. ACM Computing Surveys, 49(3), 1-35.
J. Zhao, J. Mao, G. Wang, H. Yang and B. Zhao. (2017). A miniaturized wearable wireless
hand gesture recognition system employing deep-forest classifier. IEEE Biomedical
Circuits and Systems Conference (BioCAS) (pp. 1-4). Turin, Italy: IEEE.

129
Jelle ten Kate, Gerwin Smit & Paul Breedveld. (2017). 3D-printed upper limb prostheses: a
review. Disability and Rehabilitation: Assistive Technology, 12:3, 300-314.
Junhua Li, Gong Chen, Pavithra Thangavel, Haoyong Yu, Nitish Thakor, Anastasios
Bezerianos, and Yu Sun. (2016). A Robotic Knee Exoskeleton for Walking
Assistance and Connectivity Topology Exploration in EEG Signal. IEEE RAS/EMBS.
Kania, M., Fereniec, M., and Maniewski, R. (2007). Wavelet denoising for multi-lead high
resolution ECG signals. Measurement science review, 7(4), 30-33.
Kapoor, A., and Picard, R. W. (2001). A real-time head nod and shake detector. In
Proceedings of the 2001 workshop on Perceptive user interfaces (pp. 1-5). ACM.
Kaur, G., Singh, G., and Kumar, V. (2014). A review on biometric recognition. International
Journal of Bio-Science and Bio-Technology, 6(4), 69-76.
Kay, S. M. (1988). Modern spectral estimation: theory and application. Pearson Education
India.
Kendon, A. (2004). Gesture: Visible action as utterance. UK: Cambridge University Press.
Khezri, M., and Jahed, M. (2007). Real-time intelligent pattern recognition algorithm for
surface EMG signals. Biomedical engineering online, 6(1), 1-12.
Khmag, A., Al-Haddad, S. A. R., and Hashim, S. J. B. (2014). Additive and multiplicative
noise removal based on adaptive wavelet transformation using cycle spinning.
American Journal of Applied Sciences, 11(2).
Krishnamohan, P. G., and Holi, M. S. (2011). GMM modeling of person information from
EMG signals. IEEE Recent Advances in Intelligent Computational Systems (pp. 712-
717). Trivandrum, Kerala, India: IEEE.
Krishnan, K. S., Saha, A., Ramachandran, S., and Kumar, S. (2017). Recognition of human
arm gestures using Myo armband for the game of hand cricket. IEEE International
Symposium on Robotics and Intelligent Sensors (IRIS) (pp. 389-394). Ottawa, ON,
Canada: IEEE.
Krizhevsky, A., Sutskever, I., and Hinton, G. E. (2012). Imagenet classification with deep
convolutional neural networks. Advances in neural information processing systems,
1097-1105.
130
Latest Bionic arm [Internet]. (cited 2015 Jun 24). Retrieved from
http://www.openbionics.com/
LeCun, Y., Boser, B., Denker, J. S., Henderson, D., Howard, R. E., Hubbard, W., and Jackel,
L. D. (1989). Backpropagation applied to handwritten zip code recognition. Neural
computation, 1(4), 541-551.
Li, X., Fu, J., Xiong, L., Shi, Y., Davoodi, R., and Li, Y. (2015, September). Identification of
finger force and motion from forearm surface electromyography. IEEE International
Conference on Multisensor Fusion and Integration for Intelligent System (MFI), 316–
321.
Lian, K. Y., Chiu, C. C., Hong, Y. J., and Sung, W. T. (2017). Wearable armband for real
time hand gesture recognition. IEEE International Conference on Systems, Man, and
Cybernetics (SMC) (pp. 2992-2995). Banff, AB, Canada: IEEE.
Lin, M., Chen, Q., and Yan, S. (2013). Network in network. arXiv preprint arXiv:1312.4400.
Liu, J.; Zhou, P. (n.d.). A novel myoelectric pattern recognition strategy for hand function
restoration after incomplete cervical spinal cord injury. Transactions on neural
systems and rehabilitation engineering, 21(1), 96-103.
M. E. Benalcázar, A. G. Jaramillo, Jonathan, A. Zea, A. Páez and V. H. Andaluz. (2017).
Hand gesture recognition using machine learning and the Myo armband. 25th
European Signal Processing Conference (EUSIPCO) (pp. 1040-1044). Kos, Greece:
IEEE.
Madhavan, S., Tripathy, R. K., and Pachori, R. B. (2019). Time-frequency domain deep
convolutional neural network for the classification of focal and non-focal EEG
signals. IEEE Sensors Journal, 20(6), 3078-3086.
Mahajan, N. V., Deshpande, A. S., and Satpute, S. S. (2019). Prediction of Fault in Gas
Chromatograph using Convolutional Neural Network. 3rd International Conference
on Trends in Electronics and Informatics (ICOEI) (pp. 930-933). Tirunelveli, India,
India: IEEE.
Marsland, S. (2015). Machine learning: an algorithmic perspective. CRC press.

131
Matsubara, T., and Morimoto, J. (2013). Bilinear modeling of EMG signals to extract user-
independent features for multiuser myoelectric interface. IEEE Transactions on
Biomedical Engineering, 60(8), 2205-2213.
Matsumoto, Y., and Zelinsky, A. (2000). An algorithm for real-time stereo vision
implementation of head pose and gaze direction measurement. Proceedings Fourth
IEEE International Conference on Automatic Face and Gesture Recognition.
Grenoble, France: IEEE.
McGimpsey, G., & Bradford, T. C. (2008). Limb prosthetics services and devices.
Bioengineering Institute Center for Neuroprosthetics Worcester Polytechnic
Institution.
Mekhalfa, F., and Nacereddine, N. (2017). Gentle Adaboost algorithm for weld defect
classification. Signal Processing: Algorithms, Architectures, Arrangements, and
Applications (SPA), 301-306.
Moon, K. Y. (2005). Biometrics technology status and prospects. TTA journa, l,(98), 38-47.
Morency, L. P., Sidner, C., Lee, C., and Darrell, T. (2005). Contextual recognition of head
gestures. In Proceedings of the 7th international conference on Multimodal interfaces
(pp. 18-24). Torento Italy : ACM.
Motoche, C., and Benalcázar, M. E. (2018). Real-time hand gesture recognition based on
electromyographic signals and artificial neural networks. International Conference on
Artificial Neural Networks (pp. 352-361). Rhodes, Greece: Springer.
Myo Armband. (n.d.). (Thlamic Lab) Retrieved June 25, 2020, from
https://support.getmyo.com/hc/en-us/articles/203398347-Getting-started-with-your-
Myo-armband
Napier, J. R. (1956). The prehensile movements of the human hand. The Journal of bone and
joint surgery, British volume, 38(4), 902-913.
Noce, E., Bellingegni, A. D., Ciancio, A. L., Sacchetti, R., Davalli, A., Guglielmelli, E., and
Zollo, L. ((2019)). EMG and ENG-envelope pattern recognition for prosthetic hand
control. Journal of Neuroscience Methods, 311, 38-46.
O’Neill C. (2014). An advanced, low cost prosthetic arm. IEEE SENSORS.
132
Open Bionics lab. (2019, 04 15). Retrieved from Available online:
https://openbionicslabs.com/shop/chestnut-board
P. Bonato. (2003). "Wearable Sensors/Systems and Their Impact on Biomedical
Applications". vol. IEEE ENGINEERING IN MEDICINE AND BIOLOGY
MAGAZINE.
Panwar, M., and Mehra, P. S. (2011). Hand gesture recognition for human computer
interaction. International Conference on Image Information Processing (pp. 1-7).
Shimla, India: IEEE.
Pinto, J. R., Cardoso, J. S., and Lourenço, A. (2018). Evolution, current challenges, and
future possibilities in ECG biometrics. IEEE Access, 6.
Pramunanto, E., Sumpeno, S., and Legowo, R. S. (2017). Classification of hand gesture in
Indonesian sign language system using Naive Bayes. International Seminar on
Sensors, Instrumentation, Measurement and Metrology (ISSIMM) (pp. 187-191).
Surabaya, Indonesia: IEEE.
Proakis, J. G. (2001). Digital signal processing: principles algorithms and applications.
Pearson Education India.
Qingqing Li, Penghui Dong and Jun Zheng. (2020). Enhancing the Security of Pattern
Unlock with Surface EMG-Based Biometrics. Applied sciences, 541. Retrieved 2020
R. A. Bhuiyan, A. K. Tushar, A. Ashiquzzaman, J. Shin and M. R. Islam. (2017). Reduction
of gesture feature dimension for improving the hand gesture recognition performance
of numerical sign language. 20th International Conference of Computer and
Information Technology (ICCIT). Dhaka, Bangladesh: IEEE.
Rani, S. S., Dhrisya, K. J., and Ahalyadas, M. (2017). Hand gesture control of virtual object
in augmented reality. International Conference on Advances in Computing,
Communications and Informatics (ICACCI) (pp. 1500-1505). Udupi, India: IEEE.
Rathgeb, C., and Uhl, A. (2011). A survey on biometric cryptosystems and cancelable
biometrics. EURASIP Journal on Information Security, (1), 3.

133
Redrovan, D. V., and Kim, D. (2018). Hand gestures recognition using machine learning for
control of multiple quadrotors. IEEE Sensors Applications Symposium (SAS) (pp. 1-
6). Seoul, South Korea: IEEE.
Resnik, L., Meucci, M. R., Lieberman-Klinger, S., Fantini, C., Kelty, D. L., Disla, R., and
Sasson, N. (2012). Advanced upper limb prosthetic devices: implications for upper
limb prosthetic rehabilitation. Archives of physical medicine and rehabilitation, 93,
710–717.
Robertson, D. G. E., Caldwell, G. E., Hamill, J., Kamen, G., and Whittlesey. (2014).
Research methods in biomechanics. Human Kinetics.
Roboarm. (2015). Roboarm (Unlimited tomorrow).
S. Chantaf, A. Naït-Ali, P. Karasinski, and M. Khalil. (2010). ECG modelling using wavelet
networks: application to biometrics. Int. J. Biometrics, 2(3), 236-249.
S. Hasan, K. Al-Kandari, E. Al-Awadhi, A. Jaafar, B. Al-Farhan, M. Hassan, S. Said, and S.
AlKork. (2018). Wearable Mind Thoughts Controlled Open Source 3D Printed Arm
with Embedded Sensor Feedback System. CHIRA. Seville, Spain.
S. Rawat, S. Vats and P. Kumar. (2016). Evaluating and Exploring the MYO Armband. 2016
International Conference System Modeling & Advancement in Research Trends
(SMART), 115-120.
S. Said, S. Alkork, T. Beyrouthy, and M. Fayek. (2017). Wearable Bio-Sensors Bracelet for
Driver’s Health Emergeny Detection. Biosmart. Paris, France.
Said, S., Boulkaibet, I., Sheikh, M., Karar, A. S., Alkork, S., and Nait-ali, A. (2020).
Machine-Learning-Based Muscle Control of a 3D-Printed Bionic Arm. Sensors,
20(11), 3144.
Said, S., Sheikh, M., Al-Rashidi, F., Lakys, Y., Beyrouthy, T., and Nait-ali, A. (2019). A
Customizable Wearable Robust 3D Printed Bionic Arm: Muscle Controlled. In 2019
3rd International Conference on Bio-engineering for Smart Technologies
(BioSMART) (pp. 1-6). Paris, France: IEEE.

134
Sapienza, S. (2018). On-Line Event-Driven Hand Gesture Recognition Based on Surface
Electromyographic Signals. IEEE International Symposium on Circuits and Systems
(ISCAS) (pp. 1-5). Florence: IEEE.
Saponas, T.m Tan, S., Morris, D., and Balakrishnan, R. (2008). Demonstrating the feasibility
of using forearm electromyography for muscle–computer interfaces. In Proceedings
of the 26th SIGCHI Conference on Human Factors in Computing Systems (pp. 515-
524). Florence, Italy: ACM.
Sharma, S., Farooq, H., and Chahal, N. (2016). Feature extraction and classification of
surface EMG signals for robotic hand simulation. Communications on Applied
Electronics (CAE), 4(2), 27-31.
Sharrma, A., Khandelwal, A., Kaur, K., Joshi, S., Upadhyay, R., and Prabhu, S. (2017).
Vision based static hand gesture recognition techniques. International Conference on
Communication and Signal Processing (ICCSP) (pp. 0705-0709). Chennai, India:
IEEE.
Shi, W. T., Lyu, Z. J., Tang, S. T., Chia, T. L., and Yang, C. Y. (2018). A bionic hand
controlled by hand gesture recognition based on surface EMG signals: A preliminary
study. Biocybernetics and Biomedical Engineering, 38(1), 126-135.
Shin, S., and Sung, W. (2016). Dynamic hand gesture recognition for wearable devices with
low complexity recurrent neural networks. IEEE International Symposium on Circuits
and Systems (ISCAS) (pp. 2274-2277). Montreal, QC, Canada: IEEE.
Shin, S., Jung, J., & Kim, Y. T. (2017). A study of an EMG-based authentication algorithm
using an artificial neural network. IEEE SENSORS. Glasgow, UK: IEEE.
Shioji, R., Ito, S. I., Ito, M., and Fukumi, M. (2017). Personal authentication based on wrist
EMG analysis by a convolutional neural network. 5th IIAE International Conference
on Intelligent Systems and Image Processing. Japan: The Institute of Industrial
Applications Engineers.
Simonyan, K., and Zisserman, A. (2014). Very deep convolutional networks for large-scale
image recognition. arXiv preprint arXiv:1409.1556.
135
Soutar, C., Roberge, D., Stoianov, A., Gilroy, R., and Kumar, B. V. (1998). Biometric
Encryption: enrollment and verification procedures. International Society for Optics
and Photonics., 3386, 24-35.
Sugiura, Y., Nakamura, F., Kawai, W., Kikuchi, T., & Sugimoto, M. (2017). Behind the
palm: Hand gesture recognition through measuring skin deformation on back of hand
by using optical sensors. 56th Annual Conference of the Society of Instrument and
Control Engineers of Japan (SICE) (pp. 1082-1087). Kanazawa, Japan: IEEE.
Szegedy, C., Ioffe, S., Vanhoucke, V., and Alemi, A. (2016). Inception-v4, inception-resnet
and the impact of residual connections on learning. arXiv preprint arXiv:1602.07261.
Theodoridis, S. (2015). Machine learning: a Bayesian and optimization perspective.
Academic press.
Tian, Z., Wang, J., Yang, X., and Zhou, M. (2018). WiCatch: A Wi-Fi based hand gesture
recognition system. IEEE Access, 6, 16911-16923.
Tomczyński, J., Mańkowski, T., & Kaczmarek, P. (2017). Influence of sEMG electrode
matrix configuration on hand gesture recognition performance. In 2017 (pp. 42-.
Signal Processing: Algorithms, Architectures, Arrangements, and Applications (SPA)
(pp. 42-47). Poznan: IEEE.
V. Enzo, P. Scilingo and Gaetano. (2017). "Recent Advances on Wearable Electronics and
embedded computing systems for biomedical applications". electronics MDPI.
van der Riet, D., Stopforth, R., Bright, G., and Diegel, O. (2013). An overview and
comparison of upper limb prosthetics. Africon (pp. 1-8). Pointe-Aux-Piments,
Mauritius: IEEE.
Vu, V. H., Thomas, M., Lakis, A. A., and Marcouiller, L. (2011). Operational modal analysis
by updating autoregressive model. Mechanical Systems and Signal Processing, 25(3),
1028-1044.
Wahid, M. F., Tafreshi, R., Al-Sowaidi, M., and Langari, R. (2018). Subject-independent
hand gesture recognition using normalization and machine learning algorithms.
Journal of computational science, 27, 69-76.
136
Weir, R., and Sensinger, J. (2003). The Design of artificial arms and hands for prosthetic
application . Handbook of Biomedical Design. McGraw-Hill.
Wheeler, K. R., Chang, M. H., and Knuth, K. H. (2006). Gesture-based control and EMG
decomposition. IEEE Transactions on Systems, Man, and Cybernetics, Part C
(Applications and Reviews), 36(4), 503-514.
Wu, Y., Zheng, B., and Zhao, Y. (2018). Dynamic gesture recognition based on LSTM-CNN.
2018 Chinese Automation Congress (CAC) (pp. 2446-2450). Xi'an, China, China:
IEEE.
Y. Paul, V. Goyal and R. A. Jaswal,. ( 2017). Comparative analysis between SVM & KNN
classifier for EMG signal classification on elementary time domain features. 4th
International Conference on Signal Processing, Computing and Control (ISPCC).
Solan, India.
Yamaba, H., Kurogi, A., Kubota, S. I., Katayama, T., Park, M., and Okazaki, N. (2017).
Evaluation of feature values of surface electromyograms for user authentication on
mobile devices. Artificial Life and Robotics, 22(1), 108-112.
Yamaba, H., Kurogi, T., Aburada, K., Kubota, S. I., Katayama, T., Park, M., and Okazaki, N.
(2018). On applying support vector machines to a user authentication method using
surface electromyogram signals. Artificial Life and Robotics,, 23(1), 87-93.
Yamaba, H., Nagatomo, S., Aburada, K., Kubota, S., Katayama, T., Park, M., and Okazaki,
N. (2015). An Authentication Method Independent of Tap Operation on the
Touchscreen of a Mobile Device. Journal of Robotics, Networking and Artificial Life,
2(1)(60-63).
Yang, J., Pan, J., and Li, J. (2017). sEMG-based continuous hand gesture recognition using
GMM-HMM and threshold model. IEEE International Conference on Robotics and
Biomimetics (ROBIO) (pp. 1509-1514). Macau, China: IEEE.
Yasen, M., and Jusoh, S. (2019). A systematic review on hand gesture recognition
techniques, challenges and applications. PeerJ Computer Science, 5.
Youbionic [Internet]. ([cited 2015 Jun 29]). Retrieved from www.youbionic.com/

137
Zecca, M., Micera, S., Carrozza, M. C., and Dario, P. (2002). Control of multifunctional
prosthetic hands by processing the electromyographic signal. Critical Reviews™ in
Biomedical Engineering, 30, 4-6.
Zhang, H., Zhao, Y., Yao, F., Xu, L., Shang, P., and Li, G. (2013). An adaptation strategy of
using LDA classifier for EMG pattern recognition. 35th annual international
conference of the IEEE engineering in medicine and biology society (EMBC). Osaka,
Japan: IEEE.
Zhang, X. H., Wang, J. J., Wang, X., and Ma, X. L. (2016). Improvement of dynamic hand
gesture recognition based on HMM algorithm. International Conference on
Information System and Artificial Intelligence (ISAI) (pp. 401-406). Hong Kong,
China: IEEE.
Zhang, Z., Yang, K., Qian, J., and Zhang, L. (2019). Real-time surface emg pattern
recognition for hand gestures based on an artificial neural network. Sensors, , 3170.,
19(14).
Zhu, Y., Jiang, S., and Shull, P. B. (2018). Wrist-worn hand gesture recognition based on
barometric pressure sensing. 15th International Conference on Wearable and
Implantable Body Sensor Networks (BSN) (pp. 181-184). IEEE.
Zia ur Rehman, M., Waris, A., Gilani, S. O., Jochumsen, M., Niazi, I. K., Jamil, M., and
Kamavuako, E. N. (2018). Multiday EMG-based classification of hand motions with
deep learning techniques. Sensors, 18(8), 2497.
Zuniga, J. K. (n.d.). A low-cost 3d-printed prosthetic hand for children with upper-limb
differences. BMC research notes, 8(1), 1-9.