lymphatic filariasis_mda_systematic review
TRANSCRIPT
Coverage of, and compliance with, mass drug administration under theprogramme to eliminate lymphatic filariasis in India: a systematic review
Bontha V. Babua,* and Gopalan R. Babub
aHealth Systems Research Division, Indian Council of Medical Research, New Delhi 110 029, India; bKerala Unit, National Institute ofVirology, Indian Council of Medical Research, Alappuzha 688 005, India
*Corresponding author: Tel.: +11 26172832; E-mail: [email protected]
Received 19 December 2013; revised 4 March 2014; accepted 5 March 2014
India’s mass drug administration (MDA) programme to eliminate lymphatic filariasis (PELF) covers all 250endemic districts, but compliance with treatment is not adequate for the programme to succeed in eradicatingthis neglected tropical disease. The objective of our study was to systematically review published studies on thecoverage of and compliance with MDA under the PELF in India. We searched several databases – PubMed/Medline,Google Scholar, CINAHL/EBSCO, Web of Knowledge (including Web of Science) and OVID – and by applying selec-tion criteria identified a total of 36 papers to include in the review.
Overall MDA coverage rates varied between 48.8% and 98.8%, while compliance rates ranged from 20.8% to93.7%. The coverage–compliance gap is large in many MDA programmes. The effective level of compliance,≥65%, was reported in only 10 of a total of 31 MDAs (five of 20 MDAs in rural areas and two of 12 MDAs inurban areas). The review has identified a gap between coverage and compliance, and potentially correctablecauses of this gap. These causes need to be addressed if the Indian programme is to advance towards elimin-ation of lymphatic filariasis.
Keywords: Compliance, Coverage, Global programme to eliminate lymphatic filariasis, Lymphatic filariasis, Mass drug administration,Systematic review
IntroductionAn estimated 120 million people in 73 countries are infected withlymphatic filariasis, and an estimated 1.4 billion live in areaswhere the disease is endemic.1 The 1997 World HealthAssembly resolved to eliminate lymphatic filariasis as a publichealth problem once the disease had been identified as poten-tially eradicable.2
India, a signatory of the World Health Assembly’s resolution, inits National Health Policy of 2002 set the ambitious target of elim-inating lymphatic filariasis by 2015.3 India began annual massdrug administration (MDA) with antifilarial drugs in 11 endemicdistricts in 1997, on a pilot basis. The programme to eliminatelymphatic filariasis (PELF) was extended to a further 202 districtsin 2004,4 and by 2007 covered all 250 known endemic districts. InIndia, a health services-driven MDA is usually implemented byhealth workers or community volunteers, selected by healthcarepersonnel, carrying out house-to-house distribution of drugs.Usually, the drugs are delivered to one member of a family, withthe request that the family members ingest the drugs at their con-venience. The individual delivering the drugs to a household mayor may not insist that the drugs are ingested in their presence. Inmost cases, they do not contact other family members. Usually,
the number of people covered by this process (total population towhom the drugs are delivered at their residence) is reported by thegovernment health services as the coverage achieved (‘reportedcoverage’). Hence, in the context of the Indian PELF, the reportedcoverage is not the actual MDA coverage. Hence, initial studies onMDA from India devised two indices of MDA: coverage and com-pliance. While coverage is the proportion of eligible people whoreceived the antifilarial tablets, compliance is the proportion of eli-gible people who actually ingested the tablets. The coverage–compliance gap (the proportion of people who receive the drugsbut do not ingest them) is a considerable issue in India.
In several states, implementation of MDA is irregular, withextended intervals between MDAs or MDAs being skipped.4
Compliance with the MDA is inadequate in several endemicareas.5–14 These studies have highlighted the large gap betweenMDA coverage and compliance. It is estimated that, to interrupttransmission of lymphatic filariasis, MDA compliance must exceed65–75%.15 When a considerable proportion of the population failsto comply with the MDA, a potential reservoir for the parasiteremains untreated, thus opening the door to recrudescence ofmicrofilaraemia and reducing the chance of the programme’ssuccess.16 Programmes that achieve sufficient compliance for atleast 5 years typically progress to transmission assessment
# The Author 2014. Published by Oxford University Press on behalf of Royal Society of Tropical Medicine and Hygiene. All rights reserved.For permissions, please e-mail: [email protected].
REV
IEW
Trans R Soc Trop Med Hygdoi:10.1093/trstmh/tru057
1 of 12
Transactions of the Royal Society of Tropical Medicine and Hygiene Advance Access published April 11, 2014 by guest on A
pril 20, 2014http://trstm
h.oxfordjournals.org/D
ownloaded from
surveys (TAS). If the programme passes the TAS, MDA is stoppedand post-intervention surveillance begins. In many districts MDAis continuing, and there is a need to improve compliance andthus move towards the next stage of the elimination process.An understanding of the factors associated with MDA coverageand subsequent compliance with treatment is needed to allowthe programme to develop evidence-based strategies to improvecompliance. Hence, we undertook a systematic review of studiesundertaken on MDA coverage and compliance and associated fac-tors in various lymphatic filariasis endemic districts of India.
MethodsWe conducted a systematic review of published studies con-ducted by the government health services since 1997 to evaluatethe extent of MDA coverage and compliance in different Indianstates. Also, data on various factors that influenced the coverageand compliance of MDA were captured and synthesised asdescribed below. The guidelines under the PRISMA Statementfor Reporting Systematic Reviews and Meta-Analysis were fol-lowed during this iterative process of systematic review.17,18 Thecompleted PRISMA checklist is available in the onlineSupplementary material.
Criteria for selection of studies
Only community-based studies that evaluated MDA conducted bythe health services were eligible for inclusion. Data were excludedif governmental, non-governmental or research organisationsintervened to improve compliance. However, papers that reportedsuch studies were considered and data on control MDAs wereincluded. Studies other than community-based ones wereexcluded, although they dealt with compliance-related issues.Only quantitative data were considered; hence, papers basedexclusively on qualitative research were excluded. Papers takinga mixed-methods approach were included, and only the quantita-tive data were extracted. Review documents, health servicereports, policy briefs/documents and training material/manualswere not included, as they did not report primary data.
Literature search and selection of articles
We systematically searched PubMed/Medline, Google Scholar,CINAHL/EBSCO, Web of Knowledge (including Web of Science)and OVID for articles from India published up to 15 August2013 on MDA compliance-related issues. While searchingGoogle Scholar, we limited the search to title search only. Weused the keywords ‘lymphatic filariasis’, ‘mass drug administra-tion’, ‘programme to eliminate lymphatic filariasis’, ‘global pro-gramme to eliminate lymphatic filariasis’, ‘coverage’ and‘compliance’ in different combinations. The keyword ‘India’ wasincluded in all combinations of keywords during the search. Thereference lists of all included papers, and citations of other keypapers on MDA from India, were also checked.
Selection and extraction of data
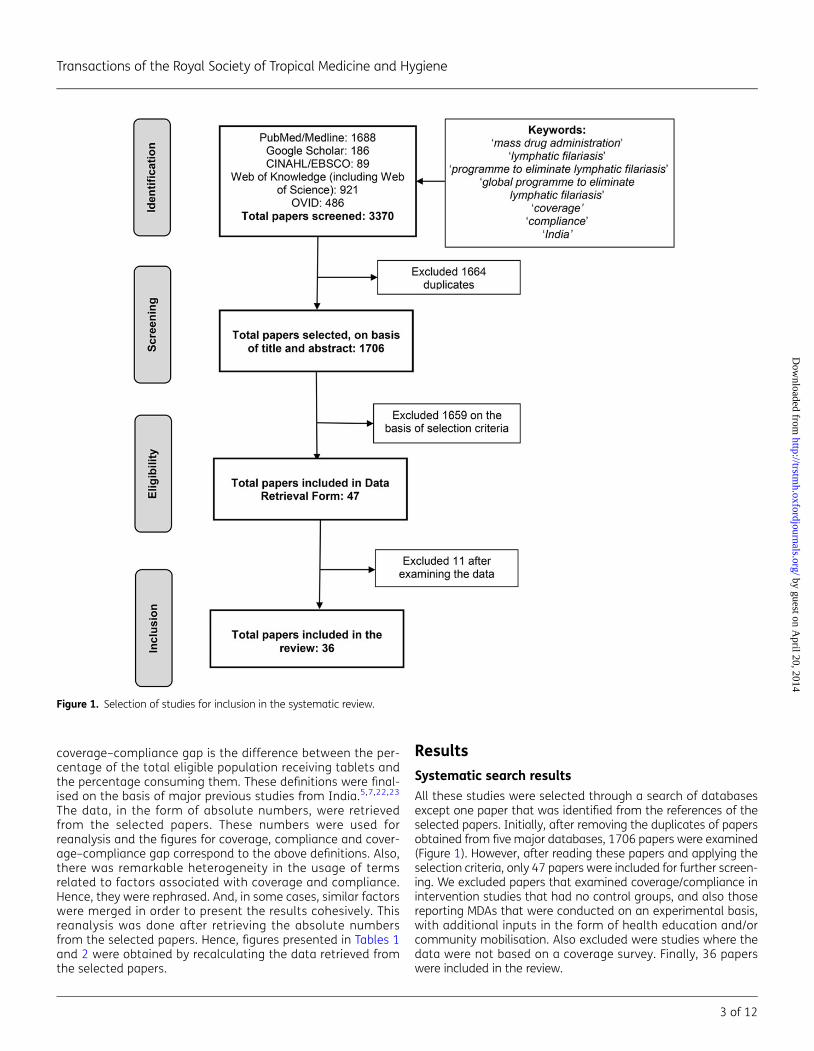
The selection of articles and extraction of data are illustrated inFigure 1. Papers were selected according to the PRISMA
guidelines.17 We independently reviewed and retrieved studies ini-tially at title and abstract level (looking at the full text if the paperdid not have an abstract). Studies that met the selection criteria(even approximately) were identified and the full texts of thesepapers retrieved. All papers were critically appraised independ-ently by BVB and GRB.
A form to retrieve the data was developed. The data had fourcore components: 1. MDA coverage; 2. MDA compliance; 3. Factorsthat influenced coverage; 4. Factors that influenced compliance.Other details of the MDA were also included. Development ofthe data extraction form was based on guidelines from theCentre for Reviews and Dissemination.19 BVB and GRB criticallyexamined the completed data extraction forms, taking into con-sideration the selection criteria, first independently and thenjointly. In the event of disagreement, a consensus was reachedafter thorough discussion until, finally the list of studies to beincluded in the review was finalised. The data extraction formswere used again while extracting and synthesising the data ofselected articles.
Quality appraisal
We were unable to find a validated quality assessment tool forcritical appraisal of the kind of programme evaluation studiesthat we had selected. We therefore developed a quality assess-ment form specifically for this review, taking as a model a check-list available from the Alberta Heritage Foundation for MedicalResearch, Canada.20 Issues that we deemed important whenassessing the quality of a study included study design, sampling(representativeness of the population under study), interviewingmethods for collection of information from study participantsand recall time. Both authors independently examined theseissues when assessing the quality of each study. We ensuredthat all the selected studies met the minimum criteria. All thestudies are based on random samples of households sampledfrom clusters. In most studies, these clusters are from ruralareas or from both rural and urban areas; some studies appliedthe probability proportional to size (PPS) sampling method todetermine the number of clusters. In all studies, data were col-lected through personal interviews with the head of the house-hold or other adult family member, using a structuredquestionnaire. The recall time is set as 1 month. However, therecall time exceeded 1 month in some studies (1–3 months inthree studies and .3 months in six studies).There is evidencethat recall of consumption of drugs during MDA is good for atleast 6 months, and coverage surveys provide accurate and con-sistent estimates of overall coverage for up to 1 year followingan MDA.21
Data synthesis
We read thoroughly the selected papers and tabulated in detailthe results for all four core components of MDA. We noted hetero-geneity in the definition of concepts related to MDA coverage andcompliance. We defined MDA coverage as the percentage of thetotal eligible population who received the tablets, and MDA com-pliance as the percentage of the total eligible population whoingested the tablets. The total eligible population excludes chil-dren ,2 years of age, pregnant women and severely ill indi-viduals, because MDA rules forbid their participation. The
B. V. Babu and G. R. Babu
2 of 12
by guest on April 20, 2014
http://trstmh.oxfordjournals.org/
Dow
nloaded from
coverage–compliance gap is the difference between the per-centage of the total eligible population receiving tablets andthe percentage consuming them. These definitions were final-ised on the basis of major previous studies from India.5,7,22,23
The data, in the form of absolute numbers, were retrievedfrom the selected papers. These numbers were used forreanalysis and the figures for coverage, compliance and cover-age–compliance gap correspond to the above definitions. Also,there was remarkable heterogeneity in the usage of termsrelated to factors associated with coverage and compliance.Hence, they were rephrased. And, in some cases, similar factorswere merged in order to present the results cohesively. Thisreanalysis was done after retrieving the absolute numbersfrom the selected papers. Hence, figures presented in Tables 1and 2 were obtained by recalculating the data retrieved fromthe selected papers.
Results
Systematic search results
All these studies were selected through a search of databasesexcept one paper that was identified from the references of theselected papers. Initially, after removing the duplicates of papersobtained from five major databases, 1706 papers were examined(Figure 1). However, after reading these papers and applying theselection criteria, only 47 papers were included for further screen-ing. We excluded papers that examined coverage/compliance inintervention studies that had no control groups, and also thosereporting MDAs that were conducted on an experimental basis,with additional inputs in the form of health education and/orcommunity mobilisation. Also excluded were studies where thedata were not based on a coverage survey. Finally, 36 paperswere included in the review.
Figure 1. Selection of studies for inclusion in the systematic review.
Transactions of the Royal Society of Tropical Medicine and Hygiene
3 of 12
by guest on April 20, 2014
http://trstmh.oxfordjournals.org/
Dow
nloaded from
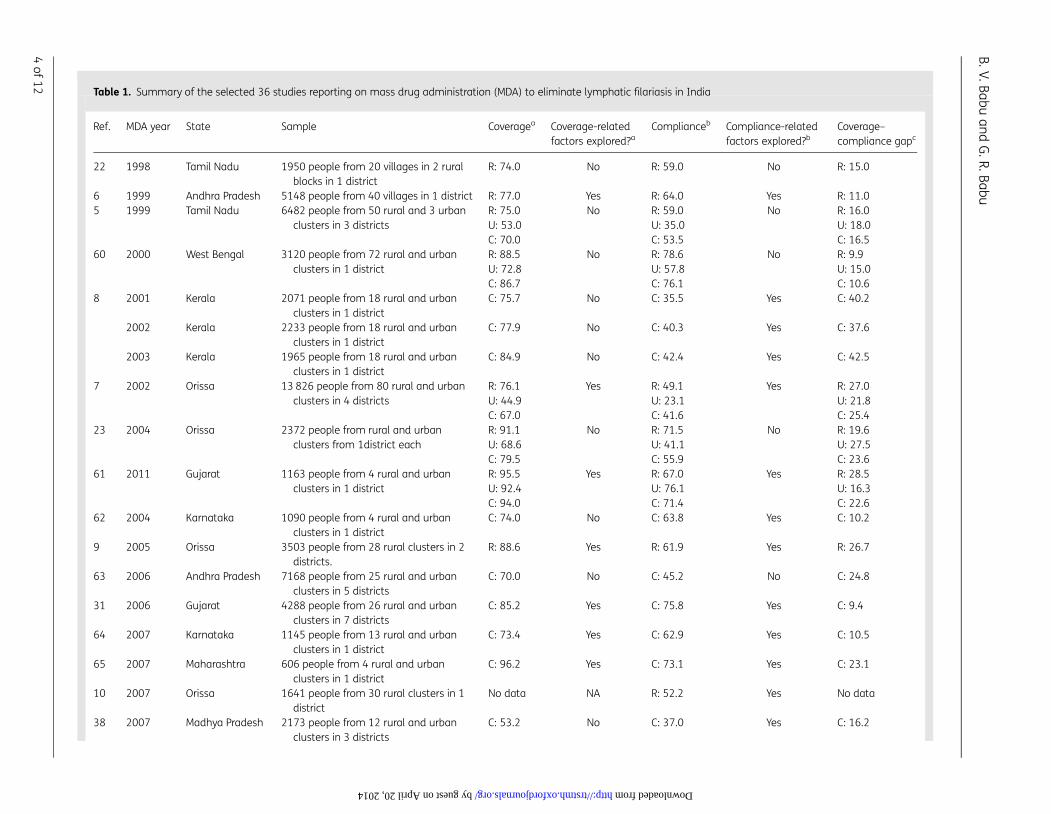
Table 1. Summary of the selected 36 studies reporting on mass drug administration (MDA) to eliminate lymphatic filariasis in India
Ref. MDA year State Sample Coveragea Coverage-relatedfactors explored?a
Complianceb Compliance-relatedfactors explored?b
Coverage–compliance gapc
22 1998 Tamil Nadu 1950 people from 20 villages in 2 ruralblocks in 1 district
R: 74.0 No R: 59.0 No R: 15.0
6 1999 Andhra Pradesh 5148 people from 40 villages in 1 district R: 77.0 Yes R: 64.0 Yes R: 11.05 1999 Tamil Nadu 6482 people from 50 rural and 3 urban
clusters in 3 districtsR: 75.0U: 53.0C: 70.0
No R: 59.0U: 35.0C: 53.5
No R: 16.0U: 18.0C: 16.5
60 2000 West Bengal 3120 people from 72 rural and urbanclusters in 1 district
R: 88.5U: 72.8C: 86.7
No R: 78.6U: 57.8C: 76.1
No R: 9.9U: 15.0C: 10.6
8 2001 Kerala 2071 people from 18 rural and urbanclusters in 1 district
C: 75.7 No C: 35.5 Yes C: 40.2
2002 Kerala 2233 people from 18 rural and urbanclusters in 1 district
C: 77.9 No C: 40.3 Yes C: 37.6
2003 Kerala 1965 people from 18 rural and urbanclusters in 1 district
C: 84.9 No C: 42.4 Yes C: 42.5
7 2002 Orissa 13 826 people from 80 rural and urbanclusters in 4 districts
R: 76.1U: 44.9C: 67.0
Yes R: 49.1U: 23.1C: 41.6
Yes R: 27.0U: 21.8C: 25.4
23 2004 Orissa 2372 people from rural and urbanclusters from 1district each
R: 91.1U: 68.6C: 79.5
No R: 71.5U: 41.1C: 55.9
No R: 19.6U: 27.5C: 23.6
61 2011 Gujarat 1163 people from 4 rural and urbanclusters in 1 district
R: 95.5U: 92.4C: 94.0
Yes R: 67.0U: 76.1C: 71.4
Yes R: 28.5U: 16.3C: 22.6
62 2004 Karnataka 1090 people from 4 rural and urbanclusters in 1 district
C: 74.0 No C: 63.8 Yes C: 10.2
9 2005 Orissa 3503 people from 28 rural clusters in 2districts.
R: 88.6 Yes R: 61.9 Yes R: 26.7
63 2006 Andhra Pradesh 7168 people from 25 rural and urbanclusters in 5 districts
C: 70.0 No C: 45.2 No C: 24.8
31 2006 Gujarat 4288 people from 26 rural and urbanclusters in 7 districts
C: 85.2 Yes C: 75.8 Yes C: 9.4
64 2007 Karnataka 1145 people from 13 rural and urbanclusters in 1 district
C: 73.4 Yes C: 62.9 Yes C: 10.5
65 2007 Maharashtra 606 people from 4 rural and urbanclusters in 1 district
C: 96.2 Yes C: 73.1 Yes C: 23.1
10 2007 Orissa 1641 people from 30 rural clusters in 1district
No data NA R: 52.2 Yes No data
38 2007 Madhya Pradesh 2173 people from 12 rural and urbanclusters in 3 districts
C: 53.2 No C: 37.0 Yes C: 16.2
B.V.Babuan
dG
.R.Babu
4of
12
by guest on April 20, 2014 http://trstmh.oxfordjournals.org/ Downloaded from
12 2007 Kerala 1185 people from 30 rural and urbanclusters in 1 district
C: 52.7 No C: 20.8 Yes C: 31.9
28 2007 Kerala 599 people from 6 wards of 1 village R: 77.0 No R: 30.5 Yes R: 46.511 2008 Orissa 2431 people from 30 rural clusters in 1
districtNo data NA R: 52.9 Yes No data
66 2008 Puducherry 1231 people from 2 villages in 1 district R: 75.3 No R: 67.3 No R: 8.026 2008 Karnataka 602 people from 4 rural and urban
clusters in 1 districtR: 85.0 No R: 26.6 Yes R: 58.4
67 2008 Karnataka 1131 people from 8 rural and urbanclusters in 1 district
C: 78.0 No C: 68.0 Yes C: 10.0
29 2008 Karnataka 1830 people from 12 rural and urbanclusters in 1 district
C: 85.9 No C: 45.9 Yes C: 40.0
68 2009 Karnataka 1228 people from 8 rural and urbanclusters in 2 districts
No data NA R: 64.1U: 40.1C: 57.9
Yes No data
13 2009 Tamil Nadu 1634 people from 12 rural and urbanclusters in 3 districts
R: 77.5U: 54.2C: 71.7
No R: 45.1U: 32.2C: 41.9
Yesd R: 32.4U: 22.0C: 29.8
2010 Tamil Nadu 1583 people from 12 rural and urbanclusters in 3 districts
R: 80.5U: 83.0C: 81.1
No R: 63.1U: 57.3C: 61.7
R: 17.4U: 25.7C: 19.4
69 2009 West Bengal 630 people from 30 rural and urbanclusters in 1 district
R: 83.9U: 84.7C: 84.1
No R: 58.7U: 60.7C: 59.3
Yes R: 25.2U: 24.0C: 24.8
2010 West Bengal 754 people from 30 rural and urbanclusters in 1 district
R: 85.9U: 83.8C: 85.4
No R: 57.2U: 56.5C: 57.0
Yes R: 28.7U: 27.3C: 28.4
25 2010 Karnataka 951 people from 4 rural and urbanclusters in 1 district
R: 68.8U: 43.6C: 62.4
No R: 44.2U: 18.5C: 37.6
Yes R: 24.6U: 25.1C: 24.8
70 2009 West Bengal 568 people from 4 rural and urbanclusters in 1 district
C: 98.4 No C: 91.7 Yes C: 6.7
71 2010 West Bengal 778 people from 4 rural and urbanclusters in 1 district
C: 55.9 No C: 38.8 Yes C: 17.1
72 2009 Karnataka 925 people from 4 rural and urbanclusters in 1 district
No data NA C: 77.3 Yes No data
14 2010 West Bengal 603 people from 4 rural and urbanclusters in 1 district
C: 48.8 No C: 34.2 Yes C: 14.6
30 2011 Andhra Pradesh 506 people from 4 rural and urbanclusters in 1 district
C: 79.7 No C: 34.3 Yes C: 45.4
27 2011 Jharkhand 4269 people from 4 rural and urbanclusters in 1 district
C: 56.8 No C: 11.1e Yes No data
73 2011 Karnataka 1026 people from 4 rural and urbanclusters in 1 district
C: 97.4 No C: 77.6 Yes C: 19.8
Continued
Transaction
sof
the
RoyalSocietyof
TropicalM
edicin
ean
dH
ygiene
5of
12
by guest on April 20, 2014 http://trstmh.oxfordjournals.org/ Downloaded from
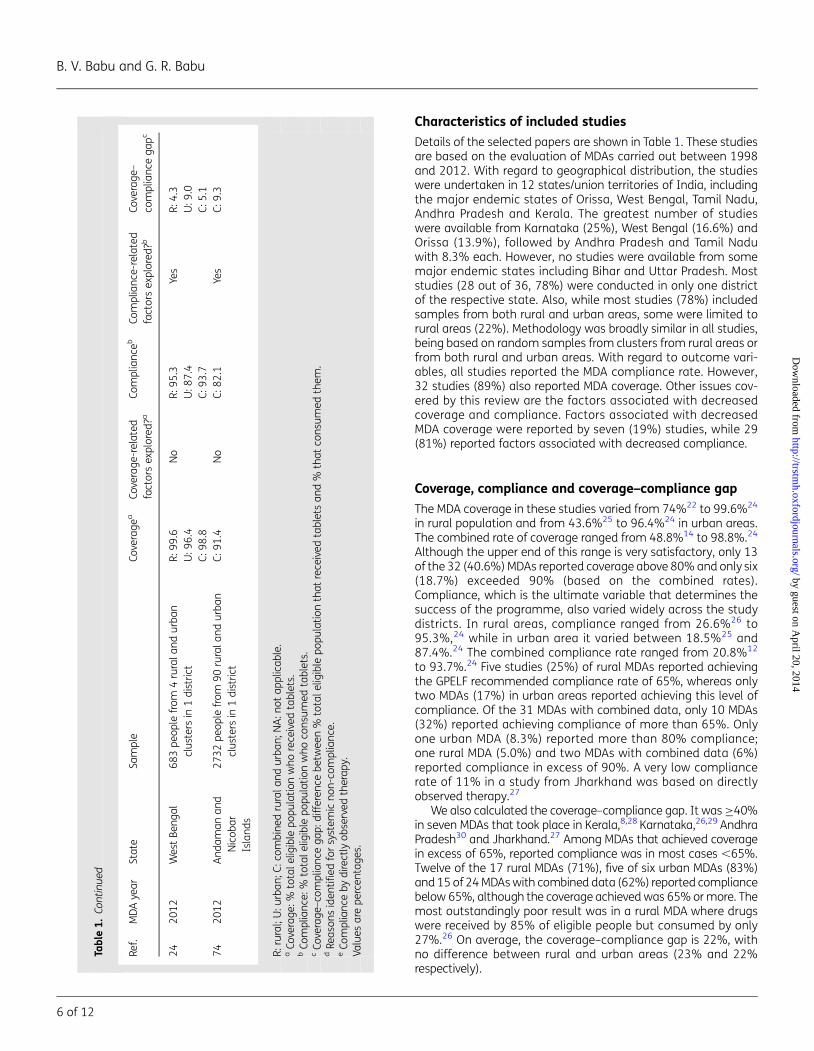
Characteristics of included studies
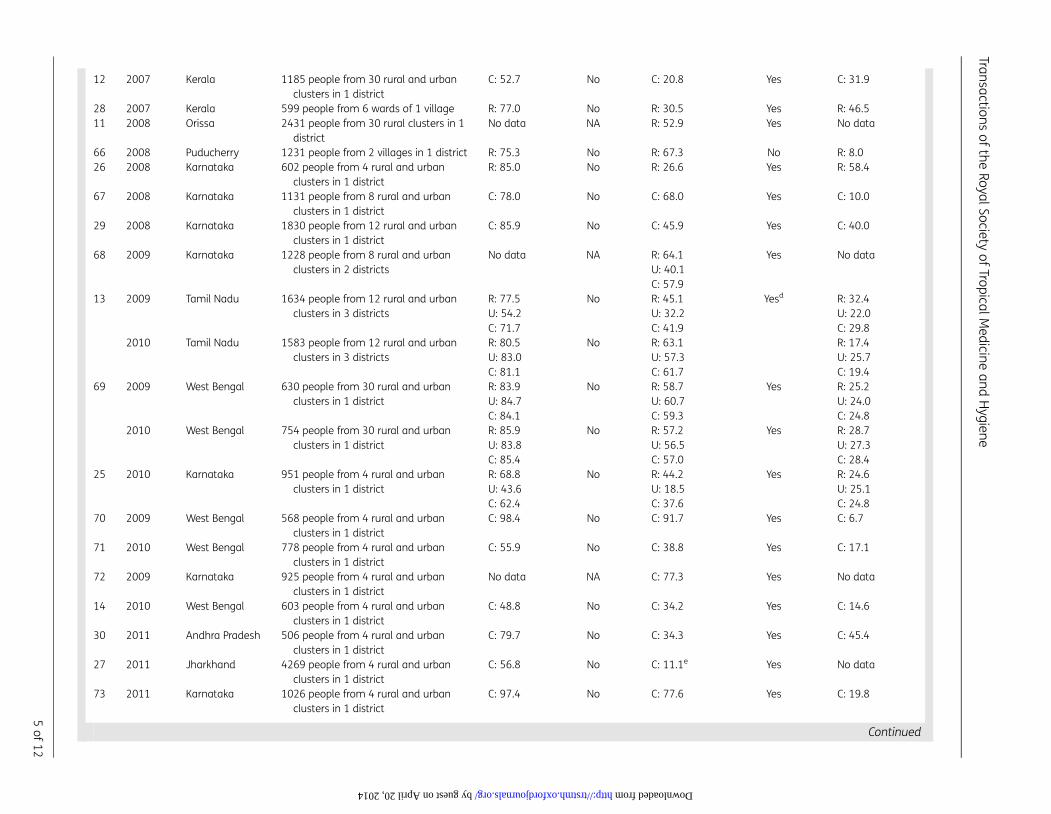
Details of the selected papers are shown in Table 1. These studiesare based on the evaluation of MDAs carried out between 1998and 2012. With regard to geographical distribution, the studieswere undertaken in 12 states/union territories of India, includingthe major endemic states of Orissa, West Bengal, Tamil Nadu,Andhra Pradesh and Kerala. The greatest number of studieswere available from Karnataka (25%), West Bengal (16.6%) andOrissa (13.9%), followed by Andhra Pradesh and Tamil Naduwith 8.3% each. However, no studies were available from somemajor endemic states including Bihar and Uttar Pradesh. Moststudies (28 out of 36, 78%) were conducted in only one districtof the respective state. Also, while most studies (78%) includedsamples from both rural and urban areas, some were limited torural areas (22%). Methodology was broadly similar in all studies,being based on random samples from clusters from rural areas orfrom both rural and urban areas. With regard to outcome vari-ables, all studies reported the MDA compliance rate. However,32 studies (89%) also reported MDA coverage. Other issues cov-ered by this review are the factors associated with decreasedcoverage and compliance. Factors associated with decreasedMDA coverage were reported by seven (19%) studies, while 29(81%) reported factors associated with decreased compliance.
Coverage, compliance and coverage–compliance gap
The MDA coverage in these studies varied from 74%22 to 99.6%24
in rural population and from 43.6%25 to 96.4%24 in urban areas.The combined rate of coverage ranged from 48.8%14 to 98.8%.24
Although the upper end of this range is very satisfactory, only 13of the 32 (40.6%) MDAs reported coverage above 80% and only six(18.7%) exceeded 90% (based on the combined rates).Compliance, which is the ultimate variable that determines thesuccess of the programme, also varied widely across the studydistricts. In rural areas, compliance ranged from 26.6%26 to95.3%,24 while in urban area it varied between 18.5%25 and87.4%.24 The combined compliance rate ranged from 20.8%12
to 93.7%.24 Five studies (25%) of rural MDAs reported achievingthe GPELF recommended compliance rate of 65%, whereas onlytwo MDAs (17%) in urban areas reported achieving this level ofcompliance. Of the 31 MDAs with combined data, only 10 MDAs(32%) reported achieving compliance of more than 65%. Onlyone urban MDA (8.3%) reported more than 80% compliance;one rural MDA (5.0%) and two MDAs with combined data (6%)reported compliance in excess of 90%. A very low compliancerate of 11% in a study from Jharkhand was based on directlyobserved therapy.27
We also calculated the coverage–compliance gap. It was ≥40%in seven MDAs that took place in Kerala,8,28 Karnataka,26,29 AndhraPradesh30 and Jharkhand.27 Among MDAs that achieved coveragein excess of 65%, reported compliance was in most cases ,65%.Twelve of the 17 rural MDAs (71%), five of six urban MDAs (83%)and 15 of 24 MDAs with combined data (62%) reported compliancebelow 65%, although the coverage achieved was 65% or more. Themost outstandingly poor result was in a rural MDA where drugswere received by 85% of eligible people but consumed by only27%.26 On average, the coverage–compliance gap is 22%, withno difference between rural and urban areas (23% and 22%respectively).
Tabl
e1.
Cont
inue
d
Ref.
MD
Aye
arSt
ate
Sam
ple
Cove
rage
aCo
vera
ge-r
elat
edfa
ctor
sex
plor
ed?a
Com
plia
nce
bCo
mpl
ian
ce-r
elat
edfa
ctor
sex
plor
ed?b
Cove
rage
–co
mpl
ian
cega
pc
24
20
12
Wes
tBe
ngal
68
3pe
ople
from
4ru
rala
nd
urb
ancl
ust
ers
in1
dis
tric
tR:
99
.6U
:96
.4C:
98
.8
No
R:9
5.3
U:8
7.4
C:9
3.7
Yes
R:4
.3U
:9.0
C:5
.17
42
01
2A
nd
aman
and
Nic
obar
Isla
nds
27
32pe
ople
from
90
rura
lan
du
rban
clu
ster
sin
1d
istr
ict
C:9
1.4
No
C:8
2.1
Yes
C:9
.3
R:ru
ral;
U:u
rban
;C:c
ombi
ned
rura
lan
du
rban
;NA
:not
appl
icab
le.
aCo
vera
ge:%
tota
lelig
ible
popu
lati
onw
hore
ceiv
edta
blet
s.b
Com
plia
nce
:%to
tale
ligib
lepo
pula
tion
who
con
sum
edta
blet
s.c
Cove
rage
–com
plia
nce
gap:
diff
eren
cebe
twee
n%
tota
lelig
ible
popu
lati
onth
atre
ceiv
edta
blet
san
d%
that
con
sum
edth
em.
dRe
ason
sid
enti
fied
for
syst
emic
non
-com
plia
nce
.e
Com
plia
nce
byd
irect
lyob
serv
edth
erap
y.Va
lues
are
perc
enta
ges.
B. V. Babu and G. R. Babu
6 of 12
by guest on April 20, 2014
http://trstmh.oxfordjournals.org/
Dow
nloaded from
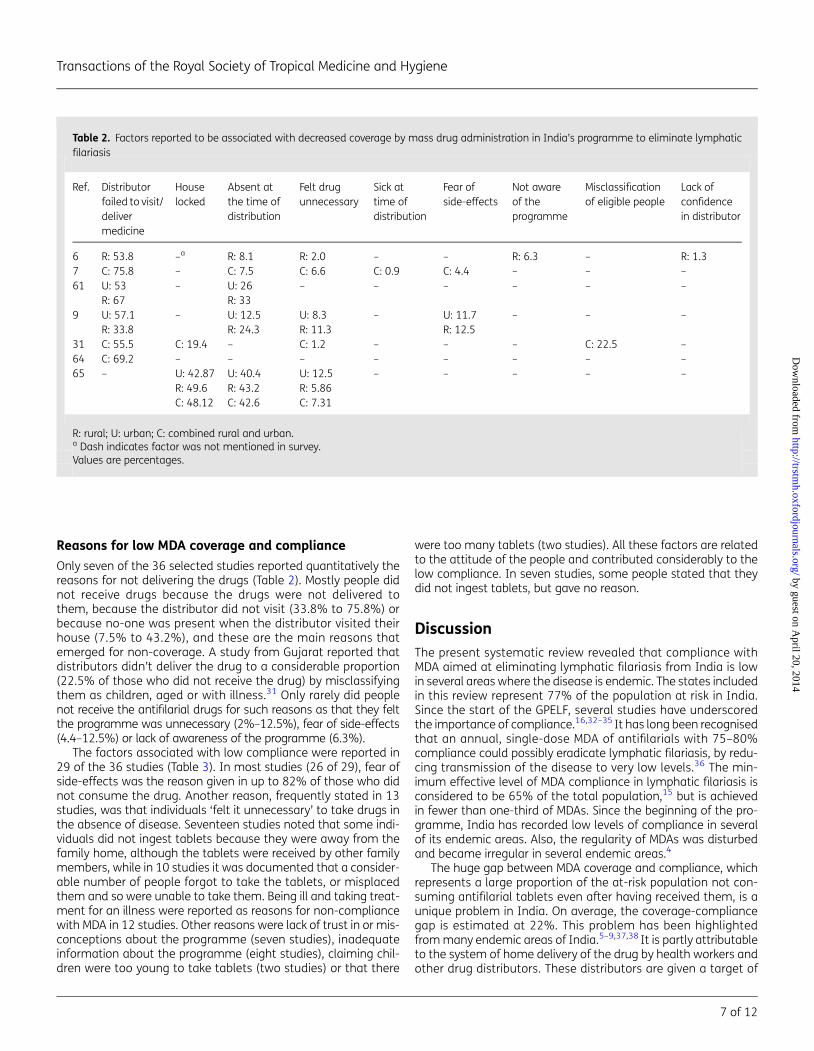
Reasons for low MDA coverage and compliance
Only seven of the 36 selected studies reported quantitatively thereasons for not delivering the drugs (Table 2). Mostly people didnot receive drugs because the drugs were not delivered tothem, because the distributor did not visit (33.8% to 75.8%) orbecause no-one was present when the distributor visited theirhouse (7.5% to 43.2%), and these are the main reasons thatemerged for non-coverage. A study from Gujarat reported thatdistributors didn’t deliver the drug to a considerable proportion(22.5% of those who did not receive the drug) by misclassifyingthem as children, aged or with illness.31 Only rarely did peoplenot receive the antifilarial drugs for such reasons as that they feltthe programme was unnecessary (2%–12.5%), fear of side-effects(4.4–12.5%) or lack of awareness of the programme (6.3%).
The factors associated with low compliance were reported in29 of the 36 studies (Table 3). In most studies (26 of 29), fear ofside-effects was the reason given in up to 82% of those who didnot consume the drug. Another reason, frequently stated in 13studies, was that individuals ‘felt it unnecessary’ to take drugs inthe absence of disease. Seventeen studies noted that some indi-viduals did not ingest tablets because they were away from thefamily home, although the tablets were received by other familymembers, while in 10 studies it was documented that a consider-able number of people forgot to take the tablets, or misplacedthem and so were unable to take them. Being ill and taking treat-ment for an illness were reported as reasons for non-compliancewith MDA in 12 studies. Other reasons were lack of trust in or mis-conceptions about the programme (seven studies), inadequateinformation about the programme (eight studies), claiming chil-dren were too young to take tablets (two studies) or that there
were too many tablets (two studies). All these factors are relatedto the attitude of the people and contributed considerably to thelow compliance. In seven studies, some people stated that theydid not ingest tablets, but gave no reason.
DiscussionThe present systematic review revealed that compliance withMDA aimed at eliminating lymphatic filariasis from India is lowin several areas where the disease is endemic. The states includedin this review represent 77% of the population at risk in India.Since the start of the GPELF, several studies have underscoredthe importance of compliance.16,32–35 It has long been recognisedthat an annual, single-dose MDA of antifilarials with 75–80%compliance could possibly eradicate lymphatic filariasis, by redu-cing transmission of the disease to very low levels.36 The min-imum effective level of MDA compliance in lymphatic filariasis isconsidered to be 65% of the total population,15 but is achievedin fewer than one-third of MDAs. Since the beginning of the pro-gramme, India has recorded low levels of compliance in severalof its endemic areas. Also, the regularity of MDAs was disturbedand became irregular in several endemic areas.4
The huge gap between MDA coverage and compliance, whichrepresents a large proportion of the at-risk population not con-suming antifilarial tablets even after having received them, is aunique problem in India. On average, the coverage-compliancegap is estimated at 22%. This problem has been highlightedfrom many endemic areas of India.5–9,37,38 It is partly attributableto the system of home delivery of the drug by health workers andother drug distributors. These distributors are given a target of
Table 2. Factors reported to be associated with decreased coverage by mass drug administration in India’s programme to eliminate lymphaticfilariasis
Ref. Distributorfailed to visit/delivermedicine
Houselocked
Absent atthe time ofdistribution
Felt drugunnecessary
Sick attime ofdistribution
Fear ofside-effects
Not awareof theprogramme
Misclassificationof eligible people
Lack ofconfidencein distributor
6 R: 53.8 –a R: 8.1 R: 2.0 – – R: 6.3 – R: 1.37 C: 75.8 – C: 7.5 C: 6.6 C: 0.9 C: 4.4 – – –61 U: 53
R: 67– U: 26
R: 33– – – – – –
9 U: 57.1R: 33.8
– U: 12.5R: 24.3
U: 8.3R: 11.3
– U: 11.7R: 12.5
– – –
31 C: 55.5 C: 19.4 – C: 1.2 – – – C: 22.5 –64 C: 69.2 – – – – – – – –65 – U: 42.87
R: 49.6C: 48.12
U: 40.4R: 43.2C: 42.6
U: 12.5R: 5.86C: 7.31
– – – – –
R: rural; U: urban; C: combined rural and urban.a Dash indicates factor was not mentioned in survey.Values are percentages.
Transactions of the Royal Society of Tropical Medicine and Hygiene
7 of 12
by guest on April 20, 2014
http://trstmh.oxfordjournals.org/
Dow
nloaded from
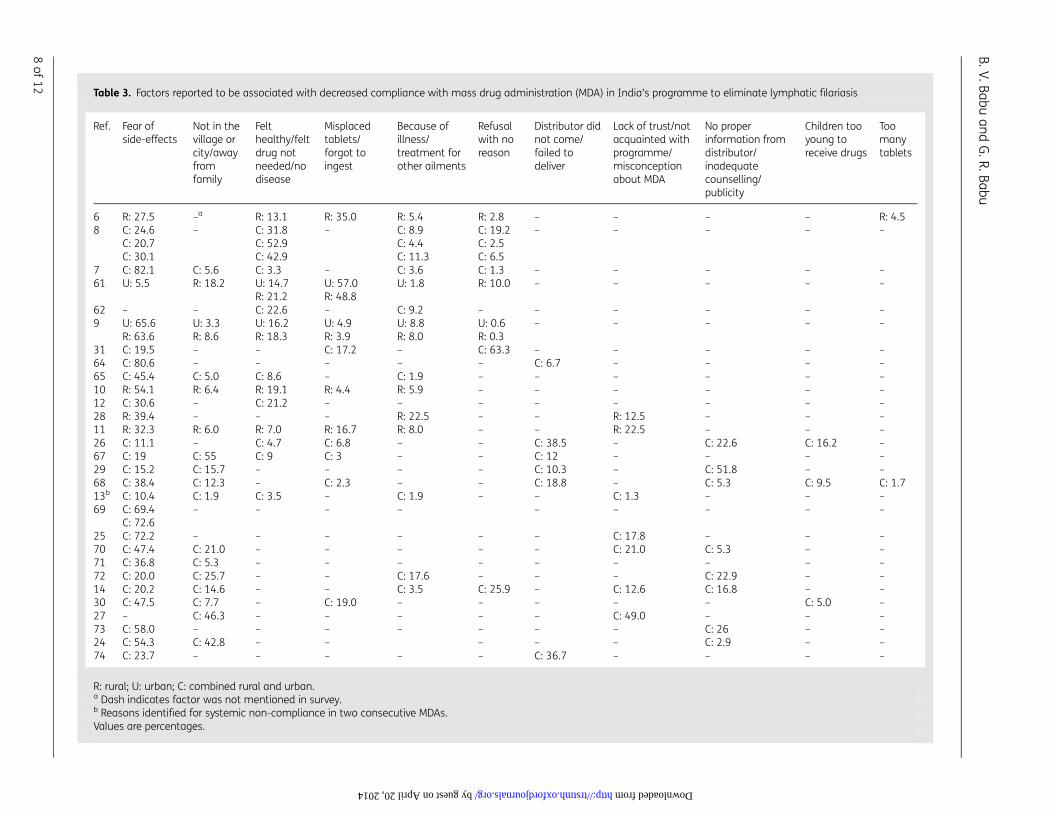
Table 3. Factors reported to be associated with decreased compliance with mass drug administration (MDA) in India’s programme to eliminate lymphatic filariasis
Ref. Fear ofside-effects
Not in thevillage orcity/awayfromfamily
Felthealthy/feltdrug notneeded/nodisease
Misplacedtablets/forgot toingest
Because ofillness/treatment forother ailments
Refusalwith noreason
Distributor didnot come/failed todeliver
Lack of trust/notacquainted withprogramme/misconceptionabout MDA
No properinformation fromdistributor/inadequatecounselling/publicity
Children tooyoung toreceive drugs
Toomanytablets
6 R: 27.5 –a R: 13.1 R: 35.0 R: 5.4 R: 2.8 – – – – R: 4.58 C: 24.6
C: 20.7C: 30.1
– C: 31.8C: 52.9C: 42.9
– C: 8.9C: 4.4C: 11.3
C: 19.2C: 2.5C: 6.5
– – – – –
7 C: 82.1 C: 5.6 C: 3.3 – C: 3.6 C: 1.3 – – – – –61 U: 5.5 R: 18.2 U: 14.7
R: 21.2U: 57.0R: 48.8
U: 1.8 R: 10.0 – – – – –
62 – – C: 22.6 – C: 9.2 – – – – – –9 U: 65.6
R: 63.6U: 3.3R: 8.6
U: 16.2R: 18.3
U: 4.9R: 3.9
U: 8.8R: 8.0
U: 0.6R: 0.3
– – – – –
31 C: 19.5 – – C: 17.2 – C: 63.3 – – – – –64 C: 80.6 – – – – – C: 6.7 – – – –65 C: 45.4 C: 5.0 C: 8.6 – C: 1.9 – – – – – –10 R: 54.1 R: 6.4 R: 19.1 R: 4.4 R: 5.9 – – – – – –12 C: 30.6 – C: 21.2 – – – – – – – –28 R: 39.4 – – – R: 22.5 – – R: 12.5 – – –11 R: 32.3 R: 6.0 R: 7.0 R: 16.7 R: 8.0 – – R: 22.5 – – –26 C: 11.1 – C: 4.7 C: 6.8 – – C: 38.5 – C: 22.6 C: 16.2 –67 C: 19 C: 55 C: 9 C: 3 – – C: 12 – – – –29 C: 15.2 C: 15.7 – – – – C: 10.3 – C: 51.8 – –68 C: 38.4 C: 12.3 – C: 2.3 – – C: 18.8 – C: 5.3 C: 9.5 C: 1.713b C: 10.4 C: 1.9 C: 3.5 – C: 1.9 – – C: 1.3 – – –69 C: 69.4
C: 72.6– – – – – – – – –
25 C: 72.2 – – – – – – C: 17.8 – – –70 C: 47.4 C: 21.0 – – – – – C: 21.0 C: 5.3 – –71 C: 36.8 C: 5.3 – – – – – – – – –72 C: 20.0 C: 25.7 – – C: 17.6 – – – C: 22.9 – –14 C: 20.2 C: 14.6 – – C: 3.5 C: 25.9 – C: 12.6 C: 16.8 – –30 C: 47.5 C: 7.7 – C: 19.0 – – – – – C: 5.0 –27 – C: 46.3 – – – – – C: 49.0 – – –73 C: 58.0 – – – – – – – C: 26 – –24 C: 54.3 C: 42.8 – – – – – C: 2.9 – –74 C: 23.7 – – – – – C: 36.7 – – – –
R: rural; U: urban; C: combined rural and urban.a Dash indicates factor was not mentioned in survey.b Reasons identified for systemic non-compliance in two consecutive MDAs.Values are percentages.
B.V.Babuan
dG
.R.Babu
8of
12
by guest on April 20, 2014 http://trstmh.oxfordjournals.org/ Downloaded from
households to be visited, and prefer to cover as many householdsas possible by just handing over the tablets. This behaviour resultsfrom a lack of sufficient training and orientation for the distribu-tors, and inadequate supervision.9 Krentel et al., in their reviewof global studies on MDA, identified a similar scenario in otherendemic areas and highlighted issues for intervention to improvesuch a situation.39
Another problem, persistent across all endemic areas, is lowMDA compliance in urban areas in comparison with rural areas.This poor uptake has been attributed to population characteris-tics, the lack of a structured public health system and an over:dominance of private health institutions in urban areas.7,40–44 Ofthe population characteristics, a high proportion of mobile/migrant individuals presents a challenge. A mobile/migrant popu-lation is usually at risk of poor access to public health care and hasfewer opportunities to participate in MDA. The implications of amobile/migrant population for the elimination of lymphatic filar-iasis and MDA-related operational issues have recently been iden-tified.45 However, the household-level reasons for low coverageand compliance in urban areas are similar to those in ruralareas. In a recent study from Haiti, it was found that the low com-pliance in urban areas was linked to people’s lack of informationon MDA and concerns about safety or becoming ill.46 Hence, it wassuggested that separate drug delivery strategies are required forurban areas.23,39,47
The predominant reasons for MDA non-coverage identified inour review (failure of distributors to hand over tablets to thoseat risk) were failure by distributors to visit a household and theabsence of people from their house during MDA. Such problemscould be avoided through better supervision and training of distri-butors and the inclusion of ‘mopping-up days’. A lack of aware-ness among the at-risk population of the benefits of the MDAand misconceptions about its risks are also contributing substan-tially to low coverage, although the programme has been runningfor more than a decade. In many endemic communities, theknowledge and perceptions of lymphatic filariasis arepoor.39,48,49 It is important that the proportion of the populationcovered during drug distribution is increased, and existing pro-blems can be addressed through effective health communicationstrategies.
With regard to reasons for non-compliance with delivereddrugs, several studies reported the influence of a fear of adversereactions. Studies from endemic areas in India and elsewherehave reported the occurrence of adverse reactions and their influ-ence on MDA compliance.11,12,39,50–52 There are many endemicareas where the answer to this problem, identified as active sur-veillance for adverse reactions and the education of at-risk indivi-duals during MDA, has not been appropriately implemented.50,52
Communities should be provided with information on possibleadverse reactions and how to manage them. People need tounderstand that the adverse reactions to antifilarial agentsdecrease with each MDA because they are often a result of thebody’s reaction to dying parasites. The report of a study fromOrissa suggests that it may be sufficient to point out that mostadverse reactions are mild and explain how to manage any thatdo occur.10 When communities do not receive adequate accurateinformation about adverse reactions, this lack of knowledge isdetrimental to the success of the MDA.39 In some endemicareas, people’s perception that the occurrence of adverse reactionis an indication of presence of infection may also be used
positively. In Papua New Guinea, adverse reactions were asso-ciated with increased rates of MDA compliance, possibly becausethey were perceived to indicate the efficacy of the treatment.53
The present systematic review highlights the gaps in MDA com-pliance and their determinants across areas of India wherelymphatic filariasis is endemic. The main limitation of this reviewis a degree of heterogeneity among the studies included in termsof the methodology adopted. Sampling strategies, survey meth-ods and outcome definitions varied slightly across the selectedstudies. However, we recalculated the outcome variable tomake these variables comparable and uniform across the studies.We intentionally did not use any strict quality appraisal tools to fil-ter the studies, in order to include studies from as many endemicareas as possible, including those from where there were fewerstudies. Unfortunately studies were not available from allendemic states; hence some major endemic states, such asBihar and Uttar Pradesh are not covered by this review. Weincluded some papers in which the recall period was longerthan a month. Although a longer recall time, in general, is a sourceof bias, it is established that MDA coverage surveys provideaccurate and consistent estimates for up to 1 year followingan MDA.21
GPELF is one of the most rapidly expanding health programmesin the history of public health.54 Many countries are now scalingdown MDA activities and moving towards processes of verificationfor elimination.55 Guidelines and protocols for these activities areavailable to the national programmes.54–56 The GPELF is commit-ted to eliminating lymphatic filariasis by 2020. However, theGovernment of India, in its National Health Policy, committed toeliminate the disease from India by 2015. India’s programmewas initiated in 1997, but interruptions and delays have meantthat MDAs have not occurred every 12 months as they should,4
and the programme is suffering from low compliance. Endgamestrategies need to be laid out carefully to address the challengesfor achieving the national and international goals for diseaseelimination. A recent WHO progress report for India stated that457 million people were covered by MDA, which represents a75% coverage of the population at risk.1 However, the numberquoted in the report is based on reported MDA coverage and ourreview, summarising 32 studies that examined the differencebetween MDA coverage and compliance, demonstrates that useof this is misleading. On average, MDA compliance is 22% lowerthan that reported, which would suggest that actual compliancein this case is close to 53%. This is lower than the 65% thresholdneeded to eliminate lymphatic filariasis. The WHO also acknowl-edges the existence of large differences between reported MDAcoverage and the results of surveys to assess coverage.57
The Indian programme has to progress from rounds of MDA toTAS if it is to achieve the goals set. In the regional strategic plan forlymphatic filariasis elimination for 2010–2015, it is stated that atleast half of the implementation units in India will be completingfive or more rounds of MDA and will initiate measures to stop MDAin these units by 2013; by the end of 2015, all units will completefive or more rounds of MDA and will initiate action to stop MDA.58
It is expected, based on the coverage assessment of the pro-gramme, that India may stop MDA prematurely. But the presentreview suggests that data on compliance, and not reported cover-age, are the appropriate measure by which to assess the pro-gramme and decide how to proceed. This issue must be dealtwith before India starts performing TAS in districts that have
Transactions of the Royal Society of Tropical Medicine and Hygiene
9 of 12
by guest on April 20, 2014
http://trstmh.oxfordjournals.org/
Dow
nloaded from
achieved reported coverage of .65% (but not necessarily compli-ance), as many of these districts will probably fail the TAS.
There is an urgent need to implement educational and otherstrategies to increase compliance with MDA. Healthcare staffand other distributors need to be trained and motivated toreach more people and ensure consumption of the drug, andthe populations at risk need to be educated about the benefitsof MDA and also to understand the possible adverse reactionsand how to manage them. India’s PELF needs a substantialstrengthening of MDA infrastructure, guidelines for which areavailable.56,57,59 This is imperative for the elimination of lymphaticfilariasis to succeed.
Supplementary dataSupplementary data are available at Transactions Online (http://trstmh.oxfordjournals.org/).
Authors’ contributions: BVB conceived the study and designed the studyprotocol; BVB and GRB carried out the search of literature and retrieval offull texts and data. BVB and GRB carried out the analysis and interpretationof the data. BVB and GRB drafted the manuscript and critically revised themanuscript for intellectual content. Both the authors read and approvedthe final manuscript. BVB and GRB are guarantors of the paper.
Funding: None.
Competing interests: None declared.
Ethical approval: Not required.
References1 WHO. Transmission assessment surveys in the Global Programme to
Eliminate Lymphatic Filariasis: WHO position statement. WklyEpidemiol Rec 2012;48:478–82.
2 WHO 50th World Health Assembly. Elimination of lymphatic filariasisas a public health problem. Resolution of the Executive Board of theWHO. WHA50.29. Geneva: WHO; 1997.
3 Government of India. National Health Policy 2002. New Delhi: Ministryof Health and Family Welfare, Government of India; 2002. pp. 1–39.
4 Government of India. Mass Drug Administration, National Vector BorneDiseases Control programme. New Delhi: Government of India; 2013.http://www.nvbdcp.gov.in/MDA.html [accessed 8 September 2013].
5 Ramaiah KD, Das PK, Appavoo NC et al. A programme to eliminatelymphatic filariasis in Tamil Nadu state, India: compliance withannual single-dose DEC mass treatment and some relatedoperational aspects. Trop Med Int Health 2000;5:842–7.
6 Babu BV, Satyanarayana K. Factors responsible for coverage andcompliance in mass drug administration during the programme toeliminate lymphatic filariasis in the East Godavari District, SouthIndia. Trop Doct 2003;33:79–82.
7 Babu BV, Kar SK. Coverage, compliance and some operational issues ofmass drug administration during the programme to eliminatelymphatic filariasis in Orissa, India. Trop Med Int Health 2004;9:702–9.
8 Regu K, Showkath Ali MK et al. Mass drug administration againstlymphatic filariasis: experiences from Kozhikode district of Keralastate. J Commun Dis 2006;38:333–8.
9 Babu BV, Mishra S. Mass drug administration under the programme toeliminate lymphatic filariasis in Orissa, India: a mixed-methods studyto identify factors associated with compliance and non-compliance.Trans R Soc Trop Med Hyg 2008;102:1207–13.
10 Cantey PT, Rout J, Rao G et al. Increasing compliance with mass drugadministration programs for lymphatic filariasis in India througheducation and lymphedema management programs. PLoS Negl TropDis 2010;4:e728.
11 Cantey PT, Rao G, Rout J, Fox LM. Predictors of compliance with a massdrug administration programme for lymphatic filariasis in Orissa State,India 2008. Trop Med Int Health 2010;15:224–31.
12 Nujum ZT. Coverage and compliance to mass drug administration forlymphatic filariasis elimination in a district of Kerala, India. Int Health2011;3:22–6.
13 Nandha B, Krishnamoorthy K, Jambulingam P. Towards elimination oflymphatic filariasis: social mobilization issues and challenges in massdrug administration with anti-filarial drugs in Tamil Nadu, South India.Health Educ Res 2013;28:591–8.
14 Roy RN, Sarkar AP, Misra R et al. Coverage and awareness of andcompliance with mass drug administration for elimination oflymphatic filariasis in Burdwan District, West Bengal, India. J HealthPopul Nutr 2013;31:171–7.
15 Stolk WA, Swaminathan S, van Oortmarssen GJ et al. Prospects forelimination of bancroftian filariasis by mass drug treatment inPondicherry, India: a simulation study. J Inf Dis 2003;188:1371–81.
16 Esterre P, Plichart C, Sechan Y, Nguyen NL. The impact of 34 years ofmassive DEC chemotherapy on Wuchereria bancrofti infection andtransmission: the Maupiti cohort. Trop Med Int Health 2001;6:190–5.
17 Moher D, Liberati A, Tetzlaff J et al. Preferred reporting items forsystematic reviews and meta-analyses: the PRISMA statement. PLoSMed 2009;6:e1000097.
18 Liberati A, Altman DG, Tetzlaff J et al. The PRISMA statement forreporting systematic reviews and meta-analyses of studies thatevaluate health care interventions: explanation and elaboration.PLoS Med 2009;6:e1000100.
19 Centre for Reviews and Dissemination. Systematic Reviews: CRD’sguidance for undertaking reviews in health care. York: CRD, Universityof York; 2009. www.york.ac.uk/inst/crd/pdf/Systematic_Reviews.pdf[accessed 9 September 2013].
20 Kmet LM, Lee RC, Cook LS. Standard Quality Assessment Criteria forEvaluating Primary Research Papers from a Variety of Fields (HTAInitiative 13). Alberta, Canada: Alberta Heritage Foundation forMedical Research; 2004.
21 Budge PJ, Anthony KA, Sognikin E et al. Accuracy of coverage surveyrecall following an integrated MDA for lymphatic filariasis,schistosomiasis and soil-transmitted helminthiasis. 60th AnnualMeeting of the American Society of Tropical Medicine and Hygiene2011. Abstract no. 1574. https://www.astmh.org/AM/Template.cfm?Section=Abstracts_and_Education1&Template=/CM/ContentDisplay.cfm&ContentID=3724 (Accessed 27 February 2014).
22 Ramaiah KD, Vijay Kumar KN, Chandrakala AV et al. Effectiveness ofcommunity and health services-organized drug delivery strategiesfor elimination of lymphatic filariasis in rural areas of Tamil Nadu,India. Trop Med Int Health 2001;6:1062–9.
23 Babu BV, Behera DK, Kerketta AS et al. Use of an inclusive-partnershipstrategy in urban areas of Orissa, India, to increase compliance in amass drug administration for the control of lymphatic filariasis. AnnTrop Med Parasitol 2006;100:621–30.
24 Ghosh S, Samanta A, Kole S. Mass drug administration of lymphaticfilariasis: recent experiences from a district of West Bengal, India.Trop Parasitol 2013;3:67–71.
B. V. Babu and G. R. Babu
10 of 12
by guest on April 20, 2014
http://trstmh.oxfordjournals.org/
Dow
nloaded from
25 Koradhanyamath DM, Kulkarni P, Holla R. Coverage and compliance ofMDA programme for lymphatic filariasis in Bidar district, Karnataka,India. Asian Pacific J Trop Dis 2012;2:290–2.
26 Ranganath BG. Coverage survey for assessing mass drugadministration against lymphatic filariasis in Gulbarga district,Karnataka, India. J Vector Borne Dis 2010;47:61–4.
27 Sunderam S, Haider S, Kashyap V et al. Evaluation of MDA for filariasisin the endemic District of Jharkhand. Indian J Prev Soc Med2011;42:346–9.
28 Aswathy S, Beteena K, Leelamoni K. Mass drug administration againstfilariasis in India: perceptions and practices in a rural community inKerala. Ann Trop Med Parasitol 2009;103:617–24.
29 Ravish KS, Ranganath TS, Riyaz BS. Coverage and compliance of massdrug administration for elimination of lymphatic filariasis in endemicareas of Bijapur district, Karnataka. Int J Basic Med Sci 2011;2:86–9.
30 Nirgude AS, Naik PR, Kondagunta N et al. Evaluation of coverage andcompliance of mass drug administration programme 2011 forelimination of lymphatic filariasis in Nalgonda district of AndhraPradesh, India. Natl J Community Med 2012;3:288–93.
31 Kumar P, Prajapati PB, Saxena D, Kaviswar AB, Kurian G. An evaluationof coverage and compliance of mass drug administration 2006 forelimination of lymphatic filariasis in endemic areas of Gujarat.Indian J Community Med 2008;33:38–42.
32 Remme JHF, Alleyne G, Plaisier AP. Estimation and prediction in tropicaldisease control: the example of onchocerciasis. In: Mollison D, editor.Epidemic Models: their Structure and Relation to Data. Cambridge:Cambridge University Press; 1995, pp. 372–92.
33 Plaisier AP, Stolk WA, Van Ooortmarssen GJ, Habbema JDF.Effectiveness of annual ivermectin treatment for Wuchereriabancrofti infection. Parasitol Today 2000;16:298–302.
34 Michael E, Malecela-Lazaro MN, Simonsen PE et al. Mathematicalmodelling and the control of lymphatic filariasis. Lancet Inf Dis2004;4:223–34.
35 El-Setouhy M, Abd Elaziz KM, Helmy H et al. The effect of complianceon the impact of mass drug administration for elimination oflymphatic filariasis in Egypt. Am J Trop Med Hyg 2007;77:1069–73.
36 Ottesen EA, Duke BO, Karam M, Behbehani K. Strategies and tools forthe control / elimination of lymphatic filariasis. Bull World Health Org1997;75:491–503.
37 Vaishnav KG, Patel IG. Independent assessment of mass drugadministration in filariasis affected Surat city. J Comm Dis2006;38:149–54.
38 Lahariya C, Mishra A. Strengthening of mass drug administrationimplementation is required to eliminate lymphatic filariasis fromIndia: an evaluation study. J Vector Borne Dis 2008;45:313–20.
39 Krentel A, Fischer PU, Weil GJ. A review of factors that influenceindividual compliance with mass drug administration for eliminationof lymphatic filariasis. PLoS Negl Trop Dis 2013;7:e2447.
40 Ramaiah KD, Vijay Kumar KN, Ravi R, Das PK. Situation analysis in alarge urban area of India, prior to launching a programme of massdrug administrations to eliminate lymphatic filariasis. Ann Trop MedParasitol 2005;99:243–52.
41 Gunawardena GS, Ismail MM, Bradley MH, Karunaweera ND. Impact ofthe 2004 mass drug administration for the control of lymphaticfilariasis, in urban and rural areas of the Western province of SriLanka. Ann Trop Med Parasitol 2007;101:335–41.
42 Nandha B, Sadanandane C, Jambulingam P, Das P. Delivery strategy ofmass annual single dose DEC administration to eliminate lymphaticfilariasis in the urban areas of Pondicherry, South India: 5 years ofexperience. Filaria J 2007;6:7.
43 Addiss D. The global alliance to eliminate lymphatic filariasis. The 6thmeeting of the global alliance to eliminate lymphatic filariasis: ahalf-time review of lymphatic filariasis elimination and itsintegration with the control of other neglected tropical diseases.Parasit Vectors 2010;3:100.
44 Simonsen PE, Mwakitalu ME. Urban lymphatic filariasis. Parasitol Res2013;112:35–44.
45 Ramaiah KD. Population migration: implications for lymphatic filariasiselimination programmes. PLoS Negl Trop Dis 2013;7:e2079.
46 Centers for Disease Control and Prevention. Mass drug administrationfor the elimination of lymphatic filariasis – Port-aU: Prince, Haiti, 2011–2012. Morb Mortal Wkly Rep 2013;62:466–8.
47 Njomo DW, Mukko DA, Nyamongo NK, Karanja J. Increasing coverage inmass drug administration for lymphatic filariasis elimination in an urbansetting: a study of Malindi town, Kenya. PLoS One 2014;9:e83413.
48 Babu BV. Social and behavioural issues of mass drug administrationand morbidity management in the programme to eliminatelymphatic filariasis. In: Report of Scientific Working Group Meetingon Lymphatic Filariasis. UNDP/World Bank/WHO Special Programmefor Research and Training in Tropical Diseases (TDR). Geneva: WHO;2005. pp. 123–31. http://www.who.int/tdr/publications/tdR:research-publications/swg-lymphatiC:filariasis/en/index.html. [accessed 26September 2013].
49 Wynd S, Melrose WD, Durrheim DN et al. Understanding thecommunity impact of lymphatic filariasis: a review of thesociocultural literature. Bull World Health Org 2007;85:493–8.
50 Babu BV, Rath K, Kerketta AS et al. Adverse reactions following massdrug administration during the programme to eliminate lymphaticfilariasis in Orissa State, India. Trans R Soc Trop Med Hyg2006;100:464–9.
51 McLaughlin SI, Radday J, Michel MC et al. Frequency, severity, and costsof adverse reactions following mass treatment for lymphatic filariasisusing diethylcarbamazine and albendazole in Leogane, Haiti, 2000.Am J Trop Med Hyg 2003;68:568–73.
52 Lima AW, Medeiros Z, Santos ZC et al. Adverse reactions followingmass drug administration with diethylcarbamazine in lymphaticfilariasis endemic areas in the Northeast of Brazil. Rev Soc Bras MedTrop 2012;45:745–50.
53 Bockarie MJ, Tisch DJ, Kastens W et al. Mass treatment to eliminatefilariasis in Papua New Guinea. N Engl J Med 2002;347:1841–8.
54 WHO. Global Programme to Eliminate Lymphatic Filariasis: Report ofan Informal Meeting on Transmission Assessment Survey for Reviewof the Training Modules and Coordination for Country Support. WHOHeadquarters, Geneva, 12–13 September 2012. Geneva: WHO; 2013.http://apps.who.int/iris/bitstream/10665/78614/1/WHO_HTM_NTD_PCT_2013.6_eng.pdf [accessed 9 September 2013].
55 WHO. Monitoring and Epidemiological Assessment of Mass DrugAdministration: a Manual for National Elimination Programme.WHO/HTM/NTD/PCT/2011.4. Geneva: WHO; 2011. http://whqlibdoc.who.int/publications/2011/9789241501484_eng.pdf [accessed 9September 2013].
56 Rebollo MP, Bockarie MJ. Toward the elimination of lymphatic filariasisby 2020: treatment update and impact assessment for the endgame.Expert Rev Anti Inf Ther 2013;11:723–31.
57 WHO. Global Programme to Eliminate Lymphatic Filariasis: ProgressReport 2000–2009 and Strategic Plan 2010–2020. Geneva: WHO;2010. http://whqlibdoc.who.int/publications/2010/9789241500722_eng.pdf [accessed 9 September 2013].
58 WHO South East Asian Regional Office. Elimination of LymphaticFilariasis in the South-East Asia Region. Report of the 8th Meeting ofthe Regional Programme Review Group (RPRG), Colombo, Sri Lanka,
Transactions of the Royal Society of Tropical Medicine and Hygiene
11 of 12
by guest on April 20, 2014
http://trstmh.oxfordjournals.org/
Dow
nloaded from
28–29 April 2011. New Delhi: WHO Regional Office for South-East Asia;2010. http://apps.searo.who.int/pds_docs/B4804.pdf [accessed 9September 2013].
59 WHO South East Asian Regional Office. The Regional Strategic Plan forElimination of Lymphatic Filariasis 2010–2015. New Delhi: WHORegional Office for South-East Asia; 2010. http://www.searo.who.int/about/administration_structure/cds/Lymphatic_Filariasis_SEA-CD-203.pdf (accessed 9 September 2013).
60 Haldar A, Mundle M, Harldar S et al. Mass DEC campaign for filariasisin a hyper endemic district of West Bengal. J Commun Dis2001;33:192–7.
61 Mehta S, Shah V, Verma A et al. Comparison of coverage andcompliance of mass drug administration 2012 in Surat, India. Natl JCommunity Med 2012;3:468–72.
62 Pattanshetty S, Kumar A, Kumar R et al. Mass drug administration toeliminate lymphatic filariasis in Southern India. Australasian Med J2010;3:847–50.
63 Mukhopadhyay AK, Patnaik SK, Babu PS, Rao KNMB. Knowledge onlymphatic filariasis and mass drug administration (MDA) programmein filaria endemic districts of Andhra Pradesh, India. J Vector Borne Dis2008;45:73–5.
64 Kumar A, Kumar P, Nagaraj K et al. A study on coverage andcompliance of mass drug administration programme for eliminationof filariasis in Udupi district, Karnataka, India. J Vector Borne Dis2009;46:237–40.
65 Godale LB, Balaji UV. A Study on coverage evaluation, compliance andawareness of mass drug administration for elimination of lymphaticfilariasis in Osmanabad district. Natl J Community Med 2012;3:391–4.
66 Mahalakshmy T, Kalaiselvan G, Parmar J, Dongre A. Coverage andcompliance to diethylcarbamazine in relation to filaria prevention
assistants in rural Puducherry, India. J Vector Borne Dis2010;47:113–5.
67 Ranganath TS, Reddy NR. Elimination of lymphatic filariasis: mass drugadministration in endemic areas of (Bidar district) Karnataka – 2008.Indian J Community Med 2012;37:219–22.
68 Patel PK. Mass drug administration coverage evaluation survey forlymphatic filariasis in Bagalkot and Gulbarga districts. Indian JCommunity Med 2012;37:101–6.
69 Sinha N, Mallik S, Panja TK, Haldar A. Coverage and compliance of massdrug administration in lymphatic filariasis: a comparative analysis in adistrict of West Bengal, India. Global J Med Public Health 2012;1:3–10.
70 Jha SN, Mukherjee S, Goswami DN et al. Critical appraisal of mass drugadministration (MDA) for lymphatic filariasis in a district of WestBengal. Indian J Prev Soc Med 2012;43:103–6.
71 Karmakar PR, Mitra K, Chatterjee A et al. A study on coverage,compliance and awareness about mass drug administration forelimination of lymphatic filariasis in a district of West Bengal, India.J Vector Borne Dis 2011;47:61–4.
72 Hussain M, Kumar DS, Nigudgi SR, Reddy S. Evaluation of mass drugadministration campaign against lymphatic filariasis at Bidar district.J Evolution Med Dent Sci 2013;2:3561–7.
73 Shetty A, Santhuram AN, Nareshkumar SJ. Assessing coverage andcompliance of mass drug administration under elimination oflymphatic filariasis program in Yadgir District, Karnataka. Intl J MedSci Public Health 2012;1:71–4.
74 Sunish IP, Shriram AN, Sivan A et al. Lymphatic filariasiselimination programme in Andaman and Nicobar Islands, India:drug coverage and compliance post eight rounds of MDA. TropDoct 2013;43:30–2.
B. V. Babu and G. R. Babu
12 of 12
by guest on April 20, 2014
http://trstmh.oxfordjournals.org/
Dow
nloaded from