low vision affects the reading process quantitatively but not qualitatively
TRANSCRIPT

208 THE JOURNAL OF SPECIAL EDUCATION VOL. 39/NO. 4/2006/PP. 208–219
In The Netherlands, children are considered visually impaired,and therefore eligible for institutional support, if their func-tional vision is less than 3/10 and/or their visual field is lessthan 30 degrees. If the visual impairment is such that the childis unable to read print and must resort to Braille, he or she isconsidered to be blind. If, despite a reduced acuity or limitedvisual field, the visual impairment is such that the child is stillable to read print, he or she is considered to have low vision.Children who have low vision but sufficient residual vision toread print are the focus of this study.
A substantial amount of research has indicated that thereading development of children with low vision lags behindthat of children with normal vision (e.g., Daugherty, 1977;Fellenius, 1999; Gompel, van Bon, Schreuder, & Adriaansen,2002). Despite a similar level of intelligence and equal educa-tion, children with low vision generally do not succeed in at-taining the same reading speed as their peers with normal vision(but see Fridal, Jansen, & Klindt, 1981). Several explanationshave been put forward for the relatively slow reading speed ofchildren with low vision. Generally, these explanations per-tain to the potential problems that readers with low vision en-counter when extracting visual information from a page or acomputer screen.
One important explanation for the slow reading speedof children with low vision concerns the ease with which textcan be fixated. During reading, the eyes do not slide evenly overthe paper, but longer breaks (fixations, varying from 200–250 ms) are alternated with relatively short eye movements(saccades, varying from 20–35 ms). The main function of a
Low Vision Affects the Reading Process Quantitatively But Not Qualitatively
Anna M. T. Bosman, Marjolein Gompel, Mathijs P. J. Vervloed, and Wim H. J. van BonRadboud University Nijmegen, The Netherlands
In this article, the authors compare the reading behavior of students with low vision to that of twogroups of students with normal vision (reading-match and age-match students). In Experiment 1, stu-dents identified the first letter in words and nonwords and the researchers measured latency and ac-curacy. No group differences were found for latency, but the reading-match group differed from theother two groups on accuracy. All three groups identified the first letter of words faster than they didfor nonwords. In Experiment 2, students named words with typical and atypical letter–sound rela-tionships; the researchers measure latency and accuracy. Both the low-vision and the reading-matchgroups were slower than the age-match group; only the reading-match group made more errors ontypical stimuli than on atypical stimuli. The absence of significant interactions between group andany experimental-word variable justified the conclusion that low vision affects the reading processquantitatively but not qualitatively.
saccade is to bring a new piece of text into the central visualfield. Information from the text can only be extracted duringa fixation (Rayner & Pollatsek, 1989). For example, centralvisual-field loss due to macular degeneration (damage to asmall area near the center of the retina) or central scotomas(regions on the retina that have no or reduced acuity as a re-sult of damage; the retinal field is nonfunctional) will hinderfixation of texts. Individuals with damage to the fovea (the re-gion on the retina with maximal visual acuity) tend to developeccentric viewing behavior; that is, an eccentric part of theretina, rather than the fovea, is used for fixation. This is calledthe preferred retinal locus (see Raasch & Rubin, 1993; Wat-son, 2000). In people with normal vision, text presented to aneccentric part of the retina is read more slowly than text pre-sented to the fovea, even when the letter size is magnified tocompensate for reduced resolution at the eccentric location.According to Raasch and Rubin (1993), this finding suggeststhat eccentric locations are simply not as fast as the fovea isin recognizing words. At the same time, these authors impliedthat for people with low vision who have central scotomas,reading rates will be depressed simply by virtue of the fact thatthey need to read with an eccentric location. In sighted peo-ple with artificially created scotomas, the reading rates werereduced when the scotoma was displaced to either the left orthe right of the fovea but not when above or below it (Cummins& Rubin, 1991). Reading rates were most depressed when thescotoma was to the right of the fixation. In this condition, itseems that the scotoma leads the eye movements and obscuresthe word upon which the eye is about to be fixated. There is
Address: Anna M. T. Bosman, PhD, Radboud University Nijmegen, Department of Special Education, PO Box 9104, 6500 HE Nijmegen, The Netherlands; e-mail: [email protected]

no reason to assume that true scotomas in people with low vi-sion would have a different effect. However, because centralvisual-field deficits are rare in children, these deficits alonecannot explain slow reading in children with low vision.
A second reason why readers with low vision might readmore slowly is related to the process of extracting informa-tion from the peripheral visual field. Although exact identifi-cation of letters in the peripheral area is not possible forreaders with normal vision, information retrieved from theperipheral visual field can guide the reading process. For in-stance, short words on the right side of the fixated word cansometimes be identified, which in some cases makes fixationon that word unnecessary. The size of the peripheral visualfield is restricted when readers suffer from, for example, tunnelvision (peripheral vision limited to 10 degrees), which forcesthe reader to make more fixations. In the case of a short distancebetween the eyes and the paper—for instance, as a result of textenlargement or the use of a reading aid—the reader is alsoforced to make more fixations because fewer letters or wordscan be seen at close distance than at a farther distance, givena fixed size of the visual field. Thus, a short-reading distancemight cause lower reading speed as well (Watson, 2000).
Results obtained with the RSVP technique (rapid serialvisual presentation) shed some light on the role of saccadiceye movements in people with low vision. With the RSVPtechnique, in which words are presented sequentially, one atthe time, at a uniform rate, and in the same location on a mon-itor, saccadic eye movements become unnecessary. Accord-ing to Arditi (1999), people with normal vision appeared tobenefit substantially from RSVP, as demonstrated by three tofour times faster reading rates, but people with low vision didnot. People with central visual-field loss read only 1.5 timesfaster with RSVP than with conventionally presented text(Rubin & Turano, 1994). This suggests that people with lowvision have difficulty with saccadic eye movements. The pre-ceding explanations, except for eccentric fixating, are mainlyconcerned with the reading of sentences and text and are lessapplicable to the reading of single words.
A third explanation for the slower reading of readerswith low vision is related to text and word reading. It concernsthe fact that a restricted visual acuity hampers the identifica-tion of letters and thus the reading rate. For instance, West etal. (2002) noted reading disabilities (i.e., reading fewer than90 words per min) in 50% of their study population with vi-sual acuity worse than 20/30 and in 90% of individuals withacuity worse than 20/40. Note, however, that a restricted vi-sual acuity also negatively affects naming latencies in non-reading tasks, such as naming objects (Gompel, Janssen, vanBon, & Schreuder, 2003; Wurm, Legge, Isenberg, & Luebker,1993). Although suitably magnified print should solve prob-lems with seeing fine details, it also leads to fewer letters orwords that can be fixated in one glance. As a result, more headand eye movements are necessary to read a sentence, whichtakes time, as does the handling of required optical aids.
As a result of their visual limitations, children with lowvision generally read more slowly than children with normalvision, and it is therefore tempting to close the search for ex-planations of reduced reading levels in children with low vi-sion. However, the question as to whether visual limitationsaffect cognitive processes in the reading of children with lowvision has not yet been adequately answered. Does a visualimpairment cause the reader to adjust reading processes qual-itatively, or are visual limitations merely affecting the readingprocess quantitatively? Putting it another way: Does visualimpairment cause a different developmental path with respectto reading in children with low vision?
To our knowledge, the first to answer this question ex-perimentally were Corley and Pring (1993a, 1993b). Theircomparative study (1993a) on oral-reading errors of studentswith low vision and students with normal vision showed thatreading errors for students with low vision are rather similarto those of younger students with normal vision who had lessreading experience. In another study (1993b), in which theyused a lexical-decision task, comparable results were obtainedin three different experiments. In lexical-decision tasks, stu-dents are presented with letter strings and asked to indicatewhether the stimulus is a word (e.g., eye) or a nonword (e.g.,eke). In the first experiment, Corley and Pring gave studentswith low vision and students with normal vision regularlyspelled words (words spelled according to standard grapheme–phoneme rules, e.g., cave), irregular words (words that are notspelled according to standard grapheme–phoneme rules, e.g.,have), and nonwords (e.g., borl, birl). Although the studentswith low vision were less accurate than the students with nor-mal vision, both groups erroneously classified irregular wordsas nonwords more often than regular words. No significant in-teraction emerged between experimental group and the wordvariable.
In the second experiment, Corley and Pring presentedboth groups with a series of words and nonwords in whicheach word was given twice. In one presentation, the wordswere shown in the normal orientation (i.e., horizontally); inthe other presentation, the words were shown vertically. Stu-dents with low vision performed just as well as students withnormal vision on this task: Both groups had more correct yes-responses on the words and more correct no-responses on thenonwords in the normal orientation than in the vertical orien-tation. Again, no significant interaction was found betweenexperimental group and word variable.
In the third and last experiment, half of the words andhalf of the nonwords were manipulated such that the pho-nemes were accentuated by alternating the case of the lettersanalogous to the phoneme boundaries. For example, the wordchurch has three phonemes, namely, [ch] [ur] [ch], and waspresented as CHurCh. In the other half of the words, there wasno correspondence between case alternation and phonemeboundaries (i.e., CHuRCH). Again, students with low visionperformed just as well as the students with normal vision:
THE JOURNAL OF SPECIAL EDUCATION VOL. 39/NO. 4/2006 209
210 THE JOURNAL OF SPECIAL EDUCATION VOL. 39/NO. 4/2006
Both groups had more correct responses to words with anal-ogous case alternation than to words presented with no anal-ogy between phoneme boundaries and case alternation. As inthe two previous experiments, no interaction was found be-tween experimental group and word variable, indicating onlyquantitative differences.
Recently, Douglas, Grimley, McLinden, and Watson(2004) reported a small, qualitative difference between thereading behavior of children with low vision and that of chil-dren with normal vision. Douglas et al. matched a group ofchildren with low vision with a group of children with normalvision on the Neale Analysis of Reading Ability Test (NARA,a standardized reading test for children ages 6–12 years). Itappeared that children with low vision were more prone tomaking substitution errors rather than mispronunciation errors,whereas children with normal vision displayed the oppositepattern. This result with regard to a qualitative difference be-tween readers with low vision and those with normal visionhints at the possibility of a different developmental path forchildren with low vision. Perhaps these children rely more ona guessing strategy when reading words that are difficult toperceive, and this strategy may involve the use of different read-ing processes.
Although the finding by Douglas et al. (2004) does notcoincide with the work of Corley and Pring (1993a, 1993b),who only found quantitative differences, some caution is inorder, because the dependent variable (i.e., error percentage)in Corley and Pring (1993b) may not have been sufficientlysensitive to discriminate between students with low vision andstudents with normal vision. Reading errors are the outcomeof a process; perhaps it is the process underlying reading thatdistinguishes between readers with low vision and those withnormal vision. In many experimental and psycholinguisticstudies, researchers use a more sensitive measure, namely, re-sponse times. Response latencies based on correct responsesmay provide more detailed information on the cognitive pro-cess under investigation.
Apart from using an additional measure to study read-ing processes in students with low vision, we also took two ad-ditional measures to enhance the possibility of finding distinctqualitative differences between students with low vision andchildren with normal vision. First, we attempted to improvethe power of our experimental manipulations by using a largersample size. Corley and Pring’s (1993a, 1993b) sample sizeswere relatively small, 9 and 10, respectively. In our study, thesample of students with low vision was doubled. Second, an-swering the question as to whether there are qualitative dif-ferences between students with low vision and students withnormal vision requires carefully matched groups. The 10 stu-dents with low vision in Corley and Pring’s (1993b) study hadstatistically similar age and reading levels as the 20 studentswith normal vision. If reading levels of students with low visionare more or less on par with those of students with normal vi-sion, qualitatively more subtle differences might be difficultto obtain. We therefore decided to use an experimental design
common in research on dyslexia, in which the behavior of the(experimental) group that constitutes the focus of the investi-gation (here, the students with low vision) is compared withthat of two control groups (i.e., students with normal vision).In the studies we report on here, we compared the reading be-havior of students with low vision to that of (a) students withnormal vision whose reading level matched that of the stu-dents with low vision but who were significantly younger, and(b) students with normal vision whose age matched that of thestudents with low vision but had a significantly higher read-ing level.
When the reading behavior of students with low visiondeviated from the reading behaviors of both the reading-matchand age-match groups with normal vision, we took it as an in-dication of qualitative differences. When the reading behaviorof students with low vision was similar to that of the reading-match group but different from that of the age-match group,we believe it indicated quantitative differences. To investigatethis issue, we developed two tasks for the present study. InExperiment 1, the emphasis was on the role of phonology inthe reading of single words by students with low vision. InExperiment 2, the main issue was the effect of atypical letter–sound relationships on decoding single words.
STUDY 1
In this experiment, we investigated the role of phonology instudents with low vision. An overwhelming amount of evi-dence for the fundamental role of phonology in reading nowexists (see, e.g., Frost, 1998; Van Orden, Pennington, & Stone,1990). Reading without activating the phonology of the wordappears impossible. An example of a task that provides evi-dence for the role of phonology in reading is first-letter nam-ing. In this task, study participants are presented with a letterstring and asked to name the first letter of that string as quicklyand as accurately as possible. Participants are presented witha set of words (e.g., book) and a set of orthographically ille-gal nonwords (e.g., bkoo). Previous experiments (Bosman &de Groot, 1995) have shown that participants across a range ofreading experience name the first letter of words more quicklythan the first letter of (orthographically illegal) nonwords. Thiseffect has been explained in terms of an inhibition process;that is, being exposed to a letter string involves mandatoryphonological processing of the entire letter string, irrespectiveof the instruction of merely naming its first letter. Phonolog-ical activation of the entire letter string inhibits the first-letternaming process, but this inhibition process is resolved morequickly for a word than for an orthographically illegal non-word. Bosman and colleagues (Bosman & de Groot,1995;Bosman, van Leerdam, & de Gelder, 2000); van Leerdam, 1995)concluded that the individuals in their studies were unable toavoid phonological activation of the entire letter string, whichhindered the task at hand, naming the first letter of the letterstring.
The question here is whether the naming performance ofchildren with low vision is equally affected by the task of first-letter naming as that of children with normal vision. Or, is itpossible that they rely even more on phonology than dosighted peers; that is, is the sound of words more importantin people with low vision than in people with normal vision?People with low vision who are otherwise unaffected may usethe sound of words more explicitly to aid the reading processthan people with normal vision because, more than anyoneelse, they have experienced that auditory information is a bet-ter guide to memory and comprehension than is visual infor-mation. If so, we expected that a larger difference between thenaming latencies of nonwords and words in students with lowvision than in students with normal vision. Similarly, for thenumber of errors, we expected that the difference in errors be-tween nonwords and words would be larger in students withlow vision than in students with normal vision.
Method
Participants
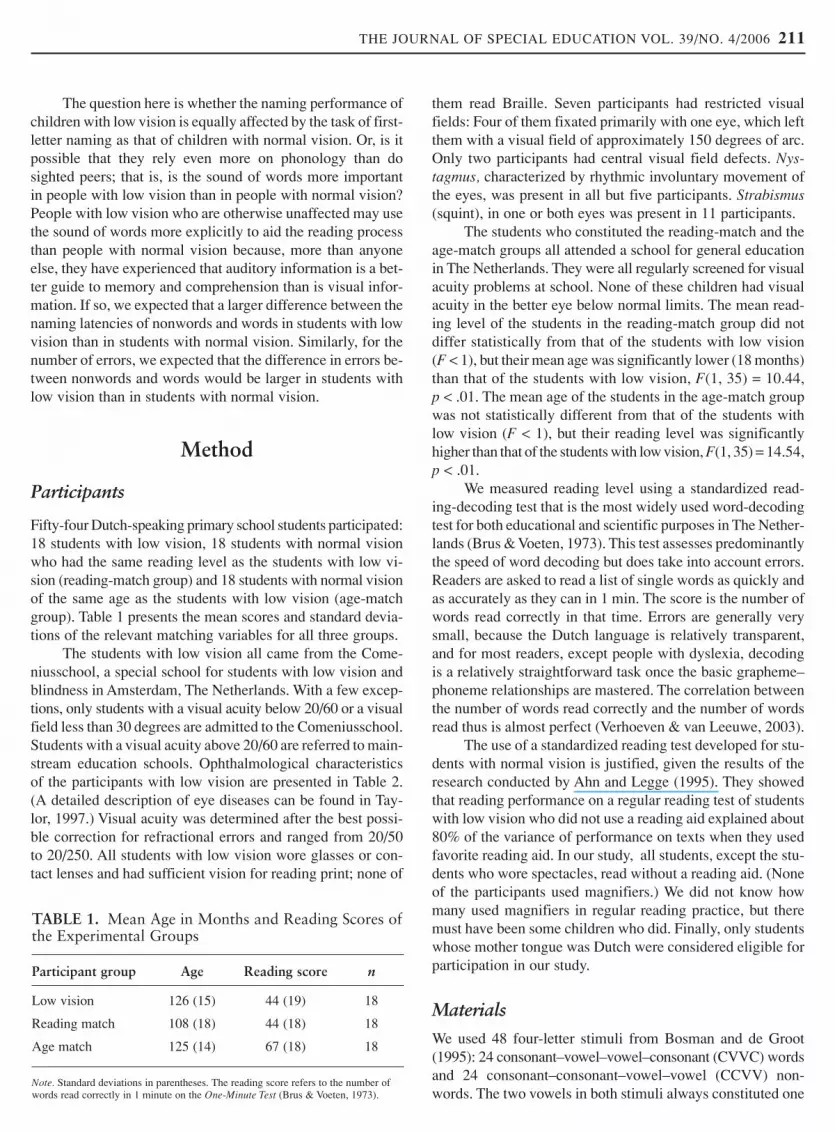
Fifty-four Dutch-speaking primary school students participated:18 students with low vision, 18 students with normal visionwho had the same reading level as the students with low vi-sion (reading-match group) and 18 students with normal visionof the same age as the students with low vision (age-matchgroup). Table 1 presents the mean scores and standard devia-tions of the relevant matching variables for all three groups.
The students with low vision all came from the Come-niusschool, a special school for students with low vision andblindness in Amsterdam, The Netherlands. With a few excep-tions, only students with a visual acuity below 20/60 or a visualfield less than 30 degrees are admitted to the Comeniusschool.Students with a visual acuity above 20/60 are referred to main-stream education schools. Ophthalmological characteristicsof the participants with low vision are presented in Table 2.(A detailed description of eye diseases can be found in Tay-lor, 1997.) Visual acuity was determined after the best possi-ble correction for refractional errors and ranged from 20/50to 20/250. All students with low vision wore glasses or con-tact lenses and had sufficient vision for reading print; none of
them read Braille. Seven participants had restricted visualfields: Four of them fixated primarily with one eye, which leftthem with a visual field of approximately 150 degrees of arc.Only two participants had central visual field defects. Nys-tagmus, characterized by rhythmic involuntary movement ofthe eyes, was present in all but five participants. Strabismus(squint), in one or both eyes was present in 11 participants.
The students who constituted the reading-match and theage-match groups all attended a school for general educationin The Netherlands. They were all regularly screened for visualacuity problems at school. None of these children had visualacuity in the better eye below normal limits. The mean read-ing level of the students in the reading-match group did notdiffer statistically from that of the students with low vision(F < 1), but their mean age was significantly lower (18 months)than that of the students with low vision, F(1, 35) = 10.44,p < .01. The mean age of the students in the age-match groupwas not statistically different from that of the students withlow vision (F < 1), but their reading level was significantlyhigher than that of the students with low vision, F(1, 35) = 14.54,p < .01.
We measured reading level using a standardized read-ing-decoding test that is the most widely used word-decodingtest for both educational and scientific purposes in The Nether-lands (Brus & Voeten, 1973). This test assesses predominantlythe speed of word decoding but does take into account errors.Readers are asked to read a list of single words as quickly andas accurately as they can in 1 min. The score is the number ofwords read correctly in that time. Errors are generally verysmall, because the Dutch language is relatively transparent,and for most readers, except people with dyslexia, decodingis a relatively straightforward task once the basic grapheme–phoneme relationships are mastered. The correlation betweenthe number of words read correctly and the number of wordsread thus is almost perfect (Verhoeven & van Leeuwe, 2003).
The use of a standardized reading test developed for stu-dents with normal vision is justified, given the results of theresearch conducted by Ahn and Legge (1995). They showedthat reading performance on a regular reading test of studentswith low vision who did not use a reading aid explained about80% of the variance of performance on texts when they usedfavorite reading aid. In our study, all students, except the stu-dents who wore spectacles, read without a reading aid. (Noneof the participants used magnifiers.) We did not know howmany used magnifiers in regular reading practice, but theremust have been some children who did. Finally, only studentswhose mother tongue was Dutch were considered eligible forparticipation in our study.
Materials
We used 48 four-letter stimuli from Bosman and de Groot(1995): 24 consonant–vowel–vowel–consonant (CVVC) wordsand 24 consonant–consonant–vowel–vowel (CCVV) non-words. The two vowels in both stimuli always constituted one
THE JOURNAL OF SPECIAL EDUCATION VOL. 39/NO. 4/2006 211
TABLE 1. Mean Age in Months and Reading Scores ofthe Experimental Groups
Participant group Age Reading score n
Low vision 126 (15) 44 (19) 18
Reading match 108 (18) 44 (18) 18
Age match 125 (14) 67 (18) 18
Note. Standard deviations in parentheses. The reading score refers to the number ofwords read correctly in 1 minute on the One-Minute Test (Brus & Voeten, 1973).

212
TA
BL
E 2
.O
phth
alm
olog
ic C
hara
cter
isti
cs o
f th
e Pa
rtic
ipan
ts W
ith
Low
Vis
ion
Cas
eG
ende
rE
tiol
ogy
Vis
ual a
cuit
yV
isua
l fie
ldN
ysta
gmus
Stra
bism
us
1G
irl
Cat
arac
t:ri
ght e
ye m
ore
than
left
eye
20/1
00R
estr
icte
d to
the
righ
t due
to c
atar
act i
n ri
ght e
yeY
esC
onve
rgen
t rig
ht e
ye
2G
irl
Pers
iste
nt p
apill
ary
mem
bran
es20
/80
Res
tric
ted
to th
e ri
ght d
ue to
am
lyop
ia in
rig
ht e
yeY
esD
iver
gent
rig
ht e
ye
3G
irl
Juve
nile
mac
ular
deg
ener
atio
n20
/250
Cen
tral
sco
tom
a,le
ft e
ye—
—
4B
oyM
yopi
a gr
avio
r20
/140
——
—
5G
irl
Vitr
eore
tinal
deg
ener
atio
n w
ith h
igh
myo
pia
20/1
00—
Yes
,lat
ent
Div
erge
nt le
ft e
ye
6G
irl
Ani
ridi
a20
/250
—Y
esD
iver
gent
rig
ht e
ye
7G
irl
Uni
late
ral c
atar
act a
nd m
yopi
a20
/75
Res
tric
ted
to r
ight
due
to c
atar
act i
n ri
ght e
yeY
esC
onve
rgen
t rig
ht e
ye
8B
oyC
orne
a pl
ana
with
hyp
erm
etro
pia
20/1
00—
—
9G
irl
Ops
oclo
nus
20/1
00—
Irre
gula
r,ra
pid
eye
Alte
rnat
ing
dive
rgen
tm
ovem
ents
10G
irl
Ast
rocy
tom
a,th
ird
vent
ricl
e20
/250
Bite
mpo
ral h
emia
nops
iaY
esD
iver
gent
left
eye
11G
irl
Con
geni
tal c
atar
act
20/1
25—
yes
Con
verg
ent l
eft e
ye
12B
oyO
cula
r al
bini
sm20
/140
—ye
s—
13G
irl
Tape
tore
tinal
deg
ener
atio
n20
/80
Smal
l con
cent
ric
rest
rict
ion
——
14B
oyV
itelli
form
mac
ular
deg
ener
atio
n20
/50
Cen
tral
sco
tom
a—
Alte
rnat
ing
conv
erge
nt
15G
irl
Ner
vus
optic
us a
trop
hy20
/140
——
—
16B
oyO
culo
cuta
neou
s al
bini
sm20
/140
—ye
s—
17G
irl
Con
geni
tal c
atar
act
20/1
25—
yes
Con
verg
ent r
ight
eye
18B
oyO
culo
cuta
neou
s al
bini
sm20
/140
—ye
sA
ltern
atin
g di
verg
ent
Not
e.A
niri
dia
is c
onge
nita
l or
trau
mat
ical
ly in
duce
d ab
senc
e or
def
ect o
f th
e ir
is; c
atar
act
is le
ns o
paci
ties;
cor
nea
plan
ais
fla
t cor
nea
and
hype
rmet
ropi
ais
far
sigh
tedn
ess;
juve
nile
mac
ular
deg
ener
atio
nis
deg
ener
atio
n st
artin
gin
chi
ldho
od o
f th
e re
tinal
are
a ly
ing
slig
htly
late
ral t
o th
e ce
nter
of
the
retin
a th
at c
onst
itute
s th
e re
gion
of
max
imum
vis
ual a
cuity
and
is m
ade
up a
lmos
t who
lly o
f re
tinal
con
es; m
yopi
ais
nea
rsig
hted
ness
; ner
vus
opti
cus
atro
phy
is a
trop
hy o
f th
e ne
rve
com
ing
from
the
eye;
ops
oclo
nus
is e
ye m
otili
ty d
isor
ders
in w
hich
irre
gula
r,ra
pid
eye
mov
emen
ts a
re p
rese
nt; p
ersi
sten
t pa
pill
ary
mem
bran
esar
e st
rand
s of
tiss
ue in
the
eye
that
are
rem
nant
s of
blo
od v
es-
sels
that
sup
plie
d nu
trie
nts
to th
e de
velo
ping
lens
of
the
eye
befo
re b
irth
; str
abis
mus
is c
ross
ed e
yes
or s
quin
t,a
visi
on c
ondi
tion
in w
hich
a p
erso
n ca
n no
t alig
n bo
th e
yes
sim
ulta
neou
sly
unde
r no
rmal
con
ditio
ns; v
itre
oret
inal
de-
gene
rati
onis
deg
ener
atio
n of
the
vitr
eous
,inc
ludi
ng th
e pr
esen
ce o
f fi
lam
ents
or
cord
-lik
e st
ruct
ures
or
avas
cula
r ba
nds
and
a co
nden
sati
on o
f th
e pe
riph
eral
vitr
eous
. The
cen
tral
vitr
eous
cav
ity a
ppea
rs e
mpt
y,an
d th
e pe
riph
eral
retin
a m
ay b
e pr
ogre
ssiv
ely
affe
cted
by
pigm
enta
ry c
hang
es a
nd c
hori
oret
inal
deg
ener
atio
n.
phoneme. The words (e.g., boek [book], maan [moon], weeg[weigh]) were drawn from the first three reading-instructionbooks in Veilig Leren Lezen (Learning to Read Safely; Cae-sar, 1979), the most widely used curriculum in The Nether-lands. This curriculum stresses the importance of phonicsinstruction. The nonwords were derived from the words andconstructed such that orthographically illegal nonwordsemerged (e.g., bkoe, mnaa, wgee).
Procedure
The experimenter told the students that words would appearon the screen and they should name the first letter of eachstimulus. All students used letter names to identify the firstletter of each word. The experimenter explained that some ofthe words were not real words but that the students were notto take note of this.
The research was conducted on a Macintosh Classic com-puter. Each stimulus appeared on the same place in the mid-dle of the screen in 14-point Helvetica black letters on a whitebackground. The students with low vision were seated ap-proximately 20 cm from the computer screen, whereas the twogroups of students with normal vision were about 50 cm fromthe screen. The angular size of the letters was 4.3° × 11.3°(height × width) at 20 cm and 1.7° × 4.6° at 50 cm. Angularsize was within the visual fields and above the acuity thresh-old of all the children with low vision. We did not considertesting the children with low vision and those with normal vi-sion at 20 cm so that viewing distance would be identical be-cause we were interested in an ecologically valid situation forall groups, and a viewing distance of 20 cm for children withnormal vision is too short. An Authorware software programcontrolled stimulus presentation, stimulus randomization, andresponse registration.
Each trial started with an auditory warning signal 500 msprior to stimulus presentation. The stimulus remained on thescreen until the student responded. Response latencies wereregistered in ms by a voice key. Response latency was the timebetween presentation of the stimulus and the voice onset (i.e.,the beginning of the pronunciation of the letter). The experi-
menter evaluated each response through pressing the appro-priate key (1 = correct, 3 = incorrect, 2 = invalid response) onthe computer keyboard. Each experimental session was pre-ceded by a set of five practice trials to familiarize the studentwith the task and to ensure the stimuli were easily readablefor the children with low vision.
Results
Although the actual number of participants in the experimentsappears modest, previous experiments with the first-letternaming paradigm have indicated that 20 participants are morethan sufficient to obtain reliable and robust effects (Bosman& de Groot, 1995; Bosman et al., 2000).
Error Analysis
We performed a 3 (group: low vision vs. reading-match vs.age-match) × 2 (stimulus: words vs. nonwords) ANOVA onthe mean number of errors for the participants. We treatedgroup as a between-participants variable and stimulus as awithin-participants variable. The means are presented in Table3. The main effect of group, F(2, 51) = 1.75, p = .18, and themain effect of stimulus, F(1, 51) = 2.30, p = .14, were not sig-nificant, but the interaction effect between group and stimu-lus was, F(2, 51) = 3.40, p < .05.
To further investigate the overall interaction effect, weperformed two separate ANOVAs on the error data. In the an-alysis in which we compared the error scores (on words andnonwords) of the low-vision group with the reading-matchgroup, no significant interaction effect between group andstimulus emerged, F(1, 34) = 2.16, p = .15. Similarly, whencomparing the error scores of the low-vision group with theage-match group, the interaction effect between group andstimulus did not reach a significant level, F(1, 34) = 1.22, p =.28.
The most detailed analysis in which the source of theoverall interaction could be revealed was testing the effect ofstimulus for each group separately. It appeared that the dif-
THE JOURNAL OF SPECIAL EDUCATION VOL. 39/NO. 4/2006 213
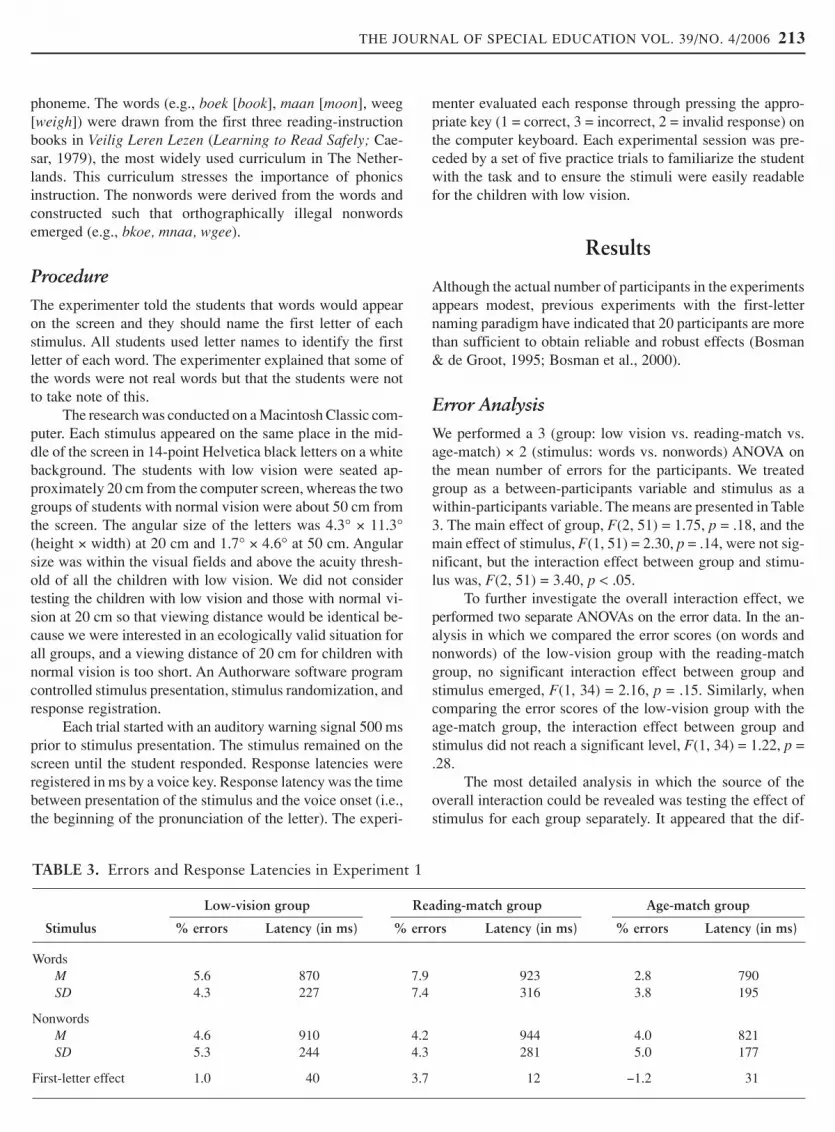
TABLE 3. Errors and Response Latencies in Experiment 1
Low-vision group Reading-match group Age-match group
Stimulus % errors Latency (in ms) % errors Latency (in ms) % errors Latency (in ms)
WordsM 5.6 870 7.9 923 2.8 790SD 4.3 227 7.4 316 3.8 195
NonwordsM 4.6 910 4.2 944 4.0 821SD 5.3 244 4.3 281 5.0 177
First-letter effect 1.0 40 3.7 12 −1.2 31

214 THE JOURNAL OF SPECIAL EDUCATION VOL. 39/NO. 4/2006
ference in error scores was only significant in the reading-match group students, indicating that they made more errorsin first-letter naming on words than on nonwords, F(1, 17) =8.12, p < .01. The F-values for the students with low visionand the age-match group were F(1, 17) = .46, p = .51, andF(1, 17) = .80, p = .38, respectively.
Latency Analysis
We performed a 3 (group: low vision vs. reading-match vs. age-match) × 2 (stimulus: words vs. nonwords) ANOVA on themean correct first-letter-naming latencies of the participants.Group was treated as a between-participants variable and stimu-lus as a within-participants variable. The means are presentedin Table 3.
The interaction effect between group and stimulus (F < 1)and the main effect of group, F(2, 51) = 1.39, p = .26, werenot significant. Thus, overall times for first-letter naming werestatistically the same for all three groups. The main effect ofstimulus, however, was significant, F(1, 51) = 7.57, p < .01.The first letter of words (M = 864, SD = 253) was named fasterthan the first letter of orthographically illegal nonwords (M =892, SD = 238).
Discussion
The error analysis showed that first-letter naming of studentswith low vision was similar to that of the age-match studentsand that first-letter naming for both groups differed from thatof the reading-match group. The reading-match group com-mitted more errors in first-letter naming on words than onnonwords, whereas students in the age-match group and thosein the low-vision group had equal numbers of errors. The la-tency analysis showed that first-letter naming behavior of stu-dents with low vision was similar to that of the age-match andreading-match students. That is, not only did mean namingtimes not differ statistically, all three groups showed the so-called first-letter effect, indicating that the first letters of wordswere named more quickly than the first letters of nonwords.
STUDY 2
Results of ample eye-movement research have shown thatreaders with normal vision fixate one position in a single word(e.g., Rayner & Pollatsek, 1989). Sufficient peripheral visionto the left and to the right of the fixation point enables themto correctly identify the word. This issue has been investigatedin detail by Legge, Mansfield, and Chung (2001), who showedthat a limited visual span in readers with normal vision re-sulted in slower reading in peripheral vision. Readers with nor-mal vision appeared to be able to process letters in a word inparallel. The question is whether people with low vision arealso capable of parallel processing of letters, albeit to a lower
degree. After all, if peripheral vision is limited, it may well bethat readers with low vision are forced to read words letter byletter from left to right.
To address this question, we selected two types of wordstimuli: words that consisted of typical letter–sound relation-ships and words that consisted of atypical letter–sound rela-tionships. Decoding letters in words with typical letter–soundrelationships is almost independent of the word context inwhich the letters are embedded. A Dutch example is minst(fewest) and an English example is tramp. Decoding letters inwords with atypical letter–sound relationships, however, de-pends to a large extent on the word context in which the lettersare embedded. A Dutch example is the word moeite (effort).English examples are choir or through. Words with typicalletter–sound relationships can be read through successive de-coding from left to right, whereas the reading of words withatypical letter–sound relationships is largely determined andoften dramatically changed by preceding and following let-ters. If students with low vision rely more on successive de-coding of letters, we expected that the difference in errors andin latencies between words with atypical and words with typ-ical letter–sound relationships would be larger in studentswith low vision than in students with normal vision.
A second variable of interest we investigated was wordfrequency. Ample evidence in the visual-word perception lit-erature has indicated that words that occur often in writtenlanguage are processed more quickly and more accurately thanwords that only occur sporadically (e.g., Monsell, 1991). Wethus expected that students with low vision as well as studentswith normal vision would display the so-called frequency ef-fect because word frequency affects the reading process earlyin the development of beginning readers (Ducrot, Lété,Sprenger-Charolles, Pynte, & Billard, 2003). All participantsin this study, including the group with low vision, had suffi-cient reading experience to show a frequency effect.
Method
Participants
The students from Experiment 1 also took part in Experi-ment 2.
Materials
We selected a set of 30 words from a word-frequency list fromStaphorsius, Krom, and de Geus (1988), a corpus of 202,526words containing the frequency count of occurrence in youthliterature. From this list, we chose 15 words with atypical letter–sound relationships. Words with typical letter–sound re-lationships predominantly contain letters that are pronouncedaccording to their letter sounds, the so-called prototypicalletter–sound correspondences. Prototypical letter–sound rela-tionships are taught in first grade in The Netherlands. English

examples are used to clarify the issue. In the English wordmat, all three letters are pronounced according to the Englishletter sounds, whereas two of the four letters in the word call(c, a) are not pronounced according to the English lettersounds. In terms of letter–sound typicality, mat would be per-fectly typical, whereas call would be rather atypical, havingtwo letters that do not follow prototypical letter–sound corre-spondences. In this experiment, we quantified letter–soundtypicality for the Dutch stimuli as follows: Words with 0 or 1atypical letter–sound relationships were considered to be typ-ical, whereas words with 2, 3, or 4 atypical letter–sound rela-tionships were considered atypical. The mean number oftypical letters in the set of words designated as typical (M =0.4, SD = .5) deviated significantly from the mean for the setof words designated atypical (M = 2.8, SD = .9), F(1, 28) =75.6, p < .0001.
The second variable of interest was frequency. The setof experimental stimuli contained 14 high-frequency words and16 low-frequency words. High-frequency words were wordsthat occurred more than 17 times but less than 96 in the cor-pus of 202,526 words. Low-frequency words were words thatoccurred less than 14 in the same corpus. The mean numberof typical letters in the high-frequency condition (M = 1.6, SD= 1.4) was almost identical to the mean for the low-frequencycondition (M = 1.6, SD = 1.5), F < 1. The mean length in let-ters was 5.7 (SD = 1.0) and varied between 4 and 7 letters.The mean length of the high-frequency words and of the low-frequency words was statistically equal (F < 1), and the meanlength of words with typical and atypical letter–sound rela-tionships was identical (F = 0).
Procedure
We used the same process in this experiment as in Experi-ment 1. The stimuli were presented on the screen one by one,and the students were asked to read the presented word asquickly and as accurately as possible. Stimulus presentationand response registration was identical to Experiment 1. Priorto the experimental session, each participant was given fivepractice trials.
Results
Previous word-naming experiments with Dutch beginningreaders have shown that 20 participants are more than suffi-cient to reliably distinguish between experimental conditions(e.g., Bosman & de Groot, 1991, 1996).
Error Analysis
We performed a 3 (group: low vision vs. reading-match vs.age-match) × 2 (frequency: high vs. low) × 2 (stimulus: typ-ical vs. atypical) ANOVA on the mean number of errors of theparticipants. Group was treated as a between-participantsvariable and frequency and stimulus as within-participantsvariables. The means are presented in Table 4.
The error analysis yielded significant main effects forgroup, F(2, 51) = 4.23, p < .05; stimulus, F(1, 51) = 4.32, p <.05; and frequency, F(1, 51) = 16.82, p < .0001. All main ef-fects had to be qualified because of significant interactions.
THE JOURNAL OF SPECIAL EDUCATION VOL. 39/NO. 4/2006 215
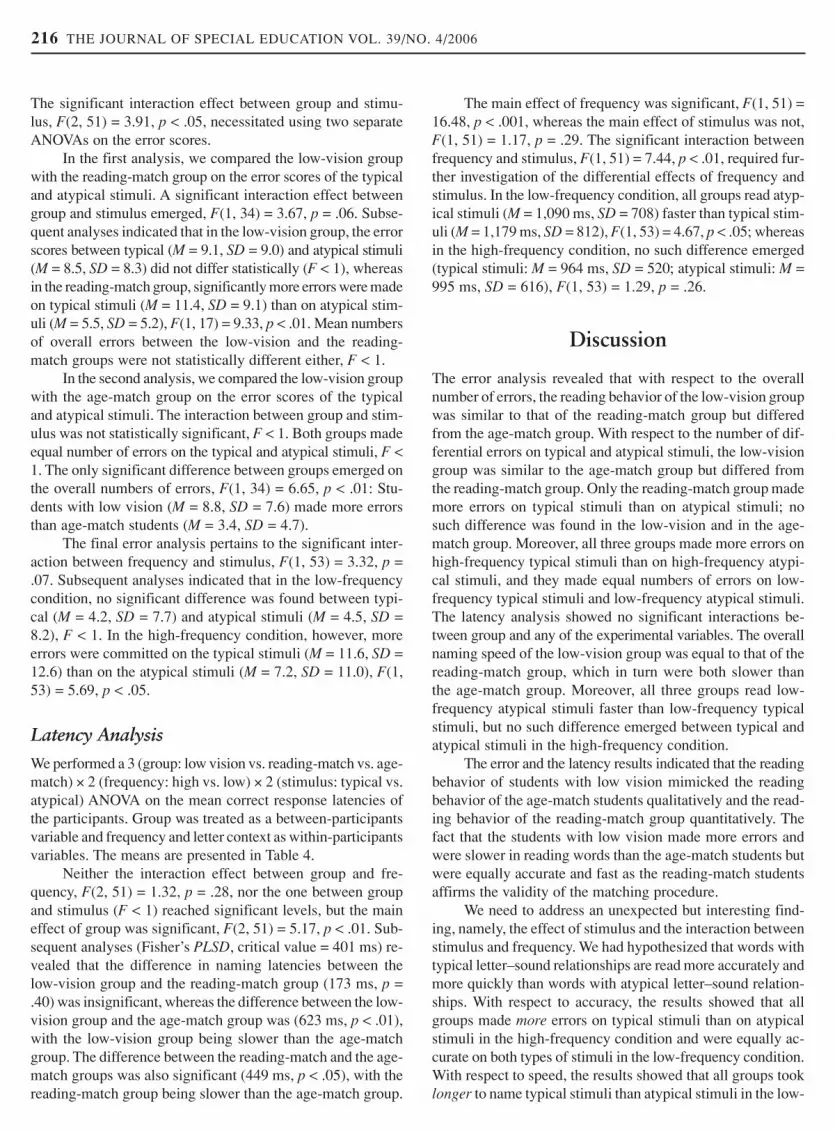
TABLE 4. Errors and Response Latencies in Experiment 2
Low-vision group Reading-match group Age-match group
Stimulus % errors Latency (in ms) % errors Latency (in ms) % errors Latency (in ms)
High-frequency words
TypicalM 7.1 1,217 4.7 1,014 0.8 661SD 8.8 697 8.5 421 3.3 102
AtypicalM 7.9 1,273 4.0 1,054 1.6 659SD 10.1 862 8.2 466 4.6 133
Low-frequency words
TypicalM 11.1 1,449 18.1 1,353 5.6 734SD 12.8 956 13.7 863 7.7 276
AtypicalM 9.0 1,350 6.9 1,174 5.6 744SD 14.1 952 8.8 621 9.8 250
Stimulus effect 0.6 21 5.9 70 −0.4 −4
Frequency effect 2.5 155 8.1 230 4.4 79
216 THE JOURNAL OF SPECIAL EDUCATION VOL. 39/NO. 4/2006
The significant interaction effect between group and stimu-lus, F(2, 51) = 3.91, p < .05, necessitated using two separateANOVAs on the error scores.
In the first analysis, we compared the low-vision groupwith the reading-match group on the error scores of the typicaland atypical stimuli. A significant interaction effect betweengroup and stimulus emerged, F(1, 34) = 3.67, p = .06. Subse-quent analyses indicated that in the low-vision group, the errorscores between typical (M = 9.1, SD = 9.0) and atypical stimuli(M = 8.5, SD = 8.3) did not differ statistically (F < 1), whereasin the reading-match group, significantly more errors were madeon typical stimuli (M = 11.4, SD = 9.1) than on atypical stim-uli (M = 5.5, SD = 5.2), F(1, 17) = 9.33, p < .01. Mean numbersof overall errors between the low-vision and the reading-match groups were not statistically different either, F < 1.
In the second analysis, we compared the low-vision groupwith the age-match group on the error scores of the typicaland atypical stimuli. The interaction between group and stim-ulus was not statistically significant, F < 1. Both groups madeequal number of errors on the typical and atypical stimuli, F <1. The only significant difference between groups emerged onthe overall numbers of errors, F(1, 34) = 6.65, p < .01: Stu-dents with low vision (M = 8.8, SD = 7.6) made more errorsthan age-match students (M = 3.4, SD = 4.7).
The final error analysis pertains to the significant inter-action between frequency and stimulus, F(1, 53) = 3.32, p =.07. Subsequent analyses indicated that in the low-frequencycondition, no significant difference was found between typi-cal (M = 4.2, SD = 7.7) and atypical stimuli (M = 4.5, SD =8.2), F < 1. In the high-frequency condition, however, moreerrors were committed on the typical stimuli (M = 11.6, SD =12.6) than on the atypical stimuli (M = 7.2, SD = 11.0), F(1,53) = 5.69, p < .05.
Latency Analysis
We performed a 3 (group: low vision vs. reading-match vs. age-match) × 2 (frequency: high vs. low) × 2 (stimulus: typical vs.atypical) ANOVA on the mean correct response latencies ofthe participants. Group was treated as a between-participantsvariable and frequency and letter context as within-participantsvariables. The means are presented in Table 4.
Neither the interaction effect between group and fre-quency, F(2, 51) = 1.32, p = .28, nor the one between groupand stimulus (F < 1) reached significant levels, but the maineffect of group was significant, F(2, 51) = 5.17, p < .01. Sub-sequent analyses (Fisher’s PLSD, critical value = 401 ms) re-vealed that the difference in naming latencies between thelow-vision group and the reading-match group (173 ms, p =.40) was insignificant, whereas the difference between the low-vision group and the age-match group was (623 ms, p < .01),with the low-vision group being slower than the age-matchgroup. The difference between the reading-match and the age-match groups was also significant (449 ms, p < .05), with thereading-match group being slower than the age-match group.
The main effect of frequency was significant, F(1, 51) =16.48, p < .001, whereas the main effect of stimulus was not,F(1, 51) = 1.17, p = .29. The significant interaction betweenfrequency and stimulus, F(1, 51) = 7.44, p < .01, required fur-ther investigation of the differential effects of frequency andstimulus. In the low-frequency condition, all groups read atyp-ical stimuli (M = 1,090 ms, SD = 708) faster than typical stim-uli (M = 1,179 ms, SD = 812), F(1, 53) = 4.67, p < .05; whereasin the high-frequency condition, no such difference emerged(typical stimuli: M = 964 ms, SD = 520; atypical stimuli: M =995 ms, SD = 616), F(1, 53) = 1.29, p = .26.
Discussion
The error analysis revealed that with respect to the overallnumber of errors, the reading behavior of the low-vision groupwas similar to that of the reading-match group but differedfrom the age-match group. With respect to the number of dif-ferential errors on typical and atypical stimuli, the low-visiongroup was similar to the age-match group but differed fromthe reading-match group. Only the reading-match group mademore errors on typical stimuli than on atypical stimuli; nosuch difference was found in the low-vision and in the age-match group. Moreover, all three groups made more errors onhigh-frequency typical stimuli than on high-frequency atypi-cal stimuli, and they made equal numbers of errors on low-frequency typical stimuli and low-frequency atypical stimuli.The latency analysis showed no significant interactions be-tween group and any of the experimental variables. The overallnaming speed of the low-vision group was equal to that of thereading-match group, which in turn were both slower thanthe age-match group. Moreover, all three groups read low-frequency atypical stimuli faster than low-frequency typicalstimuli, but no such difference emerged between typical andatypical stimuli in the high-frequency condition.
The error and the latency results indicated that the readingbehavior of students with low vision mimicked the readingbehavior of the age-match students qualitatively and the read-ing behavior of the reading-match group quantitatively. Thefact that the students with low vision made more errors andwere slower in reading words than the age-match students butwere equally accurate and fast as the reading-match studentsaffirms the validity of the matching procedure.
We need to address an unexpected but interesting find-ing, namely, the effect of stimulus and the interaction betweenstimulus and frequency. We had hypothesized that words withtypical letter–sound relationships are read more accurately andmore quickly than words with atypical letter–sound relation-ships. With respect to accuracy, the results showed that allgroups made more errors on typical stimuli than on atypicalstimuli in the high-frequency condition and were equally ac-curate on both types of stimuli in the low-frequency condition.With respect to speed, the results showed that all groups tooklonger to name typical stimuli than atypical stimuli in the low-

frequency condition and were equally fast on both types ofstimuli in the high-frequency condition. Thus, contrary to ourhypothesis, typical stimuli were not processed faster or moreaccurately. If anything, they were processed more slowly andless accurately. A possible explanation is that the reading ofwords with atypical letter–sound relationships is more con-strained than of words with typical letter–sound relationships.This enables the reader to guess the identity of words withatypical letter–sound relationships with a little more confidenceand success, as was the case with words in which the unique-ness point was closer to the beginning of words.
GENERAL DISCUSSION
The central question of this study was whether the reading pro-cess of students with low vision is qualitatively different fromthat of students with normal vision (age-match and reading-match students). We tested this question in two studies. Whenthe reading behavior of students with low vision deviated fromthat of the reading-match and age-match students with nor-mal vision, it was taken to indicate qualitative differences.When the reading behavior of students with low vision wassimilar to that of the reading-match students but differed fromthat of age-match students, it is taken to indicate quantitativedifferences.
In the first study, the error and latency results of the first-letter naming task indicated that the reading behavior of stu-dents with low vision closely mimicked the reading behaviorof the age-match students both quantitatively and qualitatively;that is, the number of first-letter errors and first-letter namingspeed were similar in the two groups. The comparison betweenthe students with low vision and those from the reading-matchgroup indicated superior performance for the students withlow vision with respect to accuracy and equal performance withrespect to speed. The fact that all three groups of studentsnamed the first letter of words more quickly than the first let-ter of illegal nonwords agrees with earlier research by Bosmanet al. (2000), who interpreted this effect in terms of the acti-vation of phonology, a well-established phenomenon in thereading of beginning and highly experienced readers with nor-mal vision. The present findings indicate that the readingprocess of students with low vision is also phonologically me-diated, which agrees with the results of Pick, Thomas, and Pick(1966) and Pring (1982), who found phonological effects inthe reading of blind people who use Braille. The fact that chil-dren with low vision clearly rely on phonology when readingcontributes in an interesting way to the ongoing discussionwith respect to the underlying cause of developmental dys-lexia. Whether a distinct visual factor (a magnocellular defi-cit; e.g., Stein & Talcott, 1999) contributes to the problem ofdyslexia in some people, it is obvious to almost all researchersin this area that phonology is the key problem. Even if thisgroup of readers differs on some visual processing measure,those differences do not necessarily contribute to the reading
problems of students with reading disabilities, which seems toparallel the conclusion that the reading process of studentswith low vision is similar to that of students with normal vi-sion who have the same reading abilities.
In the second study, we presented all three groups of stu-dents with high- and low-frequency typical letter–sound re-lationships and atypical letter–sound relationships. It wasargued that the reading process of students with low visionwas best characterized as a serial, letter-by-letter, left-to-rightprocess; therefore, they should have more trouble readingwords in which the correct reading of letters largely dependson the other letters in the word (i.e., words with atypical let-ter–sound relationships) than words containing letters thatare relatively independent of the other letters in the word (i.e.,words with typical letter–sound relationships). Our resultsprovided no evidence for this hypothesis, because the studentswith low vision read words with atypical letter–sound relation-ships and words with typical letter–sound relationshipsequally fast, exhibiting the same effect as the two groups ofstudents with normal vision. These results therefore did notindicate a qualitatively different reading behavior for the stu-dents with low vision. The finding that all three groups ex-hibited a frequency effect substantiates this conclusion. Therewas, however, a quantitative difference among the groups. Un-like in the first study, the students with low vision did notname the words as fast as their age-matched peers, but theywere equally as fast as the students in the reading-match group.
The picture that emerges suggests that the process of stu-dents with low vision involved in the reading of single wordsonly deviates quantitatively, not qualitatively, from that of stu-dents with normal vision. We are well aware that this generalconclusion is partly based on a series of null effects, but everyeffort has been made to ensure that potential effects couldemerge. Both studies included experimental manipulations(i.e., Study 1: first-letter effect, Study 2: frequency effect) show-ing sufficient sensitivity for revealing immanent effects. Theabsence of qualitative differences is also in accordance withearlier research in which no evidence was obtained for theassumption that children with low vision adopt a different cognitive-reading strategy to compensate for their limitedvision. Based on previous and our present findings, the con-clusion that the reading of single words, provided sufficientpractice, is a relatively modular process in readers with normalvision as well as in those with low vision seems warranted.
Because the physical aspects of print might have affectedreading rate, the mechanisms explaining why the reading-matched children and the children with low vision read moreslowly than the age-matched children is probably different forthe two groups. In theory, the reading rate in children with lowvision may be hampered by physical constraints on the visualinput; in younger sighted children with less reading experi-ence, reading rate may be mostly affected by aspects relatedto the reading process itself, such as automation, semanticknowledge, and phonological awareness. A positive findingwith respect to the reading behavior of students with low vision
THE JOURNAL OF SPECIAL EDUCATION VOL. 39/NO. 4/2006 217

218 THE JOURNAL OF SPECIAL EDUCATION VOL. 39/NO. 4/2006
was presented by Gompel et al. (2002), who showed that read-ing comprehension and spelling ability in a group of childrenwith low vision in The Netherlands did not deviate signifi-cantly from that of their peers with normal vision.
Although physical factors probably contribute to the rel-atively slow reading of readers with low vision, there certainlyare also psychological explanations. First, like all other skills,reading improves through practice, but when perception is dif-ficult, as it is for students with low vision, it may affect thechildren’s motivation to read. Students with little reading mo-tivation are not likely to read often and thus have limitedamounts of practice. The “practice makes perfect” explana-tion is supported by Fellenius (1996), who found that the read-ing achievement of students with low vision was affected bysuch factors as motivation, reading habits, and verbal cogni-tive ability but not by visual acuity. More important, Daugh-erty (1977) and Fridal, Jansen, and Klindt (1981) showed thatthe decoding skills of students with low vision can be im-proved in a fairly short time by means of remedial reading pro-grams. Second, children with normal vision experience ampleopportunity for incidental learning (i.e., learning that happensoutside of the instructional context). Children with normal vi-sion encounter writing on walls, labels on food packages, di-rectional road signs, and so forth. Because these opportunitiesare out of the scope of children with low vision, they neces-sarily have less experience with written materials. After Stan-ovich and West’s (1989) seminal paper on print exposure, weknow that reading performance is largely determined by thedegree of reading experience, which is directly related to theamount of print exposure. These factors suggest that the visualaspect does not necessarily have to be the only factor that couldaccount for the limited reading speed of students with low vi-sion.
With respect to practical and educational implications,our work indicates that teaching children with low vision is notvery different from teaching children with normal vision. Forexample, the suggestion from the Committee on the Preven-tion of Reading Difficulties in Young Children of the U.S. Na-tional Research Council that teaching reading should be basedon phonics rather than on a whole-word approach is as truefor students with low vision as it is for students with normalvision (Snow, Burns, & Griffin, 1998). Moreover, the fact thatreading, like any other skill, improves with practice emphasizesthe importance of practice even more in children with low vi-sion, who experience less incidental reading opportunities thanchildren with normal vision. Finally, teachers have to beknowledgeable about the physical factors that need to be ad-dressed to optimize the visual aspect of the process, but theyshould also be aware of the psychological aspects that mayinterfere with or hamper the development of reading skill inchildren with low vision.
AUTHORS’ NOTES
1. For their participation, we are greatly indebted to the students andthe teachers of the “Comeniusschoo,” the Royal Institute for Ed-
ucation of the Partially Sighted and Blind in Amsterdam, and thestudents and teachers of the Pater van der Geldschool, a regularprimary school in Waalwijk—both in The Netherlands. We muchappreciate the invaluable help of Marit Koenen in running theexperiments and our ophthamologist, Meindert de Vries, for re-trieving the medical information concerning the study participantswith low vision.
2. We would also like to thank two anonymous reviewers and JSEco-editor Charles A. MacArthur for their constructive commentson an earlier version of this article.
REFERENCES
Ahn, S. J., & Legge, G. E. (1995). Psychophysics of reading XIII: Predictorsof magnifier-aided reading speed in low vision. Vision Research, 35,1931–1938.
Arditi, A. (1999). Elicited sequential presentation for low vision reading. Vi-sion Research, 39, 4412–4418.
Bosman, A. M. T., & de Groot, A. M. B. (1995). Evidence for assembledphonology in beginning and fluent readers as assessed with the first-letter-naming task. Journal of Experimental Child Psychology, 59, 234– 259.
Bosman, A. M. T., & de Groot, A. M. B. (1996). Phonologic mediation isfundamental to reading: Evidence from beginning readers. The Quar-terly Journal of Experimental Psychology, 49A, 715–744.
Bosman, A. M. T., van Leerdam, M., & de Gelder, B. (2000). The /O/ inOVER is different from the /O/ in OTTER: Phonological effects in Dutchstudents with and without dyslexia. Developmental Psychology, 36, 817–825.
Brus, B. T., & Voeten, M. J. M. (1973). Een-minuut test [One-minute test].Nijmegen, The Netherlands: Berkhout.
Caesar, F. B. (1979). Veilig leren lezen [Learning to read safely]. Tilburg, TheNetherlands: Zwijsen.
Corley, G., & Pring, L. (1993a). The oral reading errors of partially sightedstudents. The British Journal of Visual Impairment, 11, 24–27.
Corley, G., & Pring, L. (1993b). Reading strategies in partially sighted students.Internationale Zeitschrift fur Rehabilitationsforschung [InternationalJournal of Rehabilitation Research], 16, 209–220.
Cummins, R. W., & Rubin, G. S. (1991). Reading rates with artificial macu-lar scotomas. Optometry and Vision Science, 68, 63–64.
Daugherty, K. M. (1977). Monterey learning systems: Improving academicachievement of visually impaired learners. Journal of Visual Impairmentand Blindness, 71, 298–302.
Douglas, G., Grimley, M., McLinden, M., & Watson, L. (2004). Reading er-rors made by children with low vision. Ophthalmic & Physiological Op-tics, 24, 319–322.
Ducrot, S., Lété, B., Sprenger-Charolles, L., Pynte, J., & Billard, C. (2003).The optimal viewing position effect in beginning and dyslexic readers.Current Psychology Letters, 10. Retrieved February 2, 2005, from http://cpl.revues.org/document99.htm
Fellenius, K. (1996). Reading competence of visually impaired pupils in Swe-den. Journal of Visual Impairment and Blindness, 90, 237–246.
Fellenius, K. (1999). Swedish 9-year-old readers with visual impairments: Aheterogeneous group. Journal of Visual Impairment and Blindness, 93,370–380.
Fridal, G., Jansen, L., & Klindt, M. (1981). Courses in reading developmentfor partially sighted students. Journal of Visual Impairment and Blind-ness, 75, 4–7.
Frost, R. (1998). Toward a strong phonological theory of visual word recog-nition: True issues and false trails. Psychological Bulletin, 123, 71–99.
Gompel, M., Janssen, N. M., van Bon, W. H. J., & Schreuder, R. (2003). Vi-sual input and orthographic knowledge in word reading of children withlow vision. Journal of Visual Impairment and Blindness, 97, 273–284.
Gompel, M., van Bon, W. H. J., Schreuder, R., & Adriaansen, J. J. M. (2002).Reading and spelling competence of Dutch children with low vision.Journal of Visual Impairment and Blindness, 96, 435–447.

Legge, G. E., Mansfield, J. S., & Chung, S. T. L. (2001). Psychophysics ofreading. XX. Linking letter recognition to reading speed in central andperipheral vision. Vision Research, 41, 725–734.
Monsell, S. (1991). The nature and locus of word frequency effects in read-ing. In D. Besner & G.W. Humphreys (Eds.), Basic processes in read-ing: Visual word recognition (pp. 148–197). Hillsdale, NJ: Erlbaum.
Pick, A. D., Thomas, M. L., & Pick, H. L. (1966). The role of grapheme–phoneme correspondence in the perception of Braille. Journal of VerbalLearning and Verbal Behaviour, 5, 298–300.
Pring, L. (1982). Phonological and tactual coding of Braille by blind students.The British Journal of Psychology, 13, 351–359.
Raasch, T. W., & Rubin, G. S. (1993). Reading with low vision. Journal ofthe American Optometric Association, 64, 15–18.
Rayner, K., & Pollatsek, A. (1989). The psychology of reading. EnglewoodCliffs, NJ: Prentice Hall.
Rubin, G. S., & Turano, K. (1994). Low vision reading with sequential wordpresentation. Vision Research, 34, 1723–1733.
Snow, C. E., Burns, M. S., & Griffin, P. (1998). Preventing reading difficul-ties in young children. Washington, DC: National Academy Press.
Stanovich, K. E., & West, R. F. (1989). Exposure to print and orthographicprocessing. Reading Research Quarterly, 24, 402–433.
Staphorsius, G., Krom, P. S. H., & de Geus, K. (1988). Frequenties van wo-ordvormen en letterposities in jeugdliteratuur [Frequencies of word formsand letter positions in youth literature]. Arnhem, The Netherlands: Cito.
Stein, J., & Talcott, J. (1999). Impaired neuronal timing in developmental
dyslexia: The magnocellular hypothesis. Dyslexia (Chichester, England),5, 59–77.
Taylor, D. (1997). Paediatric ophthalmology. Oxford, United Kingdom: Black-well Science.
van Leerdam, M. (1995). Recognition of word-component letters is subjectto whole-stimulus processing: A response-competition account of first-letter naming performance. Unpublished master’s thesis, University ofAmsterdam, The Netherlands.
Van Orden, G. C., Pennington, B. F., & Stone, G. O. (1990). Word identifi-cation in reading and the promise of subsymbolic psycholinguistics. Psy-chological Review, 97, 488–522.
Verhoeven, L., & van Leeuwe, J. (2003). Ontwikkeling van decodeer-vaardigheid in het basisonderwijs [Development of decoding skill in pri-mary education]. Pedagogische Studiën, 80, 257–271.
Watson, G. R. (2000). Functional assessment of low vision for activities ofdaily living. In B. Silverstone, M. A. Lang, B. P. Rosenthal, & E. E. Faye(Eds.), The lighthouse handbook on vision impairment and vision reha-bilitation (pp. 869–884). New York: Oxford University Press.
West, S. K., Rubin, G. S., Broman, A. T., Muñoz, B., Bandeem-Roche, K.,& Turano, K. (2002). How does visual impairment affect performanceon tasks of everyday life? Archives of Ophthalmology, 120, 774–780.
Wurm, L. H., Legge, G. E., Isenberg, L. M., & Luebker, A. (1993). Colorimproves object recognition in normal and low vision. Journal of Ex-perimental Psychology. Human Perception and Performance, 19, 899–911.
THE JOURNAL OF SPECIAL EDUCATION VOL. 39/NO. 4/2006 219