loss of blast heterogeneity in myelodysplastic syndrome and other chronic myeloid neoplasms
TRANSCRIPT
292 Am J Clin Pathol 2014;142:292-298292 DOI: 10.1309/AJCP73QSLLYDEGXK
© American Society for Clinical Pathology
AJCP / Original ArticleCM
E/SA
M
Loss of Blast Heterogeneity in Myelodysplastic Syndrome and Other Chronic Myeloid Neoplasms
Dragan Jevremovic, MD, PhD, Michael M. Timm, Kaaren K. Reichard, MD, William G. Morice, MD, PhD, Curtis A. Hanson, MD, David S. Viswanatha, MD, Matthew T. Howard, MD, and Phuong L. Nguyen, MD
From the Department of Laboratory Medicine and Pathology, Mayo Clinic Rochester, Rochester, MN.
Key Words: Flow cytometry; MDS; Blasts
Am J Clin Pathol September 2014;142:292-298
DOI: 10.1309/AJCP73QSLLYDEGXK
ABSTRACT
Objectives: Flow cytometry immunophenotyping has been suggested as an adjunctive technique in the evaluation of myeloid malignancies, especially in the myelodysplastic syndromes. However, its use has been limited due to complexity and cost restraints. The goal of this study is to attempt a simpler approach to flow cytometry immunophenotyping in myeloid neoplasms.
Methods: We analyzed bone marrow specimens of 45 selected patients and an additional 99 consecutive random patients using a limited antibody panel.
Results: Normal CD34-positive blasts show a characteristic pattern of CD13/HLA-DR expression, with three readily identifiable subpopulations. In contrast, myeloid neoplasms frequently show loss of this heterogeneity.
Conclusions: Analysis of a limited antibody panel with a focus on CD13/HLA-DR expression provides relatively high specificity and sensitivity for the detection of myeloid neoplasms.
Chronic myeloid neoplasms (myelodysplastic syndrome [MDS], myeloproliferative neoplasms [MPNs] and myelodysplastic/myeloproliferative neoplasms [MDSs/MPNs]) are hematopoietic stem cell disorders with variable pathology, clinical presentation, and prognosis. MDS is characterized by maturational abnormalities resulting in blocked differentiation, peripheral blood cytopenias, and an increased risk for developing acute myeloid leukemia (AML). According to the World Health Organization, the diagnosis and classification of MDS are based on a mixed set of parameters, including morphologic features of dysplasia, percentage of blasts, clinical presentation, and cytogenetic findings.1 With the exception of cytogenetic findings, all of the diagnostic parameters show high interobserver variability, therefore underlining a need for additional diagnostic tools.
Dyspoietic cells often show aberrant patterns of antigen expression, compared with their normal counterparts.2 Maturation patterns of bone marrow hematopoietic precursors,
Upon completion of this activity you will be able to:•discusstheroleofflowcytometryimmunophenotypinginthediagnosisofchronicmyeloidneoplasms.
• recognizenormalanddysplasticpatternsofCD13/HLA-DRexpressiononCD34-positiveblasts.
TheASCPisaccreditedbytheAccreditationCouncilforContinuingMedicalEducationtoprovidecontinuingmedicaleducationforphysicians.TheASCPdesignatesthisjournal-basedCMEactivityforamaximumof1 AMA PRA Category 1 Credit ™perarticle.Physiciansshouldclaimonlythecreditcommensuratewiththeextentoftheirparticipationintheactiv-ity.ThisactivityqualifiesasanAmericanBoardofPathologyMaintenanceofCertificationPartIISelf-AssessmentModule.
Theauthorsofthisarticleandtheplanningcommitteemembersandstaffhavenorelevantfinancialrelationshipswithcommercialintereststodisclose.
Questionsappearonp419.Examislocatedatwww.ascp.org/ajcpcme.
by guest on June 18, 2016http://ajcp.oxfordjournals.org/
Dow
nloaded from
Am J Clin Pathol 2014;142:292-298 293293 DOI: 10.1309/AJCP73QSLLYDEGXK 293
© American Society for Clinical Pathology
AJCP / Original Article
analyzed with flow cytometry immunophenotyping (FCIP), have been increasingly used as an adjunctive evaluation tool in distinguishing normal from dysplastic maturation.3-10 However, FCIP for MDS also has many limitations preventing it from routine clinical use: (1) no single antigen expression is diagnostic, (2) different research groups use different sets of markers and/or reagents with poor interlaboratory reproducibility, (3) the clinical usefulness of FCIP is uncertain because most studies examine only specimens with morphologically and/or cytogenetically obvious dysplasia, and (4) analytic approaches vary from looking at differentiated myeloid cells to others that focus on blast populations. Most approaches for distinguishing normal from dyspoietic myeloid maturation use a large number of antibodies, combined with either a point-based system for defining the level of abnormality,3,11 or a specialized analytic software for multidimensional data analysis.12-14
While validating an FCIP approach for MDS in our laboratory, we have observed interesting patterns of expression of CD13 and HLA-DR on CD34-positive blasts. The pattern seen in the normal CD34-positive population is missing from the majority of patients with chronic myeloid disorders. This finding could be particularly useful for laboratories that do not have access to large antibody panels and/or specialized software, as well as for laboratories that do not routinely analyze a sufficient number of abnormal specimens. It may also be a more cost-effective approach in the current era of cost awareness and declining reimbursements.
Materials and Methods
Patient Population and SamplingThe initial set of bone marrow samples included
aspirates from 18 patients with MDS, five patients with MPN, nine patients with MDS/MPN (of whom five had chronic myelomonocytic leukemia, four patients with left-shifted granulocytic hyperplasia due to granulocyte colony-stimulating factor (G-CSF) administration (before autologous peripheral blood stem cell transplantation for malignant lymphoma), and nine normal controls (patients undergoing hip replacement surgery without prior hematologic disease). The validation set included bone marrow aspirates from 99 consecutive patients undergoing bone marrow examination as requested by the Mayo Clinic Rochester (Rochester, MN) clinical hematology services. The samples were collected in ethylenediaminetetraacetic acid anticoagulant and processed within 24 hours of collection. FCIP was not used in determining the final pathologic diagnosis for any of the patients. All procedures were approved by the institutional review board.
FCIP
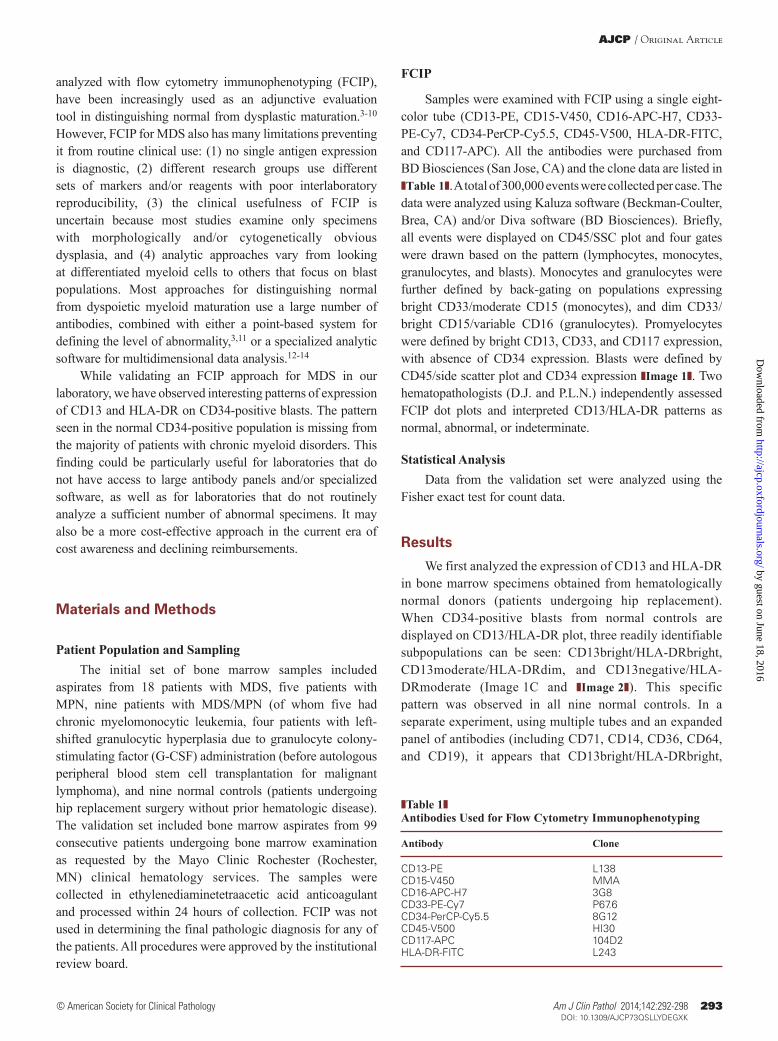
Samples were examined with FCIP using a single eight-color tube (CD13-PE, CD15-V450, CD16-APC-H7, CD33-PE-Cy7, CD34-PerCP-Cy5.5, CD45-V500, HLA-DR-FITC, and CD117-APC). All the antibodies were purchased from BD Biosciences (San Jose, CA) and the clone data are listed in ❚Table 1❚. A total of 300,000 events were collected per case. The data were analyzed using Kaluza software (Beckman-Coulter, Brea, CA) and/or Diva software (BD Biosciences). Briefly, all events were displayed on CD45/SSC plot and four gates were drawn based on the pattern (lymphocytes, monocytes, granulocytes, and blasts). Monocytes and granulocytes were further defined by back-gating on populations expressing bright CD33/moderate CD15 (monocytes), and dim CD33/bright CD15/variable CD16 (granulocytes). Promyelocytes were defined by bright CD13, CD33, and CD117 expression, with absence of CD34 expression. Blasts were defined by CD45/side scatter plot and CD34 expression ❚Image 1❚. Two hematopathologists (D.J. and P.L.N.) independently assessed FCIP dot plots and interpreted CD13/HLA-DR patterns as normal, abnormal, or indeterminate.
Statistical AnalysisData from the validation set were analyzed using the
Fisher exact test for count data.
Results
We first analyzed the expression of CD13 and HLA-DR in bone marrow specimens obtained from hematologically normal donors (patients undergoing hip replacement). When CD34-positive blasts from normal controls are displayed on CD13/HLA-DR plot, three readily identifiable subpopulations can be seen: CD13bright/HLA-DRbright, CD13moderate/HLA-DRdim, and CD13negative/HLA-DRmoderate (Image 1C and ❚Image 2❚). This specific pattern was observed in all nine normal controls. In a separate experiment, using multiple tubes and an expanded panel of antibodies (including CD71, CD14, CD36, CD64, and CD19), it appears that CD13bright/HLA-DRbright,
❚Table 1❚Antibodies Used for Flow Cytometry Immunophenotyping
Antibody Clone
CD13-PE L138CD15-V450 MMACD16-APC-H7 3G8 CD33-PE-Cy7 P67.6CD34-PerCP-Cy5.5 8G12CD45-V500 HI30CD117-APC 104D2HLA-DR-FITC L243
by guest on June 18, 2016http://ajcp.oxfordjournals.org/
Dow
nloaded from
294 Am J Clin Pathol 2014;142:292-298294 DOI: 10.1309/AJCP73QSLLYDEGXK
© American Society for Clinical Pathology
Jevremovic et al / Simplified Flow for Myeloid Neoplasms
❚Image 1❚ Gating strategy on a normal bone marrow specimen. A, CD45/SSC plot of a normal bone marrow with multiple populations gated: lymphocytes (green), monocytes (dark purple), promyelocytes (turquoise), granulocytes (yellow and light purple), eosinophils (dark red), hematogones (light brown), RBCs (light red), and cells in blast gate (orange: CD34+; green: CD34-). B, Cells from the blast gate were displayed on CD34/CD117 plot and CD34+ cells (orange) were designated as blasts. C, Normal CD34+ blasts show distinct pattern on CD13/HLA-DR plot.
100
0
101
102
103
0 101 102 103
100
0
101
102
103
0 101 102 103
100
0
101
102
103
0 101 102 103
Ant
i–H
LA-D
R
CD13
Ant
i–H
LA-D
R
CD13
Ant
i–H
LA-D
R
CD13
100
0
101
102
103
0 101 102 103
100
0
101
102
103
0 101 102 103
100
0
101
102
103
0 101 102 103
Ant
i–H
LA-D
R
CD13
Ant
i–H
LA-D
R
CD13
Ant
i–H
LA-D
R
CD13
100
0
101
102
103
0 101 102 103
100
0
101
102
103
0 101 102 103
100
0
101
102
103
0 101 102 103
Ant
i–H
LA-D
R
CD13
Ant
i–H
LA-D
R
CD13
Ant
i–H
LA-D
R
CD13
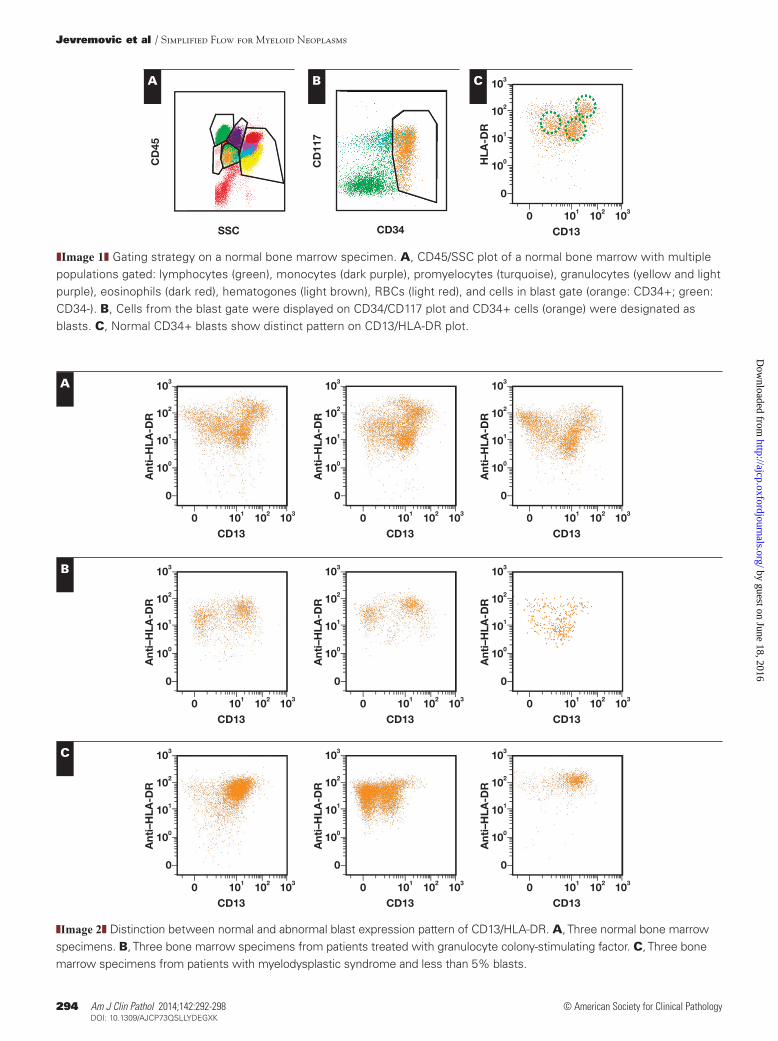
❚Image 2❚ Distinction between normal and abnormal blast expression pattern of CD13/HLA-DR. A, Three normal bone marrow specimens. B, Three bone marrow specimens from patients treated with granulocyte colony-stimulating factor. C, Three bone marrow specimens from patients with myelodysplastic syndrome and less than 5% blasts.
CD
45
SSC
CD
117
CD34
100
0
101
102
103
0 101 102 103
HLA
-DR
CD13
A
A B C
B
C
by guest on June 18, 2016http://ajcp.oxfordjournals.org/
Dow
nloaded from
Am J Clin Pathol 2014;142:292-298 295295 DOI: 10.1309/AJCP73QSLLYDEGXK 295
© American Society for Clinical Pathology
AJCP / Original Article
CD13moderate/HLA-DRdim, and CD13negative/HLA-DRmoderate cells correspond to granulocytic/monocytic precursors, immature nondifferentiated blasts, and lymphoblasts, respectively (data not shown).
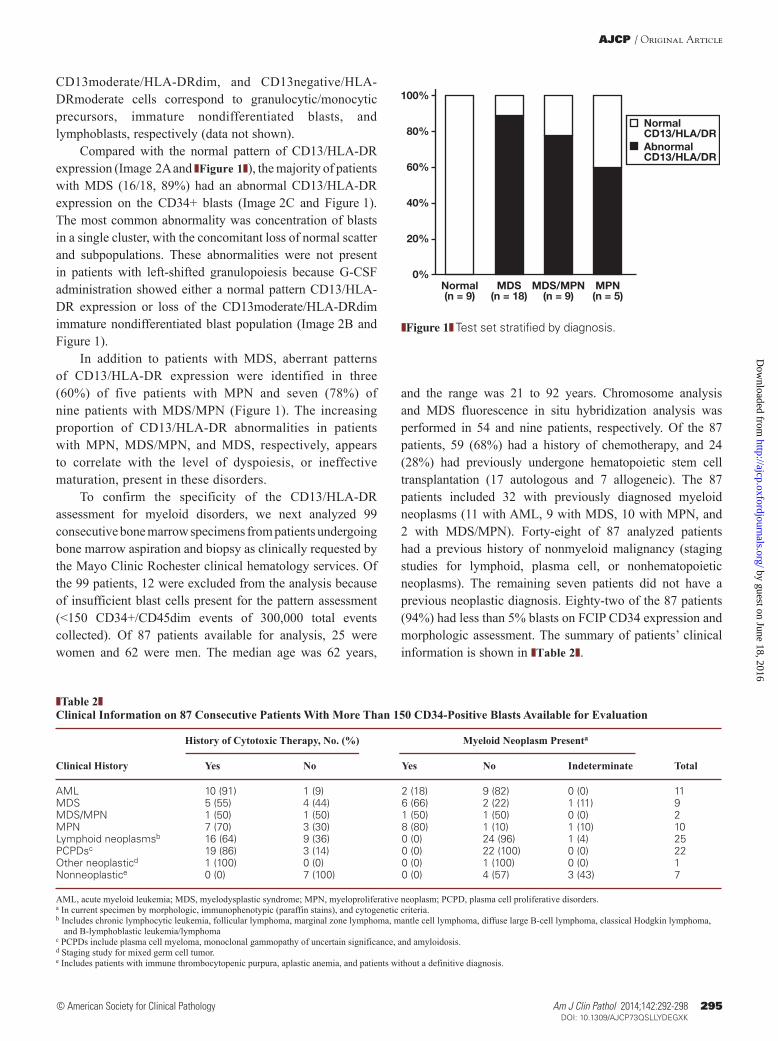
Compared with the normal pattern of CD13/HLA-DR expression (Image 2A and ❚Figure 1❚), the majority of patients with MDS (16/18, 89%) had an abnormal CD13/HLA-DR expression on the CD34+ blasts (Image 2C and Figure 1). The most common abnormality was concentration of blasts in a single cluster, with the concomitant loss of normal scatter and subpopulations. These abnormalities were not present in patients with left-shifted granulopoiesis because G-CSF administration showed either a normal pattern CD13/HLA-DR expression or loss of the CD13moderate/HLA-DRdim immature nondifferentiated blast population (Image 2B and Figure 1).
In addition to patients with MDS, aberrant patterns of CD13/HLA-DR expression were identified in three (60%) of five patients with MPN and seven (78%) of nine patients with MDS/MPN (Figure 1). The increasing proportion of CD13/HLA-DR abnormalities in patients with MPN, MDS/MPN, and MDS, respectively, appears to correlate with the level of dyspoiesis, or ineffective maturation, present in these disorders.
To confirm the specificity of the CD13/HLA-DR assessment for myeloid disorders, we next analyzed 99 consecutive bone marrow specimens from patients undergoing bone marrow aspiration and biopsy as clinically requested by the Mayo Clinic Rochester clinical hematology services. Of the 99 patients, 12 were excluded from the analysis because of insufficient blast cells present for the pattern assessment (<150 CD34+/CD45dim events of 300,000 total events collected). Of 87 patients available for analysis, 25 were women and 62 were men. The median age was 62 years,
and the range was 21 to 92 years. Chromosome analysis and MDS fluorescence in situ hybridization analysis was performed in 54 and nine patients, respectively. Of the 87 patients, 59 (68%) had a history of chemotherapy, and 24 (28%) had previously undergone hematopoietic stem cell transplantation (17 autologous and 7 allogeneic). The 87 patients included 32 with previously diagnosed myeloid neoplasms (11 with AML, 9 with MDS, 10 with MPN, and 2 with MDS/MPN). Forty-eight of 87 analyzed patients had a previous history of nonmyeloid malignancy (staging studies for lymphoid, plasma cell, or nonhematopoietic neoplasms). The remaining seven patients did not have a previous neoplastic diagnosis. Eighty-two of the 87 patients (94%) had less than 5% blasts on FCIP CD34 expression and morphologic assessment. The summary of patients’ clinical information is shown in ❚Table 2❚.
0%
20%
40%
60%
80%NormalCD13/HLA/DRAbnormalCD13/HLA/DR
100%
Normal(n = 9)
MDS(n = 18)
MDS/MPN(n = 9)
MPN(n = 5)
❚Figure 1❚ Test set stratified by diagnosis.
❚Table 2❚Clinical Information on 87 Consecutive Patients With More Than 150 CD34-Positive Blasts Available for Evaluation
History of Cytotoxic Therapy, No. (%) Myeloid Neoplasm Presenta
Clinical History Yes No Yes No Indeterminate Total
AML 10 (91) 1 (9) 2 (18) 9 (82) 0 (0) 11MDS 5 (55) 4 (44) 6 (66) 2 (22) 1 (11) 9MDS/MPN 1 (50) 1 (50) 1 (50) 1 (50) 0 (0) 2MPN 7 (70) 3 (30) 8 (80) 1 (10) 1 (10) 10Lymphoid neoplasmsb 16 (64) 9 (36) 0 (0) 24 (96) 1 (4) 25PCPDsc 19 (86) 3 (14) 0 (0) 22 (100) 0 (0) 22Other neoplasticd 1 (100) 0 (0) 0 (0) 1 (100) 0 (0) 1Nonneoplastice 0 (0) 7 (100) 0 (0) 4 (57) 3 (43) 7
AML, acute myeloid leukemia; MDS, myelodysplastic syndrome; MPN, myeloproliferative neoplasm; PCPD, plasma cell proliferative disorders.a In current specimen by morphologic, immunophenotypic (paraffin stains), and cytogenetic criteria.b Includes chronic lymphocytic leukemia, follicular lymphoma, marginal zone lymphoma, mantle cell lymphoma, diffuse large B-cell lymphoma, classical Hodgkin lymphoma,
and B-lymphoblastic leukemia/lymphomac PCPDs include plasma cell myeloma, monoclonal gammopathy of uncertain significance, and amyloidosis. d Staging study for mixed germ cell tumor. e Includes patients with immune thrombocytopenic purpura, aplastic anemia, and patients without a definitive diagnosis.
by guest on June 18, 2016http://ajcp.oxfordjournals.org/
Dow
nloaded from
296 Am J Clin Pathol 2014;142:292-298296 DOI: 10.1309/AJCP73QSLLYDEGXK
© American Society for Clinical Pathology
Jevremovic et al / Simplified Flow for Myeloid Neoplasms
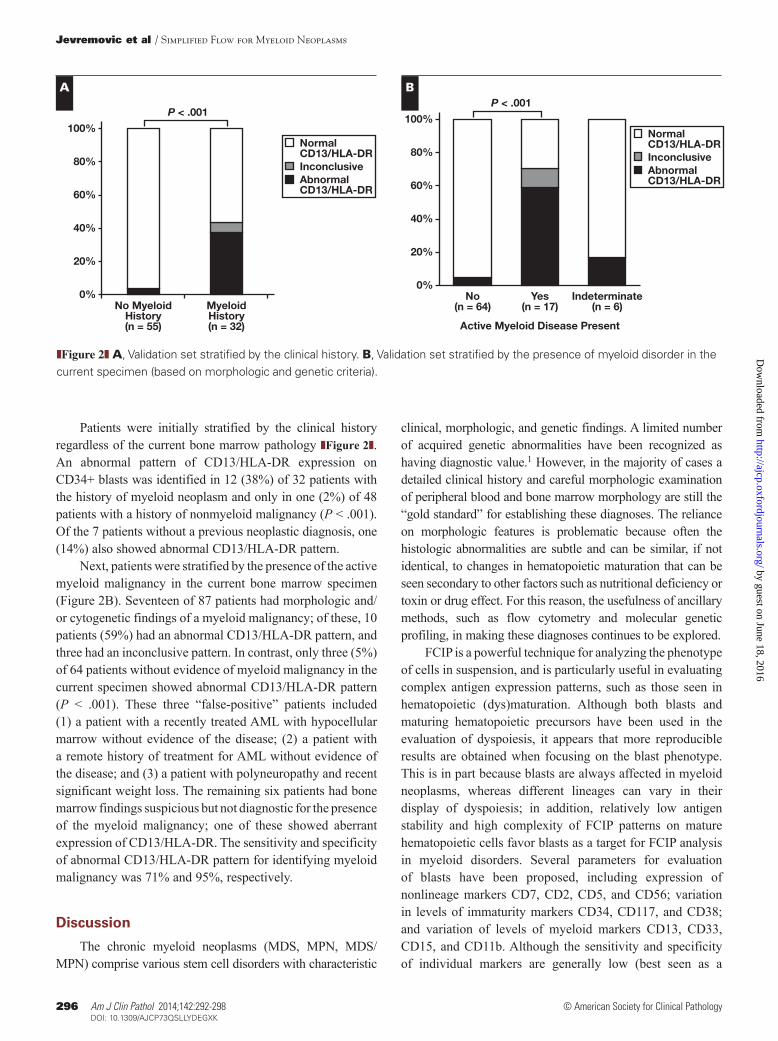
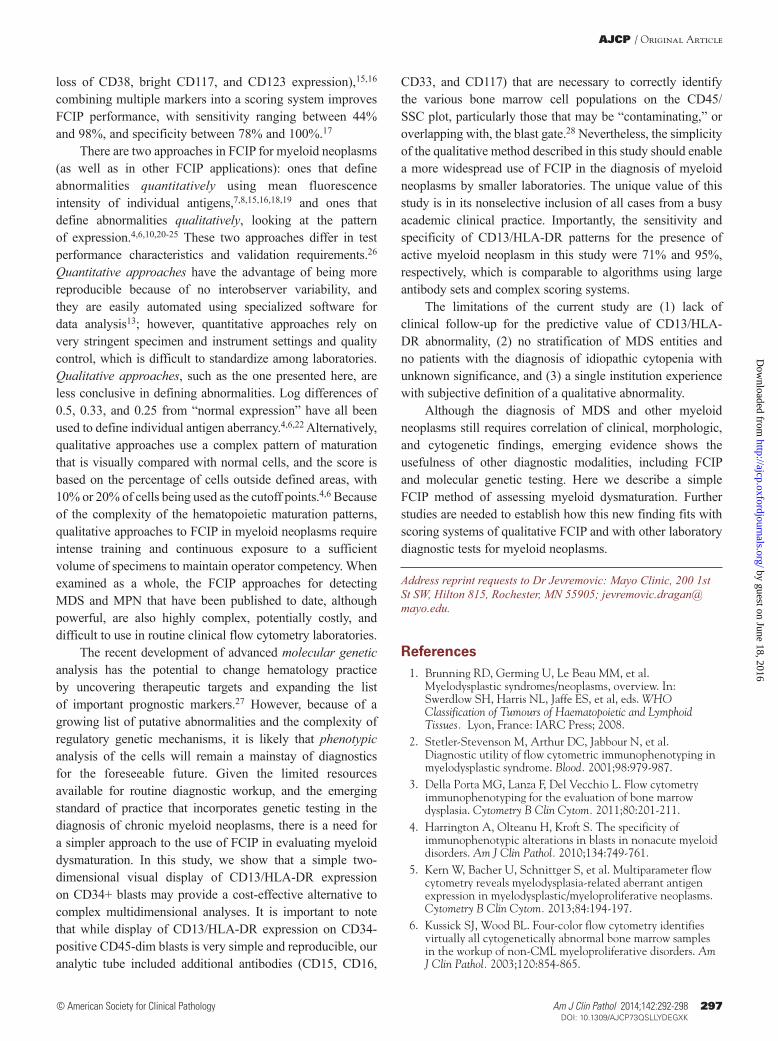
Patients were initially stratified by the clinical history regardless of the current bone marrow pathology ❚Figure 2❚. An abnormal pattern of CD13/HLA-DR expression on CD34+ blasts was identified in 12 (38%) of 32 patients with the history of myeloid neoplasm and only in one (2%) of 48 patients with a history of nonmyeloid malignancy (P < .001). Of the 7 patients without a previous neoplastic diagnosis, one (14%) also showed abnormal CD13/HLA-DR pattern.
Next, patients were stratified by the presence of the active myeloid malignancy in the current bone marrow specimen (Figure 2B). Seventeen of 87 patients had morphologic and/or cytogenetic findings of a myeloid malignancy; of these, 10 patients (59%) had an abnormal CD13/HLA-DR pattern, and three had an inconclusive pattern. In contrast, only three (5%) of 64 patients without evidence of myeloid malignancy in the current specimen showed abnormal CD13/HLA-DR pattern (P < .001). These three “false-positive” patients included (1) a patient with a recently treated AML with hypocellular marrow without evidence of the disease; (2) a patient with a remote history of treatment for AML without evidence of the disease; and (3) a patient with polyneuropathy and recent significant weight loss. The remaining six patients had bone marrow findings suspicious but not diagnostic for the presence of the myeloid malignancy; one of these showed aberrant expression of CD13/HLA-DR. The sensitivity and specificity of abnormal CD13/HLA-DR pattern for identifying myeloid malignancy was 71% and 95%, respectively.
Discussion
The chronic myeloid neoplasms (MDS, MPN, MDS/MPN) comprise various stem cell disorders with characteristic
clinical, morphologic, and genetic findings. A limited number of acquired genetic abnormalities have been recognized as having diagnostic value.1 However, in the majority of cases a detailed clinical history and careful morphologic examination of peripheral blood and bone marrow morphology are still the “gold standard” for establishing these diagnoses. The reliance on morphologic features is problematic because often the histologic abnormalities are subtle and can be similar, if not identical, to changes in hematopoietic maturation that can be seen secondary to other factors such as nutritional deficiency or toxin or drug effect. For this reason, the usefulness of ancillary methods, such as flow cytometry and molecular genetic profiling, in making these diagnoses continues to be explored.
FCIP is a powerful technique for analyzing the phenotype of cells in suspension, and is particularly useful in evaluating complex antigen expression patterns, such as those seen in hematopoietic (dys)maturation. Although both blasts and maturing hematopoietic precursors have been used in the evaluation of dyspoiesis, it appears that more reproducible results are obtained when focusing on the blast phenotype. This is in part because blasts are always affected in myeloid neoplasms, whereas different lineages can vary in their display of dyspoiesis; in addition, relatively low antigen stability and high complexity of FCIP patterns on mature hematopoietic cells favor blasts as a target for FCIP analysis in myeloid disorders. Several parameters for evaluation of blasts have been proposed, including expression of nonlineage markers CD7, CD2, CD5, and CD56; variation in levels of immaturity markers CD34, CD117, and CD38; and variation of levels of myeloid markers CD13, CD33, CD15, and CD11b. Although the sensitivity and specificity of individual markers are generally low (best seen as a
0%
20%
40%
60%
80%
NormalCD13/HLA-DRInconclusiveAbnormalCD13/HLA-DR
100%
P < .001
No MyeloidHistory(n = 55)
MyeloidHistory(n = 32)
0%
20%
40%
60%
80%
NormalCD13/HLA-DRInconclusiveAbnormalCD13/HLA-DR
100%
P < .001
No(n = 64)
Yes(n = 17)
Active Myeloid Disease Present
Indeterminate(n = 6)
❚Figure 2❚ A, Validation set stratified by the clinical history. B, Validation set stratified by the presence of myeloid disorder in the current specimen (based on morphologic and genetic criteria).
A B
by guest on June 18, 2016http://ajcp.oxfordjournals.org/
Dow
nloaded from
Am J Clin Pathol 2014;142:292-298 297297 DOI: 10.1309/AJCP73QSLLYDEGXK 297
© American Society for Clinical Pathology
AJCP / Original Article
loss of CD38, bright CD117, and CD123 expression),15,16 combining multiple markers into a scoring system improves FCIP performance, with sensitivity ranging between 44% and 98%, and specificity between 78% and 100%.17
There are two approaches in FCIP for myeloid neoplasms (as well as in other FCIP applications): ones that define abnormalities quantitatively using mean fluorescence intensity of individual antigens,7,8,15,16,18,19 and ones that define abnormalities qualitatively, looking at the pattern of expression.4,6,10,20-25 These two approaches differ in test performance characteristics and validation requirements.26 Quantitative approaches have the advantage of being more reproducible because of no interobserver variability, and they are easily automated using specialized software for data analysis13; however, quantitative approaches rely on very stringent specimen and instrument settings and quality control, which is difficult to standardize among laboratories. Qualitative approaches, such as the one presented here, are less conclusive in defining abnormalities. Log differences of 0.5, 0.33, and 0.25 from “normal expression” have all been used to define individual antigen aberrancy.4,6,22 Alternatively, qualitative approaches use a complex pattern of maturation that is visually compared with normal cells, and the score is based on the percentage of cells outside defined areas, with 10% or 20% of cells being used as the cutoff points.4,6 Because of the complexity of the hematopoietic maturation patterns, qualitative approaches to FCIP in myeloid neoplasms require intense training and continuous exposure to a sufficient volume of specimens to maintain operator competency. When examined as a whole, the FCIP approaches for detecting MDS and MPN that have been published to date, although powerful, are also highly complex, potentially costly, and difficult to use in routine clinical flow cytometry laboratories.
The recent development of advanced molecular genetic analysis has the potential to change hematology practice by uncovering therapeutic targets and expanding the list of important prognostic markers.27 However, because of a growing list of putative abnormalities and the complexity of regulatory genetic mechanisms, it is likely that phenotypic analysis of the cells will remain a mainstay of diagnostics for the foreseeable future. Given the limited resources available for routine diagnostic workup, and the emerging standard of practice that incorporates genetic testing in the diagnosis of chronic myeloid neoplasms, there is a need for a simpler approach to the use of FCIP in evaluating myeloid dysmaturation. In this study, we show that a simple two-dimensional visual display of CD13/HLA-DR expression on CD34+ blasts may provide a cost-effective alternative to complex multidimensional analyses. It is important to note that while display of CD13/HLA-DR expression on CD34-positive CD45-dim blasts is very simple and reproducible, our analytic tube included additional antibodies (CD15, CD16,
CD33, and CD117) that are necessary to correctly identify the various bone marrow cell populations on the CD45/SSC plot, particularly those that may be “contaminating,” or overlapping with, the blast gate.28 Nevertheless, the simplicity of the qualitative method described in this study should enable a more widespread use of FCIP in the diagnosis of myeloid neoplasms by smaller laboratories. The unique value of this study is in its nonselective inclusion of all cases from a busy academic clinical practice. Importantly, the sensitivity and specificity of CD13/HLA-DR patterns for the presence of active myeloid neoplasm in this study were 71% and 95%, respectively, which is comparable to algorithms using large antibody sets and complex scoring systems.
The limitations of the current study are (1) lack of clinical follow-up for the predictive value of CD13/HLA-DR abnormality, (2) no stratification of MDS entities and no patients with the diagnosis of idiopathic cytopenia with unknown significance, and (3) a single institution experience with subjective definition of a qualitative abnormality.
Although the diagnosis of MDS and other myeloid neoplasms still requires correlation of clinical, morphologic, and cytogenetic findings, emerging evidence shows the usefulness of other diagnostic modalities, including FCIP and molecular genetic testing. Here we describe a simple FCIP method of assessing myeloid dysmaturation. Further studies are needed to establish how this new finding fits with scoring systems of qualitative FCIP and with other laboratory diagnostic tests for myeloid neoplasms.
Address reprint requests to Dr Jevremovic: Mayo Clinic, 200 1st St SW, Hilton 815, Rochester, MN 55905; [email protected].
References 1. Brunning RD, Germing U, Le Beau MM, et al.
Myelodysplastic syndromes/neoplasms, overview. In: Swerdlow SH, Harris NL, Jaffe ES, et al, eds. WHO Classification of Tumours of Haematopoietic and Lymphoid Tissues. Lyon, France: IARC Press; 2008.
2. Stetler-Stevenson M, Arthur DC, Jabbour N, et al. Diagnostic utility of flow cytometric immunophenotyping in myelodysplastic syndrome. Blood. 2001;98:979-987.
3. Della Porta MG, Lanza F, Del Vecchio L. Flow cytometry immunophenotyping for the evaluation of bone marrow dysplasia. Cytometry B Clin Cytom. 2011;80:201-211.
4. Harrington A, Olteanu H, Kroft S. The specificity of immunophenotypic alterations in blasts in nonacute myeloid disorders. Am J Clin Pathol. 2010;134:749-761.
5. Kern W, Bacher U, Schnittger S, et al. Multiparameter flow cytometry reveals myelodysplasia-related aberrant antigen expression in myelodysplastic/myeloproliferative neoplasms. Cytometry B Clin Cytom. 2013;84:194-197.
6. Kussick SJ, Wood BL. Four-color flow cytometry identifies virtually all cytogenetically abnormal bone marrow samples in the workup of non-CML myeloproliferative disorders. Am J Clin Pathol. 2003;120:854-865.
by guest on June 18, 2016http://ajcp.oxfordjournals.org/
Dow
nloaded from
298 Am J Clin Pathol 2014;142:292-298298 DOI: 10.1309/AJCP73QSLLYDEGXK
© American Society for Clinical Pathology
Jevremovic et al / Simplified Flow for Myeloid Neoplasms
19. Westers TM, Alhan C, Chamuleau ME, et al. Aberrant immunophenotype of blasts in myelodysplastic syndromes is a clinically relevant biomarker in predicting response to growth factor treatment. Blood. 2010;115:1779-1784.
20. Kussick SJ, Fromm JR, Rossini A, et al. Four-color flow cytometry shows strong concordance with bone marrow morphology and cytogenetics in the evaluation for myelodysplasia. Am J Clin Pathol. 2005;124:170-181.
21. Pirruccello SJ, Young KH, Aoun P. Myeloblast phenotypic changes in myelodysplasia. CD34 and CD117 expression abnormalities are common. Am J Clin Pathol. 2006;125:884-894.
22. Scott BL, Wells DA, Loken MR, et al. Validation of a flow cytometric scoring system as a prognostic indicator for posttransplantation outcome in patients with myelodysplastic syndrome. Blood. 2008;112:2681-2686.
23. Truong F, Smith BR, Stachurski D, et al. The utility of flow cytometric immunophenotyping in cytopenic patients with a non-diagnostic bone marrow: a prospective study. Leuk Res. 2009;33:1039-1046.
24. van de Loosdrecht AA, Westers TM, Westra AH, et al. Identification of distinct prognostic subgroups in low- and intermediate-1-risk myelodysplastic syndromes by flow cytometry. Blood. 2008;111:1067-1077.
25. Stachurski D, Smith BR, Pozdnyakova O, et al. Flow cytometric analysis of myelomonocytic cells by a pattern recognition approach is sensitive and specific in diagnosing myelodysplastic syndrome and related marrow diseases: emphasis on a global evaluation and recognition of diagnostic pitfalls. Leuk Res. 2008;32:215-224.
26. Wood B, Jevremovic D, Béné MC, et al. Validation of cell-based fluorescence assays: practice guidelines from the ICSH and ICCS—part V—assay performance criteria. Cytometry B Clin Cytom. 2013;84:315-323.
27. Kulasekararaj AG, Mohamedali AM, Mufti GJ. Recent advances in understanding the molecular pathogenesis of myelodysplastic syndromes. Br J Haematol. 2013;162:587-605.
28. Harrington AM, Olteanu H, Kroft SH. A dissection of the CD45/side scatter “blast gate.” Am J Clin Pathol. 2012;137:800-804.
7. Matarraz S, López A, Barrena S, et al. The immunophenotype of different immature, myeloid and B-cell lineage-committed CD34+ hematopoietic cells allows discrimination between normal/reactive and myelodysplastic syndrome precursors. Leukemia. 2008;22:1175-1183.
8. Ogata K, Nakamura K, Yokose N, et al. Clinical significance of phenotypic features of blasts in patients with myelodysplastic syndrome. Blood. 2002;100:3887-3896.
9. van de Loosdrecht AA, Ireland R, Kern W, et al. Rationale for the clinical application of flow cytometry in patients with myelodysplastic syndromes: position paper of an International Consortium and the European LeukemiaNet Working Group. Leuk Lymphoma. 2013;54:472-475.
10. Westers TM, van der Velden VH, Alhan C, et al. Implementation of flow cytometry in the diagnostic work-up of myelodysplastic syndromes in a multicenter approach: report from the Dutch Working Party on Flow Cytometry in MDS. Leuk Res. 2012;36:422-430.
11. Westers, TM, Ireland R, Kern W, et al. Standardization of flow cytometry in myelodysplastic syndromes: a report from an international consortium and the European LeukemiaNet Working Group. Leukemia. 2012;26:1730-1741.
12. Aghaeepour N, Finak G; FlowCAP Consortium; et al. Critical assessment of automated flow cytometry data analysis techniques. Nat Methods. 2013;10:228-238.
13. Pedreira CE, Costa ES, Lecrevisse Q, et al. Overview of clinical flow cytometry data analysis: recent advances and future challenges. Trends Biotechnol. 2013;31:415-425.
14. Fiser K, Sieger T, Schumich A, et al. Detection and monitoring of normal and leukemic cell populations with hierarchical clustering of flow cytometry data. Cytometry A. 2012;81:25-34.
15. De Smet D, Trullemans F, Jochmans K, et al. Diagnostic potential of CD34+ cell antigen expression in myelodysplastic syndromes. Am J Clin Pathol. 2012;138:732-743.
16. Goardon N, Nikolousis E, Sternberg A, et al. Reduced CD38 expression on CD34+ cells as a diagnostic test in myelodysplastic syndromes. Haematologica. 2009;94:1160-1163.
17. Burbury KL, Westerman DA. Role of flow cytometry in myelodysplastic syndromes: diagnosis, classification, prognosis and response assessment. Leuk Lymphoma. 2014;55:749-760.
18. Maynadie M, Picard F, Husson B, et al. Immunophenotypic clustering of myelodysplastic syndromes. Blood. 2002;100:2349-2956.
by guest on June 18, 2016http://ajcp.oxfordjournals.org/
Dow
nloaded from