local labor market endowments, new business characteristics, and performance
TRANSCRIPT
Local Labor Market Endowments, New Business Characteristics, and Performance
Mark Doms
Federal Reserve Bank of San Francisco, [email protected]
Ethan Lewis Dartmouth College, [email protected]
Alicia Robb
University of California, Santa Cruz, [email protected]
October, 2008 JEL codes: O12, R58 Areas: startup firms, entrepreneurship, labor supply Abstract It is often asserted that a highly educated workforce is vital to improving the competitive position of American businesses, especially by boosting entrepreneurship. To examine this contention, we use population Census data and a rich, new, nationally representative panel of startup firms, to examine how the education and skill level of the local labor force are related to the creation and success of new businesses. We find that areas that possess more skilled labor also possess higher rates of self-employment and more skilled entrepreneurs. As in previous studies, we find that education of the business owner is strongly linked to improved business outcomes. Potentially consistent with the popular view, we also find that, conditional on owner's education, higher education levels in the local market are positively correlated with improved business outcomes.
I. Introduction
It has long been recognized that education plays a vital role in economic growth, though
identifying the exact channels has proved somewhat elusive. In the United States, for instance,
highly educated cities generally posted above average wage growth over the past several decades
(see Beaudry, Doms, and Lewis 2007 and Glaeser 2007).1 A firm-specific channel through which
education may affect economic growth is through entrepreneurship. In this paper, we exploit the
Kauffman Firm Survey (KFS), a new panel dataset with more than 4,000 firms that began
operations in 2004, to ask how education levels in local markets are related to entrepreneurship
and business outcomes.
The relationship between education and entrepreneurship can be thought of in two, inter-
related ways: the education of business owners and the average education in the local labor
market. More educated markets may have more educated entrepreneurs, and it has long been
recognized that the education of business owners is one of the more important variables found in
models of small business success. For instance, Fairlie and Robb (2008) document that
businesses with more educated owners had higher sales and profits, were more likely to hire
employees, and were more likely to survive.2 Owner’s education may play an important role in
business success because of self selection (higher-educated people may be more motivated or
innately gifted in characteristics that would be beneficial to new businesses) and/or human
capital (the education itself may be useful in starting and running a business).
1 There are many possible reasons why this result could emerge. One possible explanation for this above average performance since 1980 could be that highly educated cities were better able to take advantage of the information technology revolution (the Beaudry et al, 2007), while another is that highly educated cities are natural magnets for highly skilled industries (Beaudry, et al, in progress) 2 See van der Sluis, van Praag and Vijverberg (2004) for a recent review of the literature on the relationship between education and entrepreneurship, and Card (1999) for a review of the literature on the returns to education in the labor market.

Entrepreneurs may also benefit from a more educated local population. Educated
workers appear to have better access to information (Wozniak, 2006) and are better at
implementing new ideas (Bartel and Lichtenberg, 1987). Indeed, supplies of educated workers
are associated with faster adoption of new technologies (Staiger and Skinner, 2005; Doms and
Lewis, 2007) and production techniques (Lin, 2007). Acs, Armington, and Zhang (2007) point
out, furthermore, that more educated populations provide an environment “rich in social
networks,” and it is the exchange of existing ideas from disparate sources which may lead to new
ideas that help sustain businesses (Jacobs, 1969).3
Given the potential importance of education in the role of economic growth and
entrepreneurial success, we explore the relationship between education in a city and the
education of business owners and subsequent business performance. One of the primary reasons
for examining these issues is that many government policies are directed towards the assistance
of small businesses. In this paper we address to what extent the education of the local labor
force is related to small business creation and performance. It could be that policies promoting
and retaining a highly educated workforce could be at least, if not more, important than policies
that attempting to more directly foster new business development.
We use several datasets to examine these relationships. For the characteristics of
business owners, we use a firm level panel dataset of approximately 4,100 businesses that began
in 2004, which are tracked through 2006. This dataset, the Kauffman Firm Survey (KFS), has
only recently become available. We merge to the KFS information on local labor market
conditions, where the local market is defined as the consolidated metropolitan statistical area
(CMSA). The characteristics of the local labor market are constructed using the 2000 Decennial
3 A skilled workforce may also be more adept at adapting to unexpected shocks (Glaeser and Saiz, 2003) something originally suggested by Schultz (1964, 1975).
Census (DC). We use an additional source of information on entrepreneurship from the DC. In
that survey, workers are asked whether they are primarily self employed or work for others.
While self employment and entrepreneurship are not one in the same, a comparative advantage
of the DC data, over the KFS data, is a larger sample size; in 2000, our sample from the DC
contains 234,000 full-time workers that are self-described as self-employed.
Our analyses of these data produce three major findings. First, unsurprisingly, more
educated cities have more educated business owners. This is true even within detailed industries.
The educational attainment of primary business owners (KFS data) and self-employed workers
(DC data) is strongly and positively related to the education of the local labor force before and
after controlling for industry. The result implies, say, that a self-employed taxi driver in San
Francisco (a highly educated city) is likely to have a higher educational attainment than a self
employed taxi driver in Hickory, North Carolina (a city on the lower end of the educational
attainment spectrum).
Second, a city’s average education level is positively associated with entrepreneurial
activity. The share of the population that is self-employed increases with the education level of a
city, even after controlling for industry and occupation. That is, cities that are highly educated,
conditional on their industry and occupational mix, also possess larger rates of full-time self
employment. This result appears to be mostly an owner-level or “compositional” phenomenon,
driven by the fact that more educated individuals are more likely to start businesses.
Third, and perhaps most interestingly, we find that a city’s education level is positively
associated with some business outcomes, including probability of survival. In contrast to the
previous finding, this is neither a purely owner-level nor a purely city-level phenomenon. We do
replicate the finding of previous studies that the education of the business owner is associated

with improved business outcomes. But conditional on owner’s education, the average education
level of local labor market is associated with improved business outcomes.
The outline of this preliminary paper is as follows. The second section describes the data
used in the study and some stylized facts that motivate our approach. The third section presents
the empirical results. The last section provides some concluding comments.
II. Data, Motivation, and Approach
II.1 Data
We merge two datasets to examine the issues of how local labor market conditions are
related to various aspects of new businesses. The first dataset, the Kauffman Firm Survey
(KFS), is a firm level survey, which consists of three years of longitudinal data. The second
dataset, which comes from the five percent Public Use Microdata Sample (PUMS) from the
Decennial Census (DC), contains demographic information on education levels and self
employment rates at the Consolidated Metropolitan Statistical Area (CMSA) level.
The KFS is a survey of new businesses in the United States. This survey collected
information on 4,928 firms that started in 2004 and surveys them annually. This cohort is the
first large national sample of firm startups that will be tracked over time. These data contain
detailed information on both the firm and business owner(s). In addition to the 2004 baseline
year data, there are two years of follow up data (2005 and 2006) now available. Additional years
are planned. Detailed information on the firm includes three-digit NAICS industry, physical
location, employment, sales, profits, intellectual property, and financial capital (equity and debt)
used at start-up and over time. Information on up to ten business owners per firm includes age,
education, work experience, previous startup experience, and gender, race, and ethnicity.4
We use the confidential dataset because the public use microdata do not contain any
geographical detail. This research uses a subset of the data, those firms having data for all three
years and those verified as going out of business (as opposed to not responding to the survey) in
either 2005 or 2006. This reduces the sample size to 4,159 businesses. The method for
assigning owner demographics at the firm level was to first define a primary owner. For firms
with multiple owners (35 percent of the sample), the primary owner was designated by the
largest equity share. In cases where two or more owners owned equal shares, hours worked and
a series of other variables were used to create a rank ordering of owners in order to define a
primary owner. (For more information on this methodology, see Ballou et. al, 2008.) For this
research, multi-race/ethnic owners are classified into one race/ethnicity category based on the
following hierarchy: black, Asian, other, Hispanic, and white. For example, an owner is defined
as black, even if he/she is also Hispanic. As a result of the ordering, the white category includes
only non-Hispanic white.
The other data used in this paper are the Decennial Census (DC) of population which
identify metropolitan areas and allow us to construct information on each area’s labor force.
There are many different ways to define a local labor market; we have chosen the largest
definition used in the DC, the so-called “Consolidated Metropolitan Statistical Area (CMSA).”5
4 For more information about the KFS survey design and methodology, please see Ballou et. al (2008). A public use dataset is available for download from the Kauffman Foundation’s website and a more detailed confidential dataset is available to researchers through a data enclave provided by the National Opinion Research Center (NORC). For more details about how to access these data, please see www.kauffman.org/kfs. 5 The question is whether, say, Oakland and San Francisco (or, say, New York and northern New Jersey) should be treated as separate markets or the same market. For the purpose of this paper, we consider them, along with the whole San Francisco Bay Area (New York Area), to be a single labor market. This type of issue comes up in a minority of cases for densely populated parts of the country. In much of the country, it is easier to define individual labor markets, as the Census Bureau has done.

We include approximately 230 CMSAs. At the individual level, we categorize workers into one
of five mutually exclusive categories based on their highest educational achievement: less than
high school, high school graduates, some college, college graduates, and more than college. At
the market level, we use a measure often used in research on skill-biased technological change,
the so-called “college equivalent share” (Katz and Murphy, 1992; Autor, Katz, and Krueger,
1998; and Card and DiNardo, 2002). It is defined as the share of the full-time work force with at
least 16 years of education plus half of the share of those with some college but no four year
degree. We will sometimes refer to this as just the “college share.”6
II.2 Motivation and Approach
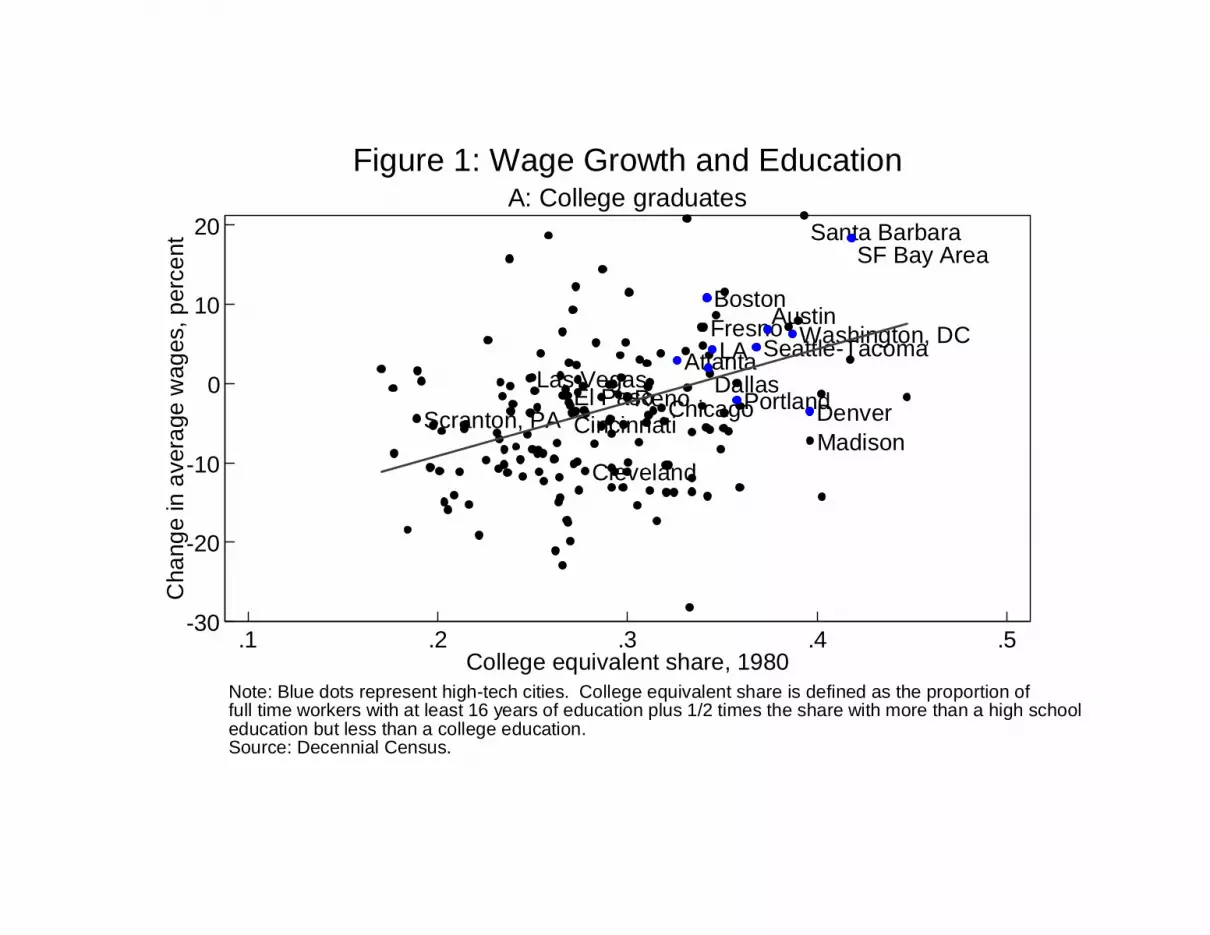
A key motivation for examining the relationship between a city’s education level and
entrepreneurship is the above average performance of highly educated U.S. cities over the past
several decades. As shown in Figure 1A, average wages for college graduates increased the
fastest between 1980 and 2000 in highly educated cities; in fact, wages for college graduates in
the most highly educated cities, such as San Francisco, increased about 20 percent faster than
cities like Hickory NC (not very highly educated). Notice this is not just the result of the fact
that the returns to college rose between 1980 and 2000: Figure 1 implicitly conditions on
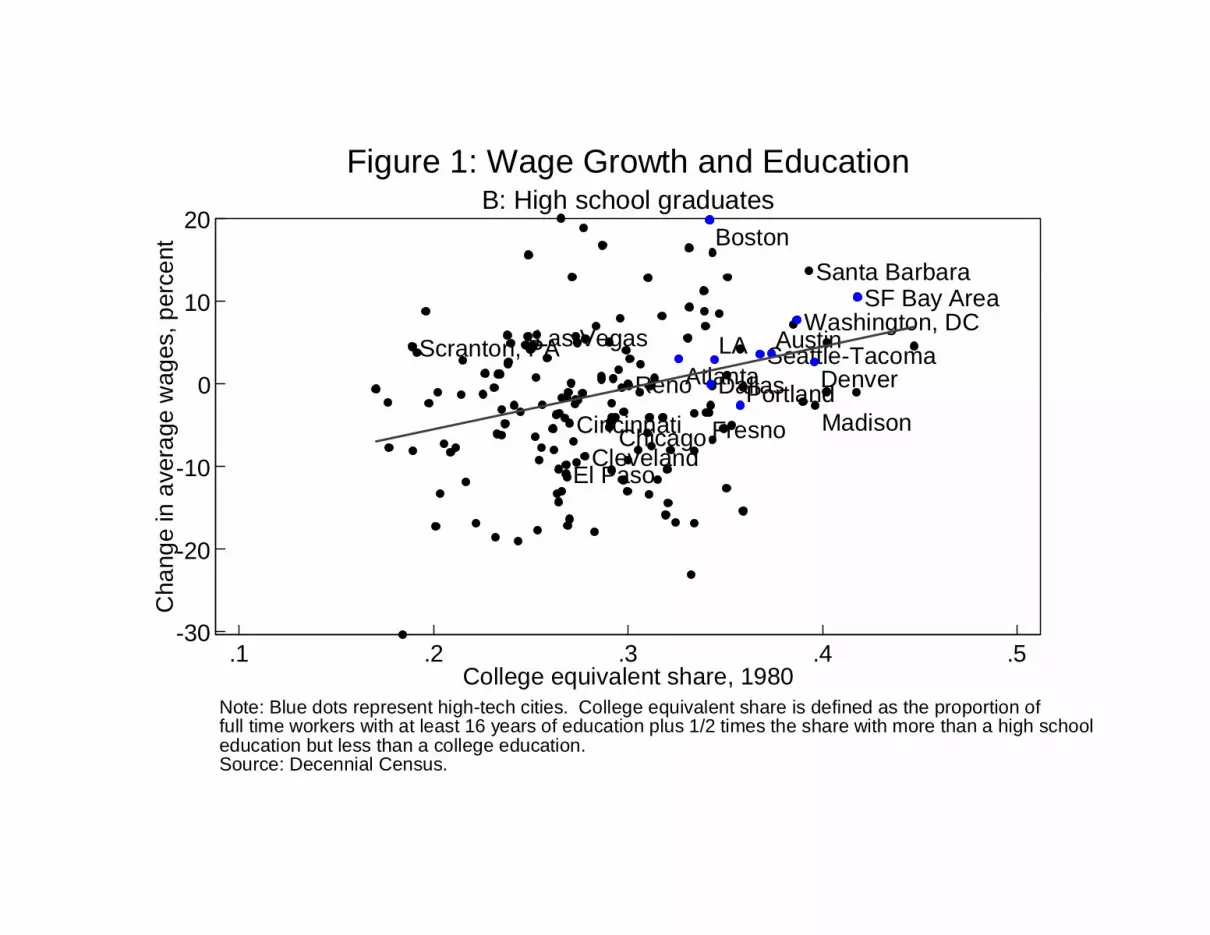
individual-level education. Furthermore, Figure 1B shows that the growth of the wages of high-
school educated workers are similarly related to initial college share.
The relationships in Figures 1A and B are not necessarily driven by a causal impact of
initial skill mix on productivity growth. For example, higher quality workers within educational
categories might differentially migrate to initially more skilled cities. Although this cannot be
6 Distilling the education distribution of a city into a single measure, such as the college-equivalent share, requires many assumptions. However, many of the results in this paper are robust to how education is measured; where the results do vary, it will be noted.
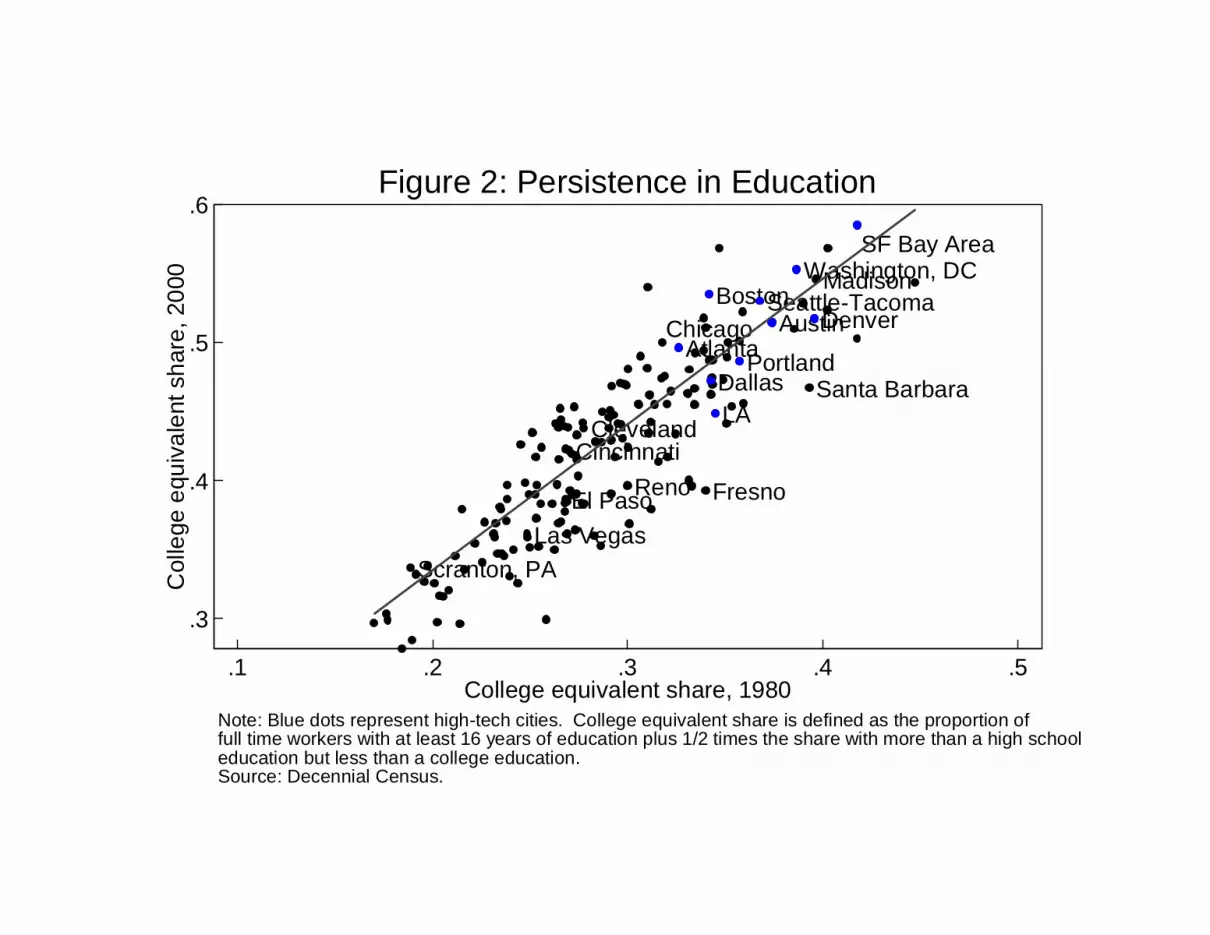
ruled out, an illustrative fact supporting the productivity growth interpretation is that the
educational differentials across cities are surprisingly stable. As shown in Figure 2, relative
rankings of education are remarkably robust between 1980 and 2000. In fact (not shown in
figure) for a smaller sample of cities it can been shown that the same cities that were highly
educated in 1940 tended to remain highly educated in 2000 (Beaudry, Doms, Lewis, 2008). In
other words, skilled workers did not migrate differentially to more educated cities skilled
between 1980 and 2000, at least when skill is measured with observable education.7
Highly educated cities may also grow faster because they have an industry mix which
favors growth; industry mix may even have a direct effect on entrepreneurship (e.g., Glaeser and
Kerr, 2007). So in order to study the effects of education mix on entrepreneurship it will be
important to control for industry mix. On the other hand, it is worth noting that that the link
between local education mix and industry mix is much weaker than many expect. Lewis (2004)
finds education mix differences account for less than 10 percent of the differences in detailed
industry mix across markets. To put it differently, Los Angeles, for example, has nearly double
the proportion of low-skill workers of the rest of the U.S.; because L.A.’s industry mix is not that
different than the rest of the U.S., even looking within any narrow industry (say, retail banking)
Los Angeles also has twice the proportion of low skill workers as other cities.
Given that more skilled cities do enjoy faster productivity growth, why is this the case?
Two candidate explanations include are that high-skilled cities adopt new technologies more
rapidly (Beaudry, Doms, and Lewis, 2008) and to move more quickly into new, higher
productivity sectors. Glaeser and Saiz (2003) also describe how more educated cities are better
at “reinventing” themselves in response to shocks (like the decline in manufacturing). The
7 Glaeser and Saiz (2003) make this same sort of point by showing that growth has little correlation with changes in college share.

present paper asks to what degree entrepreneurship and entrepreneurial success plays a role in
this relationship.
III. Education of owners and education of the city
Previous research has found the success of an individual business is linked to the
education level of the business’s owner. A variety of factors may account for this relationship:
the knowledge and skills acquired through formal education may be useful for running a
successful business; education may proxy for an owner’s ability or send a positive signal to
potential customers, lenders, and business suppliers; and education might simply be correlated
with other traits that influence business success, such as access to social networks. In this paper
we will not attempt to distinguish among these mechanisms; instead, this paper should be viewed
as more of a first step in the examination of education and entrepreneurial activity.
Another reason why more educated business owners might be more successful, and one
not considered in previous studies on the effect of owner education, is that highly educated
business owners are more likely to be operating in an area with highly educated labor which may
itself be conducive to favorable business outcomes. To oversimplify, if an area’s entrepreneurs
are drawn randomly from the local population, then areas with higher more educated populations
are likely to have more educated business owners. Empirically, this description turns out to be
not that far from the truth: a regression of owner’s college completion on the college share in the
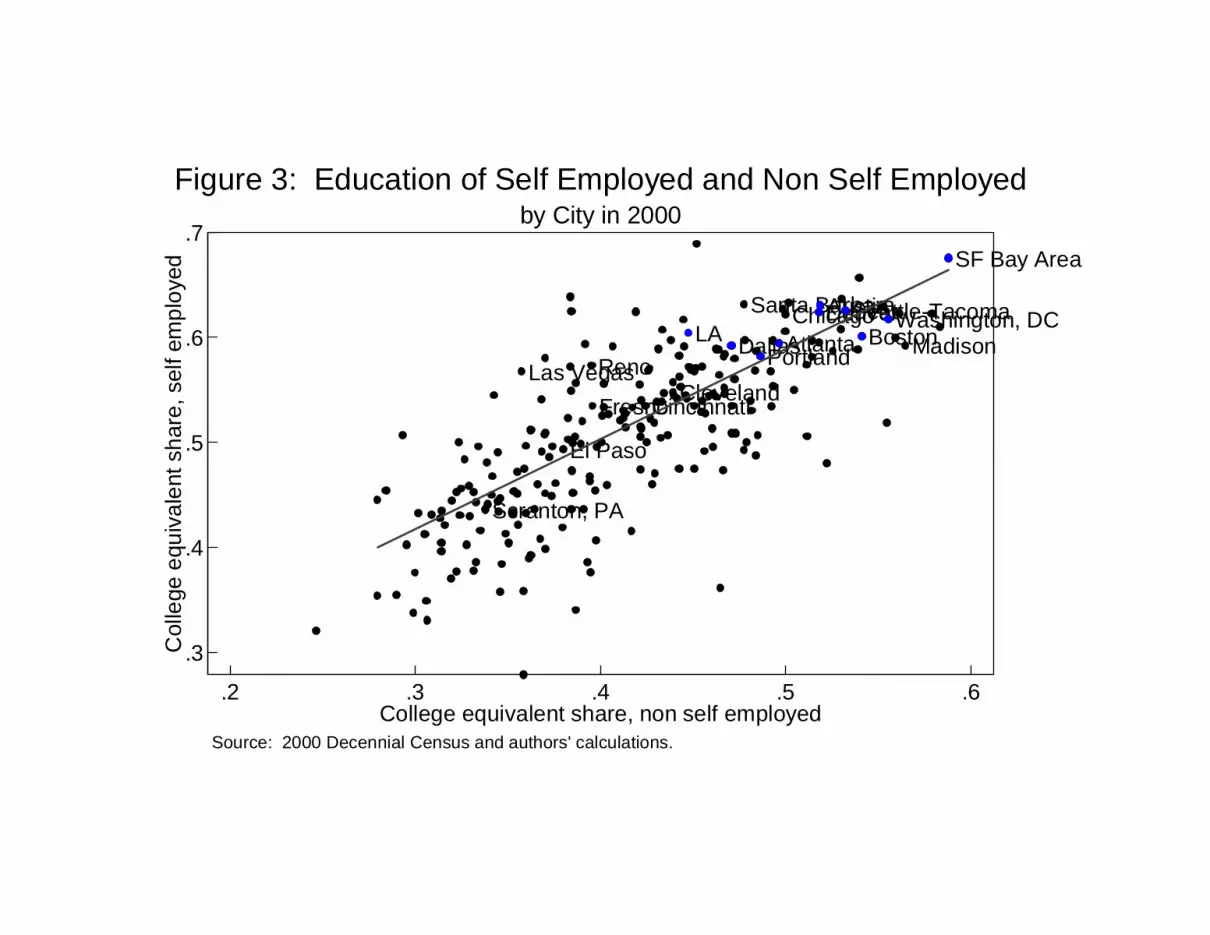
surrounding area using the KFS data fails to reject a coefficient of one. Using the DC data,
Figure 3 plots college share of the self-employed against the college share for the non-self-
employed (wage and salary workers) for our sample of 230 cities. There is a tight correlation
between the 2 series; regressing one on the other yields an R-square of .80, and a slope of one is
again not rejected.
Despite these empirical relationships, the “random draw” interpretation need not be
accurate. More educated markets may have more educated entrepreneurs because their
entrepreneurs work in, say “high tech” industries which tend to be run by more educated people.
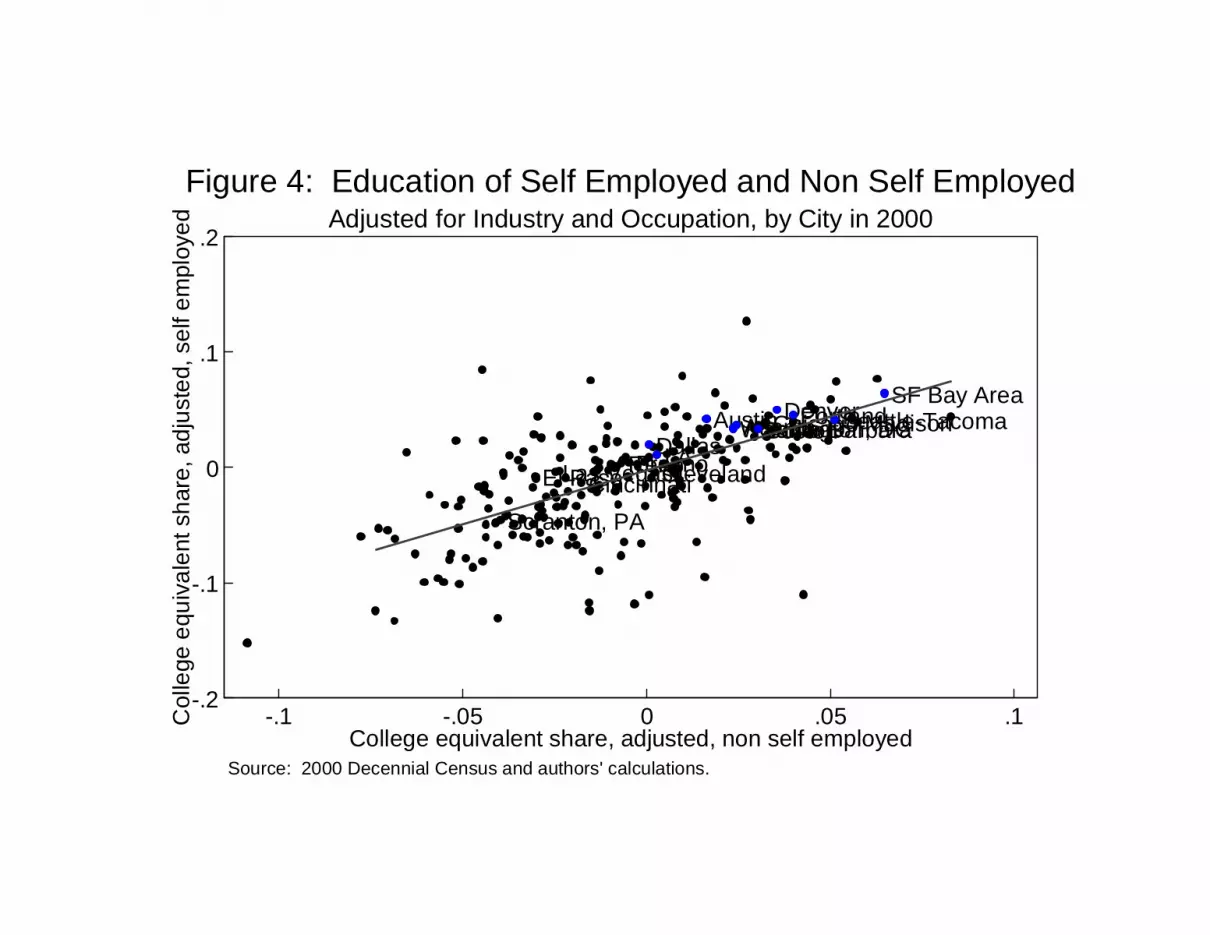
But this appears to be at most a small part of the story. Figure 4 is the same as Figure 3, except it
looks within narrow industry by occupation categories, which divides the workforce into 37,748
cells.8 Even with these narrow cells, the education of self-employed and non-self-employed
workers are highly correlated, with an R-squared of .64, Figure 4 shows.9 The variation in
average education level for all workers across areas is thus a reasonable proxy for the variation in
the education level a typical entrepreneur, in narrowly similar types of enterprises, across
markets. Nevertheless, we will control for industry mix in most specifications below.
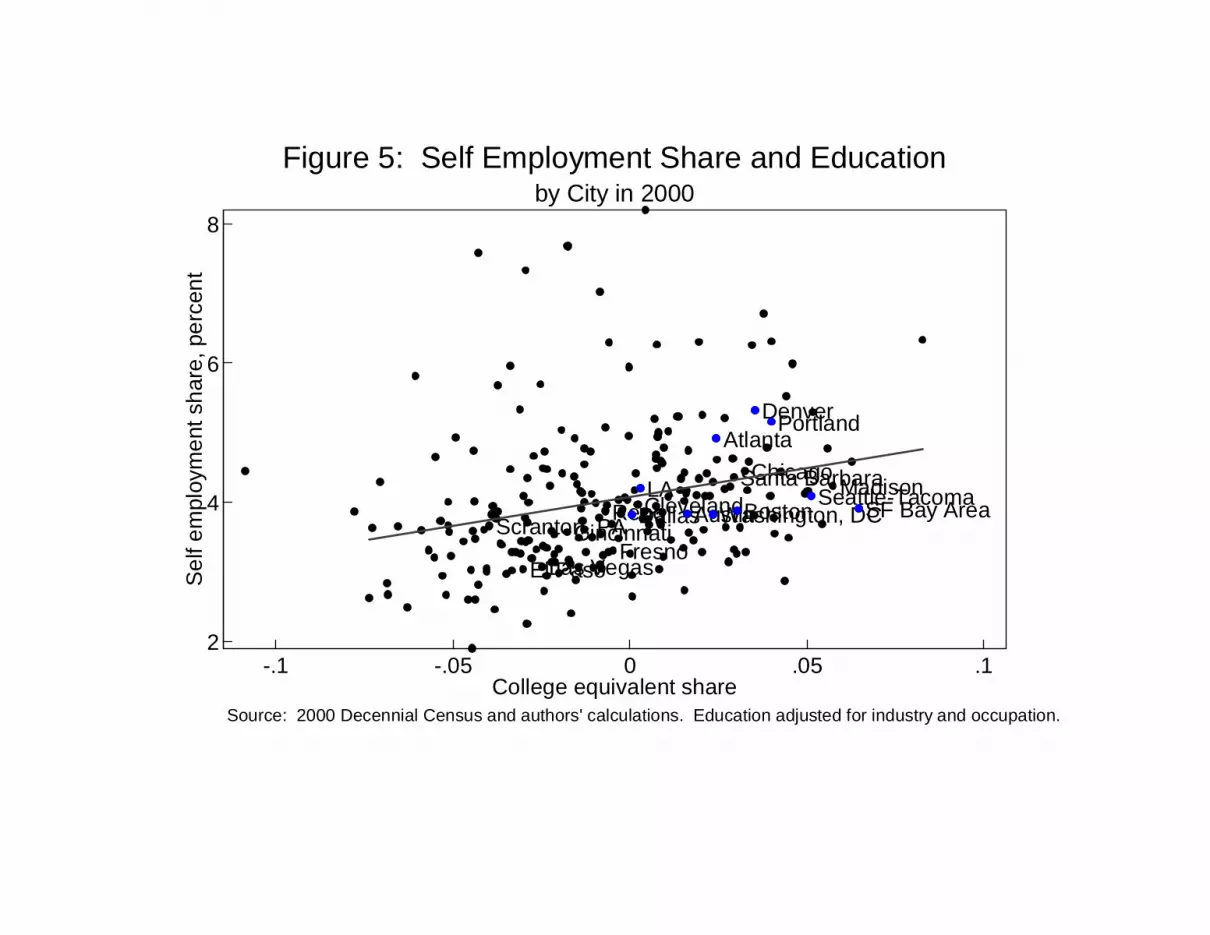
Before turning to the question of how a labor market’s average education affects business
performance, are more educated markets more entrepreneurial? Figure 5 shows that the answer
is “yes.” Again, this is not an industry mix phenomenon: in Figure 5, like Figure 4 the x-variable
is the college share within industry-occupation cells. It is useful to keep in mind when
considering these figures that not all entrepreneurs – not even most entrepreneurs – are opening
cutting-edge technology firms. Entrepreneurship is a much more widespread activity, and even
the least educated markets have a significant amount of entrepreneurship.
The relationship in Figure 5, however, is not truly a city-level phenomenon. More
educated people are more likely to be entrepreneurs, and once this is taken into account, the city-
8 The industry and occupation categories used are the detailed 1990 categories constructed for IPUMS. 9 The slope of this relationship is closer to 0.5 than one. Most of the decrease in slope is due to the occupation cells. As occupation is another proxy for skill, though, it is to be expected that education mix difference across cities are smaller within occupation cells.
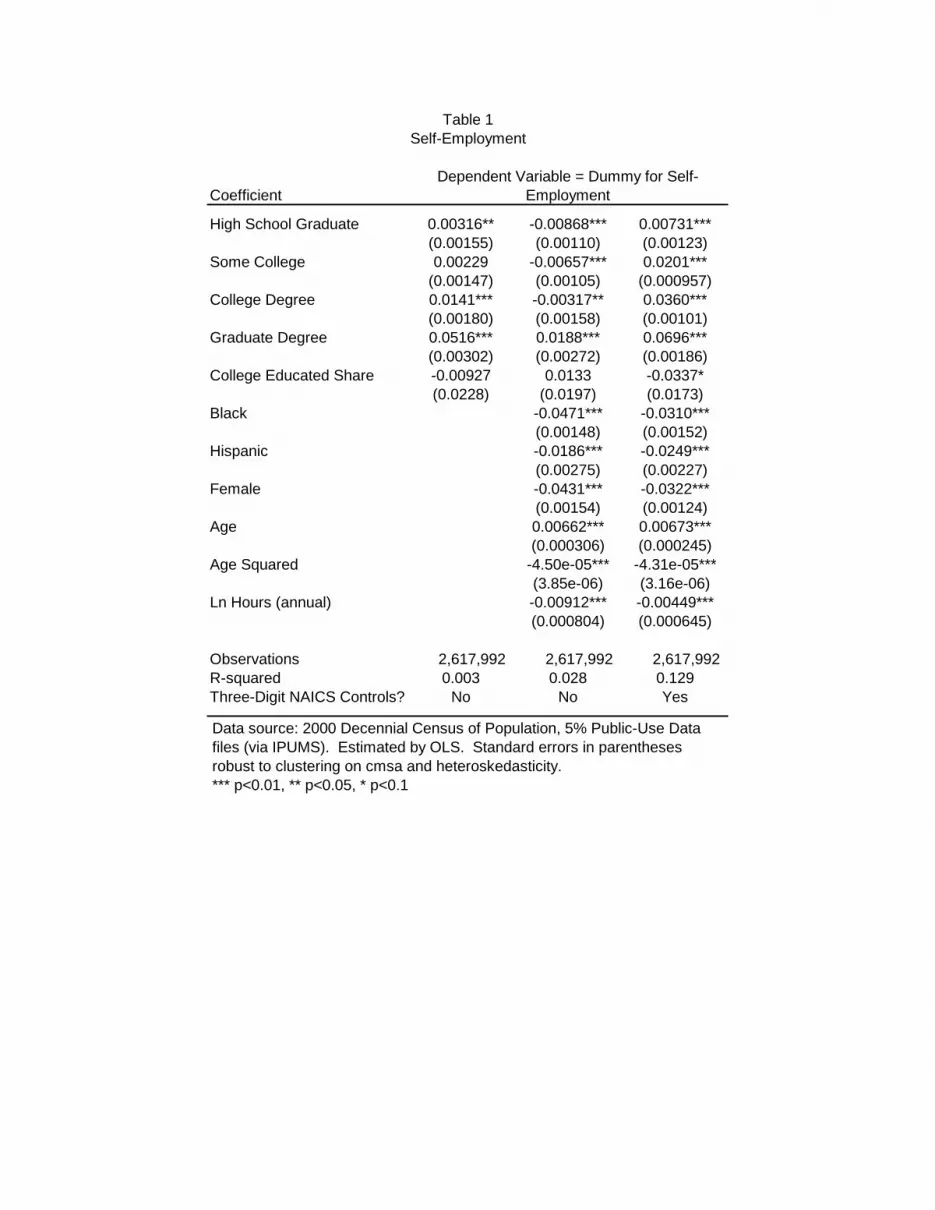
level relationship disappears. This is shown in Table 1, which uses DC data and regresses a
dummy for self-employment on four education categories of the individual (high school dropout
is excluded) plus our city-level measure of college share. The coefficient on the individual-level
education variables are significant, but there is no significant relationship with college share
conditional on individual education. Controls for other individual attributes and for three-digit
NAICS industry (columns 2,3) do not revive the city-level relationship. Table 1 is a reminder
that city-level regressions need to be interpreted with some caution – they might reflect an
aggregate or “spillover” effect, or they might reflect compositional differences. In the
regressions in the remainder of the paper we will examine the influence of owner and city
education simultaneously.
IV. Education of cities and owners and business performance
Using the KFS, we investigate whether owner education and the education level of cities
are positively correlated with a variety of outcomes we use to measure business performance.
We will examine outcomes from the third wave, calendar year 2006, two years after startup. A
dummy for survival to the second wave is our first outcome. Just under 80 percent of the firms
in the KFS sample survived through year end 2006. Respondents of surviving firms were asked
a series of questions annually regarding revenue, expenses, profits, and assets of their firms.
Survivors are likely to be selected on these outcomes, and to avoid selection issues we will start
by examining dummies for being above specific thresholds (assigning “0” for non-survivors) for
revenues ($100,000+), profits ($10,000+), and assets (50,000+).10 30 percent of firms in our
sample had profits over $10,000, 29 percent had revenues over $100,000, and 46 percent had
assets over $50,000. 10 Continuous versions of these variables are examined in Table 3, described below.

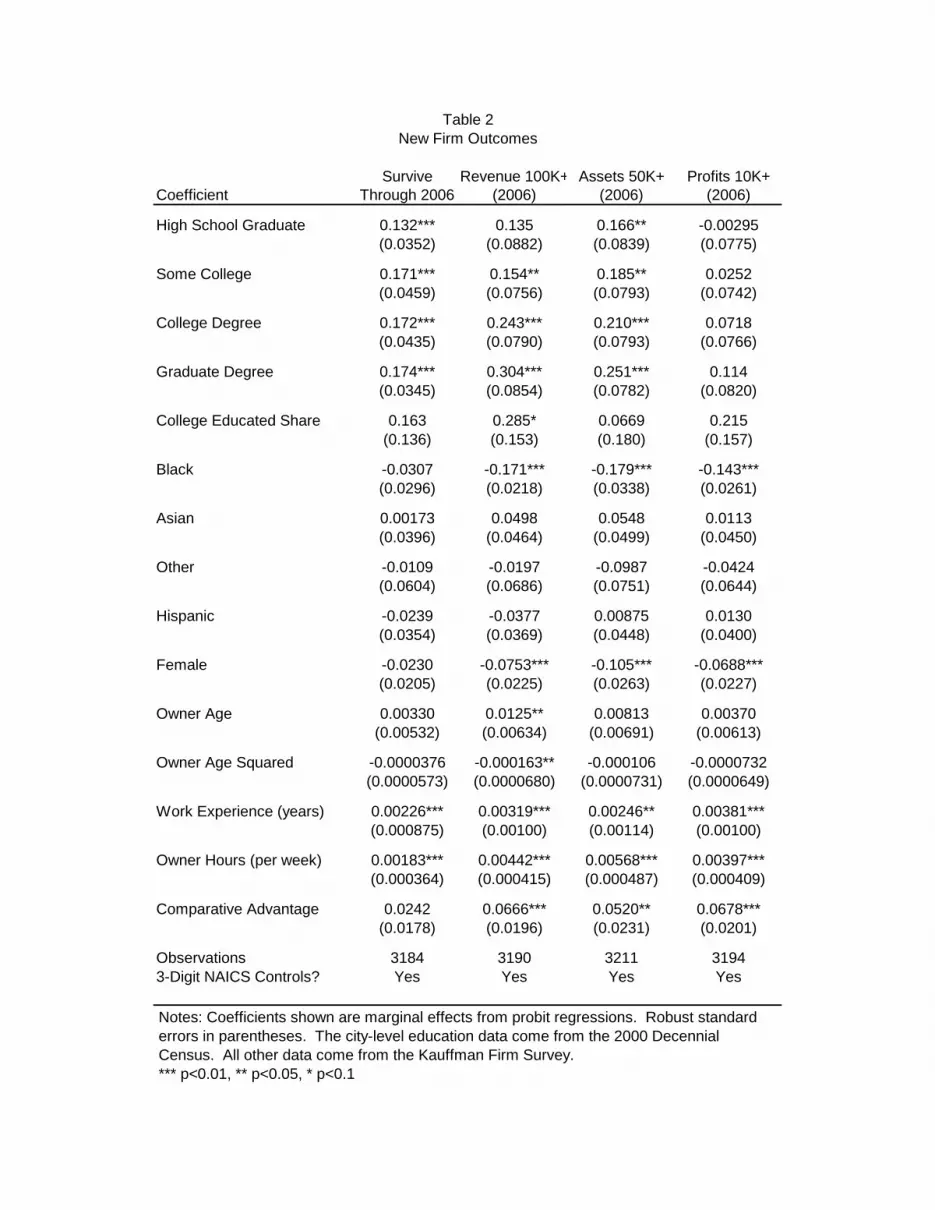
Table 2 shows estimated marginal effects from probit regressions.11 The other
independent variables include primary owner’s education, race, ethnicity, age (and age squared),
years of work experience, and average hours worked in a week. Industry is controlled for at the
three-digit NAICS level in all specifications, but coefficients are not presented.12
The omitted dummy for education level is less than high school graduation. Table 2
shows all four outcomes are monotonically increasing in the owner’s education.13 The owner
education coefficients in the profits regression are not significant, though in the case of survival,
revenue, and assets the estimates are precise and significant.
As for the aggregate college share variable, its coefficient is positive in all four columns,
though unfortunately the standard errors are large and the relationship is only statistically
significant, and there only marginally, for revenues. Thus, it appears that education of the owner
is relatively more important the education of a given city. But the point estimates suggest that
college educated share at the city level may captures a separate, if poorly estimated, effect from
owner’s education
The results for the various other owner characteristics that are controlled for in the
models are consistent with previous research in this area. Businesses with primary owners who
are African American underperform businesses owned by whites. For three of the four outcome
measures, the coefficient on black is negative and statistically significant. The coefficient on
black is negative but not statistically significant in the survival model. Our findings regarding
female-led firms are identical to those for blacks. For three of the four outcome measures,
women-owned firms do worse on average than do businesses owned by men. The coefficient
11 For dummy variables the table reports the discrete change in probability. 12 Subject to meeting confidentiality restrictions, industry coefficients are available from the authors. 13 Interestingly, though, a model which combined the three college level groups into a single category, as we essentially do with the aggregate variable, is not ruled out by the data.

on female is negative but not statistically significant in the survival model. The other race and
ethnicity variables (Hispanic, Asian, Other) are not statistically significant.
Owner age (and age squared) are statistically significant in just one of the models, that of
revenues of more than $100,000. Years of previous work experience has a positive and
statistically significant effect in all four outcome models, as does average hours worked in a
week. Higher educated, experienced owners committing significant hours to their business
venture had higher outcomes than those with lower education and experience levels or who
committed fewer hours to the business. The final variable used in the models was “comparative
advantage” which derives from a KFS question asking respondents whether they felt they had a
comparative advantage in the marketplace. Those owners answering yes to that question had
firms that had better outcomes. The coefficient on this variable is positive and statistically
significant in three of the four models. The survival model is the only one were the coefficient
was not statistically significant.
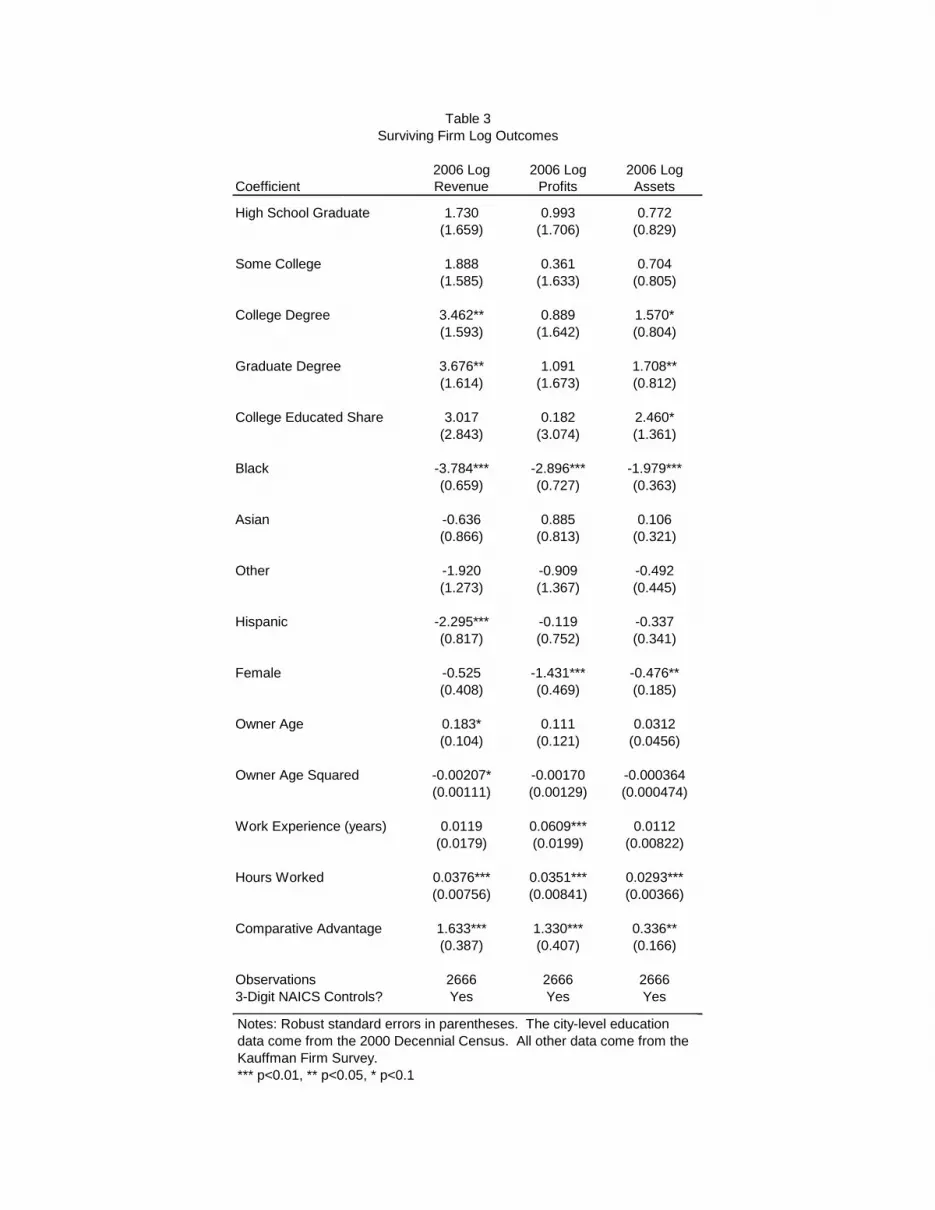
Lest the reader be concerned that the qualitative results in Table 2 were derived from the
particular thresholds chosen, Table 3 shows OLS regressions of the natural log of profits,
revenues, and assets on the same set of variables in Table 2 for the subset of firms which survive
until 2006 (and which have nonzero outcomes).14 The pattern on the owner education variables
is largely unchanged: there is a monotonic relationship with owner education which is significant
for assets and revenues but not for profits. The coefficient on college share is again sizeable but
again imprecisely estimated, though it is marginally significant in this case for assets.15
14 27.3 percent of surviving firms report zero revenues, 41.3 percent report zero profits, and 7.4 percent report zero assets. 15 We also obtain quite similar results if the revenue, assets, and profits variables are examined in “per worker” terms: we have found no evidence so far of a significant association between the education variables and firm’s employment.
The large standard errors on the KFS results for college share make the results somewhat
uninformative. So another way we attempt to measure business performance is with data on the
income from self-employment activities in the DC, where sample sizes are larger. Table 4
studies the self-employment income for all individuals who report being self-employed. In the
first column of the Table, the dependent variable is simply a dummy for having positive self-
employment earnings. This has little relationship with college share, and a weak and
unexpectedly negative relationship with individual education. It may be that more educated
entrepreneurs are able to pursue riskier business enterprises and which have higher variance –
both larger positive and negative – outcomes. In columns (2) – (4) of the table the dependent
variable is the natural log of self-employment income, thus the sample is limited to those who
have positive self-employment income. Here, both individual-level education and citywide
college share are strongly positively related to business income. In addition, while controls for
additional individual characteristics (column 3) and for industry (column 4) weaken the
individual-level relationship, they do not weaken the relationship with college share. In these
data, at least, college share appears to have a strong, independent effect on business performance.
IV. Conclusion
This paper presents preliminary work on the relationship between education and
entrepreneurship, where education of the entrepreneur is examined as well as the education of
the workforce more generally. Our initial results indicate that highly educated cities tend to
produce more educated entrepreneurs. Further, there is some evidence that highly educated
cities may have an above average entrepreneurship rate. Finally, the education of entrepreneurs

is strongly related to positive business outcomes, and the education of the city may also give a
boost to new businesses.
References Acs, Zoltan, Catherine Armington, and Ting Zhang (2007), “The Determinants of New-firm
Survival across Regional Economies,” Discussion Papers on Entrepreneurship, Growth and Public Policy (Max Planck Institute of Economics, Group for Entrepreneurship, Growth and Public Policy) 2007-04.
Autor, David H., Lawrence F. Katz and Alan B. Krueger (1998). “Computing Inequality: Have
Computers Changed the Labor Market?” Quarterly Journal of Economics 113(4): November 1998, p. 1169-1213.
Autor, David H., Frank Levy, and Richard J. Murnane (2003). “The Skill Content of Recent
Technological Change: An Empirical Exploration.” Quarterly Journal of Economics 118 (4): November 2003, p. 1279-1334.
Ballou, J., Barton, T., DesRoches, D., Potter, F., Reedy, E.J., Robb, A., Shane, S. Zhao, Z.
(2008). Kauffman Firm Survey: Results from the Baseline and First Follow-Up Surveys. Kauffman Foundation.
Bartel, Ann and Frank Lichtenberg (1987). “The Comparative Advantage of Educated Workers
in Implementing New Technology: Some Empirical Evidence.” The Review of Economics and Statistics 69(1): February 1987, p. 1-11.
Beaudry, Paul, Mark Doms, and Ethan Lewis (2006). “The IT Revolution at the City Level:
Testing a Model of Endogenous Biased Technology Adoption,” mimeo. Beaudy, Doms and Lewis (In progress). “Endogenous Industry Location” Card, David. (1999). "The Causal Effect of Education on Earnings." Handbook of Labor
Economics, Volume 3A. Ed. Ashenfelter, Orley and David Card. Amsterdam: Elsevier, p.1801-1863.
Card, David, and John E. DiNardo (2002). "Skill-Biased Technological Change and Rising
Wage Inequality: Some Problems and Puzzles." Journal of Labor Economics 20 (4): October 2002, pp. 733-83.
Caselli, Francesco, and John Coleman (2001). “Cross-Country Technology Diffusion: The Case
of Computers,” American Economic Review: Papers & Proceedings, May 2001. Comin, Diego, and Bart Hobijn (2004), “Cross-Country Technology Adoption: Making the
Theories Face the Facts.” Journal of Monetary Economics 51: 2004, p. 39-83. DiNardo, John, and Jörn-Steffen Pischke (1997). “The Returns to Computer Use Revisited: Have
Pencils Changed the Wage Structure Too?” Quarterly Journal of Economics 112, Feb. 1997, 291-303.
Doms, Mark E. and Lewis, Ethan G. (2006). “Labor Supply and Personal Computer Adoption.” FRB of Philadelphia Working Paper No. 06-10.
Fairlie, Robert and Robb, Alicia (2008). Race, Families and Business Success: African-
American, Asian-, and White-Owned Businesses (Cambridge: M.I.T. Press) Glaeser, Edward L. (2007). “Entrepreneurship and the City.” NBER Working Paper No. 13551. Glaeser, Edward L. and William R. Kerr. (2006). “Local Industrial Conditions and
Entrepreneurship: How Much of the Spatial Distribution Can We Explain?” Mimeo, Harvard University, November 15.
Glaeser, Edward L. and Albert Saiz (2003). “The Rise of the Skilled City.” NBER working paper
10191. Imbens, G.W. and Angrist, J. (1994). “Identification and Estimation of Local Average Treatment
Effects.” Econometrica 62: 467-475. Jacobs, Jane. (1969). The Economy of Cities. New York: Vintage Books. Katz, Lawrence F., and Kevin M. Murphy (1992). “Changes in Relative Wages, 1963-1987:
Supply and Demand Factors,” Quarterly Journal of Economics, 112: 1992, p 291-303. Lewis, Ethan. (2004). “How Do Local Labor Markets in the U.S. Adjust to Immigration?”
Federal Reserve Bank of Philadelphia Working Paper, #04-01. Lin, Jeffrey. (2007). “Innovation, Cities, and New Work.” Federal Reserve Bank of
Philadelphia Working Paper #07-25. Moretti, Enrico (2004). “Estimating the Social Return to Higher Education: Evidence From
Longitudinal and Repeated Cross-Sectional Data,” Journal of Econometrics, 121(1-2): July-August 2004, p. 175-212.
Nervis, Allan (1962). The State Universities and Democracy. Urbana, IL: University of Illinois
Press, 1962. Schultz, T. W. (1964). Transforming Traditional Agriculture. New Haven: Yale University
Press. ----. (1975). “The Value of the Ability to Deal with Disequilibria.” Journal of Economic
Literature 13 (3): 827–846. Staiger, Douglass, and Jonathan Skinner. 2005. “Technology Adoption From Hybrid Corn to
Beta Blockers.” NBER Working Paper #11251.

U.S. Department of Commerce, Bureau of the Census (1984). “Intercensal Estimates of the Population of Counties by Age, Sex, and Race [United States]: 1970-1980 [Computer file].” ICPSR version. Washington, DC: U.S. Dept. of Commerce, Bureau of the Census [producer]. Ann Arbor, MI: Inter-university Consortium for Political and Social Research [distributor], 2000.
van der Sluis, J., van Praag, M., and Vijverberg, W. (2004). Education and Entrepreneurship in
Industrialized Countries: A Meta-Analysis. Tinbergen InstituteWorking Paper no. TI 03–046/3, Amsterdam: Tinbergen Institute.
Wozniak, Abigail. 2006. “Why Are College Graduates More Responsive to Distant Labor
Market Opportunities?” Mimeo, University of Notre Dame.
Atlanta
AustinBoston
ChicagoCincinnati
Cleveland
DallasDenver
El Paso
Fresno
Las VegasLA
Madison
PortlandReno
SF Bay AreaSanta Barbara
Scranton, PA
Seattle-TacomaWashington, DC
-30
-20
-10
0
10
20
Cha
nge
in a
vera
ge w
ages
, per
cent
.1 .2 .3 .4 .5College equivalent share, 1980
Note: Blue dots represent high-tech cities. College equivalent share is defined as the proportion offull time workers with at least 16 years of education plus 1/2 times the share with more than a high schooleducation but less than a college education.Source: Decennial Census.
A: College graduatesFigure 1: Wage Growth and Education
AtlantaAustin
Boston
ChicagoCincinnatiCleveland
Dallas Denver
El Paso
Fresno
Las Vegas LA
MadisonPortlandReno
SF Bay AreaSanta Barbara
Scranton, PA Seattle-TacomaWashington, DC
-30
-20
-10
0
10
20
Cha
nge
in a
vera
ge w
ages
, per
cent
.1 .2 .3 .4 .5College equivalent share, 1980
Note: Blue dots represent high-tech cities. College equivalent share is defined as the proportion offull time workers with at least 16 years of education plus 1/2 times the share with more than a high schooleducation but less than a college education.Source: Decennial Census.
B: High school graduatesFigure 1: Wage Growth and Education
AtlantaAustin
BostonChicago
CincinnatiCleveland
Dallas
Denver
El Paso Fresno
Las Vegas
LA
Madison
Portland
Reno
SF Bay Area
Santa Barbara
Scranton, PA
Seattle-TacomaWashington, DC
.3
.4
.5
.6C
olle
ge e
quiv
alen
t sha
re, 2
000
.1 .2 .3 .4 .5College equivalent share, 1980
Note: Blue dots represent high-tech cities. College equivalent share is defined as the proportion offull time workers with at least 16 years of education plus 1/2 times the share with more than a high schooleducation but less than a college education.Source: Decennial Census.
Figure 2: Persistence in Education
Atlanta
AustinBoston
Chicago
CincinnatiCleveland
DallasDenver
El Paso
FresnoLas Vegas
LA MadisonPortlandReno
SF Bay Area
Santa Barbara
Scranton, PA
Seattle-TacomaWashington, DC
.3
.4
.5
.6
.7
Col
lege
equ
ival
ent s
hare
, sel
f em
ploy
ed
.2 .3 .4 .5 .6College equivalent share, non self employed
Source: 2000 Decennial Census and authors' calculations.
by City in 2000Figure 3: Education of Self Employed and Non Self Employed
AtlantaAustinBostonChicago
CincinnatiClevelandDallas
Denver
El Paso FresnoLas VegasLA
MadisonPortland
Reno
SF Bay AreaSanta Barbara
Scranton, PA
Seattle-TacomaWashington, DC
-.2
-.1
0
.1
.2
Col
lege
equ
ival
ent s
hare
, adj
uste
d, s
elf e
mpl
oyed
-.1 -.05 0 .05 .1College equivalent share, adjusted, non self employed
Source: 2000 Decennial Census and authors' calculations.
Adjusted for Industry and Occupation, by City in 2000Figure 4: Education of Self Employed and Non Self Employed
Atlanta
AustinBoston
Chicago
CincinnatiClevelandDallas
Denver
El PasoFresno
Las Vegas
LA Madison
Portland
Reno SF Bay AreaSanta Barbara
Scranton, PASeattle-Tacoma
Washington, DC
2
4
6
8S
elf e
mpl
oym
ent s
hare
, per
cent
-.1 -.05 0 .05 .1College equivalent share
Source: 2000 Decennial Census and authors' calculations. Education adjusted for industry and occupation.
by City in 2000Figure 5: Self Employment Share and Education
Coefficient
High School Graduate 0.00316** -0.00868*** 0.00731***(0.00155) (0.00110) (0.00123)
Some College 0.00229 -0.00657*** 0.0201***(0.00147) (0.00105) (0.000957)
College Degree 0.0141*** -0.00317** 0.0360***(0.00180) (0.00158) (0.00101)
Graduate Degree 0.0516*** 0.0188*** 0.0696***(0.00302) (0.00272) (0.00186)
College Educated Share -0.00927 0.0133 -0.0337*(0.0228) (0.0197) (0.0173)
Black -0.0471*** -0.0310***(0.00148) (0.00152)
Hispanic -0.0186*** -0.0249***(0.00275) (0.00227)
Female -0.0431*** -0.0322***(0.00154) (0.00124)
Age 0.00662*** 0.00673***(0.000306) (0.000245)
Age Squared -4.50e-05*** -4.31e-05***(3.85e-06) (3.16e-06)
Ln Hours (annual) -0.00912*** -0.00449***(0.000804) (0.000645)
Observations 2,617,992 2,617,992 2,617,992 R-squared 0.003 0.028 0.129Three-Digit NAICS Controls? No No Yes
Table 1Self-Employment
Dependent Variable = Dummy for Self-Employment
Data source: 2000 Decennial Census of Population, 5% Public-Use Data files (via IPUMS). Estimated by OLS. Standard errors in parentheses robust to clustering on cmsa and heteroskedasticity.*** p<0.01, ** p<0.05, * p<0.1
Survive Revenue 100K+ Assets 50K+ Profits 10K+Coefficient Through 2006 (2006) (2006) (2006)
High School Graduate 0.132*** 0.135 0.166** -0.00295(0.0352) (0.0882) (0.0839) (0.0775)
Some College 0.171*** 0.154** 0.185** 0.0252(0.0459) (0.0756) (0.0793) (0.0742)
College Degree 0.172*** 0.243*** 0.210*** 0.0718(0.0435) (0.0790) (0.0793) (0.0766)
Graduate Degree 0.174*** 0.304*** 0.251*** 0.114(0.0345) (0.0854) (0.0782) (0.0820)
College Educated Share 0.163 0.285* 0.0669 0.215(0.136) (0.153) (0.180) (0.157)
Black -0.0307 -0.171*** -0.179*** -0.143***(0.0296) (0.0218) (0.0338) (0.0261)
Asian 0.00173 0.0498 0.0548 0.0113(0.0396) (0.0464) (0.0499) (0.0450)
Other -0.0109 -0.0197 -0.0987 -0.0424(0.0604) (0.0686) (0.0751) (0.0644)
Hispanic -0.0239 -0.0377 0.00875 0.0130(0.0354) (0.0369) (0.0448) (0.0400)
Female -0.0230 -0.0753*** -0.105*** -0.0688***(0.0205) (0.0225) (0.0263) (0.0227)
Owner Age 0.00330 0.0125** 0.00813 0.00370(0.00532) (0.00634) (0.00691) (0.00613)
Owner Age Squared -0.0000376 -0.000163** -0.000106 -0.0000732(0.0000573) (0.0000680) (0.0000731) (0.0000649)
Work Experience (years) 0.00226*** 0.00319*** 0.00246** 0.00381***(0.000875) (0.00100) (0.00114) (0.00100)
Owner Hours (per week) 0.00183*** 0.00442*** 0.00568*** 0.00397***(0.000364) (0.000415) (0.000487) (0.000409)
Comparative Advantage 0.0242 0.0666*** 0.0520** 0.0678***(0.0178) (0.0196) (0.0231) (0.0201)
Observations 3184 3190 3211 31943-Digit NAICS Controls? Yes Yes Yes Yes
Table 2New Firm Outcomes
Notes: Coefficients shown are marginal effects from probit regressions. Robust standard errors in parentheses. The city-level education data come from the 2000 Decennial Census. All other data come from the Kauffman Firm Survey.*** p<0.01, ** p<0.05, * p<0.1
2006 Log 2006 Log 2006 LogCoefficient Revenue Profits Assets
High School Graduate 1.730 0.993 0.772(1.659) (1.706) (0.829)
Some College 1.888 0.361 0.704(1.585) (1.633) (0.805)
College Degree 3.462** 0.889 1.570*(1.593) (1.642) (0.804)
Graduate Degree 3.676** 1.091 1.708**(1.614) (1.673) (0.812)
College Educated Share 3.017 0.182 2.460*(2.843) (3.074) (1.361)
Black -3.784*** -2.896*** -1.979***(0.659) (0.727) (0.363)
Asian -0.636 0.885 0.106(0.866) (0.813) (0.321)
Other -1.920 -0.909 -0.492(1.273) (1.367) (0.445)
Hispanic -2.295*** -0.119 -0.337(0.817) (0.752) (0.341)
Female -0.525 -1.431*** -0.476**(0.408) (0.469) (0.185)
Owner Age 0.183* 0.111 0.0312(0.104) (0.121) (0.0456)
Owner Age Squared -0.00207* -0.00170 -0.000364(0.00111) (0.00129) (0.000474)
Work Experience (years) 0.0119 0.0609*** 0.0112(0.0179) (0.0199) (0.00822)
Hours Worked 0.0376*** 0.0351*** 0.0293***(0.00756) (0.00841) (0.00366)
Comparative Advantage 1.633*** 1.330*** 0.336**(0.387) (0.407) (0.166)
Observations 2666 2666 26663-Digit NAICS Controls? Yes Yes Yes
Table 3Surviving Firm Log Outcomes
Notes: Robust standard errors in parentheses. The city-level education data come from the 2000 Decennial Census. All other data come from the Kauffman Firm Survey.*** p<0.01, ** p<0.05, * p<0.1

CoefficientDummy for Income>0
High School Graduate -0.0461*** 0.260*** 0.0991*** 0.0848***(0.00483) (0.0170) (0.0143) (0.0133)
Some College -0.0857*** 0.276*** 0.162*** 0.0968***(0.00541) (0.0266) (0.0221) (0.0192)
College Degree -0.126*** 0.545*** 0.402*** 0.250***(0.00704) (0.0315) (0.0253) (0.0233)
Graduate Degree -0.117*** 1.103*** 0.842*** 0.537***(0.0137) (0.0253) (0.0224) (0.0204)
College Educated Share 0.00402 0.730*** 1.148*** 1.147***(0.153) (0.235) (0.204) (0.191)
Black -0.0879*** -0.0555***(0.0160) (0.0152)
Hispanic -0.0630*** -0.0356**(0.0184) (0.0167)
Female -0.500*** -0.390***(0.0104) (0.00972)
Age 0.0745*** 0.0686***(0.00298) (0.00290)
Age Squared -0.000785*** -0.000733***(3.38e-05) (3.27e-05)
Ln Hours (annual) 0.666*** 0.658***(0.00663) (0.00642)
Observations 238,113 159,967 159,967 159,967 R-squared 0.008 0.050 0.270 0.295Three-Digit NAICS Controls? No No No Yes
ln(Self Employment Income)
Table 4Self-Employment Income
Data source: 2000 Decennial Census of Population, 5% Public-Use Data files (via IPUMS). Estimated by OLS. Standard errors in parentheses robust to clustering on cmsa and heteroskedasticity.*** p<0.01, ** p<0.05, * p<0.1