loan servicing
TRANSCRIPT
A Simulation Model of Loan Servicing forSavings and Credit Cooperative
Organizations (SACCOs) under the PovertyAlleviation Program
by
SSEWANKAMBO DAMIAN
2005/HD18/4053UBIFA(Mak), PGDCS(Mak)
[email protected], +256 752 436 317
A Project Report Submitted to School of Graduate Studies in
Partial Fulfillment for the Award of Master of Science inComputer Science Degree of Makerere University
Option: Computer Information Systems
October, 2007
Declaration
I Ssewankambo Damian do hereby declare that this Project Report is original and has notbeen published or submitted for any other degree award to any other University before.
Signed: .......................................................... Date: ...........................................Ssewankambo DamianBIFA(Mak), PGDCS(Mak)Department of Information SystemsFaculty of Computing and Information Technology, Makerere University
Approval
This Project Report has been submitted for Examination with the approval of the followingsupervisors.
Signed: .......................................................... Date: ...........................................Prof. V. Baryamureeba, PhDSupervisorDepartment of Computer ScienceFaculty of Computing and Information Technology, Makerere University
Signed: .......................................................... Date: ...........................................Ms. Agnes RwashanaBAC (Mak), Msc (Mak)Assistant SupervisorDepartment of Information SystemsFaculty of Computing and Information Technology, Makerere University
ii

Dedication
This work is dedicated to my beloved parents Mr. Sekiziyivu Damian and Ms. TeddyKyebonere.
iii

Acknowledgments
I would like to thank my Father and Mother for the moral and financial support they havegiven me throughout this course.
Special thanks to my supervisor Professor Venansius Baryamureeba for the intellectual guid-ance and advice given to me, without which this work would not have been a success.
My thanks go to Dr. Ddembe Williams, Dr. Tom Wanyama, Ms. Agnes Rwashana and Mr.Paul Ssemaluulu who were always there for me.
My thanks also go to my colleagues Sarah Nsibirwa Nsubuga, Kabuye Patrick and BulegaWilson with whom we formed a Simulation and Modeling discussion group.
Iam grateful to my sisters Vivian Nakabugo, Frances Namuli ,Cissy Nakanjako and JoselineNassali who have always been supportive.
Lastly I thank all those who contributed to this work in one way or another, I will alwaysappreciate your contributions.
MAY THE ALMIGHTY GOD BLESS YOU ALL.
iv
Contents
Declaration . . . . . . . . . . . . . . . . . . . . . . . . . . . . . . . . . . . . . . . iApproval . . . . . . . . . . . . . . . . . . . . . . . . . . . . . . . . . . . . . . . . . iiDedication . . . . . . . . . . . . . . . . . . . . . . . . . . . . . . . . . . . . . . . . iiiAcknowledgements . . . . . . . . . . . . . . . . . . . . . . . . . . . . . . . . . . . iv. . . . . . . . . . . . . . . . . . . . . . . . . . . . . . . . . . . . . . . . . . . . . . viList of Figures . . . . . . . . . . . . . . . . . . . . . . . . . . . . . . . . . . . . . . viiList of Tables . . . . . . . . . . . . . . . . . . . . . . . . . . . . . . . . . . . . . . viiiAcronyms . . . . . . . . . . . . . . . . . . . . . . . . . . . . . . . . . . . . . . . . ixAbstract . . . . . . . . . . . . . . . . . . . . . . . . . . . . . . . . . . . . . . . . . xi
1 INTRODUCTION 11.1 Introduction . . . . . . . . . . . . . . . . . . . . . . . . . . . . . . . . . . . . 1
1.1.1 Background to the Study . . . . . . . . . . . . . . . . . . . . . . . . . 21.2 Statement of the problem . . . . . . . . . . . . . . . . . . . . . . . . . . . . 51.3 Objectives . . . . . . . . . . . . . . . . . . . . . . . . . . . . . . . . . . . . . 7
1.3.1 Scope . . . . . . . . . . . . . . . . . . . . . . . . . . . . . . . . . . . 71.3.2 Significance of the study . . . . . . . . . . . . . . . . . . . . . . . . . 81.3.3 Conceptual Framework . . . . . . . . . . . . . . . . . . . . . . . . . . 91.3.4 Research Contributions . . . . . . . . . . . . . . . . . . . . . . . . . . 11
2 LITERATURE REVIEW 122.1 Review of Loan Servicing Case Studies . . . . . . . . . . . . . . . . . . . . . 122.2 System Dynamics/Simulation Models in Credit Evaluation . . . . . . . . . . 14
2.2.1 Stock and Flow Diagram of a Credit Evaluation System . . . . . . . . 142.2.2 Running of a Simulation . . . . . . . . . . . . . . . . . . . . . . . . . 15
2.3 Modeling and Simulation Systems . . . . . . . . . . . . . . . . . . . . . . . 162.4 Strengths and weaknesses of simulation . . . . . . . . . . . . . . . . . . . . 17
2.4.1 Strengths of simulation . . . . . . . . . . . . . . . . . . . . . . . . . 172.4.2 Weaknesses of Simulation . . . . . . . . . . . . . . . . . . . . . . . . 19
2.5 State of the art and practice in loan servicing . . . . . . . . . . . . . . . . . 202.5.1 Loan Products . . . . . . . . . . . . . . . . . . . . . . . . . . . . . . 202.5.2 Loan servicing tips . . . . . . . . . . . . . . . . . . . . . . . . . . . . 202.5.3 Characteristics of loans . . . . . . . . . . . . . . . . . . . . . . . . . 21
2.6 Poverty Alleviation . . . . . . . . . . . . . . . . . . . . . . . . . . . . . . . . 212.6.1 How income poverty is measured. . . . . . . . . . . . . . . . . . . . . 212.6.2 Trends in income poverty and inequality . . . . . . . . . . . . . . . . 222.6.3 Role of Empowerment in Poverty Alleviation . . . . . . . . . . . . . . 23
v

2.6.4 Divestiture of Micro Credit Schemes as a Tool in Fighting Poverty . . 242.6.5 Role of Decentralization in Fighting Poverty . . . . . . . . . . . . . . 252.6.6 Impact of credit in Poverty Alleviation . . . . . . . . . . . . . . . . . 26
2.7 Loan Recovery . . . . . . . . . . . . . . . . . . . . . . . . . . . . . . . . . . 262.8 Targets . . . . . . . . . . . . . . . . . . . . . . . . . . . . . . . . . . . . . . 262.9 Critique on the Literature . . . . . . . . . . . . . . . . . . . . . . . . . . . . 272.10 Conclusion . . . . . . . . . . . . . . . . . . . . . . . . . . . . . . . . . . . . 27
3 METHODOLOGY 283.1 Review of methodologies . . . . . . . . . . . . . . . . . . . . . . . . . . . . . 28
3.1.1 Case Study. . . . . . . . . . . . . . . . . . . . . . . . . . . . . . . . 283.1.2 Viable Systems . . . . . . . . . . . . . . . . . . . . . . . . . . . . . 293.1.3 Dynamic Synthesis Methodology . . . . . . . . . . . . . . . . . . . . 29
3.2 How the specific objectives were achieved . . . . . . . . . . . . . . . . . . . . 323.2.1 Identify shortcomings with the current approaches . . . . . . . . . . . 323.2.2 Identify Variables . . . . . . . . . . . . . . . . . . . . . . . . . . . . . 333.2.3 Simulation Model Development . . . . . . . . . . . . . . . . . . . . . 333.2.4 Validation . . . . . . . . . . . . . . . . . . . . . . . . . . . . . . . . . 34
4 PRESENTATION OF RESULTS 354.1 Shortcomings with the current approaches . . . . . . . . . . . . . . . . . . . 354.2 Identified Variables . . . . . . . . . . . . . . . . . . . . . . . . . . . . . . . . 38
4.2.1 Definition of variables . . . . . . . . . . . . . . . . . . . . . . . . . . 384.3 Causal loop Diagram . . . . . . . . . . . . . . . . . . . . . . . . . . . . . . . 414.4 Modeling Decisions . . . . . . . . . . . . . . . . . . . . . . . . . . . . . . . . 414.5 Model Structure . . . . . . . . . . . . . . . . . . . . . . . . . . . . . . . . . . 42
4.5.1 POVERTY ALLEVIATION FUND SECTOR . . . . . . . . . . . . . 434.5.2 SACCOS SECTOR . . . . . . . . . . . . . . . . . . . . . . . . . . . . 434.5.3 SACCO CASH FLOW SECTOR . . . . . . . . . . . . . . . . . . . . 434.5.4 SACCO MEMBERSHIP SECTOR . . . . . . . . . . . . . . . . . . . 444.5.5 ADMINISTRATION SECTOR . . . . . . . . . . . . . . . . . . . . . 45
4.6 Simulation Model Interface . . . . . . . . . . . . . . . . . . . . . . . . . 454.7 Initial Conditions . . . . . . . . . . . . . . . . . . . . . . . . . . . . . . . . . 46
4.7.1 SACCO assessment (Experiment 1) . . . . . . . . . . . . . . . . . . . 464.7.2 SACCO assessment (Experiment 2) . . . . . . . . . . . . . . . . . . . 474.7.3 Experiment 3 . . . . . . . . . . . . . . . . . . . . . . . . . . . . . . . 48
5 DISCUSSION, CONCLUSIONS AND RECOMMENDATIONS 495.1 Discussion . . . . . . . . . . . . . . . . . . . . . . . . . . . . . . . . . . . . . 495.2 Conclusions . . . . . . . . . . . . . . . . . . . . . . . . . . . . . . . . . . . . 515.3 Recommendations . . . . . . . . . . . . . . . . . . . . . . . . . . . . . . . . . 51REFERENCES . . . . . . . . . . . . . . . . . . . . . . . . . . . . . . . . . . . . . 52APPENDIX A: INTERVIEW GUIDE . . . . . . . . . . . . . . . . . . . . . . . . 56APPENDIX B: MODEL EQUATIONS . . . . . . . . . . . . . . . . . . . . . . . . 58
vi
List of Figures
1.1 Shows the trend of fighting poverty in Uganda. . . . . . . . . . . . . . . . . . 51.2 Behavior over time graph representing the standards of living and inequality
in relation to the introduction of new poverty alleviation schemes and theirefficiency (MFPED, 2005[27]). . . . . . . . . . . . . . . . . . . . . . . . . . . 6
1.3 Conceptual Framework . . . . . . . . . . . . . . . . . . . . . . . . . . . . . . 9
2.1 The figure shows the structure of the cash, bank credit and account receivables. 15
3.1 The Dynamic Synthesis Methodology. Adapted from (Williams, 2004) [46] . 303.2 System Dynamics Modeling. Adapted from (Richard and Pugh,1981)[38]. . . 31
4.1 Micro finance Institutions Model. Adapted from (Gary,2000)[13]. . . . . . . . 384.2 Causal Loop Diagram for the proposed Simulation Model . . . . . . . . . . . 414.3 Simulation Stock and Flow diagram . . . . . . . . . . . . . . . . . . . . . . . 424.4 User Interface . . . . . . . . . . . . . . . . . . . . . . . . . . . . . . . . . . . 454.5 Simulation Experiment 1 . . . . . . . . . . . . . . . . . . . . . . . . . . . . . 464.6 Simulation Experiment 2 . . . . . . . . . . . . . . . . . . . . . . . . . . . . . 474.7 Simulation Experiment 3 . . . . . . . . . . . . . . . . . . . . . . . . . . . . . 48
5.1 Poverty Alleviation Fund reference mode . . . . . . . . . . . . . . . . . . . . 51
vii
List of Tables
2.1 Levels of Poverty . . . . . . . . . . . . . . . . . . . . . . . . . . . . . . . . . 222.2 Poverty by occupational group . . . . . . . . . . . . . . . . . . . . . . . . . . 24
3.1 Methodologies explored . . . . . . . . . . . . . . . . . . . . . . . . . . . . . . 28
viii
LIST OF ABBREVIATIONS
ACORD: Agency for Cooperation and Research in Development.AFCAP: African Pilot Capacity Building ProgrammeAMFIU: Association of Micro enterprise Finance Institutions of Uganda.BOU: Bank of UgandaCBOs: Community Based OrganizationsCDW: Community Development WorkerCGAP: Consultative Group to Assist the Poorest.CMF: Center for Micro Enterprise Finance.DANIDA: Danish International Development Agency.DFD: Development Finance Department, Bank of UgandaDFID: Department for International Development.ECS: Entandikwa Credit SchemeFEW: Financial Extension WorkerGOU: Government of Uganda.GTZ: German Technical Cooperation. (Deutsche Cresellschaft fur Technische Zusammenar-beit)IMF: International Monitory FundIFAD: International Fund for Agriculture DevelopmentLTV: Loan to Value ratiosMCC: Micro Finance Competence CenterMDIs: Micro Deposit-taking InstitutionsMFF: Micro Finance Forum.MFIs: Micro Finance Institutions.MFPED: Ministry of Finance, Planning and Economic DevelopmentMGLSD: Ministry of Gender, Labour and Social DevelopmentMTCS: Medium Term Competitiveness Strategy for the Private SectorNAADS: National Agricultural Advisory Services ProgrammeNGOs: Non Government OrganizationsNPART: Non-Performing Assets Recovery TrustNURP I : Northern Uganda Rehabilitation ProjectOSS: Operational Self SufficiencyPAP: Poverty Alleviation ProjectPAPSCA: Programme for Poverty Alleviation and Social Costs of Structural AdjustmentPEAP: Poverty Eradication Action PlanPMA: Plan for the Modernization of AgriculturePMA: Plan for Modernization of AgriculturePRESTO: Private Enterprise Support, Training and Development Programme.PRSPs: Poverty Reduction Strategy PapersPSDP: Private Sector Development Programme.RMSP: Rural Micro Finance Support ProjectSACCOS: Savings and Credit Cooperative OrganizationsSME: Small and Medium Sized EnterpriseSPEED: Support for Private Enterprise Expansion and Development.STELLA: Systems Thinking Educational Learning Laboratory with Animation
ix
SUFFICE: Support to Feasible Financial Institutions and Capacity Building Efforts.UBOS: Uganda Bureau of StatisticsUCA: Uganda Cooperative Alliance.UCAP: Uganda Micro Finance Capacity-Building FrameworkUNDP: United Nations Development Programme.UNHCR: United Nations High Commissioner for RefugeesUSAID: United States Agency for International Development.YES: Youth Entrepreneurs Scheme
x
Abstract
Evaluating credit worthy SACCOs that receive Poverty Alleviation Funds has been consid-
ered as one of the main dilemmas that loan officers at the Ministry of Finance Planning and
Economic Development (MFPED) in Uganda have to face in order to reduce the probability
of default. The lending process involves application for loans from MFPED to the successful
or unsuccessful repayment of the loan.
The objective of the Project report was to develop a simulation model that can be used
to analyze SACCOs that can / cannot pay back borrowed poverty alleviation funds to the
MFPED. This objective was achieved through the use of Systems Thinking Educational
Learning Laboratory with Animation (STELLA) software. In developing the simulation
model the concepts of System Dynamics were used. The Dynamic Synthesis Methodology
was used in the development process of the model because its a proven methodology used
by experienced modelers.
The experiments carried out indicate that SACCOs that apply for poverty alleviation funds
can be easily evaluated based on the risk assessment of the credit worthiness a SACCO
under different (What - if) scenarios. As a diagnostic tool this Simulation Model provides
an insight into the underlying structures of a SACCO from which behavior over time and
discreet events emerge. Loan officers can therefore use this Model to give advice to non
credit worthy SACCOs on how to improve on the performance of their organizations so as
to be worthy of receiving funding from the MFPED and rid themselves of poverty.
The researcher recommends that further research be made on how the system can accommo-
date multiple users simultaneously evaluating credit worthy applicants in a busy networked
environment.
xi

Chapter 1
INTRODUCTION
1.1 Introduction
The Poverty Eradication Action Plan (PEAP) is Uganda’s comprehensive Development
Framework. The PEAP has guided the formulation of government policy since its inception
in 1997. It is hoped that under this plan, Uganda will be transformed into a modern economy
in which agents in all sectors can participate in economic growth (MFPED, 2005) [27].
This implies that a number of conditions must be met:-
(i) The economy requires structural transformation, including the modernization of agri-
culture and the development of industries which build on demand and supply linkages
from agriculture.
(ii) The poor must be able to participate in this growth, both by expanding smallholder
agriculture and by expanding employment in industry and services, as well as in rural
non farm enterprises.
(iii) The economic growth must be sustainable
However in order for all the above conditions to be met, there must be cooperation in form
of loan repayment from the general public that receives loans under the project. This will
therefore benefit the wider community by expanding beneficiary base.
1
1.1.1 Background to the Study
Over the last 19 years, the Government of Uganda(GOU) implemented policies geared to-
wards eradicating poverty. These policies involved lending money to individuals through
state credit programs which included
(i) The Entandikwa Credit Scheme (ECS);
”Entandikwa” means ”start up capital”. The credit scheme was a start up capital
fund targeting poor people, with the aim of helping them to improve their economic
status. Under the scheme, 30 percent of the credit was allocated to women and youth
(International Labour Organization, 2003) [19]. Entandikwa was a government admin-
istered programme that disbursed start up loans under the Ministry of Finance. ECS
was apparently proposed by Parliament in 1993 as a way to cover the credit needs of
war-ravaged areas (originally slated for 14 districts). Probably due to political pressure
it was extended to all districts (in fact to all 214 constituencies) in the country with a
fixed (and equal) amount of loan capital being provided per constituency, thereby con-
firming the political nature of the change. It began lending in 1995 and by June 1996
had disbursed US Dollars 7.42 million in GOU money (there was no donor support
to this programme). However the exercise collapsed because the borrowers failed to
pay back (Dichter and Kamuntu, 1997) [9]. According to Moses Byaruhanga the Pres-
idential Advisor on Political Affairs, the government of Uganda suffered a shs.9b loss
through the Entandikwa Schemme. It failed due to poor management and inadequate
loan repayment.” (AGOA News, 2005) [2].
(ii) The Youth Entrepreneurship Scheme (YES).
This scheme was an intervention to mope up unemployment by enabling the affected
majority - youth to be self sustaining (Parliament, 2003) [33]. It was a credit scheme
funded directly through the treasury (Okrut et al., 2004)[32].
(iii) Poverty Alleviation Project (PAP).
The Poverty Alleviation Project was introduced to check the growing poverty levels
with in the rural population. In this project poor landless people would get government
2
loans to buy land, cultivate on it and earn a living as a way of pulling themselves out
of poverty.
(iv) Rural Farmers Scheme (RFS).
This scheme targeted rural farmers. Through this scheme farmers would be given seeds
or animals to rare, machinery such as tractors and technical advice about modern
farming methods. After a given period of time or after harvesting the beneficiaries
were expected to repay the loan depending on the assistance given so as to benefit
other farmers.
(v) Cooperative Credit Scheme (CCS).
Cooperative societies were the beneficiaries of the Cooperative Credit Scheme. Under
this project cooperative societies would borrow from the scheme and pay back a loan
after a specified period of time.
It should be noted that the performance of the schemes was adversely affected by very poor
loan recovery, inefficiency and high management costs which consequently led to under per-
formance or collapse. The view that prevailed for many years was that micro borrowers were
too poor to pay back their loans.
Poverty had increased from 33.8 percent in 1999/00 to 37.7 percent in 2002/03. However
government’s target is to have 28 percent of poor in overall population by 2014/2015 (MF-
PED, 2005) [24]).
More needs to be done to ensure that all Ugandans move and stay out of poverty. The cur-
rent Poverty Eradication Action Plan (2004/5 - 2007/8), has one of its major strategic points
as; instituting a micro-finance delivery system relying on Savings and Cooperative Credit
Organizations (SACCOs) which are made up of individuals. Here government lends money
to a SACCO through the MFPED at low interest rates. The organization/SACCO then
divides funds among members. However there should be a mechanism for analyzing whether
SACCOs can be able to pay back the money to the poverty alleviation fund/MFPED.
3

Existing case studies of loan servicing in state credit programs/SACCOs include:- Manual
system, Loan performer application, and Equinox application. These systems are robust in
the scheduling of payment times of borrowers, data storage and are easy to use. However they
do not evaluate the credit worthiness and ability of the SACCOs to pay back loans over time.
The Simulation Model developed by the researcher evaluates the credit worthiness and the
ability of a SACCO to pay back a loan over time. This simulation model caters for ”WHAT
IF” incidences and help the Loan Officer take decisions from an informed point of view
about credible borrowers. Its logical to argue that this simulation model for loan servicing
can be used along side an existing Equinox application with its advantages for better results
when analyzing the credit worthiness of a SACCO. Therefore there was a need to develop a
simulation model that could be used to identify unsound SACCOs.
4

1.2 Statement of the problem
The Government of Uganda has implemented policies geared towards eradicating poverty.
These policies involve lending money to individuals through state credit programs (En-
tandikwa Credit Scheme, Youth Entrepreneurship Scheme, Poverty Alleviation Project, Ru-
ral Farmers Scheme and Cooperative Credit Scheme) which have continuously collapsed due
to inadequate loan repayment to the poverty alleviation fund. Currently a new credit scheme
in which loans are disbursed to Savings Credit and Cooperative Organizations (SACCOs)
has been launched under the Ministry of Finance Planning and Economic Development.
However, there is no system used in assessing the performance of SACCOs that receive loans
from the scheme and their ability to payback these loans. This is an inadequate way of
planning for the poverty alleviation funds. The ministry in its planning and management
approach to these funds has shown a great loophole in this sector hence the need to use
Systems Dynamics as a tool that can analyze borrowers that can / cannot pay back loans
so as to ensure the sustain ability of the poverty alleviation fund.
Poverty Alleviation Dynamic Theory
Figure 1.1: Shows the trend of fighting poverty in Uganda.
The government’s experiences in fighting poverty are represented by Shifting the burden
archetype. Over the years the low standards of living faced by the population have prompted
5
government to introduce new poverty alleviation schemes as a quick solution to alleviating
poverty. The quick solution portrays the government as an entity trying to solve the poverty
problem.
The side effect of introducing new poverty alleviation schemes is that the causes of fail-
ure in administration of previous schemes are not investigated exorbitantly to eliminate the
reoccurance of past mistakes as aresult it leads to the lack of an adequate administration
tool. Despite the fact that government and the development partners through the MFPED
have continually allocated resources to alleviate poverty through poverty alleviation schemes,
poverty still looms among Ugandans. Lack of an adequate administration tool reduces the
chance of getting a fundamental solution, which is an effective poverty alleviation scheme.
However if an adequate administration tool is got an efficient poverty alleviation scheme
will be got. Though it will take some time (delay) before tangible results are seen the low
standards of living will be reduced hence reducing poverty. At the same time there will be
more support for an efficient poverty alleviation scheme. With the cause of failure of previous
schemes the current scheme (SACCOs) can be a success if the past deficiencies are addressed.
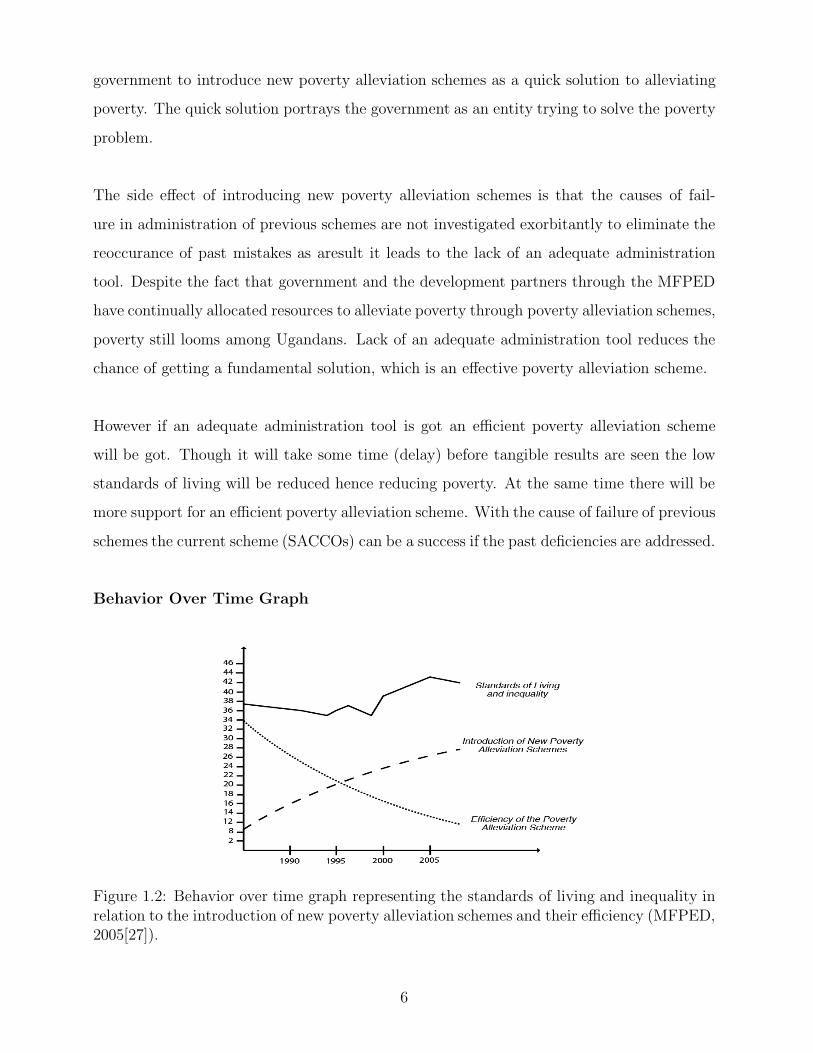
Behavior Over Time Graph
Figure 1.2: Behavior over time graph representing the standards of living and inequality inrelation to the introduction of new poverty alleviation schemes and their efficiency (MFPED,2005[27]).
6
Each time an intervention is made by introducing a new poverty alleviation scheme to re-
duce on the low standards of living a temporary improvement is registered but short lived.
Poverty remains as well as becoming worse.
1.3 Objectives
Main Objective:
The main objective of the study was to develop a Simulation model that can be used to
analyze SACCOs that can / cannot pay back poverty alleviation funds.
Specific Objectives:
(i) To identify shortcomings with the current approaches used in determining SACCOs
that receive loans from the poverty alleviation fund.
(ii) To identify variables for inclusion in the Simulation Model.
(iii) To develop a simulation model as a decision support tool for identifying credible SAC-
COs.
(iv) To validate the simulation model with existing case studies.
1.3.1 Scope
The research focused on analysis of SACCOs and their ability to pay back loans offered by
the Poverty Alleviation Scheme. It also examined the factors, which influenced positively
and negatively the performance of SACCOs. All these were put together to form a simulation
model, from which various simulations were made. The period of study considered is 2000
to 2006.
Area and population study
The study was conducted in Uganda in Kampala district at the MFPED, Post Bank head-
quarters and in Wakiso district at Wakiso Self Help Savings and Credit Cooperative or-
ganization . The office of the SACCOs coordinator at the MFPED and Wakiso Self Help
7
Savings and Credit Cooperative organization officials were visited to gather the necessary
information needed for the research. People from within the SACCO and from outside, were
interviewed so as to gather their experience in the poverty alleviation.
1.3.2 Significance of the study
(i) The simulation model will help loan officers responsible for issuing poverty alleviation
funds make meaningful decisions quickly and from an informed position. Simulation
can improve the education, effectiveness and help to develop the art of decision -
making. Simulation can be used as a facilitator of communicating ideas up and down
with in the organization(Greasley, 2004) [15].
(ii) Sustainability of the poverty alleviation fund will be achieved. The system will be
able to analyze and eliminate unsound SACCOs. In this arrangement credit worthy
SACCOs will be able to receive loans and through effective loan repayment the poverty
alleviation fund will grow because of interest, benefiting a bigger fraction of the pop-
ulation hence poverty alleviation.
(iii) The Simulation Model will lead to better management since the system will be eliminat-
ing unsound SACCOs from receiving loans. Therefore the borrowers will be expected
to meet their repayment commitments without the MFPED alocating much resources
for SACCOs to be closely monitored.
(iv) With the development of a Simulation Model as an analysis and assessment tool, loan
officers will be able to advise SACCOs on how to improve on performance depending
on analysis given by the system. System Dynamics models help to understand the
relationship between behavior patterns and system structure. Problems related to
system behavior can then be solved by changing the system structure (Marquez and
Blanchar, 2004) [26].
(v) To the government of Uganda through the MFPED this study will be applicable in
its planning procedures. Through simulations the MFPED will be able evaluate its
progess on the fight against poverty.
8
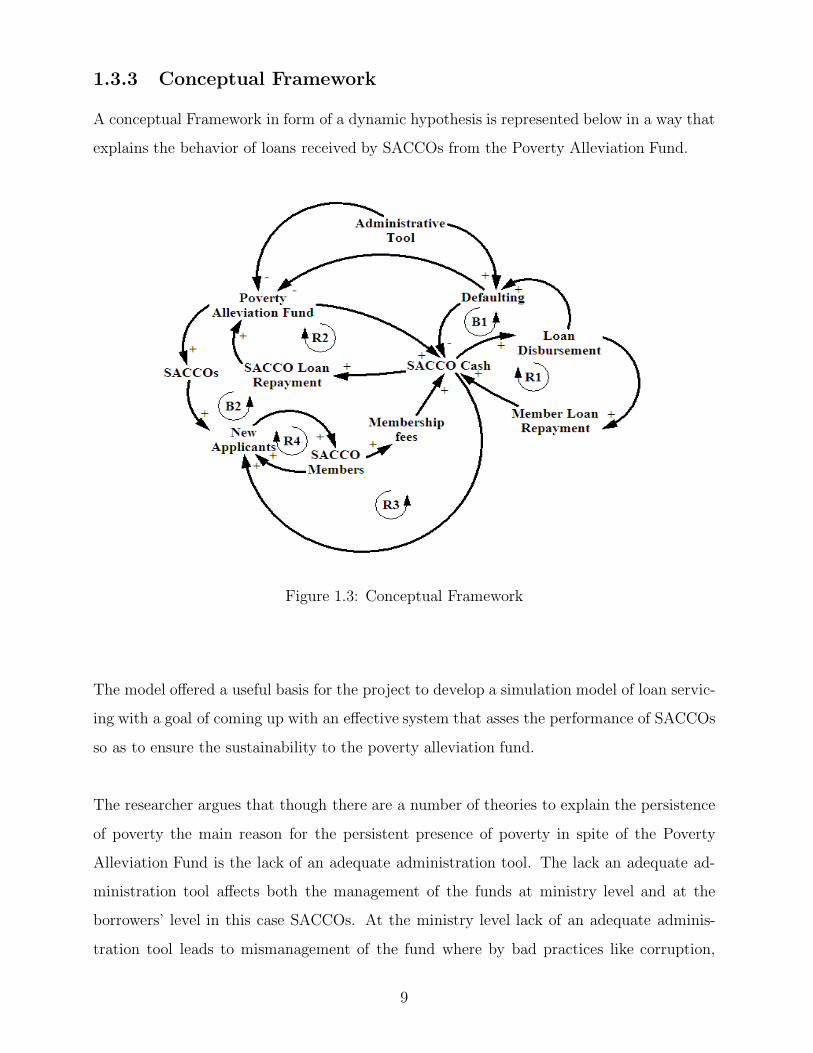
1.3.3 Conceptual Framework
A conceptual Framework in form of a dynamic hypothesis is represented below in a way that
explains the behavior of loans received by SACCOs from the Poverty Alleviation Fund.
Figure 1.3: Conceptual Framework
The model offered a useful basis for the project to develop a simulation model of loan servic-
ing with a goal of coming up with an effective system that asses the performance of SACCOs
so as to ensure the sustainability to the poverty alleviation fund.
The researcher argues that though there are a number of theories to explain the persistence
of poverty the main reason for the persistent presence of poverty in spite of the Poverty
Alleviation Fund is the lack of an adequate administration tool. The lack an adequate ad-
ministration tool affects both the management of the funds at ministry level and at the
borrowers’ level in this case SACCOs. At the ministry level lack of an adequate adminis-
tration tool leads to mismanagement of the fund where by bad practices like corruption,
9

politicking and nepotism are not checked. At the borrowers level the lack of an adequate
administration tool makes monitoring and control of funds impossible, this leads to default-
ing of loans by borrowers. With massive defaulting of members in a SACCO, loans from
the Poverty Alleviation Fund cannot be paid back by a SACCO hence making the Poverty
Alleviation Scheme ineffective. If all SACCOs fail to return the borrowed funds the scheme
collapses.
The following are the relationships that can be drawn from the conceptual framework.
(i) SACCO Cash increases Loan disbursement to members. Loan disbursement in turn
increases the number of members making repayments (Member Loan Repayments) to
the pool (SACCO Cash). This increases the SACCO Cash since members pay back
loans with interest.
(ii) SACCO Cash increases Loan disbursement. Loan disbursement increases the risk of
defaulting cases (Defaulting). Defaulting reduces SACCO Cash.
(iii) When the Poverty Alleviation Fund lends money to a SACCO inform of loans the
SACCO Cash increases. SACCO Cash in turn increases SACCO loan repayment.
SACCO loan repayment with interest increases the poverty Alleviation Fund.
(iv) The ability of a SACCO to mobilize a lot of funds (SACCO Cash) attracts new appli-
cants to the SACCO. New applicants increase the number of SACCO members. An
increase in SACCO members leads to an increase in Membership fees collected. An
increase in membership fees collected increases the SACCO cash.
(v) The availability of the poverty alleviation funds attracts new SACCOs to be formed
so as to benefit from the loans. SACCOs formed and have received loans attract new
applicants to the SACCO. New applicants lead to an increase in SACCO members.
An increase in SACCO members leads to an increase in membership fees collected. An
increase in membership fees collected lead to an increase to SACCO cash. SACCO cash
increases SACCO loan repayment. SACCO loan repayment with interest increases the
Poverty Alleviation Fund.
10
(vi) An inadequate administration tool of the management and oversight of the Poverty
Alleviation Fund leads to the loss of funds or collapse of the fund making it ineffective
in alleviating poverty. An inadequate administration tool at the same time reduces
the ability of SACCOs to monitor their activities effectively leading to defaulting of
members hence making a SACCO unable to pay back poverty alleviation funds.
1.3.4 Research Contributions
This Project Report made a contribution to the literature in terms of analyzing SACCOs
that can / cannot pay back poverty alleviation loans to the Ministry of Finance Planning and
Economic Development. The resulting tool will help SACCO Loan Managers at the MFPED
cut down debates on decisions regarding applicant SACCOs to receive poverty alleviation
funding, reduce loan losses and help researchers analyse related problems.
11
Chapter 2
LITERATURE REVIEW
Introduction
In this Chapter the researcher reviewed literature on loans, loan systems, system dynamics /
simulation and poverty in Uganda and abroad in the quest of developing a simulation model
based on standards and facts. This was of essence in developing a system that evaluates
credit worthy SACCOs putting the conditions / complexities of Uganda into perspective.
2.1 Review of Loan Servicing Case Studies
The researcher in this part presents loan servicing case studies that have been used in state
credit programs by lending authorities in Uganda. They include the following:-
(i) Manual System
At the time of launching the Entandikwa Credit Scheme and the Youth Entrepreneur-
ship scheme in the 1990s, loan accounting systems were not available to Lenders situ-
ated at county level. Lenders were relying on the ordinary manual system evaluating
the credit worthiness of potential borrowers. Given the lack of proper documentation
of financial records of potential borrowers (small entrepreneurs) and the high demand
of State loan (Entandikwa) the lenders were undergoing tremendous pressure of a slow
complex system which they couldn’t manage efficiently hence severe loan losses.
(ii) Loan Performer Application
With the introduction of the Poverty Alleviation Project (PAP) lenders were to use
the Loan Performer Application. Some of the major weakness with this application
included the following:- The application was slow and continuously broke down. When
12

repayments of loans in arrears were made twice in a day Loan Performer got confused
regarding the balances. If the user imported a pre-payment for a loan on declining
balance with interest recalculated, this resulted in negative principal balances (Loan-
performer, 1993)[25]. The system could not help the lender make analysis on ”WHAT
IF” incidences and credit worthiness of borrowers. In fact this system did not perform.
(iii) Equinox
Equinox is the application used to schedule payment times and identify SACCOs in
arrears. However it should be noted it doesnot evaluate the credit worthiness of a
SACCO. Its robust with the ability of handling complex and huge number of accounting
tasks (Equinoxco, 2004)[10]. It can be centralized through the use of the network.
However just like Loan Performer it can not carry out analysis under ”WHAT IF”
incidences.
System Dynamics Simulation Modeling has alternatively been identified as the available so-
lution of credible SACCO evaluation. Given the uncertainities(”WHAT IF”) factors that
occur in everyday business dealings a simulation Model is best positioned to handle any
changes in the business environment and its impact on a SACCO over time. System Dy-
namics mimics the dynamic world we leave in.
Most simulation models are computer-based models that perform a series of calculations
under a range of scenarios and assumptions. Simulation models project future cash flows,
income, and expenses. These assumptions include different loan growth and funding plan
scenarios and other assumptions about how a banks assets and liabilities will be replaced.
They can be used to measure risk from either an earnings or economic perspective. The
models simulate or project a banks risk exposure under a variety of assumptions and scenarios
and, thus, can be used to isolate sources of a banks risk exposure or quantify certain types
of risk. To do so, a bank performs a series of simulations and applies different assumptions
and scenarios to each simulation (Piget and Oslo, 1998) [35].
In a previous study (Welch et al., 1990 [43] examined how computer simulation can generate
quality. This can be a good methodology for eliminating unreliable SACCOs and businesses
from acquiring poverty alleviation fund loans.
13
(Bruce and Simon, 1992)[6] demonstrated how computer simulation, instead of algebraic
calculations, can replace some simple binomial calculations.
Successfully introducing a product / State loan scheme based on a new technology can give
company/MFPED significant advantages and ability to drive down the cost (Kim and Coyle,
1993)[22]. IT-enabled transactions (loan servicing predictions) help organizations / MFPED
create value by enhancing interaction with suppliers and customers (Glazer, 1993)[14].
2.2 System Dynamics/Simulation Models in Credit Eval-
uation
The Use of System Dynamics Models to evaluate the Credit Worthiness of Firms (Alfredo
and Raed, 2004) [3] was developed to evaluate credit worthy firms in Jordan that would ben-
efit from bank loans. More and more, small firms could have credit without serious check
of their credit status due to the weakness in the risk assessment approaches that existed.
This expansion policy increased the default rate and number of bankruptcy cases. These
problems required different ways to help the credit officers in banks to understand the credit
worthiness of firms.
The researcher has realized a close link in the quest of identifying credit worthy firms in
Jordan and credit worthy SACCOs in Uganda all in an effort of identifying bad creditors
since there are no strong risk assessment approaches that exit.
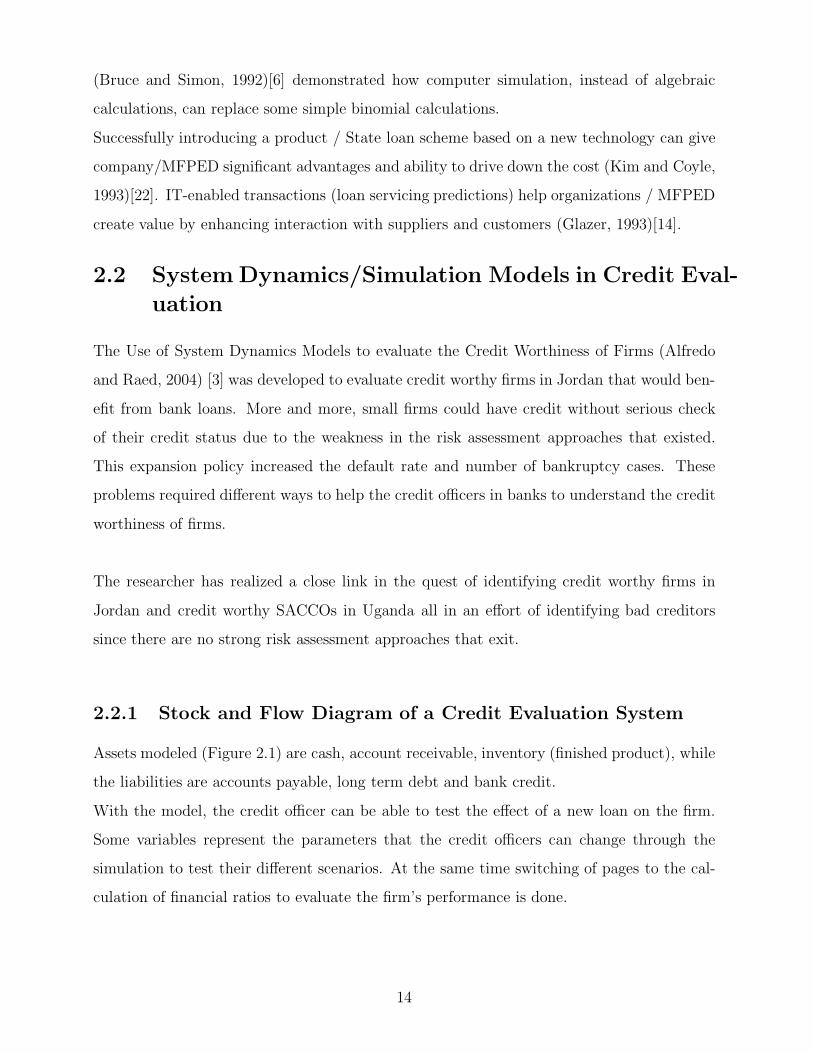
2.2.1 Stock and Flow Diagram of a Credit Evaluation System
Assets modeled (Figure 2.1) are cash, account receivable, inventory (finished product), while
the liabilities are accounts payable, long term debt and bank credit.
With the model, the credit officer can be able to test the effect of a new loan on the firm.
Some variables represent the parameters that the credit officers can change through the
simulation to test their different scenarios. At the same time switching of pages to the cal-
culation of financial ratios to evaluate the firm’s performance is done.
14

Figure 2.1: The figure shows the structure of the cash, bank credit and account receivables.
However the researcher discovered this model developed in Jordan is shallow since it does
not critically represent entities outside an organization that affect a firm and its credit wor-
thiness in the long run.
2.2.2 Running of a Simulation
It is based on System Dynamics model which allows the analyst to:
(i) Use the firms finances as inputs to calculate the financial ratios for the current financial
situation and before obtaining the new loan.
(ii) Allow the analyst or the user to measure the firms performance under different what - if
scenarios through the changes in its financial ratios when implementing these scenarios.
(iii) Allow the credit officer to analyze the firm’s loan application through simulating the
impact of the requested loan on the firm’s future performances.
A Simulation Model of Loan Servicing for Savings and Credit Cooperative organizations
developed in this project registers the successes of running the simulation of the Jordanian
model as well as other benefits such as aspects of business life like delays and many others
15

are reflected.
Its on the basis of this simulation (Jordanian model) as an insight that a Simulation of
Model of loan servicing for SACCOs was developed though with different parameters that
represent the state of SACCOs in Uganda.
2.3 Modeling and Simulation Systems
System Dynamics Simulation Modeling is based on understanding the formulations, devel-
oping the causal loop diagrams, developing the stocks and flows diagrams, validation, and
testing. Causal loop diagrams are the basis on which the SD model is built. They depict,
graphically, the interactions and cause-and-effect relationships among the different system
parameters (Hines, 2000)[17].
Computer simulation, has become a useful part of modeling many systems in economics to
gain insight into the operation of those systems. Computer simulations are often considered
to be human out of the loop simulations (Richardson, 1995)[36].
The three essences for all computer simulation models are theory, data and program. To
develop a computer model to simulate the behavior of a system, detailed knowledge (theory
and data) about that system are fundamental. A given computer program is thus the main
tool to express the logic of theory in computer codes (Chi, 2000)[8]. Simulation in the study
having occured, theory about loan servicing was analyzed, the data about the methodology
followed to disburse funds was evaluated so as to come out with a model that aids decision
makers to determine borrowers that can/cannot service loans.
Further more (Aghie and Popplewell, 1997)[1] notes that, computer simulation has been clas-
sified as one of the best problem-solving tools, permitting experimentation with a model. It
has been pointed out also that simulation is an excellent tool for forecasting outcomes, an-
alyzing entire problems and finding total solutions, economically. These capabilities should
help managers to implement correct decisions first time.
16

Simulation is one of the most powerful analysis tools available to those responsible for the
design and operation of complex systems. (Welgama and Mills, 1995)[44] State that, it
is a method that ”mimics” the operating behaviour of the system. Some of the benefits
of simulation are the possibility of exploring new policies, operating procedures and so on,
without disrupting ongoing operations, and the ability to gain insights into system variables.
Simulation involves the process of abstraction, construction of the model and conducting
experiments.
2.4 Strengths and weaknesses of simulation
2.4.1 Strengths of simulation
Computer simulation techniques, developed over 30 years, are recognized as a powerful
tool used to understand and resolve even very complex problems (Aghaie and Popplewell,
1997)[1].This underscores the need to use Simulation for determining SACCOs that can pay
back poverty alleviation funds.
(Greasley, 2004)[15] suggests that simulation can improve the education, effectiveness and
help to develop the art of decision-making. Furthermore, he proposes its use as a facilitator
of communicating ideas up and down within an organization. This is a clear indication that
Simulation will help loan officers at MFPED make quick decisions.
Simulation has been successfully used in statistical process control (SPC) (Aghaie and Pop-
plewell, 1997)[1].
Simulation is an important decision making and problem-solving tool that according to
(Holst and Bolmsj, 2001)[18] finds its typical application in three main areas such as:
(i) Explorative studies of existing systems to improve them;
(ii) Studies of existing systems with some changes made to them, similar to the first purpose
but used to validate a specific alternative, e.g. proposed investment; and
(iii) Design and validation of new systems
17

A good simulation model can reliably predict the performance of the existing system under
different conditions. In the practical cases described by (OKane, 2004)[31], simulation models
were then developed to simulate alternative ”what-if” scenarios. (Greasley, 2004)[15] used
simulation, in a practical case, to predict improvements in the system performance.
By analysing the beahviour of the system and considering the goals and objectives of the sys-
tem, it is possible to enhance system design. Simulation can virtually guarantee the design
of better performing manufacturing facilities Greasley (2004)[15]. Designing manufacturing
systems before implementing them in practice is a task that simulation modeling is ideally
suited to (Baldwin et al., 2000)[4].
Simulation models can be more realistic. A simulation model can accommodate various
business forecasts and allow flexibility in running sensitivity analyzes. For instance, basis
risk can be evaluated by varying the spreads between the indices the bank uses to price its
products.
Perhaps the strongest advantage of simulation models is that they can present risk in terms
that are meaningful and clear to senior management and boards of directors.
Simulation models can vary greatly in their complexity and accuracy. As the cost of com-
puting technology has declined, simulation models have improved. Some simulation models
can:
(i) Handle the intermediate principal amortizations of products such as installment loans.
(ii) Handle caps and floors on adjustable rate loans and prepayment of mortgages or
mortgage-backed securities under various interest rate scenarios (embedded options).
(iii) Handle nonstandard swaps and futures contracts.
(iv) Change spread relationships to capture basis risk.
(v) Model a variety of interest rate movements and yield curve shapes.
(vi) Test for internal consistency among assumptions.
(vii) Analyze market or economic risk as well as risk to interest income.
18
2.4.2 Weaknesses of Simulation
System dynamics are more accessible to a wider range of people and practically are often
used to clarify conceptual relationships before the formal models are introduced. However,
casual loop diagrams have some problems in addressing system dynamics issues. Firstly,
casual loop diagrams cannot effectively address delays an important notion in the field of
system dynamics. A simple cross over the link can qualitatively indicate the existence of
a delay, but it cannot show the magnitude of the delay. Its limitation in terms of quan-
tities representation also applies to other building blocks of causal loop diagrams, such as
positive and negative signs. This is also an essential and natural part of SD research. In
addition, a crux problem with causal loop diagrams is that they make no distinction between
information links and rate-to-level links (Richardson, 1986)[37]. In the future work, formal
quantitative models will be applied to address quantitative relationships.
Although offering greater versatility than the alternatives, simulation is not always objec-
tive. A simulation can misrepresent the banks current risk position because it relies on
managements assumptions about the banks future business.
The myriad of assumptions that underlie most simulation models can make it difficult to
determine how much a variable contributes to changes in the value of the target account.
For this reason, many banks supplement their earnings simulation measures by isolating
the risk inherent in the existing balance sheet using gap reports or measurements of risk
to the economic value of equity. In measuring their earnings at risk, many bankers limit
the evaluation of their risk exposures to the following two years because interest rate and
business assumptions that project further are considered unreliable. As a result, banks that
use simulation models with horizons of only one or two years do not fully capture their long-
term exposure. A bank that uses a simulation model to measure the risk solely to near-term
earnings should supplement its model with gap reports or economic value of equity models
that measure the amount of long-term repricing exposures (Piget and Oslo, 1998)[35].
19
2.5 State of the art and practice in loan servicing
Loan servicing
Is a term referring to the steps taken to maintain a loan from the time it is closed until the
last payment is received and the obligation is paid. Steps may include billing the borrower,
collecting payments, escrowing tax and insurance payments, and making contract changes
(Heartland, 2006) [16]. On the other hand Loan servicing is refered to as the act of collecting
loan payments, handling property tax and insurance escrows, fore closing on defaulted loans
and remitting payments to the investors (Fairvalley, 2006) [11].
2.5.1 Loan Products
Some of the loan products provided include the following:-
(i) Working capital loans. These loans are targeted to individuals who have an enterprise
that is not the primary means of generating income for the individual. Working capital
loans are designed for investing in activities that support the enterprise’s business cycle.
(ii) Welfare loans. These loans are designed to respond to life cycle crises that members
have to deal with. These loans take care of needs such as education, medical expenses,
legal fees etc. Members have to stipulate the reason for which they are taking the loan
in order to quality for consideration.
(iii) Development loan. These are loan capital investment that are made presumably to
increase the holding of productive land, building houses, purchasing inputs. It’s a
financing instrument with a term of a minimum of five years.
2.5.2 Loan servicing tips
(i) Posting protocol: Adopt a standard payment application protocol (e.g. late fee, inter-
est, then principle) common in most servicing systems.
(ii) Ticklers: Ensure post - closing follow-up items are addressed, e.g. annual financial
statements, tax payments and filling.
(iii) Data quality and data integrity: Set - up loans timely and accurately pre/post closing
and compare terms to loan documentation. Any loan modifications should be immedi-
20
ately updated In system to avoid future payment posting discrepancies that can affect
repayment history records.
(iv) Immediate application of funds received: Post payments received as soon as practical
to limit number of returned payments (insufficient funds) and loan delinquencies. Post
using effective date of payment (i.e. date payment received). Encourage Automated
clearing House or electronic funds transfer payment whenever possible to ensure timely
payment receipt from borrower.
(vi) Variable rate loans: Use common index that investors are accustomed to purchasing.
Ensure index rate is updated when rates change and that proper rate is utilized to
avoid future principal and interest payment allocation issues (Wallstreet, 2006)[42].
2.5.3 Characteristics of loans
From the supply side, loans are provided with the following being the standard requirements
that borrowers are supposed to meet.
(i) Loan size. Maximum loan size is based on one’s ability to repay.
(ii) Collateral for the loans. These may include shares, guarantors or other assets.
(iii) Loan term. This depends on the agreed time frame.
(iv) Loan fees. These may include loan appraisal fees.
(vi) Equity requirements
(vii) Loan repayment dates/times.
2.6 Poverty Alleviation
2.6.1 How income poverty is measured.
Using a national survey on household expenditure (which has been conducted in most years
since 1992), statisticians calculate the real household expenditure per adult equivalent. This
measure includes home-produced food as well as goods purchased from the market, and ad-
justs household size for the number of people of different ages, to give an accurate reflection
21
of the relation between the household’s total expenditure and its members’ consumption
needs. It also corrects for inflation. Households whose real expenditure per adult equivalent
falls below a given level (the poverty line) are considered poor. The poverty line used in
Uganda is an absolute, not a relative one; it measures the level of expenditure needed to
secure basic food consumption needs (taking into account regional variations in food prices)
and a corresponding level of non-food consumption. Poverty can be measured by the head-
count -the proportion of people below the poverty line -or by the poverty gap and depth of
poverty, which also takes into account the distance below the poverty line (MFPED, 2005)
[27].
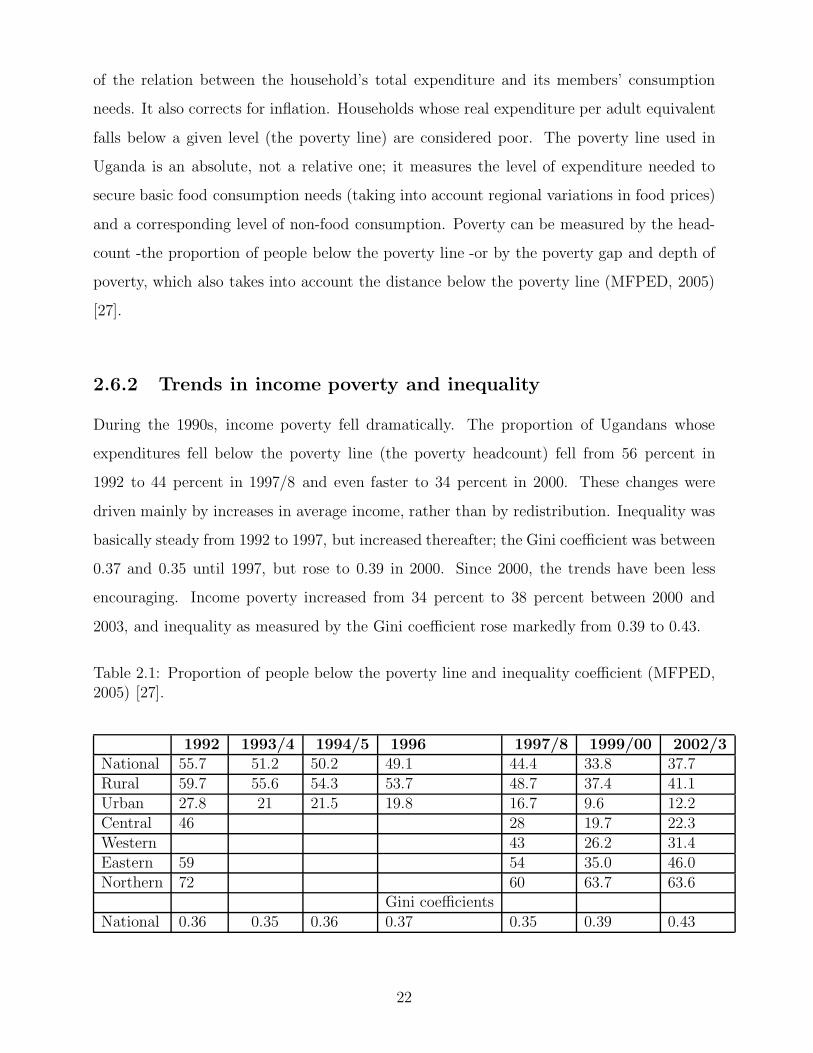
2.6.2 Trends in income poverty and inequality
During the 1990s, income poverty fell dramatically. The proportion of Ugandans whose
expenditures fell below the poverty line (the poverty headcount) fell from 56 percent in
1992 to 44 percent in 1997/8 and even faster to 34 percent in 2000. These changes were
driven mainly by increases in average income, rather than by redistribution. Inequality was
basically steady from 1992 to 1997, but increased thereafter; the Gini coefficient was between
0.37 and 0.35 until 1997, but rose to 0.39 in 2000. Since 2000, the trends have been less
encouraging. Income poverty increased from 34 percent to 38 percent between 2000 and
2003, and inequality as measured by the Gini coefficient rose markedly from 0.39 to 0.43.
Table 2.1: Proportion of people below the poverty line and inequality coefficient (MFPED,2005) [27].
1992 1993/4 1994/5 1996 1997/8 1999/00 2002/3National 55.7 51.2 50.2 49.1 44.4 33.8 37.7Rural 59.7 55.6 54.3 53.7 48.7 37.4 41.1Urban 27.8 21 21.5 19.8 16.7 9.6 12.2Central 46 28 19.7 22.3Western 43 26.2 31.4Eastern 59 54 35.0 46.0Northern 72 60 63.7 63.6
Gini coefficientsNational 0.36 0.35 0.36 0.37 0.35 0.39 0.43
22

There has been extensive discussion of the relation of these findings to participatory evidence.
While the participatory data show less perceived improvement, this arises partly because
the period of comparison was different. While most Ugandan households in 2000 were
economically better off than they had been in 1992, they were not necessarily better off than
they or their parents had been in the 1960s or early1970s, because of the decline in incomes
during the 1970s and early 1980s. The Gini coefficient results have a number of implications
for poverty in the period 2000-2003:
(i) Poverty rose in almost all regions of the country, with a particularly sharp rise in the
East. However, the North (in which poverty fell slightly, although it must be noted
that the sample excludes the insecure areas of Pader, Kitgum and Gulu) remains the
poorest region in the country.
(ii) The regional shares of population changed markedly, with an increase in the share of
the East and a reduction in the share of the North. This partly reflects the movement
of some displaced persons to the East because of insecurity.
(iii) Inequality increased markedly, with the Gini coefficient rising from 0.39 to 0.43.
(iv) The sectoral shares of household heads changed dramatically, with a major shift out of
crop agriculture. This may be partly due to a change in the sample, although the share
of households owning land is constant across the two surveys. This is accompanied by
a large drop in consumption of home-produced food, while consumption of purchased
food increased.
The increase in poverty is particularly marked for households in crop agriculture, although
other sectors such as trade and hotels also show large increases. By contrast, workers in
government services experienced reductions in poverty (MFPED, 2005) [27].
2.6.3 Role of Empowerment in Poverty Alleviation
The steps taken by Government through various social policies and programmes for disad-
vantaged groups like, women, widows, the youth, the elderly, neglected children and orphans,
23
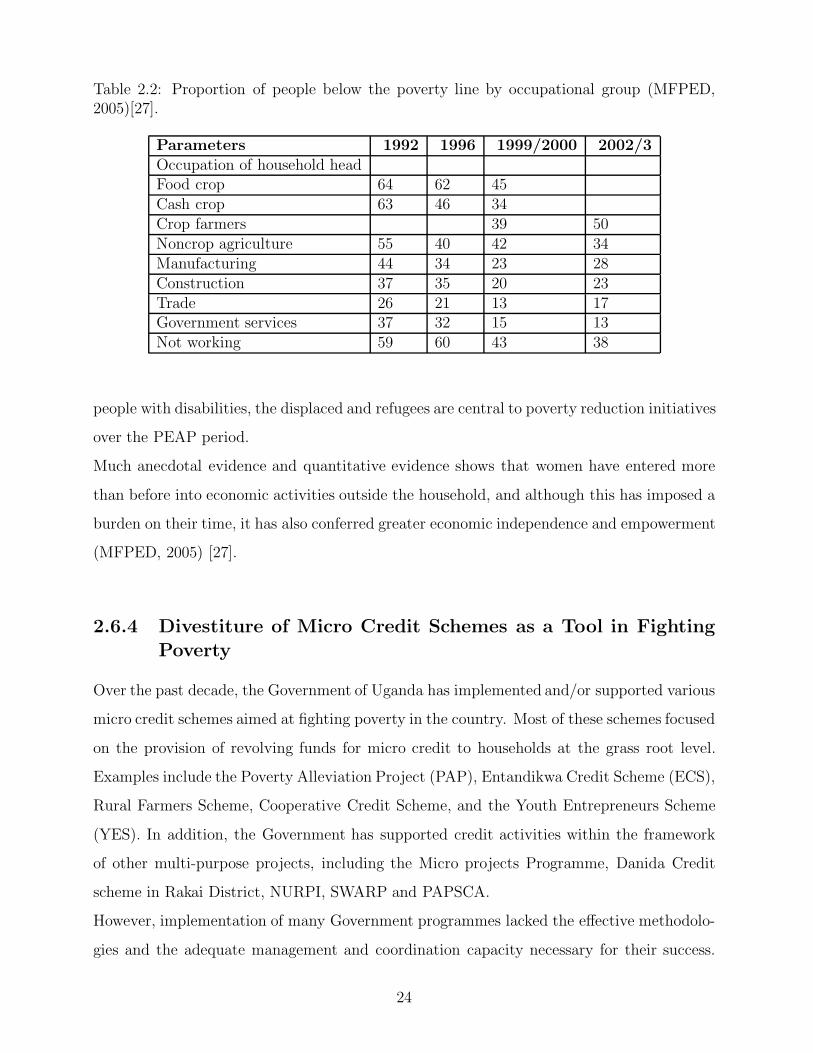
Table 2.2: Proportion of people below the poverty line by occupational group (MFPED,2005)[27].
Parameters 1992 1996 1999/2000 2002/3Occupation of household headFood crop 64 62 45Cash crop 63 46 34Crop farmers 39 50Noncrop agriculture 55 40 42 34Manufacturing 44 34 23 28Construction 37 35 20 23Trade 26 21 13 17Government services 37 32 15 13Not working 59 60 43 38
people with disabilities, the displaced and refugees are central to poverty reduction initiatives
over the PEAP period.
Much anecdotal evidence and quantitative evidence shows that women have entered more
than before into economic activities outside the household, and although this has imposed a
burden on their time, it has also conferred greater economic independence and empowerment
(MFPED, 2005) [27].
2.6.4 Divestiture of Micro Credit Schemes as a Tool in Fighting
Poverty
Over the past decade, the Government of Uganda has implemented and/or supported various
micro credit schemes aimed at fighting poverty in the country. Most of these schemes focused
on the provision of revolving funds for micro credit to households at the grass root level.
Examples include the Poverty Alleviation Project (PAP), Entandikwa Credit Scheme (ECS),
Rural Farmers Scheme, Cooperative Credit Scheme, and the Youth Entrepreneurs Scheme
(YES). In addition, the Government has supported credit activities within the framework
of other multi-purpose projects, including the Micro projects Programme, Danida Credit
scheme in Rakai District, NURPI, SWARP and PAPSCA.
However, implementation of many Government programmes lacked the effective methodolo-
gies and the adequate management and coordination capacity necessary for their success.
24

As a result, the performance of the schemes was adversely affected by very poor loan recov-
ery, inefficiency and high management costs which consequently led to under-performance
and/or collapse (Nannyonjo and Nsubuga, 2004)[28].
The government’s own credit programmes (Entandikwa and PAP) suffer badly from being
government run. Both are viewed as unsuccessful and as having contributed further to a
dependency culture. While there is evidence that PAP has learned some lessons and has
begun to achieve a minimum of financial success, there remain bureaucratic and political in-
terference, operational inefficiencies, lack of logistical support, poor motivation among front
line workers, and undue complexity of goals and missions (Ditcher and Kamuntu, 1997) [9].
2.6.5 Role of Decentralization in Fighting Poverty
Decentralized government structures are central to Uganda’s mode of governance as spelt
out in the 1995 Constitution and the 1997 Local Government Act. Moreover, the decentral-
ization process is at the heart of the Poverty Eradication Action Plan, which sets out the
strategy through which the GOU aims to eradicate poverty. The GOU has over the years
strengthened the decentralized structures through increasing their autonomy, and widening
their participation in decision making in order to enhance the efficiency and effectiveness in
allocation of resources towards the achievement of the PEAP objectives in line with local
priorities. The government also recognizes that effective monitoring and evaluation is essen-
tial for ensuring that budgetary allocations are fully translated into outputs and outcomes.
To this effect, the GOU has put in place a monitoring network comprising representatives
from the central government, line ministries, donors and the civil society. In addition, efforts
have been made to improve transparency and accountability by stepping up public informa-
tion through the media and use of notice boards in public places such as schools and places
of worship. Strong decentralized structures will facilitate the work of CDWs and FEWs
through better coordination and wider participation (Nannyonjo and Nsubuga, 2004) [28].
25

2.6.6 Impact of credit in Poverty Alleviation
Credit is considered to be an essential input to increase agricultural productivity, mainly
land and labour. It is believed that credit boosts income levels, increases employment at the
household level and thereby alleviates poverty. Credit enables poor people to overcome their
liquidity constraints and undertake some investments, especially in improved farm technol-
ogy and inputs, thereby leading to increased agricultural production. Furthermore credit
helps poor people to smooth out their consumption patterns during the lean periods of the
year. By so doing, credit maintains the productive capacity of poor rural households. The
World Bank in also observed that improved consumption is an investment in the productiv-
ity of the labour force (Okrut et al., 2004) [32].
2.7 Loan Recovery
With regard to the unsuccessful GOU Entandikwa scheme, there is need for efforts to recover
the outstanding loans as writing them off will not only have negative effects on the entire
private sector micro finance industry, but will also result in increased and willful default-
ing. One option for the GOU is to hand over the portfolio to court bailiffs, lawyers and/or
the Non Performing Assets Recovery Trust (NPART), which will continue recovery of the
loans. Another option is to sale the loan portfolio to financial institutions, which will pro-
vide additional financial services to the clients subsequent to full recovery of the outstanding
Entandikwa loans (Nannyonjo and Nsubuga, 2004)[28].
2.8 Targets
The income-based interpretation of the poverty reduction goal is the PEAP target of reduc-
ing the incidence of household poverty to 10 percent by 2017. In comparison, the Millennium
Development Goal for poverty eradication translates into a target of 28 percent poverty by
2015. This target is considerably less ambitious than the PEAP target (Uganda Debt Net-
work, 2003) [41].
26
2.9 Critique on the Literature
The study identified a need for a methodology for analyzing SACCOs at MFPED that
can/cannot pay back loans from the poverty alleviation fund. System dynamics is repre-
sented as the suitable methodology for analysis in the project.
2.10 Conclusion
The researcher identified that System Dynamics was used in a number financial institutions
successfully. The development and use of System Dynamics as an analysis/ assessment tool
will therefore be of significant importance to the MFPED.
27

Chapter 3
METHODOLOGY
3.1 Review of methodologies
The researcher explored three methodologies of research which included Case Study, Viable
Systems and Dynamic Synthesis. A comprehensive study was done about the three method-
ologies to select the best to be used in the development of the research. Dynamic synthesis
was selected as the most appropriate methodology to be used in the research as others had
serious shortcomings.
Table 3.1: Rankings of the three explored methodologies.
No. Functionality Case Study Viable Systems Dynamic Synthesis1 Accuracy YES YES YES2 Focus YES YES YES3 Non Biased NO NO YES4 Ease to use YES NO YES5 Inclusive NO NO YES6 Ranking 2 3 1
3.1.1 Case Study.
Case Study is an exploratory (single in-depth study) or explanatory (cross-case analysis) re-
search strategy, which involves an empirical investigation of a particular contemporary phe-
nomenon within its real life context using multiple sources of evidence (Williams,2000)[48].
A frequent criticism of case study methodology is that its dependence on a single case ren-
ders it incapable of providing a generalizing conclusion. It is also stated that they can also
lead to bias (Williams, 2004) [46].There are no really good methodological frameworks for
28

conduct of case studies or use of case study research.
3.1.2 Viable Systems
Viable Systems Methodology (VSM) posists an organizational structure which must exist in
order for an entity to be viable i.e. able to survive.
3.1.3 Dynamic Synthesis Methodology
Dynamic Synthesis Methodology refers to the integration of theoretical concepts and struc-
turing of parts and elements of a process over time in such a manner to form a formal
functional entity, underpinned by synthesis as philosophy of science. (Williams, 2004)[46]
The researcher used Dynamic Synthesis Methodology which is the tested methodology used
by advanced modelers. Williams(2004)[46 ] States that the Dynamic Synthesis Methodol-
ogy is grounded on well tested and developed theoretical anchors and builds on an existing
epistemological philosophy of science in the acquisition of knowledge, as a basis for theory
building and extension in the field of System dynamics.
Combining case study and System dynamics modeling makes Dynamic Synthesis Method-
ology a powerful empirical research method that potentially makes useful contribution to
body of System Dynamics (Williams, 2004)[46].
The Dynamic Synthesis Methodology (DSM) includes six iterative research process phases,
namely: Problem Statement, Field Studies, System Dynamics Model Building, Case Studies,
Simulation Experiments and Model Use and Theory Extension. The process diagram that
outlines this iterative research process, which was used to conduct the research study, is
illustrated below.
29
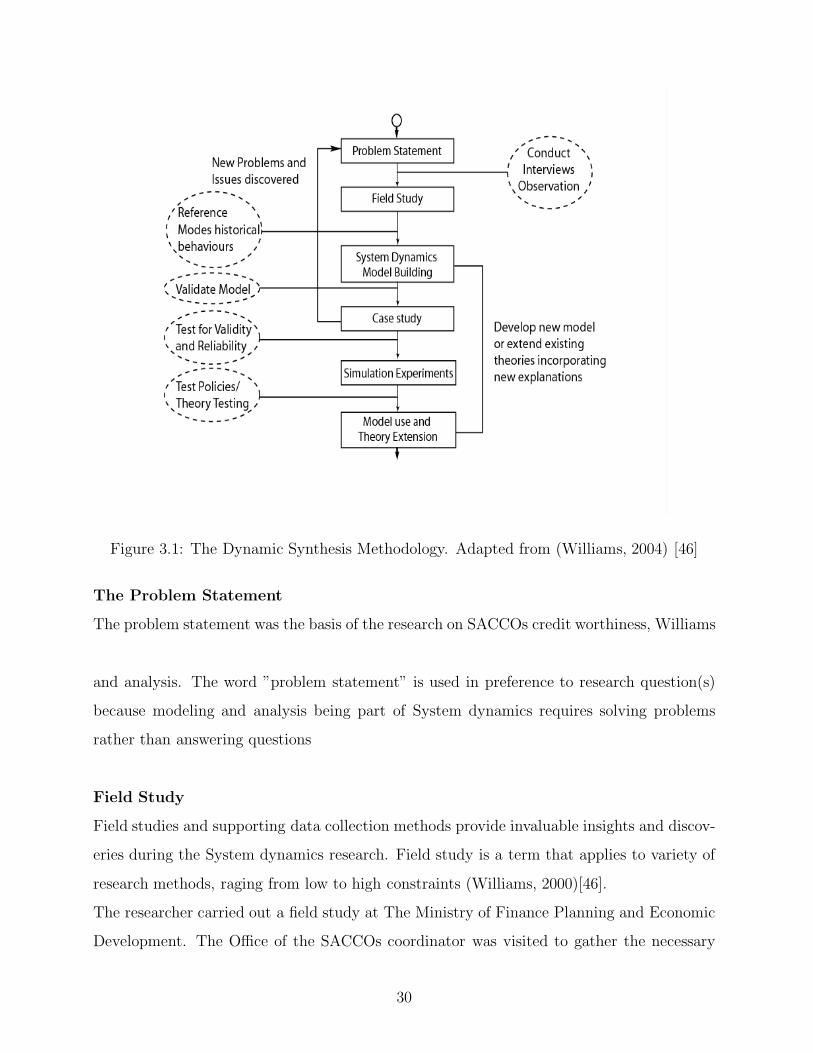
Figure 3.1: The Dynamic Synthesis Methodology. Adapted from (Williams, 2004) [46]
The Problem Statement
The problem statement was the basis of the research on SACCOs credit worthiness, Williams
(2004)[46] states that the statement of the problem is an important early phase in modeling
and analysis. The word ”problem statement” is used in preference to research question(s)
because modeling and analysis being part of System dynamics requires solving problems
rather than answering questions
Field Study
Field studies and supporting data collection methods provide invaluable insights and discov-
eries during the System dynamics research. Field study is a term that applies to variety of
research methods, raging from low to high constraints (Williams, 2000)[46].
The researcher carried out a field study at The Ministry of Finance Planning and Economic
Development. The Office of the SACCOs coordinator was visited to gather the necessary
30
information.
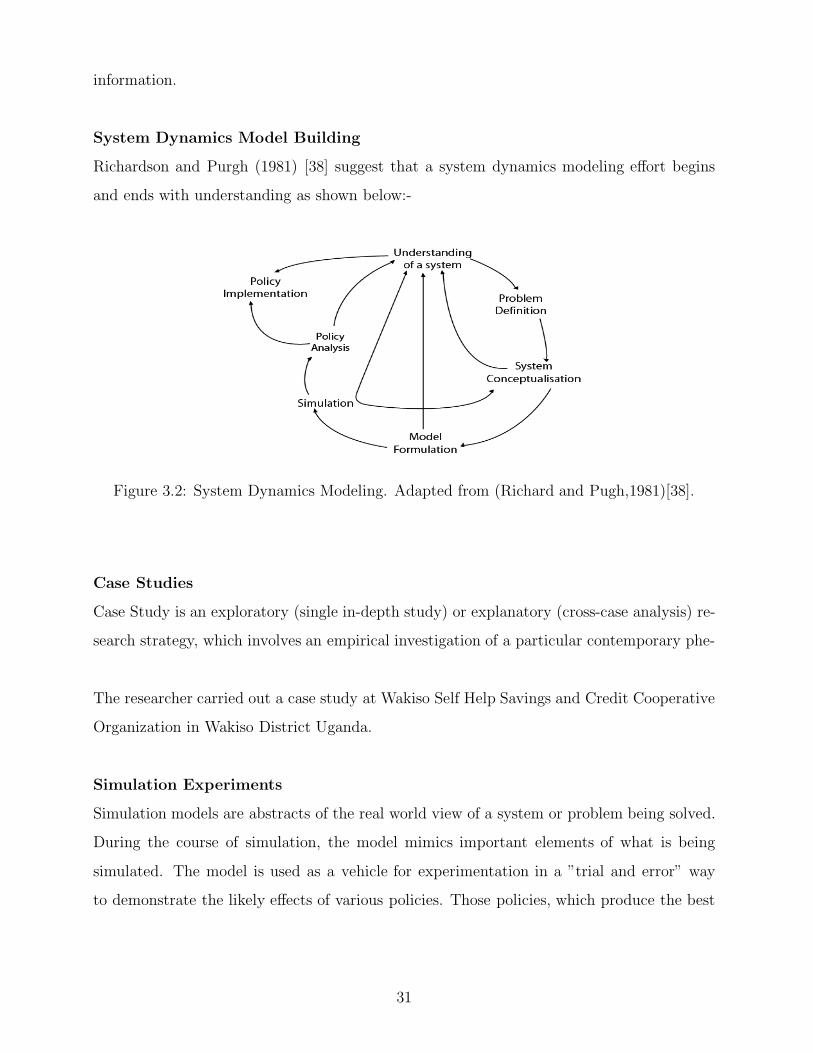
System Dynamics Model Building
Richardson and Purgh (1981) [38] suggest that a system dynamics modeling effort begins
and ends with understanding as shown below:-
Figure 3.2: System Dynamics Modeling. Adapted from (Richard and Pugh,1981)[38].
Case Studies
Case Study is an exploratory (single in-depth study) or explanatory (cross-case analysis) re-
search strategy, which involves an empirical investigation of a particular contemporary phe-
nomenon within its real life context using multiple sources of evidence (Williams,2000)[48].
The researcher carried out a case study at Wakiso Self Help Savings and Credit Cooperative
Organization in Wakiso District Uganda.
Simulation Experiments
Simulation models are abstracts of the real world view of a system or problem being solved.
During the course of simulation, the model mimics important elements of what is being
simulated. The model is used as a vehicle for experimentation in a ”trial and error” way
to demonstrate the likely effects of various policies. Those policies, which produce the best
result in the model, will be implemented in real life (Williams,2004)[46].
31
Model Use and Theory Extension
The System dynamics modeling approach takes a philosophical position that feedback struc-
tures are responsible for the changing patterns of behaviour we experience in complex prob-
lems. System Thinking /System Dynamics notation can be used to model and test different
hypotheses propounded about RE process modeling and analysis. A dynamic hypothesis,
can be tested verbally, or as a causal loop diagram or as a stock and flow diagram. In view of
SD’s capacity to deal with the dynamic complexity created by interdependencies, feedback,
time delays and non-linearity (Williams,2000)[46].
3.2 How the specific objectives were achieved
The specific objectives are listed below and the techniques that were used to achieve them
are laid out as follows:-
3.2.1 Identify shortcomings with the current approaches
Data Collection Methods
The researcher used interviews and reviewing existing literature on the shortcomings with
current approaches used in loan disbursement to SACCOs.
The researcher conducted interviews with two MFPED officials that took decisions and
oversaw loan disbursement to SACCOs. An interview guide was used and questions were
designed to enable interviewees air out deficiencies with the current approaches of loan dis-
bursement. This helped to gain an insight into major problems as well as offering solutions.
Interviews also allowed the researcher access first hand information and also established a
relationship with the interviewees.
Existing documentation were reviewed which included Reports, Papers and Journals etc. at
the MFPED and World Bank libraries regarding approaches that were used in determing
SACCOs that received Poverty Alleviation Funds were incorporated in the report.
Observation enabled the researcher crosscheck the validity and accuracy of information gath-
ered through interviews and reviewed literature.
32

3.2.2 Identify Variables
The variables used in the simulation model were got through reviewing of literature and
interviews with the use of an interview guide.
3.2.3 Simulation Model Development
Simulation Model Development involved both Design and Implementation. The Design or
blue print of a simulation is the Causal loop diagram. It was drawn showing the cause and
effect tendencies of SACCO activities, this then lead to Implementation.
The methodology that was used in the implementation of the project, is Systems Dynamics
its based on the use of simulation models. Systems Thinking Educational Learning Labora-
tory with animation (STELLA) is a computer simulation program which was used to develop
models. STELLA provides a framework and an easy-to-understand graphical interface for
observing the quantitative interaction of variables within a system. The graphical interface
was used to describe and analyze very complex mathematical systems.
In Implementation A systems dynamics model was built based on the field study results
which provided a descriptive model. The Causal Loop Diagrams, was later converted to
stock and flow diagrams which is a formal quantitative model of the problem in question.
Mathematical relationships between and among variables which enable the simulation of the
model are defined after which simulations of the key variables are run. The simulation was
an imitation (on a computer) of a system as it progressed through time. The Purpose is to
obtain a better understanding of the system as well as the identification of the area which
needs improvement, on which future decision of the organization are based.
As a consequence, the model will be used as a supportive tool for decision making rather
than making decisions on behalf of the user. It’s on the results of the simulation model that
the MFPED will base its decision as regards giving loans to credible SACCOS made of small
scale entrepreneurs. System dynamics is the best suitable methodology through which this
can be determined because of the following reasons;
33

(i) It expresses all variables into cause and effect relationship. This is essential because
many people would think of another problem being the cause of poor loan repayment
out, yet the problem is somewhere else.
(ii) Many times systems fail and management has to look outside the organization for the
cause of the problem, yet the problem is within. So systems dynamics comes in to give
a solution to the problems by analyzing each sector, and identifying the origin of the
problem, and how it relates with the other entities.
(iii) System dynamics enables the user to have results of a long period of time. Having this
type of problem requires adequate planning for a long or short period of time. System
Dynamics provides this solution by enabling the simulator have results for the period
of time for proper planning.
(iv) ) System dynamics does not provide solutions to problems, but the problem is high-
lighted and this prompts management to dig deep into the highlighted problem to see
how to solve the problem.
3.2.4 Validation
Law and Kelton(1991)[23] suggests that if a model is ”valid”, then the decisions made with
the model should be similar to those that would be made by physically experimenting with
the system. A model is said to be credible when a simulation model and its results are
accepted by managers/customers as being valid, and used as an aid (tool) in making many
decisions.
Williams (2004)[46], states that building valid and credible process models is an important
aspect of a researcher’s representation of the actual system being studied.
Values were tested by the researcher on the model with available case studies and ministry
data to ensure that values are acceptable and that credible and reliable figures are produced
by the model after its run. This aimed at removing exaggerations and possible causes of
error.
34
Chapter 4
PRESENTATION OF RESULTS
4.1 Shortcomings with the current approaches
In the new poverty alleviation scheme of disbursing loans to SACCOs the researcher identi-
fied and investigated shortcomings of current approaches used in determining SACCOs that
receive poverty alleviation funds.
Current approaches used in the evaluation of SACCOs that receive loans.
The researcher discovered that loan officers use Traditional judgmental approaches for eval-
uation of SACCOs that receive loans. Assessing the credibility of a SACCO is a major
aspect that is looked at by loan officers when selecting SACCOs that qualify for a loan.
For a SACCO to be declared credible the following factors have to be considered to the
satisfaction of loan officers:-
(i) The SACCO had to produce a Registration Certificate certified by the Ministry of
Tourism Trade and Industry which registers SACCOs under the Cooperatives statute
an omnibus law for all types of cooperatives.
(ii) Management is evaluated. The managers must be known in areas they come from.
These leaders must produce introduction letters from the Local Council 1 (one) chair-
person.
(iii) Objectives of the SACCO should be convincing to loan officers and aimed to uplift
SACCO members from poverty.
(iv) Evidence of SACCO activity inform of financial documents i.e. balance sheet must be
35
submitted to loan officers.
The researcher found out that though the Traditional judgmental methods may select good
and bad creditors its not entirely accurate because of the following reasons:-
(i) Loan officers make decisions based on the past data of the SACCO which have no
bearing on the future events.
(ii) They give a static picture where as we live in a dynamic world. They also provide a
shallow view whereas it would be much more useful if a holistic picture of the SACCO’s
ability to survive the period of the loan and make repayment.
(iii) Often Balance Sheets of SACCOs can be ”adjusted” to portray a rosier picture of the
financial health of the SACCO than actually exists so the financial ratios based on to
give loans are rendered inappropriate.
(iv) The Traditional judgmental approach is not entirely correct because its based on prob-
ability.
(v) Does not consider ”what if” possibilities which may occur in the business environment
and affect the performance of SACCOs and their ability to pay back the loans under
different pressures.
(vi) These methods do not include the effect of delays in the business environment. In all
aspects of business life, there are delays - Some serious and some not. These delays can
have non - linear effects which are a breeding ground for chaotic behavior where small
changes in some parameters can result in massive changes in the financial position of
the SACCO.
The researcher would encourage the use of Traditional Judgmental approach of assessing
credible SACCOs alongside the proposed approach of using Simulation modeling. The ad-
vantages of the proposed approach are further explained below.
Proposed approach
The researcher proposed system dynamics with the use of Simulation and modeling as the
new approach because of the following reasons:-
36
(i) Complexity. Operations of the inner workings of a SACCO are complex for loan officers
to come up with a correct decision using the traditional judgmental approach. However
Simulation and modeling allows one to measure soft relationships using graphs. Such a
technique for representing non - measurable features coupled with advanced modeling
software such as STELLA interface eases significantly the modeling task.
(ii) Simulation and modeling is flexible enough to permit dynamic runs which give signifi-
cant advantage over Traditional judgmental approach in understanding the pattern of
behavior of a candidate SACCO.
(iii) Interconnectedness. Variables of the SACCO do not work in isolation but affect one
another. It is difficult to predict the effect of the interconnections through the use
of traditional judgmental approach. However Simulation and modeling easily predicts
event by running simulations based on cause and effect of variables.
(iv) Simulation and modeling allows easy insertion of delays and non - linearity, which is
always important in the case on credit analysis, this allows system dynamics models
to introduce a better picture of the real financial position of a SACCO.
(v) In Uganda’s case where data may be un available for some SACCOs, Simulation and
modeling allows one to model with the little data because the ’cause and effect’ rela-
tionships are mostly defined, this gives a strong potential for using system dynamics
models.
(vi) It allows the user to examine behavior under ”what - if” scenarios which provides a
risk assessment of the SACCOs future prospects.
Through the use of System Dynamics a Simulation Model was developed to evaluate SACCOs
performance and ability to pay back poverty alleviation loans. The main goal will be to test
if a SACCO really qualifies to obtain a loan and whether it will be viable enough to repay in
future. It therefore evaluates the credit worthiness of the SACCO over time (Trend analysis)
37

4.2 Identified Variables
Through literature review the Micro finance Institutions Model Figure 4.1 (Gary, 2000)[11]
was examined and the following were identified as critical variables Funds Available For
Lending (SACCO Cash), Loan Repayment (Member Loan Repayment) and Defaulted Loans
(Defaulting).
Figure 4.1: Micro finance Institutions Model. Adapted from (Gary,2000)[13].
Through interviews with Loan officers at the MFPED and Wakiso Self Help SACCO offi-
cials the researcher identified the Poverty Alleviation Fund, SACCOs, SACCO Cash and
SACCO Members as critical variables. Other variables included New Applicants, Fraud,
Civic Education, Awareness, SACCO Income, Subscription Fee, Member Savings, SACCO
Interest Rate, Administrative Tool, Membership fees, Drop out SACCO Members, Borrow-
ers,Funders, Government funding, credibility, Liquidated SACCOs, New SACCOs, Funders,
SACCO loans, Subscription fee, Administration, Fraud, Corruption, Nepotism, Monitoring
and Control, Politicking and Loan disbursement.
4.2.1 Definition of variables
(i) SACCO Cash: It’s a pool of funds/resources that are accumulated by a SACCO.
These accumulated funds are from the member savings, membership fees and from
loan repayments with interest.
38
(ii) New applicants: Are the applicants who are applying to join a SACCO.
(iii) SACCO members: Refers to members of a SACCO.
(iv) Membership fees: These are fees that members of a SACCO must pay for in every
agreed period of time for either a year or month.
(v) Loan disbursement: It’s the distribution of resources accumulated by the SACCO in
form of loans to members within a SACCO.
(vi) Member loan repayment: It’s the repayment of loans by borrowers in a SACCO.
(vii) Politicking: Political affiliation is considered as a basis of giving out a loan rather than
the ability of an individual to manage a loan.
(viii) Defaulting: Failure of SACCO members to pay back loans.
(ix) SACCO loan repayment: The ability of a SACCO to repay loans to the Poverty Alle-
viation Fund/MFPED.
(x) Poverty Alleviation Fund: Resources/funds at the MFPED available to be lent to
SACCOs for purposes of helping people get out of poverty.
(xi) SACCOs: These are Savings and Credit Cooperative Organizations that apply for
poverty alleviation funds with an aim of giving loans to members to pull them selves
out of poverty.
(xii) Monitoring and Control: The ability to examine the internal workings of an organiza-
tion to ensure efficiency.
(xiii) Nepotism: Awarding loans to people basing on family, tribal and religious attachment
to the administrator.
(xiv) Funders: These are the financiers of the Poverty Alleviation Fund.
(xv) Government Fund: It’s the contribution to the Poverty Alleviation Fund by the Gov-
ernment of Uganda (GOU).
(xvi) Donor fund: It’s the contribution of donors to the Poverty Alleviation Fund.
39

(xvii) Administrative Tool: A mechanism used to evaluate the internal workings of an orga-
nization to ensure efficiency.
(xviii) New SACCOs: The number of SACCOs that join the club of loan borrowers from the
MFPED.
(xix) SACCO entry rate: Its rate at which SACCOs join the club of borrowers.
(xx) Liquidated SACCOs: The number of SACCOs that leave the club of borrowers from
the Poverty Alleviation Fund.
(xxi) Rate of SACCOs dropping out: It refers to the rate at which SACCOs drop out from
the club of borrowers from the Poverty Alleviation Fund.
(xxii) Fraud: It’s the level of stealing organization funds.
(xxiii) Member savings: It’s the amount of money that SACCO members deposit with SAC-
COs so as to save for future investments.
(xxiv) SACCO Interest Rate: Its the percentage rate of the net loan set by the SACCO that
has to be paid by the borrower every after a given period of time.
(xxv) SACCO Interest. Its the top up amount of money paid to the SACCO in addition to
the net loan.
(xxvi) Poverty Alleviation Interest Rate: Its the percentage rate of the net loan set by the
MFPED that has to be paid by the borrowing SACCO every after a given period of
time.
(xxvii) Poverty Alleviation Interest. Its the top up amount of money paid to the MFPED in
addition to the net loan given to the SACCO.
(xxviii) Net Loan: Its the loan given to the borrower minus interest.
40

4.3 Causal loop Diagram
From the Conceptual framework Fig.1.3 inform of the Dynamic Hypothesis and the variables
that were identified a causal loop diagram was developed as shown below.
Figure 4.2: Causal Loop Diagram for the proposed Simulation Model
This Causal Loop Diagram was translated into a stock and diagram as shown in Fig4.2.
4.4 Modeling Decisions
To build the Simulation Model, STELLA a Simulation Software was used because it has the
advantage of allowing the user fill in Variables while STELLA fills in the equations. Another
decision was to run as many Simulations as possible and carrying out adjustments until
satisfactory results were obtained.
41
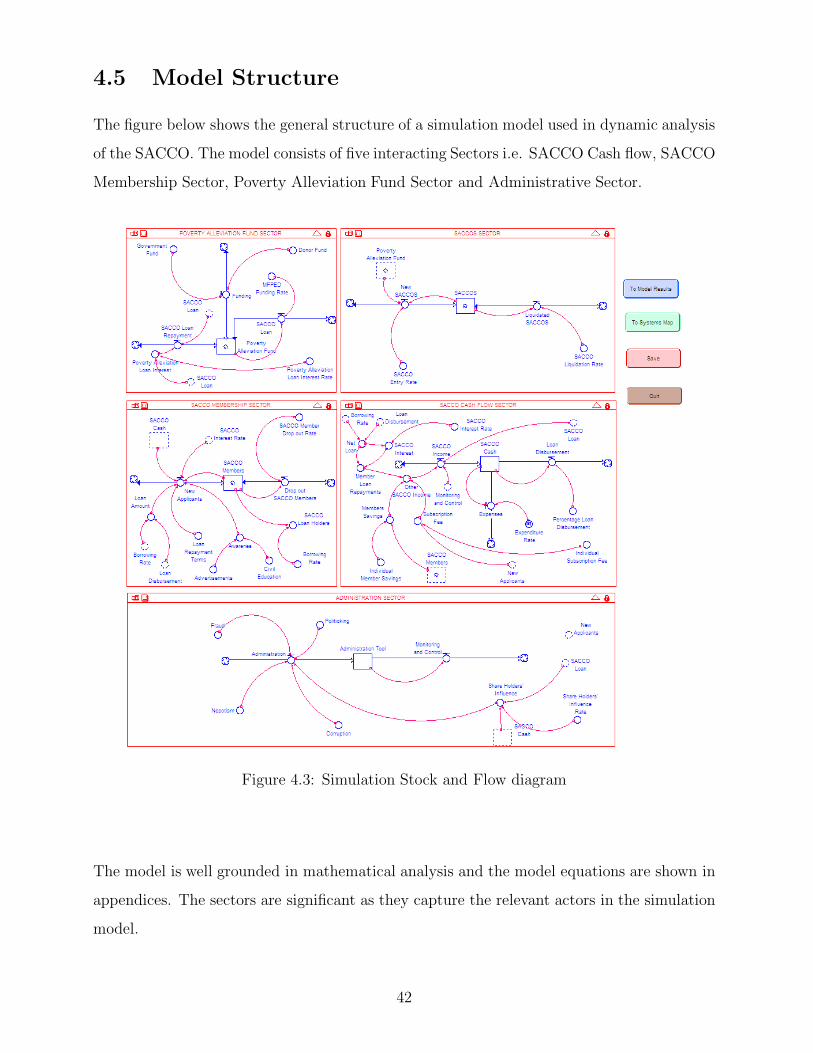
4.5 Model Structure
The figure below shows the general structure of a simulation model used in dynamic analysis
of the SACCO. The model consists of five interacting Sectors i.e. SACCO Cash flow, SACCO
Membership Sector, Poverty Alleviation Fund Sector and Administrative Sector.
Figure 4.3: Simulation Stock and Flow diagram
The model is well grounded in mathematical analysis and the model equations are shown in
appendices. The sectors are significant as they capture the relevant actors in the simulation
model.
42
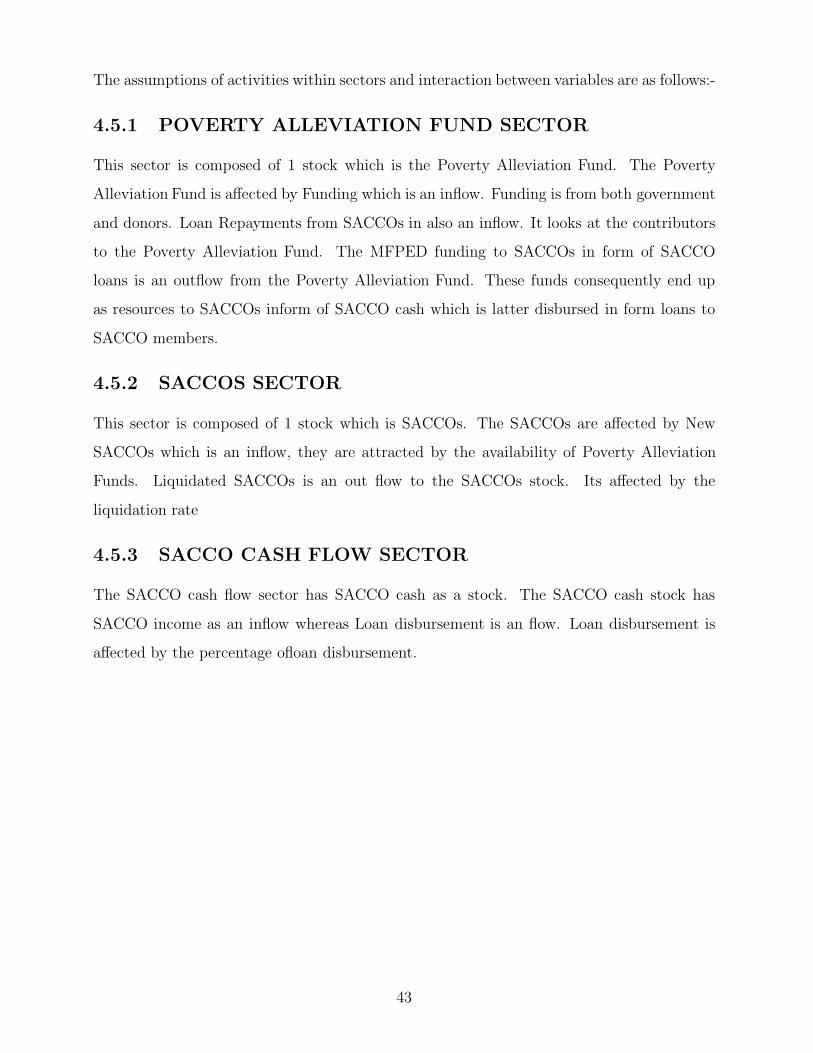
The assumptions of activities within sectors and interaction between variables are as follows:-
4.5.1 POVERTY ALLEVIATION FUND SECTOR
This sector is composed of 1 stock which is the Poverty Alleviation Fund. The Poverty
Alleviation Fund is affected by Funding which is an inflow. Funding is from both government
and donors. Loan Repayments from SACCOs in also an inflow. It looks at the contributors
to the Poverty Alleviation Fund. The MFPED funding to SACCOs in form of SACCO
loans is an outflow from the Poverty Alleviation Fund. These funds consequently end up
as resources to SACCOs inform of SACCO cash which is latter disbursed in form loans to
SACCO members.
4.5.2 SACCOS SECTOR
This sector is composed of 1 stock which is SACCOs. The SACCOs are affected by New
SACCOs which is an inflow, they are attracted by the availability of Poverty Alleviation
Funds. Liquidated SACCOs is an out flow to the SACCOs stock. Its affected by the
liquidation rate
4.5.3 SACCO CASH FLOW SECTOR
The SACCO cash flow sector has SACCO cash as a stock. The SACCO cash stock has
SACCO income as an inflow whereas Loan disbursement is an flow. Loan disbursement is
affected by the percentage ofloan disbursement.
43
4.5.4 SACCO MEMBERSHIP SECTOR
This sector looks at the SACCO members. The sector is made up of 1 stock which include
SACCO members. It includes New applicants to the SACCO as an inflow.
New Applicants to the SACCO are influenced by:-
(a). SACCO Members: Current SACCO Members contribute to the attraction of New
Applicants to the SACCO. Its assumed that they influence other persons to join the
SACCO if the SACCO Members are proud of the SACCO’s financial condition.
(b). Awareness: Availability of information about the existence of a SACCO that gives out
loans. This can be through advertisements and civil education about the usefulness of
people to join SACCOs.
(c). SACCO Cash: The ability of a SACCO to raise a lot of cash/funds that can be used by
the organization to lend out as loans to members encourage people to join the SACCO.
(d). Loan Amount: The amount that a borrower may get influences New Members. If the
loan amount is high more members are likely to join, if its low less members are likely
to join.
(e). Loan Repayment Terms. If the repayment terms are harsh less people are likely to join
the SACCO and vice versa.
(f). SACCO Interest Rate. If the SACCO’s loan interest rate on loans is very high less
people may join but if its very low more people are likely to join especially those who
are interested in borrowing.
44
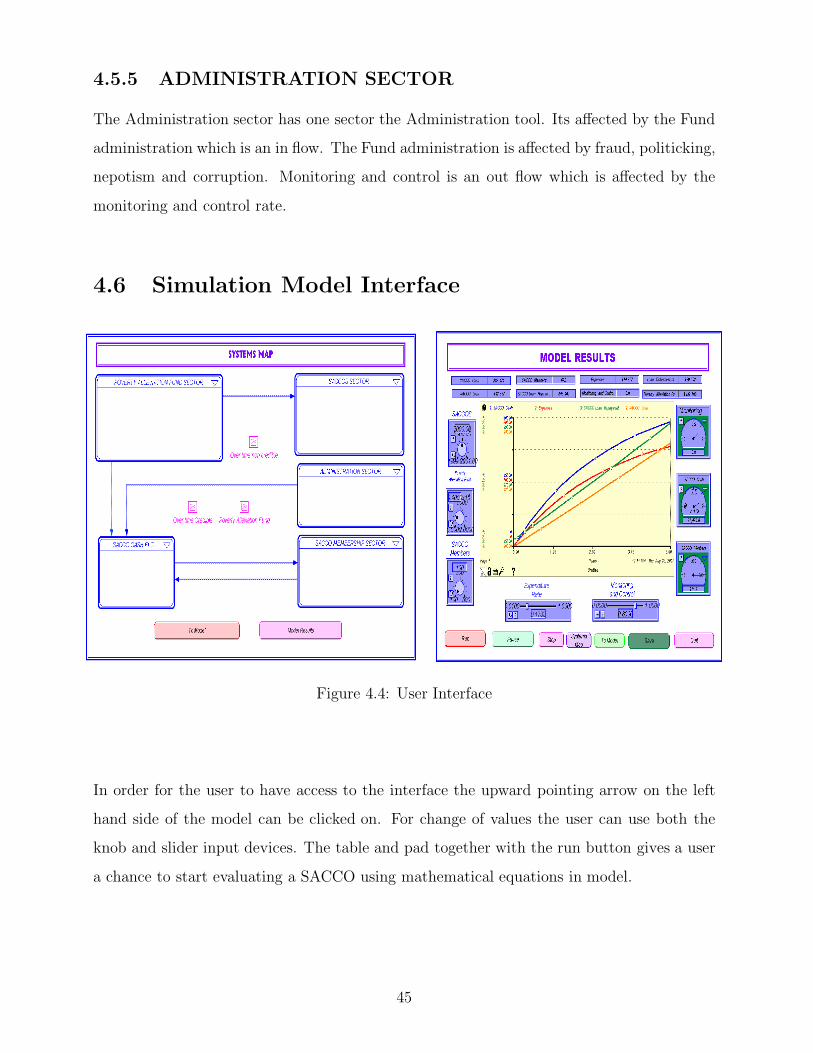
4.5.5 ADMINISTRATION SECTOR
The Administration sector has one sector the Administration tool. Its affected by the Fund
administration which is an in flow. The Fund administration is affected by fraud, politicking,
nepotism and corruption. Monitoring and control is an out flow which is affected by the
monitoring and control rate.
4.6 Simulation Model Interface
Figure 4.4: User Interface
In order for the user to have access to the interface the upward pointing arrow on the left
hand side of the model can be clicked on. For change of values the user can use both the
knob and slider input devices. The table and pad together with the run button gives a user
a chance to start evaluating a SACCO using mathematical equations in model.
45
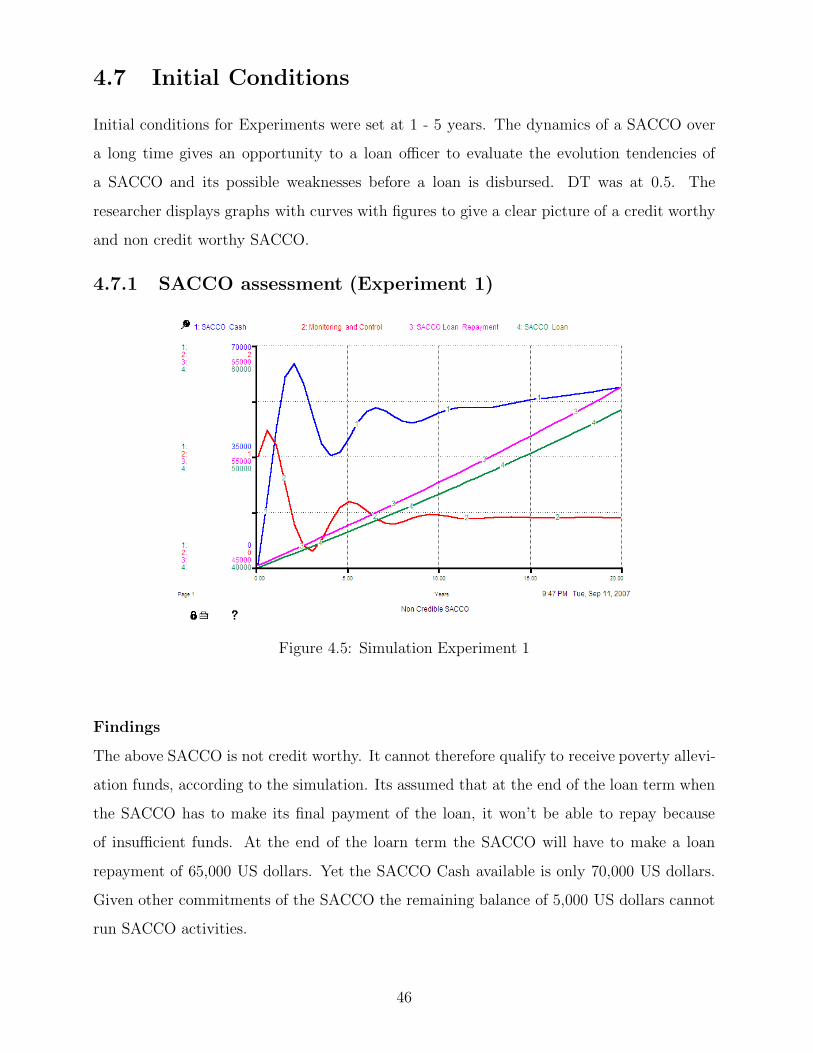
4.7 Initial Conditions
Initial conditions for Experiments were set at 1 - 5 years. The dynamics of a SACCO over
a long time gives an opportunity to a loan officer to evaluate the evolution tendencies of
a SACCO and its possible weaknesses before a loan is disbursed. DT was at 0.5. The
researcher displays graphs with curves with figures to give a clear picture of a credit worthy
and non credit worthy SACCO.
4.7.1 SACCO assessment (Experiment 1)
Figure 4.5: Simulation Experiment 1
Findings
The above SACCO is not credit worthy. It cannot therefore qualify to receive poverty allevi-
ation funds, according to the simulation. Its assumed that at the end of the loan term when
the SACCO has to make its final payment of the loan, it won’t be able to repay because
of insufficient funds. At the end of the loarn term the SACCO will have to make a loan
repayment of 65,000 US dollars. Yet the SACCO Cash available is only 70,000 US dollars.
Given other commitments of the SACCO the remaining balance of 5,000 US dollars cannot
run SACCO activities.
46

In conclusion this SACCO cannot be entrusted with a loan because indications of he simu-
lation show it will not be able to repay the loan.
4.7.2 SACCO assessment (Experiment 2)
Figure 4.6: Simulation Experiment 2
Findings
The above SACCO is credit worthy. It can therefore qualify to receive poverty alleviation
funds, according to the simulation. Its assumed that at the end of loan term when the
SACCO has to make its final payment of the loan, it will be able to repay because there will
be sufficient funds to make the final payment. At the end the loan term the SACCO will
have to make a loan repayment of 65,000 US dollars. SACCO Cash available at 300,000 US
dollars. From the SACCO Cash of 300,000 US dollars a loan repayment of 65,000 US dollars
can be made without straining the activities of the SACCO.
In conclusion this SACCO can be entrusted with a loan because indications of the simulation
show it will be able to repay the loan.
47
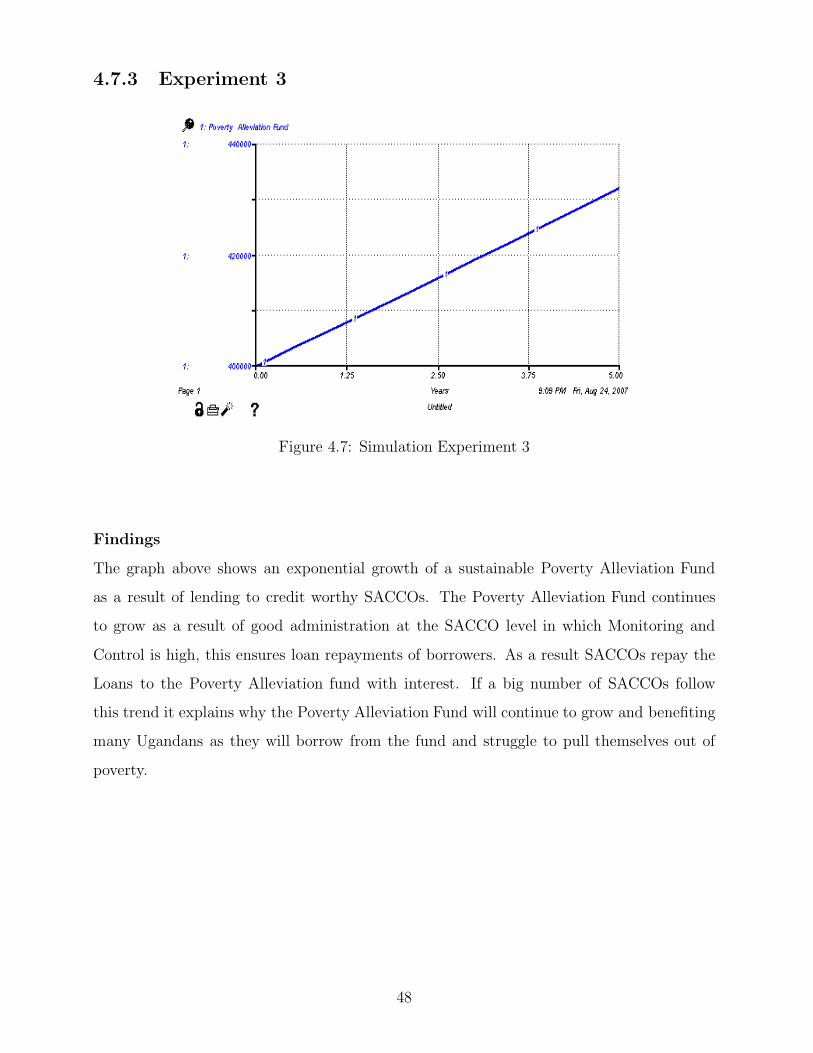
4.7.3 Experiment 3
Figure 4.7: Simulation Experiment 3
Findings
The graph above shows an exponential growth of a sustainable Poverty Alleviation Fund
as a result of lending to credit worthy SACCOs. The Poverty Alleviation Fund continues
to grow as a result of good administration at the SACCO level in which Monitoring and
Control is high, this ensures loan repayments of borrowers. As a result SACCOs repay the
Loans to the Poverty Alleviation fund with interest. If a big number of SACCOs follow
this trend it explains why the Poverty Alleviation Fund will continue to grow and benefiting
many Ugandans as they will borrow from the fund and struggle to pull themselves out of
poverty.
48

Chapter 5
DISCUSSION, CONCLUSIONSAND RECOMMENDATIONS
Overview
In this chapter the researcher examines how the objectives of the project were addressed
using System Dynamics (simulation and modeling). The findings and contributions of the
project to the evaluation of credit worthy SACCOs that apply for poverty alleviation funds
are discussed. Conclusions and recommendations are also given.
5.1 Discussion
The researcher achieved the objectives of the study using a number of techniques. Identifica-
tion of shortcomings with the current approaches used in determining credit worthy SACCOs
at the MFPED was carried out, identifying variables for inclusion in the simulation model
were realized. The simulation model was developed and validated with existing case studies.
Three research methodologies were investigated which included case study, viable systems
and dynamic synthesis taking into account the Accuracy, Focus, Bias, Ease to use and Inclu-
siveness. The dynamic synthesis methodology was found to be the best as the others were
found to have a number of weaknesses.
Through the use of Dynamic Synthesis methodology the problem statement was overcome
by the development of the dynamic hypothesis. The dynamic hypothesis reflects the links
between critical variables.
49

The casual loop diagram was constructed from the dynamic hypothesis depicting the link
between critical and noncritical variables. Causal loop diagrams are cause and effect repre-
sentations of structures and processes that have loops or feed back as represented in figure 4.1.
Literature review portrays System Dynamics as a tool to be used in the wider goal of Poverty
Alleviation in Uganda. Still under literature review loan servicing case studies, modeling
and simulation systems, state of the art/practice in loan servicing, earlier work and charac-
teristics of loans are closely examined.
The causal loop diagram was converted into a stock and flow diagram Figure 4.3. It should
be noted that the stock and flow diagram only considered variables that are quantifiable.
Variables that could not be quantified. The simulation model was developed using STELLA
software.
When the model is Run it projects the ability of a SACCO to repay a loan over time given
”what - if” scenarios. It establishes whether a SACCO can stand the test of time in which
the loan must be repaid.
Through model validation the researcher aimed at justifying the reliability of the model and
providing confidence for model application. The government’s target is to have 28 percent
of poor in over all population by 2014/2015 (MFPED, 2005)[27]. During this period the
poverty alleviation fund is expected to be growing to challenge the poverty levels. Growth
will be due to loan repayment with interest and continued funding from Uganda’s develop-
ment partners and government (GOU).
50
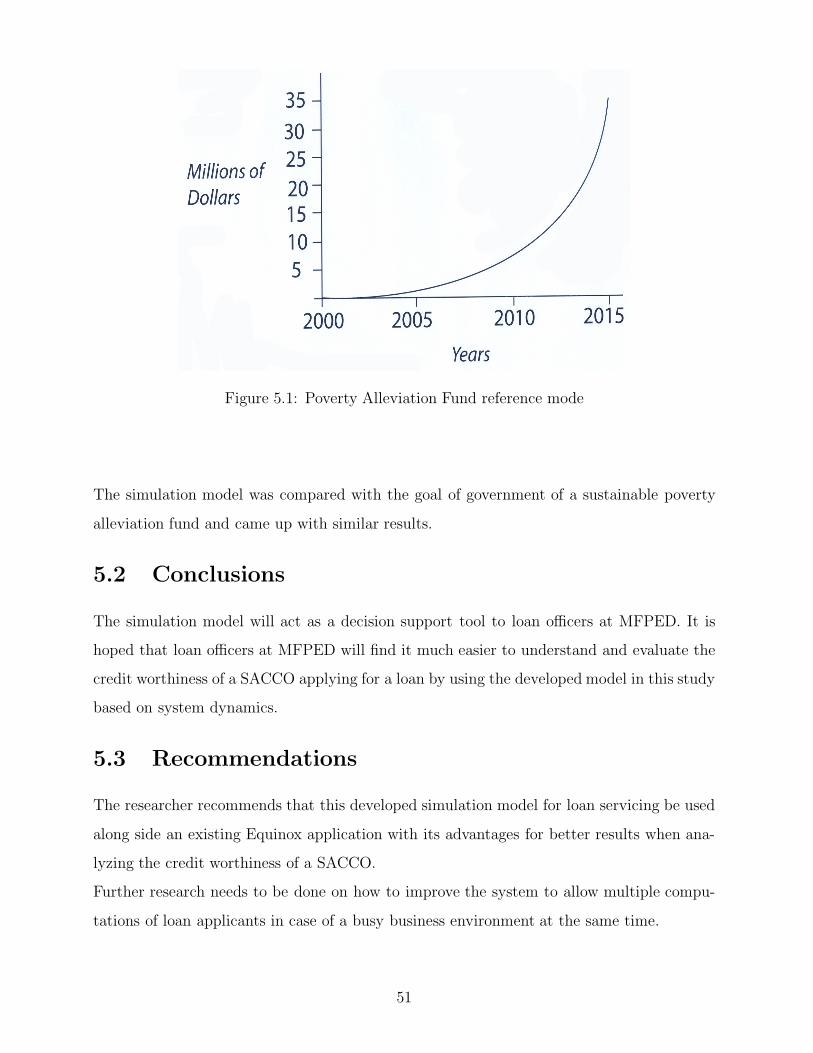
Figure 5.1: Poverty Alleviation Fund reference mode
The simulation model was compared with the goal of government of a sustainable poverty
alleviation fund and came up with similar results.
5.2 Conclusions
The simulation model will act as a decision support tool to loan officers at MFPED. It is
hoped that loan officers at MFPED will find it much easier to understand and evaluate the
credit worthiness of a SACCO applying for a loan by using the developed model in this study
based on system dynamics.
5.3 Recommendations
The researcher recommends that this developed simulation model for loan servicing be used
along side an existing Equinox application with its advantages for better results when ana-
lyzing the credit worthiness of a SACCO.
Further research needs to be done on how to improve the system to allow multiple compu-
tations of loan applicants in case of a busy business environment at the same time.
51
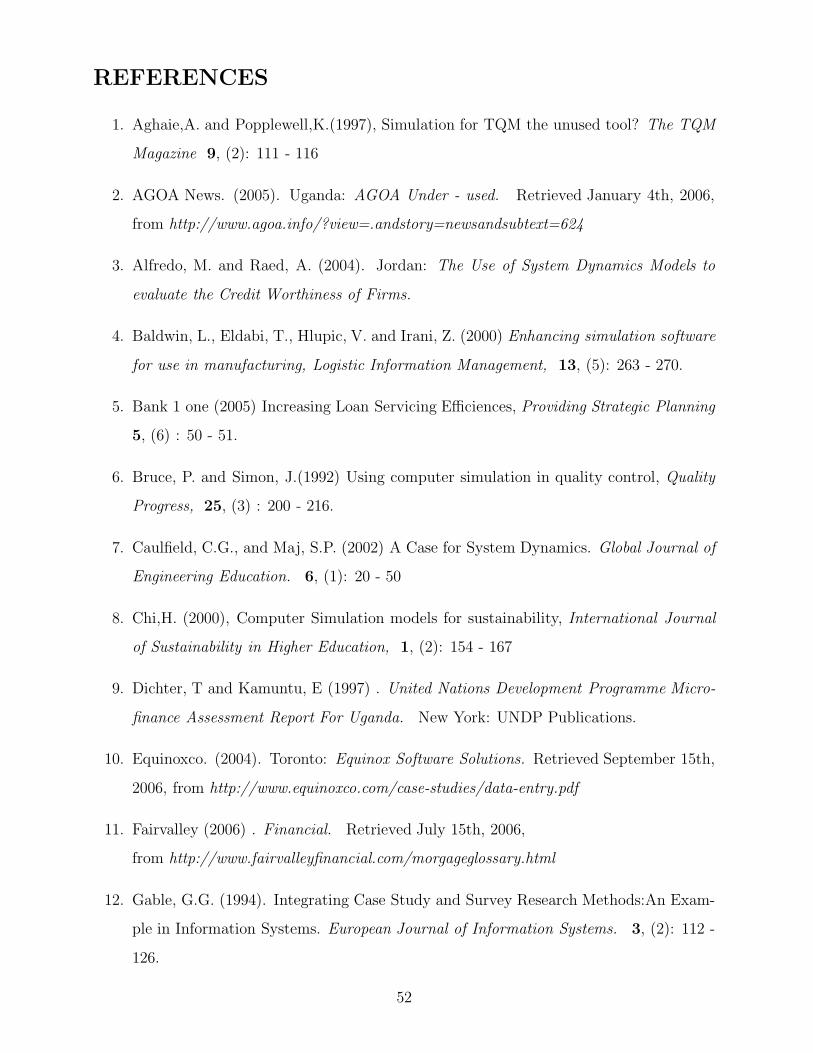
REFERENCES
1. Aghaie,A. and Popplewell,K.(1997), Simulation for TQM the unused tool? The TQM
Magazine 9, (2): 111 - 116
2. AGOA News. (2005). Uganda: AGOA Under - used. Retrieved January 4th, 2006,
from http://www.agoa.info/?view=.andstory=newsandsubtext=624
3. Alfredo, M. and Raed, A. (2004). Jordan: The Use of System Dynamics Models to
evaluate the Credit Worthiness of Firms.
4. Baldwin, L., Eldabi, T., Hlupic, V. and Irani, Z. (2000) Enhancing simulation software
for use in manufacturing, Logistic Information Management, 13, (5): 263 - 270.
5. Bank 1 one (2005) Increasing Loan Servicing Efficiences, Providing Strategic Planning
5, (6) : 50 - 51.
6. Bruce, P. and Simon, J.(1992) Using computer simulation in quality control, Quality
Progress, 25, (3) : 200 - 216.
7. Caulfield, C.G., and Maj, S.P. (2002) A Case for System Dynamics. Global Journal of
Engineering Education. 6, (1): 20 - 50
8. Chi,H. (2000), Computer Simulation models for sustainability, International Journal
of Sustainability in Higher Education, 1, (2): 154 - 167
9. Dichter, T and Kamuntu, E (1997) . United Nations Development Programme Micro-
finance Assessment Report For Uganda. New York: UNDP Publications.
10. Equinoxco. (2004). Toronto: Equinox Software Solutions. Retrieved September 15th,
2006, from http://www.equinoxco.com/case-studies/data-entry.pdf
11. Fairvalley (2006) . Financial. Retrieved July 15th, 2006,
from http://www.fairvalleyfinancial.com/morgageglossary.html
12. Gable, G.G. (1994). Integrating Case Study and Survey Research Methods:An Exam-
ple in Information Systems. European Journal of Information Systems. 3, (2): 112 -
126.
52
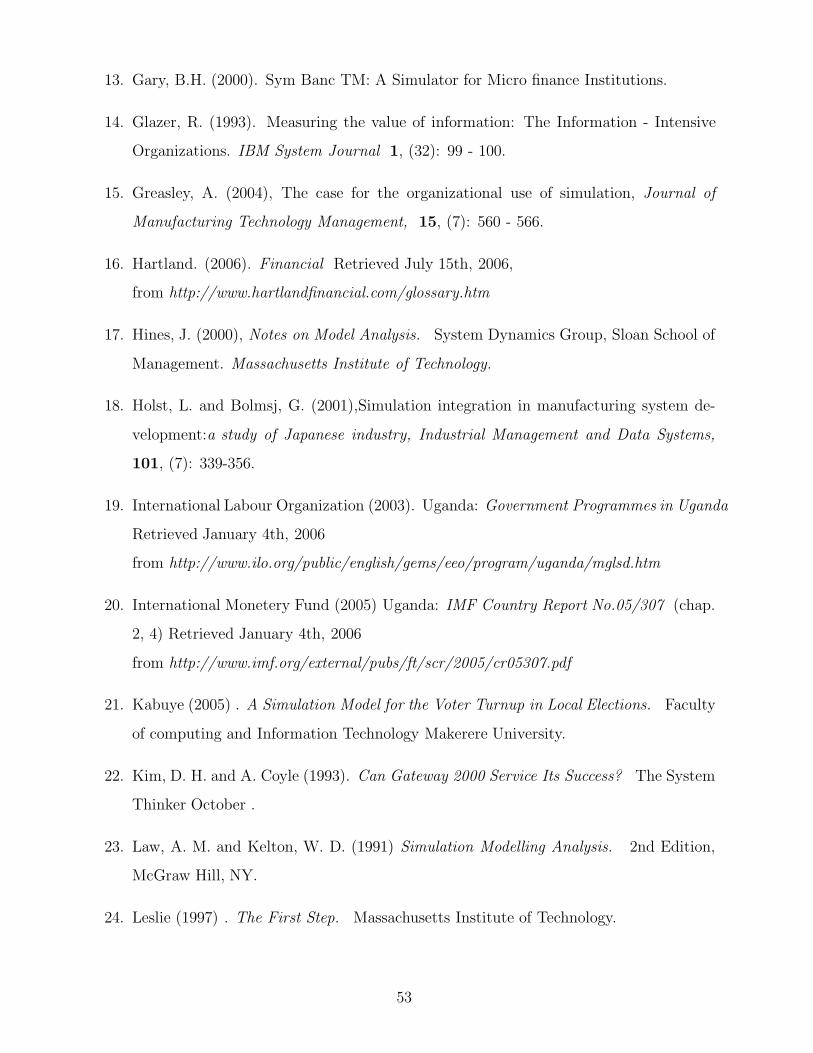
13. Gary, B.H. (2000). Sym Banc TM: A Simulator for Micro finance Institutions.
14. Glazer, R. (1993). Measuring the value of information: The Information - Intensive
Organizations. IBM System Journal 1, (32): 99 - 100.
15. Greasley, A. (2004), The case for the organizational use of simulation, Journal of
Manufacturing Technology Management, 15, (7): 560 - 566.
16. Hartland. (2006). Financial Retrieved July 15th, 2006,
from http://www.hartlandfinancial.com/glossary.htm
17. Hines, J. (2000), Notes on Model Analysis. System Dynamics Group, Sloan School of
Management. Massachusetts Institute of Technology.
18. Holst, L. and Bolmsj, G. (2001),Simulation integration in manufacturing system de-
velopment:a study of Japanese industry, Industrial Management and Data Systems,
101, (7): 339-356.
19. International Labour Organization (2003). Uganda: Government Programmes in Uganda
Retrieved January 4th, 2006
from http://www.ilo.org/public/english/gems/eeo/program/uganda/mglsd.htm
20. International Monetery Fund (2005) Uganda: IMF Country Report No.05/307 (chap.
2, 4) Retrieved January 4th, 2006
from http://www.imf.org/external/pubs/ft/scr/2005/cr05307.pdf
21. Kabuye (2005) . A Simulation Model for the Voter Turnup in Local Elections. Faculty
of computing and Information Technology Makerere University.
22. Kim, D. H. and A. Coyle (1993). Can Gateway 2000 Service Its Success? The System
Thinker October .
23. Law, A. M. and Kelton, W. D. (1991) Simulation Modelling Analysis. 2nd Edition,
McGraw Hill, NY.
24. Leslie (1997) . The First Step. Massachusetts Institute of Technology.
53

25. Loanperformer (1993) Loanperformer systems Retrieved February 18th, 2006
from http://www.loanperformer.com
26. Marquez, A.C., and Blanchar, C. (2004). A Decision support System for Evaluat-ing
Operations Investments in High-Technology Systems. The Decision Support Systems.
DESCUP-11036
27. Ministry of Finance, Planning and Economic Development (2005) Uganda: Poverty
Reduction Strategy Paper (chap. 2, 4) Retrieved January 4th, 2006
from http://www.finance.go.ug/documents.html
28. Nannyonjo and Nsubuga (2004) Bank of Uganda working paper. Recognising the role
of Microfinance Institutions in Uganda Kampala. BOU Publications.
29. Oechsner, R., Pfeffer, M., Pfitzner, L., Binder, H., Mller, E. and Vonderstrass, T.
(2003), From overall equipment efficiency (OEE) to overall Fab effectiveness (OFE),
Material Science in Semiconductor Processing, 5, (4): 333-339.
30. OFHEO (1999),Risk-Based Capital Regulation. Second Notice of Proposed Rule Mak-
ing II Office of Federal Housing Enforcement Oversight: 321 - 360
31. OKane, J. (2004),Simulating production performance: cross case analysis and policy
implications, Industrial Management and Data Systems, 104, (4): 309 - 321.
32. Okrut, F., Banga, M. and Mukungu (2004) Microfinance and Poverty in Uganda.
Achievements and Challenges. Retrieved January 4th, 2006 from
http://www.eprc.or.ug/pdf-files/series41.pdf.
33. Parliament (2003) Parliament: Finance, Planning and economic development commit-
tee Report on the ministrial Policy Statement and Budget estimates for the financial
year 2003/2004. (chap. 4) Retreaved December 21st, 2005 from
http://www.parliament.go.ug/financepercentage20rpt7-session3.htm
34. Phyllis (2002). Small business Administration: Management Challenges Washington
DC
35. Piget.H and Oslo. D (1998). Interest Rate Risk A comptroller’s Handbook
54
36. Richardson, G.P.(1995). Loop Polarity, Loop Dominance and the concept of Dominant
Polarity, System Dynamics Review, 11, (1): 67 - 88
37. Richardson, G. P. (1986). Problems with causal loop diagrams. System Dynamics
Review Summer 2, (1): 158 - 170.
38. Richardson, G. P., and Purgh, A. L. (1981). Introduction to System Dynamics Mod-
elling with DYNAMO, Productivity Press, Portland (OR)
39. Smyth, L, Sanchez, S., and E. Lawrence (1996), Comprehensive Model for Managing
Credit Risk on Home Mortgage Portfolios, Decision Sciences, 27, (2): 291 - 317
40. Tignor, W.W. (2004). Simulation in The System Engineering Process: System Dy-
namics for System Engineering Process. Second Annual Workshop on Web Enabled
Modeling and Simulation. Arlington, VA.(USA).October 12-15. Sciences, 4 (3): 200
- 210
41. Uganda Debt Network (2003), Anual Report, Kampala
42. Wall Street Without Walls(2006) Federal Reserve Bank of Boston
43. Welch, W.J., Kang, S.M., Yu, T.K. and Sacks, J.(1990), Computer experiments for
quality control parameter design, Journal of Quality Technology, 22, (3): 100 - 102
44. Welgama P.S. and Mills R.G.J., (1995), Use of simulation in the design of a JIT system,
International Journal of Operations and Production Management, 15, (9): 245-260
45. Williams, D. (2002). An Application of System Dynamics to Requirements Engineering
Process Modelling, Unpublished PhD, London South Bank University.
46. Williams, D. (2004). Dynamics Synthesis Methodology: A Theoretical Framework for
Research in The Requirements Process Modelling and Analysis. Proceedings of the
1st European Conference on Research Methods for Business and Management Studies.
Cambridge, UK. April 29-30, 467-490. ISBN: 0-9540488-3-0.
47. Williams, D., Hall, T. and Kennedy, M.S. (1999)A Framework for Improving The Re-
quirements Engineering Process Management. Proceedings of Software Quality Man-
agement Conference, Southampton, UK. 29-31 March. 203-217.
55
48. Wilson. D. (1995): Residential Loss Severity in California: 1992 to 1995, Journal of
Fixed Income, 2, (5): 150-151
APPENDIX A: INTERVIEW GUIDE
The researcher carried out interviews with both officials at the Ministry of Finance Planning
and Economic Planning as well as the SACCO leadership of the Wakiso Self Help Savings
and Credit Cooperative Organization. Below is the interview guide.
Interview guide with Ministry officials:
(i) What is the goal of the poverty alleviation program through loan disbursement to
Savings and Credit Cooperative organizations?
(ii) What is your role in achieving this goal?
(iii) Who are the contributors to the poverty alleviation fund?
(iv) What systems are used in loan servicing?
(v) What is the most efficient system?
(vi) What are the advantages of this system against the rest?
(vii) What steps are followed by a SACCO before it qualifies for Poverty Alleviation Fund
loans?
(viii) What approaches are used in evaluating SACCOs that receive poverty alleviation
funds/loans?
(ix) Do you think the current approaches used to evaluate beneficiaries of loans from the
ministry are efficient?
(x) If not why do you think these approaches are not efficient?
(xi) What is the interest rate set by the ministry on loans?
(xii) How much money does each SACCO applicant receive?
56
(xiii) How can the Poverty Alleviation Fund be sustainable?
Interview guide with Wakiso Self Help Savings and Credit Cooperative Organi-
zation officials:
(i) What is the main goal of Wakiso Self Help Savings and Credit Cooperative Organiza-
tion?
(ii) What influenced you to form this SACCO?
(iii) What processes do you go through to form a SACCO?
(iv) What are the activities of Wakiso Self Help Savings and Credit Cooperative Organi-
zation?
(v) What systems does this SACCO use in loan servicing to members?
(vi) How does a SACCO accumulate resources?
(vii) What affects new members to join a SACCO?
(viii) What initiatives have Wakiso Self Help Savings and Credit Cooperative Organization
taken to attract new members?
(ix) What influences members to leave the SACCO?
(x) How do you distribute the SACCO cash/resources to borrowers
(xi) What is the interest rate of this SACCO?
57
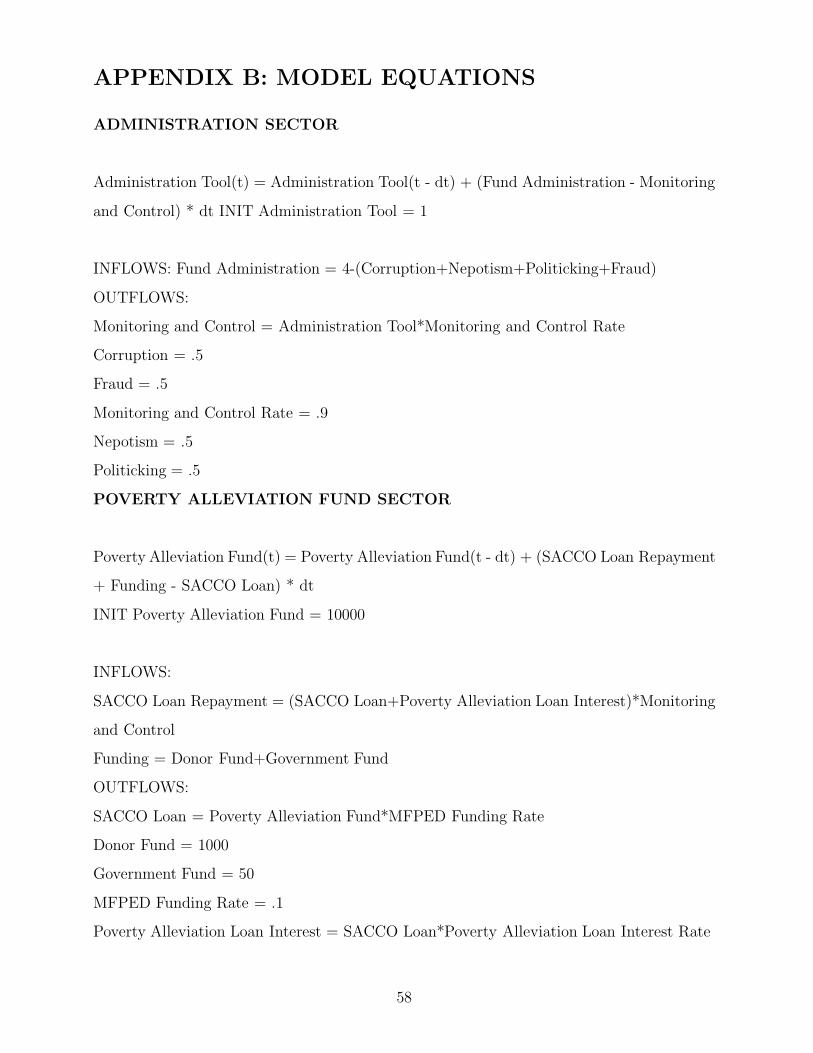
APPENDIX B: MODEL EQUATIONS
ADMINISTRATION SECTOR
Administration Tool(t) = Administration Tool(t - dt) + (Fund Administration - Monitoring
and Control) * dt INIT Administration Tool = 1
INFLOWS: Fund Administration = 4-(Corruption+Nepotism+Politicking+Fraud)
OUTFLOWS:
Monitoring and Control = Administration Tool*Monitoring and Control Rate
Corruption = .5
Fraud = .5
Monitoring and Control Rate = .9
Nepotism = .5
Politicking = .5
POVERTY ALLEVIATION FUND SECTOR
Poverty Alleviation Fund(t) = Poverty Alleviation Fund(t - dt) + (SACCO Loan Repayment
+ Funding - SACCO Loan) * dt
INIT Poverty Alleviation Fund = 10000
INFLOWS:
SACCO Loan Repayment = (SACCO Loan+Poverty Alleviation Loan Interest)*Monitoring
and Control
Funding = Donor Fund+Government Fund
OUTFLOWS:
SACCO Loan = Poverty Alleviation Fund*MFPED Funding Rate
Donor Fund = 1000
Government Fund = 50
MFPED Funding Rate = .1
Poverty Alleviation Loan Interest = SACCO Loan*Poverty Alleviation Loan Interest Rate
58

Poverty Alleviation Loan Interest Rate = .13
SACCO CASH FLOW SECTOR
SACCO Cash(t) = SACCO Cash(t - dt) + (SACCO Income - Loan Disbursement - Ex-
penses) * dt
INIT SACCO Cash = 10
INFLOWS:
SACCO Income = SACCO Loan+Other SACCO Income
OUTFLOWS:
Loan Disbursement = SACCO Cash*Percentage Loan Disbursement
Expenses = SACCO Cash*Expenditure Rate
Annual Member Loan Repayments = Net Loan+SACCO Interest
Expenditure Rate = .2
Individual Member Savings = 10
Individual Subscription Fee = 10
Members Savings = SACCO Members*Individual Member Savings
Net Loan = Loan Disbursement*Borrowing Rate
Other SACCO Income = Annual Member Loan Repayments+Members Savings+Subscription
Fee
Percentage Loan Disbursement = .35
SACCO Interest = Net Loan*SACCO Interest Rate
SACCO Interest Rate = 0.03
Subscription Fee = Individual Subscription Fee*New Applicants
SACCO MEMBERSHIP SECTOR
SACCO Members(t) = SACCO Members(t - dt) + (New Applicants - Drop out SACCO
Members) * dt
INIT SACCO Members = 100
59
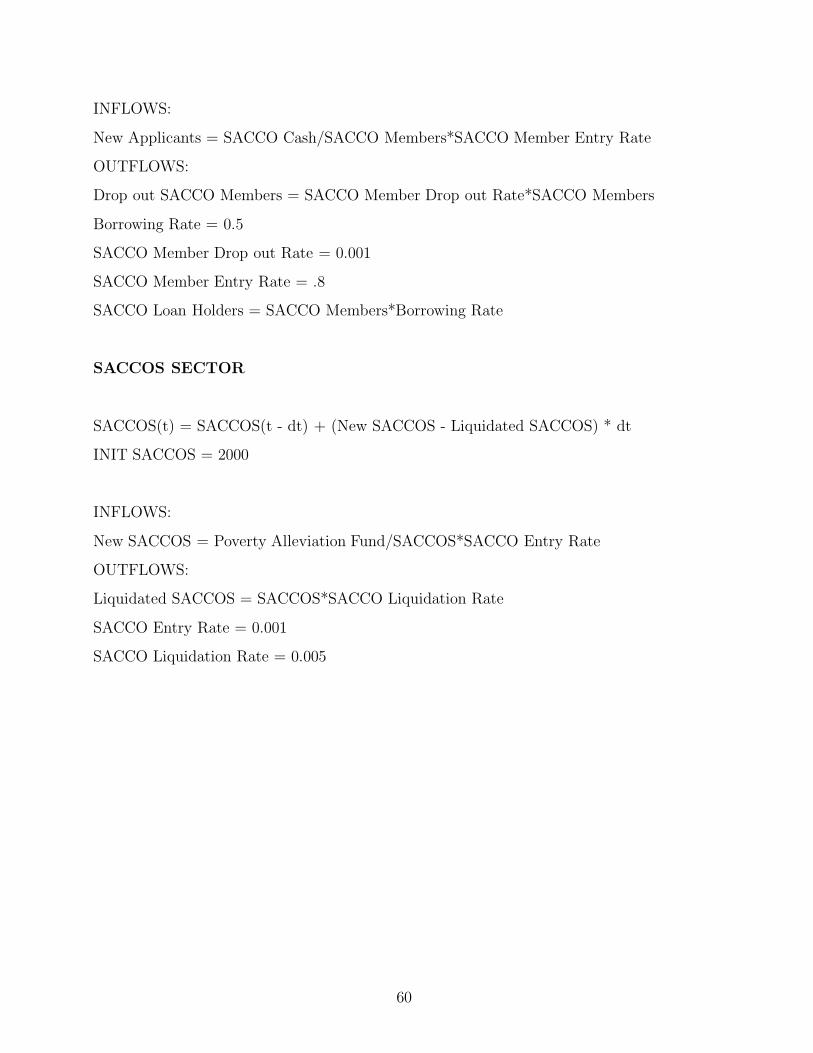
INFLOWS:
New Applicants = SACCO Cash/SACCO Members*SACCO Member Entry Rate
OUTFLOWS:
Drop out SACCO Members = SACCO Member Drop out Rate*SACCO Members
Borrowing Rate = 0.5
SACCO Member Drop out Rate = 0.001
SACCO Member Entry Rate = .8
SACCO Loan Holders = SACCO Members*Borrowing Rate
SACCOS SECTOR
SACCOS(t) = SACCOS(t - dt) + (New SACCOS - Liquidated SACCOS) * dt
INIT SACCOS = 2000
INFLOWS:
New SACCOS = Poverty Alleviation Fund/SACCOS*SACCO Entry Rate
OUTFLOWS:
Liquidated SACCOS = SACCOS*SACCO Liquidation Rate
SACCO Entry Rate = 0.001
SACCO Liquidation Rate = 0.005
60