listing, exchange plaza, 5th floor, plot - bse
TRANSCRIPT
May 5, 2022
The Secretary National Stock Exchange of India Limited Capital Market – Listing, Exchange Plaza, 5th Floor, Plot No. C/1, G Block, Bandra-Kurla Complex, Bandra (E), Mumbai 400 051
NSE SCRIP CODE: CHOLAFIN EQ
The Secretary BSE Ltd. 25th Floor, Phiroze Jeejeebhoy Towers Dalal Street, Fort Mumbai 400 001
BSE SCRIP CODE: 511243
NSDL / CDSL / NSE-WDM / BSE-F Class
Dear Sir/Madam,
Sub: Intimation on the outcome of the Board Meeting held on 5th May, 2022 and disclosure under Regulation 30 of SEBI Listing Regulations.
Kindly refer our letters dated 5th, 21st & 26th April, 2022, intimating you of the convening of the meeting of the Board of Directors to inter alia consider audited financial results for the year ended 31st March, 2022, recommendation of final dividend for FY 21-22 and increasing the overall borrowing limits.
In this regard, we wish to inform you that the Board of Directors at their meeting held today have approved the following:
1. Audited financial results:
Audited financial results (Standalone and Consolidated) for the year ended 31st March, 2022 in respect of which we enclose the following as prescribed under Regulation 33 of the Listing Regulations:
(i) The detailed format of the audited financial results being submitted as per the listing regulations. The saidresults will be uploaded online on the stock exchange website. The financial results will also be publishedas per the format prescribed in the listing regulations;
(ii) Auditor’s report from the joint statutory auditors, M/s. Price Waterhouse LLP and M/s. Sundaram &Srinivasan, Chartered Accountants;
(iii) Declaration under Regulation 33(3)(d) of the Listing Regulations;(iv) Disclosure under Regulation 52(4) of the Listing Regulations;(v) Press release with regard to the above financial results being released for publication.
Further, please find enclosed the disclosure on related party transactions on a consolidated basis and balances for the half year ended 31st March, 2022 pursuant to reg.23(9) of the Listing Regulations. The said disclosure is also being made available on the company’s website www.cholamandalam.com.
contd…2

//2//
2. Convening of Annual general meeting (AGM):
Convening of 44th AGM of the Company on Friday, the 29th July, 2022. The Register of Members will be closed from Monday, 25 July, 2022 to Friday, 29 July, 2022 (both days inclusive) for the purpose of AGM and Final dividend.
3. Increase of borrowing limits:
Recommendation for increase in overall borrowing limits of the Company from Rs.75,000 crores to Rs.1,10,000 crores for approval of the shareholders at the 44th AGM.
4. Recommendation of final dividend and payment date:
Recommendation of final dividend of Re.0.70/- per equity share (35% per equity share of face value of Rs.2/- each) for the year ended 31st March, 2022 out of the profits of the Company. The dividend will be paid within 30 days from the date of annual general meeting (i.e. on or before 27th August, 2022), upon approval by the shareholders at the 44th AGM.
Schedule of Analysts / Investors call:
Pursuant to Regulation 30(2) of the Listing Regulations, details of the schedule of Analyst / Investors call in connection with the audited financial results (Standalone and Consolidated) for the year ended 31st March, 2022 is given below:
Date Organised by Link Time 6-May-2022 Kotak Institutional Equities Click here 10 a.m.
Any subsequent changes in the schedule will be posted on the website of the Company, www.cholamandalam.com.
The meeting of Board of Directors commenced at 2.15 p.m. and concluded at 6.10 p.m.
Kindly take the above information on record and acknowledge receipt.
Thanking you,
Yours faithfully, For Cholamandalam Investment and Finance Company Limited
P. SujathaCompany Secretary
Encl.: as above

CORPORATE PRESENTATION - MARCH 2022

Table of Contents
2. Corporate overview
3. Financial performance
4. Business segments' overview
1. Group overview
5. Funding profile 6. Subsidiaries performance
8. Risk management
2
7. Environmental Social Governance

3
Murugappa Group Overview

4
Murugappa Group in a Nutshell
121Years
Years of Existence
$4.2B
$18.3B
3 Sectors 29 Businesses 10 Listed Companies
19Countries
Geographical Presence
90+Locations
Manufacturing Locations 51,000+ Work force
Consolidated Turnover(FY21)
Group Market cap (as on 31st
Mar 2022)

5
Murugappa Group Overview
Murugappa Group
Agriculture Engineering Financial services
Market Cap(Cr.) 36,105 45,748 70,852
PAT(Cr.) 2,020 589 1,824
Turnover (Cr.) 18,545 8,432 14,030
PAT(Cr.) 1,329 691 305
Turnover (Cr.) 14,145 2,604
Market Cap(Cr.) 26,711 9,384 14,488 31,260
1,521
9,584
58,978
282
4,388
NA
284
4,400 5,827
22
11,875
58
Note: Market Capitalization of Financial services incl. Chola Investments and Chola Financial Holdings. Financial Performance are of FY 20-21. Market data as on 31st Mar 2022. Source: BSE

6
Corporate Overview

SPIRIT OF MURUGAPPA
“The fundamental principle of economic activity is that no man you transact with will lose, then you shall not."
7
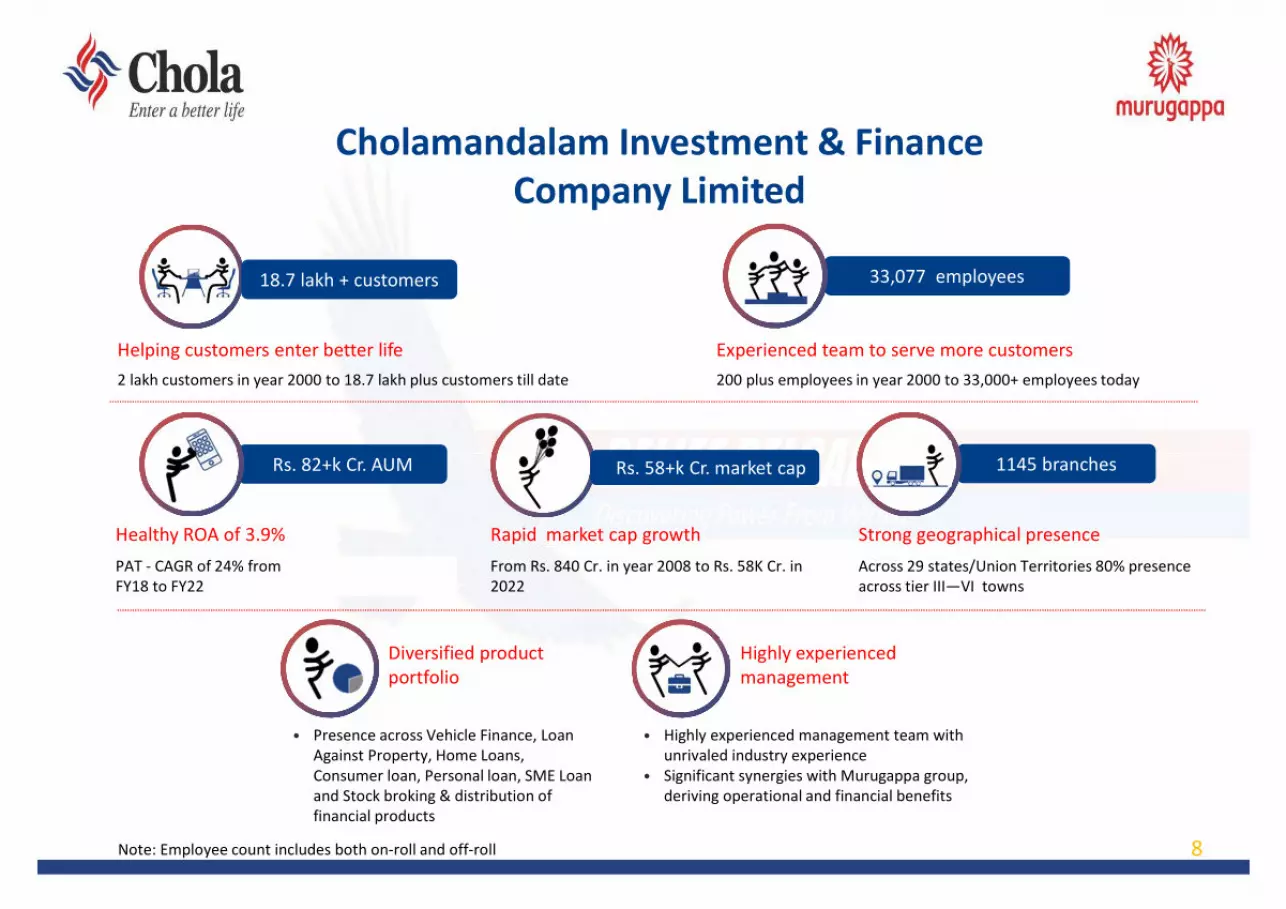
Cholamandalam Investment & FinanceCompany Limited
Helping customers enter better life2 lakh customers in year 2000 to 18.7 lakh plus customers till date
Experienced team to serve more customers200 plus employees in year 2000 to 33,000+ employees today
Rs. 82+k Cr. AUM 1145 branches
Diversified product portfolio
• Presence across Vehicle Finance, Loan Against Property, Home Loans, Consumer loan, Personal loan, SME Loan and Stock broking & distribution of financial products
Highly experienced management
• Highly experienced management team with unrivaled industry experience
• Significant synergies with Murugappa group, deriving operational and financial benefits
Healthy ROA of 3.9%PAT - CAGR of 24% fromFY18 to FY22
Rapid market cap growthFrom Rs. 840 Cr. in year 2008 to Rs. 58K Cr. in 2022
Strong geographical presenceAcross 29 states/Union Territories 80% presence across tier III—VI towns
33,077 employees
Rs. 58+k Cr. market cap
8
18.7 lakh + customers
Note: Employee count includes both on-roll and off-roll

9
Our journey so far
FY 1979-90
FY 1990-2005
FY 2005-10
FY 2010-15
FY 2015-20
FY 2020-21
• Commenced equipment financing
• Commenced Vehicle Finance business
• Started Chola Securities
• Started Chola Distribution
2006• JV with DBS bank
Singapore commenced Consumer Finance and Loan Against Property (LAP) Business
2008• LMS v3.4rollout
2009• Exited Consumer
Finance business
2011• Terminated JV with DBS• Mobile app rollout
2012• AUM crossed ₹13k Cr.• Commenced Tractor
Business
2013• AUM crossed ₹20k Cr.• Commenced HL Business• Increased VF branch
network to 473
2014• AUM crossed ₹25K Cr.• Commenced CE Business
2015• GNPA recognition at 150
Days• Increased branch network
to 534
2016• GNPA recognition at 120 days• AUM crossed ₹30K Cr.• New LEAP LOS Digital platform• LMS v3.12 platform upgrade
2017• AUM crossed ₹ 37k Cr.• GNPA recognition at 90 days• Increased branch network to 703• GaadiBazaar dealer platform
2018• AUM Crossed ₹42k Cr.• Increased branch network to 873• Gen 3 scoring model
2019• AUM crossed ₹54k Cr.• PAT crossed Rs.1000 crores• Increased branch network to 900• HL platform digitization• HRMS SaaS solution• AI/ML based scoring model• Enterprise email & collaboration platform• Revamped GaadiBazaar dealer platform
2020• AUM crossed ₹66k Cr.• Increased branch network to 1091.• Maiden issue of Masala Bonds with CDC• ECB with IFC
2021• AUM crossed ₹69k Cr.• Increased branch
network to 1137.• LAP platform
digitization• Digital Data Centre
setup• ECB with DFS• Inspite of Covid
pandemic CIFCL registered a growth of 16% growth in assets and 44% growth in PAT
LMS – Loan Management SystemLOS – Loan Origination SystemAI/ML – Artificial Intelligence / Machine Learning
2022• Reaffirmed as
constituent of FTSE4Good Index Series
• Highest disbursement in the history of Chola
• Increased branch network to 1145.
• AUM crossed ₹82k Cr• Launched Consumer &
Small Enterprise Loan (CSEL), Secured Business & Personal Loan (SBPL) and SME Loan (SME) business.
• ROA back to Pre-COVID levels.
FY 2021-22

Highlights – Q4FY22 and FY22
10
Overview
Highest disbursement in the history of Chola at Rs.12718 crores in Q4 and Rs.35,490 crores inFY22 which is a growth of 58% and 36% respectively
Business AUM growth of 10% YoY at Rs.76,907 crores.
PBT at Rs.929 crores in Q4FY22 (187% Growth) and Rs.2891 crores in FY22 (42% Growth).
PBT - ROTA stood at 4.8% for Q4 FY 22 and 3.9% in FY22.
Return on Equity at 24.6% for Q4 FY 22 and at 20.4% for FY 22.
LAP Focused on financing of Loans against Property to SME customers for their business needs and
operates out of 388 branches PAN India.
Over 80% of the book is financed against Self-Occupied residential property as collateral
Delivered Disbursements of Rs.1978 Cr in Q4 FY 22 (66% Growth) and Rs.5862 Cr (62% Growth)
PBT stood at Rs.177 Cr in Q4 FY 22 (162% Growth) and Rs.475 Cr (55% Growth)
VF
Well-diversified Product Portfolio spread across 1145 branches PAN India. Focused on financing of Commercial, Passenger, Two-wheelers, Tractors and Construction
Equipment in both New and Used Vehicles. Our focus continues to be on retail customers especially in smaller towns and rural areas. Delivered Best ever Disbursals of Rs.8785 Cr in Q4 of FY 22 (43% Growth) and Rs.25439 Cr in FY
22 (26% Growth) PBT Stood at Rs.685 Cr in Q4 of FY 22 (282% Growth) and Rs.2054 Cr(60% Growth)
Click the respective link for business performance

Highlights – Q4FY22 and FY22
11
CreditQuality
Strong collections resulted Stage 3 down to 4.37% in Mar’22 from 5.85% in Dec’21. GNPA as per RBI at 6.82% in Mar’22 as against 8.53% in Dec’21 and NNPA at 4.85% in Mar’22. Management Overlay held at Rs.500 Cr as of Mar’22
Treasury Cost of funds to borrowings is at 6.6% Well diversified Borrowing Profile cut across Banks and Market Borrowings Capital Adequacy Ratio stood at 19.62%. Tier I at 16.49%.
HL
Focused on providing Home Loans under Affordable Segment with presence across 217 branches PAN India.
89% of assets are in tier 2,3,4 cities and suburbs of tier 1 cities Delivered Disbursements of Rs.441 Cr in Q4 of FY 22 and Rs.1571 Cr in FY 22 PBT stood at Rs.67 Cr for Q4 of FY 22 (95% Growth) and Rs.215 Cr in FY 22 (91% Growth)
CSEL - Offers Personal Loans, Professional Loans & Business Loans to Salaried, Self-employed Professionals and Micro & Small businesses – Launched in 50 locations and have acquired over 1.3 Lakh customers in Q4 of FY 22. The business growth is both through Traditional and Partnerships with Fin-techs.
SBPL - Offer secured business loan with self-occupied residential property or commercial-cum-residential property as collateral – Launched in 50 locations with initial focus on South and West Markets.
SME – The product suite includes Supply chain financing, term loans for capex, loan against shares, funding on hypothecation of machinery for specific industries. Servicing out of 35 locations with business growth both through Traditional and Fintech Partnerships.
NewBusinesses
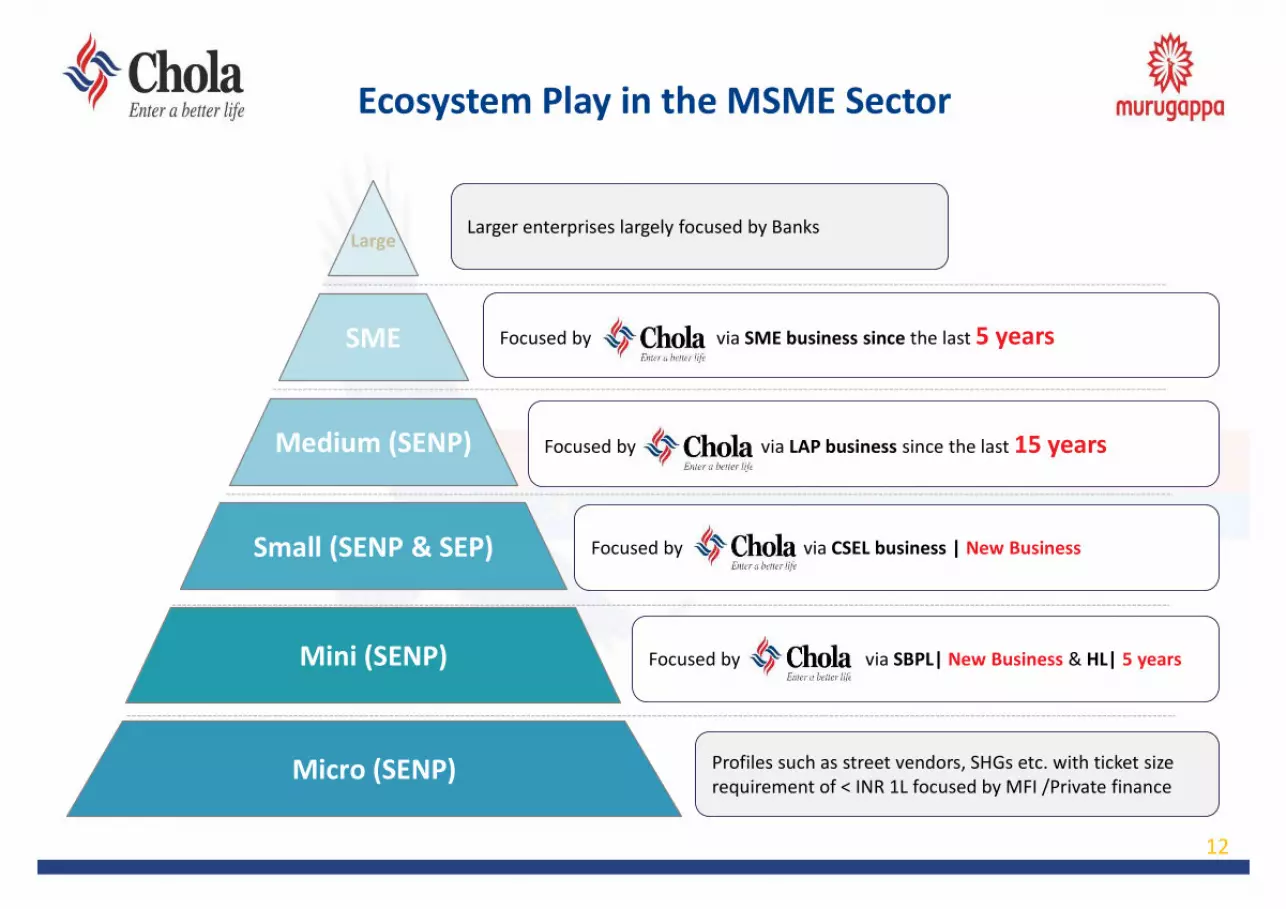
Ecosystem Play in the MSME Sector
12
SME
Medium (SENP)
Mini (SENP)
Small (SENP & SEP)
Large
Micro (SENP) Profiles such as street vendors, SHGs etc. with ticket size requirement of < INR 1L focused by MFI /Private finance
Larger enterprises largely focused by Banks
Focused by via SME business since the last 5 years
Focused by via LAP business since the last 15 years
Focused by via CSEL business | New Business
Focused by via SBPL| New Business & HL| 5 years

Shareholding
Shareholding Pattern Institutional Holders (More than 1%)
o Promoters’ share holding of 51.55% includes o Cholamandalam Financial Holdings Limited –
45.41%, o Ambadi Investments Limited – 4.11% o Others - 2.03%
13Note: As on 29th Apr 2022
Top Domestic Institutional Holding
• Axis Mutual Fund
• HDFC Mutual Fund
• Birla Sun Life Mutual Fund
• DSP Mutual Fund
• SBI Mutual Fund
• UTI Mutual Fund
• HDFC Life Insurance
Top Foreign Institutional Holding
• Capital World
• Vanguard
• Blackrock
• WhiteOak Capital
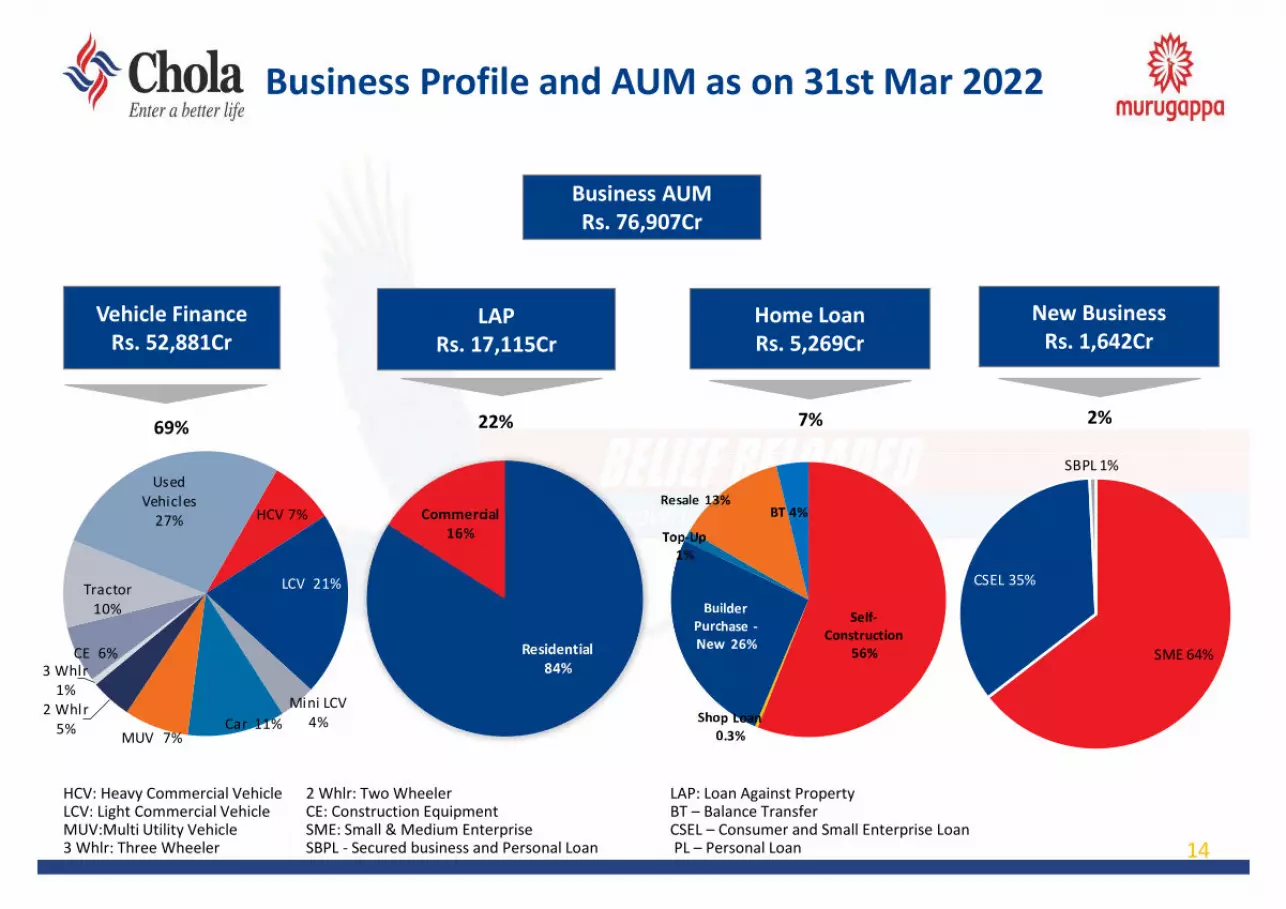
Business Profile and AUM as on 31st Mar 2022
Business AUMRs. 76,907Cr
Vehicle Finance Rs. 52,881Cr
LAPRs. 17,115Cr
Home LoanRs. 5,269Cr
22%
14
7%69%
New BusinessRs. 1,642Cr
2%
Self-Construction
56%
Shop Loan0.3%
Builder Purchase -New 26%
Top-Up1%
Resale 13%BT 4%HCV 7%
LCV 21%
Mini LCV4%Car 11%
MUV 7%
2 Whlr5%
3 Whlr 1%
CE 6%
Tractor 10%
Used Vehicles
27%
HCV: Heavy Commercial Vehicle 2 Whlr: Two Wheeler LAP: Loan Against PropertyLCV: Light Commercial Vehicle CE: Construction Equipment BT – Balance TransferMUV:Multi Utility Vehicle SME: Small & Medium Enterprise CSEL – Consumer and Small Enterprise Loan3 Whlr: Three Wheeler SBPL - Secured business and Personal Loan PL – Personal Loan
SME 64%
CSEL 35%
SBPL 1%

Strong Geographical Presence
• 1145 branches across 29 states/Union territories: 1093 VF, 388 LAP (380 co-located with VF), 217 HL (177 co-located with VF) & 4 locations for Head office Functions and Operations in Tamil Nadu
• 80% locations are in Tier-III, Tier-IV, Tier V and Tier-VI towns
Chhattisgarh (67)
Jharkand (29)
Odisha (59)
West Bengal (62)
Delhi (5)
Punjab (23)
Rajasthan (83) UP (73)
Uttarakhand (16)
Karnataka (64)
Kerala (49)Tamil Nadu (117)
Maharashtra (119)
Puducherry (2)
Gujarat
(65)
Goa (2)
Madhya Pradesh(80)
Andhra Pradesh (53)
Assam (25)
Haryana (33)
Himachal Pradesh (17)
Telangana (41)
Jammu & Kashmir (5)
Tripura (4)
Meghalaya (3)
Mizoram (1)
Chandigarh (2)
Note: Figures in brackets represents total no. of branches as on 31st Mar 2022. 15
Bihar (43)
Dadra & Nagar Haveli (1)
Sikkim (1) Arunachal Pradesh (1)
873 9071091 1137 1145
FY18 FY19 FY20 FY21 FY22
26% 27% 27% 27% 28%
24% 24% 23% 22% 22%
23% 24% 24% 23% 23%
27% 25% 26% 26% 26%
FY18 FY19 FY20 FY21 FY22South North West East
79% 79% 81% 80% 80%
14% 14% 13% 13% 13%7% 7% 6% 7% 7%
FY18 FY19 FY20 FY21 FY22Rural Semi-Urban Urban

16
Financial Performance

Financial Snapshot —10 Years
17
• Capital Infusion• Spurt in GNPA in FY20 and FY 21 was due to Covid and in FY 22 was due to new RBI norms on NPA
FY13 FY14 FY15 FY16 FY17 FY18 FY19 FY20 FY21 FY22 CAGR CAGR
IGAAP IGAAP IGAAP IGAAP IGAAP INDAS INDAS INDAS INDAS INDAS (5 years)(10
years)
Disbursem ents 12,118 13,114 12,808 16,380 18,591 25,114 30,451 29,091 26,043 35,490 36% 9% 13%Assets under m anagem ent 18,998 23,253 25,452 29,650 34,167 42,924 54,279 60,549 69,996 76,907 10% 16% 17%
Total Income 2,556 3,263 3,691 4,194 4,660 5,529 7,049 8,715 9,576 10,139 6% 16% 17%
Interest expenses 1,411 1,771 1,960 2,051 2,231 2,659 3,589 4,592 4,576 4,299 -6% 13% 13%
Net Incom e 1,145 1,492 1,731 2,143 2,430 2,870 3,460 4,123 5,000 5,840 17% 19% 20%
Operating Expenses 570 658 749 845 1,013 1,115 1,270 1,578 1,583 2,069 30.6% 17% 15%Operating Profit Before
Loan Losses 575 834 982 1,298 1,416 1,754 2,190 2,545 3,416 3,771 10% 21% 23%
Loan Losses & Prov ision 124 283 325 427 311 353 367 959 1,378 880 -36% 26% 24%
Profit before tax 451 550 657 871 1,106 1,401 1,823 1,586 2,038 2,891 42% 20% 23%
Profit after tax 307 364 435 568 719 918 1,186 1,052 1,515 2,147 42% 24% 24%
Ratios
Net Income to assets (%) 7.6 7.7 6.9 7.7 7.5 7.7 7.0 6.9 7.3 7.9
Expense to assets (%) 3.8 3.4 3.0 3.0 3.1 3.0 2.6 2.6 2.3 2.8
Losses and prov isions (%) 0.8 1.5 1.3 1.5 1.0 0.9 0.7 1.6 2.0 1.2
Return on assets (PBT) (%) 3.0 2.8 2.6 3.1 3.4 3.7 3.7 2.7 3.0 3.9
Networth *1965 2295 *3173 3657 4285 5098 6176 *8172 9560 11708
Tier I 11.1 10.5 13.0 13.3 13.6 13.2 12.6 15.3 15.1 16.5
CAR (%) *19.0 17.2 *21.2 19.7 18.6 18.4 17.4 *20.68 19.1 19.6
Return on equity (%) 18.1 17.1 15.8 16.7 18.1 19.6 20.9 15.2 16.9 20.4
Earnings per share (Basic) 4.6 5.1 6.0 7.5 9.2 11.8 15.2 13.4 18.5 26.2
Dividend 35% 35% 35% 45% 55% 65% 65% 85% 100% 100%
Market Capitalisation 3883 4125 8423 11140 15072 22667 22624 12535 45824 58978
GNPA (%) 1.0 1.9 3.1 3.5 4.7 3.4 2.7 3.8 4.0 6.8
NNPA (%) 0.2 0.7 2.0 2.1 3.2 2.2 1.7 2.2 2.2 4.7
NPA Recognition 6month 6month 5month 4month 3month 3month 3month 3month 3month 3month
Branch Network 518 574 534 534 703 873 900 1091 1137 1145
YoYFinancials Snapshot

Disbursements
18
Disbursements (%)Disbursements (₹Cr)
20,607
24,983 23,387 20,249
25,439
3,174
3,837 3,662
3,627
5,862
606
1,157 1,505
1,542
1,571
726
474 537
624
2,618
* 25,114
* 30,451 * 29,091
* 26,043
* 35,490
FY18 FY19 FY20 FY21 FY22
VF LAP HL New Businesses * Total Disbursements
82% 82% 80% 78%72%
13% 13% 13% 14%17%
2% 4% 5% 6%4%
3% 2% 2% 2%7%
FY18 FY19 FY20 FY21 FY22VF LAP HL New Business
New business includes SME, CSEL and SBPL

Assets Under Management
19
Business - Assets under Management (%)Business - Assets under Management (₹Cr)
31,473 40,606 44,206
50,415 52,881
10,097
11,626 12,960
14,777 17,115
978
1,912
3,125
4,345
5,269
377
135
258
458
1,642
* 42,924
* 54,279
* 60,549
* 69,996
* 76,907
FY18 FY19 FY20 FY21 FY22
VF LAP HL New Businesses * Total AUM
73% 75% 73% 72% 69%
24% 21% 21% 21% 22%
2% 4% 5% 6% 7%
1% 0% 0% 1% 2%
FY18 FY19 FY20 FY21 FY22VF LAP HL New Businesses
New business includes SME, CSEL and SBPL
20
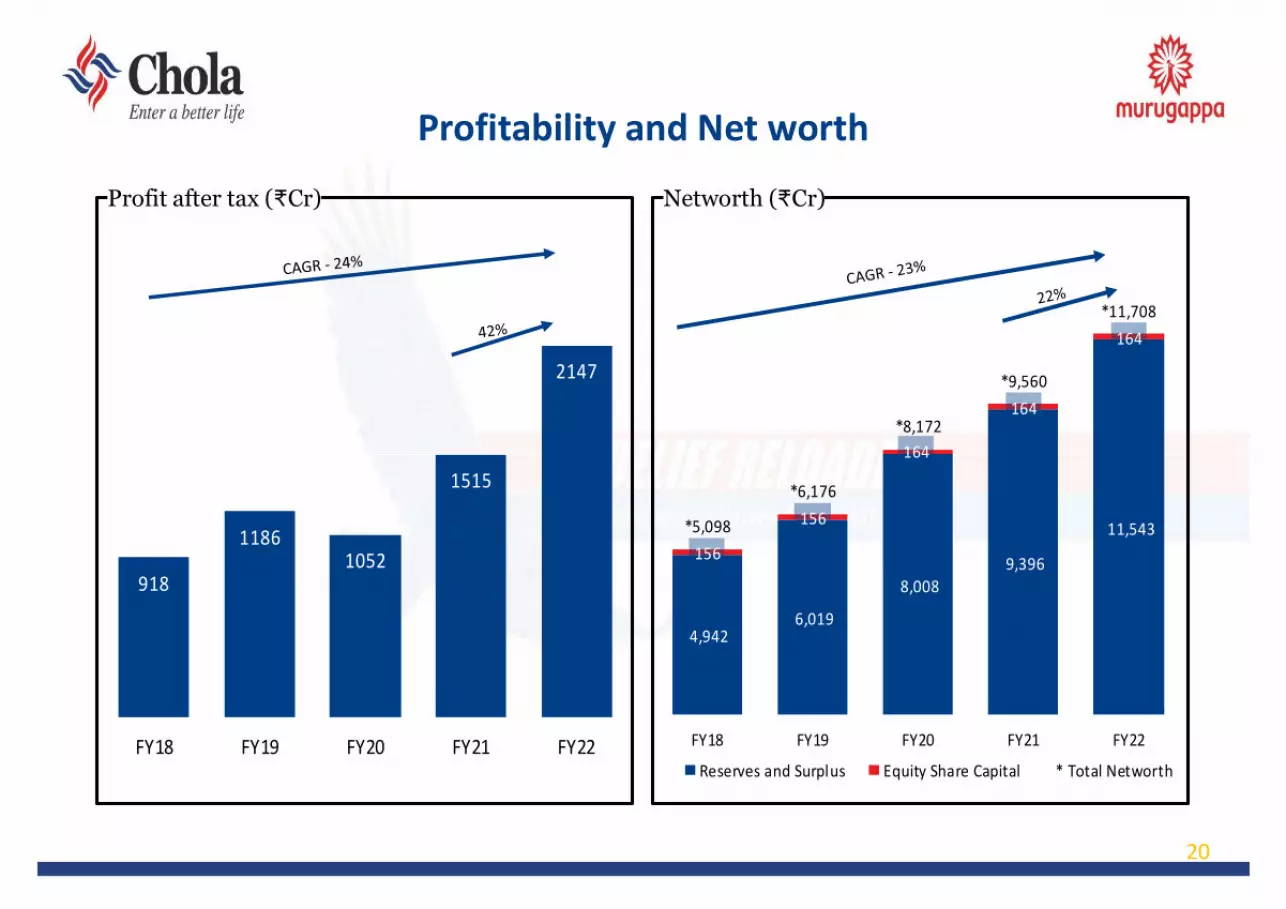
Profitability and Net worth
Profit after tax (₹Cr) Networth (₹Cr)
918
11861052
1515
2147
FY18 FY19 FY20 FY21 FY22
4,942 6,019
8,008 9,396
11,543 156
156
164
164
164
*5,098
*6,176
*8,172
*9,560
*11,708
FY18 FY19 FY20 FY21 FY22
Reserves and Surplus Equity Share Capital * Total Networth

Asset RatiosNet Income Margin (%) Expenses Ratio (%)
21
Loan Losses & Provisions (%) ROA - PBT (%)
7.7%
7.0% 6.9%
7.3%
7.9%
FY18 FY19 FY20 FY21 FY22
3.0%
2.6% 2.6%
2.3%
2.8%
FY18 FY19 FY20 FY21 FY22
0.9%
0.7%
1.6%
2.0%
1.2%
FY18 FY19 FY20 FY21 FY22
3.7% 3.7%
2.7%3.0%
3.9%
FY18 FY19 FY20 FY21 FY22

Shareholders’ Returns Ratios
P/E Ratio P/BV Ratio
22
Return on equity (%) Earnings per share (₹)
19.6%20.9%
15.2%16.9%
20.4%
FY18 FY19 FY20 FY21 FY22
11.8
15.213.4
18.5
26.2
FY18 FY19 FY20 FY21 FY22
24.7
19.1
11.4
30.2
27.5
FY18 FY19 FY20 FY21 FY22
4.4
3.7
1.5
4.8 5.0
FY18 FY19 FY20 FY21 FY22

Profit and Loss Statement (As per IND AS)
23
₹ Cr
Particulars Q1FY21 Q2FY21 Q3FY21 Q4FY21 FY21 Q1FY22 Q2FY22 Q3FY22 Q4FY22 FY22Growth %Q4-o-Q4
Growth %Y-o-Y
Disbursements 3,589 6,457 7,926 8,071 26,043 3,635 8,706 10,430 12,718 35,490 58% 36%Closing Assets 70,826 74,471 75,813 76,518 76,518 75,763 75,063 79,161 82,904 82,904 8% 8%Operating Income 2,121 2,456 2,520 2,478 9,576 2,478 2,481 2,547 2,632 10,139 6% 6%Finance Charges 1,131 1,185 1,140 1,120 4,576 1,104 1,078 1,046 1,071 4,299 -4% -6%Net Income 991 1,271 1,380 1,358 5,000 1,374 1,403 1,501 1,561 5,840 15% 17%Expenses 346 355 369 514 1,583 371 518 532 649 2,069 26% 31%Net Credit Losses 64 334 460 520 1,378 563 69 265 -17 880 -103% -36%PBT 581 582 551 324 2,038 441 817 704 929 2,891 187% 42%PAT 431 432 409 243 1,515 327 607 524 690 2,147 184% 42%Asset RatiosIncome 13.3% 14.2% 14.4% 14.0% 14.0% 13.8% 13.7% 13.9% 13.7% 13.7%Cost of Funds 7.1% 6.9% 6.5% 6.3% 6.7% 6.1% 5.9% 5.7% 5.6% 5.8%Net Income Margin 6.2% 7.4% 7.9% 7.7% 7.3% 7.7% 7.7% 8.2% 8.1% 7.9%Expense 2.2% 2.1% 2.1% 2.9% 2.3% 2.1% 2.9% 2.9% 3.4% 2.8%Losses & Provisions 0.4% 1.9% 2.6% 2.9% 2.0% 3.1% 0.4% 1.4% -0.1% 1.2%ROA–PBT 3.6% 3.4% 3.1% 1.8% 3.0% 2.5% 4.5% 3.8% 4.8% 3.9%ROA–PAT 2.7% 2.5% 2.3% 1.4% 2.2% 1.8% 3.3% 2.9% 3.6% 2.9%Gross - Stage 3 1,996 1,756 1,703 2,705 2,705 4,545 4,271 4,244 3,343 3,343ECL Provisions - Stage 3 831 749 765 1,197 1,197 1,614 1,557 1,647 1,326 1,326Coverage Ratio - Stage 3 41.6% 42.6% 44.9% 44.3% 44.3% 35.5% 36.5% 38.8% 39.7% 39.7%
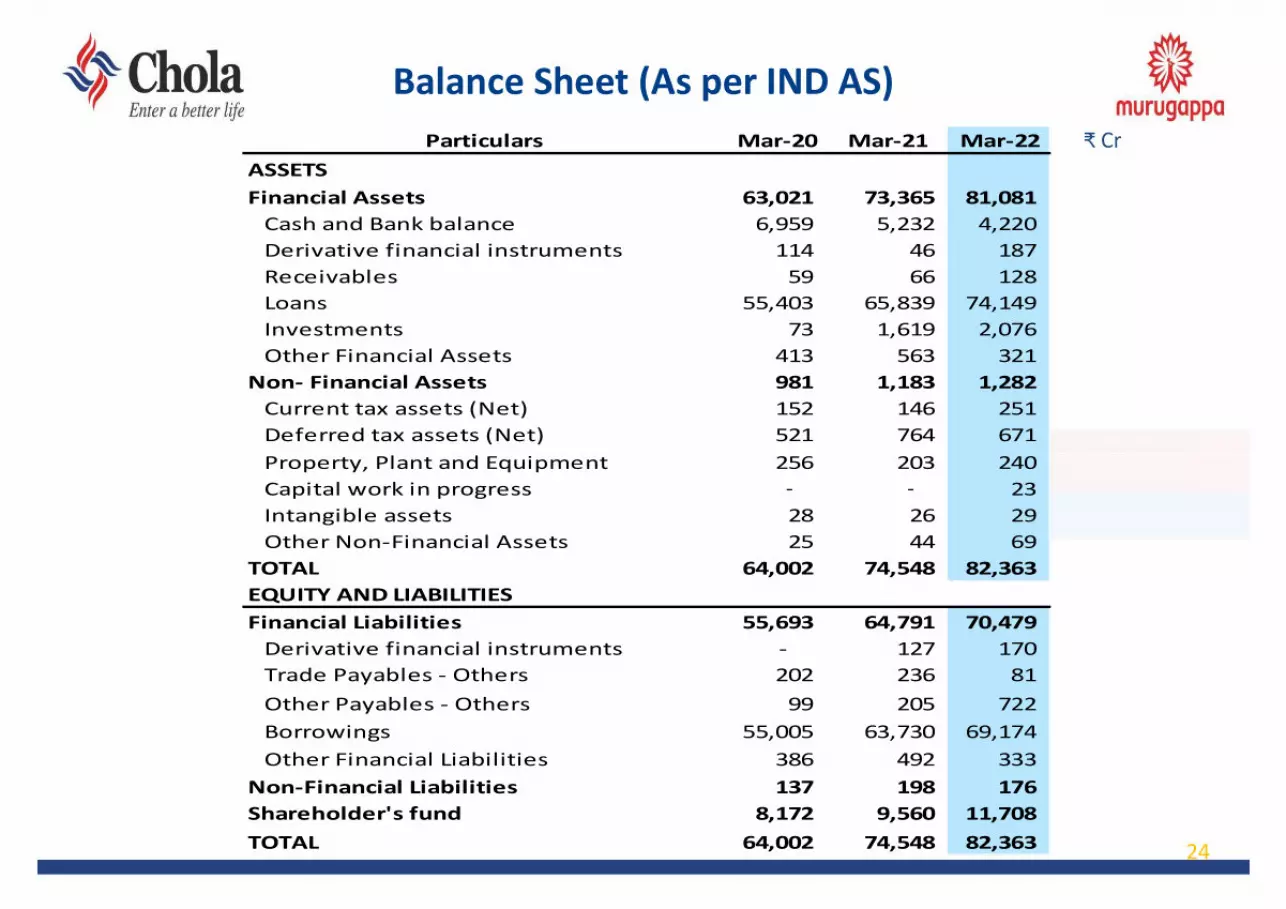
Balance Sheet (As per IND AS)₹ Cr
24
Particulars Mar-20 Mar-21 Mar-22ASSETSFinancial Assets 63,021 73,365 81,081 Cash and Bank balance 6,959 5,232 4,220 Derivative financial instruments 114 46 187 Receivables 59 66 128 Loans 55,403 65,839 74,149 Investments 73 1,619 2,076 Other Financial Assets 413 563 321 Non- Financial Assets 981 1,183 1,282 Current tax assets (Net) 152 146 251 Deferred tax assets (Net) 521 764 671 Property, Plant and Equipment 256 203 240 Capital work in progress - - 23 Intangible assets 28 26 29 Other Non-Financial Assets 25 44 69 TOTAL 64,002 74,548 82,363 EQUITY AND LIABILITIESFinancial Liabilities 55,693 64,791 70,479 Derivative financial instruments - 127 170 Trade Payables - Others 202 236 81 Other Payables - Others 99 205 722 Borrowings 55,005 63,730 69,174 Other Financial Liabilities 386 492 333 Non-Financial Liabilities 137 198 176 Shareholder's fund 8,172 9,560 11,708 TOTAL 64,002 74,548 82,363

Stagewise Assets & Provision Summary
25
₹ Cr
Mar-21 Mar-21 Mar-21 Mar-22 Mar-22 Mar-22 Mar-21 Mar-21 Mar-21 Mar-22 Mar-22 Mar-22
Particulars Normal Mgt Overlay
Total Normal Mgt Overlay
Total Normal Mgt Overlay
Total Normal Mgt Overlay
Total
INR Cr INR Cr INR Cr INR Cr INR Cr INR Cr % to GA % to GA % to GA % to GA % to GA % to GAGross Assets 68,284 68,284 76,478 76,478 100.0% 100.0% 100.0% 100.0%
Stage 1 61,348 61,348 67,318 67,318 89.84% 89.84% 88.02% 88.02%Stage 2 4,231 4,231 5,817 5,817 6.20% 6.20% 7.61% 7.61%Stage 3 2,705 2,705 3,343 3,343 3.96% 3.96% 4.37% 4.37%
Provision 1,344 1,100 2,444 1,829 500 2,329 1.97% 1.61% 3.58% 2.39% 0.65% 3.04%Stage 1 167 371 537 343 - 343 0.27% 0.60% 0.88% 0.51% - 0.51%Stage 2 413 297 710 615 45 660 9.76% 7.01% 16.77% 10.57% 0.77% 11.34%Stage 3 765 433 1,197 871 455 1,326 28.27% 16.00% 44.27% 26.05% 13.62% 39.67%
Net Assets 66,940 65,839 74,649 74,149 98.03% 96.42% 97.61% 96.96%Stage 1 61,181 60,810 66,975 66,975 89.60% 89.06% 87.57% 87.57%Stage 2 3,818 3,521 5,202 5,158 5.59% 5.16% 6.80% 6.74%Stage 3 1,940 1,508 2,472 2,017 2.84% 2.21% 3.23% 2.64%
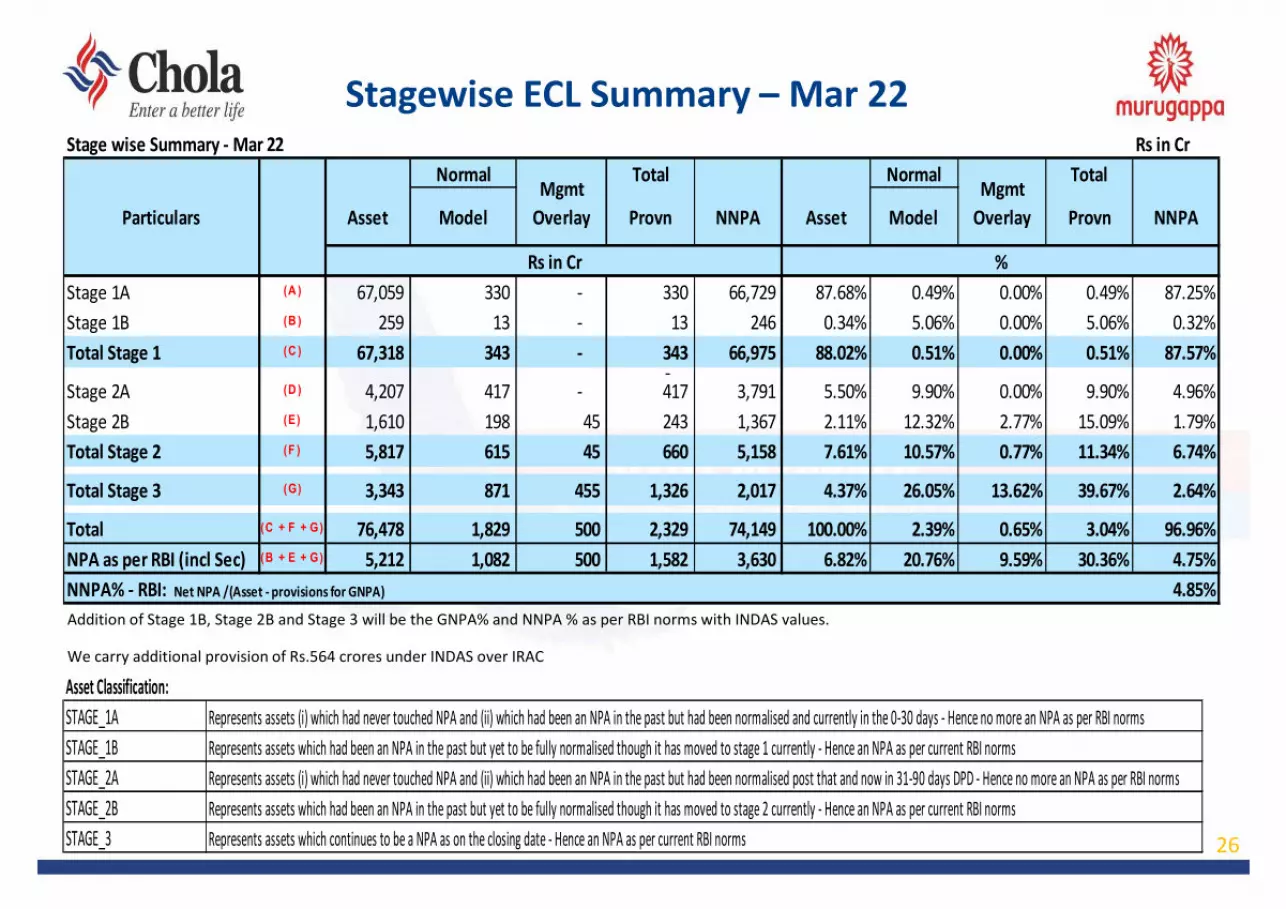
Stagewise ECL Summary – Mar 22
26
Addition of Stage 1B, Stage 2B and Stage 3 will be the GNPA% and NNPA % as per RBI norms with INDAS values.
We carry additional provision of Rs.564 crores under INDAS over IRAC
Stage wise Summary - Mar 22 Rs in CrNormal Total Normal Total
Asset Model Provn NNPA Asset Model Provn NNPA
Stage 1A (A ) 67,059 330 - 330 66,729 87.68% 0.49% 0.00% 0.49% 87.25%Stage 1B (B ) 259 13 - 13 246 0.34% 5.06% 0.00% 5.06% 0.32%Total Stage 1 (C ) 67,318 343 - 343 66,975 88.02% 0.51% 0.00% 0.51% 87.57%
- Stage 2A (D ) 4,207 417 - 417 3,791 5.50% 9.90% 0.00% 9.90% 4.96%Stage 2B (E) 1,610 198 45 243 1,367 2.11% 12.32% 2.77% 15.09% 1.79%Total Stage 2 (F ) 5,817 615 45 660 5,158 7.61% 10.57% 0.77% 11.34% 6.74%
Total Stage 3 (G) 3,343 871 455 1,326 2,017 4.37% 26.05% 13.62% 39.67% 2.64%
Total (C + F + G) 76,478 1,829 500 2,329 74,149 100.00% 2.39% 0.65% 3.04% 96.96%NPA as per RBI (incl Sec) (B + E + G) 5,212 1,082 500 1,582 3,630 6.82% 20.76% 9.59% 30.36% 4.75%NNPA% - RBI: Net NPA /(Asset - provisions for GNPA) 4.85%
ParticularsMgmt
OverlayMgmt
Overlay
Rs in Cr %
Asset Classification:STAGE_1A Represents assets (i) which had never touched NPA and (ii) which had been an NPA in the past but had been normalised and currently in the 0-30 days - Hence no more an NPA as per RBI normsSTAGE_1B Represents assets which had been an NPA in the past but yet to be fully normalised though it has moved to stage 1 currently - Hence an NPA as per current RBI normsSTAGE_2A Represents assets (i) which had never touched NPA and (ii) which had been an NPA in the past but had been normalised post that and now in 31-90 days DPD - Hence no more an NPA as per RBI normsSTAGE_2B Represents assets which had been an NPA in the past but yet to be fully normalised though it has moved to stage 2 currently - Hence an NPA as per current RBI normsSTAGE_3 Represents assets which continues to be a NPA as on the closing date - Hence an NPA as per current RBI norms

Stage 3 Assets Product-wise
27
As per revised RBI norms GNPA% & NNPA% as of March’22 is at 6.82% and 4.85% respectively.
Asset ClassClosing Asset
Gross Stage 3
Stage 3 Asset %
ECL Provision
Provision Coverage
Net Stage 3
Net Stage 3%
Mar'22 76,478 3,343 4.37% 1,326 39.67% 2,017 2.64%VF 53,816 2,097 3.90% 851 40.60% 1,245 2.31%LAP 15,768 1,041 6.60% 363 34.90% 677 4.30%HL 5,196 155 2.98% 73 47.23% 82 1.57%Others 1,697 51 2.98% 38 76.04% 12 0.71%
Dec'21 72,499 4,244 5.85% 1,647 38.80% 2,598 3.58%VF 51,895 2,850 5.49% 1,132 39.72% 1,718 3.31%LAP 14,925 1,176 7.88% 411 34.99% 764 5.12%HL 4,841 167 3.46% 64 38.16% 104 2.14%Others 837 51 6.07% 39 77.40% 11 1.37%

Chola –Stage 3 Assets Trend
28
As per revised RBI norms GNPA% & NNPA% as of March’22 is at 6.82% and 4.85% respectively.
29
Business Overview

Vehicle Finance

• Disbursements grew by 43% in Q4FY22 at Rs.8785 crores ascompared to Rs.6153 crores in Q4FY21 and by 26% at Rs.25439 croresin FY22 as compared to Rs.20249 crores in FY 21.
Disbursements
Assets under management • AUM have grown by 5% YoY
Loss and provisions
• Loan losses improved to 0.04% in Q4FY22 from 3.6% in Q4FY21 and 1.4% in FY22 from 2.5% in FY21.
Profit before tax• PBT grew by 282% at Rs.685 crores in Q4FY22 as compared to Rs.179
crores in Q4FY21 and by 60% at Rs.2054 crores in FY 22 as compared to Rs.1287 crores in FY 21.
Vehicle Finance: Q4FY22 & FY22 Performance
31

Sector Outlook
The Light commercial vehicle segment had a growthof 14% in Q4 FY’22 & 15% for the full year. Thissegment is showing healthy recovery trendssupported by replacement demand and recovery inthe macroeconomic environment in the comingquarters.
The Small commercial vehicle segment had a growthof 25% in Q4 FY’22 & 23% for the full year. Theimpact on account of the pandemic was minimal inthis segment due to its nature of deployment in lastmile connectivity and there is a high expectation offavourable growth during the year.
The Heavy commercial vehicle segment had agrowth of 22% in Q4 FY’22 & 54% for the full year onaccount of a low base in the previous year. Therecovery in macroeconomic environment andimproved freight availability will support growth inthis segment.
Chola’s Position
Increased demand for Light commercial vehicle willhelp us garner higher market share due to ourpresence in rural areas along with a balanced salesand collection approach.
Uptick in demand for Small commercial vehicles willhelp us improve market share combined with ourvigilant approach to financing based on vehicleviability and earning capacity.
Our exposure in this segment is 8% at a portfoliolevel. We continue to keep a close watch on thissegment for further improvement in marketconditions and fleet owner sentiments.
Sector outlook – Vehicle Finance business (1/3)
32
Sector outlook – Vehicle Finance business (2/3)
Sector Outlook
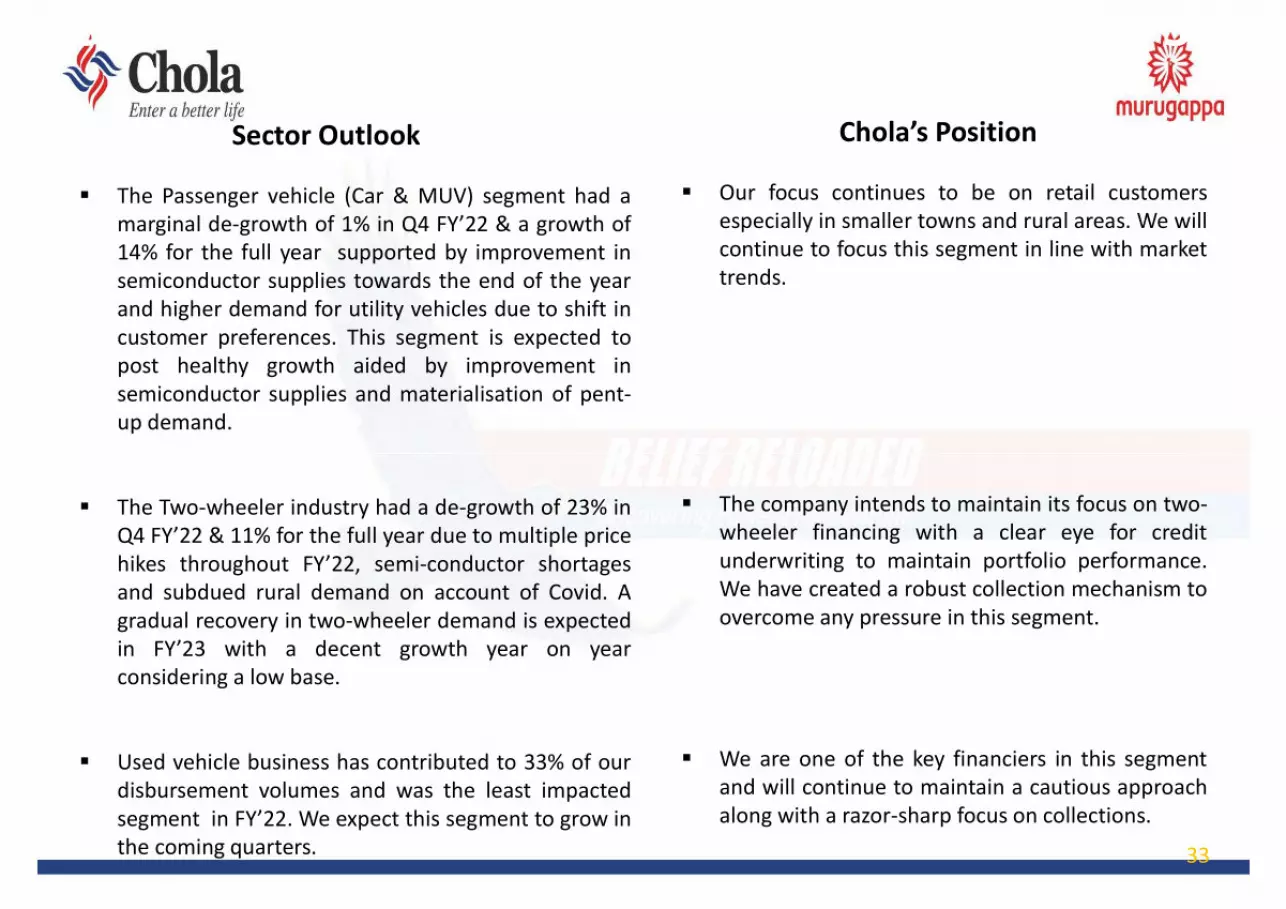
The Passenger vehicle (Car & MUV) segment had amarginal de-growth of 1% in Q4 FY’22 & a growth of14% for the full year supported by improvement insemiconductor supplies towards the end of the yearand higher demand for utility vehicles due to shift incustomer preferences. This segment is expected topost healthy growth aided by improvement insemiconductor supplies and materialisation of pent-up demand.
The Two-wheeler industry had a de-growth of 23% inQ4 FY’22 & 11% for the full year due to multiple pricehikes throughout FY’22, semi-conductor shortagesand subdued rural demand on account of Covid. Agradual recovery in two-wheeler demand is expectedin FY’23 with a decent growth year on yearconsidering a low base.
Used vehicle business has contributed to 33% of ourdisbursement volumes and was the least impactedsegment in FY’22. We expect this segment to grow inthe coming quarters.
Chola’s Position
Our focus continues to be on retail customersespecially in smaller towns and rural areas. We willcontinue to focus this segment in line with markettrends.
The company intends to maintain its focus on two-wheeler financing with a clear eye for creditunderwriting to maintain portfolio performance.We have created a robust collection mechanism toovercome any pressure in this segment.
We are one of the key financiers in this segmentand will continue to maintain a cautious approachalong with a razor-sharp focus on collections.
33

Sector outlook – Vehicle Finance business (3/3)
Sector Outlook
The Construction Equipment segment had a de-growth of 17% in Q4 FY’22 & 8% for the full year dueto increasing cost of equipment prices, mutedrentals and monsoon related impediments whichimpacted the road and construction sector. However,there is positive sentiments in the market withexpectation of higher allocation to infra sector bythe government and restoration of normalcy inmining and construction activity which might resultin a positive growth this year.
The Tractor industry had a de-growth of 26% in Q4FY’22 & 6% for the full year due to the huge volumesin FY’21 which was the ever all-time high for tractorsales in India, Tractor volumes might show minimalgrowth this year given the high base and moderationin demand.
Chola’s Position
Our exposure in this segment is around 6% at aportfolio level and our focus will be on buildingquality book.
We will approach this segment with a clear watch onportfolio considering various external factors likeuneven rainfall, crop loss and irregular cash flows.
34
Auto Industry Outlook
Trend in Domestic LCV Sales Trend in Domestic SCV Sales
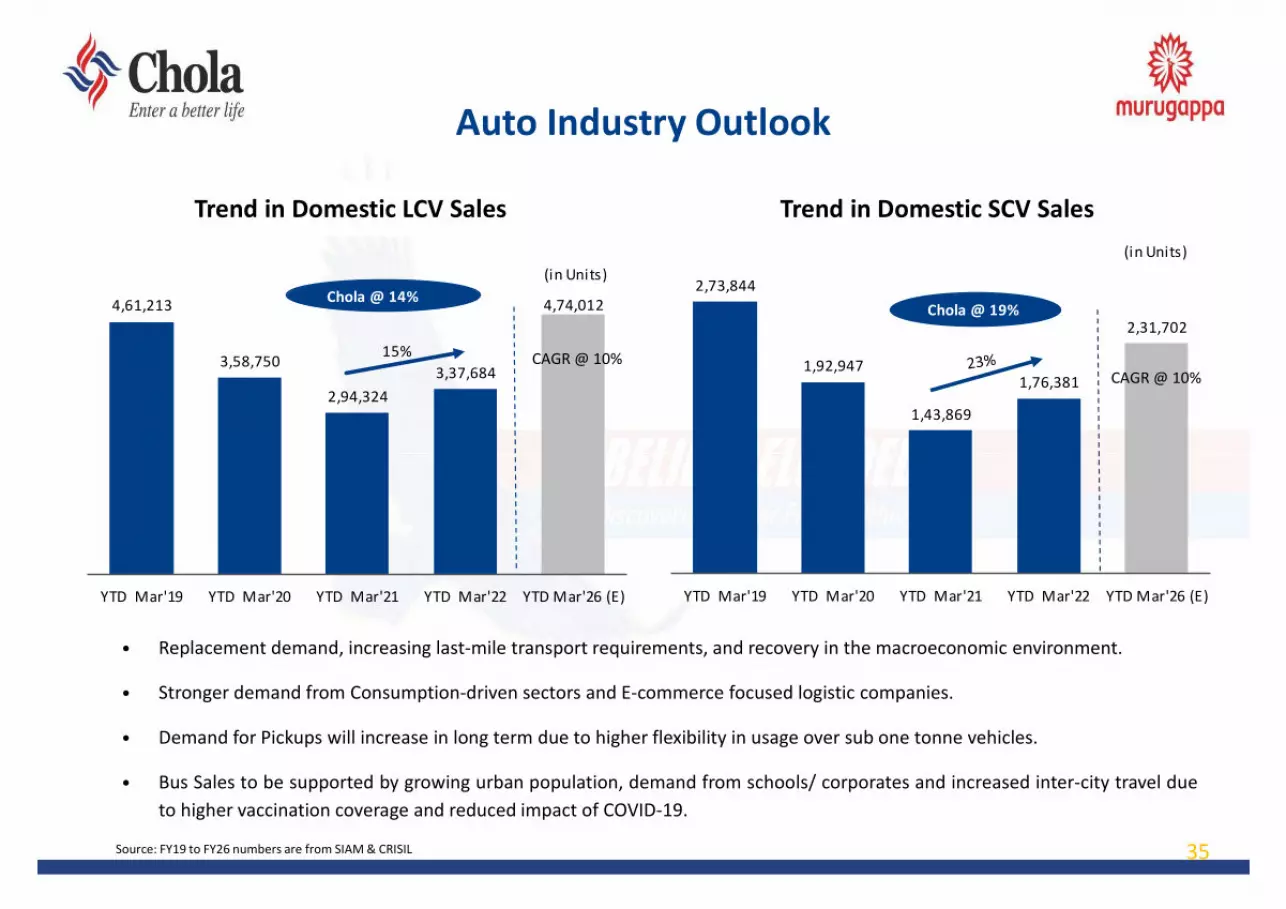
• Replacement demand, increasing last-mile transport requirements, and recovery in the macroeconomic environment.
• Stronger demand from Consumption-driven sectors and E-commerce focused logistic companies.
• Demand for Pickups will increase in long term due to higher flexibility in usage over sub one tonne vehicles.
• Bus Sales to be supported by growing urban population, demand from schools/ corporates and increased inter-city travel dueto higher vaccination coverage and reduced impact of COVID-19.
Source: FY19 to FY26 numbers are from SIAM & CRISIL 35
4,61,213
3,58,750
2,94,3243,37,684
4,74,012
YTD Mar'19 YTD Mar'20 YTD Mar'21 YTD Mar'22 YTD Mar'26 (E)
(in Units)Chola @ 14%
15%
2,73,844
1,92,947
1,43,869
1,76,381
2,31,702
YTD Mar'19 YTD Mar'20 YTD Mar'21 YTD Mar'22 YTD Mar'26 (E)
(in Units)
Chola @ 19%
CAGR @ 10%CAGR @ 10%

Auto Industry Outlook
Trend in Domestic HCV Sales Trend in Domestic Car & MUV Sales
• Improved industrial activity, steady agricultural output,rebound of economic activity and the government’s focuson infrastructure will aid growth.
• Pick up in construction and mining activities over the longterm would drive demand.
• Higher Income, lower penetration and lower cost ofcapital to boost long term demand.
• Improvement in semiconductor supplies andmaterialisation of pent-up demand.
36Source: FY19 to FY26 numbers are from SIAM & CRISIL
2,95,394
1,65,256
1,28,353
1,97,641
3,19,383
YTD Mar'19 YTD Mar'20 YTD Mar'21 YTD Mar'22 YTD Mar'26 (E)
(in Units)
Chola @ 85%
54% 33,54,249
27,74,159 27,13,47030,82,105
43,70,071
YTD Mar'19 YTD Mar'20 YTD Mar'21 YTD Mar'22 YTD Mar'26 (E)
(in Units)Chola @10%
14%CAGR @ 10%
CAGR @ 20%

Vehicle Finance—Business Model & Positioning
37
CV PV
• ~65% of disbursements are to micro & small enterprises and agri -based customer segment
• Chola positioning-– Middle of the pyramid through New CVs,
Used CVs – Top of the Bottom of the pyramid through SCV
& older CVs Shubh
• ~ 66% of disbursements are to Chola Existing, Agri & Commercial usage customers
• ~ 34% disbursements are to Self Employed with financials
• Chola positioning-– Middle of the pyramid is into Agri, Asset &
Commercial
Principal Operator
> 50 Vehicles
Large Operators 26-50 vehicles HCV
HCV : Heavy commercial vehicle, LCV : Light commercialvehicle, SCV : Small commercial vehicle, SRTO:
Small Road Transport Operators
Industry
Chola Position
Medium Operators 10 -25 – HCV & LCV vehicles
High
Low
RISK
High
Low
Retu
rns
First Time Users & Small Ticket Operators, older vehicles HCV, LCV & SCV
Salaried
PV: Passenger Vehicle, MUV :Multi Utility Vehicle
High
Low
RISK
High
Low
Retu
rns
SRTOs – HCV & LCV
Taxi and Tour Operator
Agri, Asset & Commercial, Used
Industry
Chola Position
Self Employed with Financials
Vehicle Finance—Business Model & Positioning
38
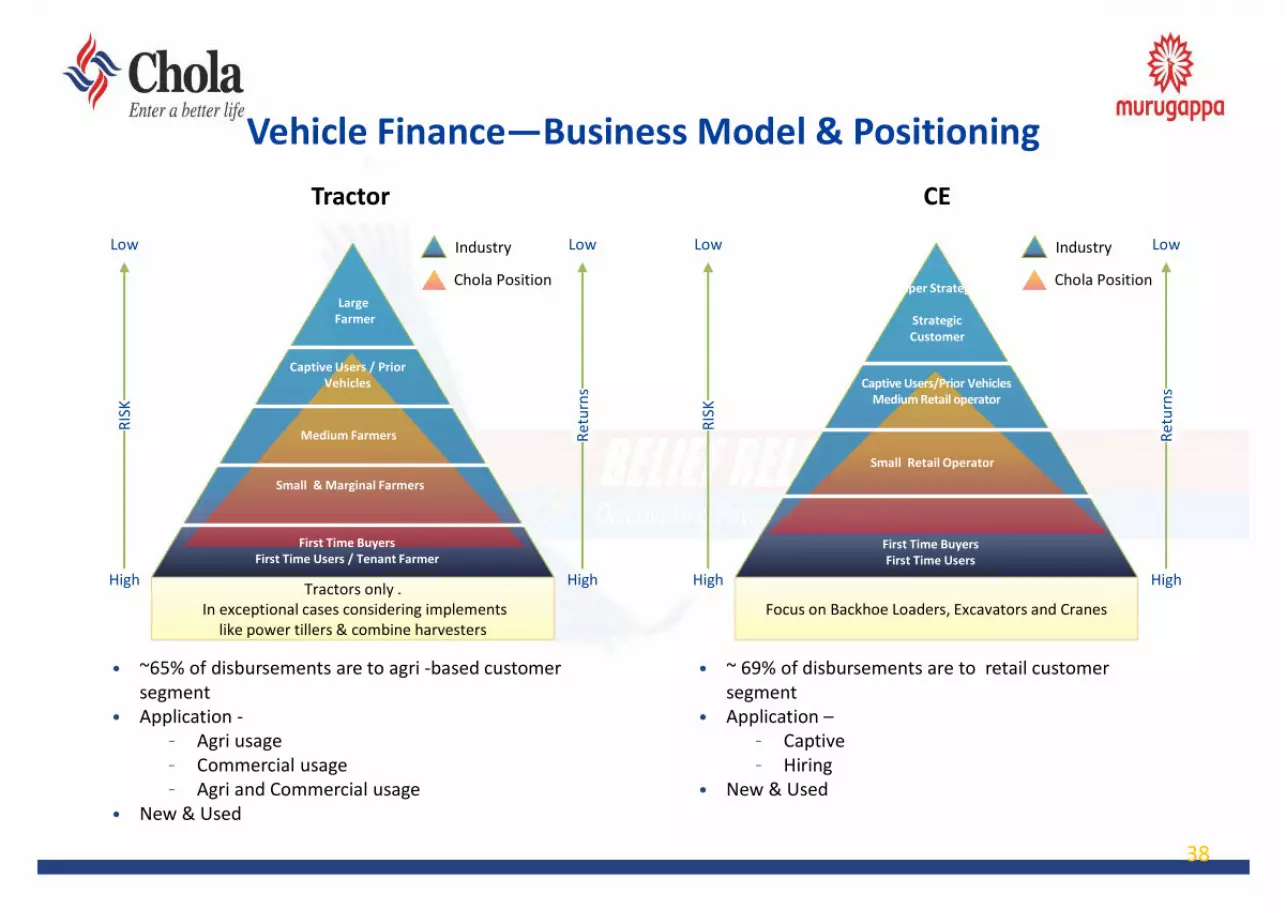
Tractor CE
• ~65% of disbursements are to agri -based customer segment
• Application -– Agri usage– Commercial usage– Agri and Commercial usage
• New & Used
• ~ 69% of disbursements are to retail customer segment
• Application –– Captive– Hiring
• New & Used
Tractors only .In exceptional cases considering implements
like power tillers & combine harvesters
Industry
Chola Position
High
Low
RISK
High
Low
Retu
rns
First Time BuyersFirst Time Users / Tenant Farmer
Super Strategic
Strategic Customer
Focus on Backhoe Loaders, Excavators and Cranes
High
Low
RISK
High
Low
Retu
rns
Small & Marginal Farmers
Industry
Chola Position
Captive Users/Prior VehiclesMedium Retail operator
Small Retail Operator
First Time BuyersFirst Time Users
LargeFarmer
Captive Users / Prior Vehicles
Medium Farmers

Vehicle Finance - Disbursement/Portfolio Mix – Q4FY22Well diversified across geographyWell diversified across geography
Disbursements - State wise
39
Portfolio - State wise
AP
Karnataka
Kerala
Puducherry
Telangana
TN
Delhi
HaryanaHP
J&K
Punjab
Rajasthan
Chandigarh
UPUttarakhand
Assam, Meghalaya,
Mizoram
BiharSikkim
Chattisgarh
Jharkhand
Odisha
Tripura
Arunachal Pradesh
WB
Goa
Gujarat
Maharashtra
MP
SOUTH 28%
NORTH 22%
EAST 28%
WEST 21%
6%6%
4%0%
4%
8%
1%3%
1%0%1%
8%0%
7%1%4%5%
0%7%
3%
5%0% 0%
5%0%
5%
10%
6%
APKarnataka
Kerala
Puducherry
Telangana
TN
DelhiHaryana
HP
J&KPunjab
RajasthanChandigarh
UPUttarakhandAssam,
Meghalaya, Mizoram
BiharSikkim
Chattisgarh
Jharkhand
Odisha
TripuraArunachal Pradesh
WB
Goa
Gujarat
Maharashtra
MP
SOUTH 27%
NORTH 21%
EAST 31%
WEST 20%
5%6%
5%0%
4%
8%
1%3%
1%0%
2%7%0%
7%1%4%6%0%
6%
3%
6%
0% 0%5%0%
4%
10%
6%

Vehicle Finance - Disbursement/Portfolio Mix – Q4FY22Well diversified product segmentsWell diversified product segments
Disbursements (₹Cr) - Product wise Portfolio (₹Cr) - Product wise
40
3 Wheeler0.3%2 Wheeler
6%
Used Vehicles36%
Tractor6%MINI LCV
3%
CAR 10%
MUV 7%
LCV 18%
HCV 8%
CE 6%
3 Wheeler1%
2 Wheeler4%
Used Vehicles27%
Tractor10%MINI LCV
4%
CAR 11%
MUV 7%
LCV 21%
HCV 9%
CE 6%
41
Vehicle Finance - Disbursement Mix – Quarter-wise
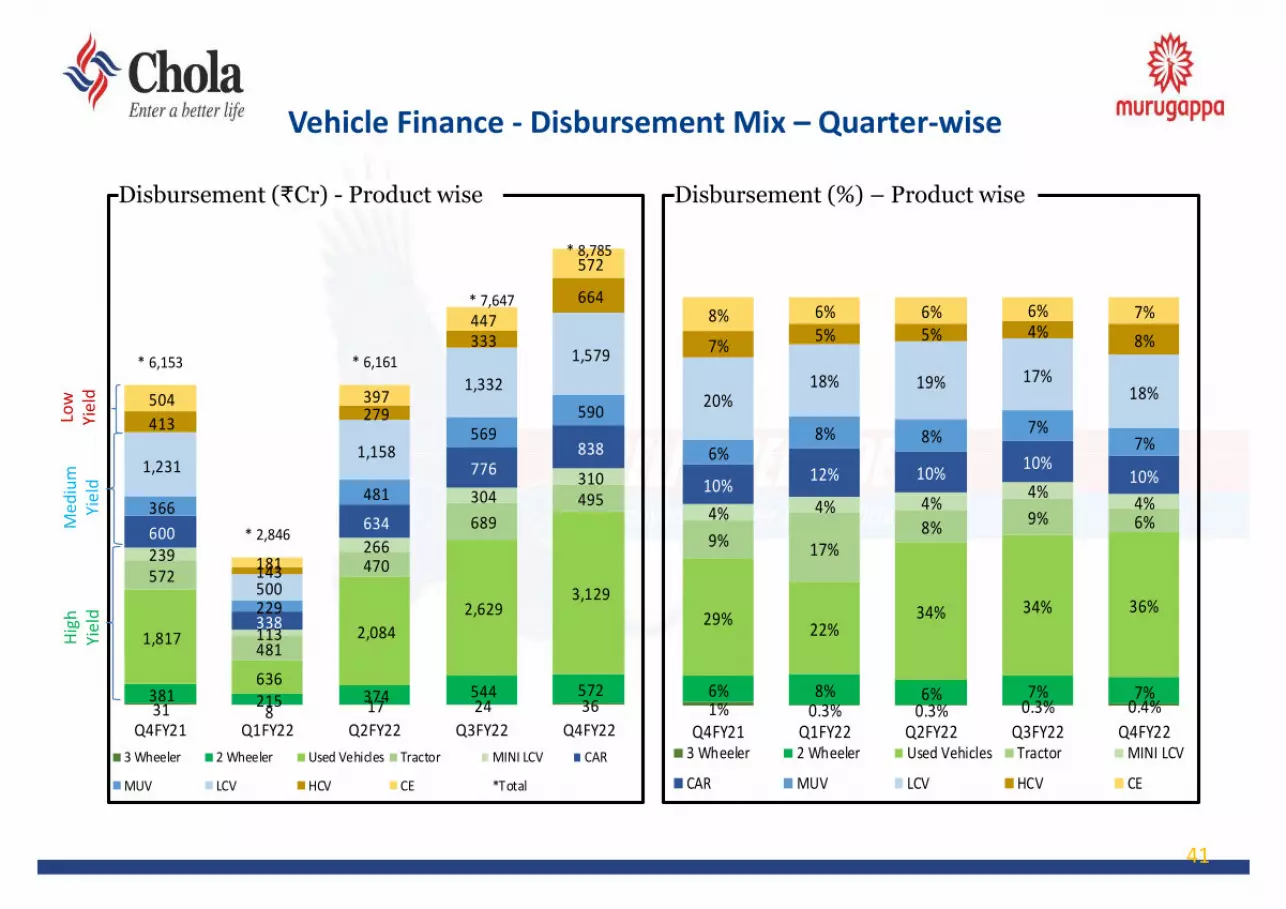
Disbursement (%) – Product wiseDisbursement (₹Cr) - Product wise
31 8 17 24 36 381 215 374 544 572
1,817
636
2,084 2,629
3,129 572
481
470
689 495
239
113
266
304 310
600
338
634
776 838
366
229
481
569 590
1,231
500
1,158
1,332
1,579
413
143
279
333
664
504
181
397
447
572
* 6,153
* 2,846
* 6,161
* 7,647
* 8,785
Q4FY21 Q1FY22 Q2FY22 Q3FY22 Q4FY223 Wheeler 2 Wheeler Used Vehicles Tractor MINI LCV CAR
MUV LCV HCV CE *Total
Hig
h Yi
eld
Med
ium
Yi
eld
Low
Yi
eld
1% 0.3% 0.3% 0.3% 0.4%6% 8% 6% 7% 7%
29% 22%34% 34% 36%
9% 17%8% 9% 6%4% 4% 4%
4%4%
10% 12% 10% 10%10%
6%8% 8% 7%
7%
20%18% 19% 17%
18%
7% 5% 5% 4% 8%8% 6% 6% 6% 7%
Q4FY21 Q1FY22 Q2FY22 Q3FY22 Q4FY223 Wheeler 2 Wheeler Used Vehicles Tractor MINI LCV
CAR MUV LCV HCV CE

42
Vehicle Finance - Portfolio Mix – Quarter-wise
Portfolio (₹Cr) - Product wise Portfolio (%) – Product wise
1% 1% 1% 1% 1%4% 4% 4% 4% 5%
27% 27% 26% 27% 28%
10% 10% 10% 10% 10%
5% 4% 4% 4% 4%
10% 11% 11% 11% 11%
7% 7% 7% 7% 7%
21% 21% 21% 21% 21%
9% 9% 9% 8% 7%
6% 6% 6% 6% 6%
Q4FY21 Q1FY22 Q2FY22 Q3FY22 Q4FY22
3 Wheeler 2 Wheeler Used Vehicles Tractor MINI LCV
CAR MUV LCV HCV CE
547 494 444 401 375 2,161 2,049 2,083 2,263 2,443
13,464 12,640 13,055 13,743 14,735
4,947 5,016 5,049 5,211 5,196 2,303 2,167 2,167 2,193 2,180 5,255 5,159 5,310 5,550 5,818 3,314 3,253 3,409
3,620 3,830
10,472 10,083 10,374
10,568 10,995
4,882 4,560 4,313
3,937 3,914
3,069 2,982 3,083
3,189 3,395
* 50,415 * 48,403 * 49,285
* 50,675 * 52,881
Q4FY21 Q1FY22 Q2FY22 Q3FY22 Q4FY22
3 Wheeler 2 Wheeler Used Vehicles Tractor MINI LCV CAR
MUV LCV HCV CE *Total
Hig
h Yi
eld
Med
ium
Yie
ldLo
w Y
ield
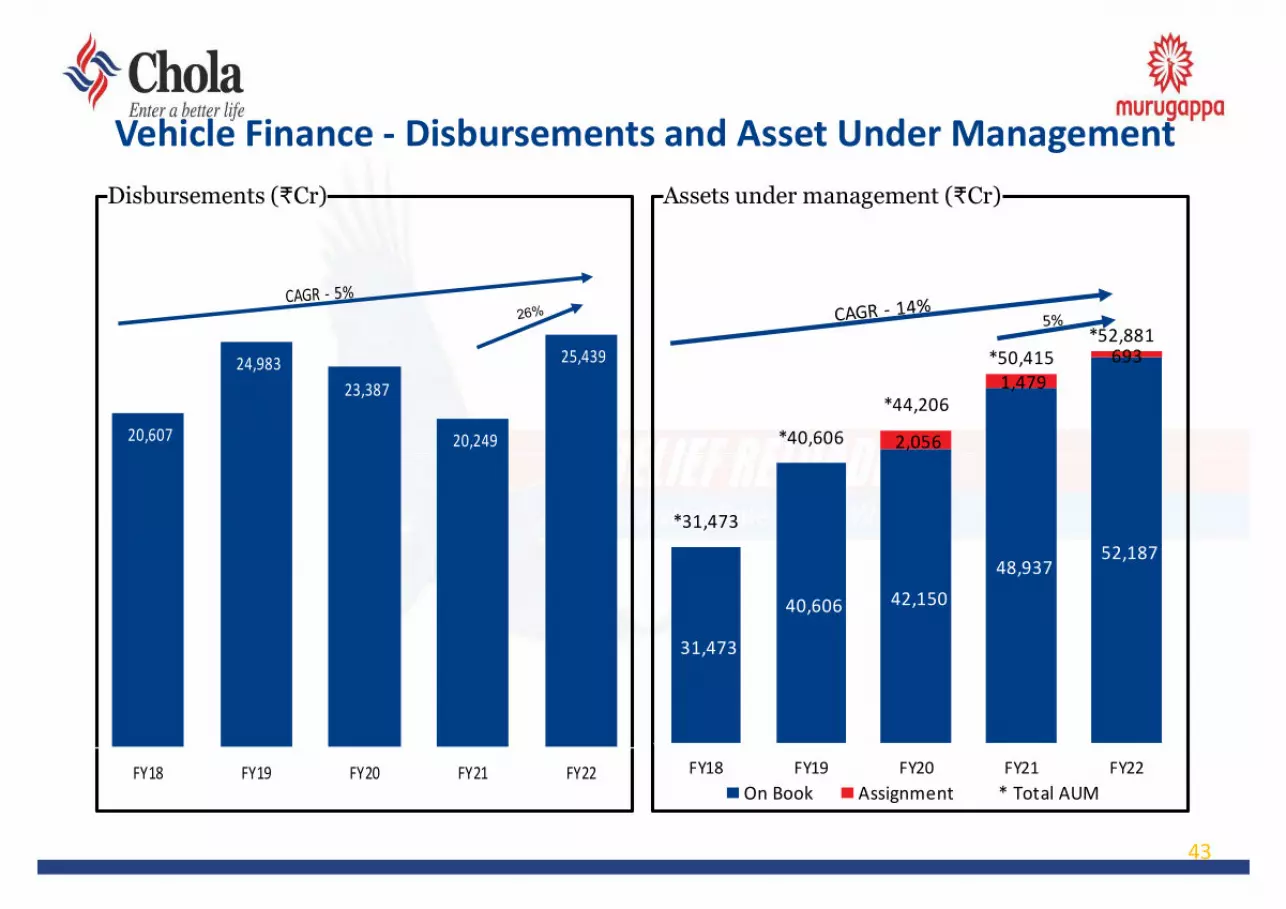
Vehicle Finance - Disbursements and Asset Under ManagementDisbursements (₹Cr) Assets under management (₹Cr)
43
20,607
24,983 23,387
20,249
25,439
FY18 FY19 FY20 FY21 FY22
31,473
40,606 42,150
48,937 52,187
2,056
1,479 693
*31,473
*40,606
*44,206
*50,415*52,881
FY18 FY19 FY20 FY21 FY22On Book Assignment * Total AUM

Vehicle Finance - Income and Profit before taxIncome (₹Cr)
44
Profit before tax (₹Cr)
4,241
5,485
6,624
7,440 7,721
FY18 FY19 FY20 FY21 FY22
988
1,269
945
1,287
2,054
FY18 FY19 FY20 FY21 FY22
60%

Vehicle Finance - Asset Ratios
45
ROA - PBT (%)Loan Losses & Provisions (%)
Net Income Margin (%) Expense Ratio (%)
8.2%7.5%
7.2%7.8%
8.8%
FY18 FY19 FY20 FY21 FY22
3.6%
3.0% 3.0%
2.7%
3.3%
FY18 FY19 FY20 FY21 FY22
0.9% 0.9%
1.9%
2.5%
1.4%
FY18 FY19 FY20 FY21 FY22
3.7%3.6%
2.2%
2.7%
4.1%
FY18 FY19 FY20 FY21 FY22

Profit and Loss Statement - Vehicle Finance (Managed)₹ Cr
46
Particulars Q1FY21 Q2FY21 Q3FY21 Q4FY21 FY21 Q1FY22 Q2FY22 Q3FY22 Q4FY22 FY22Growth %Q4-o-Q4
Growth %Y-o-Y
Disbursements 3,231 4,781 6,084 6,153 20,249 2,846 6,161 7,647 8,785 25,439 43% 26%Closing Assets 46,828 49,264 49,936 50,415 50,415 48,403 49,285 50,675 52,881 52,881 5% 5%Operating Income 1,694 1,900 1,935 1,911 7,440 1,916 1,903 1,938 1,963 7,721 3% 4%Finance Charges 910 957 927 871 3,665 875 828 810 777 3,290 -11% -10%Net Income 784 943 1,008 1,041 3,776 1,041 1,075 1,128 1,187 4,431 14% 17%Expenses 282 300 310 416 1,308 315 427 415 496 1,654 19% 26%Net Credit Losses 62 284 389 445 1,180 468 57 192 5 723 -99% -39%PBT 440 359 309 179 1,287 258 591 521 685 2,054 282% 60%Asset RatiosIncome 14.9% 15.7% 15.5% 15.4% 15.5% 15.6% 15.5% 15.4% 15.4% 15.3%Cost of Funds 8.0% 7.9% 7.4% 7.0% 7.6% 7.1% 6.7% 6.4% 6.1% 6.5%Net Income Margin 6.9% 7.8% 8.1% 8.4% 7.8% 8.5% 8.7% 9.0% 9.3% 8.8%Expense 2.5% 2.5% 2.5% 3.4% 2.7% 2.6% 3.5% 3.3% 3.9% 3.3%Losses & Provisions 0.5% 2.3% 3.1% 3.6% 2.5% 3.8% 0.5% 1.5% 0.04% 1.4%ROA–PBT 3.9% 3.0% 2.5% 1.4% 2.7% 2.1% 4.8% 4.1% 5.4% 4.1%

Profit and Loss Statement - Vehicle Finance (On Book) ₹ Cr
47
Particulars Q1FY21 Q2FY21 Q3FY21 Q4FY21 FY21 Q1FY22 Q2FY22 Q3FY22 Q4FY22 FY22Growth %Q4-o-Q4
Growth % Y-o-Y
Disbursements 3,231 4,781 6,084 6,153 20,249 2,846 6,161 7,647 8,785 25,439 43% 26%Closing Assets (On B/S) 44,775 47,354 48,244 48,937 48,937 47,108 48,182 49,785 52,187 52,187 7% 7%Operating Income 1,631 1,850 1,891 1,869 7,240 1,876 1,865 1,905 1,933 7,578 3% 5%Finance Charges 868 914 888 839 3,510 847 804 790 761 3,202 -9% -9%Net Income 763 936 1,003 1,030 3,731 1,028 1,062 1,114 1,172 4,376 14% 17%Expenses 282 300 310 416 1,308 315 427 415 496 1,654 19% 26%Net Credit Losses 62 284 389 445 1,180 468 57 192 5 723 -99% -39%PBT 418 351 304 169 1,242 245 577 507 670 1,999 298% 61%Asset RatiosIncome 15.0% 15.9% 15.7% 15.6% 15.6% 15.7% 15.5% 15.4% 15.4% 15.4%Cost of Funds 8.0% 7.9% 7.4% 7.0% 7.6% 7.1% 6.7% 6.4% 6.1% 6.5%Net Income Margin 7.0% 8.1% 8.3% 8.6% 8.1% 8.6% 8.8% 9.0% 9.3% 8.9%Expense 2.6% 2.6% 2.6% 3.5% 2.8% 2.6% 3.6% 3.4% 3.9% 3.4%Losses & Provisions 0.6% 2.4% 3.2% 3.7% 2.5% 3.9% 0.5% 1.6% 0.04% 1.5%ROA–PBT 3.9% 3.0% 2.5% 1.4% 2.7% 2.0% 4.8% 4.1% 5.3% 4.1%

Loan Against Property

Loan Against Property – Q4FY22 & FY22 Performance
• Disbursements grew by 66% in Q4FY22 at Rs.1978 crores as compared to Rs.1191 crores in Q4FY21 and by 62% at Rs.5862 crores in FY22 as compared to Rs.3627 crores in FY 21.
Disbursements
Asset under management • AUM have grown by 16% YoY.
Loss and provisions• Loan losses improved to -0.6% in Q4FY22 from 1.5% in Q4FY21 and
0.7% in FY22 from 1.1% in FY21.
Profit before tax• PBT grew by 162% at Rs.177 crores in Q4FY22 as compared to Rs.68
crores in Q4FY21 and by 55% at Rs.475 crores in FY 22 as compared to Rs.306 crores in FY 21.
49
50
• The NBFC sector would begin the year with sufficientcapital and provisions with stable margins and theexpected YoY loan growth of around 14%. LAP Marketis expected to grow at 7%-9%.
• FY 23 is expected to be a year of normalcy in theabsence of any major disruption with mortgage loansexpected to witness a higher demand than unsecuredloans, in particular, Loan Against Property is expectedto see reasonable growth as it is the important sourcefor growth capital
• The government has been pushing the credit forMSME sector with the extension of ECLGS in order torevamp the sector
Source: IndiaRatings; CRISIL Research
• On back of improved economic activities, Businesshas witnessed increased demand for LAP loans andis expected to continue the same in upcomingquarters
• Inline with growth expected in fiscal year 2023,branch expansion is planned majorly in tier 3 andtier 4 cities
• Collections remain a priority for the business withactivities like strengthening collections team anddigitizing collections channels. In addition, Chola hasprovided adequate provisions
• Portfolio LTV at origination stands low at 51% whichprovides adequate security cover.
Sector Outlook Chola’s Position
Loan Against Property: Industry outlook

Loan Against Property - Disbursements and Asset Under Management
51
Disbursements (₹Cr) Assets under Management (₹Cr)
3,174
3,837 3,662 3,627
5,862
FY18 FY19 FY20 FY21 FY22
62%
9,424 9,954 10,536 12,716
15,571
671 1,671
2,425
2,062
1,544
* 10,095
* 11,626 * 12,960
* 14,777
* 17,115
FY18 FY19 FY20 FY21 FY22
On Book Assigned * Total AUM

Loan Against Property – Income and Profit before tax
52
Income (₹Cr) Profit before tax (₹Cr)
1,184 1,248
1,479
1,642
1,827
FY18 FY19 FY20 FY21 FY22
221
305
244
306
475
FY18 FY19 FY20 FY21 FY22

Loan Against Property – Asset Ratios
53
ROA - PBT (%)
Net Income Margin (%) Expenses Ratio (%)
Loan Losses & Provisions (%)
4.1%3.8% 3.8%
4.3%
5.0%
FY18 FY19 FY20 FY21 FY22
1.1% 1.0%1.1%
1.0%
1.2%
FY18 FY19 FY20 FY21 FY22
0.8%
-0.03%
0.8%
1.1%
0.7%
FY18 FY19 FY20 FY21 FY22
2.3%
2.8%
2.0%
2.2%
3.0%
FY18 FY19 FY20 FY21 FY22

Profit and Loss Statement - Loan Against Property (Managed)
54
₹ Cr
Particulars Q1FY21 Q2FY21 Q3FY21 Q4FY21 FY21 Q1FY22 Q2FY22 Q3FY22 Q4FY22 FY22Growth %Q4-o-Q4
Growth %Y-o-Y
Disbursements 119 1,052 1,265 1,191 3,627 386 1,736 1,763 1,978 5,862 66% 62%Closing Assets 13,109 13,866 14,457 14,777 14,777 14,513 15,421 16,218 17,115 17,115 16% 16%Operating Income 386 400 425 432 1,642 432 442 470 482 1,827 12% 11%Finance Charges 260 265 265 262 1,051 261 262 266 266 1,054 1% 0%Net Income 126 135 160 170 591 171 181 205 217 773 27% 31%Expenses 30 30 30 47 137 31 49 47 65 191 39% 40%Net Credit Losses 10 39 44 55 148 76 2 54 (26) 106 -146% -28%PBT 86 65 87 68 306 65 130 103 177 475 162% 55%Asset RatiosIncome 11.9% 11.8% 11.9% 12.0% 11.9% 11.8% 11.7% 11.8% 11.7% 11.7%Cost of Funds 8.0% 7.8% 7.4% 7.3% 7.6% 7.2% 6.9% 6.7% 6.5% 6.8%Net Income Margin 3.9% 4.0% 4.5% 4.7% 4.3% 4.7% 4.8% 5.1% 5.3% 5.0%Expense 0.9% 0.9% 0.8% 1.3% 1.0% 0.8% 1.3% 1.2% 1.6% 1.2%Losses & Provisions 0.3% 1.1% 1.2% 1.5% 1.1% 2.1% 0.0% 1.4% -0.6% 0.7%ROA–PBT 2.6% 1.9% 2.4% 1.9% 2.2% 1.8% 3.5% 2.6% 4.3% 3.0%
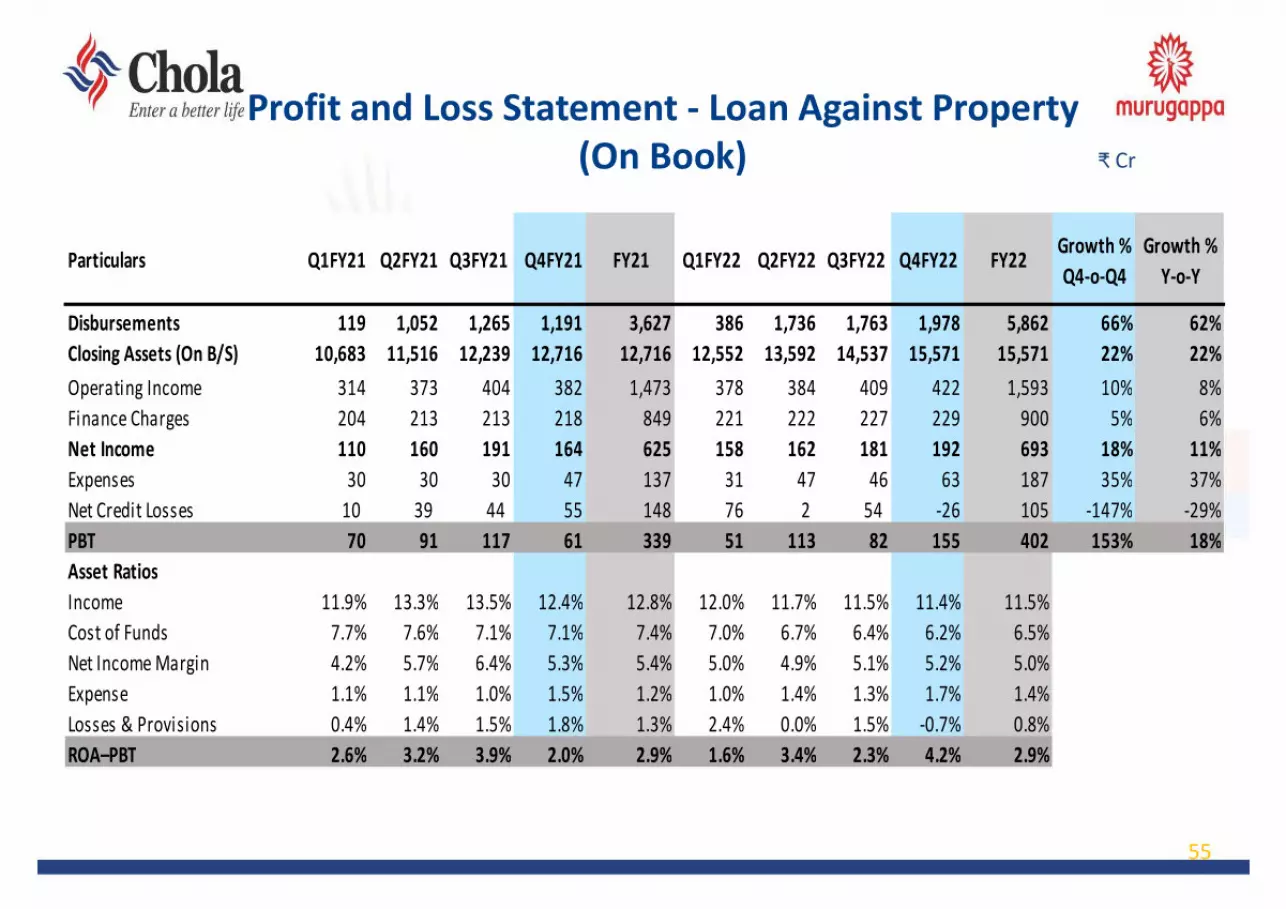
Profit and Loss Statement - Loan Against Property (On Book) ₹ Cr
55
Particulars Q1FY21 Q2FY21 Q3FY21 Q4FY21 FY21 Q1FY22 Q2FY22 Q3FY22 Q4FY22 FY22Growth %Q4-o-Q4
Growth % Y-o-Y
Disbursements 119 1,052 1,265 1,191 3,627 386 1,736 1,763 1,978 5,862 66% 62%Closing Assets (On B/S) 10,683 11,516 12,239 12,716 12,716 12,552 13,592 14,537 15,571 15,571 22% 22%Operating Income 314 373 404 382 1,473 378 384 409 422 1,593 10% 8%Finance Charges 204 213 213 218 849 221 222 227 229 900 5% 6%Net Income 110 160 191 164 625 158 162 181 192 693 18% 11%Expenses 30 30 30 47 137 31 47 46 63 187 35% 37%Net Credit Losses 10 39 44 55 148 76 2 54 -26 105 -147% -29%PBT 70 91 117 61 339 51 113 82 155 402 153% 18%Asset RatiosIncome 11.9% 13.3% 13.5% 12.4% 12.8% 12.0% 11.7% 11.5% 11.4% 11.5%Cost of Funds 7.7% 7.6% 7.1% 7.1% 7.4% 7.0% 6.7% 6.4% 6.2% 6.5%Net Income Margin 4.2% 5.7% 6.4% 5.3% 5.4% 5.0% 4.9% 5.1% 5.2% 5.0%Expense 1.1% 1.1% 1.0% 1.5% 1.2% 1.0% 1.4% 1.3% 1.7% 1.4%Losses & Provisions 0.4% 1.4% 1.5% 1.8% 1.3% 2.4% 0.0% 1.5% -0.7% 0.8%ROA–PBT 2.6% 3.2% 3.9% 2.0% 2.9% 1.6% 3.4% 2.3% 4.2% 2.9%

Home Loans

Home Loans – Q4FY22 & FY22 Performance
• Disbursements stood at Rs.441 crores in Q4FY22 as compared to Rs.538 crores in Q4FY21 and grew by 2% at Rs.1571 crores in FY22 as compared to Rs.1542 crores in FY 21.
Disbursements
Asset under management • AUM have grown by 21% YoY.
Loss and provisions• Loan losses improved to 0.003% in Q4FY22 from 1.7% in Q4FY21 and
0.9% in FY22 from 1.5% in FY21.
Profit before tax• PBT grew by 95% at Rs.67 crores in Q4FY22 as compared to Rs.34
crores in Q4FY21 and by 91% at Rs.215 crores in FY 22 as compared to Rs.112 crores in FY 21
57

58
Sector Outlook Chola’s Position
Home Loans - Industry outlook
• Revival of demand in Q4 FY22 is expected to
sustain in FY23.
• As cash flows of micro and small businesses
continue to improve, fresh collections are
expected to remain stable
• Affordable housing credit offered by HFCs is
estimated to grow 17-20% in FY23
• Retail segment demand is likely to continue to
be for ready property and self-construction,
especially in Tier 3,4 towns and cities
• Chola’s exposure is majorly into self-
construction residential houses
• Chola doesn’t have focus on developer supplied
houses
• ~89% of assets are in tier 2,3,4 cities and
suburbs of tier 1 cities
• Chola is expanding its geographical footprint
especially in the North, West and East Zones to
augment asset growth

Home Loans - Disbursements and Asset Under Management
59
Assets under Management (₹Cr)Disbursements (₹Cr)
606
1,157
1,505 1,542 1,571
FY18 FY19 FY20 FY21 FY22
978
1,912 2,449
3,726
4,742
677
620
527
*978
*1,912
*3,125
*4,345
*5,269
FY18 FY19 FY20 FY21 FY22On Book Assigned * Total AUM

Home Loans - Income and Profit before taxIncome (₹Cr)
60
Profit before tax (₹Cr)
101
189
357
519
671
FY18 FY19 FY20 FY21 FY22
738
64
112
215
FY18 FY19 FY20 FY21 FY22
91%
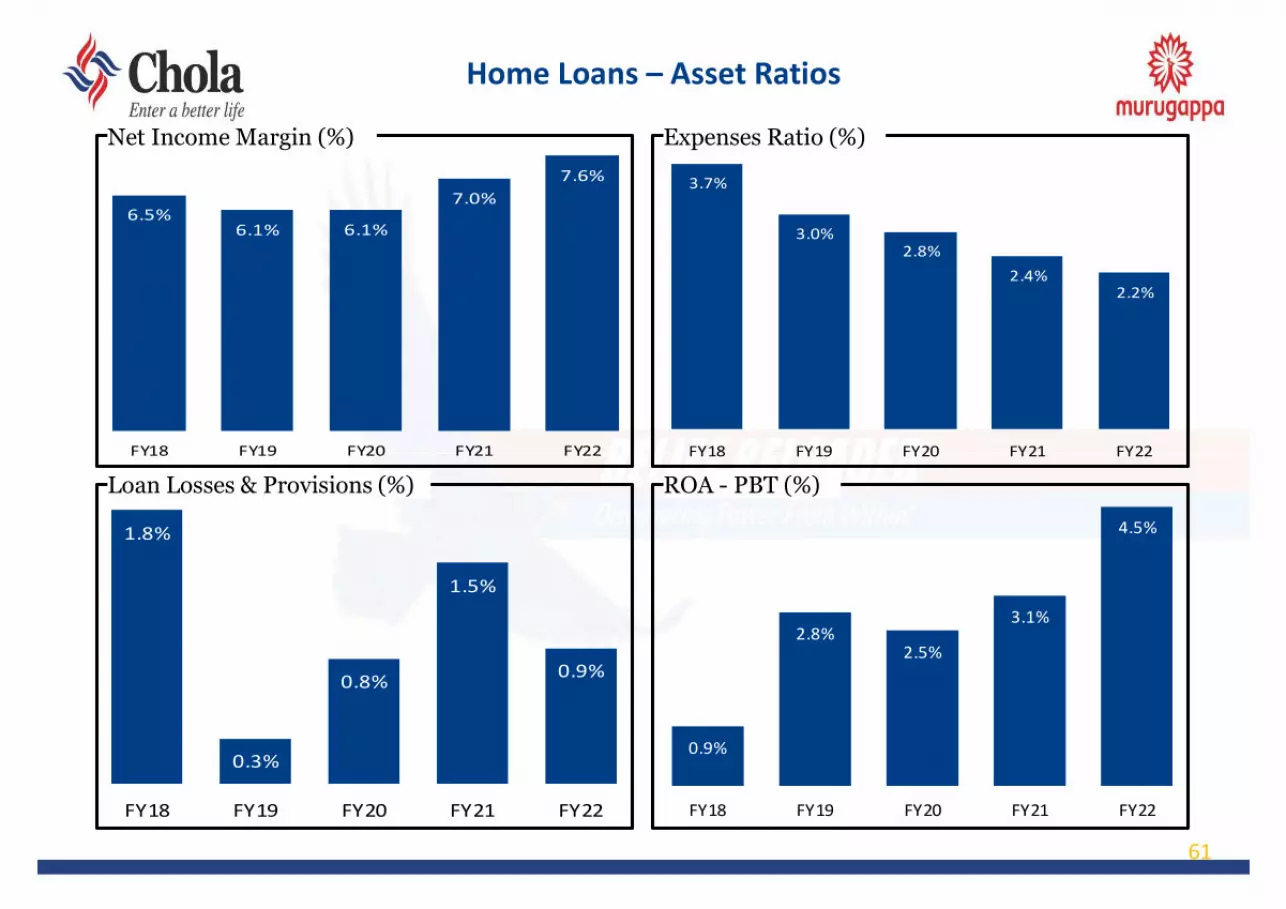
Home Loans – Asset Ratios
61
Loan Losses & Provisions (%) ROA - PBT (%)
Net Income Margin (%) Expenses Ratio (%)
6.5%6.1% 6.1%
7.0%7.6%
FY18 FY19 FY20 FY21 FY22
3.7%
3.0%2.8%
2.4%2.2%
FY18 FY19 FY20 FY21 FY22
1.8%
0.3%
0.8%
1.5%
0.9%
FY18 FY19 FY20 FY21 FY22
0.9%
2.8%2.5%
3.1%
4.5%
FY18 FY19 FY20 FY21 FY22

Profit and Loss Statement - Home Loans (Managed)
62
₹ Cr
Particulars Q1FY21 Q2FY21 Q3FY21 Q4FY21 FY21 Q1FY22 Q2FY22 Q3FY22 Q4FY22 FY22Growth %Q4-o-Q4
Growth %Y-o-Y
Disbursements 190 381 434 538 1,542 199 494 437 441 1,571 -18% 2%Closing Assets 3,302 3,630 3,932 4,345 4,345 4,402 4,765 5,039 5,269 5,269 21% 21%Operating Income 111 124 132 152 519 154 164 174 179 671 18% 29%Finance Charges 62 65 65 70 262 74 76 78 80 308 13% 17%Net Income 49 59 67 82 257 80 88 96 100 363 23% 42%Expenses 19 21 19 30 89 18 27 27 33 105 9% 17%Net Credit Losses 2 9 27 17 55 20 9 14 0.04 44 -100% -20%PBT 28 29 22 34 112 41 51 55 67 215 95% 91%Asset RatiosIncome 13.9% 14.2% 13.9% 14.9% 14.2% 14.1% 14.2% 14.1% 14.1% 14.1%Cost of Funds 7.7% 7.5% 6.9% 6.9% 7.2% 6.8% 6.6% 6.3% 6.3% 6.5%Net Income Margin 6.2% 6.7% 7.0% 8.0% 7.0% 7.3% 7.6% 7.8% 7.9% 7.6%Expense 2.4% 2.4% 1.9% 2.9% 2.4% 1.6% 2.4% 2.2% 2.6% 2.2%Losses & Provisions 0.3% 1.0% 2.8% 1.7% 1.5% 1.9% 0.8% 1.2% 0.003% 0.9%ROA–PBT 3.5% 3.3% 2.3% 3.4% 3.1% 3.8% 4.4% 4.5% 5.3% 4.5%

Profit and Loss Statement - Home Loans (On Book)
63
₹ Cr
Particulars Q1FY21 Q2FY21 Q3FY21 Q4FY21 FY21 Q1FY22 Q2FY22 Q3FY22 Q4FY22 FY22Growth %Q4-o-Q4
Growth % Y-o-Y
Disbursements 190 381 434 538 1,542 199 494 437 441 1,571 -18% 2%Closing Assets (On B/S) 2,613 2,962 3,288 3,726 3,726 3,801 4,186 4,486 4,742 4,742 27% 27%Operating Income 88 111 138 136 473 136 145 157 163 600 20% 27%Finance Charges 47 51 51 58 207 62 64 67 69 262 19% 27%Net Income 41 60 87 78 266 74 81 90 94 338 20% 27%Expenses 19 21 19 30 89 18 27 27 33 105 9% 17%Net Credit Losses 2 9 27 17 55 20 9 14 0.04 44 -100% -20%PBT 19 30 41 31 122 35 44 49 61 189 98% 56%Asset RatiosIncome 13.9% 15.7% 17.6% 15.7% 15.7% 14.4% 14.4% 14.4% 14.3% 14.3%Cost of Funds 7.4% 7.2% 6.5% 6.7% 6.9% 6.6% 6.4% 6.2% 6.1% 6.3%Net Income Margin 6.5% 8.6% 11.0% 9.0% 8.8% 7.8% 8.0% 8.2% 8.3% 8.1%Expense 3.1% 3.0% 2.4% 3.5% 3.0% 1.9% 2.7% 2.4% 2.9% 2.5%Losses & Provisions 0.4% 1.2% 3.4% 2.0% 1.8% 2.2% 0.9% 1.3% 0.003% 1.0%ROA–PBT 3.1% 4.3% 5.3% 3.6% 4.0% 3.8% 4.4% 4.5% 5.4% 4.5%

64
Funding Profile

CAR and Credit Rating
Minimum CAR Stipulated by RBI is 15% & for Tier I is 10%
Capital Adequacy Ratio (CAR) – As per RBI guideline
Loan type India ratings Care ICRA Crisil
ST CP/WCDL - CARE A1+^ [ICRA] A1+ [CRISIL] A1+
LT NCD/CC IND AA + (ind) stable* - [ICRA] AA+ -
Tier II SD IND AA + (ind) stable CARE AA+ [ICRA] AA+/Stable [CRISIL] AA+/Stable
Tier I PDI IND AA (ind) CARE AA [ICRA] AA/Stable -
^ CP Rating* NCD Rating
Credit Rating
65
13.24 12.44 15.28 15.14 16.49
5.12 4.92 5.41 3.93 3.13
18.36 17.36 20.69 19.07 19.62
FY18 FY19 FY20 FY21 FY22
Tier I Tier II

66
Diversified Borrowings Profile (I/II)(₹Cr)
8% 7% 6% 7% 6% 6%
60%55% 58% 55% 57% 61%
10%15% 14%
14% 14%15%
3% 3% 3%2% 2%
2%5% 6% 6% 7% 7%6%
8% 7% 6% 6% 5% 5%3%
3% 2% 2% 2% 2%3% 4% 5% 7% 7% 4%
* 55,005 * 63,730 * 63,197 * 62,309 * 65,806 * 69,174
Mar-20 Mar-21 Q1FY22 Q2FY22 Q3FY22 Mar-22
Borrowing mix by instrument type
Tier II Capital Bank Term loans Debentures Overseas Term Loan FCNR
Securitisation CC / WCDL Commercial Papers / ICD * Total Borrowings

Diversified Borrowings Profile (I/II)(₹Cr)
67
2% 2% 3% 2% 3% 3%5% 9% 8% 11% 11% 9%5%
4% 4% 4% 4% 4%1%3% 1% 1% 1% 1%
68%66% 67% 63% 66% 69%
4%6% 6% 7%
6% 5%4%1% 2% 2% 2% 2%2% 2% 2% 4% 2% 3%8% 7% 6% 6% 5% 5%
* 55,005 * 63,730 * 63,197 * 62,309 * 65,806 * 69,174
Mar-20 Mar-21 Q1FY22 Q2FY22 Q3FY22 Mar-22
Borrowing mix by investor type
Trusts Mutual Fund Insurance Company Individuals & HUF Banks
BANK - OVERSEAS FII, FPI, NRI & NRN Corporates Securitisation * Total Borrowings

68
ALM Statement as of 31st Mar 2022 (As per IND AS)(₹Cr)
Note: Behavioural ALM. Advances and maturities include the securitization inflows and outflows respectively
Particulars 1 m >1 to 2m >2 to 3m >3 to 6m >6m to 1 yr >1 to 3 yr >3 to 5 yr >5 yr TotalCash & Bank Balances 2,002.65 - 2,036.36 37.22 48.57 194.28 194.28 827.78 5,341.12 Advances 2,232.44 2,285.63 2,047.75 7,645.24 12,072.17 31,607.32 10,945.47 6,799.09 75,635.10 Trade Receivable & Others 109.73 92.98 84.16 37.34 90.12 271.15 391.26 1,808.34 2,885.08 Total Inflows (A) 4,344.81 2,378.61 4,168.27 7,719.79 12,210.85 32,072.74 11,531.01 9,435.21 83,861.30 Cumulative Total Inflows (B) 4,344.81 6,723.42 10,891.69 18,611.48 30,822.34 62,895.08 74,426.09 83,861.30 Borrowin Repayment-Bank & Others 1,439.88 875.86 2,918.93 5,405.55 7,752.46 23,693.75 9,159.37 580.01 51,825.80 Borrowin Repayment- Market 832.34 59.67 1,226.84 1,615.39 2,753.74 6,887.44 1,138.27 2,655.30 17,168.98 Capital Reserves and Surplus - - - - - - - 11,886.38 11,886.38 Other Outflows 1,983.35 102.49 16.43 339.27 134.25 204.24 103.54 96.56 2,980.13 Total Outflows (C ) 4,255.56 1,038.01 4,162.20 7,360.21 10,640.45 30,785.43 10,401.18 15,218.26 83,861.30 Cumulative Total Outflows (D) 4,255.56 5,293.57 9,455.77 16,815.99 27,456.43 58,241.86 68,643.04 83,861.30 E. GAP (A - C) 89.25 1,340.60 6.07 359.58 1,570.41 1,287.31 1,129.83 (5,783.05) F.Cumulative GAP (B - D) 89.25 1,429.85 1,435.92 1,795.50 3,365.90 4,653.21 5,783.05 0.00 Cumulative GAP as % (F/D) 2.10% 27.01% 15.19% 10.68% 12.26% 7.99% 8.42% 0.00%
ALM snapshot as on 31st Mar 2022

69
Subsidiaries

70
Subsidiaries – Q4FY22 & FY22
•CHFL recorded a gross income of Rs. 15.90 crores in Q4FY22 as
compared to Rs. 10.82 crores in Q4FY21 and PBT of Rs.1.22
crores as compared to Rs. 0.78 crores in Q4FY21. The income
grew by 52% at Rs.56.37 crores in FY22 as against Rs.37.15 crores
in FY21 and PBT grew by 251% at Rs.9.19 crores in FY22 as
against Rs.2.62 crores in FY21. The Company has made an
application to National Housing Bank (NHB) for registration as a
Housing Finance Company in June 2018 and currently engaging
with the RBI to obtain license to operate as a Housing Finance
Company.
CholamandalamHome Finance Limited (CHFL)
•During the quarter CSEC focused on the three distinct business
lines for enhancing revenues and productivity - broking, wealth
and insurance distribution. The Broking business grew 6% and
wealth business grew by 9% and Insurance business down by 7%
as on Mar 2022. The income grew by 33% in FY22 at Rs.40.01
crores as against Rs.30.14 crores in FY21 and by 11% in Q4FY22 at
Rs.9.93 crores as against Rs.8.98 crores in Q4FY21. The PBT grew
by 9% in FY22 at Rs.7.48 crores as against Rs.6.84 crores in FY21.
The Wealth AUM crossed ₹ 1,875 crores.
CholamandalamSecurities
Limited (CSEC)

71
Associate and Joint Venture – FY22
Paytail is a new age Fintech company focusing on offline ‘Buy
Now Pay Later’ through brand partnerships. Through
a funding partnership with Paytail, Chola has started providing
check-out financing to customers with good
repayment track record in Tier II, III & IV markets who do not
own a credit card. The net revenue of Paytail in FY22 is Rs.1.5
Cr.
PaytailCommerce
Private Limited
Payswiff is a leading POS provider in India enabling online
payment gateway services for e-commerce businesses and
providing e-commerce solutions with a total merchant base of
3 lakh+ small to mid-sized merchants like supermarkets,
medical stores etc. The net revenue of Payswiff in FY22 is
Rs.49.3 Cr.
PayswiffTechnologies
Private Limited

72
EnvironmentalSocial
Governance
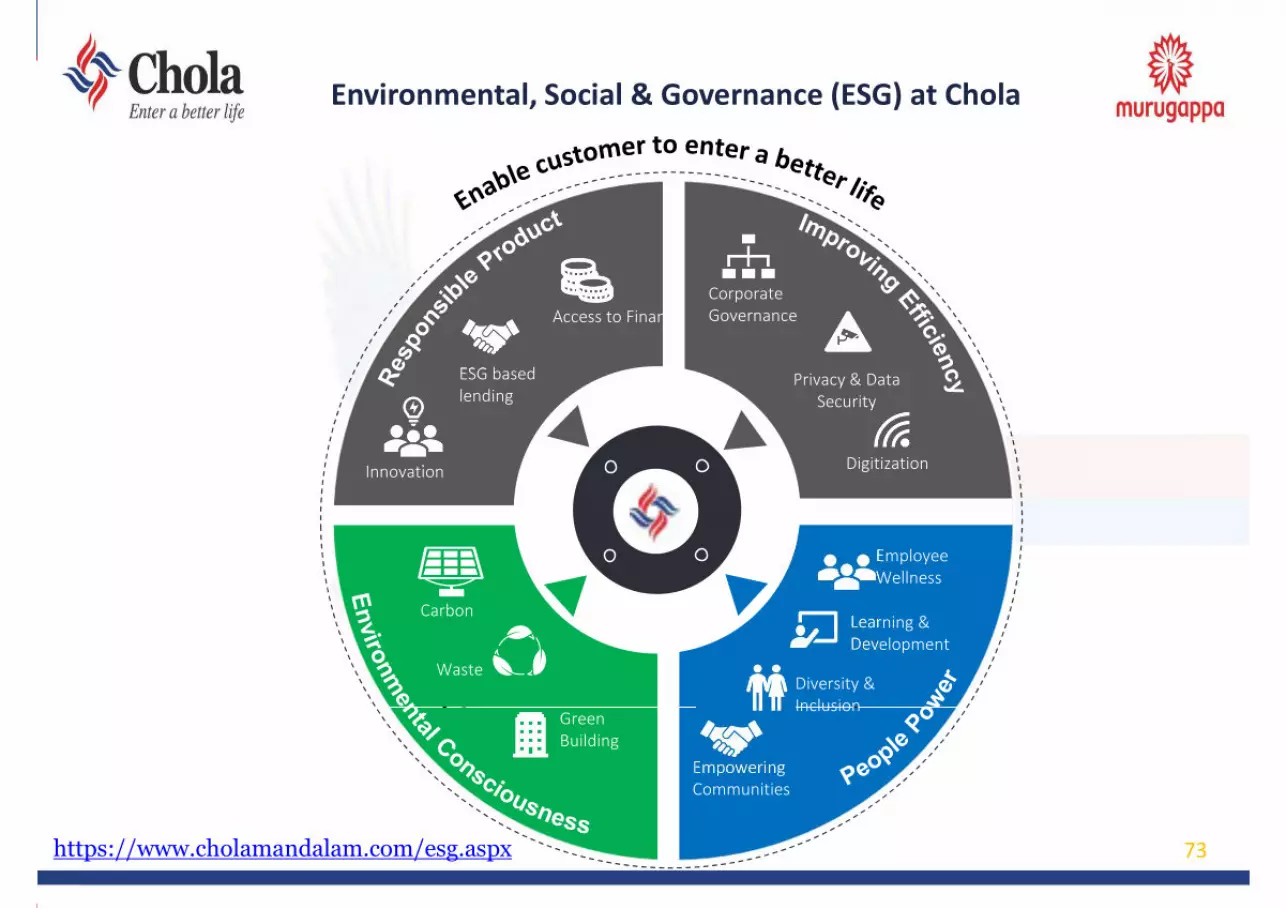
Environmental, Social & Governance (ESG) at Chola
Privacy & Data Security
Digitization
Employee Wellness
Learning & Development
Empowering Communities
Diversity & Inclusion
Carbon
Green Building
Waste
Corporate Governance
Innovation
ESG based lending
Access to Finance
73https://www.cholamandalam.com/esg.aspx

Responsible Products
Vehicle FinancingVehicle Financing
Affordable HousingAffordable Housing
Loan against PropertyLoan against Property
SME LoansSME Loans
Focus on transport entrepreneurs, first time borrowers (FTB)and new to credit customers (NTCC); predominantly ingeographies with limited presence of organized financiers
Focus on lending to small businesses against the collateral ofself occupied residential property at affordable ROI
Focus on underserved customers in tier III,IV,V, VI cities toenable them to achieve their dream of entering a betterhome, minimal documentation
Support people such as vegetable owners, flour mill ownersand micro business owners who don’t have conventionaldocumentation to grow the business
Our products focus on first time borrowers (FTB) and new to credit customers (NTCC)ensuring financial inclusion of sections of society including micro business owners
Access to Finance
Access to Finance
All our products are custom designed to suit our customer’s need. We provide customizedcredit models, with minimal documentation. Gaadi bazar is one such example, whichfocuses on emerging market trends. With customer satisfaction as our key focus we havetailored our products to match their preferences.
We do not engage with industries that pose a threat to the environment. The list of suchindustries are monitored and updated regularly to ensure compliance. We have beenreconfirmed as a constituent of FTSE4Good Series in June 2021.
ESG Based Lending
ESG Based Lending
InnovationInnovation
G
74

Improving Efficiency
Corporate GovernancePolicies and process in place to enablehighest standards in governance andtransparency; ethical behaviour, boarddiversity etc form a part of our Code ofConduct Policy
DigitizationBusinesses and functions aligned towardsgoing digital; minimal manualdocumentation currently; first financecompany to get all processes on a digitalplatform aiming at improved efficiencywith minimal error
Privacy & Data Security
Policy review at board level on periodic basis;Training on data security and privacyprocedures for employees; Monitoring ofcyber resilience and response with a stringentSLAs. Periodic Vulnerability assessment forcritical applications & infrastructure andeffective patch management”
Digitization
Effective Governance
G
75

People Power
People Power
Learning & Development
Regular discussions carried out to recognizeimprovement areas of employees
Trainings conducted for upskilling includingvernacular trainings
75,192 manhours of training conducted in FY 21 Support formal employee education by providing
80% fees as financial support for those in need
Empowering Communities
CSR spend at INR 3207.48 Lacs for FY 21 Key focus areas include upliftment in the Trucking
community Regular health and eye camps carried out at ‘Transport
Nagars’ (Trucker Hubs)-golden quadrilateral across India-1,80,539 eye screenings till March 2021
Piloted numerous projects in the area of Heath, Water &Sanitation, Education, road safety, environmentsustainability etc.
Employee Wellness
Emotional & mental wellbeing programs:Utilized by several employees in the pastyear
Dedicated grievance hotline Focus on Stress management Financial wellness of employees &
families- 8 wellbeing programs conductedlast year
Pandemic support programs: paid leave,term life insurance, hospitalization benefit,vaccination
ISO 30408:2016- Human ResourceManagement certified
Diversity & Inclusiveness
Business activities such as hiring,promotion, and compensation ofemployees, conducted without regard torace, colour, religion, gender etc.
We aim at hiring more women inbusiness roles and achieve genderequality in our organization.
Emphasis on local hiring
S
76

Environmental Consciousness
Green Building Waste Carbon
Setering the use of digital solutions in the administration and monitoring of environmental authorities
We aim at incorporating green methodsin the construction of our upcomingoffice buildings. The latest officeconstruction at Guindy is under thesupervision of a green consultant andaims to imbibe Green BuildingprinciplesOur processes are ISO 9001:2015Quality Management System Certified
With a clear focus on sustainability,Chola has a well defined e-wastepolicy which ensures that disposalof e-waste is carried out onlythrough authorized e-waste vendorsat all our facilities
As an environmentally responsiblecompany Chola has taken varioussteps towards sustainability bycontributing towards waterconservation, energy efficiency,supporting micro businesses in theRenewable energy sector etc. Goingforward, we will focus on carbonfootprint reduction
E
77

ESG Certification – FTSE Russell
78
Our Company has been included in the FTSE4Good Index
Series, created by the global index and data provider FTSE
Russell. The FTSE4Good Index Series is designed to measure
the performance of companies demonstrating strong
Environmental, Social and Governance (ESG) practices.
The FTSE4Good indexes are used by a wide variety of market
participants to create and assess responsible investment
funds and other products. FTSE Russell evaluations are
based on performance in areas such as Corporate
Governance, Health & Safety, Anti-Corruption and Climate
Change. Businesses included in the FTSE4Good Index Series
meet a variety of environmental, social and governance
criteria.
Note: Reaffirmed as constituent of FTSE4Good Index Series in June 2021

79
Risk Management

80
Risk Governance Structure
Board of Directors
Chief Risk Officer
Risk Champions of Businesses/ functions
Risk Management Committee
Oversee the entire risk management process
Formed in 2007-08 Meet four times in a year Periodic review of framework,
process, key risk movement and other initiatives
Establish framework, tools & techniques
Create risk awareness Works with Business/Functional
head and Risk Champions of respective functions to identify, assess, mitigate, monitor and report key risks
Risk Management Division
Executive Director Review the risk management process

81
Key Functions of Risk Management Division
• Identify key risks in each function/business
• Assess the risks in terms of probability of occurrence and their impact
• Identify mitigation/ risk controls put in place by respective process champions
• Identify key risk indicators to measure and monitor residual risk. Breach in key risks
against thresholds are highlighted to risk champions to take appropriate mitigation
strategies
• For each function/business, the Risk Index monitors the level and direction of risk.
Composite Risk Index tracks the level and direction of risks at an enterprise level.

82
ERM as Value Centre in Business Processes
• ERM works with business teams on the overall customer life cycle management
Identifying segments & channels risk profiles
Underwriting models to optimally onboard risk and price appropriately
Active portfolio management and prioritization for collection efforts
Customer retention strategies
• ERM team actively engages with the product teams for assessing risk reward trade-offs
and other initiatives

83
• Periodic engagement with internal audit team to incorporate key observations on
process failures identified by IA team which will be considered as part of risk review
process. ERM also gives risk based inputs to internal audit team to plan and
prioritize their audits
• Actively participates and provides inputs to Asset Liability support group which
monitors company’s liquidity position
• Actively involved in risk assessment of IT and Cyber Security and its mitigation
strategies
• Developing a framework for ESG implementation in the organization
• Develop and manage business continuity plan for all critical corporate functions
across the organization
ERM as Value Centre in Corporate Processes

84
Information Technology

85
Technology Updates
Drive enhanced usage of hybrid cloud solutions and adoptcloud-first approach for new business solutions
Continued enhancement of network infrastructure tosupport remote working, cloud solutions, & collaboration
Complete BCP / DR Drill execution for key product andprocesses, ensure appropriateness of network & compute
Augmented asset and service management solution tohandle all lifecycle events of technology assets
Ensure on-going rigor for carrying out vulnerabilityassessment for deployed solutions and underlying systems
Drive cyber security and data handling awareness acrossorganization’s employee and customer base
Increase automation for user access to applications andhandle it across the user lifecycle stages
Design and roll out Minimum Security Baseline for thecomponents of the technology infrastructure
Develop and manage a clear electronic asset disposalpolicy and appropriate handling of e-waste
Enhance digital solution for new personal loans and businessloans products supporting online partnership & assisted modes
Integration with leading manufacturers for online Lead flowand seamless approvals and lead status updates
Pilot of re-imagined Field Collections solution with support fordiverse mobile devices
Increased robotic automation for different processes in theback-office functions using scripts and tools
Technology InfrastructureProvide resilient & scalable environment
Digital Engagement & Application PlatformDeliver seamless digital experience for all
Security & GovernanceEmbed cyber security & technology governance
Ensure ongoing compliance with RBI master directions, acrossinfrastructure, applications, network, service managementand security
Improve employee engagement & productivity throughdeployment of collaboration tools and automated reports
Deploy enhanced bots and engagement of customers usingonline, voice, and WhatsApp channels
Identify and build requisite skills in strategic technology areasto ensure readiness on Digital Technology front as a function
People & InnovationDrive innovation & build new capabilities
86
ECL Methodology
87
Changes to ECL Methodology
• RBI had made changes to the method of evaluating the NPAs as per their circular dated 12th Nov2021.
• While these changes are regarding evaluation of NPA as per Income Recognition and AssetClassification and Provisioning (IRACP) as defined by RBI and has no bearing directly on the ECLmodel and was further clarified by RBI in their Feb 15th circular.
• We have made suitable changes in presenting the stagewise asset categorization to bring in moretransparency in our reporting to enable all stakeholders to relate the figures both under IRAC modeland the IND AS ECL model.
• Separate Probability of Default were calculated for each of the sub-classifications under Stage 1 andStage 2.
• Other Measurement framework and segmentation under ECL remains the same.

Asset ClassificationStage 1 - On initial recognition, all loans are classified as Stage 1. Subsequently, loans which are not more than 30 DPD onthe reporting date are classified as Stage 1. It also includes loans which have been reclassified from Stage 2 or Stage 3 onimprovement in credit quality as reflected in their DPD on the reporting date. Within Stage 1, there are 3 sub-categories
1 A – Accounts which never went to stage 3 earlier and accounts which went to Stage 3 but subsequently normalized andcurrently in 0-30 days
1 B – Accounts which were stage 3 earlier, and roll backed but yet to normalize though it has moved to stage 1 currently
Stage 2 - It represents loans which have significant increase in credit risk since origination. Loans which are more than 30 DPD and upto 90 DPD on the reporting date are classified as Stage 2. It also includes loans which have been reclassified from Stage 3 on improvement in credit quality as reflected in their DPD on the reporting date. Within Stage 2, there are 3 sub-categories2 A – Accounts which never went to stage 3 earlier and accounts which went to Stage 3 but subsequently normalized and currently in 31-90 days2 B – Accounts which were stage 3 earlier, and roll backed but yet to normalize, though it has moved to Stage 2 currently
Stage 3 - Loans with more than 90 dpd on the reporting date are considered credit impaired.
PD is computed separately for each of the sub-segment. PD of stage 3 loan is 100% as it is already under default.
Forward looking information with reference to external forecasts of macro-economic parameters is also considered in the estimation of PD by applying appropriate weightages to the most likely, optimistic and pessimistic scenarios.
Addition of Stage 1B, Stage 2B and Stage 3 will be the GNPA as per RBI norms with INDAS values.

89
Retail Staging Framework
Basis Account Conduct it is classified into different stages
Stage 1
Stage 2
Stage 3
EAD
LGD
PD m
12
ECLLifetime
EAD
LGD
PD
%)100(
Asset classification
ECL
PD : Probability of defaultLGD : Loss given defaultEAD : Exposure at time of defaultDiscounting of recoveries is done for respective Stages
Measurement Framework

90
Measurement Framework
Stage 1EAD
LGD
PD m
12
ECL
Lifetime
EAD
LGD
PD
%)100(
Asset classification
ECL
•Assets with low risk (0-30 DPD) on reporting date •Loss estimate based on a 1 year forward estimate
Stage 2
Stage 3
•Assets with Significant Increase in Credit Risk (SICR) since initial recognition •Assets with > 30 DPD and < 90 DPD are considered as Stage 2•Lifetime expected loss is computed
•Assets where default event has already happened as on reporting date•Assets which have DPD > 90 days as on reporting date are classified into stage 3
Description

91
Retail Pooling
HCV New LCV New MLCV/2W/3W New
CAR/MUV New USED OLDER VEHICLE
Tractor CE
Portfolios are segmented based on the below categories. PD term structure and LGDs are computed for each segment separately.
Chola
Vehicle Finance Loan Against Property Home Loan Others
LAP Delhi LAP Tamil Nadu
LAP Punjab / Haryana /
ChandigarhLAP Gujarat
LAP Others
VF portfolio is split basis the product category LAP portfolio is split basis geography
Home Loans and other smaller portfolios are not segmented

92
Contact us
Our registered office
Cholamandalam Investment and Finance Company Limited (Chola),Dare House 1st Floor, No. 2, NSC Bose Road, Parrys,Chennai 600001.Toll free number: 1800-200-4565 (9 AM to 7 PM)Land Line: 044–3000 7172http://www.cholamandalam.com
Sujatha P-Sr. Vice President & Company Secretary–[email protected] D-Executive Vice President & CFO–[email protected]
Email-ID

93
• Certain statements included in this presentation may be forward looking statements made based on management’s current expectations and beliefs
concerning future developments and their potential effects upon Cholamandalam Investment and Finance Company Ltd and its subsidiaries. There
can be no assurance that future developments affecting Cholamandalam Investment and Finance Company Ltd and its subsidiaries will be those
anticipated by management. These forward-looking statements are not a guarantee of future performance and involve risks and uncertainties, and
there are important factors that could cause actual results to differ, possibly materially, from expectations reflected in such forward-looking
statements. Cholamandalam Investment and Finance Company Ltd does not intend and is under no obligation, to update any particular forward-
looking statement included in this presentation.
• The facts and figures mentioned in this presentation is for informational purposes only and does not constitute or form part of, and should not be
construed as, an offer or invitation to sell securities of the Company, or the solicitation of any bid from you or any investor or an offer to subscribe
for or purchase securities of the Company, and nothing contained herein shall form the basis of or be relied on in connection with any contract or
commitment whatsoever. Nothing in the foregoing shall constitute and/or deem to constitute an offer or an invitation to an offer, to be made to
the Indian public or any section thereof or any other jurisdiction through this presentation, and this presentation and its contents should not be
construed to be a prospectus in India or elsewhere. This document has not been and will not be reviewed or approved by any statutory or
regulatory authority in India or any other jurisdiction or by any stock exchanges in India or elsewhere. This document and the contents hereof are
restricted for only the intended recipient (s). This document and the contents hereof should not be (i) forwarded or delivered or transmitted in any
manner whatsoever, to any other person other than the intended recipient (s); or (ii) reproduced in any manner whatsoever. Any forwarding,
distribution or reproduction of this document in whole or in part is unauthorised.
• The information in this document is being provided by the Company and is subject to change without notice. The information in this presentation
has not been independently verified. No representation or warranty, express or implied, is made to the accuracy, completeness or fairness of the
presentation and the information contained herein and no reliance should be placed on such information. The Company or any other parties whose
names appear herein shall not be liable for any statements made herein or any event or circumstance arising therefrom.
Disclaimer
