linking farmers to markets through productive alliances
TRANSCRIPT
November 2016
Linking Farmers to Markets through Productive Alliances
An Assessment of the World Bank Experience in Latin America
Pub
lic D
iscl
osur
e A
utho
rized
Pub
lic D
iscl
osur
e A
utho
rized
Pub
lic D
iscl
osur
e A
utho
rized
Pub
lic D
iscl
osur
e A
utho
rized
© 2016 International Bank for Reconstruction and Development / The World Bank 1818 H Street NWWashington DC 20433Telephone: 202-473-1000Internet: www.worldbank.org
This work is a product of the staff of The World Bank with external contributions. The findings, interpretations, and conclusions expressed in this work do not necessarily reflect the views of The World Bank, its Board of Executive Directors, or the governments they represent.
The World Bank does not guarantee the accuracy of the data included in this work. The boundaries, colors, denominations, and other information shown on any map in this work do not imply any judgment on the part of The World Bank concerning the legal status of any territory or the endorsement or acceptance of such boundaries.
Rights and Permissions
The material in this work is subject to copyright. Because The World Bank encourages dissemination of its knowledge, this work may be reproduced, in whole or in part, for noncommercial purposes as long as full attribution to this work is given.
Any queries on rights and licenses, including subsidiary rights, should be addressed to the Publishing and Knowledge Division, The World Bank Group, 1818 H Street NW, Washington, DC 20433, USA; fax: 202-522-2625; e-mail: [email protected].
Photographys from World Bank Projects and ShutterstockConcept and design: Jaime Sosa
Linking Farmers to Markets through Productive Alliances
An Assessment of the World Bank Experience in Latin America
November 2016

TABLE OF CONTENTSAcknowledgements ix
Abbreviations x
Executive Summary 1
1. Introduction 5
2. The Productive Alliance Approach 9
3. Productive Alliances in Latin America and the Caribbean 13
4. Targeting Strategies: Geographic, Value Chains, Beneficiaries 21
5. Subproject Preparation and Selection 29
6. Subproject Financing 33
7. Results Monitoring 39
8. Achievements and Outcomes 41
9. Evaluation Strategies 49
10. Lessons Learned 55
11. Conclusions and Recommendations 59
Annex 1 Descriptions PA Projects in Latin America and the Caribbean 62
Annex 2 Key PA Project Characteristics 65
Annex 3 Targeting Strategies 69
Annex 4 Subproject Selection Process 71
Annex 5 Subproject Financing 74
Annex 6 PA Project Monitoring and Evaluation Systems 76
Annex 7 Results Frameworks 79
Annex 8 Productive Alliance Project Outcomes and Impact Evaluations 83
Annex 9 Theory of Change for Productive Alliance projects 93
Annex 10 Selected issues and possible solutions 95
References 98
LIST OF FIGURESFigure 2.1 Core Elements of a Productive Alliance 12
Figure 3.1 Geography of Productive Alliance Projects in Latin America 14
Figure 3.2 Stages of beneficiary producer organizations 17
Figure 3.3 End Market Levels 18
Figure 4.1 Distribution of rural population and smallholder producers 24
Figure 5.1 Steps of the Subproject Selection Process 31
Figure 8.1 Main areas of PA project impact 43
LIST OF TABLESTable 3.1 Conditional versus unconditional Productive Alliance projects 15
Table 3.2 Areas of emphasis 16
Table 3.3 Formality of Commercial Agreements 18
Table 4.1 Geographical Coverage of Productive Alliance Projects 22
Table 4.2 Targeting of Value Chains 23
Table 4.3 Eligibility criteria for Beneficiary Producers 25
Table 8.1 Financial Rates of Return 46
LIST OF BOXESIn Practice Box 1: Eligibility Criteria for Targeting Buyers 28
In Practice Box 2: Preparation and Selection Criteria for Subproject Business Plans 32
In Practice Box 3: Institutional Arrangements of PA Subproject Selection Process 32
In Practice Box 4: Leveraging Subproject Funding through broader Alliances (Colombia) 36
In Practice Box 5: Upfront Engagement of the Commercial Financial Sector (Honduras) 37
In Practice Box 6: Revolving Funds as an Alternative Financing Mechanism (Colombia) 38
In Practice Box 7 Productive Alliances as a Tool for Effective Social Inclusion (Colombia) 44
In Practice Box 8: Dissolution versus Failure of a Productive Alliance (Colombia) 46
In Practice Box 9: Factors of Sustainability (Bolivia and Colombia) 48
In Practice Box 10: Measuring Successful Productive Alliances (Brazil Pernambuco) 52
In Practice Box 11: Building Partnerships for Obtaining Evidence 53
In Practice Box 12: Learning from Different Evaluation Methodologies (DIME) 54
LIST OF ANNEX FIGURESFigure A6.1 M&E System Example 1: Colombia PAAP 78
Figure A6.2 M&E System Example 2: Mexico SPSB 78
Figure A9.1 Theory of Change Logic 93
LIST OF ANNEX TABLESTable A2.1 Productive Alliance Projects in Latin America and the Caribbean 65
Table A2.2 PA Stand-alone versus PA Component 66
Table A2.3 Target Areas and Direct Beneficiaries 67
Table A3.1 Producer Eligibility Criteria for Subproject Proposals 69
Table A3.2 Producer Organization Requirements 70
Table A4.1 Institutional arrangements subproject selection 71
Table A5.1 Financial Support to Producer Organizations 74
Table A5.2 Financed Support and Cost Categories 75
Table A6.1 Subproject Monitoring 76
Table A7.1 Project Development Objectives and Indicators 79

Table A8.1 Scope of Projects 83
Table A8.2 Investment Support 83
Table A8.3 Key Outcomes and Impacts of Completed PA Projects 84
Table A9.2 Prototypical Theory of Change for Productive Alliance Projects 94

ix
Linking Farmers to Markets through Productive Alliances
The preparation of this report has been led by Alexandra Christina Horst (Junior Professional Officer, Agriculture Global Practice) in close collaboration with Maria del Mar Polo (Agricultural Economist, Food and Agriculture Organization) and with guidance from Laurent Msellati (Practice Manager, Agriculture Global Practice), Michael Morris (Lead Agriculture Economist, Agriculture Global Practice) and David Tuchschneider (Senior Rural Development Specialist, Agriculture Global Practice). It has been peer-reviewed by Martien van Nieuwkoop (Practice Manager, Agriculture Global Practice), Panos Varangis (Head, Finance and Markets), Loraine Ronchi (Lead Economist, Trade and Competitiveness Global Practice), and Mark Lundy (Senior Researcher, International Center for Tropical Agriculture). The report was edited by Anna Roumani (Consultant, Agriculture Global Practice).
The report has also benefited greatly from detailed comments, discussions and expert consultations within the World Bank Agriculture Global Practice, specifically from Fatima Amazonas (Senior Rural Development Specialist), Diego Arias (Senior Agriculture Economist), Marie-Helene Collion (former Lead Agricultural Specialist), Edward Bresnyan (Senior Agriculture Economist), Pierre Olivier Colleye (Senior Microfinance Specialist), Luz Diaz (Senior Agribusiness Specialist), Svetlana Edmeades (Senior Agriculture Economist), Barbara Farinelli (Agriculture Economist), Marianne Grosclaude (Lead Agriculture Economist), Steven Jaffee (Lead Agriculture Economist), Willem Janssen (Lead Agriculture Economist), Roy Parizat (Senior Economist), Norman Piccioni (Senior Rural Development Specialist), Anna Roumani (Consultant), Eli Weiss (Senior Rural Development Specialist), and Pierre Werbrouck (former Lead Agriculture Economist).
Furthermore, comments and contributions have been received from colleagues within the World Bank and other development and research institutions: Luis Dias (Economist, FAO), Dino Francescutti (Senior Economist, FAO), Frank Hollinger (Economist, FAO) Barbara Jordan Vicente (Consultant Junior Economist, FAO), and Astrid Zwager (Research Analyst, World Bank Development Impact Evaluation Unit). Special recognition is extended to the Project Management Units of all Productive Alliance projects analyzed in this assessment for providing crucial inputs and documentation to this report.
ACKNOWLEDGEMENTS
x
AF Additional Financing
ALIADOS Sierra Rural Development Project (Peru)
CCRB Coordinating Unit for Biological Corridors and Resources
CDD Community-Driven Development
CfP Call for Proposals
CIAT International Center for Tropical Agriculture
CLARs Local Resource Allocation Committees
COMRURAL Rural Competitiveness Project
CONABIO National Commission for Knowledge and Use of Biodiversity
COSUDE Swiss Agency for Development and Cooperation
COTESIP Technical Council for Sustainable Production Systems
EDOs Enterprise Development Officers
IRR Internal Rate of Return
FPS National Fund for Social and Productive Investments
GDP Gross Domestic Product
GEF Global Environmental Facility
IADB Inter-American Development Bank
IBRD International Bank for Reconstruction and Development
ICC Investment Coordination Committee
ICR Implementation Completion and Results Report
IDA International Development Association
IFI Intermediate Financial Institution
IRR Internal Rate of Return
JSIF Jamaica Social Investment Fund
M&E Monitoring and Evaluation
MADR Ministry of Agriculture and Rural Development (Colombia)
MIDA Ministry of Agricultural Development (Panama)
MINAG Ministry of Agriculture (Peru)
MINECO Ministry of Economy (Guatemala)
MRC Management Review Committee
MTR Mid-Term Review
NGO Non-Governmental Organization
ABBREVIATIONS
xi
Linking Farmers to Markets through Productive Alliances
NIC National Inter-sectoral Committee
NPAS National Protected Areas System
OGA Local Management Organization
OGR Regional Management Organization
PA Productive Alliances
PAAP Productive Alliance Support Program (Colombia)
PAR Rural Alliances Project (Bolivia)
PDER Project to Support a Rural Economic Development Program (Guatemala)
PDO Project Development Objective
PCU Project Coordination Unit
PO Producer Organization(s)
POA Annual Operational Plan
PPAR Project Performance Assessment Report
PRORURAL Rural Productivity Project (Panama and Pernambuco, Brazil)
REDI Rural Economic Development Initiative (Jamaica)
REEC Rural Economic Evaluation Committees
RIC Regional Inter-sectoral Committee(s)
RPU Regional Project Units
SDEs Entrepreneurial Services Providers
SEGEPLAN Presidential Secretariat for Planning and Programming
SENA National Apprenticeship Service (Colombia)
SIGG Georeferenced Management Information System
SIGIEP Project Monitoring System - Sistema Integral de Gestión de Información y Evaluación del Proyecto (Mexico)
SNIP National Public Investment System (Peru)
TA Technical Assistance
1
i. The World Bank Agriculture Global
Practice has identified “linking farmers
to markets” as a major development
challenge in recognition of the obstacles faced by smallholder producers as they seek to compete in rapidly expanding modern agricultural value chains. As laid out in its Agriculture Action Plan (2013-2015), the Agriculture Global Practice is working to improve the competitiveness and entrepreneurship of smallholder producers in developing countries by strengthening value chains.
ii. One approach to address this
challenge has been to promote
Productive Alliances (PA) that
strengthen the linkages between
producers, buyers and the public
sector within agriculture value-
chains. The PA approach provides holistic solutions to address market imperfections that inhibit smallholder producers’ socio-economic progress.
CONCEPTiii. A Productive Alliance involves
three core agents: a group of
smallholder producers, one or more
buyers, and the public sector. These three agents are connected through a business proposition, or “business plan”, which describes the capital and services needs of the producers and proposes improvements that would allow them to upgrade their production capacities and skills to strengthen their linkage with the market, i.e. the buyer(s). The implementation of such a business plan through a subproject is typically supported through three core inputs and/or activities directed
towards the producers’ needs: productive investments, technical assistance, and business development. These core inputs are financed through public grants provided by the project, which are matched by the beneficiary producers and in some cases also by the buyer(s).
iv. The financial support provided to
Productive Alliance subprojects usually
comes in the form of matching grants,
which are justified by the positive
externalities that are generated by the
subproject and the fact that commercial
finance is often not available to rural
smallholders. The levels of grant support and the arrangements for co-financing among the alliance partners have varied considerably across PA projects; experience suggests that satisfactory outcomes are far more likely when a minimum of 30% co-financing of the total subproject costs is required of beneficiary producers. While many PA projects have required only in-kind contributions from producers, cash contributions encourage greater ownership of the supported subproject, ensure enhanced risk-sharing, and require greater commitment on the part of producers.
v. The design of the Productive
Alliance approach encourages
the development of two types of
productive alliances: (i) a horizontal
alliance among the producers and
most importantly (ii) a vertical alliance
between the producers and the
buyer(s). Major motivations identified by both producers and buyers for joining a vertical alliance have been increased stability in prices, assured sales, as well as improvements in product quality
and hence revenues. In addition, producers also value the opportunity to obtain technical assistance, improve their negotiating power, and receive payment promptly from the buyer(s).
vi. The basic concept of the
Productive Alliance approach is simple,
and it has proved sufficiently flexible
to adjust to a wide range of market
realities and policy objectives. By design, the PA approach resolves multiple constraints in a simultaneous and tailored fashion by providing integrated solutions that are adapted to local conditions. It has shown its flexibility across PA projects, having demonstrated the ability to adapt to differences in policy priorities, market opportunities, and countries’ economic conditions. In favorable enabling environments, PA projects benefit from complementary support systems from public and private sector agents, encouraging a harmonization of public and private services in line with the overall PA project’s objectives of improving smallholder production and market integration.
IMPLEMENTATION EXPERIENCEvii. The Productive Alliance approach
was introduced during the early 2000s
in Latin America and the Caribbean
(LAC). Since then, the World Bank has
provided more than US$1 billion in
financing to support 21 projects with
over 3,500 subprojects in ten countries
across the LAC region. Projects promoting PA have also been introduced in countries in Sub-Saharan Africa and East Asia. This widespread adoption is
EXECUTIVE SUMMARY
2
Linking Farmers to Markets through Productive Alliances
based on increasing evidence suggesting - subject to further, intensified formal evaluation - that the PA -approach can lead to increases in productivity, market integration, production, sales volume, value-addition, prices, and income of smallholder farmers, while generating on-farm and non-farm employment, improving the quality of jobs, as well as the inclusion of vulnerable groups.
viii. The subproject preparation
and selection process follows a
common procedure across Productive
Alliance projects: First, a public information campaign is carried out to raise awareness among potential beneficiaries. Subsequently, a call for initial subproject proposals is launched to invite interested producers to submit initial subproject proposals. Next, the initial subproject proposals are screened and evaluated against predefined eligibility criteria. Viable proposals are then elaborated into more detailed subproject business plans, often with the support of service providers. Finally, subproject proposals which meet (a minimum of) the established criteria are approved for financing.
ix. Across Latin America, many
different variations have appeared
of the Productive Alliance approach,
distinguished in terms of their areas
of emphasis, types of beneficiary
producers, end markets and formality
of commercial agreements between
producers and buyers. Generally, improving market integration and competitiveness are the main areas of emphasis of Productive Alliance projects. Depending on the sector and the prevailing market structures, PA projects have supported subprojects that work with producers at different stages of organization. Similarly, PA projects have differed in the types of end markets they have targeted, as
well as in the levels of product quality requirements they have pursued. Finally, PA projects have varied in the degree of formality they have demanded with respect to the commercial agreements struck between producers and buyers; these have ranged from formal written contracts to more informal agreements.
x. Based on differences in project
objectives and expected outcomes,
Productive Alliance projects in LAC
have adopted a variety of targeting
strategies regarding geography,
agricultural value chains, and
beneficiaries. For instance, most PA projects have focused on specific priority areas in a given country based on socio-economic, demographic and market criteria to ensure effective geographic targeting. PA projects have financed subprojects with activities in both agricultural production and rural non-farm economic activities, although the former have predominated. In terms of beneficiaries, PA projects generally have targeted “transitional smallholder producers” who lack well-established linkages to buyers and markets but have the potential and willingness to increase their productive and entrepreneurial capacities to engage in modern agri-food markets. PA projects have established transparent and technical criteria for selecting beneficiary producers, to ensure credibility and a fair selection process. With respect to buyers, targeting financially and commercially strong buyers and ensuring their commitment to an alliance with the producers are critical. Very few PA projects have established eligibility criteria for buyers, however, which has been identified as an area for improvement for future PA interventions.
xi. To leverage Productive Alliance
subproject financing, almost all
Productive Alliance projects have
aimed to enhance producers’ access to
commercial finance, but these efforts
have rarely been successful. A limited number of PA projects have successfully engaged the commercial financial sector from early on by making them part of the alliance and subproject co-financing structure. However, most have not been able to realize their intentions. The reasons for this are manifold and include low coverage of financial services in rural areas, lack of collateral from the smallholder producers, regulatory issues that prevent financial institutions from making loans to groups of producers (and not individuals), among others.
ACHIEVEMENTSxii. The generally positive
achievements of Productive Alliance
projects are assessed in this report in
terms of: (i) scope, (ii) social inclusion,
(iii) socio-economic impacts, (iv)
efficiency, and (v) sustainability.
Scope: Almost all Productive Alliance projects in Latin America have exceeded their appraisal targets for the number of alliance subprojects. However, they have generally fallen short on the expected number of beneficiary producers per producer organization. Another important finding regarding beneficiaries is that indirect beneficiaries of PA projects are largely unaccounted for and have been measured only in a few cases.
Social inclusion: Productive Alliance projects have performed well in including women and other disadvantaged groups, such as indigenous peoples or smallholder producers in post-conflict zones. Based on project evaluation results, the PA approach appears to be an effective tool for social inclusion, as: (i) the participation of disadvantaged groups in PA projects is high, sometimes exceeding the proportion
3
of these groups in the overall population; and (ii) the performance of alliances involving these groups compared to alliances involving producers from non-disadvantaged groups has been equally good and in some cases even better.
Socio-economic impacts: Productive Alliance projects have generated significant positive impacts in production, sales, income, and employment. Evidence from surveys and evaluations of several projects has shown that the PA approach has led to increases in production volume, productivity, access to improved inputs and productive equipment, as well as to integration into new markets. Moreover, beneficiary producers benefit from better product quality and diversification and hence increased sales volume and prices. Specifically, increases in sales have ranged between 20% and 60% and the average net income of beneficiary producers has been around 30% higher compared to control groups. Moreover, some PA projects have been found to have led to improvements in employment and the generation of new job, but the available evidence on jobs is based on relatively small samples and varies strongly across value chains.
Efficiency: Most Productive Alliance projects have generated satisfactory average rates of return at the commonly assumed discount rate of 12% and 10 year estimation period. Returns have often varied greatly between products, however, which underlines the importance of accurately assessing the long-term market potential of the products to be financed under a PA project. Regarding sustainability, vertical alliances often form between smallholder producers and buyers
and persist over the longer term, with most alliances continuing to operate after project support has ceased.
Sustainability: Productive Alliance projects have promoted longer-term vertical alliances between smallholder producers and buyers. Increasing evidence shows that a significant portion of established alliances continue operating also after subproject support ends. However, as for development operations in general, only few ex-post evaluations are done more than two years after overall project completion, leaving most assessments of sustainability limited to one or two years after subproject completion.
LESSONS LEARNEDxiii. Key lessons emerging from the
Productive Alliance experience in
Latin America include the following:
» Setting up a competitive subproject
selection process based on clearly
defined technical evaluation
criteria is crucial for establishing
credibility among stakeholders,
avoiding political interference, and
safeguarding the technical quality of
selected subprojects. A competitive
process ensures that subprojects
are approved based on the merit
and viability of their business plan,
leaving few opportunities for financing
to be steered by government
officials or local authorities based
on non-technical criteria.
» Identifying and analyzing promising
value chains based on technical criteria,
aligned with project objectives and
market potential, are important to
ensure effectiveness and sustainability.
Such analysis should be done during
project preparation and must be
based on a realistic assessment
of the local/regional comparative
advantage in specific value chains.
» Productive Alliance projects involving
a multi-sector approach with different
institutions, components, and areas
of concentration are challenging to
implement. First-time operations
with newly formed implementation
agencies should be kept simple, use
piloting and evaluation for future
scale-up, and receive close supervision
so that the learning opportunity is
optimized and the implementation
agencies are capable of entering a
follow-on phase with confidence.
» Establishing assessment criteria for
the selection of potential buyers and
regular monitoring of the producer-
buyer relationship can reduce the risk
of choosing an uncompetitive buyer or
promoting elite capture in imperfect
markets. Measures to enhance the
continuity of a vertical alliance include
improved identification of buyers
and their market competitiveness
and viability, brokerage services for
organizations that outgrow their
current alliance arrangements, and
an increased outreach to potential
buyers outside the local spheres.
» Requiring cash contributions or
bank loans as co-financing from
producers can ensure a stronger
buy-in. The provision of financial
resources which are not in-kind
creates a greater ownership of the
success of the supported subproject
and allows producer organizations to
strengthen their entrepreneurial skills
and commitment to the subproject.
» Building capacity of beneficiary
producers over an extended period
while they grow and mature is
crucial for ensuring long-term
4
Linking Farmers to Markets through Productive Alliances
success. Experience suggests that
accompanying beneficiary producer
organizations – and buyers - over the
course of their alliance subproject
implementation period, rather than
providing a one-off injection of
resources, can build the capacity
needed to foster adaptation to
specific and evolving business needs
and ensure long-term survival.
» More large-scale and representative
evidence is needed to substantiate
the results on socio-economic impacts
and efficiency. Sound evaluation
strategies and ensured budgeting
for data collection and analysis can
bolster the evidence base supporting
use of the PA approach. Starting this
process at the project design stage
and rigorously following through
increases the likelihood that a PA
project can demonstrate results and
attribute them to the project.
» Developing a plan for transitioning
to post World Bank-financing
of Productive Alliance activities
ensures continuity without
disruptions for subprojects. This
requires early definition of an exit
strategy with transition planning
beginning – at the latest - by the
time of the Mid-term Review and
continuous monitoring thereafter.
RECOMMENDATIONSxiv. Considering the achievements of
past and current Productive Alliance
projects and the lessons learned from
the implementation experience to
date, five main recommendations
emerge that can strengthen and
enhance the Productive Alliance
approach in future projects:
» Productive Alliance projects should
seek to build broad alliances through
a stronger involvement of local
actors in the enabling environment
(e.g. financial, institutional, and
educational). This will enable them
to tap into local knowledge and
business opportunities and to better
integrate the alliance subprojects in
municipal development plans and
related investments and services.
» Productive Alliance projects should
develop a systematic approach
linking beneficiary producers with the
commercial financial sector to leverage
financing. This could be done through
guarantees to stimulate the willingness
of financial intuitions to co-finance
a significant part of the business
plan through a loan. Furthermore,
PA projects could increasingly focus
on meeting other financing needs
of producers, such as payment
systems, insurance, or savings.
» Productive Alliance projects should
intensively promote the diversification
of buyers and markets. A more
diversified portfolio of offtake markets
can serve as an instrument to increase
producers’ resilience to external
shocks and to protect producers from
exploitative behavior by buyers.
» Productive Alliance projects could
increasingly consider adopting
a multi-sector approach, where
appropriate and desired by the client.
In this manner, the generally socio-
economic development objectives of
the PA approach can be combined
with high-level objectives such as
environmental sustainability, social
inclusion, or improved nutrition
outcomes. Given its flexibility in
design and implementation, the PA
approach is adaptable and can be
used to address several objectives
in a more holistic manner.
» Productive Alliance projects should
incorporate an impact evaluation
strategy and dedicated budget
from the early design stage. Despite
widespread application of the PA
approach and increasing evidence on
results, limited large-scale rigorous
and formal evidence exists so far
on its effectiveness. Because of this
lack of evidence, several key design
questions remain un-answered.
Hence, future PA projects should
include relevant evaluation questions
in their results monitoring design
and incorporate baseline and impact
evaluation data collection and
analysis in their budget planning.
5
1
1. Introduction
> 2. Productive Alliances in Latin America and the Caribbean
6
Linking Farmers to Markets through Productive Alliances
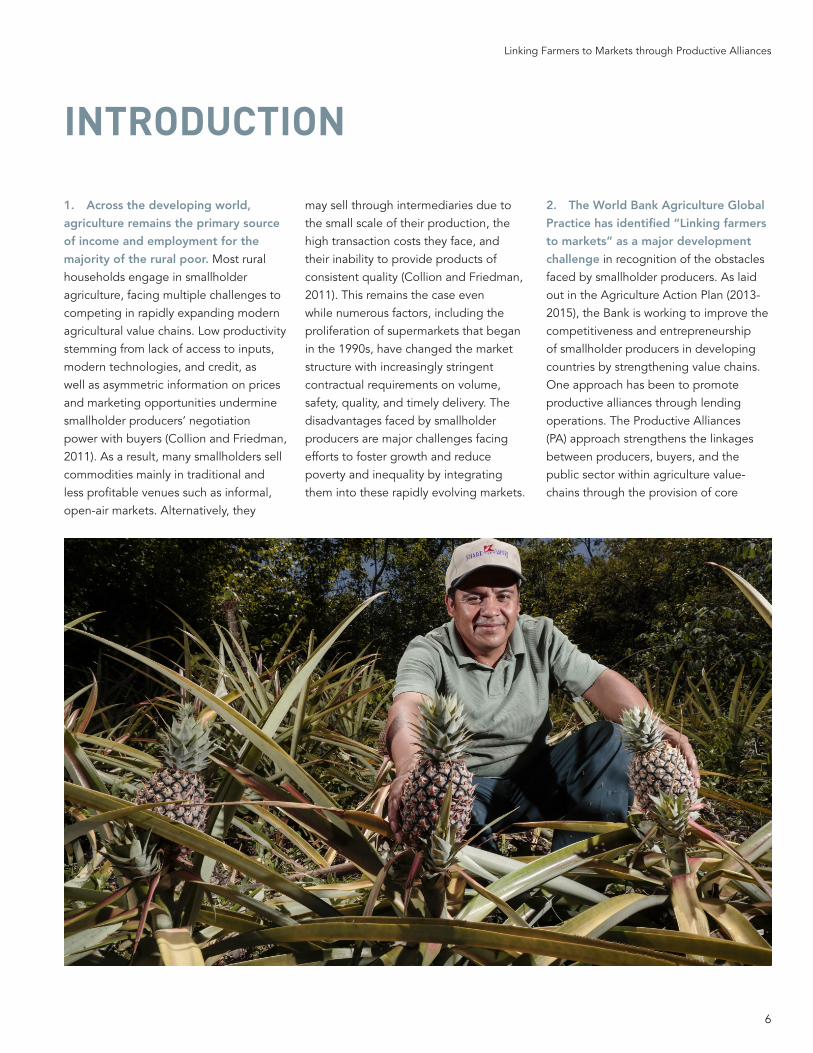
1. Across the developing world,
agriculture remains the primary source
of income and employment for the
majority of the rural poor. Most rural households engage in smallholder agriculture, facing multiple challenges to competing in rapidly expanding modern agricultural value chains. Low productivity stemming from lack of access to inputs, modern technologies, and credit, as well as asymmetric information on prices and marketing opportunities undermine smallholder producers’ negotiation power with buyers (Collion and Friedman, 2011). As a result, many smallholders sell commodities mainly in traditional and less profitable venues such as informal, open-air markets. Alternatively, they
may sell through intermediaries due to the small scale of their production, the high transaction costs they face, and their inability to provide products of consistent quality (Collion and Friedman, 2011). This remains the case even while numerous factors, including the proliferation of supermarkets that began in the 1990s, have changed the market structure with increasingly stringent contractual requirements on volume, safety, quality, and timely delivery. The disadvantages faced by smallholder producers are major challenges facing efforts to foster growth and reduce poverty and inequality by integrating them into these rapidly evolving markets.
2. The World Bank Agriculture Global
Practice has identified “Linking farmers
to markets” as a major development
challenge in recognition of the obstacles faced by smallholder producers. As laid out in the Agriculture Action Plan (2013-2015), the Bank is working to improve the competitiveness and entrepreneurship of smallholder producers in developing countries by strengthening value chains. One approach has been to promote productive alliances through lending operations. The Productive Alliances (PA) approach strengthens the linkages between producers, buyers, and the public sector within agriculture value-chains through the provision of core
INTRODUCTION
7
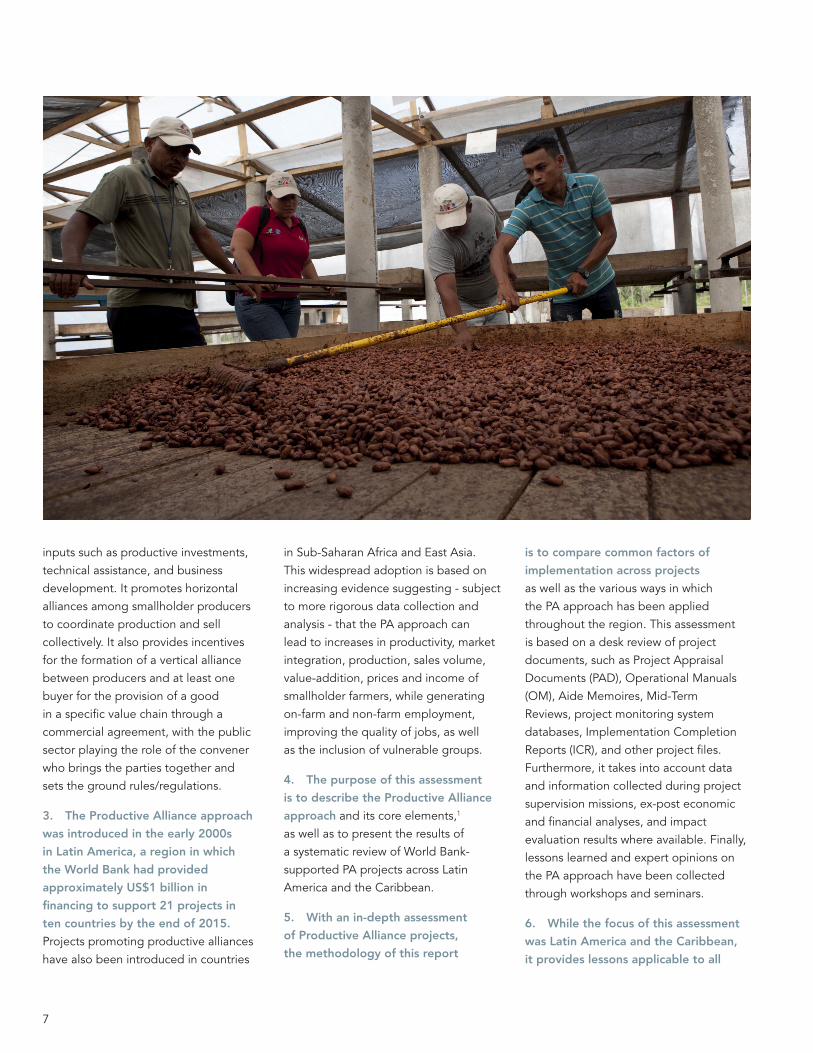
inputs such as productive investments, technical assistance, and business development. It promotes horizontal alliances among smallholder producers to coordinate production and sell collectively. It also provides incentives for the formation of a vertical alliance between producers and at least one buyer for the provision of a good in a specific value chain through a commercial agreement, with the public sector playing the role of the convener who brings the parties together and sets the ground rules/regulations.
3. The Productive Alliance approach
was introduced in the early 2000s
in Latin America, a region in which
the World Bank had provided
approximately US$1 billion in
financing to support 21 projects in
ten countries by the end of 2015.
Projects promoting productive alliances have also been introduced in countries
in Sub-Saharan Africa and East Asia. This widespread adoption is based on increasing evidence suggesting - subject to more rigorous data collection and analysis - that the PA approach can lead to increases in productivity, market integration, production, sales volume, value-addition, prices and income of smallholder farmers, while generating on-farm and non-farm employment, improving the quality of jobs, as well as the inclusion of vulnerable groups.
4. The purpose of this assessment
is to describe the Productive Alliance
approach and its core elements,1 as well as to present the results of a systematic review of World Bank-supported PA projects across Latin America and the Caribbean.
5. With an in-depth assessment
of Productive Alliance projects,
the methodology of this report
is to compare common factors of
implementation across projects as well as the various ways in which the PA approach has been applied throughout the region. This assessment is based on a desk review of project documents, such as Project Appraisal Documents (PAD), Operational Manuals (OM), Aide Memoires, Mid-Term Reviews, project monitoring system databases, Implementation Completion Reports (ICR), and other project files. Furthermore, it takes into account data and information collected during project supervision missions, ex-post economic and financial analyses, and impact evaluation results where available. Finally, lessons learned and expert opinions on the PA approach have been collected through workshops and seminars.
6. While the focus of this assessment
was Latin America and the Caribbean,
it provides lessons applicable to all
8
Linking Farmers to Markets through Productive Alliances
1. Project documents use different terminologies for a productive alliance, such as rural alliance, commercial alliance, productive partnership, productive subprojects and producer organization productive subprojects. For consistency, this report uses only the term productive alliances.
developing regions. Learning from the experience of the PA approach is important, because by 2040 the number of people living in rural areas is not expected to decline from today’s rural population and a high proportion of that population will continue to be engaged in agriculture (World Bank, 2015). Hence, both the World Bank and its partners have an interest in identifying effective and efficient instruments to link smallholder farmers to markets, which can be adapted to idiosyncratic production, markets and sector priorities. This report claims that the PA approach is a promising candidate.
7. The structure of this report is
as follows: Section 2 describes the concept of the PA approach and its
core elements. Section 3 presents the experience of PA projects in Latin America and the Caribbean. Section 4 details the variation in PA project implementation based on geography, value chains and beneficiary targeting. Section 5 describes how PA subprojects are selected, and Section 6 summarizes the financial support typically provided to the alliance partners. Section 7 presents the monitoring activities of PA projects, while Section 8 discusses key outcomes and impacts of these operations. Section 9 provides suggestions for developing evaluation strategies for PA projects, and Section 10 summarizes the main lessons learned. Section 11 provides conclusions and recommendations.
9
2
< 1. Introduction
2. Productive Alliances in Latin America and the Caribbean
> 3. Targeting Strategies: Geographic, Value Chains, Beneficiaries
10
Linking Farmers to Markets through Productive Alliances
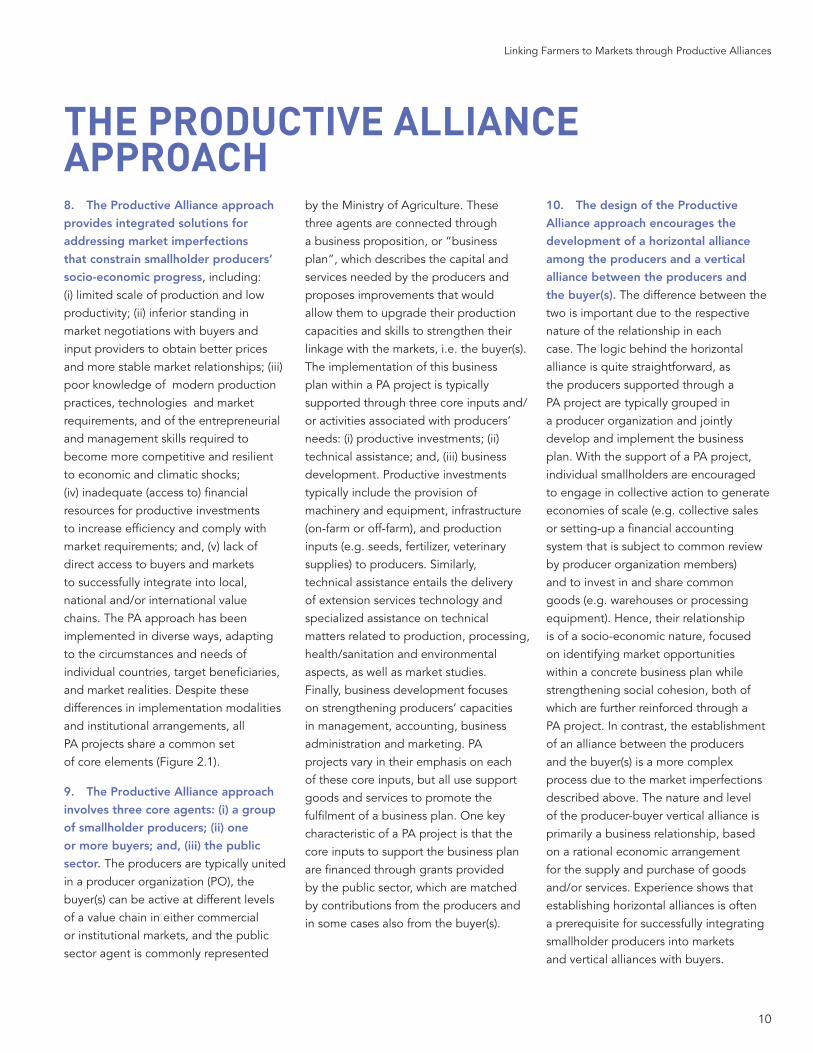
8. The Productive Alliance approach
provides integrated solutions for
addressing market imperfections
that constrain smallholder producers’
socio-economic progress, including: (i) limited scale of production and low productivity; (ii) inferior standing in market negotiations with buyers and input providers to obtain better prices and more stable market relationships; (iii) poor knowledge of modern production practices, technologies and market requirements, and of the entrepreneurial and management skills required to become more competitive and resilient to economic and climatic shocks; (iv) inadequate (access to) financial resources for productive investments to increase efficiency and comply with market requirements; and, (v) lack of direct access to buyers and markets to successfully integrate into local, national and/or international value chains. The PA approach has been implemented in diverse ways, adapting to the circumstances and needs of individual countries, target beneficiaries, and market realities. Despite these differences in implementation modalities and institutional arrangements, all PA projects share a common set of core elements (Figure 2.1).
9. The Productive Alliance approach
involves three core agents: (i) a group
of smallholder producers; (ii) one
or more buyers; and, (iii) the public
sector. The producers are typically united in a producer organization (PO), the buyer(s) can be active at different levels of a value chain in either commercial or institutional markets, and the public sector agent is commonly represented
by the Ministry of Agriculture. These three agents are connected through a business proposition, or “business plan”, which describes the capital and services needed by the producers and proposes improvements that would allow them to upgrade their production capacities and skills to strengthen their linkage with the markets, i.e. the buyer(s). The implementation of this business plan within a PA project is typically supported through three core inputs and/or activities associated with producers’ needs: (i) productive investments; (ii) technical assistance; and, (iii) business development. Productive investments typically include the provision of machinery and equipment, infrastructure (on-farm or off-farm), and production inputs (e.g. seeds, fertilizer, veterinary supplies) to producers. Similarly, technical assistance entails the delivery of extension services technology and specialized assistance on technical matters related to production, processing, health/sanitation and environmental aspects, as well as market studies. Finally, business development focuses on strengthening producers’ capacities in management, accounting, business administration and marketing. PA projects vary in their emphasis on each of these core inputs, but all use support goods and services to promote the fulfilment of a business plan. One key characteristic of a PA project is that the core inputs to support the business plan are financed through grants provided by the public sector, which are matched by contributions from the producers and in some cases also from the buyer(s).
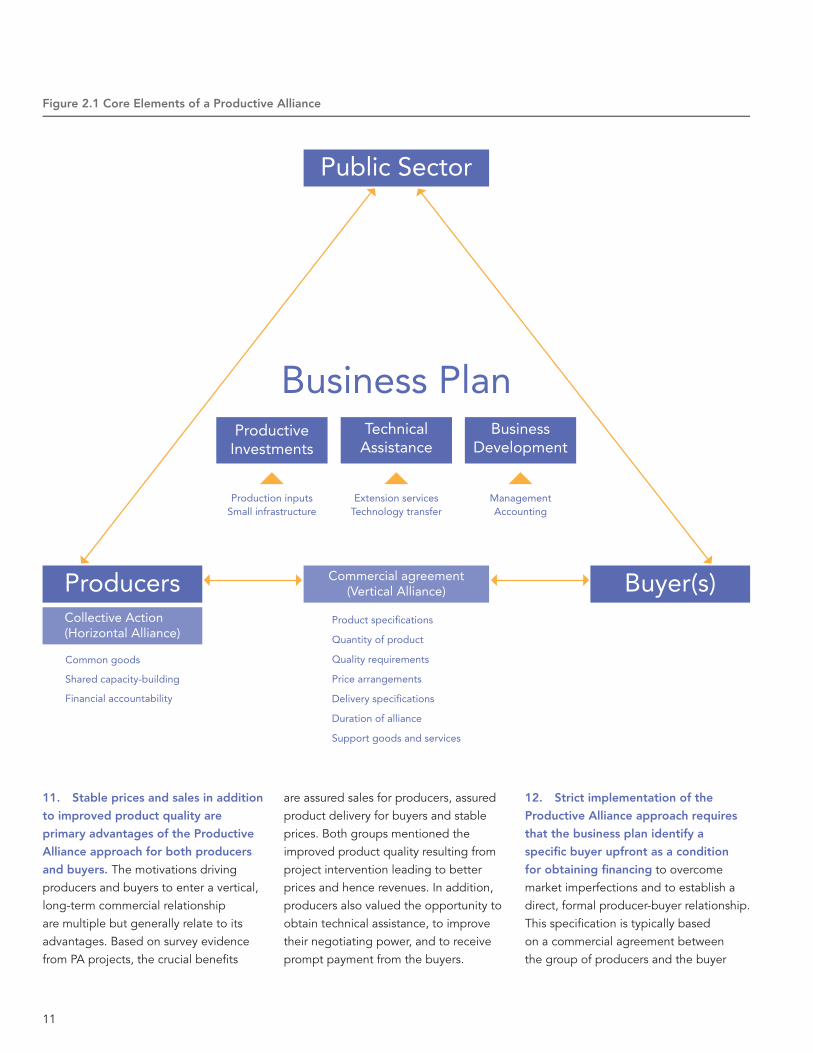
10. The design of the Productive
Alliance approach encourages the
development of a horizontal alliance
among the producers and a vertical
alliance between the producers and
the buyer(s). The difference between the two is important due to the respective nature of the relationship in each case. The logic behind the horizontal alliance is quite straightforward, as the producers supported through a PA project are typically grouped in a producer organization and jointly develop and implement the business plan. With the support of a PA project, individual smallholders are encouraged to engage in collective action to generate economies of scale (e.g. collective sales or setting-up a financial accounting system that is subject to common review by producer organization members) and to invest in and share common goods (e.g. warehouses or processing equipment). Hence, their relationship is of a socio-economic nature, focused on identifying market opportunities within a concrete business plan while strengthening social cohesion, both of which are further reinforced through a PA project. In contrast, the establishment of an alliance between the producers and the buyer(s) is a more complex process due to the market imperfections described above. The nature and level of the producer-buyer vertical alliance is primarily a business relationship, based on a rational economic arrangement for the supply and purchase of goods and/or services. Experience shows that establishing horizontal alliances is often a prerequisite for successfully integrating smallholder producers into markets and vertical alliances with buyers.
THE PRODUCTIVE ALLIANCE APPROACH
11
11. Stable prices and sales in addition
to improved product quality are
primary advantages of the Productive
Alliance approach for both producers
and buyers. The motivations driving producers and buyers to enter a vertical, long-term commercial relationship are multiple but generally relate to its advantages. Based on survey evidence from PA projects, the crucial benefits
are assured sales for producers, assured product delivery for buyers and stable prices. Both groups mentioned the improved product quality resulting from project intervention leading to better prices and hence revenues. In addition, producers also valued the opportunity to obtain technical assistance, to improve their negotiating power, and to receive prompt payment from the buyers.
12. Strict implementation of the
Productive Alliance approach requires
that the business plan identify a
specific buyer upfront as a condition
for obtaining financing to overcome market imperfections and to establish a direct, formal producer-buyer relationship. This specification is typically based on a commercial agreement between the group of producers and the buyer
Business Plan
Public Sector
Buyer(s)ProducersCollective Action(Horizontal Alliance)
Common goods
Shared capacity-building
Financial accountability
Commercial agreement(Vertical Alliance)
Product specifications
Quantity of product
Quality requirements
Price arrangements
Delivery specifications
Duration of alliance
Support goods and services
ProductiveInvestments
Production inputsSmall infrastructure
TechnicalAssistance
Extension servicesTechnology transfer
BusinessDevelopment
ManagementAccounting
Figure 2.1 Core Elements of a Productive Alliance
12
Linking Farmers to Markets through Productive Alliances
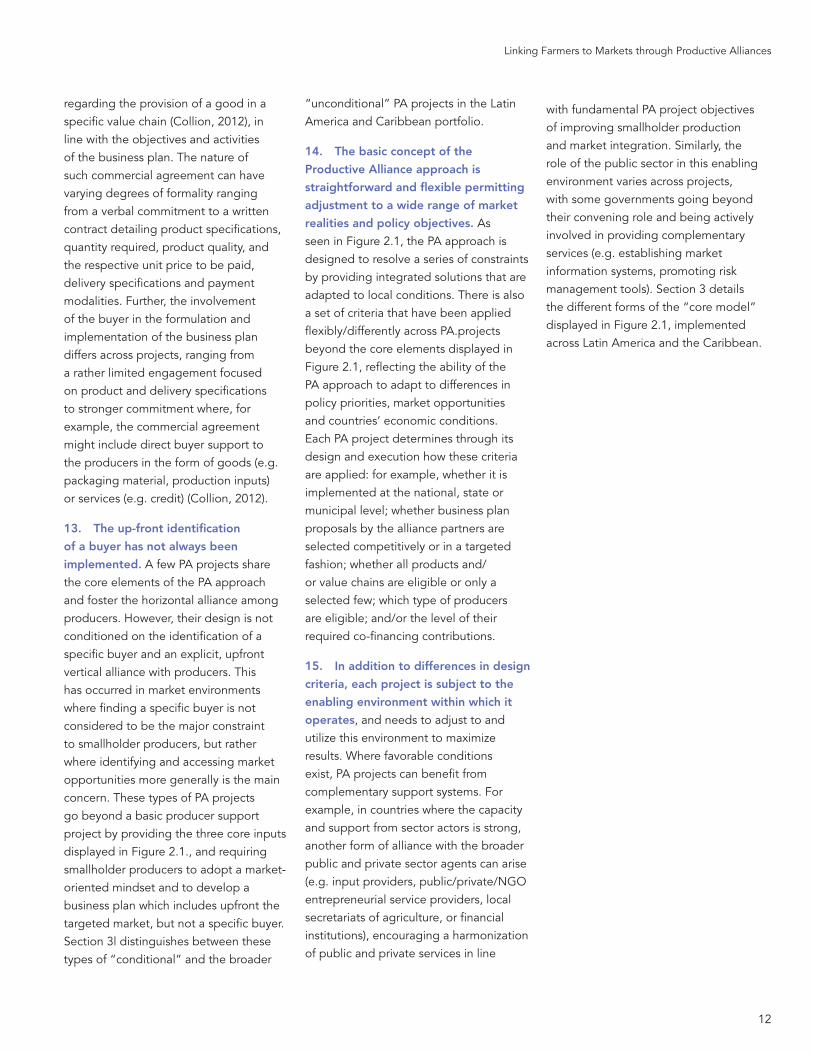
regarding the provision of a good in a specific value chain (Collion, 2012), in line with the objectives and activities of the business plan. The nature of such commercial agreement can have varying degrees of formality ranging from a verbal commitment to a written contract detailing product specifications, quantity required, product quality, and the respective unit price to be paid, delivery specifications and payment modalities. Further, the involvement of the buyer in the formulation and implementation of the business plan differs across projects, ranging from a rather limited engagement focused on product and delivery specifications to stronger commitment where, for example, the commercial agreement might include direct buyer support to the producers in the form of goods (e.g. packaging material, production inputs) or services (e.g. credit) (Collion, 2012).
13. The up-front identification
of a buyer has not always been
implemented. A few PA projects share the core elements of the PA approach and foster the horizontal alliance among producers. However, their design is not conditioned on the identification of a specific buyer and an explicit, upfront vertical alliance with producers. This has occurred in market environments where finding a specific buyer is not considered to be the major constraint to smallholder producers, but rather where identifying and accessing market opportunities more generally is the main concern. These types of PA projects go beyond a basic producer support project by providing the three core inputs displayed in Figure 2.1., and requiring smallholder producers to adopt a market-oriented mindset and to develop a business plan which includes upfront the targeted market, but not a specific buyer. Section 3l distinguishes between these types of “conditional” and the broader
“unconditional” PA projects in the Latin America and Caribbean portfolio.
14. The basic concept of the
Productive Alliance approach is
straightforward and flexible permitting
adjustment to a wide range of market
realities and policy objectives. As seen in Figure 2.1, the PA approach is designed to resolve a series of constraints by providing integrated solutions that are adapted to local conditions. There is also a set of criteria that have been applied flexibly/differently across PA.projects beyond the core elements displayed in Figure 2.1, reflecting the ability of the PA approach to adapt to differences in policy priorities, market opportunities and countries’ economic conditions. Each PA project determines through its design and execution how these criteria are applied: for example, whether it is implemented at the national, state or municipal level; whether business plan proposals by the alliance partners are selected competitively or in a targeted fashion; whether all products and/or value chains are eligible or only a selected few; which type of producers are eligible; and/or the level of their required co-financing contributions.
15. In addition to differences in design
criteria, each project is subject to the
enabling environment within which it
operates, and needs to adjust to and utilize this environment to maximize results. Where favorable conditions exist, PA projects can benefit from complementary support systems. For example, in countries where the capacity and support from sector actors is strong, another form of alliance with the broader public and private sector agents can arise (e.g. input providers, public/private/NGO entrepreneurial service providers, local secretariats of agriculture, or financial institutions), encouraging a harmonization of public and private services in line
with fundamental PA project objectives of improving smallholder production and market integration. Similarly, the role of the public sector in this enabling environment varies across projects, with some governments going beyond their convening role and being actively involved in providing complementary services (e.g. establishing market information systems, promoting risk management tools). Section 3 details the different forms of the “core model” displayed in Figure 2.1, implemented across Latin America and the Caribbean.
13
3
< 2. The Productive Alliance Approach
3. Productive Alliances in Latin America and the Caribbean
> 4. Targeting Strategies: Geographic, Value Chains, Beneficiaries
14
Linking Farmers to Markets through Productive Alliances
16. In Latin America and the
Caribbean agriculture remains an
important sector for the rural poor, with its contribution to GDP ranging from a high of 22% (Nicaragua) to a low of 3.5% (Mexico) (WDI, 2012). Smallholder agriculture predominates, with about 72% of the regional rural population involved in small-scale farming, compared to just 3% engaged in large-scale commercial production.2 The remaining 25% consists of landless laborers employed primarily in agriculture (Collion, 2012).
17. Since the early 2000s, the
World Bank has been implementing
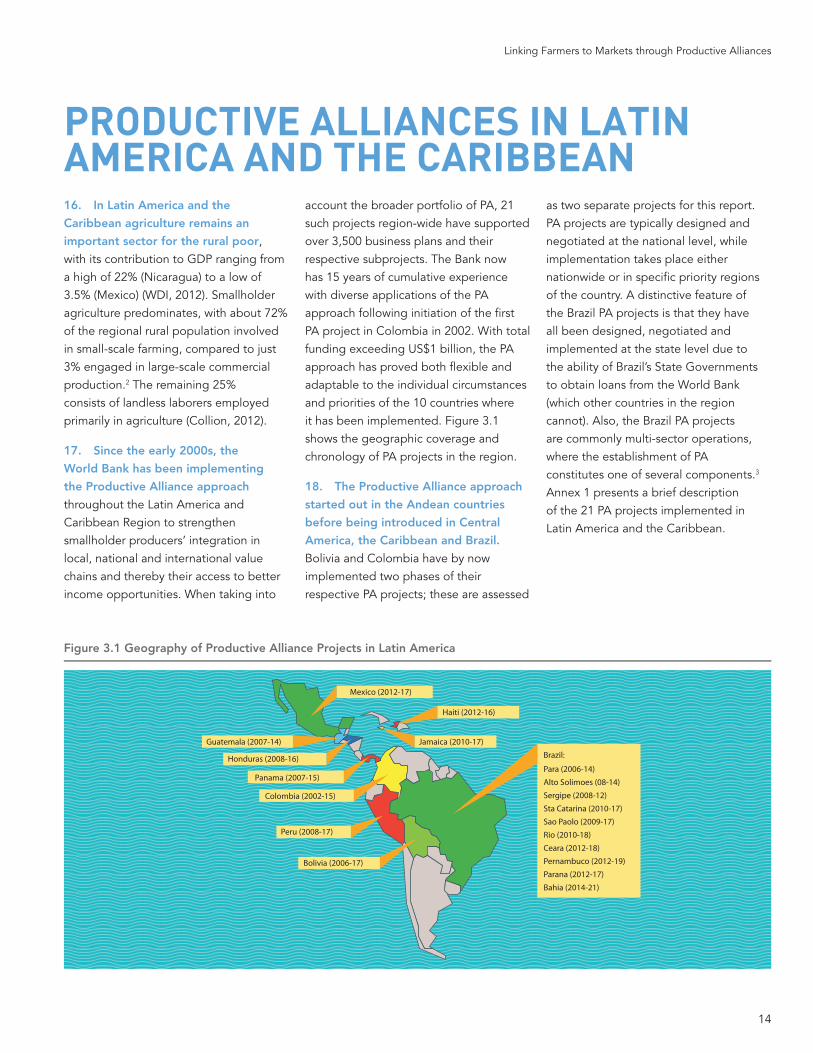
the Productive Alliance approach throughout the Latin America and Caribbean Region to strengthen smallholder producers’ integration in local, national and international value chains and thereby their access to better income opportunities. When taking into
account the broader portfolio of PA, 21 such projects region-wide have supported over 3,500 business plans and their respective subprojects. The Bank now has 15 years of cumulative experience with diverse applications of the PA approach following initiation of the first PA project in Colombia in 2002. With total funding exceeding US$1 billion, the PA approach has proved both flexible and adaptable to the individual circumstances and priorities of the 10 countries where it has been implemented. Figure 3.1 shows the geographic coverage and chronology of PA projects in the region.
18. The Productive Alliance approach
started out in the Andean countries
before being introduced in Central
America, the Caribbean and Brazil. Bolivia and Colombia have by now implemented two phases of their respective PA projects; these are assessed
as two separate projects for this report. PA projects are typically designed and negotiated at the national level, while implementation takes place either nationwide or in specific priority regions of the country. A distinctive feature of the Brazil PA projects is that they have all been designed, negotiated and implemented at the state level due to the ability of Brazil’s State Governments to obtain loans from the World Bank (which other countries in the region cannot). Also, the Brazil PA projects are commonly multi-sector operations, where the establishment of PA constitutes one of several components.3 Annex 1 presents a brief description of the 21 PA projects implemented in Latin America and the Caribbean.
PRODUCTIVE ALLIANCES IN LATIN AMERICA AND THE CARIBBEAN
Figure 3.1 Geography of Productive Alliance Projects in Latin America
Mexico (2012-17)
Haiti (2012-16)
Honduras (2008-16)
Panama (2007-15)
Colombia (2002-15)
Peru (2008-17)
Bolivia (2006-17)
Para (2006-14)
Brazil:
Alto Solimoes (08-14)
Sergipe (2008-12)
Sta Catarina (2010-17)
Sao Paolo (2009-17)
Rio (2010-18)
Ceara (2012-18)
Pernambuco (2012-19)
Parana (2012-17)
Bahia (2014-21)
Jamaica (2010-17)Guatemala (2007-14)
15
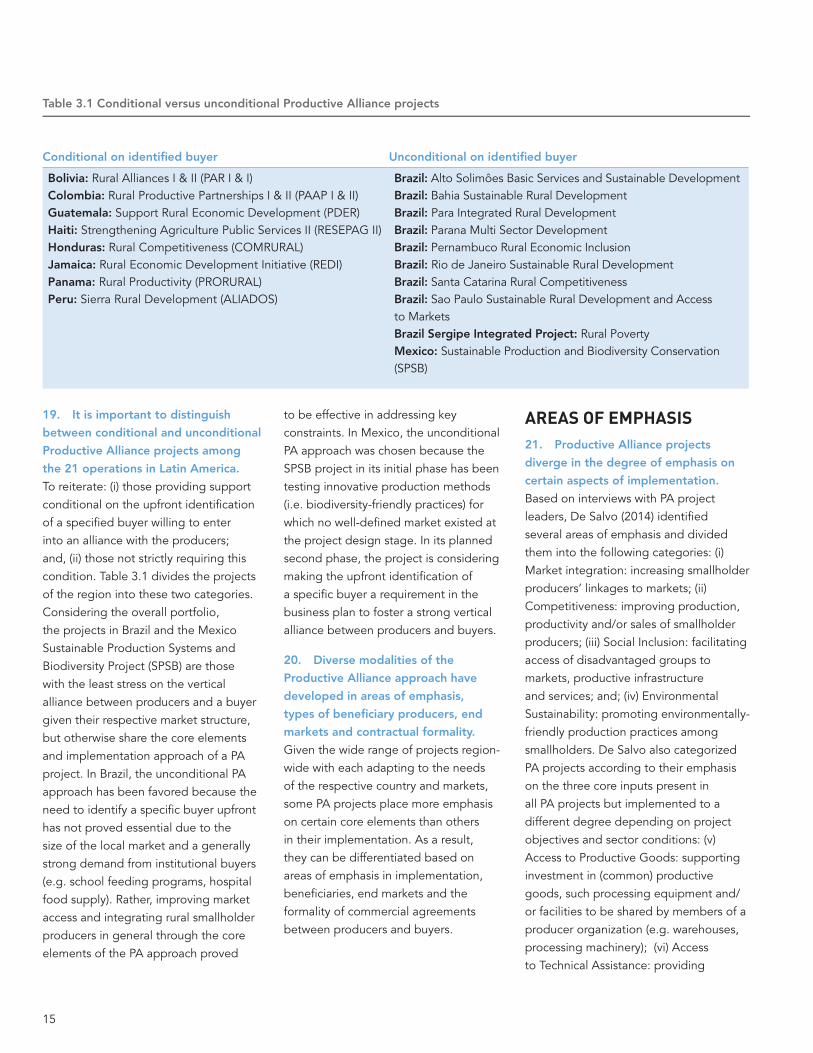
19. It is important to distinguish
between conditional and unconditional
Productive Alliance projects among
the 21 operations in Latin America. To reiterate: (i) those providing support conditional on the upfront identification of a specified buyer willing to enter into an alliance with the producers; and, (ii) those not strictly requiring this condition. Table 3.1 divides the projects of the region into these two categories. Considering the overall portfolio, the projects in Brazil and the Mexico Sustainable Production Systems and Biodiversity Project (SPSB) are those with the least stress on the vertical alliance between producers and a buyer given their respective market structure, but otherwise share the core elements and implementation approach of a PA project. In Brazil, the unconditional PA approach has been favored because the need to identify a specific buyer upfront has not proved essential due to the size of the local market and a generally strong demand from institutional buyers (e.g. school feeding programs, hospital food supply). Rather, improving market access and integrating rural smallholder producers in general through the core elements of the PA approach proved
Conditional on identified buyer Unconditional on identified buyer
Bolivia: Rural Alliances I & II (PAR I & I)Colombia: Rural Productive Partnerships I & II (PAAP I & II)Guatemala: Support Rural Economic Development (PDER)Haiti: Strengthening Agriculture Public Services II (RESEPAG II)Honduras: Rural Competitiveness (COMRURAL)Jamaica: Rural Economic Development Initiative (REDI)Panama: Rural Productivity (PRORURAL)Peru: Sierra Rural Development (ALIADOS)
Brazil: Alto Solimôes Basic Services and Sustainable DevelopmentBrazil: Bahia Sustainable Rural DevelopmentBrazil: Para Integrated Rural DevelopmentBrazil: Parana Multi Sector DevelopmentBrazil: Pernambuco Rural Economic InclusionBrazil: Rio de Janeiro Sustainable Rural DevelopmentBrazil: Santa Catarina Rural CompetitivenessBrazil: Sao Paulo Sustainable Rural Development and Access to MarketsBrazil Sergipe Integrated Project: Rural PovertyMexico: Sustainable Production and Biodiversity Conservation (SPSB)
Table 3.1 Conditional versus unconditional Productive Alliance projects
to be effective in addressing key constraints. In Mexico, the unconditional PA approach was chosen because the SPSB project in its initial phase has been testing innovative production methods (i.e. biodiversity-friendly practices) for which no well-defined market existed at the project design stage. In its planned second phase, the project is considering making the upfront identification of a specific buyer a requirement in the business plan to foster a strong vertical alliance between producers and buyers.
20. Diverse modalities of the
Productive Alliance approach have
developed in areas of emphasis,
types of beneficiary producers, end
markets and contractual formality.
Given the wide range of projects region-wide with each adapting to the needs of the respective country and markets, some PA projects place more emphasis on certain core elements than others in their implementation. As a result, they can be differentiated based on areas of emphasis in implementation, beneficiaries, end markets and the formality of commercial agreements between producers and buyers.
AREAS OF EMPHASIS 21. Productive Alliance projects
diverge in the degree of emphasis on
certain aspects of implementation. Based on interviews with PA project leaders, De Salvo (2014) identified several areas of emphasis and divided them into the following categories: (i) Market integration: increasing smallholder producers’ linkages to markets; (ii) Competitiveness: improving production, productivity and/or sales of smallholder producers; (iii) Social Inclusion: facilitating access of disadvantaged groups to markets, productive infrastructure and services; and; (iv) Environmental Sustainability: promoting environmentally-friendly production practices among smallholders. De Salvo also categorized PA projects according to their emphasis on the three core inputs present in all PA projects but implemented to a different degree depending on project objectives and sector conditions: (v) Access to Productive Goods: supporting investment in (common) productive goods, such processing equipment and/or facilities to be shared by members of a producer organization (e.g. warehouses, processing machinery); (vi) Access to Technical Assistance: providing
16
Linking Farmers to Markets through Productive Alliances
Country Project Name Mar
ket
In
teg
rati
on
Co
mp
etit
ive-
ness
Soci
al
Incl
usio
n
Env
iro
nmen
-ta
l Sus
tain
-ab
ility
Acc
ess
to
Pro
duc
tive
G
oo
ds
Acc
ess
to
Tech
nica
l A
ssis
tanc
e
Acc
ess
to
Bus
ines
s D
evel
op
men
t Tr
aini
ng
BoliviaRural Alliances I (PAR I) ** * *** * * ** ***
Rural Alliances II (PAR II) ** * *** ** ** ** ***
Brazil
Alto Solimôes Basic Services and Sustainable Development
** ** *** *** *** * **
Bahia *** *** ** * * ** ***
Para Integrated Rural Development ** ** *** ** *** ** **
Parana Multi Sector Development * * ** ** *** ** **
Pernambuco Rural Economic Inclusion ** *** ** ** *** * *
Rio de Janeiro Sustainable Rural Development
** ** ** *** ** ** **
Santa Catarina Rural Competitiveness * *** * ** *** ** *
Sao Paulo Sustainable Rural Development and Access to Markets
*** ** * ** ** ** **
Sergipe Integrated Project: Rural Poverty
** ** *** * *** * *
Colombia
Rural Productive Partnerships I (PAAP I) ** *** ** * * ** ***
Rural Productive Partnerships II (PAAP II)
*** *** ** * * ** **
GuatemalaSupport Rural Economic Development (PDER)
*** ** *** * ** ** *
HaitiStrengthening Agriculture Public Services (RESEPAG II)
*** * ** * ** *** ***
Honduras Rural Competitiveness (COMRURAL) *** *** ** * * ** ***
JamaicaRural Economic Development Initiative (REDI)
*** ** ** * ** * *
MexicoSustainable Production and Biodiversity Conservation (SPSB)
** * * *** *** ** *
Panama Panama Rural Productivity (PRORURAL) *** ** ** *** * ** *
Peru Sierra Rural Development (ALIADOS) ** *** ** * * * Note: A stronger emphasis by the larger number in stars/darker color shading, ranging from one to three stars/shadings. Source: Modified from De Salvo (2014)
Table 3.2 Areas of emphasis
smallholder producers with access to improved extension services and other technical assistance; and, (vii) Access to Business Development Training: supporting producer groups in organizing themselves to improve their position in market negotiations, reaching economies of scale in production, and enhancing their administrative management. The
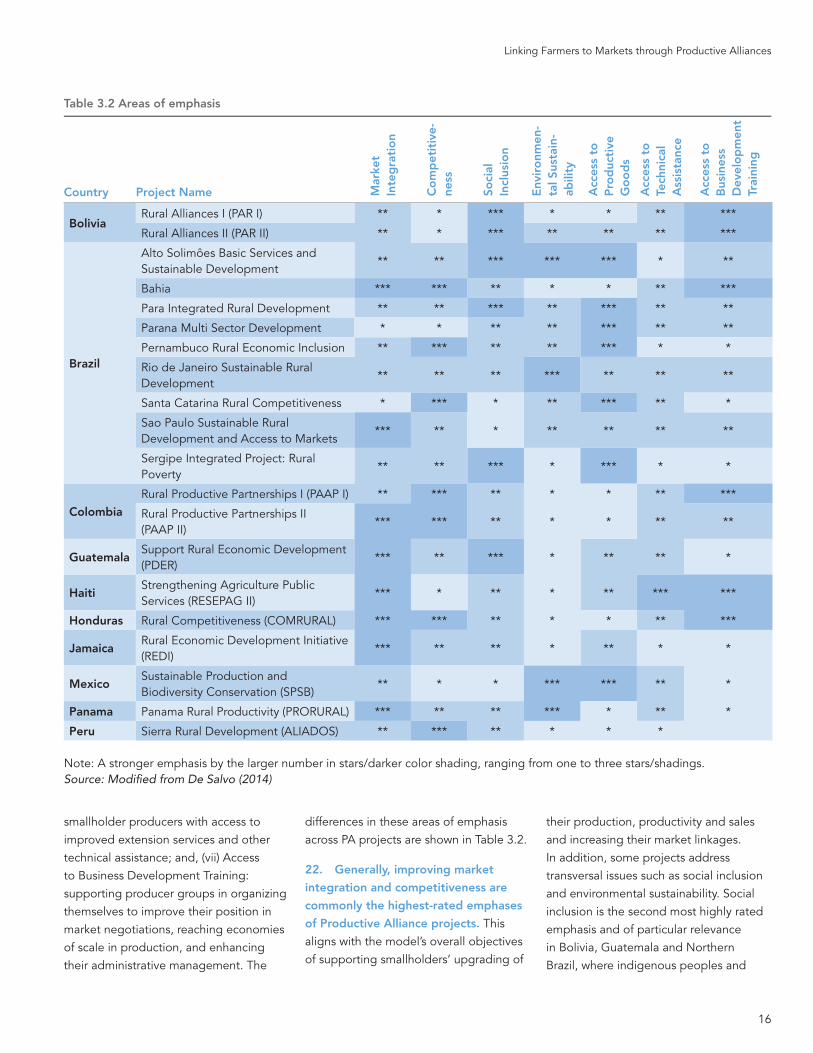
differences in these areas of emphasis across PA projects are shown in Table 3.2.
22. Generally, improving market
integration and competitiveness are
commonly the highest-rated emphases
of Productive Alliance projects. This aligns with the model’s overall objectives of supporting smallholders’ upgrading of
their production, productivity and sales and increasing their market linkages. In addition, some projects address transversal issues such as social inclusion and environmental sustainability. Social inclusion is the second most highly rated emphasis and of particular relevance in Bolivia, Guatemala and Northern Brazil, where indigenous peoples and
17
other disadvantaged groups represent a large share of the population and are generally among the poorest. Promoting environmentally sustainable farming practices has increasingly become the focus of several Productive Alliance projects in the Latin America region, such as in Mexico and Panama. The three remaining areas of emphasis on core inputs can be considered as means to achieve the above-mentioned goals and a prerequisite for achieving overall PA objectives. However, projects differ in the importance they assign to each core input. For example, Access to Productive Goods is considered of high importance in seven projects, yet with a strong bias
towards Brazil where PA projects have emerged from former Community-Driven Development (CDD) interventions that supported the provision of small-scale common goods requiring local coordination. Similarly, Access to Business Development Training to strengthen producer organizations is mentioned as a key emphasis in Bolivia, Brazil (State of Bahia), Colombia and Honduras, where agricultural markets are generally quite competitive. Finally, Access to Technical Assistance is not rated as a high-level focus in any of the PA projects, but the provision of improved technical assistance services is an important means of achieving the objectives of these projects.
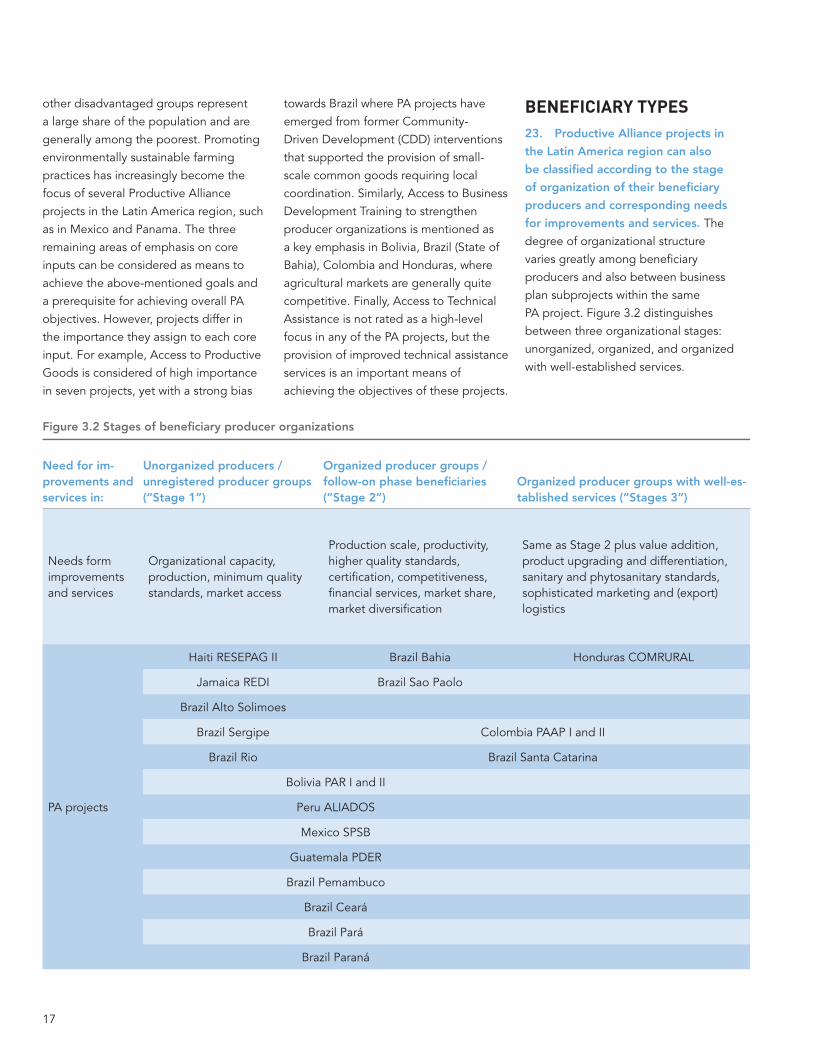
Figure 3.2 Stages of beneficiary producer organizations
Need for im-provements and services in:
Unorganized producers / unregistered producer groups (“Stage 1”)
Organized producer groups / follow-on phase beneficiaries (“Stage 2”)
Organized producer groups with well-es-tablished services (“Stages 3”)
Needs form improvements and services
Organizational capacity, production, minimum quality standards, market access
Production scale, productivity, higher quality standards, certification, competitiveness, financial services, market share, market diversification
Same as Stage 2 plus value addition, product upgrading and differentiation, sanitary and phytosanitary standards, sophisticated marketing and (export) logistics
PA projects
Haiti RESEPAG II Brazil Bahia Honduras COMRURAL
Jamaica REDI Brazil Sao Paolo
Brazil Alto Solimoes
Brazil Sergipe Colombia PAAP I and II
Brazil Rio Brazil Santa Catarina
Bolivia PAR I and II
Peru ALIADOS
Mexico SPSB
Guatemala PDER
Brazil Pemambuco
Brazil Ceará
Brazil Pará
Brazil Paraná
BENEFICIARY TYPES 23. Productive Alliance projects in
the Latin America region can also
be classified according to the stage
of organization of their beneficiary
producers and corresponding needs
for improvements and services. The degree of organizational structure varies greatly among beneficiary producers and also between business plan subprojects within the same PA project. Figure 3.2 distinguishes between three organizational stages: unorganized, organized, and organized with well-established services.
18
Linking Farmers to Markets through Productive Alliances
Up
gra
din
g
step
s
+ specifications for more advanced/quite specific process standards, yet implemented in the context of highly integrated supply chains and where the suppli-er has a relatively sophisti-cated management structure for quality control and risk management
+ 2nd and 3rd party confor-mity assessment
+ specifications for more advanced and often quite specific process standards with associated greater detail in record-keeping
+ 2nd and 3rd party conformity assess-ment
+ specifications for selected basic standards, basic GAP, good hygiene, and approaches to safe pesticide use/storage and record-keeping systems
+ 2nd and 3rd party conformity assessment
+ internal quality characteristics of products
+ basic requirements on pesticide use
1st and 2nd party inspections / testing
+ quality grades and varietals preferences
+ consistent quality and quantities
+ visual inspectations
+ visual character-istics
+ visual inspecta-tions
Level 1 Level 2 Level 3 Level 4 Level 5 Level 6
Stringency of official and buyer’s requirements Level of sophistication of the conformity assessment systems
Developing Countries Industrialized Countries
Traditional retail markets & small stores
Small local super-markets
High-end supermar-kets Retail markets
Local stores Discount supermarkets
High-end supermar-kets
Source: Jaffee et al. (2011)
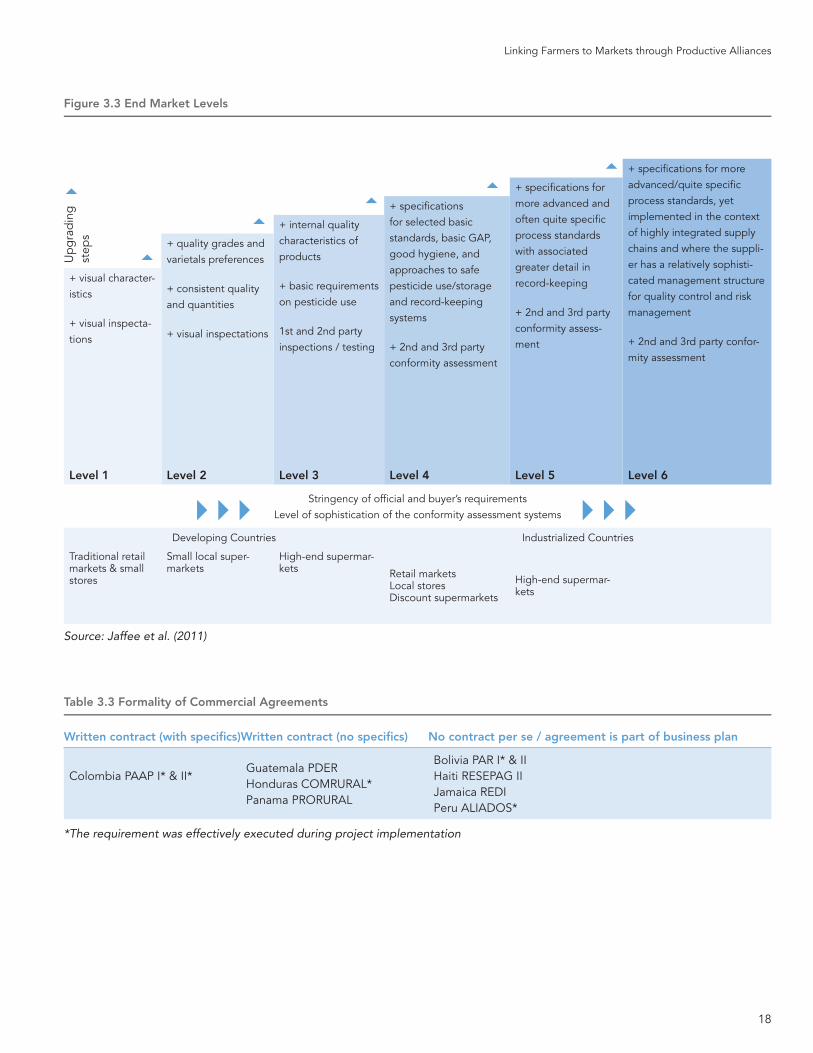
Figure 3.3 End Market Levels
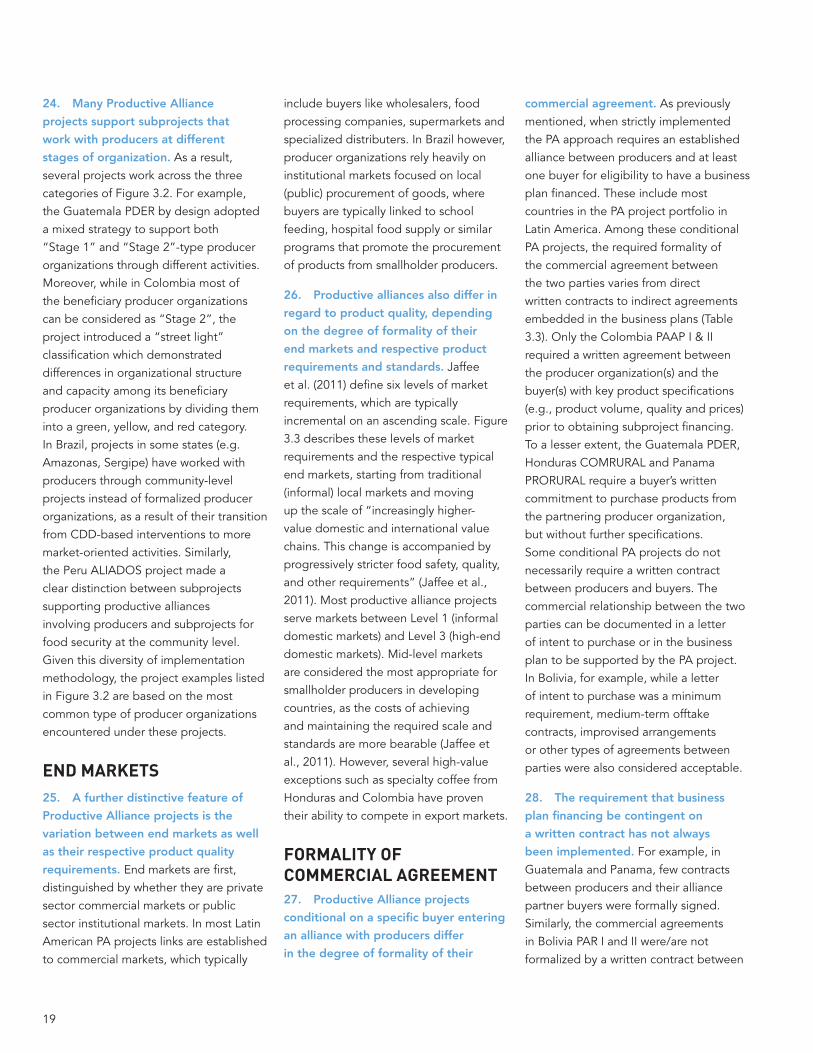
Written contract (with specifics)Written contract (no specifics) No contract per se / agreement is part of business plan
Colombia PAAP I* & II*Guatemala PDER Honduras COMRURAL*Panama PRORURAL
Bolivia PAR I* & II Haiti RESEPAG IIJamaica REDIPeru ALIADOS*
*The requirement was effectively executed during project implementation
Table 3.3 Formality of Commercial Agreements
19
24. Many Productive Alliance
projects support subprojects that
work with producers at different
stages of organization. As a result, several projects work across the three categories of Figure 3.2. For example, the Guatemala PDER by design adopted a mixed strategy to support both “Stage 1” and “Stage 2”-type producer organizations through different activities. Moreover, while in Colombia most of the beneficiary producer organizations can be considered as “Stage 2”, the project introduced a “street light” classification which demonstrated differences in organizational structure and capacity among its beneficiary producer organizations by dividing them into a green, yellow, and red category. In Brazil, projects in some states (e.g. Amazonas, Sergipe) have worked with producers through community-level projects instead of formalized producer organizations, as a result of their transition from CDD-based interventions to more market-oriented activities. Similarly, the Peru ALIADOS project made a clear distinction between subprojects supporting productive alliances involving producers and subprojects for food security at the community level. Given this diversity of implementation methodology, the project examples listed in Figure 3.2 are based on the most common type of producer organizations encountered under these projects.
END MARKETS 25. A further distinctive feature of
Productive Alliance projects is the
variation between end markets as well
as their respective product quality
requirements. End markets are first, distinguished by whether they are private sector commercial markets or public sector institutional markets. In most Latin American PA projects links are established to commercial markets, which typically
include buyers like wholesalers, food processing companies, supermarkets and specialized distributers. In Brazil however, producer organizations rely heavily on institutional markets focused on local (public) procurement of goods, where buyers are typically linked to school feeding, hospital food supply or similar programs that promote the procurement of products from smallholder producers.
26. Productive alliances also differ in
regard to product quality, depending
on the degree of formality of their
end markets and respective product
requirements and standards. Jaffee et al. (2011) define six levels of market requirements, which are typically incremental on an ascending scale. Figure 3.3 describes these levels of market requirements and the respective typical end markets, starting from traditional (informal) local markets and moving up the scale of “increasingly higher-value domestic and international value chains. This change is accompanied by progressively stricter food safety, quality, and other requirements” (Jaffee et al., 2011). Most productive alliance projects serve markets between Level 1 (informal domestic markets) and Level 3 (high-end domestic markets). Mid-level markets are considered the most appropriate for smallholder producers in developing countries, as the costs of achieving and maintaining the required scale and standards are more bearable (Jaffee et al., 2011). However, several high-value exceptions such as specialty coffee from Honduras and Colombia have proven their ability to compete in export markets.
FORMALITY OF COMMERCIAL AGREEMENT27. Productive Alliance projects
conditional on a specific buyer entering
an alliance with producers differ
in the degree of formality of their
commercial agreement. As previously mentioned, when strictly implemented the PA approach requires an established alliance between producers and at least one buyer for eligibility to have a business plan financed. These include most countries in the PA project portfolio in Latin America. Among these conditional PA projects, the required formality of the commercial agreement between the two parties varies from direct written contracts to indirect agreements embedded in the business plans (Table 3.3). Only the Colombia PAAP I & II required a written agreement between the producer organization(s) and the buyer(s) with key product specifications (e.g., product volume, quality and prices) prior to obtaining subproject financing. To a lesser extent, the Guatemala PDER, Honduras COMRURAL and Panama PRORURAL require a buyer’s written commitment to purchase products from the partnering producer organization, but without further specifications. Some conditional PA projects do not necessarily require a written contract between producers and buyers. The commercial relationship between the two parties can be documented in a letter of intent to purchase or in the business plan to be supported by the PA project. In Bolivia, for example, while a letter of intent to purchase was a minimum requirement, medium-term offtake contracts, improvised arrangements or other types of agreements between parties were also considered acceptable.
28. The requirement that business
plan financing be contingent on
a written contract has not always
been implemented. For example, in Guatemala and Panama, few contracts between producers and their alliance partner buyers were formally signed. Similarly, the commercial agreements in Bolivia PAR I and II were/are not formalized by a written contract between
20
Linking Farmers to Markets through Productive Alliances
2. Based on Collion (2012), smallholder agriculture includes households involved in livestock-raising, artisanal fishing and forestry.
3. The other project components in Brazil are typically related to sectors other than agriculture, such as the provision of water and sanitation or small-scale road infrastructure to beneficiaries. Projects in other countries (i.e. Guatemala, Jamaica, Peru and Mexico) also implement components complementary to the establishment of productive alliances, but usually with proportionally lower funding compared to the projects in Brazil.
the beneficiary POs and buyers – which is not in any case, a requirement - but for all subprojects the terms of the agreements were specified in the business plans supporting the subproject application.
29. The success of a vertical alliance
is not necessarily guaranteed by a pro
forma commercial agreement between
producers and buyers but rather by the
commitment of both alliance partners
to implement the business plan. While formulating the specifics of a vertical alliance between producers and buyers potential misunderstandings and conflicts should be avoided and it is highly important that all parties comply with the agreed (written or unwritten) terms of the business plan. Thus, PA projects conditioned on the identification of a specific buyer are more straightforward as they require the involvement of this buyer in the implementation of the business plan from the beginning. In other words, while a formal upfront agreement can foster and clarify the specifications of a vertical alliance between producers and buyers, its success depends on the commitment of the alliance partners to act on this agreement during project implementation.
21
4
< 3. Productive Alliances in Latin America and the Caribbean
4. Targeting Strategies: Geographic, Value Chains, Beneficiaries
> 5. Subproject Preparation and Selection
22
Linking Farmers to Markets through Productive Alliances
30. The specific objectives and
expected outcomes of a Productive
Alliance project determine its targeting
strategies. Given the flexibility of the PA approach, governments can use it as an instrument to achieve diverse outcomes related to the overall objectives of supporting smallholders in production upgrades and market integration. Such outcomes might include: (i) improved commercialization of smallholder agriculture in specific priority regions, or in another case, nationwide; (ii) targeting support to selected value chains, while in other cases considering all value chains as eligible; or, (iii) supporting certain groups within the rural population, or targeting the rural poor in general. Hence, once the objectives and expected outcomes of a PA project are clear, appropriate targeting strategies can be developed.
31. Productive Alliance projects
across Latin America have adopted
various targeting strategies:
geographic, agricultural value
chains and beneficiary-based. As a
result, specific eligibility criteria for subproject financing have evolved, as described and compared below.
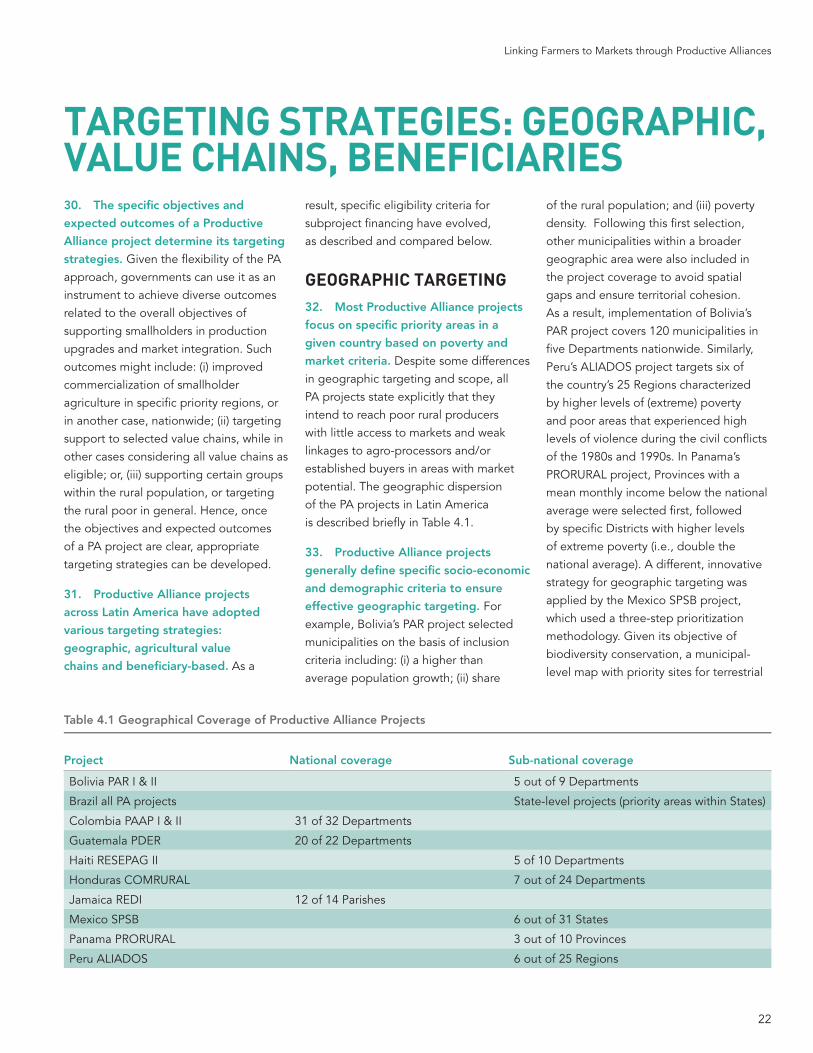
GEOGRAPHIC TARGETING32. Most Productive Alliance projects
focus on specific priority areas in a
given country based on poverty and
market criteria. Despite some differences in geographic targeting and scope, all PA projects state explicitly that they intend to reach poor rural producers with little access to markets and weak linkages to agro-processors and/or established buyers in areas with market potential. The geographic dispersion of the PA projects in Latin America is described briefly in Table 4.1.
33. Productive Alliance projects
generally define specific socio-economic
and demographic criteria to ensure
effective geographic targeting. For example, Bolivia’s PAR project selected municipalities on the basis of inclusion criteria including: (i) a higher than average population growth; (ii) share
of the rural population; and (iii) poverty density. Following this first selection, other municipalities within a broader geographic area were also included in the project coverage to avoid spatial gaps and ensure territorial cohesion. As a result, implementation of Bolivia’s PAR project covers 120 municipalities in five Departments nationwide. Similarly, Peru’s ALIADOS project targets six of the country’s 25 Regions characterized by higher levels of (extreme) poverty and poor areas that experienced high levels of violence during the civil conflicts of the 1980s and 1990s. In Panama’s PRORURAL project, Provinces with a mean monthly income below the national average were selected first, followed by specific Districts with higher levels of extreme poverty (i.e., double the national average). A different, innovative strategy for geographic targeting was applied by the Mexico SPSB project, which used a three-step prioritization methodology. Given its objective of biodiversity conservation, a municipal-level map with priority sites for terrestrial
TARGETING STRATEGIES: GEOGRAPHIC, VALUE CHAINS, BENEFICIARIES
Project National coverage Sub-national coverage
Bolivia PAR I & II 5 out of 9 Departments
Brazil all PA projects State-level projects (priority areas within States)
Colombia PAAP I & II 31 of 32 Departments
Guatemala PDER 20 of 22 Departments
Haiti RESEPAG II 5 of 10 Departments
Honduras COMRURAL 7 out of 24 Departments
Jamaica REDI 12 of 14 Parishes
Mexico SPSB 6 out of 31 States
Panama PRORURAL 3 out of 10 Provinces
Peru ALIADOS 6 out of 25 Regions
Table 4.1 Geographical Coverage of Productive Alliance Projects
23
biodiversity conservation was established first, then overlaid by a map of priority municipalities based on indices of poverty and marginalization. Areas of overlap – or “hot spots” – were identified as having significant potential for mainstreaming biodiversity while improving wellbeing, including improving/increasing producers’ organizational level, production area and value of production. This process resulted in the selection of six priority target states.
34. The geographic focus of a
Productive Alliance project can
change over time due to a country’s
shifting needs or, interventions which
scale-up the operation. Guatemala’s PDER project was designed initially to focus on eight Departments, based on indicators of indigenous population, level of poverty, agricultural potential and productive infrastructure. During project implementation, external factors (a severe storm) called for the project’s expansion to 20 Departments and re-focusing some activities on infrastructure investments. In the case of Colombia, PAAP I was initially focused on 27 out of the countries’ 32 Departments before expanding to national coverage during the second project phase due to the positive outcomes of first-stage interventions and an increased national budget.
35. In many cases, the geographic
targeting of Productive Alliance
projects is a well-justified, as it ensures
the effective provision of goods
and services to a specified target
population, taking into account a project’s objectives and countries’ specific poverty and market conditions. Based on the overall goals of poverty reduction and market integration, the geographic selectivity of PA projects based on socio-economic, vulnerability and environmental criteria makes sense. However, the level of effectiveness might be even higher if more emphasis were placed during the design phase on assessing the availability of existing infrastructure (e.g. warehouses, roads, ports) and accessibility to national and international markets.
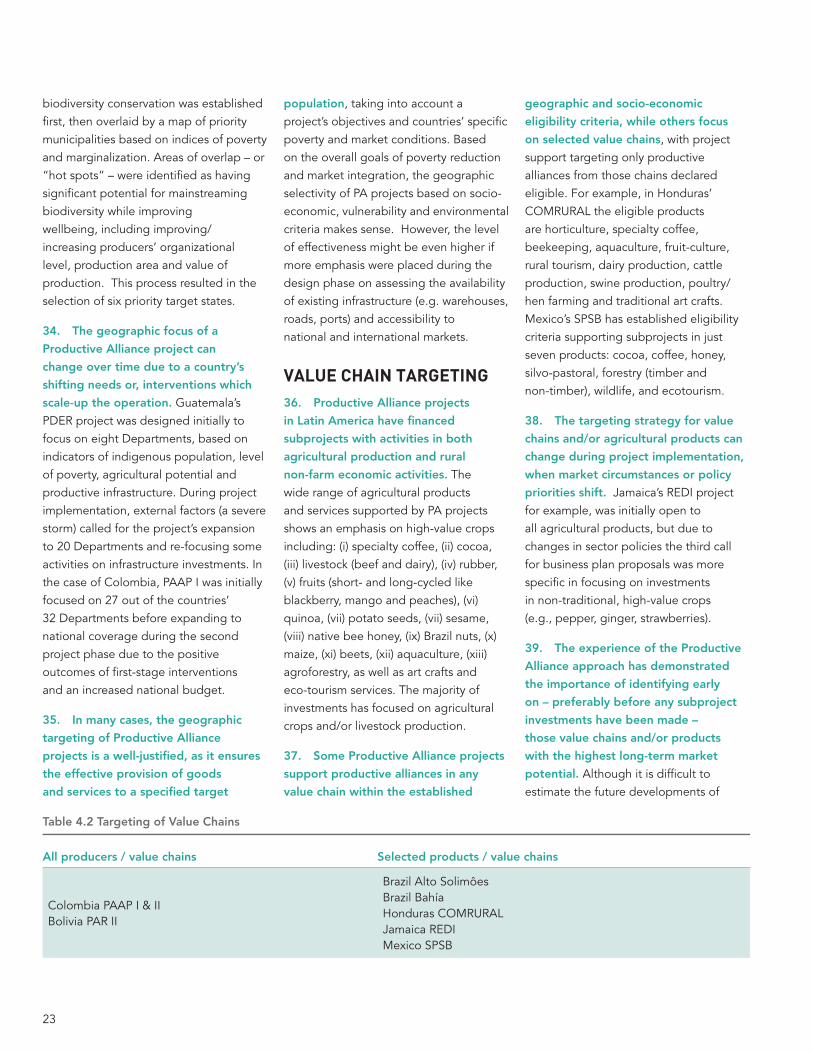
VALUE CHAIN TARGETING 36. Productive Alliance projects
in Latin America have financed
subprojects with activities in both
agricultural production and rural
non-farm economic activities. The wide range of agricultural products and services supported by PA projects shows an emphasis on high-value crops including: (i) specialty coffee, (ii) cocoa, (iii) livestock (beef and dairy), (iv) rubber, (v) fruits (short- and long-cycled like blackberry, mango and peaches), (vi) quinoa, (vii) potato seeds, (vii) sesame, (viii) native bee honey, (ix) Brazil nuts, (x) maize, (xi) beets, (xii) aquaculture, (xiii) agroforestry, as well as art crafts and eco-tourism services. The majority of investments has focused on agricultural crops and/or livestock production.
37. Some Productive Alliance projects
support productive alliances in any
value chain within the established
geographic and socio-economic
eligibility criteria, while others focus
on selected value chains, with project support targeting only productive alliances from those chains declared eligible. For example, in Honduras’ COMRURAL the eligible products are horticulture, specialty coffee, beekeeping, aquaculture, fruit-culture, rural tourism, dairy production, cattle production, swine production, poultry/hen farming and traditional art crafts. Mexico’s SPSB has established eligibility criteria supporting subprojects in just seven products: cocoa, coffee, honey, silvo-pastoral, forestry (timber and non-timber), wildlife, and ecotourism.
38. The targeting strategy for value
chains and/or agricultural products can
change during project implementation,
when market circumstances or policy
priorities shift. Jamaica’s REDI project for example, was initially open to all agricultural products, but due to changes in sector policies the third call for business plan proposals was more specific in focusing on investments in non-traditional, high-value crops (e.g., pepper, ginger, strawberries).
39. The experience of the Productive
Alliance approach has demonstrated
the importance of identifying early
on – preferably before any subproject
investments have been made –
those value chains and/or products
with the highest long-term market
potential. Although it is difficult to estimate the future developments of
All producers / value chains Selected products / value chains
Colombia PAAP I & IIBolivia PAR II
Brazil Alto SolimôesBrazil Bahía Honduras COMRURALJamaica REDIMexico SPSB
Table 4.2 Targeting of Value Chains
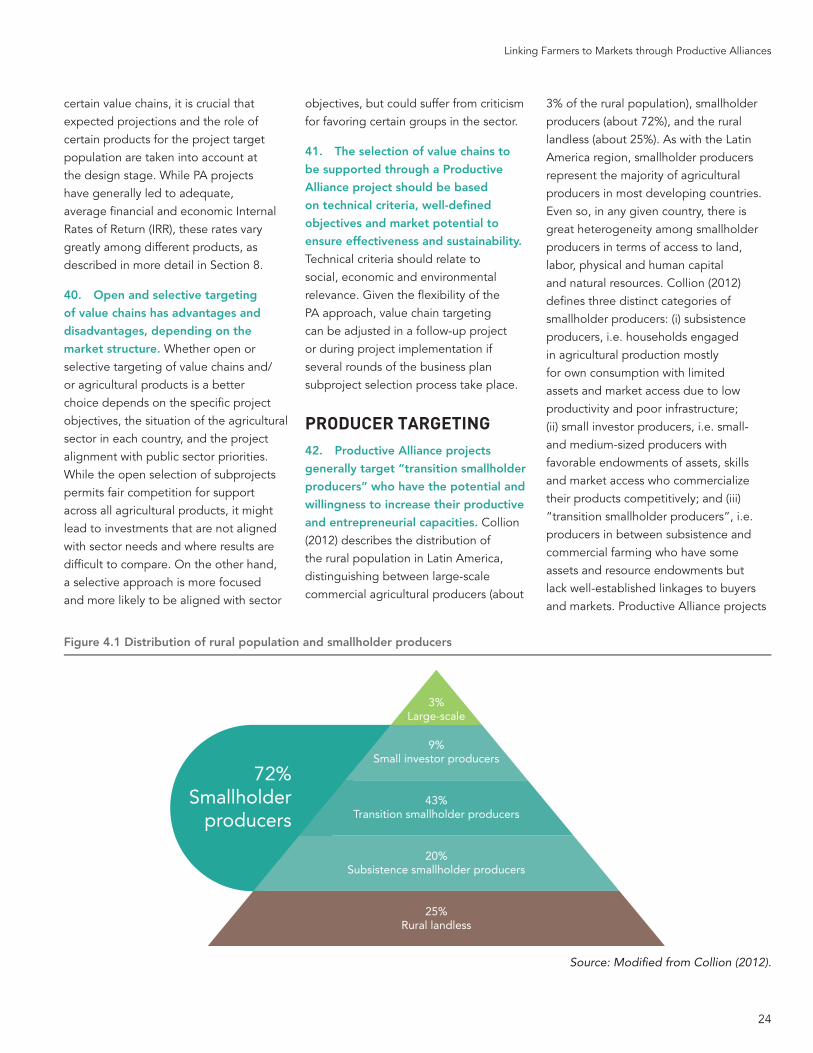
24
Linking Farmers to Markets through Productive Alliances
certain value chains, it is crucial that expected projections and the role of certain products for the project target population are taken into account at the design stage. While PA projects have generally led to adequate, average financial and economic Internal Rates of Return (IRR), these rates vary greatly among different products, as described in more detail in Section 8.
40. Open and selective targeting
of value chains has advantages and
disadvantages, depending on the
market structure. Whether open or selective targeting of value chains and/or agricultural products is a better choice depends on the specific project objectives, the situation of the agricultural sector in each country, and the project alignment with public sector priorities. While the open selection of subprojects permits fair competition for support across all agricultural products, it might lead to investments that are not aligned with sector needs and where results are difficult to compare. On the other hand, a selective approach is more focused and more likely to be aligned with sector
objectives, but could suffer from criticism for favoring certain groups in the sector.
41. The selection of value chains to
be supported through a Productive
Alliance project should be based
on technical criteria, well-defined
objectives and market potential to
ensure effectiveness and sustainability.
Technical criteria should relate to social, economic and environmental relevance. Given the flexibility of the PA approach, value chain targeting can be adjusted in a follow-up project or during project implementation if several rounds of the business plan subproject selection process take place.
PRODUCER TARGETING42. Productive Alliance projects
generally target “transition smallholder
producers” who have the potential and
willingness to increase their productive
and entrepreneurial capacities. Collion (2012) describes the distribution of the rural population in Latin America, distinguishing between large-scale commercial agricultural producers (about
3% of the rural population), smallholder producers (about 72%), and the rural landless (about 25%). As with the Latin America region, smallholder producers represent the majority of agricultural producers in most developing countries. Even so, in any given country, there is great heterogeneity among smallholder producers in terms of access to land, labor, physical and human capital and natural resources. Collion (2012) defines three distinct categories of smallholder producers: (i) subsistence producers, i.e. households engaged in agricultural production mostly for own consumption with limited assets and market access due to low productivity and poor infrastructure; (ii) small investor producers, i.e. small- and medium-sized producers with favorable endowments of assets, skills and market access who commercialize their products competitively; and (iii) “transition smallholder producers”, i.e. producers in between subsistence and commercial farming who have some assets and resource endowments but lack well-established linkages to buyers and markets. Productive Alliance projects
Source: Modified from Collion (2012).
72%Smallholder
producers
3%Large-scale
9%Small investor producers
43%Transition smallholder producers
20%Subsistence smallholder producers
25%Rural landless
Figure 4.1 Distribution of rural population and smallholder producers
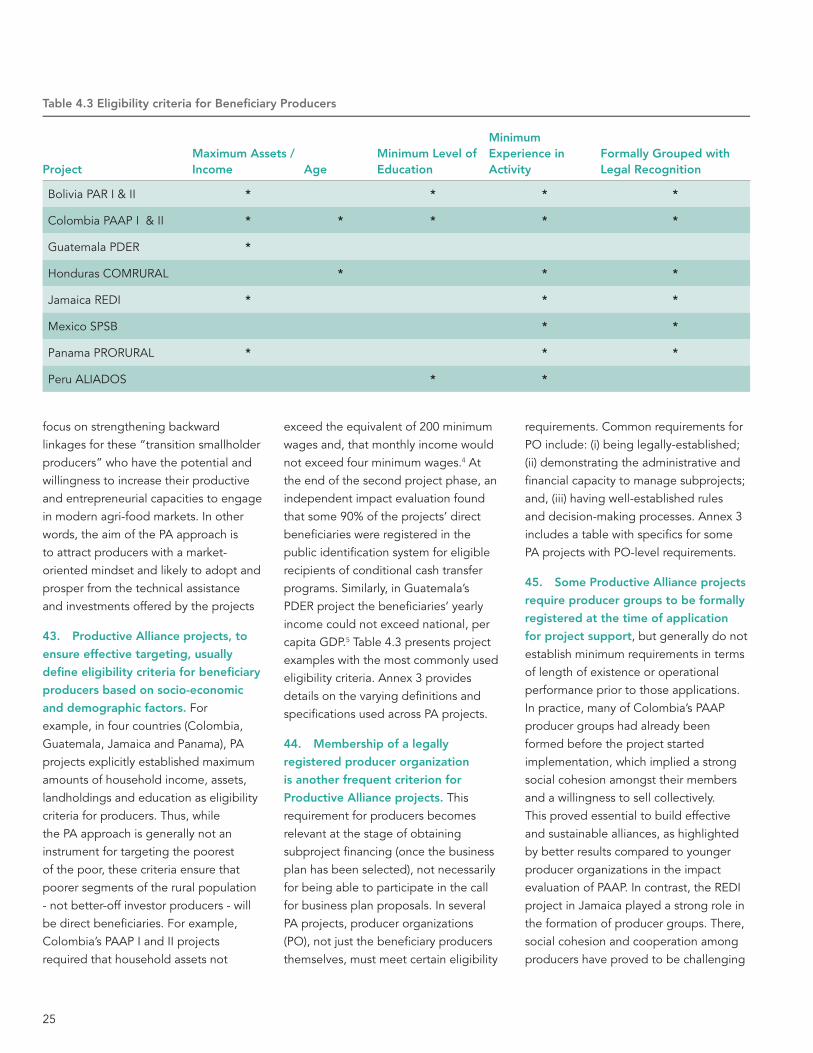
25
focus on strengthening backward linkages for these “transition smallholder producers” who have the potential and willingness to increase their productive and entrepreneurial capacities to engage in modern agri-food markets. In other words, the aim of the PA approach is to attract producers with a market-oriented mindset and likely to adopt and prosper from the technical assistance and investments offered by the projects
43. Productive Alliance projects, to
ensure effective targeting, usually
define eligibility criteria for beneficiary
producers based on socio-economic
and demographic factors. For example, in four countries (Colombia, Guatemala, Jamaica and Panama), PA projects explicitly established maximum amounts of household income, assets, landholdings and education as eligibility criteria for producers. Thus, while the PA approach is generally not an instrument for targeting the poorest of the poor, these criteria ensure that poorer segments of the rural population - not better-off investor producers - will be direct beneficiaries. For example, Colombia’s PAAP I and II projects required that household assets not
exceed the equivalent of 200 minimum wages and, that monthly income would not exceed four minimum wages.4 At the end of the second project phase, an independent impact evaluation found that some 90% of the projects’ direct beneficiaries were registered in the public identification system for eligible recipients of conditional cash transfer programs. Similarly, in Guatemala’s PDER project the beneficiaries’ yearly income could not exceed national, per capita GDP.5 Table 4.3 presents project examples with the most commonly used eligibility criteria. Annex 3 provides details on the varying definitions and specifications used across PA projects.
44. Membership of a legally
registered producer organization
is another frequent criterion for
Productive Alliance projects. This requirement for producers becomes relevant at the stage of obtaining subproject financing (once the business plan has been selected), not necessarily for being able to participate in the call for business plan proposals. In several PA projects, producer organizations (PO), not just the beneficiary producers themselves, must meet certain eligibility
requirements. Common requirements for PO include: (i) being legally-established; (ii) demonstrating the administrative and financial capacity to manage subprojects; and, (iii) having well-established rules and decision-making processes. Annex 3 includes a table with specifics for some PA projects with PO-level requirements.
45. Some Productive Alliance projects
require producer groups to be formally
registered at the time of application
for project support, but generally do not establish minimum requirements in terms of length of existence or operational performance prior to those applications. In practice, many of Colombia’s PAAP producer groups had already been formed before the project started implementation, which implied a strong social cohesion amongst their members and a willingness to sell collectively. This proved essential to build effective and sustainable alliances, as highlighted by better results compared to younger producer organizations in the impact evaluation of PAAP. In contrast, the REDI project in Jamaica played a strong role in the formation of producer groups. There, social cohesion and cooperation among producers have proved to be challenging
ProjectMaximum Assets / Income Age
Minimum Level of Education
Minimum Experience in Activity
Formally Grouped with Legal Recognition
Bolivia PAR I & II * * * *
Colombia PAAP I & II * * * * *
Guatemala PDER *
Honduras COMRURAL * * *
Jamaica REDI * * *
Mexico SPSB * *
Panama PRORURAL * * *
Peru ALIADOS * *
Table 4.3 Eligibility criteria for Beneficiary Producers
26
Linking Farmers to Markets through Productive Alliances
during project implementation. Similarly, in Mexico the SPSB project provided specific support enabling producer groups to be legally registered.
46. Other Productive Alliance projects
help producer groups selected for
subproject financing to identify and
adopt the most appropriate legal
structure by financing legal advice and the costs associated with formalization. The types of legal associations for producers and the respective pre-requisites vary greatly between countries. As a result, because each form of legal status involves the group in complying with specific organizational requirements, it is important that producers become familiar with these requirements before settling on a single option. For example, in Guatemala’s PDER project, beneficiary producers typically formalized as civil society organizations, which turned out to be the least expensive and most expedient form of organization for registration.
47. Another common requirement
established by Productive Alliance
projects is a minimum number of
member producers, which, in the design of the Latin American PA projects varied between 10 and 30 members. In practice, none of these PA projects imposed a maximum limit on members, which permitted the formation of larger producer groups able to benefit from project support and scale. As a result, the average number of members per PO in the Bolivia PAR I was 50, in the Colombia PAAP I 58 and in the Guatemala PDER, 96 producers.
48. Brazil is a special case for the
targeting of beneficiary producers
under Productive Alliance projects, since these have emerged from former Community-Driven Development (CDD) projects (particularly in the Northeast region). Productive subprojects have been implemented with producer associations at the community level instead of with formalized producer organizations (e.g. Brazil Alto Solimôes,
Brazil Sergipe, Brazil Rio). Other projects in Brazil however, support productive subproject implementation through producer organizations of family farmers (e.g. Brazil Bahia, Brazil Ceará, Brazil Pernambuco, Brazil Santa Catarina, Brazil Sao Paolo), similar to the non-Brazilian PA projects. The Peru ALIADOS project also emerged from a history of CDD-projects, adopting two lines of subproject support: a productive line based on business plans aligned with the PA approach and another line for community-level territorial development.
49. Overall, a clear strategy for
targeting beneficiary producers is
crucial for defining the success of
a Productive Alliance project (and of any development project). To ensure credibility and a fair selection process, beneficiary targeting should be executed in a transparent manner and based on technical criteria (i.e. social, economic, environmental soundness) in alignment with sector objectives and market opportunities.
27
BUYER TARGETING50. Targeting financially and
commercially strong buyers and their
commitment to an alliance with the
producers, are critical, given that establishing alliances between producer organizations and buyer(s) is the key objective of PA projects (particularly the ones that make the vertical alliance a conditional requirement for financing). Most PA projects in Latin America seek to link smallholder producers to buyers in commercial markets. Typically, these buyers are private firms and/or individuals such as brokers, traders, exporters, wholesalers, supermarkets, specialized distributors, processors and restaurant chains. In contrast, the PA projects in Brazil generally do not share this orientation towards the private commercial market, although this result is not due to their design. Despite the option and even with encouragement to make the link to commercial markets, many subprojects in Brazil (especially in the Northeast region) provide support to beneficiary producers and communities enabling them to sell primarily to public sector institutional markets (e.g. school feeding programs, hospital food supply). This focus on institutional buyers has, in several cases, been encouraged by these public procurement programs paying above-market prices and/or providing tax benefits for smallholder producers.
51. Few Productive Alliance have
established eligibility criteria for
buyers. So far, PA projects have focused on establishing criteria to ensure the rigorous selection of viable producers. An equivalent effort for the selection of buyers has not yet occurred, which increases the risk of: (i) electing a buyer who is not sufficiently competitive to perform sustainably in the market; or, (ii) promoting elite capture in imperfect markets with few buyers which can
lead potentially to collusion and low prices for producers. Only in Bolivia, Colombia, Guatemala and Panama was the formal screening of buyers required, with the specific requirements being described in In Practice Box 1.6
52. Requiring buyers to co-invest
in supported business plans has not
been very successful. The PA projects in Colombia, Guatemala and Panama required buyers to co-invest in the alliance subproject in their designs. In practice, only in the case of Colombia was this requirement consistently applied during implementation, as private funds from buyers were part of the total partnership investment package. As a consequence, PA projects could more forcefully require criteria for active buyer involvement and monitor these during implementation to ensure greater financial commitment from buyers. However, enforcing such commitment from early on, especially in a new PA project, might be challenging. As the subproject grant financing primarily goes to the producers, buyers might not perceive the benefit of their involvement in a productive alliance, in addition to the general reluctance to enter into a business relationship with smallholder producers.
53. While criteria for economic
viability should be mandatory for
the selection of buyers in Productive
Alliance projects, requiring their active
(financial) contributions might be more
feasible during a second phase project
or in a longer-established alliance. Alternatively, PA projects could put much greater effort into explaining the benefits to buyers of a vertical alliance with smallholder producers. Specifically, although the subproject productive investments, technical assistance and business development activities of PA projects are directed primarily towards
4. Colombia’s minimum wage was US$328 a month in December 2011.
5. Annual GDP per capita (2013 US$ PPP): US$5,300 (2013 estimation), US$5,200 (2012 est.), US$5,200 (2011 estimation).
6. Throughout this report, “In Practice” boxes highlight practical recommendations, innovative activities or lessons learned based on examples drawn from PA projects that the World Bank has implemented in Latin America.
beneficiary producers, buyers also benefit through resulting improvements in product quantity and quality. Several PA projects have reported that the advantages for buyers include better prices and sales from improved product quality and more stable product delivery. These and other advantages have been confirmed through larger-scale surveys and stakeholder workshops in the Colombia PAAP-II project where more than 90% of buyers stated/agreed that their motivation to enter a PA with smallholder producer organizations was driven by business reasons. Such evidence should be disseminated more intensively and widely to promote the PA approach with potential buyers.
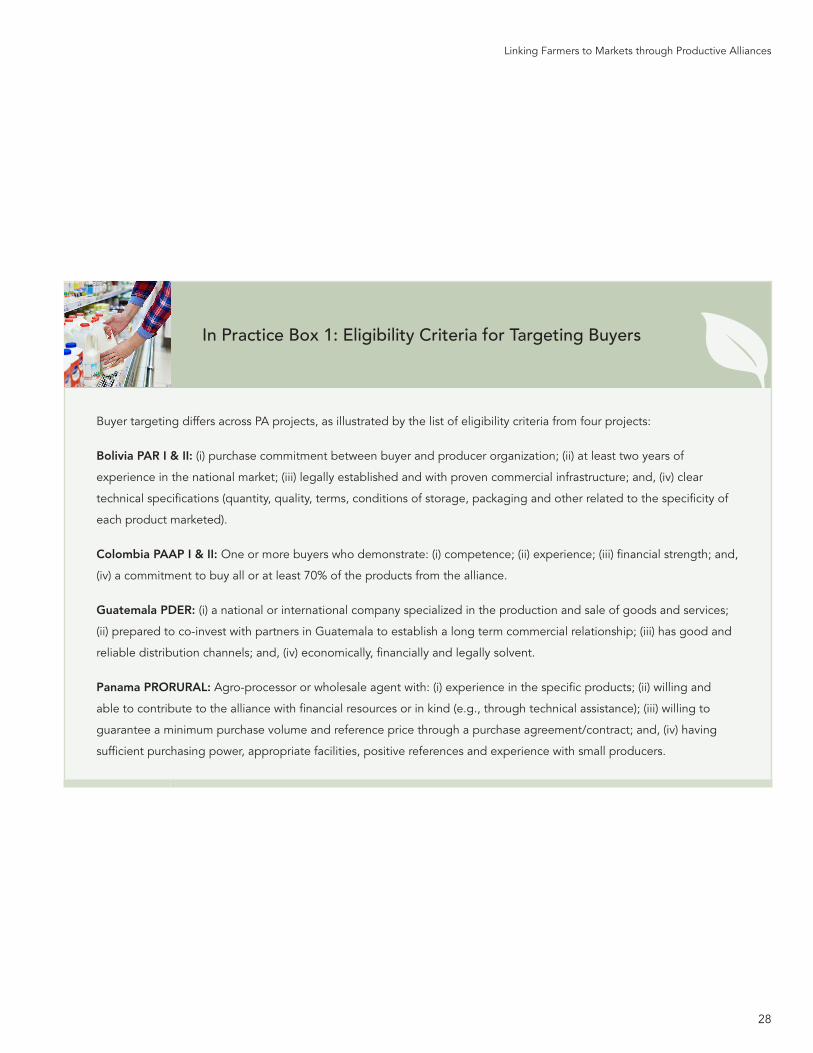
28
Linking Farmers to Markets through Productive Alliances
In Practice Box 1: Eligibility Criteria for Targeting Buyers
Buyer targeting differs across PA projects, as illustrated by the list of eligibility criteria from four projects:
Bolivia PAR I & II: (i) purchase commitment between buyer and producer organization; (ii) at least two years of
experience in the national market; (iii) legally established and with proven commercial infrastructure; and, (iv) clear
technical specifications (quantity, quality, terms, conditions of storage, packaging and other related to the specificity of
each product marketed).
Colombia PAAP I & II: One or more buyers who demonstrate: (i) competence; (ii) experience; (iii) financial strength; and,
(iv) a commitment to buy all or at least 70% of the products from the alliance.
Guatemala PDER: (i) a national or international company specialized in the production and sale of goods and services;
(ii) prepared to co-invest with partners in Guatemala to establish a long term commercial relationship; (iii) has good and
reliable distribution channels; and, (iv) economically, financially and legally solvent.
Panama PRORURAL: Agro-processor or wholesale agent with: (i) experience in the specific products; (ii) willing and
able to contribute to the alliance with financial resources or in kind (e.g., through technical assistance); (iii) willing to
guarantee a minimum purchase volume and reference price through a purchase agreement/contract; and, (iv) having
sufficient purchasing power, appropriate facilities, positive references and experience with small producers.
29
5
< 4. Targeting Strategies: Geographic, Value Chains, Beneficiaries
5. Subproject Preparation and Selection
> 6. Subproject Financing
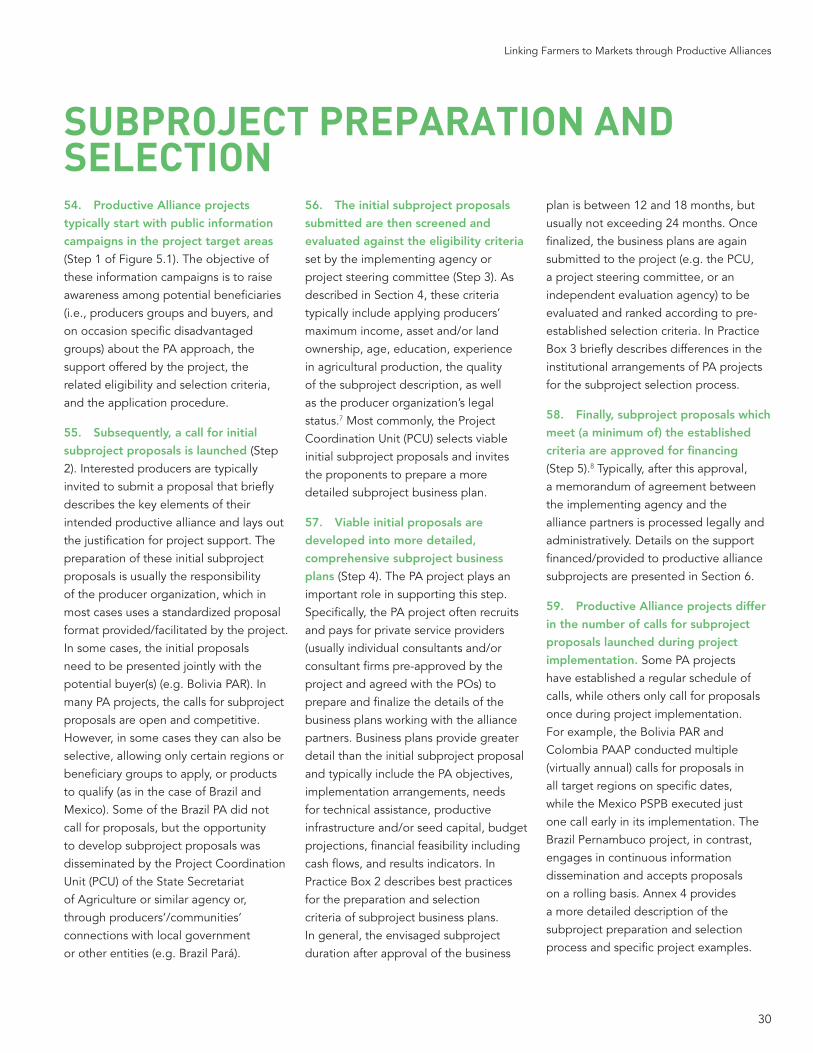
30
Linking Farmers to Markets through Productive Alliances
54. Productive Alliance projects
typically start with public information
campaigns in the project target areas
(Step 1 of Figure 5.1). The objective of these information campaigns is to raise awareness among potential beneficiaries (i.e., producers groups and buyers, and on occasion specific disadvantaged groups) about the PA approach, the support offered by the project, the related eligibility and selection criteria, and the application procedure.
55. Subsequently, a call for initial
subproject proposals is launched (Step 2). Interested producers are typically invited to submit a proposal that briefly describes the key elements of their intended productive alliance and lays out the justification for project support. The preparation of these initial subproject proposals is usually the responsibility of the producer organization, which in most cases uses a standardized proposal format provided/facilitated by the project. In some cases, the initial proposals need to be presented jointly with the potential buyer(s) (e.g. Bolivia PAR). In many PA projects, the calls for subproject proposals are open and competitive. However, in some cases they can also be selective, allowing only certain regions or beneficiary groups to apply, or products to qualify (as in the case of Brazil and Mexico). Some of the Brazil PA did not call for proposals, but the opportunity to develop subproject proposals was disseminated by the Project Coordination Unit (PCU) of the State Secretariat of Agriculture or similar agency or, through producers’/communities’ connections with local government or other entities (e.g. Brazil Pará).
56. The initial subproject proposals
submitted are then screened and
evaluated against the eligibility criteria set by the implementing agency or project steering committee (Step 3). As described in Section 4, these criteria typically include applying producers’ maximum income, asset and/or land ownership, age, education, experience in agricultural production, the quality of the subproject description, as well as the producer organization’s legal status.7 Most commonly, the Project Coordination Unit (PCU) selects viable initial subproject proposals and invites the proponents to prepare a more detailed subproject business plan.
57. Viable initial proposals are
developed into more detailed,
comprehensive subproject business
plans (Step 4). The PA project plays an important role in supporting this step. Specifically, the PA project often recruits and pays for private service providers (usually individual consultants and/or consultant firms pre-approved by the project and agreed with the POs) to prepare and finalize the details of the business plans working with the alliance partners. Business plans provide greater detail than the initial subproject proposal and typically include the PA objectives, implementation arrangements, needs for technical assistance, productive infrastructure and/or seed capital, budget projections, financial feasibility including cash flows, and results indicators. In Practice Box 2 describes best practices for the preparation and selection criteria of subproject business plans. In general, the envisaged subproject duration after approval of the business
plan is between 12 and 18 months, but usually not exceeding 24 months. Once finalized, the business plans are again submitted to the project (e.g. the PCU, a project steering committee, or an independent evaluation agency) to be evaluated and ranked according to pre-established selection criteria. In Practice Box 3 briefly describes differences in the institutional arrangements of PA projects for the subproject selection process.
58. Finally, subproject proposals which
meet (a minimum of) the established
criteria are approved for financing
(Step 5).8 Typically, after this approval, a memorandum of agreement between the implementing agency and the alliance partners is processed legally and administratively. Details on the support financed/provided to productive alliance subprojects are presented in Section 6.
59. Productive Alliance projects differ
in the number of calls for subproject
proposals launched during project
implementation. Some PA projects have established a regular schedule of calls, while others only call for proposals once during project implementation. For example, the Bolivia PAR and Colombia PAAP conducted multiple (virtually annual) calls for proposals in all target regions on specific dates, while the Mexico PSPB executed just one call early in its implementation. The Brazil Pernambuco project, in contrast, engages in continuous information dissemination and accepts proposals on a rolling basis. Annex 4 provides a more detailed description of the subproject preparation and selection process and specific project examples.
SUBPROJECT PREPARATION AND SELECTION
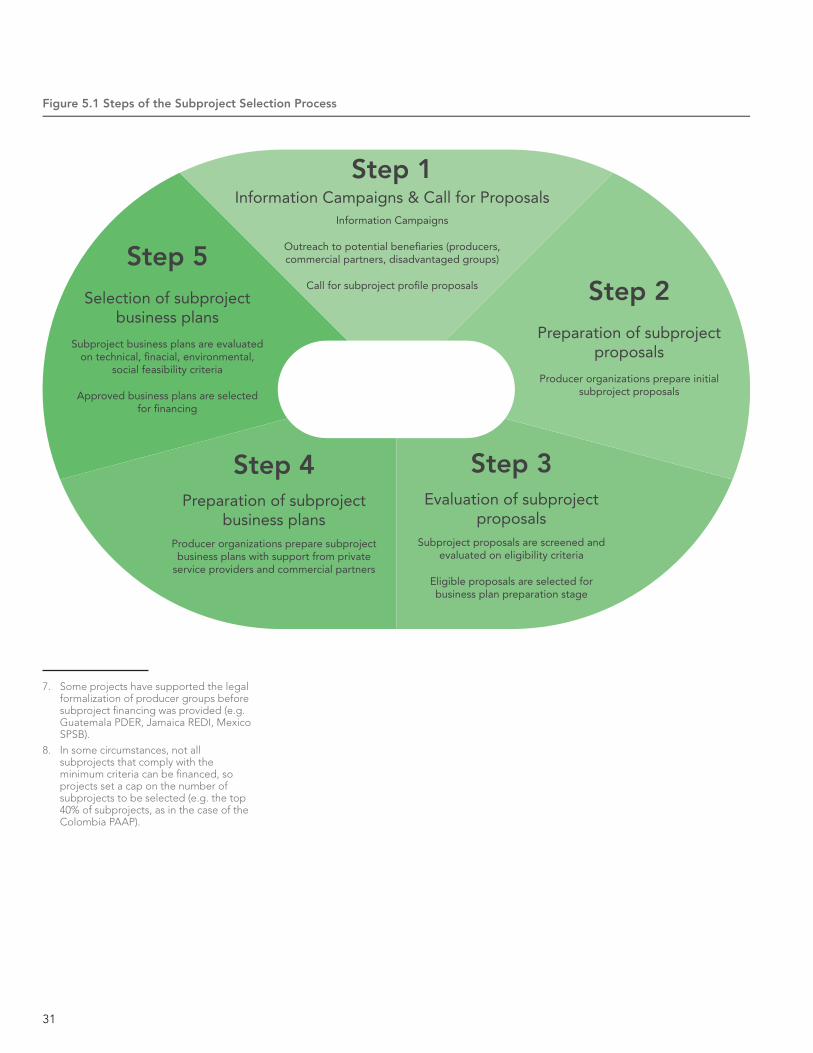
31
Figure 5.1 Steps of the Subproject Selection Process
Step 1Information Campaigns & Call for Proposals
Step 2Preparation of subproject
proposals
Step 4Preparation of subproject
business plans
Step 5Selection of subproject
business plans
Step 3Evaluation of subproject
proposals
Information Campaigns
Outreach to potential benefiaries (producers, commercial partners, disadvantaged groups)
Call for subproject profile proposals
Producer organizations prepare initial subproject proposals
Producer organizations prepare subproject business plans with support from private
service providers and commercial partners
Subproject business plans are evaluated on technical, finacial, environmental,
social feasibility criteria
Approved business plans are selected for financing
Subproject proposals are screened and evaluated on eligibility criteria
Eligible proposals are selected for business plan preparation stage
7. Some projects have supported the legal formalization of producer groups before subproject financing was provided (e.g. Guatemala PDER, Jamaica REDI, Mexico SPSB).
8. In some circumstances, not all subprojects that comply with the minimum criteria can be financed, so projects set a cap on the number of subprojects to be selected (e.g. the top 40% of subprojects, as in the case of the Colombia PAAP).
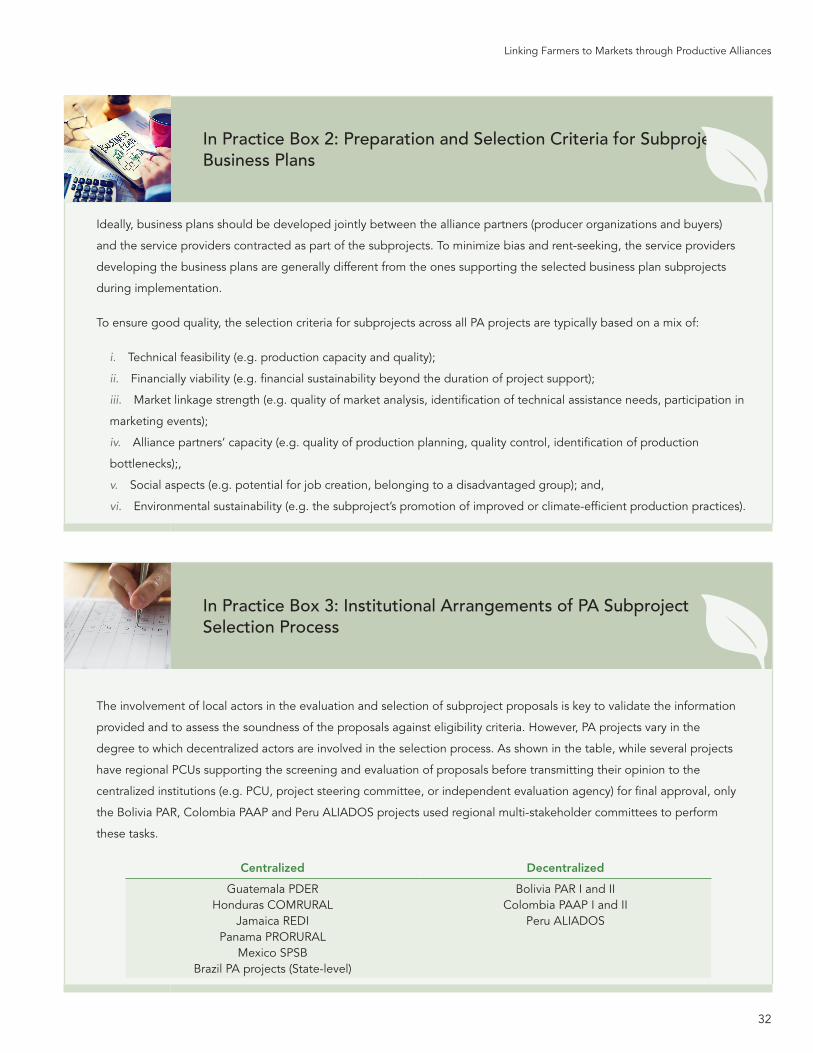
32
Linking Farmers to Markets through Productive Alliances
In Practice Box 2: Preparation and Selection Criteria for Subproject Business Plans
Ideally, business plans should be developed jointly between the alliance partners (producer organizations and buyers)
and the service providers contracted as part of the subprojects. To minimize bias and rent-seeking, the service providers
developing the business plans are generally different from the ones supporting the selected business plan subprojects
during implementation.
To ensure good quality, the selection criteria for subprojects across all PA projects are typically based on a mix of:
i. Technical feasibility (e.g. production capacity and quality);
ii. Financially viability (e.g. financial sustainability beyond the duration of project support);
iii. Market linkage strength (e.g. quality of market analysis, identification of technical assistance needs, participation in
marketing events);
iv. Alliance partners’ capacity (e.g. quality of production planning, quality control, identification of production
bottlenecks);,
v. Social aspects (e.g. potential for job creation, belonging to a disadvantaged group); and,
vi. Environmental sustainability (e.g. the subproject’s promotion of improved or climate-efficient production practices).
In Practice Box 3: Institutional Arrangements of PA Subproject Selection Process
The involvement of local actors in the evaluation and selection of subproject proposals is key to validate the information
provided and to assess the soundness of the proposals against eligibility criteria. However, PA projects vary in the
degree to which decentralized actors are involved in the selection process. As shown in the table, while several projects
have regional PCUs supporting the screening and evaluation of proposals before transmitting their opinion to the
centralized institutions (e.g. PCU, project steering committee, or independent evaluation agency) for final approval, only
the Bolivia PAR, Colombia PAAP and Peru ALIADOS projects used regional multi-stakeholder committees to perform
these tasks.
Centralized Decentralized
Guatemala PDER Honduras COMRURAL
Jamaica REDI Panama PRORURAL
Mexico SPSBBrazil PA projects (State-level)
Bolivia PAR I and IIColombia PAAP I and II
Peru ALIADOS
33
6
< 5. Subproject Preparation and Selection
6. Subproject Financing
> 7. Results Monitoring
34
Linking Farmers to Markets through Productive Alliances
60. The financial support for
Productive Alliance projects is
provided through matching grants.
These grants co-finance the core inputs of Productive Investments (e.g., machinery and equipment, fertilizers, seeds), Technical Assistance (e.g., consulting services, studies and surveys) and Business Development (e.g., training in organizational management, business administration, accounting and marketing). The activities are typically implemented by the producer organizations with technical support from private service providers, while the public sector Project Coordination Unit (PCU) focuses on facilitation, monitoring and supervision to ensure quality and adequate procurement. Details of co-financing arrangements for specific projects are described in Annex 5.
61. The levels of grant support per
subproject and the arrangements for
co-financing vary considerably between
Productive Alliance projects. In most cases, PA projects co-finance between 70% and 90% of the total subproject investment costs. Beneficiary producer organizations (or other partners) are typically required to contribute between 10% and 30%. A higher contribution from the beneficiary producers leads to a greater sense of ownership and commitment to the successful implementation of their PA subproject business plan. Colombia’s PAAP I and II projects capped co-financing support from the PA project at 40% and 30% of subproject costs, respectively. In addition, both phases successfully leveraged additional funds from other partners (e.g. local governments/
municipalities, other development partners) to cover the remaining costs not financed by the beneficiary producer contributions. In Practice Box 4 describes the creation of a broader alliance, including agents of the enabling environment, around the PA project.
62. Beneficiary producer organizations
are responsible for implementing the
approved subprojects and thus the
key recipient of the grant funds. In the majority of cases, the matching grants provided by a PA Project are disbursed into the subproject-specific beneficiary producer (or community) organization bank account. Thus, they are accountable for the proper use and management of grant resources in line with their approved subproject business plans. These accounts and the use of the grant funds managed and overseen by a subproject committee to ensure compliance with procurement rules. The most common procurement procedure used across PA projects is “Community-based Procurement”, which is explained to the POs during training and capacity-building activities organized by the projects. Typically, matching grants are disbursed in three tranches into the account of the PO during the life of the PA project. Prior to the transfer of resources to a PO bank account, in all PA projects the PCU has to first verify and clear the PO’s requests for payment both technically and financially.
63. Some alternatives to the
direct disbursements of Productive
Alliance project grants to producer
organizations have developed. For example, in Colombia, financial resources of the PAAP project were administered by
a Trust Company and were paid out into individual trust accounts controlled by each beneficiary producer organization. The project’s operational manual specified that the grant disbursements were conditioned on the funds being used in accordance with the subproject business plan and under the supervision of the Trust Company and the Ministry of Agriculture and Rural Development. The use of one-time disbursements to trusts managed by the POs themselves helped to streamline project activities and eliminated restrictions to project execution within the same fiscal year. Another example is the Guatemala PDER project, which contracted and directly paid Business Development Service providers who also managed the implementation of other technical assistance. The matching grants for seed capital and infrastructure were paid directly in three tranches into the POs’ bank accounts, once all requirements were met. In the Peru ALIADOS project the large number of subprojects - which were small in scope and technically simple - led the project to authorize single lump-sum payments to POs (instead of several tranches).
64. There are established ceilings
for the grant amount supporting a
subproject. These ceilings typically range from a minimum of US$1,800 per beneficiary household in Bolivia’s PAR projects to a maximum of US$3,600 in Honduras’ COMRURAL project. A notable exception is Peru’s ALIADOS project which has a much lower grant ceiling of US$600 per beneficiary household. Similarly, PA project designs established maximum grant amounts
SUBPROJECT FINANCING
35
per producer organization/subproject. In some projects the total grant ceiling amounts per PO were/are quite high, ranging from US$200,000 to US$300,000 (i.e., Jamaica REDI: up to US$200,000; Panama PRORURAL: up to US$250,000; Mexico SPSB: up to US$300,000). In contrast, other PA projects allow for lower ceilings of around US$30,000 to US$50,000 per PO (i.e., Guatemala PDER: up to US$30,000; Bolivia PAR: up to US$50,000; Peru ALIADOS: US$10,000 for microenterprises, US$20,000 for small enterprises, and US$30,000 for medium enterprises, as the expected number of beneficiaries increases from the former to the latter). In several PA projects in Brazil, financial support to subprojects resulted in over-dimensioned investments, given the much lower than expected number of subprojects and beneficiaries (e.g. Brazil Pará). The actual average investments per alliance and beneficiary household are presented in Section 8 for completed PA projects.
65. Most Productive Alliance
projects accept both in-kind and cash
contributions by the producers, which
has led to a bias towards in-kind
contributions. To encourage ownership and shared risk-taking assumed by producers beyond their existing in-kind contributions (e.g., machinery, land, productive assets and labor), some projects have made cash (or bank credits) contributions by producers a requirement. For example, the Bolivia PAR II accepts only cash contributions as producers’ financial counterpart. In the Honduras COMRURAL, the co-financing level is 70% to 90%, of which at least 30% has to be covered through a loan from a financial partner. In Practice Box 5 provides more details on this case.
66. The use of matching grants in
Productive Alliance projects can be
justified by positive externalities, lack
of access, and collateral for commercial
finance. The provision of matching grants from the public sector to support smallholder agricultural production in rural areas raises the question of whether such financing could and should be better-provided by commercial financial institutions. There are three main arguments for why such public-sector matching financing is warranted: (i) positive externalities: the activities of a PA project can be expected to have positive externalities on producers that are not directly benefiting from project support. In the case of the Colombia PAAP II, the final impact evaluation quantified such positive spillovers and found a positive, significant income effect for producers living near direct project beneficiaries. Moreover, PA projects have been shown to increase the adoption of improved production practices, often leading to positive environmental externalities; (ii) lack of access to commercial finance: the coverage of commercial finance institutions in remote rural areas is still low (although in some countries this situation is changing with mobile banking), so that access for smallholder producers to financial services is not always a given; and, (iii) lack of collateral: smallholder farmers often do not have (sufficient) collateral acceptable for financial institutions to give them a loan. A fourth argument could be made that PA projects provide smallholder producers with longer-term finance combined with capacity-building, a service that commercial banks do not usually offer. However, these arguments do not preclude an increased role for financial intuitions in PA projects, as their selection process lowers the transaction costs of identifying quality business plans, which makes sense from a financial and an agribusiness viewpoint. In general, more could be done to include the commercial financial sector formally in the PA approach, where desirable
and needed. Some experiences are described in the next paragraph.
67. In their design, almost all
Productive Alliance projects mention
the goal of enhancing producers’ access
to commercial financial services to
complement project grant financing
and beneficiary contributions, but
in practice few such linkages have
materialized. Activities to stimulate this access include (i) specific technical assistance to producer organizations to improve the “bankability” of subproject business plans, i.e., meeting the standard requirements of commercial financial institutions; (ii) specific technical assistance to financial institutions to adjust their services to the needs of the beneficiary producers; (iii) a credit line to eligible financial institutions at market interest rates; or, (iv) a diagnostic study of local financial institutions and their coverage and service provision to smallholder producers (e.g. Guatemala PDER and Peru ALIADOS). Along the same line, the Mexico SPSB project establishes commercial financial institutions as key technical service providers which are hired to support the management of financial services for each of the project’s seven targeted products. However, among the PA projects that have closed, the implementation of these activities was often limited and did not lead to systematic improvement in producers’ access to commercial credit. The reasons for this are manifold, including: low coverage of financial services in the rural areas where the PA projects operate, producers’ lack of collateral, and regulatory issues preventing financial institutions from making loans to groups of producers (and not individuals). The only project that has systematically involved commercial financial institutions in subproject financing is the COMRURAL project, with its requirement that 30% of total
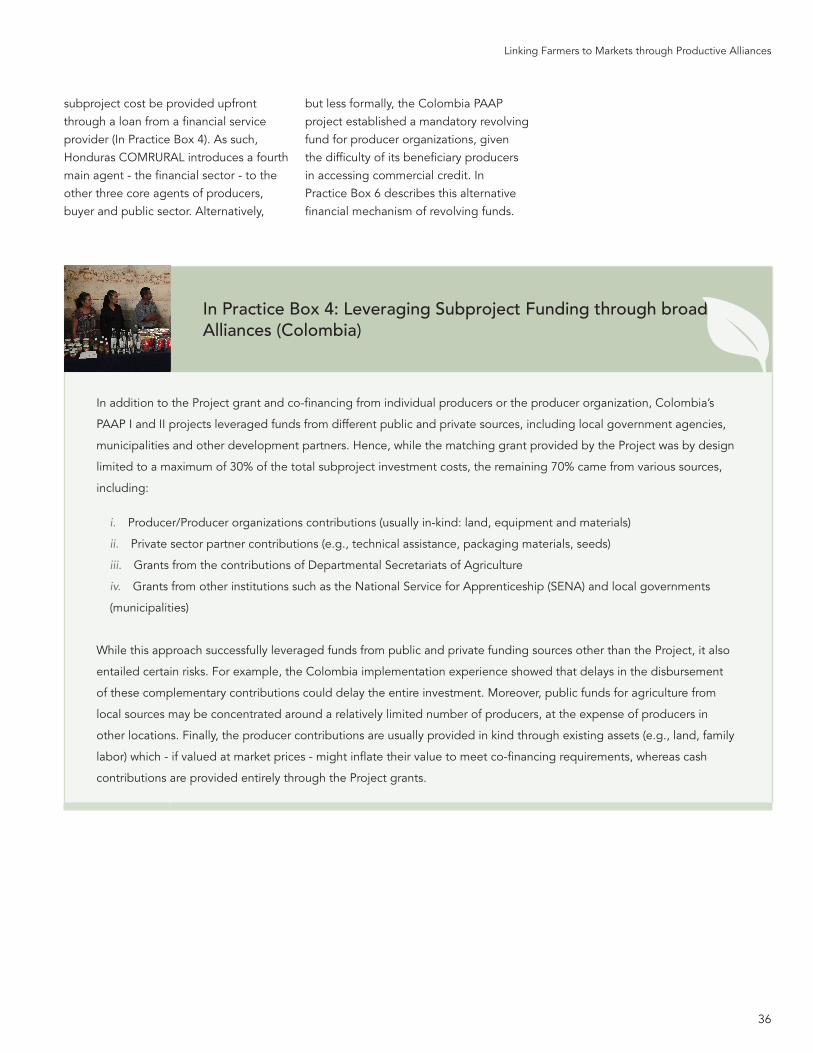
36
Linking Farmers to Markets through Productive Alliances
In Practice Box 4: Leveraging Subproject Funding through broader Alliances (Colombia)
In addition to the Project grant and co-financing from individual producers or the producer organization, Colombia’s
PAAP I and II projects leveraged funds from different public and private sources, including local government agencies,
municipalities and other development partners. Hence, while the matching grant provided by the Project was by design
limited to a maximum of 30% of the total subproject investment costs, the remaining 70% came from various sources,
including:
i. Producer/Producer organizations contributions (usually in-kind: land, equipment and materials)
ii. Private sector partner contributions (e.g., technical assistance, packaging materials, seeds)
iii. Grants from the contributions of Departmental Secretariats of Agriculture
iv. Grants from other institutions such as the National Service for Apprenticeship (SENA) and local governments
(municipalities)
While this approach successfully leveraged funds from public and private funding sources other than the Project, it also
entailed certain risks. For example, the Colombia implementation experience showed that delays in the disbursement
of these complementary contributions could delay the entire investment. Moreover, public funds for agriculture from
local sources may be concentrated around a relatively limited number of producers, at the expense of producers in
other locations. Finally, the producer contributions are usually provided in kind through existing assets (e.g., land, family
labor) which - if valued at market prices - might inflate their value to meet co-financing requirements, whereas cash
contributions are provided entirely through the Project grants.
subproject cost be provided upfront through a loan from a financial service provider (In Practice Box 4). As such, Honduras COMRURAL introduces a fourth main agent - the financial sector - to the other three core agents of producers, buyer and public sector. Alternatively,
but less formally, the Colombia PAAP project established a mandatory revolving fund for producer organizations, given the difficulty of its beneficiary producers in accessing commercial credit. In Practice Box 6 describes this alternative financial mechanism of revolving funds.
37
In Practice Box 5: Upfront Engagement of the Commercial Financial Sector (Honduras)
The Honduras COMRURAL project required that a subproject secure a loan from a financial partner, covering at least of
30% of total subproject investment costs, in addition to the required 10% in cash or in kind contribution by the PO. From
the beginning of the project, a broad range of financial partners were identified as eligible to participate in co-financing
the subproject:
i. Commercial banks, finance associations, private finance development institutions regulated by the Banking and
National Insurance Commission;
ii. Credit and savings cooperatives affiliated with the Honduran Federation of Credit and Savings Cooperatives; and,
iii. Other micro-finance institutions, and other buyers such as input providers.
During implementation, the Producer Organizations’ contribution was often higher than required, in some cases almost
50% of subproject costs. A lesson learned from the Honduras COMRURAL Project is that smallholders are able to
obtain access to commercial finance despite the widely-held view that it is too risky for banks to lend to smallholders.
The project has demonstrated that financial actors can lend funds to organized smallholders if an effective enabling
environment exists. This includes: strong communication between counterparts and the banks; the setting up of a
project guarantee fund; and, a longer-term engagement to build trust and confidence among all actors. As a result
of their participation in the project, various producer organizations have received further loans. Thus, the project was
able to demonstrate that smallholder producers can be attractive clients who repay their loans on time. Based on this
experience, a new PDO-level indicator was introduced for the project’s Additional Financing, measuring the percentage
of producer organizations without loans in arrears, and at the intermediate results level, the ratio of loans to grants in the
business plans.
38
Linking Farmers to Markets through Productive Alliances
In Practice Box 6: Revolving Funds as an Alternative Financing Mechanism (Colombia)
In Colombia, many participating producer organizations experienced difficulty accessing commercial credit under PAAP
I. The design of the second phase project PAAP II therefore included stronger measures to entice financial institutions to
provide credit to beneficiary producers. As an intermediate step, a mandatory revolving fund was established which was
initially financed using funds recovered through the partial repayment scheme of Project grant managed by the producer
organizations. Producer organizations were encouraged to use and manage their revolving fund as a tool to finance
their working and investment capital requirements. A secondary objective of the revolving fund was to allow producer
organizations to build up their credit-worthiness, which was expected to enable them to obtain commercial financial
credit. While access to commercial credit remained low during PAAP II, the revolving funds turned out to be a successful
measure to finance (beneficiary) producer investments, technical assistance and to purchase specialized machinery. By
completion of PAAP II, 399 revolving funds were in operation.
Despite the popularity of the revolving funds, the Colombia PAAP project envisaged several steps to also gradually
improve producer organizations’ (PO) access to commercial finance:
i. POs’ financial transactions managed by the trust companies could help them build a track record in the financial system
ii. POs should prepare audited financial statements
iii. Forward contracts could be established to obtain supplier credit
iv. Existing vertical alliances from PAAP I that need capital to expand should be assisted by a specialized person in their
negotiations with the banking system
v. The PCU and OGR should approach financial institutions that offer credit to small enterprises such as banks, micro-
credit institutions and NGOs
39
7
< 6. Subproject Financing
7. Results Monitoring
> 8. Achievements and Outcomes
40
Linking Farmers to Markets through Productive Alliances
68. Productive Alliance projects
engage in continuous monitoring and
regular reporting of project activities
and achievements in relation to
established project targets. These targets are spelled out in the Project Results Framework, which includes both Project Development Objective and Intermediate Results Indicators (with their respective targets by year and for the end of project implementation).9 The Project Coordination Unit (PCU) is responsible for providing the necessary information at the aggregate project level and for sharing it with the World Bank Task Team. Depending on a project’s organizational structure, this monitoring data collection can be done either centrally (if there is only a national PCU) or with the support of decentralized Regional Project Units (RPUs) that collect information for their respective region and share it with the national PCU. Typically, projects develop a Project Monitoring and Evaluation (M&E) System for this purpose. In the case of PA projects, some have developed sophisticated on-line platforms that include results as well as fiduciary monitoring (e.g. Brazil Pernambuco, Bolivia PAR, Colombia PAAP, Mexico SPSB), while others rely on Excel-based data sets (e.g. Guatemala PDER, Jamaica REDI, Panama PRORURAL). In some cases, results monitoring has been incomplete due to the lack of an adequate system, which had led to partial, sub-optimal data collection (e.g. Brazil Alto Solimôes, Brazil Pará). Annex 6 provides details on monitoring and data collection activities at different stages of project implementation, as well as some examples of M&E online systems developed for PA projects.
69. The Project Coordination Units
at the central and/or regional level are
responsible for monitoring subproject
activities and achievements. Such monitoring of subproject implementation should be conducted according to the results indicators spelled out in the subproject business plans (which are typically aligned with the overall Project Results Framework). The beneficiary producer organizations are required to collect and report data periodically to the PCU, which then systematically records this information in a Project Monitoring and Evaluation System. The technical assistance service providers hired by the project are commonly expected to validate the data provided by the POs. In addition, PCU staff regularly visit each subproject for verification.
70. Many of the Productive Alliance
projects reviewed could improve
their efforts to fulfill data needs and
improve data collection methods for
better results monitoring, as is the case also for other World Bank-financed lending operations. Regarding data availability at the subproject level, the productive alliance business plans typically contain baseline information on some important indicators (such as sales volumes, prices obtained and end markets). However, experiences from Mid-Term Reviews (MTR), Implementation Completion and Results Reports (ICR), and ex-post economic analyses of PA projects have shown that data on key indicators, such as production costs and sales incomes before and after the subproject investment, have often not been accurately collected. This lack of adequate and consistent data collection
limits the ability to monitor project results at the outcome level and to conduct final evaluations. Consequently, more guidance and training on data needs and collection methods should be provided to PCUs and POs by PA projects, as they often do not have the specific skills required for these tasks. In response to this identified need, some PA projects have been strengthening their M&E Systems and provided training to consultants who accompany the subproject partners in recording key data such as production costs, sales revenues and the use of hired and non-hired labor. Conducting periodic quality checks of these data bases is crucial to enable measurement of the impact of the Productive Alliance approach at project completion. The issue of adequate monitoring data collection will be addressed further in the Sections 8 and 9.
RESULTS MONITORING
9. Annex 7 displays the PDO indicators from the Results Frameworks of the analyzed Productive Alliance projects.
41
8
< 7. Results Monitoring
8. Achievements and Outcomes
> 9. Evaluation Strategies
42
Linking Farmers to Markets through Productive Alliances
71. The achievements of Productive
Alliance projects can be presented
under five dimensions: (i) scope, (ii),
social inclusion, (iii) socio-economic
impacts, (iv) efficiency, and (v)
sustainability. Of the PA projects in the Latin America region, eight have completed their implementation. These are, in chronological order of their completion: Colombia PAAP I, Brazil Sergipe, Bolivia PAR I, Brazil Alto Solimôes, Brazil Pará, Guatemala PDER, Panama PRORURAL and Colombia PAAP II. The main achievements compared to targets and consequent outcomes of these projects are summarized for the five afore-mentioned dimensions, based on the projects’ Implementation Completion and Results Reports.
SCOPE72. Almost all Productive Alliance
projects in Latin America exceeded
their appraisal targets for the number
of alliance subprojects, but not for the
number of beneficiary households.
With respect to the number of vertical productive alliances with buyers (i.e. subprojects) to be established, all projects except for the Guatemala PDER and the projects in Brazil exceeded their targets. However, only the Colombia PAAP I and II met and actually exceeded the targets for number of direct beneficiary producer households. This is because projects generally supported a larger than expected number of alliances, but with fewer beneficiary producers per participating organization than anticipated at appraisal. The actual average number of producer households per alliance ranges from 35 (Panama
PRORURAL) to 104 (Guatemala PDER). Details on project scope are presented in Table A8.1 in Annex 8.
73. Indirect beneficiaries of Productive
Alliance projects remain largely
unaccounted for. Similar to other World Bank investment projects, the focus of results monitoring and analyses is on the direct beneficiaries. However, it is likely that a considerable number of producers benefit indirectly from positive spillover effects of the activities undertaken by PA projects. These indirect effects (both positive and negative) are usually not measured in project monitoring systems. For the PA projects, only Colombia PAAP II started monitoring indirect beneficiaries during project implementation (since 2010). The results show that in addition to the 42,552 direct beneficiary households, at least 11,057 households benefited indirectly from the project. The related spillover effects are discussed below under socio-economic impacts.
74. The actual grant investment
amounts per beneficiary household vary
greatly among projects, ranging from an average of US$514 (Colombia PAAP II) to US$4,186 Panama (PRORURAL), and per alliance from US$30,370 (PAAP II) to US$189,450 (Brazil Pará). The variation in those amounts is due to the different types of investments and upgrades promoted by each project (e.g. some projects promoted the procurement of equipment or machinery, which resulted in higher investment costs per beneficiary). These figures do not include grants from other public sources and, hence, the actual total grant amounts received by alliances is expected to be higher. For example, the decrease in
the average amount between Colombia PAAP I and II is assumed to be the result of a large increase in financial contributions from other agents (e.g. municipalities and other partners of broader alliances). As projects did not consistently report co-financing from sources other than the Project, producers and buyers, it is not possible to provide this information. Details on the scope of the project investment support given are presented in Table A8.2 in Annex 8.
SOCIAL INCLUSION75. Productive Alliance projects
have performed well in including
women. Most of the PA projects have not established specific requirements or strategies with regard to including women in their activities. Yet, many PA projects report on the number of female project beneficiaries in their project monitoring systems and include women’s participation in the projects’ Results Frameworks (with specific end-of-project targets in the intermediate results indicators, which usually related to a certain percentage of total project beneficiaries). A special case is Brazil Sergipe, which even included a results indicator on women’s participation at the Project Development Objective (PDO) level. According to these monitoring systems, in most PA projects women’s involvement and participation in productive alliances is much higher than expected. For example, the Colombia PAAP I successfully reached households headed by women (175% of the Results Framework indicator target). On a much higher level, PAAP II directly benefited more than 9,900 female-headed producer
ACHIEVEMENTS AND OUTCOMES
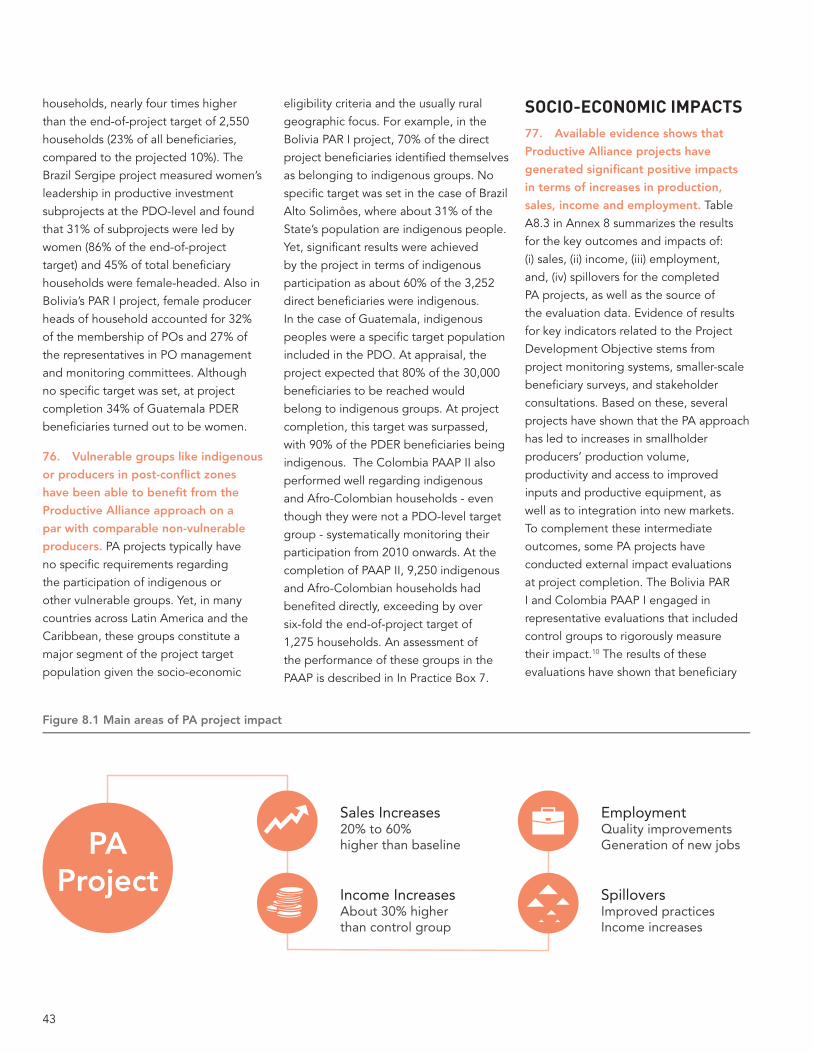
43
households, nearly four times higher than the end-of-project target of 2,550 households (23% of all beneficiaries, compared to the projected 10%). The Brazil Sergipe project measured women’s leadership in productive investment subprojects at the PDO-level and found that 31% of subprojects were led by women (86% of the end-of-project target) and 45% of total beneficiary households were female-headed. Also in Bolivia’s PAR I project, female producer heads of household accounted for 32% of the membership of POs and 27% of the representatives in PO management and monitoring committees. Although no specific target was set, at project completion 34% of Guatemala PDER beneficiaries turned out to be women.
76. Vulnerable groups like indigenous
or producers in post-conflict zones
have been able to benefit from the
Productive Alliance approach on a
par with comparable non-vulnerable
producers. PA projects typically have no specific requirements regarding the participation of indigenous or other vulnerable groups. Yet, in many countries across Latin America and the Caribbean, these groups constitute a major segment of the project target population given the socio-economic
eligibility criteria and the usually rural geographic focus. For example, in the Bolivia PAR I project, 70% of the direct project beneficiaries identified themselves as belonging to indigenous groups. No specific target was set in the case of Brazil Alto Solimôes, where about 31% of the State’s population are indigenous people. Yet, significant results were achieved by the project in terms of indigenous participation as about 60% of the 3,252 direct beneficiaries were indigenous. In the case of Guatemala, indigenous peoples were a specific target population included in the PDO. At appraisal, the project expected that 80% of the 30,000 beneficiaries to be reached would belong to indigenous groups. At project completion, this target was surpassed, with 90% of the PDER beneficiaries being indigenous. The Colombia PAAP II also performed well regarding indigenous and Afro-Colombian households - even though they were not a PDO-level target group - systematically monitoring their participation from 2010 onwards. At the completion of PAAP II, 9,250 indigenous and Afro-Colombian households had benefited directly, exceeding by over six-fold the end-of-project target of 1,275 households. An assessment of the performance of these groups in the PAAP is described in In Practice Box 7.
SOCIO-ECONOMIC IMPACTS 77. Available evidence shows that
Productive Alliance projects have
generated significant positive impacts
in terms of increases in production,
sales, income and employment. Table A8.3 in Annex 8 summarizes the results for the key outcomes and impacts of: (i) sales, (ii) income, (iii) employment, and, (iv) spillovers for the completed PA projects, as well as the source of the evaluation data. Evidence of results for key indicators related to the Project Development Objective stems from project monitoring systems, smaller-scale beneficiary surveys, and stakeholder consultations. Based on these, several projects have shown that the PA approach has led to increases in smallholder producers’ production volume, productivity and access to improved inputs and productive equipment, as well as to integration into new markets. To complement these intermediate outcomes, some PA projects have conducted external impact evaluations at project completion. The Bolivia PAR I and Colombia PAAP I engaged in representative evaluations that included control groups to rigorously measure their impact.10 The results of these evaluations have shown that beneficiary
Figure 8.1 Main areas of PA project impact
Sales Increases 20% to 60% higher than baseline
Income Increases About 30% higher than control group
Employment Quality improvementsGeneration of new jobs
Spillovers Improved practicesIncome increases
PAProject
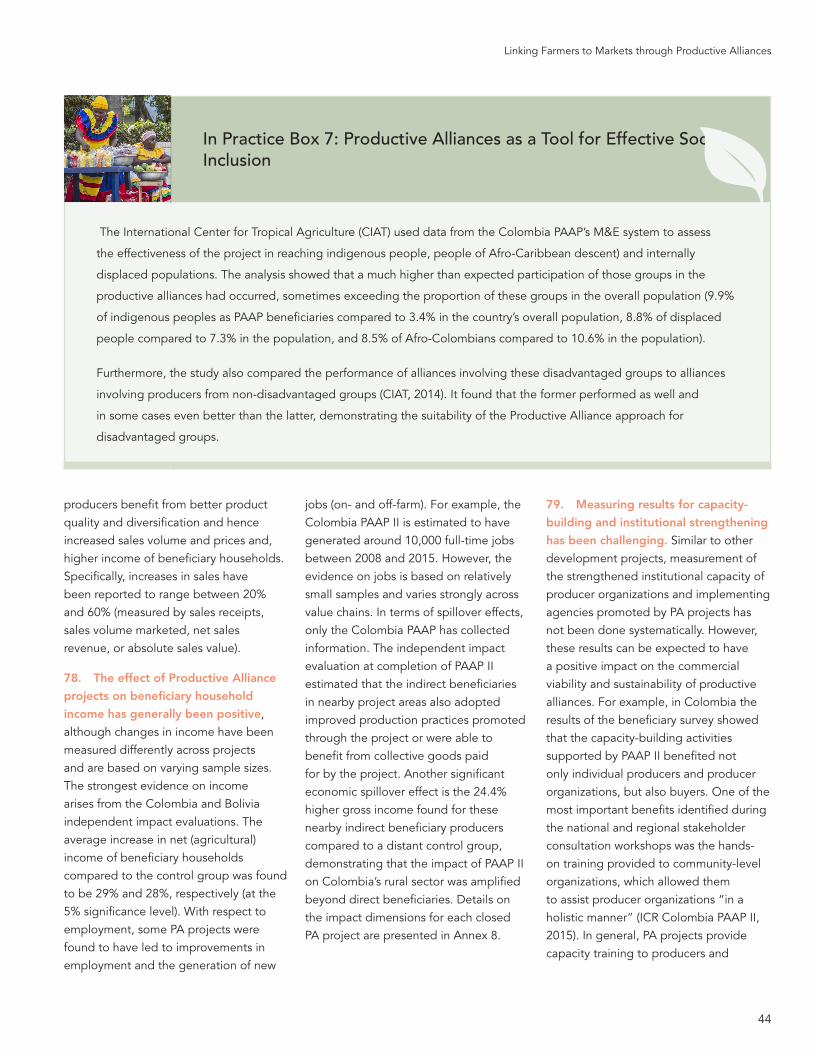
44
Linking Farmers to Markets through Productive Alliances
In Practice Box 7: Productive Alliances as a Tool for Effective Social Inclusion
The International Center for Tropical Agriculture (CIAT) used data from the Colombia PAAP’s M&E system to assess
the effectiveness of the project in reaching indigenous people, people of Afro-Caribbean descent) and internally
displaced populations. The analysis showed that a much higher than expected participation of those groups in the
productive alliances had occurred, sometimes exceeding the proportion of these groups in the overall population (9.9%
of indigenous peoples as PAAP beneficiaries compared to 3.4% in the country’s overall population, 8.8% of displaced
people compared to 7.3% in the population, and 8.5% of Afro-Colombians compared to 10.6% in the population).
Furthermore, the study also compared the performance of alliances involving these disadvantaged groups to alliances
involving producers from non-disadvantaged groups (CIAT, 2014). It found that the former performed as well and
in some cases even better than the latter, demonstrating the suitability of the Productive Alliance approach for
disadvantaged groups.
producers benefit from better product quality and diversification and hence increased sales volume and prices and, higher income of beneficiary households. Specifically, increases in sales have been reported to range between 20% and 60% (measured by sales receipts, sales volume marketed, net sales revenue, or absolute sales value).
78. The effect of Productive Alliance
projects on beneficiary household
income has generally been positive, although changes in income have been measured differently across projects and are based on varying sample sizes. The strongest evidence on income arises from the Colombia and Bolivia independent impact evaluations. The average increase in net (agricultural) income of beneficiary households compared to the control group was found to be 29% and 28%, respectively (at the 5% significance level). With respect to employment, some PA projects were found to have led to improvements in employment and the generation of new
jobs (on- and off-farm). For example, the Colombia PAAP II is estimated to have generated around 10,000 full-time jobs between 2008 and 2015. However, the evidence on jobs is based on relatively small samples and varies strongly across value chains. In terms of spillover effects, only the Colombia PAAP has collected information. The independent impact evaluation at completion of PAAP II estimated that the indirect beneficiaries in nearby project areas also adopted improved production practices promoted through the project or were able to benefit from collective goods paid for by the project. Another significant economic spillover effect is the 24.4% higher gross income found for these nearby indirect beneficiary producers compared to a distant control group, demonstrating that the impact of PAAP II on Colombia’s rural sector was amplified beyond direct beneficiaries. Details on the impact dimensions for each closed PA project are presented in Annex 8.
79. Measuring results for capacity-
building and institutional strengthening
has been challenging. Similar to other development projects, measurement of the strengthened institutional capacity of producer organizations and implementing agencies promoted by PA projects has not been done systematically. However, these results can be expected to have a positive impact on the commercial viability and sustainability of productive alliances. For example, in Colombia the results of the beneficiary survey showed that the capacity-building activities supported by PAAP II benefited not only individual producers and producer organizations, but also buyers. One of the most important benefits identified during the national and regional stakeholder consultation workshops was the hands-on training provided to community-level organizations, which allowed them to assist producer organizations “in a holistic manner” (ICR Colombia PAAP II, 2015). In general, PA projects provide capacity training to producers and
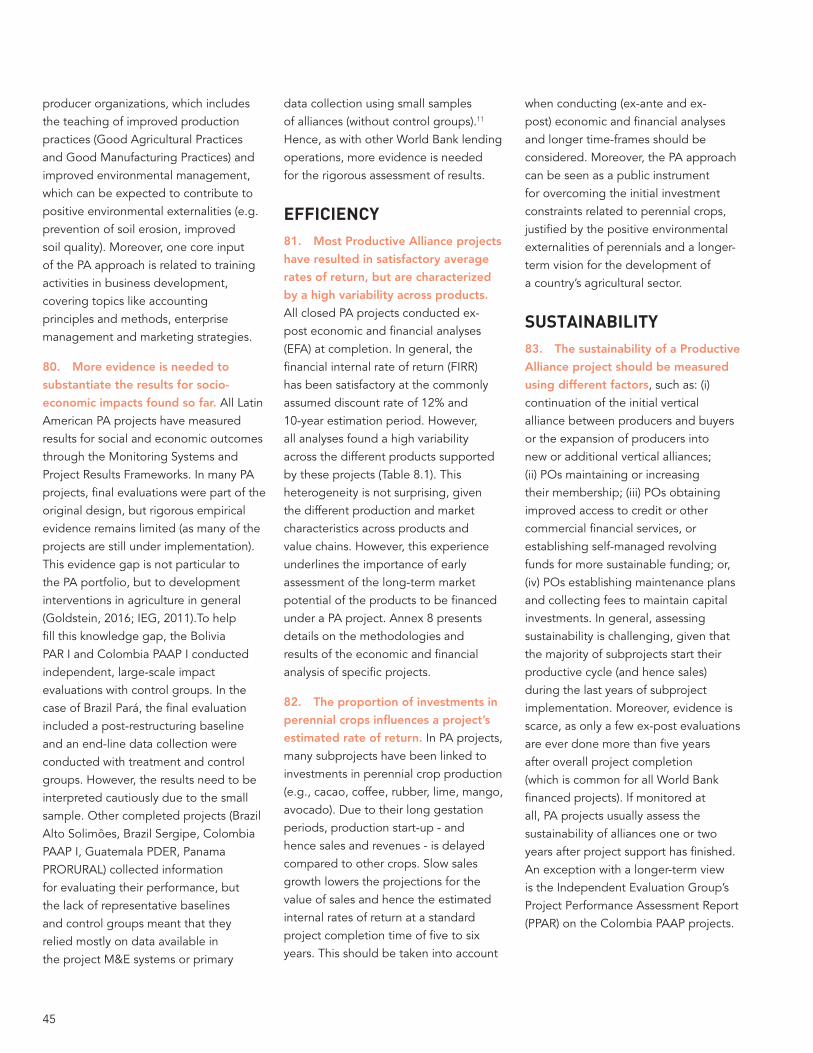
45
producer organizations, which includes the teaching of improved production practices (Good Agricultural Practices and Good Manufacturing Practices) and improved environmental management, which can be expected to contribute to positive environmental externalities (e.g. prevention of soil erosion, improved soil quality). Moreover, one core input of the PA approach is related to training activities in business development, covering topics like accounting principles and methods, enterprise management and marketing strategies.
80. More evidence is needed to
substantiate the results for socio-
economic impacts found so far. All Latin American PA projects have measured results for social and economic outcomes through the Monitoring Systems and Project Results Frameworks. In many PA projects, final evaluations were part of the original design, but rigorous empirical evidence remains limited (as many of the projects are still under implementation). This evidence gap is not particular to the PA portfolio, but to development interventions in agriculture in general (Goldstein, 2016; IEG, 2011).To help fill this knowledge gap, the Bolivia PAR I and Colombia PAAP I conducted independent, large-scale impact evaluations with control groups. In the case of Brazil Pará, the final evaluation included a post-restructuring baseline and an end-line data collection were conducted with treatment and control groups. However, the results need to be interpreted cautiously due to the small sample. Other completed projects (Brazil Alto Solimôes, Brazil Sergipe, Colombia PAAP I, Guatemala PDER, Panama PRORURAL) collected information for evaluating their performance, but the lack of representative baselines and control groups meant that they relied mostly on data available in the project M&E systems or primary
data collection using small samples of alliances (without control groups).11 Hence, as with other World Bank lending operations, more evidence is needed for the rigorous assessment of results.
EFFICIENCY81. Most Productive Alliance projects
have resulted in satisfactory average
rates of return, but are characterized
by a high variability across products.
All closed PA projects conducted ex-post economic and financial analyses (EFA) at completion. In general, the financial internal rate of return (FIRR) has been satisfactory at the commonly assumed discount rate of 12% and 10-year estimation period. However, all analyses found a high variability across the different products supported by these projects (Table 8.1). This heterogeneity is not surprising, given the different production and market characteristics across products and value chains. However, this experience underlines the importance of early assessment of the long-term market potential of the products to be financed under a PA project. Annex 8 presents details on the methodologies and results of the economic and financial analysis of specific projects.
82. The proportion of investments in
perennial crops influences a project’s
estimated rate of return. In PA projects, many subprojects have been linked to investments in perennial crop production (e.g., cacao, coffee, rubber, lime, mango, avocado). Due to their long gestation periods, production start-up - and hence sales and revenues - is delayed compared to other crops. Slow sales growth lowers the projections for the value of sales and hence the estimated internal rates of return at a standard project completion time of five to six years. This should be taken into account
when conducting (ex-ante and ex-post) economic and financial analyses and longer time-frames should be considered. Moreover, the PA approach can be seen as a public instrument for overcoming the initial investment constraints related to perennial crops, justified by the positive environmental externalities of perennials and a longer-term vision for the development of a country’s agricultural sector.
SUSTAINABILITY 83. The sustainability of a Productive
Alliance project should be measured
using different factors, such as: (i) continuation of the initial vertical alliance between producers and buyers or the expansion of producers into new or additional vertical alliances; (ii) POs maintaining or increasing their membership; (iii) POs obtaining improved access to credit or other commercial financial services, or establishing self-managed revolving funds for more sustainable funding; or, (iv) POs establishing maintenance plans and collecting fees to maintain capital investments. In general, assessing sustainability is challenging, given that the majority of subprojects start their productive cycle (and hence sales) during the last years of subproject implementation. Moreover, evidence is scarce, as only a few ex-post evaluations are ever done more than five years after overall project completion (which is common for all World Bank financed projects). If monitored at all, PA projects usually assess the sustainability of alliances one or two years after project support has finished. An exception with a longer-term view is the Independent Evaluation Group’s Project Performance Assessment Report (PPAR) on the Colombia PAAP projects.
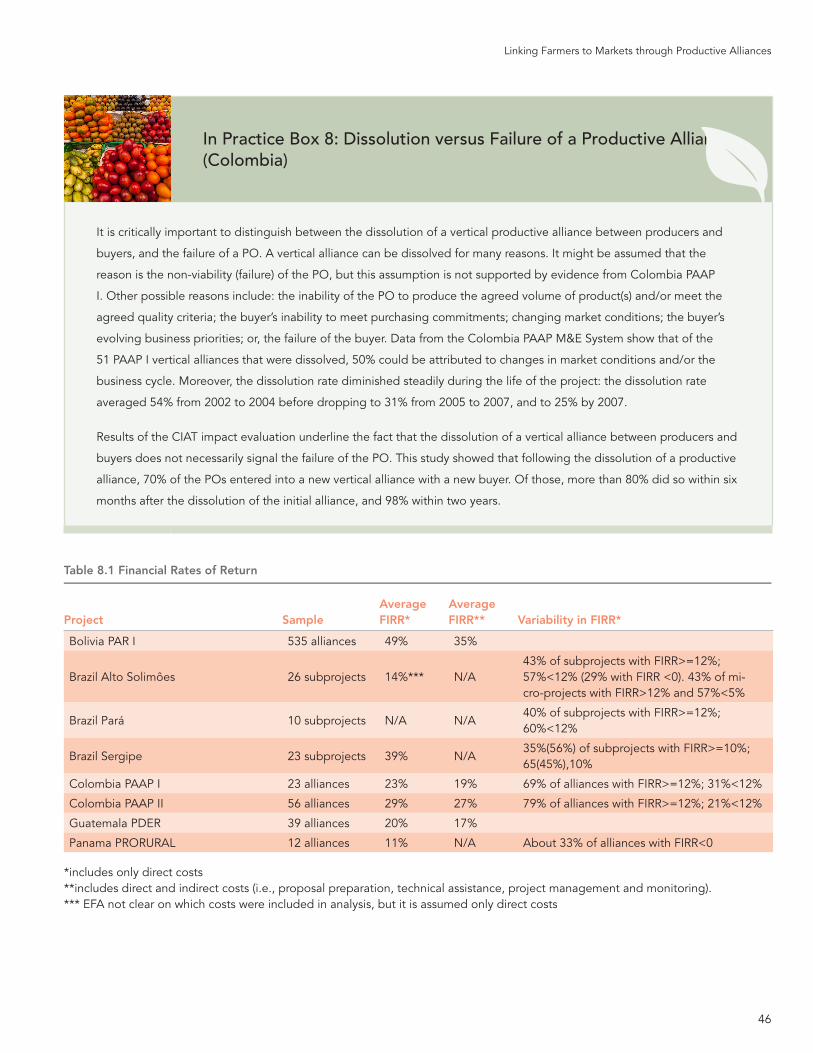
46
Linking Farmers to Markets through Productive Alliances
In Practice Box 8: Dissolution versus Failure of a Productive Alliance (Colombia)
It is critically important to distinguish between the dissolution of a vertical productive alliance between producers and
buyers, and the failure of a PO. A vertical alliance can be dissolved for many reasons. It might be assumed that the
reason is the non-viability (failure) of the PO, but this assumption is not supported by evidence from Colombia PAAP
I. Other possible reasons include: the inability of the PO to produce the agreed volume of product(s) and/or meet the
agreed quality criteria; the buyer’s inability to meet purchasing commitments; changing market conditions; the buyer’s
evolving business priorities; or, the failure of the buyer. Data from the Colombia PAAP M&E System show that of the
51 PAAP I vertical alliances that were dissolved, 50% could be attributed to changes in market conditions and/or the
business cycle. Moreover, the dissolution rate diminished steadily during the life of the project: the dissolution rate
averaged 54% from 2002 to 2004 before dropping to 31% from 2005 to 2007, and to 25% by 2007.
Results of the CIAT impact evaluation underline the fact that the dissolution of a vertical alliance between producers and
buyers does not necessarily signal the failure of the PO. This study showed that following the dissolution of a productive
alliance, 70% of the POs entered into a new vertical alliance with a new buyer. Of those, more than 80% did so within six
months after the dissolution of the initial alliance, and 98% within two years.
Project SampleAverage FIRR*
Average FIRR** Variability in FIRR*
Bolivia PAR I 535 alliances 49% 35%
Brazil Alto Solimôes 26 subprojects 14%*** N/A43% of subprojects with FIRR>=12%; 57%<12% (29% with FIRR <0). 43% of mi-cro-projects with FIRR>12% and 57%<5%
Brazil Pará 10 subprojects N/A N/A40% of subprojects with FIRR>=12%; 60%<12%
Brazil Sergipe 23 subprojects 39% N/A35%(56%) of subprojects with FIRR>=10%; 65(45%),10%
Colombia PAAP I 23 alliances 23% 19% 69% of alliances with FIRR>=12%; 31%<12%
Colombia PAAP II 56 alliances 29% 27% 79% of alliances with FIRR>=12%; 21%<12%
Guatemala PDER 39 alliances 20% 17%
Panama PRORURAL 12 alliances 11% N/A About 33% of alliances with FIRR<0
*includes only direct costs**includes direct and indirect costs (i.e., proposal preparation, technical assistance, project management and monitoring).*** EFA not clear on which costs were included in analysis, but it is assumed only direct costs
Table 8.1 Financial Rates of Return
47
84. There is evidence of long-term
vertical alliances between smallholder
producers and buyers. For example, in the Panama PRORURAL project it was found that 80% of the 130 alliances continued to operate one year after project support ended. In addition, documentary evidence shows that new members of beneficiary producer organizations increased 54%, implying that membership of a producer organization supported by PRORURAL was perceived as valuable. Continued monitoring of Colombia PAAP alliances even after project closure, showed that most of the productive alliances had continued to operate even seven years after project completion. Specifically, 62% of first phase partnerships were continuing to operate seven years after PAAP-I closure. In the case of PAAP-II vertical alliances, 80% of producer organizations continued to sell to a buyer 24 months after project support ended (In Practice Box 8). Furthermore, the CIAT study demonstrated that the vast majority of producer organizations were capable of establishing new alliances when an earlier alliance dissolved (CIAT, 2014). Regarding other dimensions of sustainability, the survey results from 83 beneficiary vertical alliances in the impact evaluation of PAAP II show that 82% of beneficiary producer organizations are collecting annual membership fees to finance their operations and to maintain capital infrastructure. Another factor influencing the sustainability of production is productive reinvestments, with PAAP II beneficiary producers being more likely to reinvest part of their net revenues in productive activities than the control group.
10. The methdologies of these impact evaluations are summarized in Annex 8. Details can be found in the projects’ Implementation Completion and Results Reports.
11. For example, the Guatemala PDER project conducted a final external evaluation through an independent consultant firm based on a sample of 16 alliances out of 174 alliances operating at project completion.
85. The prospects for sustainability
seem better for producer organizations
that existed prior to the Productive
Alliance project intervention, according to available data from project impact evaluations and anecdotal evidence from stakeholder assessments (In Practice Box 9). These organizations benefit from having an established track record in collective action, rather than organizations formed just for the purpose of accessing project support.
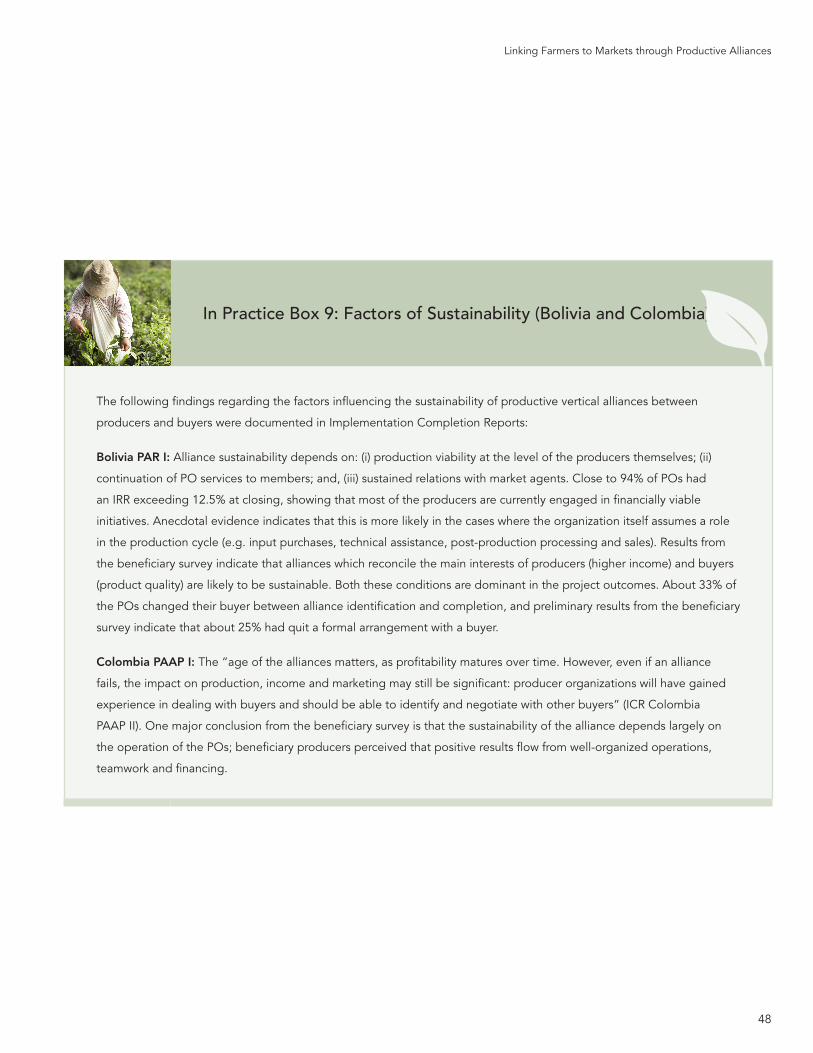
48
Linking Farmers to Markets through Productive Alliances
In Practice Box 9: Factors of Sustainability (Bolivia and Colombia)
The following findings regarding the factors influencing the sustainability of productive vertical alliances between
producers and buyers were documented in Implementation Completion Reports:
Bolivia PAR I: Alliance sustainability depends on: (i) production viability at the level of the producers themselves; (ii)
continuation of PO services to members; and, (iii) sustained relations with market agents. Close to 94% of POs had
an IRR exceeding 12.5% at closing, showing that most of the producers are currently engaged in financially viable
initiatives. Anecdotal evidence indicates that this is more likely in the cases where the organization itself assumes a role
in the production cycle (e.g. input purchases, technical assistance, post-production processing and sales). Results from
the beneficiary survey indicate that alliances which reconcile the main interests of producers (higher income) and buyers
(product quality) are likely to be sustainable. Both these conditions are dominant in the project outcomes. About 33% of
the POs changed their buyer between alliance identification and completion, and preliminary results from the beneficiary
survey indicate that about 25% had quit a formal arrangement with a buyer.
Colombia PAAP I: The “age of the alliances matters, as profitability matures over time. However, even if an alliance
fails, the impact on production, income and marketing may still be significant: producer organizations will have gained
experience in dealing with buyers and should be able to identify and negotiate with other buyers” (ICR Colombia
PAAP II). One major conclusion from the beneficiary survey is that the sustainability of the alliance depends largely on
the operation of the POs; beneficiary producers perceived that positive results flow from well-organized operations,
teamwork and financing.

49
9
> 8. Achievements and Outcomes
9. Evaluation Strategies
< 10. Lessons Learned
50
Linking Farmers to Markets through Productive Alliances
86. Productive Alliance projects often
lack adequate baseline data. As with other development projects, missing baselines are often due to the high cost of household-level data collection in rural areas and the demand-driven nature of most subprojects, which make it impossible to know ex-ante which products will be supported during project implementation. To reduce the likelihood of ending up without robust baseline data, establishing a representative baseline and control groups should be a priority following effectiveness, taking into account data collection for vulnerable groups. Where available and possible, such efforts should explore whether useful data may already exist, and they may want to seek out opportunities for securing additional (external) funding for baseline data collection.
87. Furthermore, outcomes for
Productive Alliance projects are
often too ambitious for the project
engagement period. Several PA projects have defined their Results Framework PDO indicators and the respective targets at levels which can only be achieved longer-term (e.g. changes in household income). Such higher-level outcomes are unlikely to materialize by the end of an initial PA project of five or six years. Consequently, PA projects should focus on realistic and achievable medium-term outcomes. Table A9.2 in Annex 9 provides a prototypical theory of change indicating varying levels of outcomes for a PA project.
88. As a result, an increased focus
is needed on developing evaluation
strategies for Productive Alliance
projects which are aligned with the
monitoring of project indicators. Lessons from Brazil Alto Solimôes, Brazil Pará, Colombia PAAP II, and Panama PRORURAL highlight the need for an M&E unit with a clear operational plan to be established early on within the Project Coordination Unit. Furthermore, to facilitate impact evaluation data collection at project completion (especially for the ex-post economic and financial analyses), PA projects should train beneficiary producer organizations to establish and maintain records and accounts on production, yields, costs, sales volumes, prices and/or sales revenues associated with their productive activities and the measurement of key project indicators. A systematic monitoring of compliance with these activities would limit inconsistencies in the analysis of subproject profitability, from which several PA projects have suffered. Thus, a project monitoring and complementary evaluation strategy should be part of the design of each PA and be spelled out in the Operational Manual.
89. In recent years, Productive
Alliance projects have strengthened
their M&E strategies and revised their
Results Frameworks. Recognizing the limited, rigorous evidence - beyond the impact evaluations of the Bolivia PAR I and Colombia PAAP II projects - trends in the M&E of PA projects have been promising: (i) (Restructured) Results Frameworks contain fewer and more precise PDO indicators (e.g. moving from absolute values towards percentage increases compared to defined benchmarks); (ii) PDO indicators are increasingly defined at the outcome-level instead of impact-level (as the
latter should be measured through complementary, final project evaluations conducted several years beyond project closing); and, (iii) product documents (PAD, MTR) make more frequent references to project-specific baseline data. Furthermore, there is an ongoing transformation of PA projects to monitor and evaluate not only socio-economic effects, but also to assess co-benefits for the environment (Mexico SPSB and Panama PRORURAL), social inclusion (Brazil Sergipe, Panama PRORURAL), and nutrition (Brazil Bahia, Haiti RESEPAG II).
90. Productive Alliance project teams
are increasingly developing a Theory
of Change to more systematically
include evaluation strategies in their
project designs. The concept of a Theory of Change is to demonstrate how an intervention is expected to lead to desired results (Kusek and Rist, 2004). Designs of a Theory of Change can vary, but typically include the results chain elements of: (i) inputs, (ii) activities, (iii) outputs, (iv) outcomes, and, (v) impacts (Morra Imas and Rist, 2009). In addition to the five main elements, a Theory of Change can also include the description of target groups, risk factors and mitigation activities, or responsibility assignments. The details depend on the needs and purposes of the project team and client. A Theory of Change should ideally be developed at the project design stage, but the concept can also be used post-effectiveness to assess the consistency of the logic behind the existing Results Framework, which may imply restructuring. Annex 9 provides a brief description of the elements and logic behind the workings
EVALUATION STRATEGIES
51
of a Theory of Change, and presents a prototypical Theory of Change for a Productive Alliance project based on workshops with project teams.
91. Key recommendations for
the Monitoring and Evaluation of
Productive Alliance projects have
emerged. When working out the details of the development or revision of a project’s M&E design, the most commonly found challenges relate to unclear definitions of indicators in project Results Frameworks. These challenges are not unique to PA projects, but project teams in the Latin America region have sought to address them specifically for PA-type projects. Based on several workshops and group discussions, the following recommendations were identified:
» PDO indicators should not go
beyond (medium-term) outcome level
(due to difficulties in measurement
and unrealistic expectations for
the typical 5-year project)
» Baseline and impact evaluation
data collection should be part of
M&E design and budget planning
(complementing the standard Results
Framework monitoring to have a
control group for adequate comparison
and attribution at project completion)
» Standardized measurements of PDO
indicators should be developed
across PA projects for purposes
of comparability (e.g. % increases
instead of absolute values)
» The commonly used PDO indicators
on sales should be interpreted with
caution due to related factors beyond
a project’s control (e.g. business
cycle, market conditions, regulation)
» The PDO should be defined to
include all beneficiary groups (as
PA projects have target beneficiary
groups at different organizational
stages, as Section 3 describes)
» The PDO should be clearly related
to the specific PA activities (to
reflect if PDO is related to increasing
market access, market share,
competitiveness, productivity, or else)
» Information on buyers should be
collected systematically in the Results
Framework (so far, PA projects have
focused almost entirely on data
collection from producers only)
» Information on maintenance provisions
should be collected systematically in
the Results Framework (as PA projects
provide productive infrastructure
which requires regular maintenance
to ensure long-term operation)
92. Several Productive Alliance
projects have internalized these
recommendations and developed
innovative Results Frameworks. For instance, in the case of Brazil Pernambuco and the Additional Financing of Honduras COMRURAL the PDO indicators were revised to the outcome level and not at the impact or output level. Both projects as well as the Brazil Paraíba Sustainable Rural Development Project appraised in 2016 have all (re-)defined their PDO indicators related to sales as a percentage increase in the value of gross sales of the beneficiary POs. This will permit the comparison of results across projects, taking care to consider countries’ specific circumstances influencing sales and market conditions. Furthermore, the Brazil Paraíba project has made an innovative addition to the Results Framework based on Recommendation 7 whereby the Appraisal Package Intermediate Results Indicators include “buyers who fulfill their obligations under the commercialization agreement or business plan”. This first-time inclusion of a buyer-related indicator is defined as the proportion
of total buyers involved in the project-sponsored alliances who meet the terms described in the subproject business plan. Similarly, the Brazil Pernambuco project innovated by including an Intermediate Results Indicator on the maintenance of project-financed productive infrastructure, also linked to Recommendation 7. In that case, the Results Framework was revised at the Mid-Term Review by adding a maintenance indicator for the complementary water and sanitation infrastructure investments: monitoring the percentage of beneficiary producer organizations “with organized arrangements for the management, operation and maintenance of financed productive investments.” By organized arrangements the project refers to: “(i) designated people responsible for it; (ii) an established reserve fund for operation and maintenance (including replacement); and (iii) [producer organization] members are actively paying an agreed and adequate sum on a regular basis (annually) into that fund.” In Practice Box 10 describes an additional, new approach adopted by the Brazil Pernambuco project at Mid-Term to define key success factors of productive alliances.
93. An increasing number of
Productive Alliance projects have
engaged in larger-scale data collection
activities to enable rigorous assessment
of their effectiveness at completion at the producer organization - or even household - level (e.g. Bolivia PAR I, Colombia PAAP, Mexico PSPB, Brazil Pernambuco). Most recent projects have taken the above-mentioned Recommendation 2 seriously and are including evaluation strategies and data collection activities within a year of effectiveness in their M&E design (e.g. Bolivia PAR II). This results-oriented approach can be expected to continue and increase in future PA projects. In Practice Box 11 describes
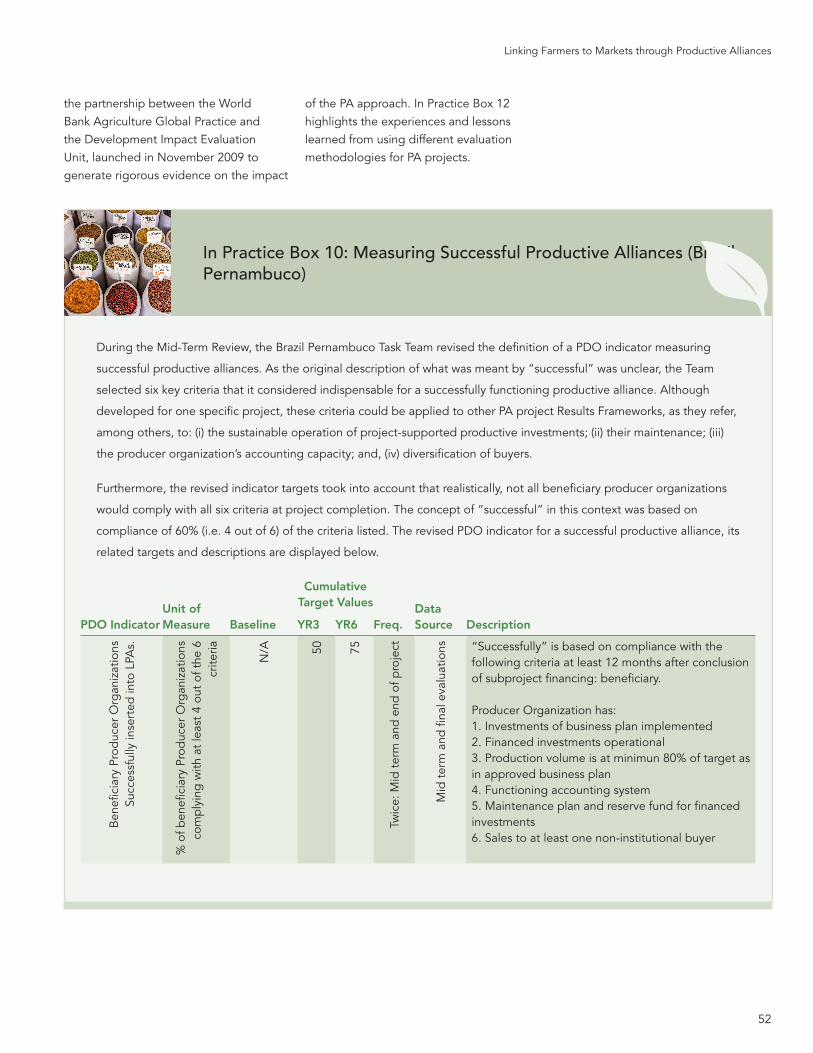
52
Linking Farmers to Markets through Productive Alliances
In Practice Box 10: Measuring Successful Productive Alliances (Brazil Pernambuco)
During the Mid-Term Review, the Brazil Pernambuco Task Team revised the definition of a PDO indicator measuring
successful productive alliances. As the original description of what was meant by “successful” was unclear, the Team
selected six key criteria that it considered indispensable for a successfully functioning productive alliance. Although
developed for one specific project, these criteria could be applied to other PA project Results Frameworks, as they refer,
among others, to: (i) the sustainable operation of project-supported productive investments; (ii) their maintenance; (iii)
the producer organization’s accounting capacity; and, (iv) diversification of buyers.
Furthermore, the revised indicator targets took into account that realistically, not all beneficiary producer organizations
would comply with all six criteria at project completion. The concept of “successful” in this context was based on
compliance of 60% (i.e. 4 out of 6) of the criteria listed. The revised PDO indicator for a successful productive alliance, its
related targets and descriptions are displayed below.
PDO IndicatorUnit of Measure Baseline
Cumulative Target Values
Freq.Data Source DescriptionYR3 YR6
Ben
efici
ary
Prod
ucer
Org
aniz
atio
ns
Succ
essf
ully
inse
rted
into
LPA
s.
% o
f ben
efici
ary
Prod
ucer
Org
aniz
atio
ns
com
ply
ing
with
at
leas
t 4
out
of t
he 6
cr
iteria
N/A 50 75
Twic
e: M
id t
erm
and
end
of p
roje
ct
Mid
ter
m a
nd fi
nal e
valu
atio
ns “Successfully” is based on compliance with the following criteria at least 12 months after conclusion of subproject financing: beneficiary.
Producer Organization has:1. Investments of business plan implemented2. Financed investments operational3. Production volume is at minimun 80% of target as in approved business plan4. Functioning accounting system5. Maintenance plan and reserve fund for financed investments6. Sales to at least one non-institutional buyer
the partnership between the World Bank Agriculture Global Practice and the Development Impact Evaluation Unit, launched in November 2009 to generate rigorous evidence on the impact
of the PA approach. In Practice Box 12 highlights the experiences and lessons learned from using different evaluation methodologies for PA projects.
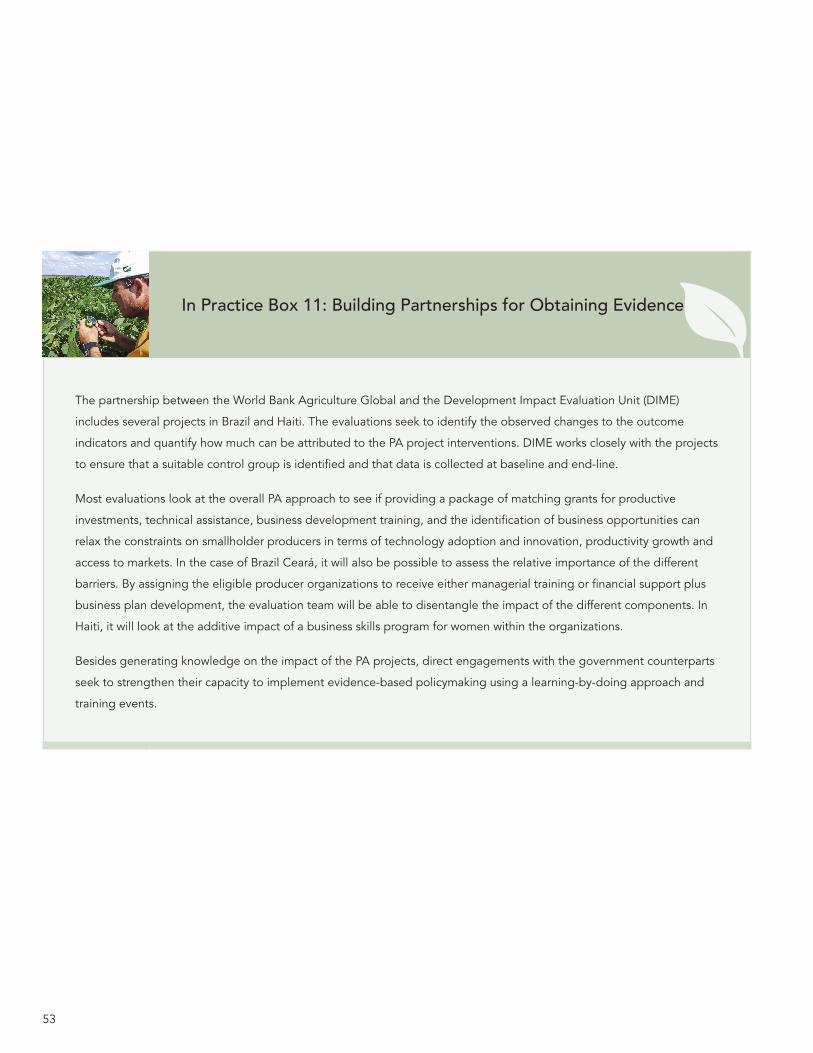
53
In Practice Box 11: Building Partnerships for Obtaining Evidence
The partnership between the World Bank Agriculture Global and the Development Impact Evaluation Unit (DIME)
includes several projects in Brazil and Haiti. The evaluations seek to identify the observed changes to the outcome
indicators and quantify how much can be attributed to the PA project interventions. DIME works closely with the projects
to ensure that a suitable control group is identified and that data is collected at baseline and end-line.
Most evaluations look at the overall PA approach to see if providing a package of matching grants for productive
investments, technical assistance, business development training, and the identification of business opportunities can
relax the constraints on smallholder producers in terms of technology adoption and innovation, productivity growth and
access to markets. In the case of Brazil Ceará, it will also be possible to assess the relative importance of the different
barriers. By assigning the eligible producer organizations to receive either managerial training or financial support plus
business plan development, the evaluation team will be able to disentangle the impact of the different components. In
Haiti, it will look at the additive impact of a business skills program for women within the organizations.
Besides generating knowledge on the impact of the PA projects, direct engagements with the government counterparts
seek to strengthen their capacity to implement evidence-based policymaking using a learning-by-doing approach and
training events.
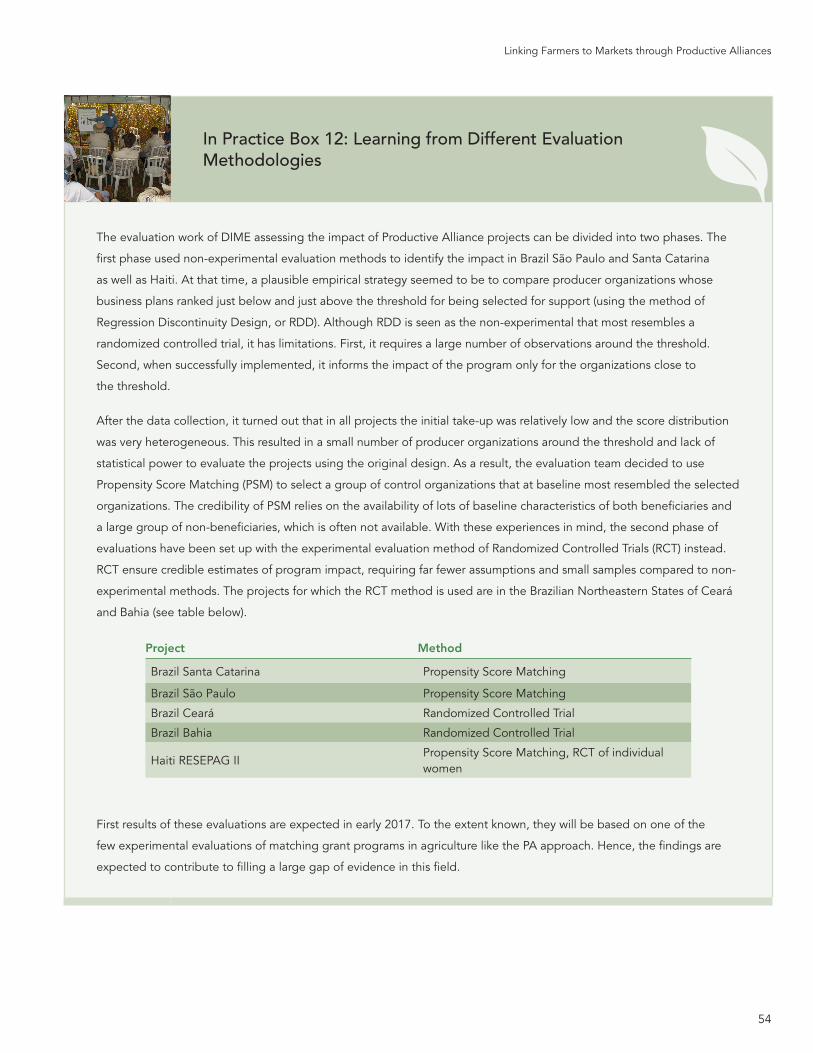
54
Linking Farmers to Markets through Productive Alliances
In Practice Box 12: Learning from Different Evaluation Methodologies
The evaluation work of DIME assessing the impact of Productive Alliance projects can be divided into two phases. The
first phase used non-experimental evaluation methods to identify the impact in Brazil São Paulo and Santa Catarina
as well as Haiti. At that time, a plausible empirical strategy seemed to be to compare producer organizations whose
business plans ranked just below and just above the threshold for being selected for support (using the method of
Regression Discontinuity Design, or RDD). Although RDD is seen as the non-experimental that most resembles a
randomized controlled trial, it has limitations. First, it requires a large number of observations around the threshold.
Second, when successfully implemented, it informs the impact of the program only for the organizations close to
the threshold.
After the data collection, it turned out that in all projects the initial take-up was relatively low and the score distribution
was very heterogeneous. This resulted in a small number of producer organizations around the threshold and lack of
statistical power to evaluate the projects using the original design. As a result, the evaluation team decided to use
Propensity Score Matching (PSM) to select a group of control organizations that at baseline most resembled the selected
organizations. The credibility of PSM relies on the availability of lots of baseline characteristics of both beneficiaries and
a large group of non-beneficiaries, which is often not available. With these experiences in mind, the second phase of
evaluations have been set up with the experimental evaluation method of Randomized Controlled Trials (RCT) instead.
RCT ensure credible estimates of program impact, requiring far fewer assumptions and small samples compared to non-
experimental methods. The projects for which the RCT method is used are in the Brazilian Northeastern States of Ceará
and Bahia (see table below).
Project Method
Brazil Santa Catarina Propensity Score Matching
Brazil São Paulo Propensity Score Matching
Brazil Ceará Randomized Controlled Trial
Brazil Bahia Randomized Controlled Trial
Haiti RESEPAG IIPropensity Score Matching, RCT of individual women
First results of these evaluations are expected in early 2017. To the extent known, they will be based on one of the
few experimental evaluations of matching grant programs in agriculture like the PA approach. Hence, the findings are
expected to contribute to filling a large gap of evidence in this field.

55
10
< 9. Evaluation Strategies
10. Lessons Learned
> 11.Conclusions and Recommendations
56
Linking Farmers to Markets through Productive Alliances
94. Several lessons emerge from
the Productive Alliance experience in
Latin America, which are relevant not only for a particular project but across the PA portfolio and future operations. Although the mode of implementation of the PA approach has varied between countries, the experience has shown that PA projects have succeeded in supporting producer organizations to improve organizational capacity, develop more entrepreneurial mindsets, and to increase the production, product quality, diversity and productivity of the organization’s members. Technical assistance and business development support provided by PA projects on a continuous, medium-term basis have proven to be essential for strengthening POs and laying the ground for entrepreneurial sustainability. In the following, main lessons learned and success factors identified in Implementation Completion and Results
Reports of closed PA projects are presented at the project preparation, implementation, and closing phases.
LESSONS FROM PROJECT PREPARATION 95. More emphasis should be placed
on identifying and analyzing promising
value chains. Such analysis should be done during project preparation and must be based on a realistic assessment of the local/regional comparative advantage in specific value chains. In environments where competition is likely to be limited, as in remote areas with logistical and technical challenges, a pre-investment market study should be carried out to identify potential buyers and understand their size and limitations.
96. Beneficiary targeting and
selection must consider producers’
existing endowments and assess
their ability to comply with market
requirements. Not all small producers have the capacity or risk profile required for market-driven partnership with a buyer. Buyers’ incentives to deal with small producers relate to product quality, volume and timely delivery. Small producers can reach these requirements by being part of a producer organization. However, this collective action cannot overcome a producer’s absolute constraints in access to land and water.
97. Setting realistic outcomes aligned
with project activities and investments
is critical for success. Over-ambitious project targets and unclear indicators can pose significant challenges. For example, increased sales is a challenging indicator of competitiveness in demand-driven
LESSONS LEARNED
57
projects like the PAs, as the exact size of the gains to be made from project investments (in value terms) is difficult to know a priori. Also, the “sales value” indicator (particularly in global commodity sectors) is linked to exogenous factors outside the project’s control, such as changes in commodity prices. Expressing the increase in sales as a percentage of initial sales or in volume terms (in percentage) would be more appropriate. Overall, PDO outcome indicators aligned with gains in productivity, efficiencies, quality improvements, and reduction of postharvest losses seem appropriate for PA projects.
98. Operations involving a multi-
sector approach with different
institutions, components, and areas
of concentration are challenging
to implement. Ground-breaking operations with new borrowers need to be kept simple, use piloting and evaluation for future scale-up, and receive close supervision so that the learning opportunity is optimized and the client is capable of entering a follow-on phase with confidence.
LESSONS FROM PROJECT IMPLEMENTATION99. An open, competitive subproject
selection process based on clearly-
defined technical evaluation criteria
can be crucial for establishing
credibility among stakeholders and
avoiding political interference. PA project beneficiaries have indicated that a competitive process ensured that subprojects were approved based on their merit and viability, leaving few opportunities for financing to be steered by government officials or local authorities to friends and associates.
100. Requiring cash contributions
or bank loans as co-financing from
producers can ensure a stronger
buy-in. The provision of financial resources which are not in-kind creates greater ownership of the success of the supported subproject and allows producer organizations to strengthen their entrepreneurial skills and commitment to the subproject.
101. Accompanying producer
groups over an extended period while
they grow and mature is crucial for
ensuring long-term success. Instead of providing a one-off injection of resources, PA projects should accompany beneficiary producer organizations (and buyers) over the course of their alliance subproject implementation period and into the operational phase, with the goal of building the capacity needed to ensure long-term survival.
102. An assessment of potential
buyers can ensure continuity of a
vertical alliance. In some projects, producer organizations found that their increased productive capacity surpassed their current buyer’s capacity. Measures to mitigate this include improved buyer identification and their market competitiveness and viability, brokerage services for organizations that outgrow their current alliance arrangements, and an increased outreach to potential buyers outside the local sphere.
58
Linking Farmers to Markets through Productive Alliances
103. Capacity-building activities for
producer organizations need to adapt
to specific business needs. In some PA projects, capacity-building of producer organizations has focused on general subproject managerial requirements (e.g. accounting, procurement), which have been of high importance. However, it has also become evident that capacity-building needs to be tailored to the specific functions each producer organization assumes in the vertical alliance established with a buyer. For example, organizations may be asked to reduce transaction costs for producers (e.g. input purchases) and negotiate with current and future partners, but they may also need to operate collective infrastructure (e.g. storage, processing and packaging), or organize the provision of technical assistance services to members. All these needs require specific knowledge, for which support should be included in the business plan.
LESSONS FROM PROJECT CLOSING 104. Productive Alliances can
be a cost-efficient way to boost
productivity, expand production,
improve competitiveness, and link
farmers to markets. A large number of closed PA projects have shown satisfactory financial rates of return and largely achieved their objectives.
105. The Productive Alliance
approach is flexible and can be
adapted to fit the needs of many
different target groups, value chains,
and production environments. It has been an effective tool for targeting not only well-established producer groups and value chains, but has also shown the capacity to include disadvantaged groups successfully.
106. Building broader alliances is
crucial for post-completion operation
and sustainability. Ideally, the borrower country will sustain its commitment to the PA approach and ensure budget support. However, this is often not the case. Hence, mechanisms are needed to graduate from donor dependence to ensure continued support for certain elements of the project. An important role can be played by broader alliances with state agencies and/or municipalities, which in some PA projects were key for some of the successful activities. Such alliances within the broader institutional framework can be strategic partners for further development. Furthermore, alliances with the financial sector such as commercial banks are highly-relevant for financial sustainability.
107. Productive Alliance projects
should develop a plan for the transition
to post-World Bank financing. To ensure that activities move smoothly to government agencies following the closing of the World Bank-financed PA project, an exit strategy should be defined early on. Ideally, transition planning should begin at the time of the Mid-term Review and be monitored continuously thereafter.
59
11
< 10. Lessons Learned
11.Conclusions and Recommendations
60
Linking Farmers to Markets through Productive Alliances
108. This assessment describes the
Productive Alliance approach and
presents the results of a systematic
review of World Bank-financed
Productive Alliances projects across
Latin America and the Caribbean.
The PA approach has been adopted in 21 projects across ten countries with funding of over US$1 billion. Given the recent expansion of the approach to other regions, the findings of this assessment - based on a detailed overview of different PA projects in terms of targeting strategies, subproject selection, implementation, monitoring and evaluation - provide valuable lessons on the different design features and implementation experiences across Latin America since the early 2000s.
109. The concept of the Productive
Alliance approach is based on three
main agents (Producers, Buyers, Public
Sector) and three core inputs and/
or activities (Productive Investments,
Technical Assistance, and Business
Development). As this assessment demonstrates, PA projects can vary in the emphasis given to each individual core element, but all aim to strengthen smallholder producers’ capacity to improve production and competiveness (through horizontal alliances) and access markets through linkages with buyers (through vertical alliances). The distinct types of PA projects can be categorized based on different objectives, degree of organization among beneficiary producers, or end markets. In general, the entry point of the PA approach is the producer organization. In practice, the degree of organizational structure varies greatly, particularly for the case of
(Northeastern) Brazil where projects have transitioned from former Community-Driven Development interventions to the PA approach. As a result, some projects in Brazil have been implemented with producers on the community level and heavily focused on providing production investment support rather than ensuring coordinated sales to buyers. Furthermore, while PA projects outside Brazil seek to establish vertical alliances with private sector commercial markets, Brazilian producers rely heavily on supplying to public institutional markets. Recently, a new emphasis on environmental sustainability and climate smart agriculture has emerged among PA projects, promoting “green” PA as in Mexico or Panama. Similarly, a greater focus has been placed on beneficiary targeting and social inclusion of vulnerable groups in PA projects, and in some cases on their nutritional effects. This amplification of objectives and related co-benefits demonstrates the flexibility of the PA approach, while preserving its core objective of smallholder integration in agricultural value chains.
110. The effectiveness of completed
Productive Alliance projects has been
assessed in terms of scope, social
inclusion, socio-economic impacts,
efficiency and and sustainabilty. In general, the PA approach has been successful in reaching smallholder producers and including vulnerable groups like women, indigenous peoples and young producers. The available evidence points to the PA approach as having led to increases in smallholder producers’ production volume,
productivity, and access to improved inputs and productive equipment, as well as integration into new markets. Furthermore, beneficiary producers have been found to benefit from (i) better product quality and diversification, (ii) increased sales volume and prices, and hence (iii) higher income. Also, a few PA projects have assessed their effect on employment generation and quality, which have largely been positive. Results from beneficiary and stakeholder surveys of PA projects have highlighted their prominent role in capacity-building and in institutional strengthening of producer organizations and implementing agencies. Finally, ex-post Economic and Financial Analyses have shown that most PA projects have acceptable internal rate of returns, although performance is highly variable across different value chains.
111. The following recommendations
consider the needs for strengthening
future projects to enhance the impact
and sustainability of the Productive
Alliance approach, in consideration of the achievements and lessons learned described in this assessment:12
» Productive Alliance projects need
to prominently promote building
broader alliances through a stronger
involvement of local actors in
the enabling environment (e.g.
municipalities, local chambers of
commerce, NGOs) in the initial
subproject selection process and in the
supervision of their implementation.
This would not only enable them to
tap into local knowledge and business
opportunities, but also to better
integrate the alliance subprojects in
CONCLUSIONS AND RECOMMENDATIONS
61
municipal development plans and
related investments and services.
» Productive Alliance projects could
develop and adopt a more systematic
approach linking beneficiary producers
with the commercial financial
sector. This might be done through
guarantees provided by the overall
project to stimulate the willingness
of financial intuitions to co-finance a
significant part of the business plan
through a loan. A good example is
the Honduras COMRURAL project,
which requires a financial institution to
be part of the commercial agreement
from the beginning. Furthermore,
PA projects could increasingly focus
on meeting other financing needs
of producers, such as payment
systems, insurance, or savings.
» Productive Alliance projects need
to more intensively promote the
diversification of buyers and markets
to which beneficiary producers are
seeking to connect. A more diversified
portfolio of offtake markets can
serve as an instrument to increase
producers’ resilience to external
shocks (e.g. negative economic
or climatic events) and to protect
producers from exploitative behavior
by buyers (especially in imperfect
market environments. Diversification
is especially important for the case of
Brazil, where producers rely heavily
on selling most of their production
to institutional markets (e.g. school
feeding programs, public hospitals,
and the like). Similarly, diversification
of products (in addition to the main
project-supported products) could be
promoted by future PA projects as well.
» Productive Alliance projects might
consider adopting a multi-sector
approach, where appropriate and
desired by the client. Some, recent PA
projects have already done this (e.g.
Mexico SPSB, Panama PRORURAL) by
adding to their typical socio-economic
development objectives certain
desirable higher-level objectives related
to: (i) environmental sustainability
(“productive landscapes”); (ii) social
inclusion and to a lesser extent
(iii) nutrition. Given its flexibility in
design and implementation, the PA
approach is adaptable and can be
used to address several objectives
in a more holistic manner.
» Productive Alliance projects should
incorporate an impact evaluation
strategy and respective budget early
in their design stage. As this report
has documented, despite widespread
application of the Productive Alliance
approach, little large-scale, rigorous
evidence exists on its effectiveness
at the producer organization and
household level. Because of this lack
of evidence, key design questions are
as yet, unanswerable. For example,
a primary issue resulting from this
assessment is how the performance of
conditional PA projects relates to their
unconditional counterparts. Although
conditional PA seem intuitively more
effective at integrating producers
into markets, there is insufficient
evidence to explain the basis for
this intuition. Therefore, future PA
projects should include relevant
evaluation questions in their results
monitoring design and incorporate
baseline and impact evaluation data
collection in their budget planning.
12. Further areas of attention in future projects and proposed actions to address them are described in Annex 10.
62
Linking Farmers to Markets through Productive Alliances
This Annex briefly describes in
chronological order the 21 Productive
Alliance projects that had been
implemented across ten countries in
Latin America and the Caribbean.
In Colombia, the first Productive
Partnerships Support Project (PAAP I) was
implemented between May 2002 and
September 2008. The Project Development
Objective (PDO) was to generate income,
create employment, and promote social
cohesion of poor rural communities in an
economic and environmentally sustainable
manner through the development and
implementation of a demand-driven
productive alliance scheme with the
private sector. The main intervention
mechanism consisted of matching grants
for participating smallholder producer
organizations to co-finance productive
investments, complemented by technical
assistance, supervision, and training for
the productive partners. The actual total
project costs amounted to US$30 million,
of which US$22 million were funded by
the International Bank for Reconstruction
and Development (IBRD) and US$8.44
million by the Government of Colombia.
At project completion, US$19.7 million
had been provided as grant investment
support to 136 vertical alliances, directly
benefiting 11,714 producer households.
A follow-on, Colombia Second Rural
Productive Partnerships Project (PAAP
II) started in January 2008 and closed
in June 2015. The PDO was to increase
rural competitiveness and build up rural
entrepreneurship in poor rural communities
in a sustainable manner through demand-
driven partnership schemes with the
commercial private sector. Project cost
estimated at appraisal was US$122.40
ANNEX 1 DESCRIPTIONS PA PROJECTS IN LATIN AMERICA AND THE CARIBBEAN
million, of which IBRD provided US$30
million. A distinguishing feature of PAAP II
was its ability to leverage funding from the
public and private sectors. At completion,
the total cost of the second phase was
well beyond appraisal estimates and
amounted to US$346 million, of which
US$190 million were contributed by the
producer organizations themselves, US$90
million by the national government, US$32
million by local governments, and US30
million by IBRD as planned. In total, 744
productive alliances were financed, directly
benefiting over 45,000 producer households
in 31 of the country’s 32 Departments.
In Bolivia, the Rural Alliances Project
(PAR I) was implemented between May
2006 and March 2014. The PDO was
to test a model to improve accessibility
to markets for poor rural producers in
selected pilot areas by: (i) promoting
strategic productive alliances between
different economic actors at the local level,
(ii) empowering rural producers through
the development of self-managed grass-
root organizations, (iii) increasing access
to productive assets and technology, and
iv) promoting more effective, responsive
and accountable service organizations
at the local level. The estimated total
project cost at appraisal was US$34.88
million, of which US$28.40 million were
planned to be financed by the International
Development Association (IDA), US$5.54
million by producer organizations, and
US$0.95 million by municipal governments.
In 2009, an Additional Financing (AF) of
US$36.57 million was approved, comprising
an additional US$30 million IDA credit,
US$5.71 from producers’ organizations,
and US$0.86 million from municipal
governments. At completion, the total
project cost amounted to US$79.7 million,
with the contribution of US$19.8 million by
the producer organizations and municipal
governments being nearly 50% higher
than estimated. In total, the project had
financed 768 productive alliances and
counted 28,527 direct beneficiaries.
A follow-on Bolivia Second Rural Alliance
Project (PAR II) started in September 2013
and the estimated closing date is November
2017. The PDO was slightly modified
from PAR I to improving accessibility
to markets for small rural producers in
selected areas by: (i) promoting productive
alliances between different small rural
producer organizations and purchasers;
(ii) empowering rural producers through
the establishment and strengthening of
self-managed grass-root organizations;
(iii) increasing access to productive assets,
technology and financial services; (iv)
promoting more effective, responsive and
accountable service organizations at the
local level; and, (v) enhancing environmental
sustainability of productive practices. The
total project cost is estimated at US$64.54
million, comprising a US$50 million IDA
credit and co-financing of US$13.50
million from producer organizations and
US$1.04 million from municipalities.
According to the Results Framework, the
project aims to establish 645 productive
alliances that will directly benefit 25,000
poor rural households, most of which are
indigenous peoples. Moreover, the project
is expected to fund municipal subprojects
(e.g. rural road rehabilitation, small bridges)
to benefit about 10,100 households.
In Guatemala, IBRD co-financed
together with the Inter-American
Development Bank (IADB) the Rural
Economic Development Program (PDER),
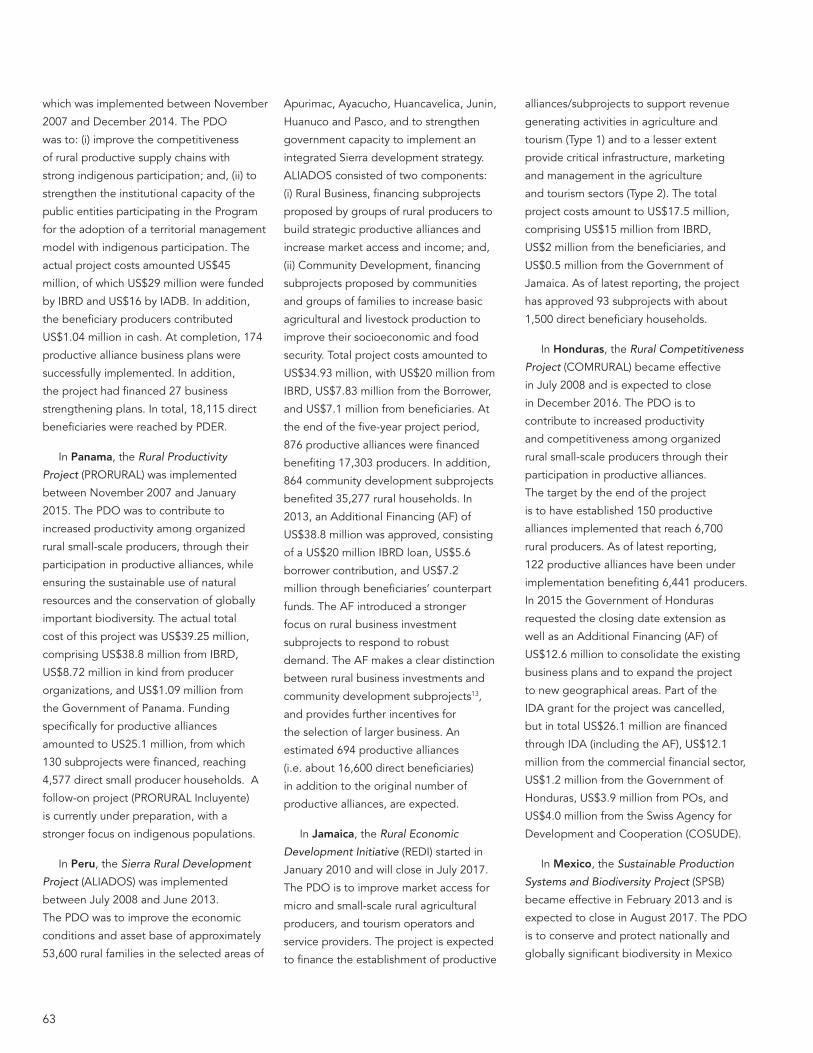
63
which was implemented between November
2007 and December 2014. The PDO
was to: (i) improve the competitiveness
of rural productive supply chains with
strong indigenous participation; and, (ii) to
strengthen the institutional capacity of the
public entities participating in the Program
for the adoption of a territorial management
model with indigenous participation. The
actual project costs amounted US$45
million, of which US$29 million were funded
by IBRD and US$16 by IADB. In addition,
the beneficiary producers contributed
US$1.04 million in cash. At completion, 174
productive alliance business plans were
successfully implemented. In addition,
the project had financed 27 business
strengthening plans. In total, 18,115 direct
beneficiaries were reached by PDER.
In Panama, the Rural Productivity
Project (PRORURAL) was implemented
between November 2007 and January
2015. The PDO was to contribute to
increased productivity among organized
rural small-scale producers, through their
participation in productive alliances, while
ensuring the sustainable use of natural
resources and the conservation of globally
important biodiversity. The actual total
cost of this project was US$39.25 million,
comprising US$38.8 million from IBRD,
US$8.72 million in kind from producer
organizations, and US$1.09 million from
the Government of Panama. Funding
specifically for productive alliances
amounted to US25.1 million, from which
130 subprojects were financed, reaching
4,577 direct small producer households. A
follow-on project (PRORURAL Incluyente)
is currently under preparation, with a
stronger focus on indigenous populations.
In Peru, the Sierra Rural Development
Project (ALIADOS) was implemented
between July 2008 and June 2013.
The PDO was to improve the economic
conditions and asset base of approximately
53,600 rural families in the selected areas of
Apurimac, Ayacucho, Huancavelica, Junin,
Huanuco and Pasco, and to strengthen
government capacity to implement an
integrated Sierra development strategy.
ALIADOS consisted of two components:
(i) Rural Business, financing subprojects
proposed by groups of rural producers to
build strategic productive alliances and
increase market access and income; and,
(ii) Community Development, financing
subprojects proposed by communities
and groups of families to increase basic
agricultural and livestock production to
improve their socioeconomic and food
security. Total project costs amounted to
US$34.93 million, with US$20 million from
IBRD, US$7.83 million from the Borrower,
and US$7.1 million from beneficiaries. At
the end of the five-year project period,
876 productive alliances were financed
benefiting 17,303 producers. In addition,
864 community development subprojects
benefited 35,277 rural households. In
2013, an Additional Financing (AF) of
US$38.8 million was approved, consisting
of a US$20 million IBRD loan, US$5.6
borrower contribution, and US$7.2
million through beneficiaries’ counterpart
funds. The AF introduced a stronger
focus on rural business investment
subprojects to respond to robust
demand. The AF makes a clear distinction
between rural business investments and
community development subprojects13,
and provides further incentives for
the selection of larger business. An
estimated 694 productive alliances
(i.e. about 16,600 direct beneficiaries)
in addition to the original number of
productive alliances, are expected.
In Jamaica, the Rural Economic
Development Initiative (REDI) started in
January 2010 and will close in July 2017.
The PDO is to improve market access for
micro and small-scale rural agricultural
producers, and tourism operators and
service providers. The project is expected
to finance the establishment of productive
alliances/subprojects to support revenue
generating activities in agriculture and
tourism (Type 1) and to a lesser extent
provide critical infrastructure, marketing
and management in the agriculture
and tourism sectors (Type 2). The total
project costs amount to US$17.5 million,
comprising US$15 million from IBRD,
US$2 million from the beneficiaries, and
US$0.5 million from the Government of
Jamaica. As of latest reporting, the project
has approved 93 subprojects with about
1,500 direct beneficiary households.
In Honduras, the Rural Competitiveness
Project (COMRURAL) became effective
in July 2008 and is expected to close
in December 2016. The PDO is to
contribute to increased productivity
and competitiveness among organized
rural small-scale producers through their
participation in productive alliances.
The target by the end of the project
is to have established 150 productive
alliances implemented that reach 6,700
rural producers. As of latest reporting,
122 productive alliances have been under
implementation benefiting 6,441 producers.
In 2015 the Government of Honduras
requested the closing date extension as
well as an Additional Financing (AF) of
US$12.6 million to consolidate the existing
business plans and to expand the project
to new geographical areas. Part of the
IDA grant for the project was cancelled,
but in total US$26.1 million are financed
through IDA (including the AF), US$12.1
million from the commercial financial sector,
US$1.2 million from the Government of
Honduras, US$3.9 million from POs, and
US$4.0 million from the Swiss Agency for
Development and Cooperation (COSUDE).
In Mexico, the Sustainable Production
Systems and Biodiversity Project (SPSB)
became effective in February 2013 and is
expected to close in August 2017. The PDO
is to conserve and protect nationally and
globally significant biodiversity in Mexico
64
Linking Farmers to Markets through Productive Alliances
through mainstreaming biodiversity-friendly
management practices in productive
landscapes in priority biological corridors.
The total project cost amounts to US$30.89
million, including US$11.69 million from
the Global Environmental Facility (GEF)
and US$19.2 million from the Federal
Government. 185 producers groups
have been participating in biodiversity-
friendly production initiatives, directly
benefiting nearly 16,000 producers.
In Haiti, the Strengthening Agriculture
Public Services II Project (RESEPAG II)
became effective in April 2012 and is
expected to be completed in June 2018.
The PDO is to: (i) reinforce the capacity
of the Ministry of Agriculture, Natural
Resources and Rural Development to
provide or facilitate access to services in
the agricultural sector; (ii) increase market
access to small producers and food security
in selected areas, and, (iii) provide financial
assistance in the case of an Agriculture
Sector Emergency. The total project cost
is US50 million, of which US$40 million are
from IDA and US$10 million from the Global
Agriculture and Food Security Program
Trust Fund (GAFSP). The establishment
of productive alliances is linked to
Component 2, which is financed with US$
36 million. As of June 2016, 51 matching
grant subprojects were implemented in
the North/North Eastern Departments,
directly benefiting over 10,000 households.
Additional subprojects were expected to
be approved as the screening of further
subproject proposals was underway.
In Brazil, ten projects with a productive
alliance component started operating in
2007, but the majority became effective
more recently, from 2010 onwards. As
mentioned in the main text, the projects in
Brazil are typically multi-sector operations,
in which productive alliances constitute
only one of several project components.
The projects in Brazil in chronological
order of their starting date are: Pará
Integrated Rural Development Project
(2007-2014), Alto Solimôes Basic Services
and Sustainable Development Project
(2008-2014), Sergipe Integrated Project
(2009-2012), São Paulo Sustainable Rural
Development and Access to Markets Project
(2010-2017), Rio de Janeiro Sustainable
Rural Development Project (2010-2016),
Santa Catarina Rural Competitiveness
Project (2010-2016), Pernambuco Rural
Economic Inclusion Project (2012-2019),
Ceará Rural Sustainable Development
and Competitiveness Project (2012-2016),
Parana Multi Sector Development Project
(2013-2018 with extension/Additional
Financing), and Bahia Sustainable Rural
Development Project (2014-2021).
13. The Additional Financing PERU ALIADOS ensures that territorial development subprojects are not used to promote market- oriented activities and that they maintain their focus on poverty-reduction and natural resources management.
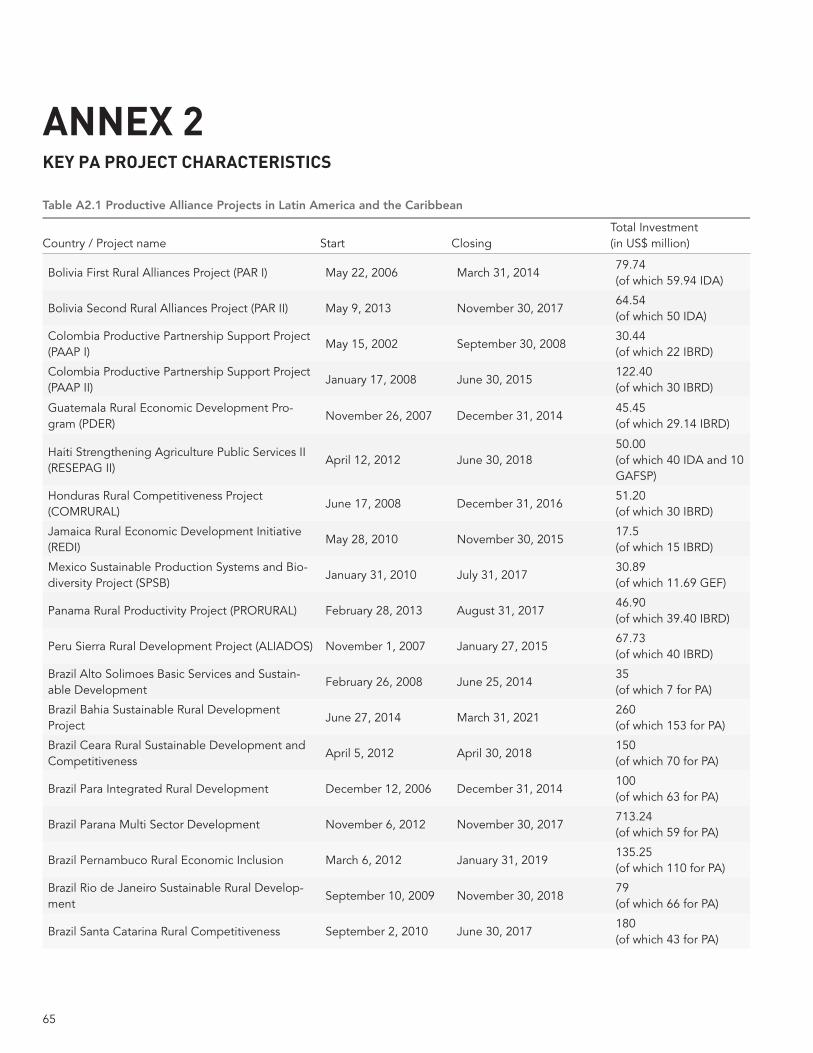
65
ANNEX 2 KEY PA PROJECT CHARACTERISTICS
Table A2.1 Productive Alliance Projects in Latin America and the Caribbean
Country / Project name Start ClosingTotal Investment (in US$ million)
Bolivia First Rural Alliances Project (PAR I) May 22, 2006 March 31, 201479.74 (of which 59.94 IDA)
Bolivia Second Rural Alliances Project (PAR II) May 9, 2013 November 30, 201764.54 (of which 50 IDA)
Colombia Productive Partnership Support Project (PAAP I)
May 15, 2002 September 30, 200830.44 (of which 22 IBRD)
Colombia Productive Partnership Support Project (PAAP II)
January 17, 2008 June 30, 2015122.40 (of which 30 IBRD)
Guatemala Rural Economic Development Pro-gram (PDER)
November 26, 2007 December 31, 201445.45(of which 29.14 IBRD)
Haiti Strengthening Agriculture Public Services II (RESEPAG II)
April 12, 2012 June 30, 201850.00 (of which 40 IDA and 10 GAFSP)
Honduras Rural Competitiveness Project (COMRURAL)
June 17, 2008 December 31, 201651.20 (of which 30 IBRD)
Jamaica Rural Economic Development Initiative (REDI)
May 28, 2010 November 30, 201517.5 (of which 15 IBRD)
Mexico Sustainable Production Systems and Bio-diversity Project (SPSB)
January 31, 2010 July 31, 201730.89 (of which 11.69 GEF)
Panama Rural Productivity Project (PRORURAL) February 28, 2013 August 31, 201746.90 (of which 39.40 IBRD)
Peru Sierra Rural Development Project (ALIADOS) November 1, 2007 January 27, 201567.73 (of which 40 IBRD)
Brazil Alto Solimoes Basic Services and Sustain-able Development
February 26, 2008 June 25, 201435 (of which 7 for PA)
Brazil Bahia Sustainable Rural Development Project
June 27, 2014 March 31, 2021260 (of which 153 for PA)
Brazil Ceara Rural Sustainable Development and Competitiveness
April 5, 2012 April 30, 2018150 (of which 70 for PA)
Brazil Para Integrated Rural Development December 12, 2006 December 31, 2014100 (of which 63 for PA)
Brazil Parana Multi Sector Development November 6, 2012 November 30, 2017713.24 (of which 59 for PA)
Brazil Pernambuco Rural Economic Inclusion March 6, 2012 January 31, 2019135.25 (of which 110 for PA)
Brazil Rio de Janeiro Sustainable Rural Develop-ment
September 10, 2009 November 30, 201879 (of which 66 for PA)
Brazil Santa Catarina Rural Competitiveness September 2, 2010 June 30, 2017180 (of which 43 for PA)
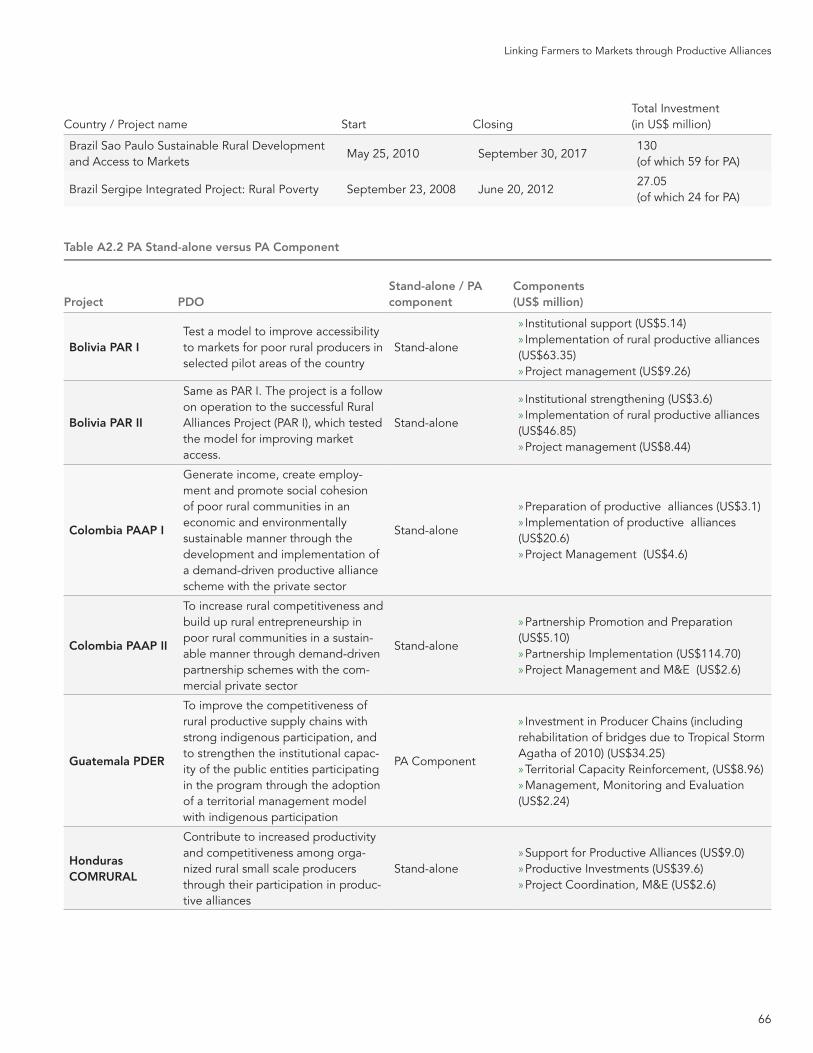
66
Linking Farmers to Markets through Productive Alliances
Country / Project name Start ClosingTotal Investment (in US$ million)
Brazil Sao Paulo Sustainable Rural Development and Access to Markets
May 25, 2010 September 30, 2017130 (of which 59 for PA)
Brazil Sergipe Integrated Project: Rural Poverty September 23, 2008 June 20, 201227.05 (of which 24 for PA)
Table A2.2 PA Stand-alone versus PA Component
Project PDOStand-alone / PA component
Components (US$ million)
Bolivia PAR ITest a model to improve accessibility to markets for poor rural producers in selected pilot areas of the country
Stand-alone
» Institutional support (US$5.14) » Implementation of rural productive alliances
(US$63.35) » Project management (US$9.26)
Bolivia PAR II
Same as PAR I. The project is a follow on operation to the successful Rural Alliances Project (PAR I), which tested the model for improving market access.
Stand-alone
» Institutional strengthening (US$3.6) » Implementation of rural productive alliances
(US$46.85) » Project management (US$8.44)
Colombia PAAP I
Generate income, create employ-ment and promote social cohesion of poor rural communities in an economic and environmentally sustainable manner through the development and implementation of a demand-driven productive alliance scheme with the private sector
Stand-alone
» Preparation of productive alliances (US$3.1) » Implementation of productive alliances
(US$20.6) » Project Management (US$4.6)
Colombia PAAP II
To increase rural competitiveness and build up rural entrepreneurship in poor rural communities in a sustain-able manner through demand-driven partnership schemes with the com-mercial private sector
Stand-alone
» Partnership Promotion and Preparation (US$5.10) » Partnership Implementation (US$114.70) » Project Management and M&E (US$2.6)
Guatemala PDER
To improve the competitiveness of rural productive supply chains with strong indigenous participation, and to strengthen the institutional capac-ity of the public entities participating in the program through the adoption of a territorial management model with indigenous participation
PA Component
» Investment in Producer Chains (including rehabilitation of bridges due to Tropical Storm Agatha of 2010) (US$34.25) » Territorial Capacity Reinforcement, (US$8.96) » Management, Monitoring and Evaluation
(US$2.24)
Honduras COMRURAL
Contribute to increased productivity and competitiveness among orga-nized rural small scale producers through their participation in produc-tive alliances
Stand-alone » Support for Productive Alliances (US$9.0) » Productive Investments (US$39.6) » Project Coordination, M&E (US$2.6)
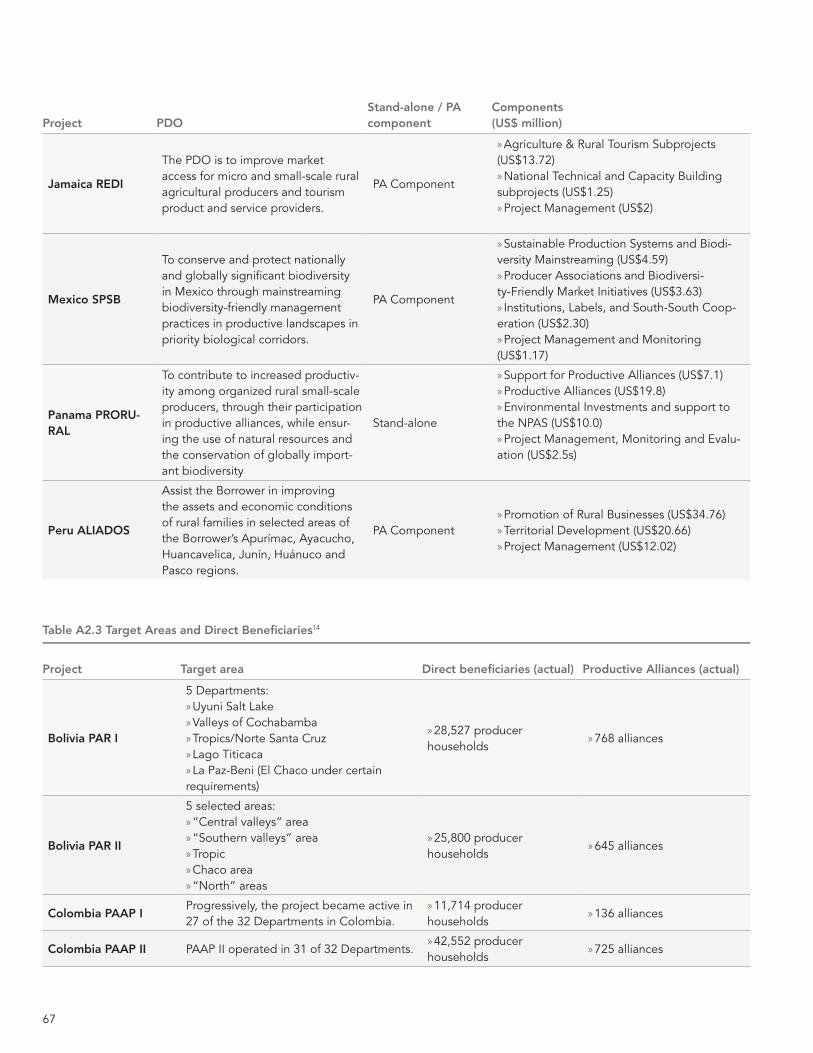
67
Project PDOStand-alone / PA component
Components (US$ million)
Jamaica REDI
The PDO is to improve market access for micro and small-scale rural agricultural producers and tourism product and service providers.
PA Component
» Agriculture & Rural Tourism Subprojects (US$13.72) » National Technical and Capacity Building
subprojects (US$1.25) » Project Management (US$2)
Mexico SPSB
To conserve and protect nationally and globally significant biodiversity in Mexico through mainstreaming biodiversity-friendly management practices in productive landscapes in priority biological corridors.
PA Component
» Sustainable Production Systems and Biodi-versity Mainstreaming (US$4.59) » Producer Associations and Biodiversi-
ty-Friendly Market Initiatives (US$3.63) » Institutions, Labels, and South-South Coop-
eration (US$2.30) » Project Management and Monitoring
(US$1.17)
Panama PRORU-RAL
To contribute to increased productiv-ity among organized rural small-scale producers, through their participation in productive alliances, while ensur-ing the use of natural resources and the conservation of globally import-ant biodiversity
Stand-alone
» Support for Productive Alliances (US$7.1) » Productive Alliances (US$19.8) » Environmental Investments and support to
the NPAS (US$10.0) » Project Management, Monitoring and Evalu-
ation (US$2.5s)
Peru ALIADOS
Assist the Borrower in improving the assets and economic conditions of rural families in selected areas of the Borrower’s Apurímac, Ayacucho, Huancavelica, Junín, Huánuco and Pasco regions.
PA Component » Promotion of Rural Businesses (US$34.76) » Territorial Development (US$20.66) » Project Management (US$12.02)
Table A2.3 Target Areas and Direct Beneficiaries14
Project Target area Direct beneficiaries (actual) Productive Alliances (actual)
Bolivia PAR I
5 Departments: » Uyuni Salt Lake » Valleys of Cochabamba » Tropics/Norte Santa Cruz » Lago Titicaca » La Paz-Beni (El Chaco under certain
requirements)
» 28,527 producer households
» 768 alliances
Bolivia PAR II
5 selected areas: » “Central valleys” area » “Southern valleys” area » Tropic » Chaco area » “North” areas
» 25,800 producer households
» 645 alliances
Colombia PAAP IProgressively, the project became active in 27 of the 32 Departments in Colombia.
» 11,714 producer households
» 136 alliances
Colombia PAAP II PAAP II operated in 31 of 32 Departments. » 42,552 producer
households » 725 alliances
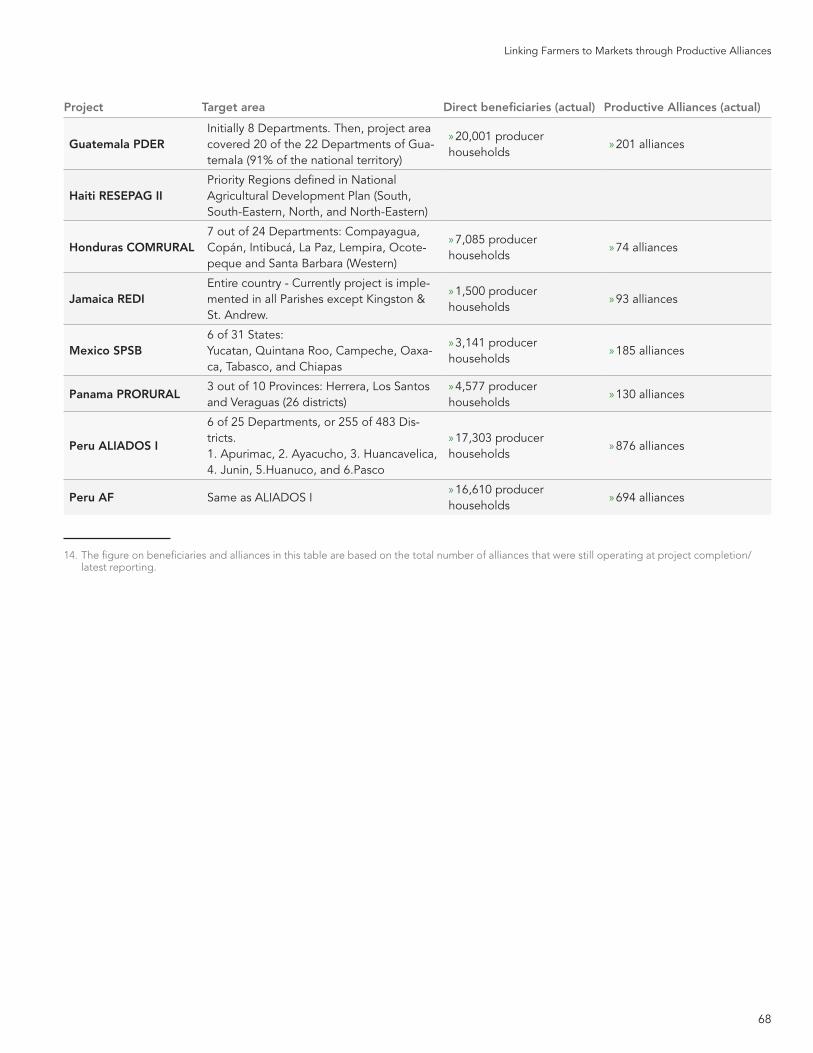
68
Linking Farmers to Markets through Productive Alliances
14. The figure on beneficiaries and alliances in this table are based on the total number of alliances that were still operating at project completion/latest reporting.
Project Target area Direct beneficiaries (actual) Productive Alliances (actual)
Guatemala PDER Initially 8 Departments. Then, project area covered 20 of the 22 Departments of Gua-temala (91% of the national territory)
» 20,001 producer households
» 201 alliances
Haiti RESEPAG IIPriority Regions defined in National Agricultural Development Plan (South, South-Eastern, North, and North-Eastern)
Honduras COMRURAL7 out of 24 Departments: Compayagua, Copán, Intibucá, La Paz, Lempira, Ocote-peque and Santa Barbara (Western)
» 7,085 producer households
» 74 alliances
Jamaica REDI Entire country - Currently project is imple-mented in all Parishes except Kingston & St. Andrew.
» 1,500 producer households
» 93 alliances
Mexico SPSB 6 of 31 States:Yucatan, Quintana Roo, Campeche, Oaxa-ca, Tabasco, and Chiapas
» 3,141 producer households
» 185 alliances
Panama PRORURAL 3 out of 10 Provinces: Herrera, Los Santos and Veraguas (26 districts)
» 4,577 producer households
» 130 alliances
Peru ALIADOS I
6 of 25 Departments, or 255 of 483 Dis-tricts. 1. Apurimac, 2. Ayacucho, 3. Huancavelica, 4. Junin, 5.Huanuco, and 6.Pasco
» 17,303 producer households
» 876 alliances
Peru AF Same as ALIADOS I » 16,610 producer
households » 694 alliances
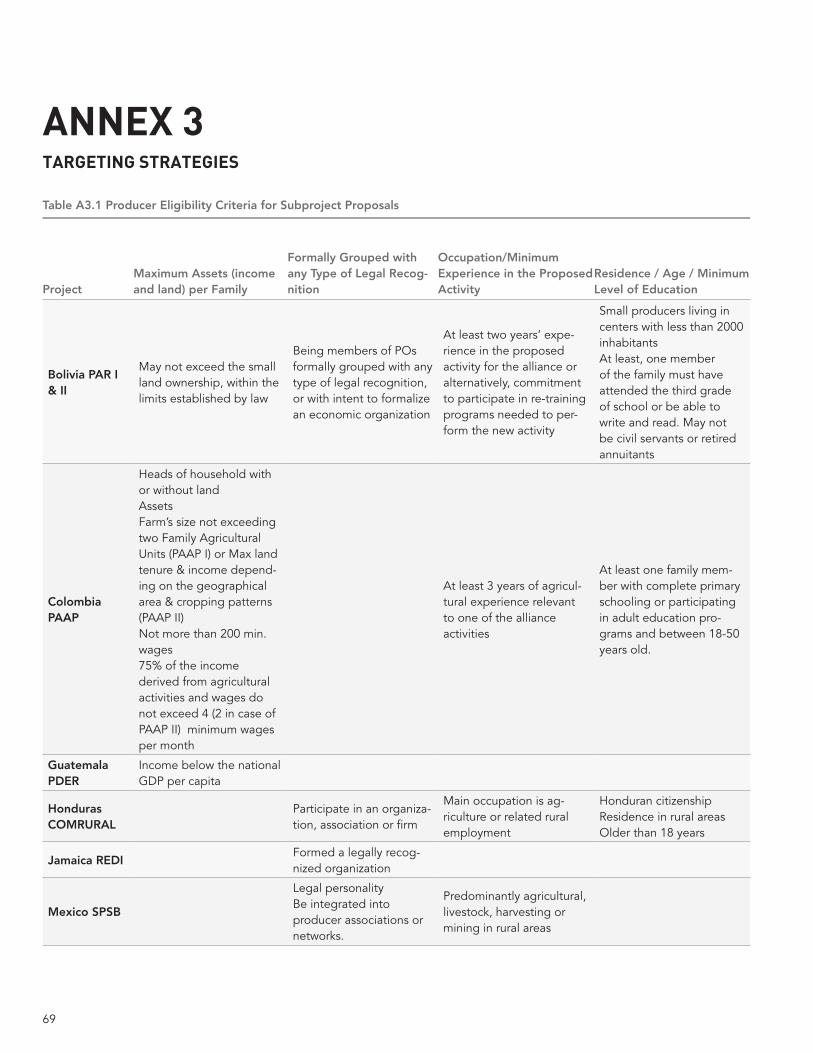
69
ANNEX 3
TARGETING STRATEGIES
Table A3.1 Producer Eligibility Criteria for Subproject Proposals
ProjectMaximum Assets (income and land) per Family
Formally Grouped with any Type of Legal Recog-nition
Occupation/Minimum Experience in the Proposed Activity
Residence / Age / Minimum Level of Education
Bolivia PAR I & II
May not exceed the small land ownership, within the limits established by law
Being members of POs formally grouped with any type of legal recognition, or with intent to formalize an economic organization
At least two years’ expe-rience in the proposed activity for the alliance or alternatively, commitment to participate in re-training programs needed to per-form the new activity
Small producers living in centers with less than 2000 inhabitantsAt least, one member of the family must have attended the third grade of school or be able to write and read. May not be civil servants or retired annuitants
Colombia PAAP
Heads of household with or without landAssetsFarm’s size not exceeding two Family Agricultural Units (PAAP I) or Max land tenure & income depend-ing on the geographical area & cropping patterns (PAAP II)Not more than 200 min. wages75% of the income derived from agricultural activities and wages do not exceed 4 (2 in case of PAAP II) minimum wages per month
At least 3 years of agricul-tural experience relevant to one of the alliance activities
At least one family mem-ber with complete primary schooling or participating in adult education pro-grams and between 18-50 years old.
Guatemala PDER
Income below the national GDP per capita
Honduras COMRURAL
Participate in an organiza-tion, association or firm
Main occupation is ag-riculture or related rural employment
Honduran citizenshipResidence in rural areasOlder than 18 years
Jamaica REDI Formed a legally recog-nized organization
Mexico SPSB
Legal personality Be integrated into producer associations or networks.
Predominantly agricultural, livestock, harvesting or mining in rural areas
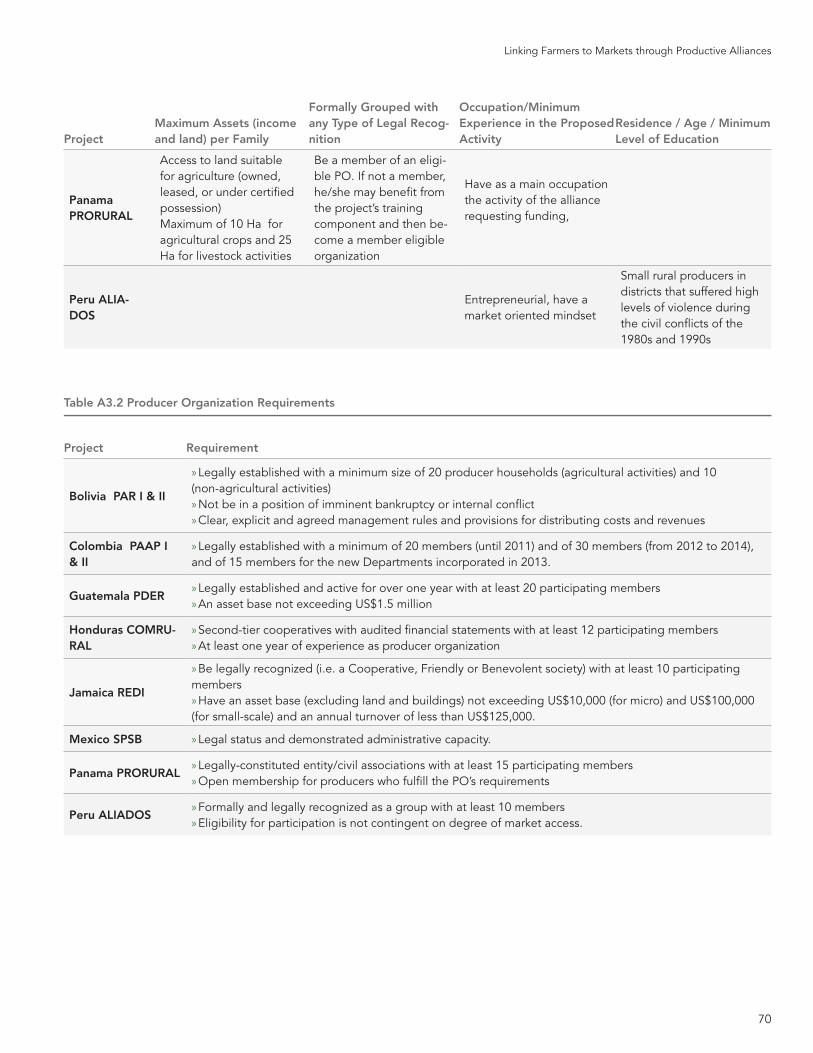
70
Linking Farmers to Markets through Productive Alliances
ProjectMaximum Assets (income and land) per Family
Formally Grouped with any Type of Legal Recog-nition
Occupation/Minimum Experience in the Proposed Activity
Residence / Age / Minimum Level of Education
Panama PRORURAL
Access to land suitable for agriculture (owned, leased, or under certified possession)Maximum of 10 Ha for agricultural crops and 25 Ha for livestock activities
Be a member of an eligi-ble PO. If not a member, he/she may benefit from the project’s training component and then be-come a member eligible organization
Have as a main occupation the activity of the alliance requesting funding,
Peru ALIA-DOS
Entrepreneurial, have a market oriented mindset
Small rural producers in districts that suffered high levels of violence during the civil conflicts of the 1980s and 1990s
Table A3.2 Producer Organization Requirements
Project Requirement
Bolivia PAR I & II
» Legally established with a minimum size of 20 producer households (agricultural activities) and 10 (non-agricultural activities) » Not be in a position of imminent bankruptcy or internal conflict » Clear, explicit and agreed management rules and provisions for distributing costs and revenues
Colombia PAAP I & II
» Legally established with a minimum of 20 members (until 2011) and of 30 members (from 2012 to 2014), and of 15 members for the new Departments incorporated in 2013.
Guatemala PDER » Legally established and active for over one year with at least 20 participating members » An asset base not exceeding US$1.5 million
Honduras COMRU-RAL
» Second-tier cooperatives with audited financial statements with at least 12 participating members » At least one year of experience as producer organization
Jamaica REDI
» Be legally recognized (i.e. a Cooperative, Friendly or Benevolent society) with at least 10 participating members » Have an asset base (excluding land and buildings) not exceeding US$10,000 (for micro) and US$100,000
(for small-scale) and an annual turnover of less than US$125,000.
Mexico SPSB » Legal status and demonstrated administrative capacity.
Panama PRORURAL » Legally-constituted entity/civil associations with at least 15 participating members » Open membership for producers who fulfill the PO’s requirements
Peru ALIADOS » Formally and legally recognized as a group with at least 10 members » Eligibility for participation is not contingent on degree of market access.
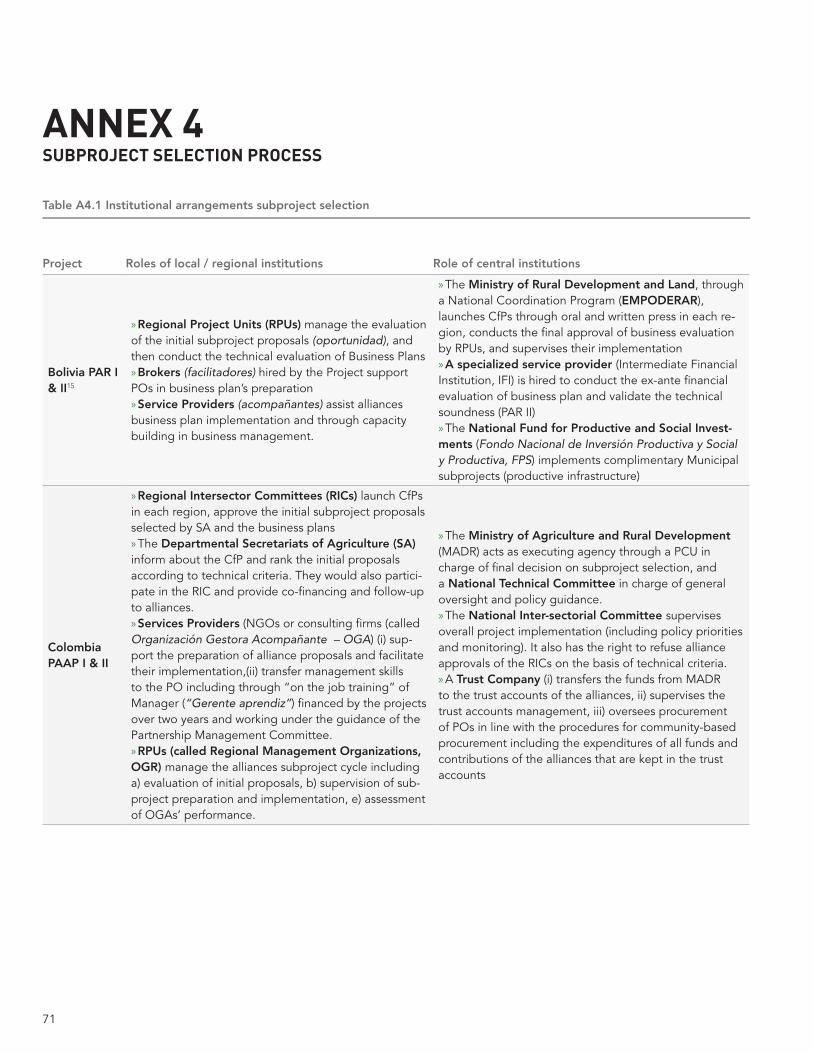
71
ANNEX 4 SUBPROJECT SELECTION PROCESS
Table A4.1 Institutional arrangements subproject selection
Project Roles of local / regional institutions Role of central institutions
Bolivia PAR I & II15
» Regional Project Units (RPUs) manage the evaluation of the initial subproject proposals (oportunidad), and then conduct the technical evaluation of Business Plans » Brokers (facilitadores) hired by the Project support
POs in business plan’s preparation » Service Providers (acompañantes) assist alliances
business plan implementation and through capacity building in business management.
» The Ministry of Rural Development and Land, through a National Coordination Program (EMPODERAR), launches CfPs through oral and written press in each re-gion, conducts the final approval of business evaluation by RPUs, and supervises their implementation » A specialized service provider (Intermediate Financial
Institution, IFI) is hired to conduct the ex-ante financial evaluation of business plan and validate the technical soundness (PAR II) » The National Fund for Productive and Social Invest-
ments (Fondo Nacional de Inversión Productiva y Social y Productiva, FPS) implements complimentary Municipal subprojects (productive infrastructure)
Colombia PAAP I & II
» Regional Intersector Committees (RICs) launch CfPs in each region, approve the initial subproject proposals selected by SA and the business plans » The Departmental Secretariats of Agriculture (SA)
inform about the CfP and rank the initial proposals according to technical criteria. They would also partici-pate in the RIC and provide co-financing and follow-up to alliances. » Services Providers (NGOs or consulting firms (called
Organización Gestora Acompañante – OGA) (i) sup-port the preparation of alliance proposals and facilitate their implementation,(ii) transfer management skills to the PO including through “on the job training” of Manager (“Gerente aprendiz”) financed by the projects over two years and working under the guidance of the Partnership Management Committee. » RPUs (called Regional Management Organizations,
OGR) manage the alliances subproject cycle including a) evaluation of initial proposals, b) supervision of sub-project preparation and implementation, e) assessment of OGAs’ performance.
» The Ministry of Agriculture and Rural Development (MADR) acts as executing agency through a PCU in charge of final decision on subproject selection, and a National Technical Committee in charge of general oversight and policy guidance. » The National Inter-sectorial Committee supervises
overall project implementation (including policy priorities and monitoring). It also has the right to refuse alliance approvals of the RICs on the basis of technical criteria. » A Trust Company (i) transfers the funds from MADR
to the trust accounts of the alliances, ii) supervises the trust accounts management, iii) oversees procurement of POs in line with the procedures for community-based procurement including the expenditures of all funds and contributions of the alliances that are kept in the trust accounts
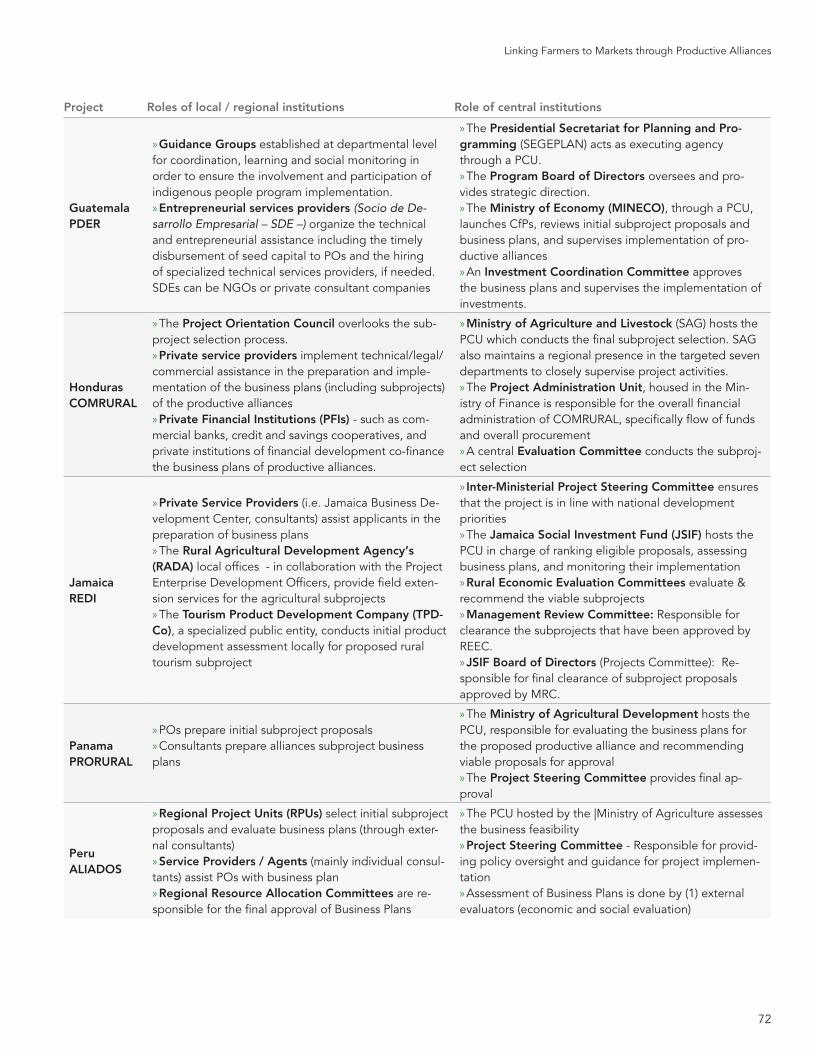
72
Linking Farmers to Markets through Productive Alliances
Project Roles of local / regional institutions Role of central institutions
Guatemala PDER
» Guidance Groups established at departmental level for coordination, learning and social monitoring in order to ensure the involvement and participation of indigenous people program implementation. » Entrepreneurial services providers (Socio de De-
sarrollo Empresarial – SDE –) organize the technical and entrepreneurial assistance including the timely disbursement of seed capital to POs and the hiring of specialized technical services providers, if needed. SDEs can be NGOs or private consultant companies
» The Presidential Secretariat for Planning and Pro-gramming (SEGEPLAN) acts as executing agency through a PCU. » The Program Board of Directors oversees and pro-
vides strategic direction. » The Ministry of Economy (MINECO), through a PCU,
launches CfPs, reviews initial subproject proposals and business plans, and supervises implementation of pro-ductive alliances » An Investment Coordination Committee approves
the business plans and supervises the implementation of investments.
Honduras COMRURAL
» The Project Orientation Council overlooks the sub-project selection process. » Private service providers implement technical/legal/
commercial assistance in the preparation and imple-mentation of the business plans (including subprojects) of the productive alliances » Private Financial Institutions (PFIs) - such as com-
mercial banks, credit and savings cooperatives, and private institutions of financial development co-finance the business plans of productive alliances.
» Ministry of Agriculture and Livestock (SAG) hosts the PCU which conducts the final subproject selection. SAG also maintains a regional presence in the targeted seven departments to closely supervise project activities. » The Project Administration Unit, housed in the Min-
istry of Finance is responsible for the overall financial administration of COMRURAL, specifically flow of funds and overall procurement » A central Evaluation Committee conducts the subproj-
ect selection
Jamaica REDI
» Private Service Providers (i.e. Jamaica Business De-velopment Center, consultants) assist applicants in the preparation of business plans » The Rural Agricultural Development Agency‘s
(RADA) local offices - in collaboration with the Project Enterprise Development Officers, provide field exten-sion services for the agricultural subprojects » The Tourism Product Development Company (TPD-
Co), a specialized public entity, conducts initial product development assessment locally for proposed rural tourism subproject
» Inter-Ministerial Project Steering Committee ensures that the project is in line with national development priorities » The Jamaica Social Investment Fund (JSIF) hosts the
PCU in charge of ranking eligible proposals, assessing business plans, and monitoring their implementation » Rural Economic Evaluation Committees evaluate &
recommend the viable subprojects » Management Review Committee: Responsible for
clearance the subprojects that have been approved by REEC. » JSIF Board of Directors (Projects Committee): Re-
sponsible for final clearance of subproject proposals approved by MRC.
Panama PRORURAL
» POs prepare initial subproject proposals » Consultants prepare alliances subproject business
plans
» The Ministry of Agricultural Development hosts the PCU, responsible for evaluating the business plans for the proposed productive alliance and recommending viable proposals for approval » The Project Steering Committee provides final ap-
proval
Peru ALIADOS
» Regional Project Units (RPUs) select initial subproject proposals and evaluate business plans (through exter-nal consultants) » Service Providers / Agents (mainly individual consul-
tants) assist POs with business plan » Regional Resource Allocation Committees are re-
sponsible for the final approval of Business Plans
» The PCU hosted by the |Ministry of Agriculture assesses the business feasibility » Project Steering Committee - Responsible for provid-
ing policy oversight and guidance for project implemen-tation » Assessment of Business Plans is done by (1) external
evaluators (economic and social evaluation)
73
Specific project examples of the
institutional arrangements of the subproject
selection process are described below:
In Bolivia’s PAR projects, the Regional
Project Units (RPU) are the first layer
responsible for verifying the eligibility
of the beneficiaries, evaluating initial
subproject proposals, and conducting
the technical evaluation of the business
plans. Business plans are prepared by
local specialists hired by the project, to
support the producer organizations and
their buyer(s) in this matter. A specialized
consultant firm validates the technical
feasibility of the proposal and conducts
an ex-ante financial evaluation of the
business plan. The Regional Project Units
then pass their recommendations on each
business plan to the National Coordination
Program (EMPODERAR) of the Ministry
of Rural Development and Land, which
conducts the final approval of the business
plan and supervises its implementation.
In Colombia’s PAAP projects, Regional
Management Organizations (OGRs)
are responsible for launching annual
regional competitive calls for the initial
subproject proposals in line with sector
policy priorities determined by a National
Inter-sector Committee established
by the project. After the receipt of the
proposals, the Departmental Secretariats
of Agriculture rank these proposals and
pass them on to the OGRs which further
evaluate the technical, financial, economic,
environmental and social soundness of
the proposals. After this evaluation, they
submit those that comply with the criteria
to Regional Inter-sector Committees, which
are composed of local representatives
of the private and public sector. These
committees then review the evaluation by
the OGRs and either approve the proposals
for further elaboration into business plans
or reject them with a justification. In the
first phase of the project (PAAP I), the
OGRs were responsible for the proposal
15. Bolivia PAR II: Same as PAR I, but the role of the service providers (faciliatadores & acompañantes) was strengthened to support the productive alliance preparation and implementation, as well as of the IFI to validate the technical choice of the proposal, a part of certifying the ex-ante financial evaluation.
and business plan preparation, while a
radical change occurred under the second
phase, in which the producer organizations
and their buyers were made responsible
for these tasks, usually with the support
of a specialized service provider (e.g.
NGO, agricultural consulting firm, etc.).
In Peru’s ALIADOS project, the
preparation of the initial subproject
proposals is the responsibility of the
producer organization. The evaluation
and selection of these proposals is done
by the project’s regional offices, who
approve eligible proposals for the business
plan preparation phase. For this, the
project provides support to the producer
organizations and their buyer(s) by hiring
a consultant who assists them in writing
the business plan (80% of the consultant
cost is funded by the project and 20%
by the beneficiaries). The subsequent
evaluation of the prepared business
plans is done by: (i) external evaluators
(responsible for the economic and social
evaluation); (ii) the PCU (who assesses
the business feasibility); (iii) the project’s
regional offices; and, (iv) a Regional/Local
Resource Allocation Committee (CLAR)
composed of representatives of the public
and private sectors as well as civil society
entities. The CLAR are the final decision-
makers on subproject approval. During the
Additional Financing, ALIADOS allowed
for a more active involvement of regional
governments in the subproject selection
process through their participation in
the decision-making process of Rural
Business and Territorial Development
Plans. The AF simplified organizational
arrangements and project procedures by
eliminating the requirement that every
subproject had to be approved by the
National Public Investment System (SNIP).
In contrast to the examples above,
Guatemala’s PDER project relied on a
centralized Project Coordination Unit
(PCU) within the Ministry of Economics
(MINECO) to launch the calls for proposals,
review the submitted subproject proposals
and business plans, and supervise the
subprojects. In coordination with the PCU,
an Investment Coordination Committee,
comprised of technical representatives from
the various co-executing agencies of the
project, approved the business plans and
supervised their implementation. At the
departmental level, guidance groups for
coordination, learning, and social monitoring
were established to ensure the involvement
and participation of indigenous peoples in
the implementation of the subprojects.
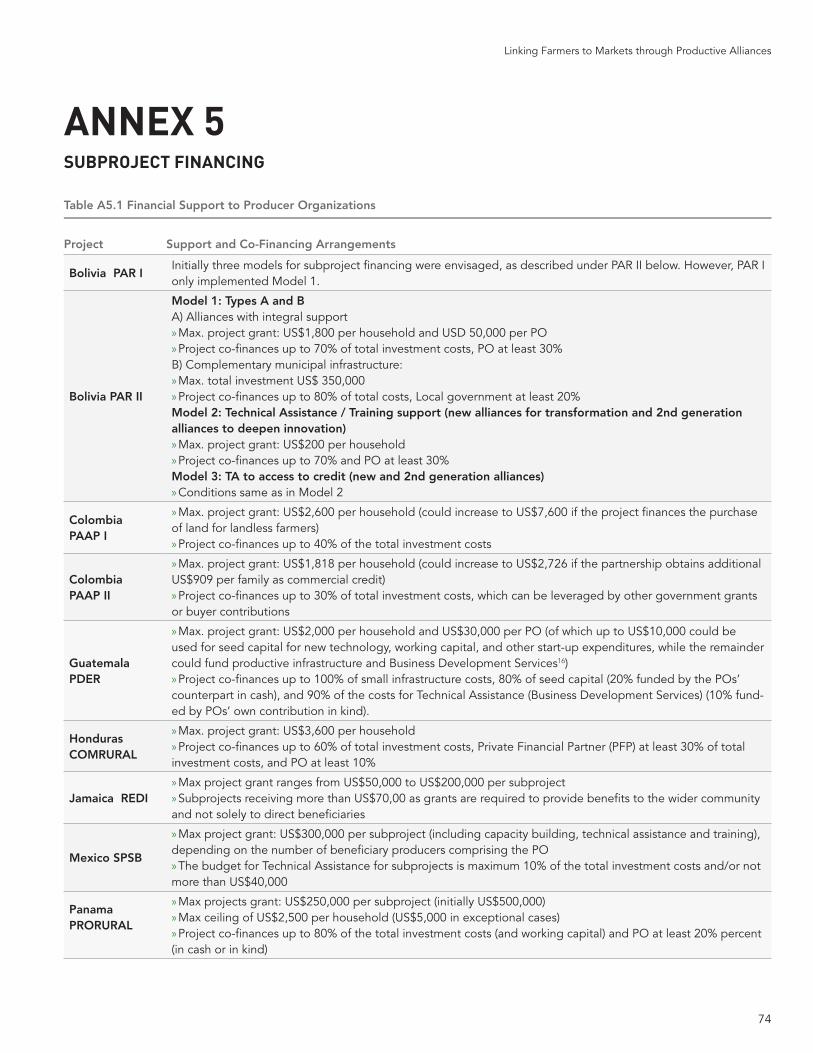
74
Linking Farmers to Markets through Productive Alliances
Table A5.1 Financial Support to Producer Organizations
Project Support and Co-Financing Arrangements
Bolivia PAR IInitially three models for subproject financing were envisaged, as described under PAR II below. However, PAR I only implemented Model 1.
Bolivia PAR II
Model 1: Types A and BA) Alliances with integral support » Max. project grant: US$1,800 per household and USD 50,000 per PO » Project co-finances up to 70% of total investment costs, PO at least 30%
B) Complementary municipal infrastructure: » Max. total investment US$ 350,000 » Project co-finances up to 80% of total costs, Local government at least 20%
Model 2: Technical Assistance / Training support (new alliances for transformation and 2nd generation alliances to deepen innovation) » Max. project grant: US$200 per household » Project co-finances up to 70% and PO at least 30%
Model 3: TA to access to credit (new and 2nd generation alliances) » Conditions same as in Model 2
Colombia PAAP I
» Max. project grant: US$2,600 per household (could increase to US$7,600 if the project finances the purchase of land for landless farmers) » Project co-finances up to 40% of the total investment costs
Colombia PAAP II
» Max. project grant: US$1,818 per household (could increase to US$2,726 if the partnership obtains additional US$909 per family as commercial credit) » Project co-finances up to 30% of total investment costs, which can be leveraged by other government grants
or buyer contributions
Guatemala PDER
» Max. project grant: US$2,000 per household and US$30,000 per PO (of which up to US$10,000 could be used for seed capital for new technology, working capital, and other start-up expenditures, while the remainder could fund productive infrastructure and Business Development Services16) » Project co-finances up to 100% of small infrastructure costs, 80% of seed capital (20% funded by the POs’
counterpart in cash), and 90% of the costs for Technical Assistance (Business Development Services) (10% fund-ed by POs’ own contribution in kind).
Honduras COMRURAL
» Max. project grant: US$3,600 per household » Project co-finances up to 60% of total investment costs, Private Financial Partner (PFP) at least 30% of total
investment costs, and PO at least 10%
Jamaica REDI » Max project grant ranges from US$50,000 to US$200,000 per subproject » Subprojects receiving more than US$70,00 as grants are required to provide benefits to the wider community
and not solely to direct beneficiaries
Mexico SPSB
» Max project grant: US$300,000 per subproject (including capacity building, technical assistance and training), depending on the number of beneficiary producers comprising the PO » The budget for Technical Assistance for subprojects is maximum 10% of the total investment costs and/or not
more than US$40,000
Panama PRORURAL
» Max projects grant: US$250,000 per subproject (initially US$500,000) » Max ceiling of US$2,500 per household (US$5,000 in exceptional cases) » Project co-finances up to 80% of the total investment costs (and working capital) and PO at least 20% percent
(in cash or in kind)
ANNEX 5SUBPROJECT FINANCING
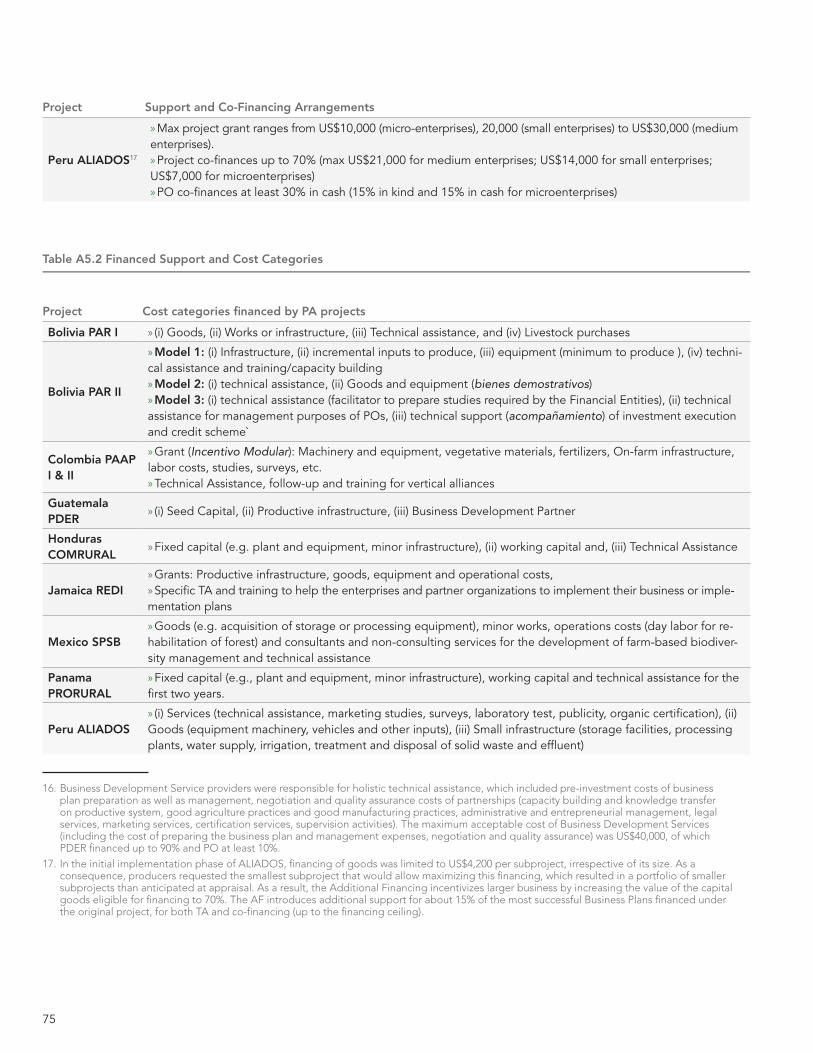
75
Project Support and Co-Financing Arrangements
Peru ALIADOS17
» Max project grant ranges from US$10,000 (micro-enterprises), 20,000 (small enterprises) to US$30,000 (medium enterprises). » Project co-finances up to 70% (max US$21,000 for medium enterprises; US$14,000 for small enterprises;
US$7,000 for microenterprises) » PO co-finances at least 30% in cash (15% in kind and 15% in cash for microenterprises)
Table A5.2 Financed Support and Cost Categories
Project Cost categories financed by PA projects
Bolivia PAR I » (i) Goods, (ii) Works or infrastructure, (iii) Technical assistance, and (iv) Livestock purchases
Bolivia PAR II
» Model 1: (i) Infrastructure, (ii) incremental inputs to produce, (iii) equipment (minimum to produce ), (iv) techni-cal assistance and training/capacity building » Model 2: (i) technical assistance, (ii) Goods and equipment (bienes demostrativos) » Model 3: (i) technical assistance (facilitator to prepare studies required by the Financial Entities), (ii) technical
assistance for management purposes of POs, (iii) technical support (acompañamiento) of investment execution and credit scheme`
Colombia PAAP I & II
» Grant (Incentivo Modular): Machinery and equipment, vegetative materials, fertilizers, On-farm infrastructure, labor costs, studies, surveys, etc. » Technical Assistance, follow-up and training for vertical alliances
Guatemala PDER
» (i) Seed Capital, (ii) Productive infrastructure, (iii) Business Development Partner
Honduras COMRURAL
» Fixed capital (e.g. plant and equipment, minor infrastructure), (ii) working capital and, (iii) Technical Assistance
Jamaica REDI » Grants: Productive infrastructure, goods, equipment and operational costs, » Specific TA and training to help the enterprises and partner organizations to implement their business or imple-
mentation plans
Mexico SPSB » Goods (e.g. acquisition of storage or processing equipment), minor works, operations costs (day labor for re-
habilitation of forest) and consultants and non-consulting services for the development of farm-based biodiver-sity management and technical assistance
Panama PRORURAL
» Fixed capital (e.g., plant and equipment, minor infrastructure), working capital and technical assistance for the first two years.
Peru ALIADOS » (i) Services (technical assistance, marketing studies, surveys, laboratory test, publicity, organic certification), (ii)
Goods (equipment machinery, vehicles and other inputs), (iii) Small infrastructure (storage facilities, processing plants, water supply, irrigation, treatment and disposal of solid waste and effluent)
16. Business Development Service providers were responsible for holistic technical assistance, which included pre-investment costs of business plan preparation as well as management, negotiation and quality assurance costs of partnerships (capacity building and knowledge transfer on productive system, good agriculture practices and good manufacturing practices, administrative and entrepreneurial management, legal services, marketing services, certification services, supervision activities). The maximum acceptable cost of Business Development Services (including the cost of preparing the business plan and management expenses, negotiation and quality assurance) was US$40,000, of which PDER financed up to 90% and PO at least 10%.
17. In the initial implementation phase of ALIADOS, financing of goods was limited to US$4,200 per subproject, irrespective of its size. As a consequence, producers requested the smallest subproject that would allow maximizing this financing, which resulted in a portfolio of smaller subprojects than anticipated at appraisal. As a result, the Additional Financing incentivizes larger business by increasing the value of the capital goods eligible for financing to 70%. The AF introduces additional support for about 15% of the most successful Business Plans financed under the original project, for both TA and co-financing (up to the financing ceiling).
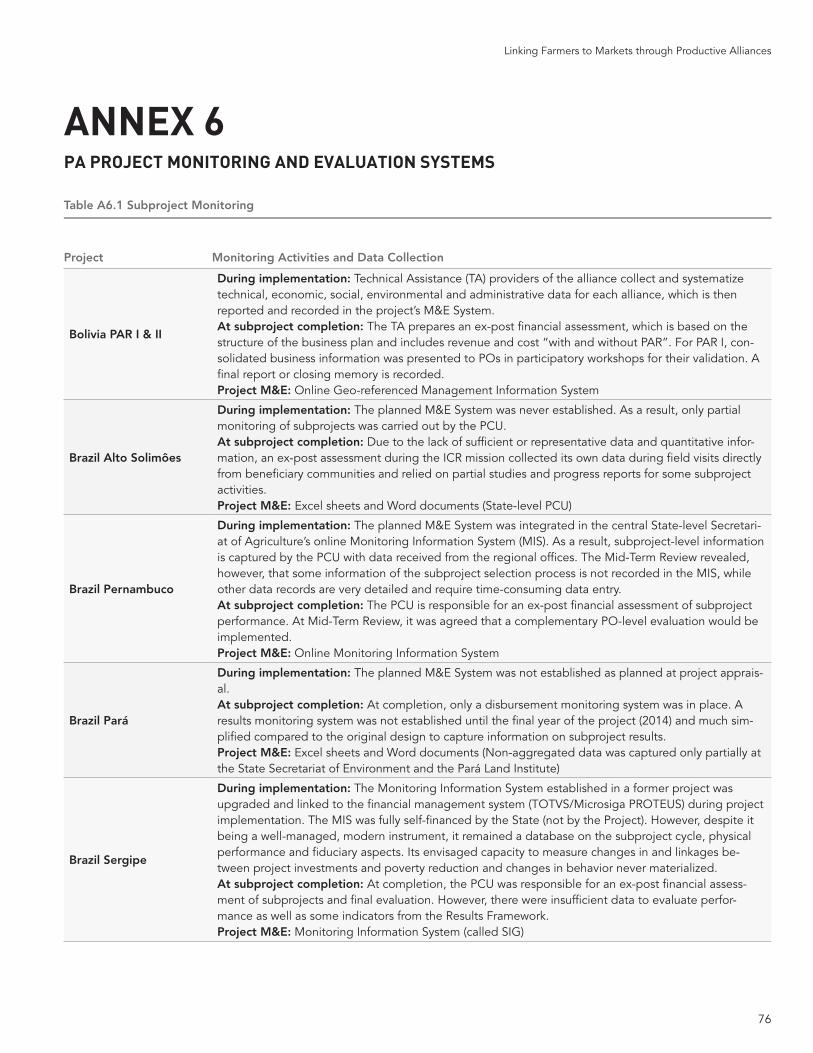
76
Linking Farmers to Markets through Productive Alliances
Table A6.1 Subproject Monitoring
Project Monitoring Activities and Data Collection
Bolivia PAR I & II
During implementation: Technical Assistance (TA) providers of the alliance collect and systematize technical, economic, social, environmental and administrative data for each alliance, which is then reported and recorded in the project’s M&E System. At subproject completion: The TA prepares an ex-post financial assessment, which is based on the structure of the business plan and includes revenue and cost “with and without PAR”. For PAR I, con-solidated business information was presented to POs in participatory workshops for their validation. A final report or closing memory is recorded.Project M&E: Online Geo-referenced Management Information System
Brazil Alto Solimôes
During implementation: The planned M&E System was never established. As a result, only partial monitoring of subprojects was carried out by the PCU.At subproject completion: Due to the lack of sufficient or representative data and quantitative infor-mation, an ex-post assessment during the ICR mission collected its own data during field visits directly from beneficiary communities and relied on partial studies and progress reports for some subproject activities.Project M&E: Excel sheets and Word documents (State-level PCU)
Brazil Pernambuco
During implementation: The planned M&E System was integrated in the central State-level Secretari-at of Agriculture’s online Monitoring Information System (MIS). As a result, subproject-level information is captured by the PCU with data received from the regional offices. The Mid-Term Review revealed, however, that some information of the subproject selection process is not recorded in the MIS, while other data records are very detailed and require time-consuming data entry.At subproject completion: The PCU is responsible for an ex-post financial assessment of subproject performance. At Mid-Term Review, it was agreed that a complementary PO-level evaluation would be implemented.Project M&E: Online Monitoring Information System
Brazil Pará
During implementation: The planned M&E System was not established as planned at project apprais-al.At subproject completion: At completion, only a disbursement monitoring system was in place. A results monitoring system was not established until the final year of the project (2014) and much sim-plified compared to the original design to capture information on subproject results.Project M&E: Excel sheets and Word documents (Non-aggregated data was captured only partially at the State Secretariat of Environment and the Pará Land Institute)
Brazil Sergipe
During implementation: The Monitoring Information System established in a former project was upgraded and linked to the financial management system (TOTVS/Microsiga PROTEUS) during project implementation. The MIS was fully self-financed by the State (not by the Project). However, despite it being a well-managed, modern instrument, it remained a database on the subproject cycle, physical performance and fiduciary aspects. Its envisaged capacity to measure changes in and linkages be-tween project investments and poverty reduction and changes in behavior never materialized.At subproject completion: At completion, the PCU was responsible for an ex-post financial assess-ment of subprojects and final evaluation. However, there were insufficient data to evaluate perfor-mance as well as some indicators from the Results Framework.Project M&E: Monitoring Information System (called SIG)
ANNEX 6PA PROJECT MONITORING AND EVALUATION SYSTEMS
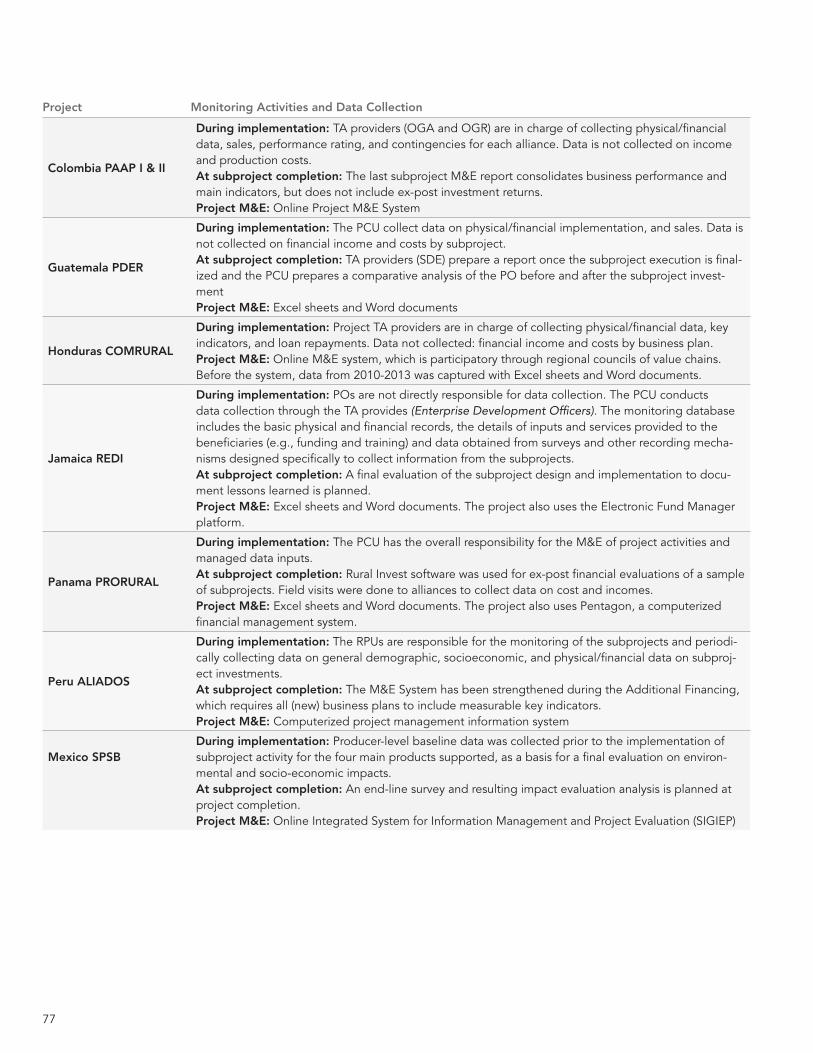
77
Project Monitoring Activities and Data Collection
Colombia PAAP I & II
During implementation: TA providers (OGA and OGR) are in charge of collecting physical/financial data, sales, performance rating, and contingencies for each alliance. Data is not collected on income and production costs.At subproject completion: The last subproject M&E report consolidates business performance and main indicators, but does not include ex-post investment returns. Project M&E: Online Project M&E System
Guatemala PDER
During implementation: The PCU collect data on physical/financial implementation, and sales. Data is not collected on financial income and costs by subproject.At subproject completion: TA providers (SDE) prepare a report once the subproject execution is final-ized and the PCU prepares a comparative analysis of the PO before and after the subproject invest-mentProject M&E: Excel sheets and Word documents
Honduras COMRURAL
During implementation: Project TA providers are in charge of collecting physical/financial data, key indicators, and loan repayments. Data not collected: financial income and costs by business plan.Project M&E: Online M&E system, which is participatory through regional councils of value chains. Before the system, data from 2010-2013 was captured with Excel sheets and Word documents.
Jamaica REDI
During implementation: POs are not directly responsible for data collection. The PCU conducts data collection through the TA provides (Enterprise Development Officers). The monitoring database includes the basic physical and financial records, the details of inputs and services provided to the beneficiaries (e.g., funding and training) and data obtained from surveys and other recording mecha-nisms designed specifically to collect information from the subprojects.At subproject completion: A final evaluation of the subproject design and implementation to docu-ment lessons learned is planned. Project M&E: Excel sheets and Word documents. The project also uses the Electronic Fund Manager platform.
Panama PRORURAL
During implementation: The PCU has the overall responsibility for the M&E of project activities and managed data inputs.At subproject completion: Rural Invest software was used for ex-post financial evaluations of a sample of subprojects. Field visits were done to alliances to collect data on cost and incomes. Project M&E: Excel sheets and Word documents. The project also uses Pentagon, a computerized financial management system.
Peru ALIADOS
During implementation: The RPUs are responsible for the monitoring of the subprojects and periodi-cally collecting data on general demographic, socioeconomic, and physical/financial data on subproj-ect investments. At subproject completion: The M&E System has been strengthened during the Additional Financing, which requires all (new) business plans to include measurable key indicators.Project M&E: Computerized project management information system
Mexico SPSBDuring implementation: Producer-level baseline data was collected prior to the implementation of subproject activity for the four main products supported, as a basis for a final evaluation on environ-mental and socio-economic impacts.At subproject completion: An end-line survey and resulting impact evaluation analysis is planned at project completion.Project M&E: Online Integrated System for Information Management and Project Evaluation (SIGIEP)
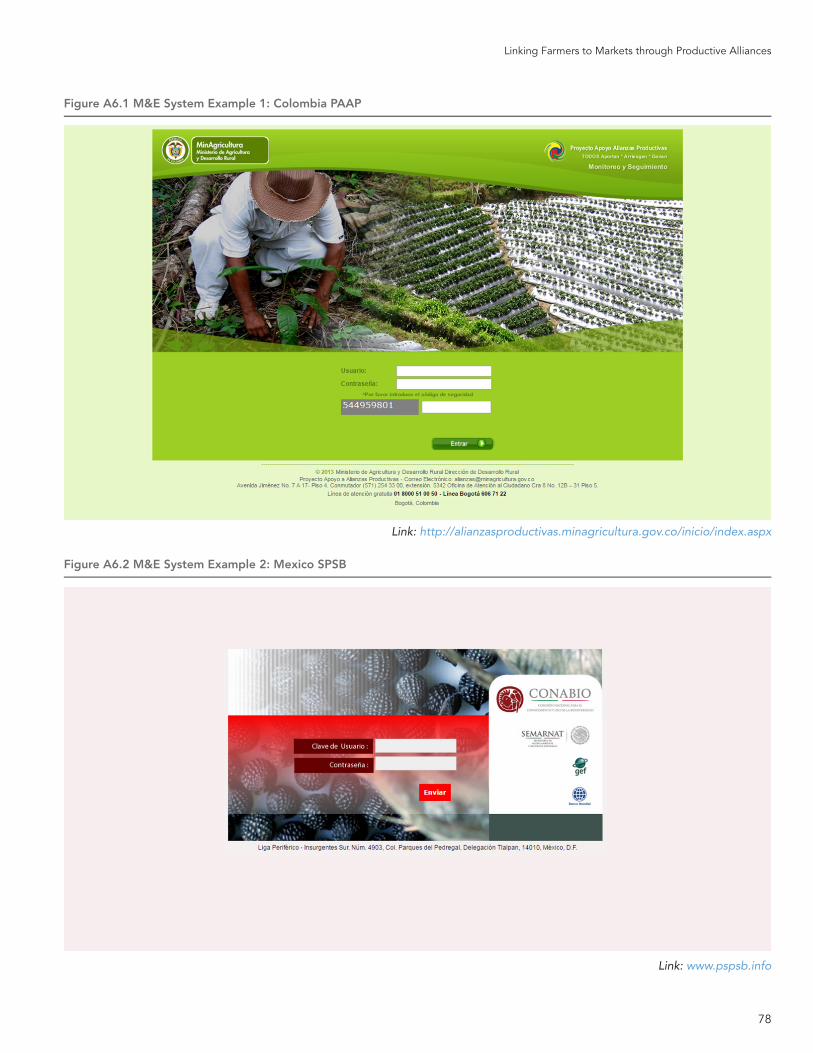
78
Linking Farmers to Markets through Productive Alliances
Link: www.pspsb.info
Link: http://alianzasproductivas.minagricultura.gov.co/inicio/index.aspx
Figure A6.1 M&E System Example 1: Colombia PAAP
Figure A6.2 M&E System Example 2: Mexico SPSB
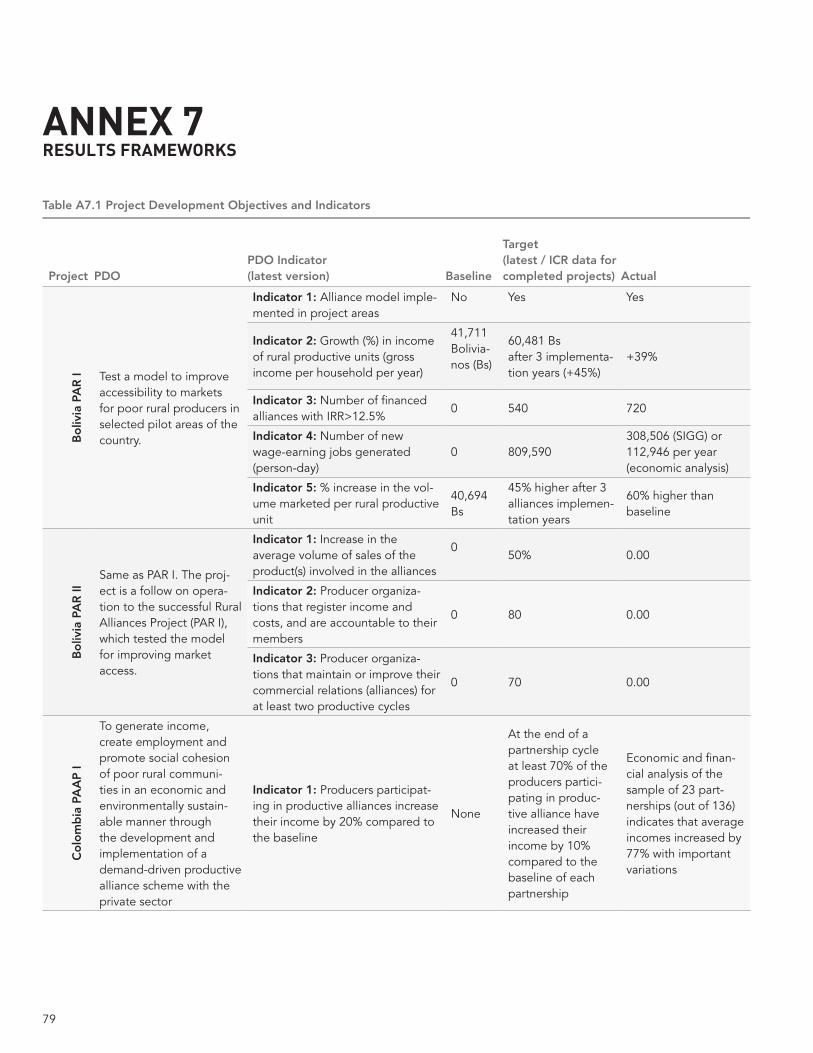
79
ANNEX 7 RESULTS FRAMEWORKS
Table A7.1 Project Development Objectives and Indicators
Project PDOPDO Indicator(latest version) Baseline
Target(latest / ICR data for completed projects) Actual
Bo
livia
PA
R I Test a model to improve
accessibility to markets for poor rural producers in selected pilot areas of the country.
Indicator 1: Alliance model imple-mented in project areas
No Yes Yes
Indicator 2: Growth (%) in income of rural productive units (gross income per household per year)
41,711 Bolivia-nos (Bs)
60,481 Bs after 3 implementa-tion years (+45%)
+39%
Indicator 3: Number of financed alliances with IRR>12.5%
0 540 720
Indicator 4: Number of new wage-earning jobs generated (person-day)
0 809,590308,506 (SIGG) or 112,946 per year (economic analysis)
Indicator 5: % increase in the vol-ume marketed per rural productive unit
40,694 Bs
45% higher after 3 alliances implemen-tation years
60% higher than baseline
Bo
livia
PA
R II
Same as PAR I. The proj-ect is a follow on opera-tion to the successful Rural Alliances Project (PAR I), which tested the model for improving market access.
Indicator 1: Increase in the average volume of sales of the product(s) involved in the alliances
050% 0.00
Indicator 2: Producer organiza-tions that register income and costs, and are accountable to their members
0 80 0.00
Indicator 3: Producer organiza-tions that maintain or improve their commercial relations (alliances) for at least two productive cycles
0 70 0.00
Co
lom
bia
PA
AP
I
To generate income, create employment and promote social cohesion of poor rural communi-ties in an economic and environmentally sustain-able manner through the development and implementation of a demand-driven productive alliance scheme with the private sector
Indicator 1: Producers participat-ing in productive alliances increase their income by 20% compared to the baseline
None
At the end of a partnership cycle at least 70% of the producers partici-pating in produc-tive alliance have increased their income by 10% compared to the baseline of each partnership
Economic and finan-cial analysis of the sample of 23 part-nerships (out of 136) indicates that average incomes increased by 77% with important variations
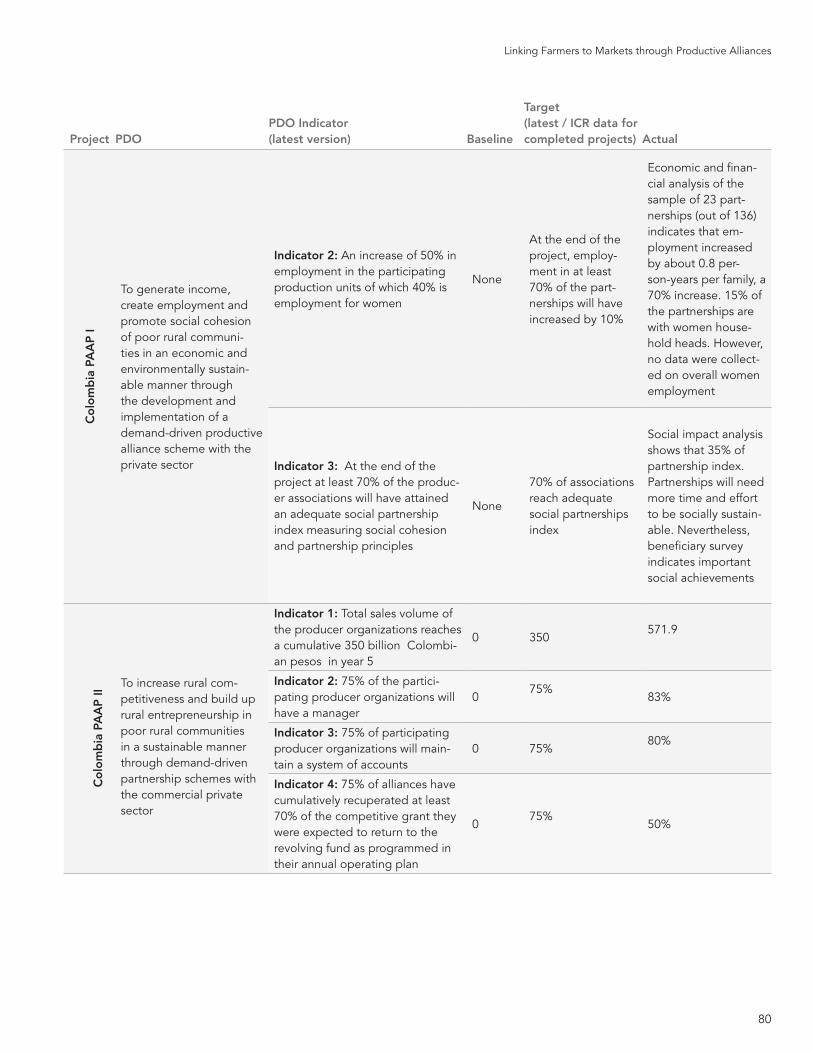
80
Linking Farmers to Markets through Productive Alliances
Project PDOPDO Indicator(latest version) Baseline
Target(latest / ICR data for completed projects) Actual
Co
lom
bia
PA
AP
I
To generate income, create employment and promote social cohesion of poor rural communi-ties in an economic and environmentally sustain-able manner through the development and implementation of a demand-driven productive alliance scheme with the private sector
Indicator 2: An increase of 50% in employment in the participating production units of which 40% is employment for women
None
At the end of the project, employ-ment in at least 70% of the part-nerships will have increased by 10%
Economic and finan-cial analysis of the sample of 23 part-nerships (out of 136) indicates that em-ployment increased by about 0.8 per-son-years per family, a 70% increase. 15% of the partnerships are with women house-hold heads. However, no data were collect-ed on overall women employment
Indicator 3: At the end of the project at least 70% of the produc-er associations will have attained an adequate social partnership index measuring social cohesion and partnership principles
None
70% of associations reach adequate social partnerships index
Social impact analysis shows that 35% of partnership index. Partnerships will need more time and effort to be socially sustain-able. Nevertheless, beneficiary survey indicates important social achievements
Co
lom
bia
PA
AP
II
To increase rural com-petitiveness and build up rural entrepreneurship in poor rural communities in a sustainable manner through demand-driven partnership schemes with the commercial private sector
Indicator 1: Total sales volume of the producer organizations reaches a cumulative 350 billion Colombi-an pesos in year 5
0 350571.9
Indicator 2: 75% of the partici-pating producer organizations will have a manager
075%
83%
Indicator 3: 75% of participating producer organizations will main-tain a system of accounts
0 75%80%
Indicator 4: 75% of alliances have cumulatively recuperated at least 70% of the competitive grant they were expected to return to the revolving fund as programmed in their annual operating plan
075%
50%
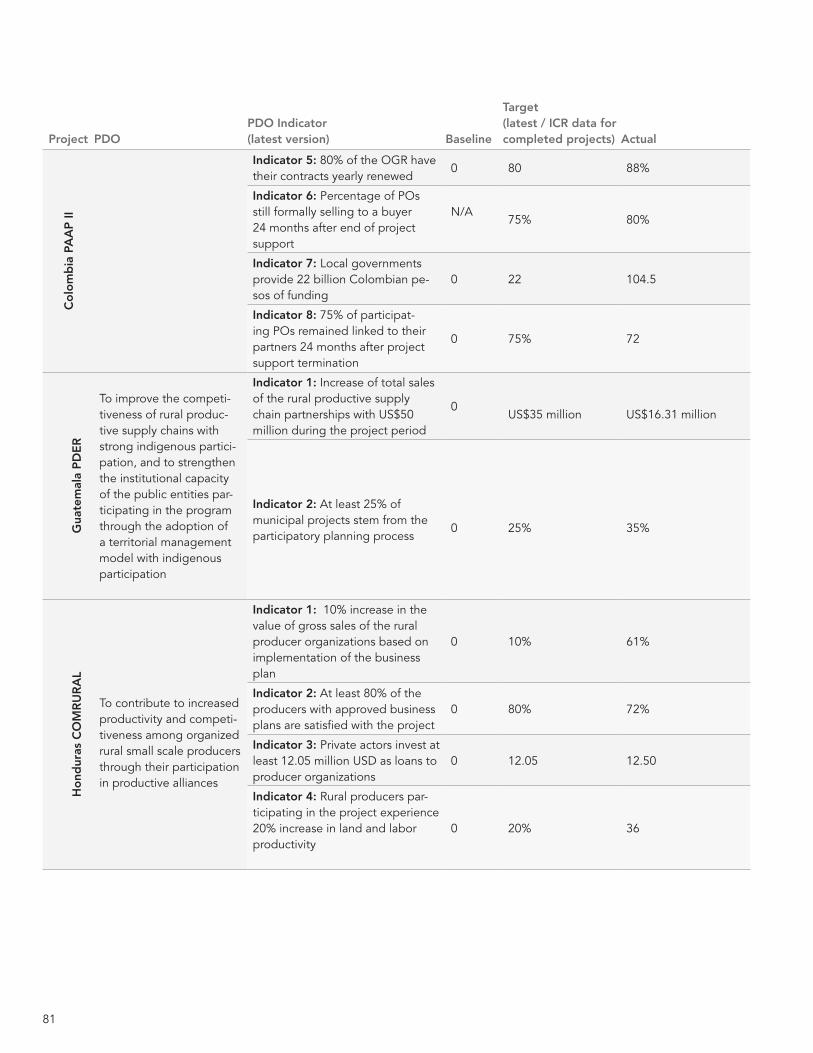
81
Project PDOPDO Indicator(latest version) Baseline
Target(latest / ICR data for completed projects) Actual
Co
lom
bia
PA
AP
II
Indicator 5: 80% of the OGR have their contracts yearly renewed
0 80 88%
Indicator 6: Percentage of POs still formally selling to a buyer 24 months after end of project support
N/A75% 80%
Indicator 7: Local governments provide 22 billion Colombian pe-sos of funding
0 22 104.5
Indicator 8: 75% of participat-ing POs remained linked to their partners 24 months after project support termination
0 75% 72
Gua
tem
ala
PD
ER
To improve the competi-tiveness of rural produc-tive supply chains with strong indigenous partici-pation, and to strengthen the institutional capacity of the public entities par-ticipating in the program through the adoption of a territorial management model with indigenous participation
Indicator 1: Increase of total sales of the rural productive supply chain partnerships with US$50 million during the project period
0US$35 million US$16.31 million
Indicator 2: At least 25% of municipal projects stem from the participatory planning process
0 25% 35%
Ho
ndur
as C
OM
RU
RA
L
To contribute to increased productivity and competi-tiveness among organized rural small scale producers through their participation in productive alliances
Indicator 1: 10% increase in the value of gross sales of the rural producer organizations based on implementation of the business plan
0 10% 61%
Indicator 2: At least 80% of the producers with approved business plans are satisfied with the project
0 80% 72%
Indicator 3: Private actors invest at least 12.05 million USD as loans to producer organizations
0 12.05 12.50
Indicator 4: Rural producers par-ticipating in the project experience 20% increase in land and labor productivity
0 20% 36
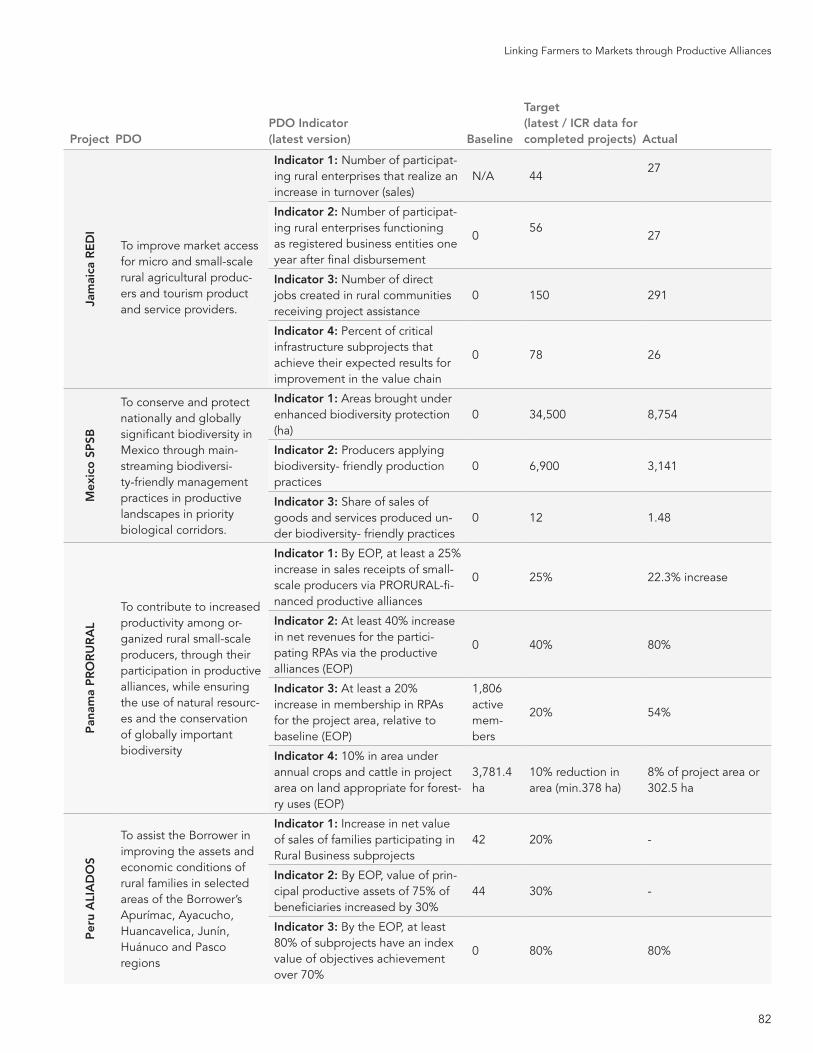
82
Linking Farmers to Markets through Productive Alliances
Project PDOPDO Indicator(latest version) Baseline
Target(latest / ICR data for completed projects) Actual
Jam
aica
RE
DI
To improve market access for micro and small-scale rural agricultural produc-ers and tourism product and service providers.
Indicator 1: Number of participat-ing rural enterprises that realize an increase in turnover (sales)
N/A 4427
Indicator 2: Number of participat-ing rural enterprises functioning as registered business entities one year after final disbursement
056
27
Indicator 3: Number of direct jobs created in rural communities receiving project assistance
0 150 291
Indicator 4: Percent of critical infrastructure subprojects that achieve their expected results for improvement in the value chain
0 78 26
Mex
ico
SP
SB
To conserve and protect nationally and globally significant biodiversity in Mexico through main-streaming biodiversi-ty-friendly management practices in productive landscapes in priority biological corridors.
Indicator 1: Areas brought under enhanced biodiversity protection (ha)
0 34,500 8,754
Indicator 2: Producers applying biodiversity- friendly production practices
0 6,900 3,141
Indicator 3: Share of sales of goods and services produced un-der biodiversity- friendly practices
0 12 1.48
Pan
ama
PR
OR
UR
AL
To contribute to increased productivity among or-ganized rural small-scale producers, through their participation in productive alliances, while ensuring the use of natural resourc-es and the conservation of globally important biodiversity
Indicator 1: By EOP, at least a 25% increase in sales receipts of small-scale producers via PRORURAL-fi-nanced productive alliances
0 25% 22.3% increase
Indicator 2: At least 40% increase in net revenues for the partici-pating RPAs via the productive alliances (EOP)
0 40% 80%
Indicator 3: At least a 20% increase in membership in RPAs for the project area, relative to baseline (EOP)
1,806 active mem-bers
20% 54%
Indicator 4: 10% in area under annual crops and cattle in project area on land appropriate for forest-ry uses (EOP)
3,781.4 ha
10% reduction in area (min.378 ha)
8% of project area or 302.5 ha
Per
u A
LIA
DO
S
To assist the Borrower in improving the assets and economic conditions of rural families in selected areas of the Borrower’s Apurímac, Ayacucho, Huancavelica, Junín, Huánuco and Pasco regions
Indicator 1: Increase in net value of sales of families participating in Rural Business subprojects
42 20% -
Indicator 2: By EOP, value of prin-cipal productive assets of 75% of beneficiaries increased by 30%
44 30% -
Indicator 3: By the EOP, at least 80% of subprojects have an index value of objectives achievement over 70%
0 80% 80%
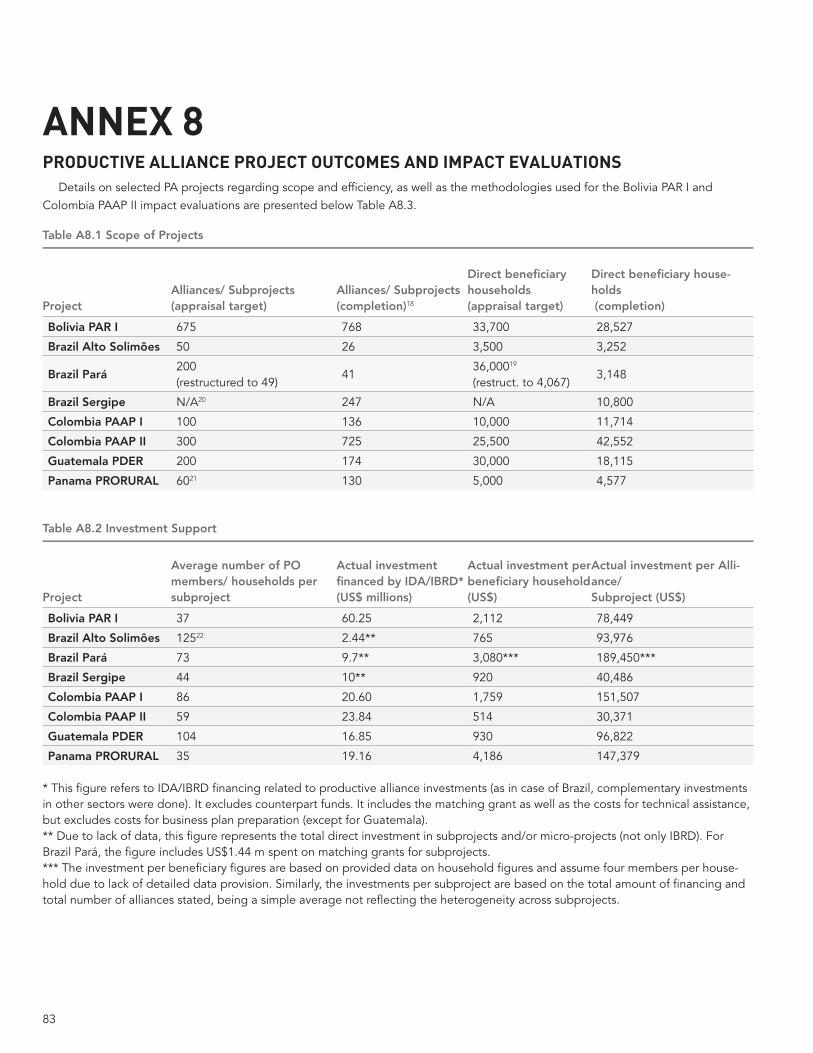
83
ANNEX 8PRODUCTIVE ALLIANCE PROJECT OUTCOMES AND IMPACT EVALUATIONS
Details on selected PA projects regarding scope and efficiency, as well as the methodologies used for the Bolivia PAR I and Colombia PAAP II impact evaluations are presented below Table A8.3.
Table A8.1 Scope of Projects
ProjectAlliances/ Subprojects(appraisal target)
Alliances/ Subprojects(completion)18
Direct beneficiary households(appraisal target)
Direct beneficiary house-holds (completion)
Bolivia PAR I 675 768 33,700 28,527
Brazil Alto Solimôes 50 26 3,500 3,252
Brazil Pará200 (restructured to 49)
4136,00019
(restruct. to 4,067)3,148
Brazil Sergipe N/A20 247 N/A 10,800
Colombia PAAP I 100 136 10,000 11,714
Colombia PAAP II 300 725 25,500 42,552
Guatemala PDER 200 174 30,000 18,115
Panama PRORURAL 6021 130 5,000 4,577
Table A8.2 Investment Support
Project
Average number of PO members/ households per subproject
Actual investment financed by IDA/IBRD*(US$ millions)
Actual investment per beneficiary household(US$)
Actual investment per Alli-ance/Subproject (US$)
Bolivia PAR I 37 60.25 2,112 78,449
Brazil Alto Solimôes 12522 2.44** 765 93,976
Brazil Pará 73 9.7** 3,080*** 189,450***
Brazil Sergipe 44 10** 920 40,486
Colombia PAAP I 86 20.60 1,759 151,507
Colombia PAAP II 59 23.84 514 30,371
Guatemala PDER 104 16.85 930 96,822
Panama PRORURAL 35 19.16 4,186 147,379 * This figure refers to IDA/IBRD financing related to productive alliance investments (as in case of Brazil, complementary investments in other sectors were done). It excludes counterpart funds. It includes the matching grant as well as the costs for technical assistance, but excludes costs for business plan preparation (except for Guatemala).** Due to lack of data, this figure represents the total direct investment in subprojects and/or micro-projects (not only IBRD). For Brazil Pará, the figure includes US$1.44 m spent on matching grants for subprojects.*** The investment per beneficiary figures are based on provided data on household figures and assume four members per house-hold due to lack of detailed data provision. Similarly, the investments per subproject are based on the total amount of financing and total number of alliances stated, being a simple average not reflecting the heterogeneity across subprojects.
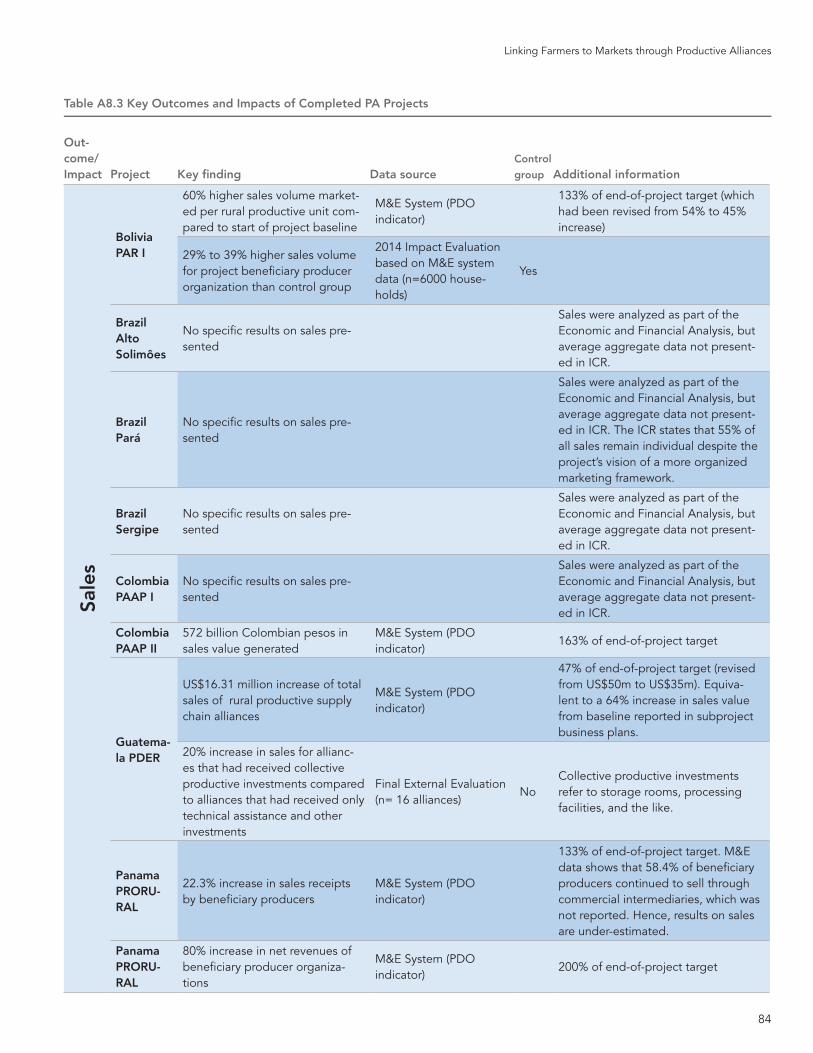
84
Linking Farmers to Markets through Productive Alliances
Table A8.3 Key Outcomes and Impacts of Completed PA Projects
Out-come/ Impact Project Key finding Data source
Control
group Additional information
Sale
s
Bolivia PAR I
60% higher sales volume market-ed per rural productive unit com-pared to start of project baseline
M&E System (PDO indicator)
133% of end-of-project target (which had been revised from 54% to 45% increase)
29% to 39% higher sales volume for project beneficiary producer organization than control group
2014 Impact Evaluation based on M&E system data (n=6000 house-holds)
Yes
Brazil Alto Solimôes
No specific results on sales pre-sented
Sales were analyzed as part of the Economic and Financial Analysis, but average aggregate data not present-ed in ICR.
Brazil Pará
No specific results on sales pre-sented
Sales were analyzed as part of the Economic and Financial Analysis, but average aggregate data not present-ed in ICR. The ICR states that 55% of all sales remain individual despite the project’s vision of a more organized marketing framework.
Brazil Sergipe
No specific results on sales pre-sented
Sales were analyzed as part of the Economic and Financial Analysis, but average aggregate data not present-ed in ICR.
Colombia PAAP I
No specific results on sales pre-sented
Sales were analyzed as part of the Economic and Financial Analysis, but average aggregate data not present-ed in ICR.
Colombia PAAP II
572 billion Colombian pesos in sales value generated
M&E System (PDO indicator)
163% of end-of-project target
Guatema-la PDER
US$16.31 million increase of total sales of rural productive supply chain alliances
M&E System (PDO indicator)
47% of end-of-project target (revised from US$50m to US$35m). Equiva-lent to a 64% increase in sales value from baseline reported in subproject business plans.
20% increase in sales for allianc-es that had received collective productive investments compared to alliances that had received only technical assistance and other investments
Final External Evaluation (n= 16 alliances)
NoCollective productive investments refer to storage rooms, processing facilities, and the like.
Panama PRORU-RAL
22.3% increase in sales receipts by beneficiary producers
M&E System (PDO indicator)
133% of end-of-project target. M&E data shows that 58.4% of beneficiary producers continued to sell through commercial intermediaries, which was not reported. Hence, results on sales are under-estimated.
Panama PRORU-RAL
80% increase in net revenues of beneficiary producer organiza-tions
M&E System (PDO indicator)
200% of end-of-project target
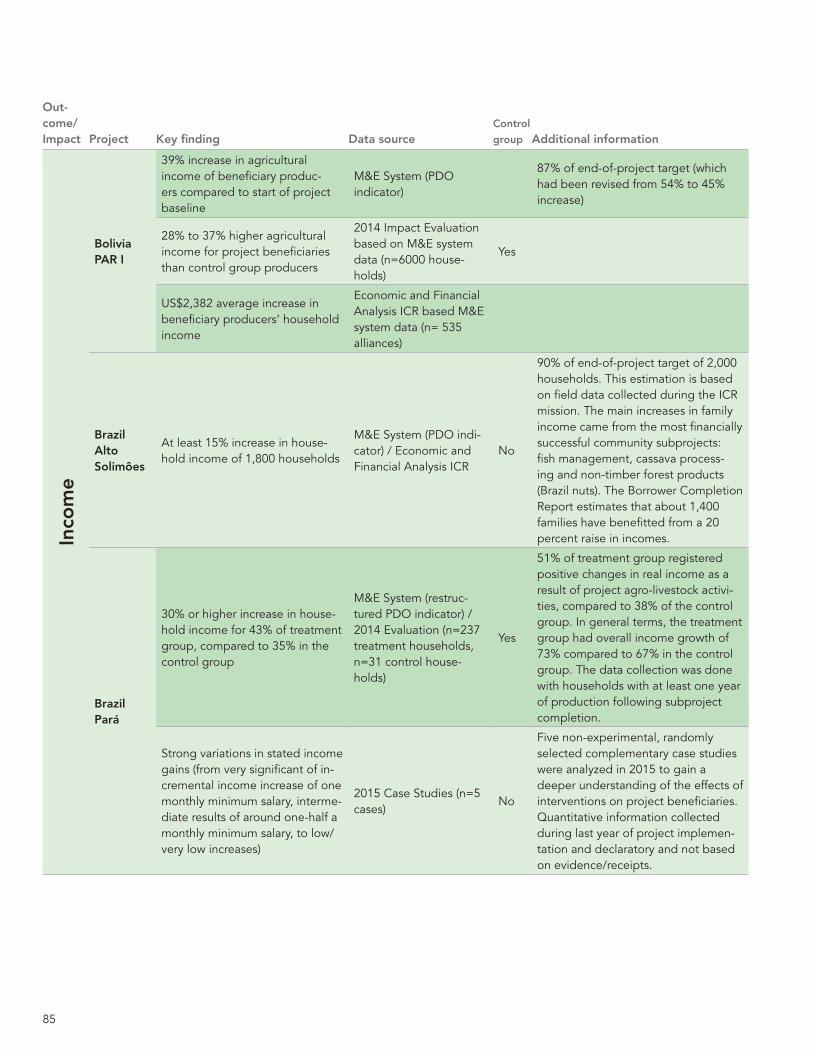
85
Out-come/ Impact Project Key finding Data source
Control
group Additional information
Inco
me
Bolivia PAR I
39% increase in agricultural income of beneficiary produc-ers compared to start of project baseline
M&E System (PDO indicator)
87% of end-of-project target (which had been revised from 54% to 45% increase)
28% to 37% higher agricultural income for project beneficiaries than control group producers
2014 Impact Evaluation based on M&E system data (n=6000 house-holds)
Yes
US$2,382 average increase in beneficiary producers’ household income
Economic and Financial Analysis ICR based M&E system data (n= 535 alliances)
Brazil Alto Solimôes
At least 15% increase in house-hold income of 1,800 households
M&E System (PDO indi-cator) / Economic and Financial Analysis ICR
No
90% of end-of-project target of 2,000 households. This estimation is based on field data collected during the ICR mission. The main increases in family income came from the most financially successful community subprojects: fish management, cassava process-ing and non-timber forest products (Brazil nuts). The Borrower Completion Report estimates that about 1,400 families have benefitted from a 20 percent raise in incomes.
Brazil Pará
30% or higher increase in house-hold income for 43% of treatment group, compared to 35% in the control group
M&E System (restruc-tured PDO indicator) / 2014 Evaluation (n=237 treatment households, n=31 control house-holds)
Yes
51% of treatment group registered positive changes in real income as a result of project agro-livestock activi-ties, compared to 38% of the control group. In general terms, the treatment group had overall income growth of 73% compared to 67% in the control group. The data collection was done with households with at least one year of production following subproject completion.
Strong variations in stated income gains (from very significant of in-cremental income increase of one monthly minimum salary, interme-diate results of around one-half a monthly minimum salary, to low/very low increases)
2015 Case Studies (n=5 cases)
No
Five non-experimental, randomly selected complementary case studies were analyzed in 2015 to gain a deeper understanding of the effects of interventions on project beneficiaries. Quantitative information collected during last year of project implemen-tation and declaratory and not based on evidence/receipts.
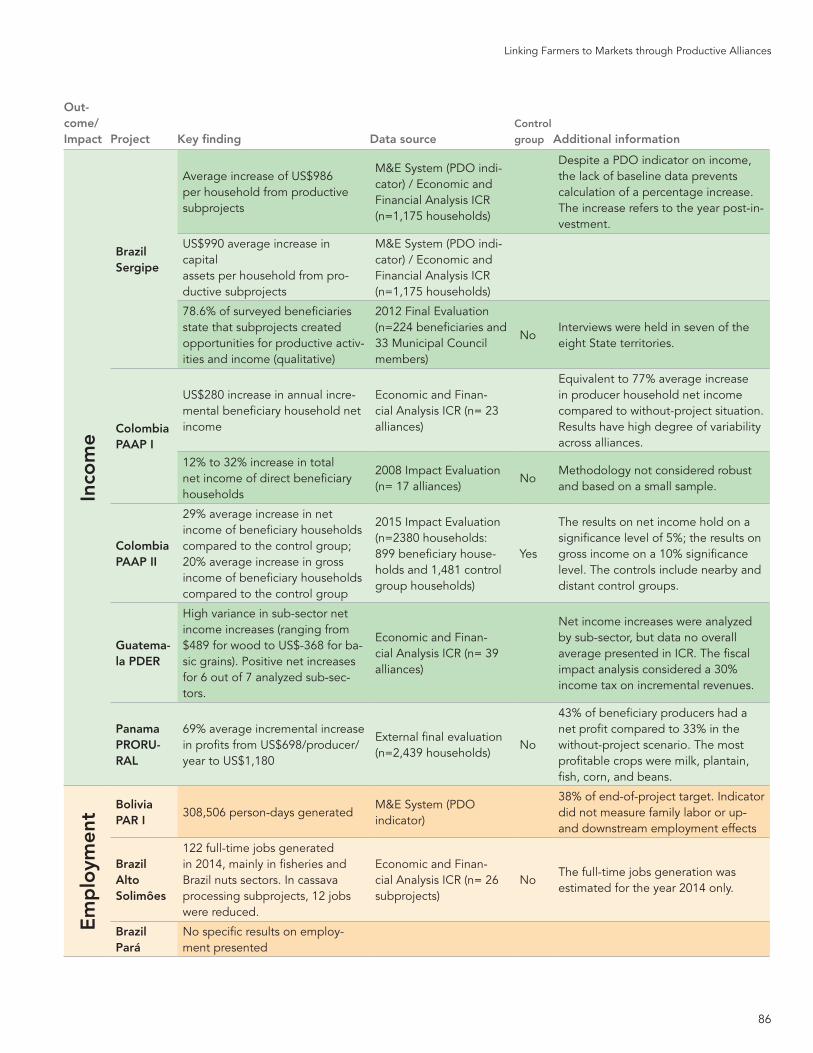
86
Linking Farmers to Markets through Productive Alliances
Out-come/ Impact Project Key finding Data source
Control
group Additional information
Inco
me
Brazil Sergipe
Average increase of US$986 per household from productive subprojects
M&E System (PDO indi-cator) / Economic and Financial Analysis ICR (n=1,175 households)
Despite a PDO indicator on income, the lack of baseline data prevents calculation of a percentage increase. The increase refers to the year post-in-vestment.
US$990 average increase in capital assets per household from pro-ductive subprojects
M&E System (PDO indi-cator) / Economic and Financial Analysis ICR (n=1,175 households)
78.6% of surveyed beneficiaries state that subprojects created opportunities for productive activ-ities and income (qualitative)
2012 Final Evaluation (n=224 beneficiaries and 33 Municipal Council members)
NoInterviews were held in seven of the eight State territories.
Colombia PAAP I
US$280 increase in annual incre-mental beneficiary household net income
Economic and Finan-cial Analysis ICR (n= 23 alliances)
Equivalent to 77% average increase in producer household net income compared to without-project situation. Results have high degree of variability across alliances.
12% to 32% increase in total net income of direct beneficiary households
2008 Impact Evaluation (n= 17 alliances)
NoMethodology not considered robust and based on a small sample.
Colombia PAAP II
29% average increase in net income of beneficiary households compared to the control group; 20% average increase in gross income of beneficiary households compared to the control group
2015 Impact Evaluation (n=2380 households: 899 beneficiary house-holds and 1,481 control group households)
Yes
The results on net income hold on a significance level of 5%; the results on gross income on a 10% significance level. The controls include nearby and distant control groups.
Guatema-la PDER
High variance in sub-sector net income increases (ranging from $489 for wood to US$-368 for ba-sic grains). Positive net increases for 6 out of 7 analyzed sub-sec-tors.
Economic and Finan-cial Analysis ICR (n= 39 alliances)
Net income increases were analyzed by sub-sector, but data no overall average presented in ICR. The fiscal impact analysis considered a 30% income tax on incremental revenues.
Panama PRORU-RAL
69% average incremental increase in profits from US$698/producer/year to US$1,180
External final evaluation (n=2,439 households)
No
43% of beneficiary producers had a net profit compared to 33% in the without-project scenario. The most profitable crops were milk, plantain, fish, corn, and beans.
Em
plo
ymen
t
Bolivia PAR I
308,506 person-days generatedM&E System (PDO indicator)
38% of end-of-project target. Indicator did not measure family labor or up- and downstream employment effects
Brazil Alto Solimôes
122 full-time jobs generated in 2014, mainly in fisheries and Brazil nuts sectors. In cassava processing subprojects, 12 jobs were reduced.
Economic and Finan-cial Analysis ICR (n= 26 subprojects)
NoThe full-time jobs generation was estimated for the year 2014 only.
Brazil Pará
No specific results on employ-ment presented
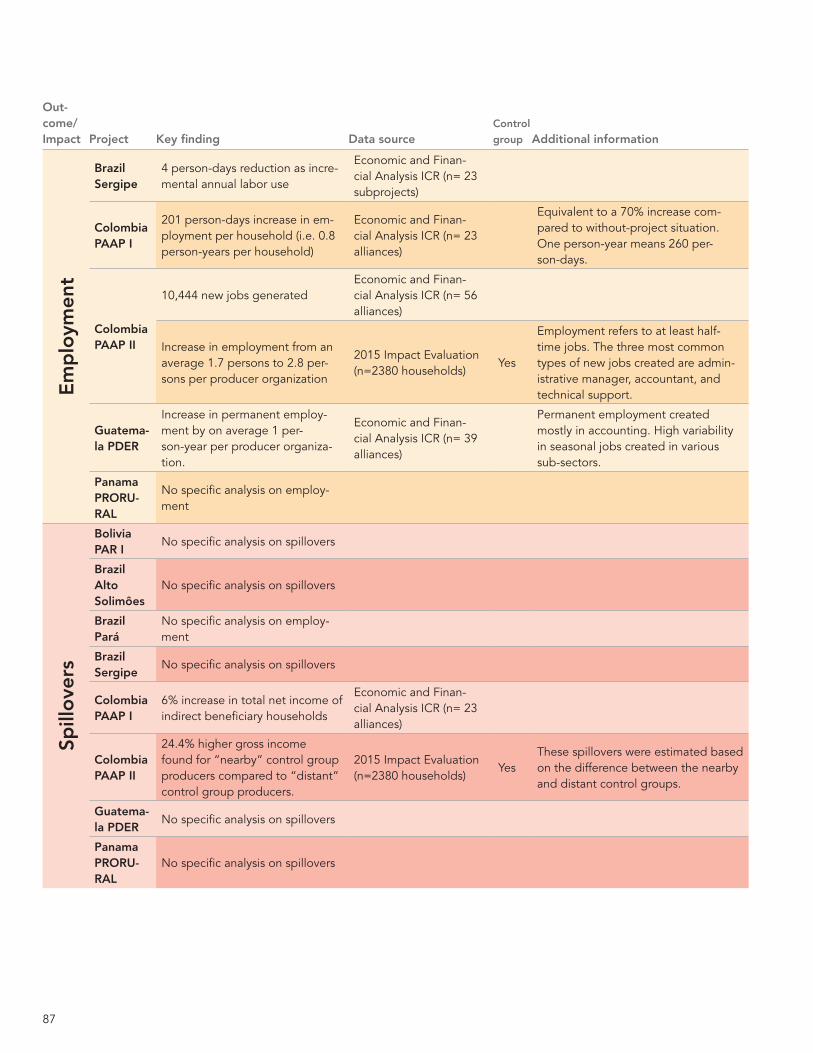
87
Out-come/ Impact Project Key finding Data source
Control
group Additional information
Em
plo
ymen
t
Brazil Sergipe
4 person-days reduction as incre-mental annual labor use
Economic and Finan-cial Analysis ICR (n= 23 subprojects)
Colombia PAAP I
201 person-days increase in em-ployment per household (i.e. 0.8 person-years per household)
Economic and Finan-cial Analysis ICR (n= 23 alliances)
Equivalent to a 70% increase com-pared to without-project situation. One person-year means 260 per-son-days.
Colombia PAAP II
10,444 new jobs generatedEconomic and Finan-cial Analysis ICR (n= 56 alliances)
Increase in employment from an average 1.7 persons to 2.8 per-sons per producer organization
2015 Impact Evaluation (n=2380 households)
Yes
Employment refers to at least half-time jobs. The three most common types of new jobs created are admin-istrative manager, accountant, and technical support.
Guatema-la PDER
Increase in permanent employ-ment by on average 1 per-son-year per producer organiza-tion.
Economic and Finan-cial Analysis ICR (n= 39 alliances)
Permanent employment created mostly in accounting. High variability in seasonal jobs created in various sub-sectors.
Panama PRORU-RAL
No specific analysis on employ-ment
Spill
ove
rs
Bolivia PAR I
No specific analysis on spillovers
Brazil Alto Solimôes
No specific analysis on spillovers
Brazil Pará
No specific analysis on employ-ment
Brazil Sergipe
No specific analysis on spillovers
Colombia PAAP I
6% increase in total net income of indirect beneficiary households
Economic and Finan-cial Analysis ICR (n= 23 alliances)
Colombia PAAP II
24.4% higher gross income found for “nearby” control group producers compared to “distant” control group producers.
2015 Impact Evaluation (n=2380 households)
YesThese spillovers were estimated based on the difference between the nearby and distant control groups.
Guatema-la PDER
No specific analysis on spillovers
Panama PRORU-RAL
No specific analysis on spillovers
88
Linking Farmers to Markets through Productive Alliances
SCOPE: Regarding the individual projects
analyzed, Colombia’s PAAP I reached
11,714 producers through the establishment
of 136 alliance subprojects, surpassing
the appraisal targets by 17% and 30%,
respectively. In terms of distribution of
products supported, 76% of alliance
subprojects were related to crops (mainly
perennial crops), 14% to livestock, and the
remaining 10% to aquaculture and forestry.
The average IBRD grant amount was
US$1,759 per beneficiary household and US
$151,507 per alliance. The follow-on project
PAAP II had a much wider scope, with more
than 42,000 direct beneficiaries in 725
productive alliances at project completion
(167% and 242% of the appraisal targets,
respectively). At the same time, compared
to the first phase, the grant resources from
IBRD declined significantly to US$514 per
beneficiary household and US$30,370 per
alliance. It is important to note, however,
that these figures do not include grants from
other public sources (as no comprehensive
data on these sources is available). Thus,
the overall grant amount (IBRD and other)
received by beneficiaries and alliances
under PAAP II is higher than the figures
displayed in Table 8.2. The fact that the
grants financed by the project dropped
significantly under PAAP II indicates that
PAAP II resources were leveraged to a
much larger degree through other funding
sources, allowing for a strong increase
in project scope. The findings from the
18. These figures are the total number of vertical alliances/subprojects established during project implementation that were still operating at project completion. For example, in Colombia 744 had been established with 46,362 direct beneficiaries, but 725 were still operating at project completion. Similarly, in Guatemala, a total of 216 alliances had been established(189 Business Plans and 27 Business Strengthening Plans), but 15 BP were cancelled during project, resulting in a total 174 alliances funded
19. The PAD was inconsistent in defining the number of target beneficiary households in its Results Framework, referring to 36,000 as well as 25,000 households. The PDO indicator referred to 36,000 households.
20. The Brazil Sergipe project implemented “socio-economic infrastructure” subprojects, which included productive market- linked investments with technical assistance support, next to other types of subprojects. 1000 (restructured to 500) of these socio-economic subprojects for 20,000 households were the appraisal targets. At completion, 547 subprojects had been implemented in total, benefiting 22,006 households. For this assessment only results for productive subprojects are reported.
21. The original target of 60 alliance subprojects was based on a US$500,000 ceiling per subproject. This ceiling was reduced to US$ 250,000 in 2012, which automatically doubled the possible number of alliances, resulting in an actual financing of 130 alliances.
22. The Brazil Alto Solimôes project was implemented with producers through community associations. Hence, no information on producer organization membership can be provided, but instead the average number of beneficiary households per subproject.
Economic and Financial Analysis of PAAP
II indicate that the bulk of the co-financing
resulted from the beneficiary producers,
mainly through in kind contributions of
assets and family labor. Grants for other
sources were typically in the order of 10% to
20% of total subproject investment costs.
In Bolivia, PAR I reached 28,527 direct
beneficiary households (84% of the end-
of-project target) through 768 partnerships
(114% of the target). Nine products were
the most largely supported by the project
and accounted for 72% of investment costs
(535 subprojects) and about 70% of the
project’s direct beneficiaries. These were
livestock (49%), quinoa (16%), coffee (9%),
and a mix of others (pig breeding, cocoa,
potato seed, peach and sesame, 26%).
The average grant support given by PAR
I amounted to US$2,112 per beneficiary
household and US$78,449 per alliance.
In Guatemala, the PDER project was
expected to reach 30,000 beneficiaries
through 200 productive alliances. At the
end of the project, only 18,115 beneficiaries
(60%) were reached through 174 alliances.
This lower than expected achievement in
Guatemala might be partially explained
by the complex project design and
implementation arrangements, which linked
business plan subprojects to broader local
public investments in various sectors, which
required coordinated implementation
strategies between several line ministries.
While the PDER invested in 13 products,
fruits and vegetable were by far the most
financed (40.7% of the total investments
in productive subprojects), followed by
coffee (28.5%), and basic grains (6.5%). The
Panama PRORURAL project reached 4,577
producers (91% of the appraisal target)
through 130 productive alliances. The
project provided the highest grant support
per beneficiary household (US$4,187)
and the second highest grant support per
alliance (US$147,379). Investments were
concentrated in the following productive
chains: dairy and cattle products, maize,
roots and tubers, traditional fishing,
beats, and others (e.g. sugarcane,
apiculture, fruits, small livestock, etc.).
In Brazil, the Alto Solimôes project
reached 3,252 households (90% of the
end-of-project target) through seven
subprojects and nineteen micro-projects. Of
the Project’s direct productive investment
of US$2,443,383, 90% percent was invested
in the seven subprojects and the remaining
10% in the nineteen micro-projects. The
former were concentrated in inland fisheries
(4 subprojects, representing about 40% of
PA investments), Brazil nuts (1 subproject,
representing 28% of PA investments) as well
as fingerlings and indigenous bees honey
processing. Micro-projects focused mainly
on cassava processing (9 micro-projects,
representing about 5% of PA investments).
According to the ex-post Economic and
Financial Analysis, the average investment
per beneficiary household was about
US$765. Although on the lower side
compared to other PA projects, according
89
to the ICR this “could be considered as a
reasonable amount given the characteristics
of the areas (isolated and logistically
challenging) and the type of beneficiaries
(small farmers with low levels of market
integration)” (ICR Brazil Alto Solimôes,
2015). In the Brazilian State of Pará, the
PA project reached 3,148 households (9%
of the initial appraisal target of 36,000
which was restructured to 4,067 households
during implementation). The project
financed the preparation of subprojects, of
which 41 were actually implemented. The
investment per subproject and beneficiary
household is high in comparison to other
PA projects. The main products financed
through subprojects were (i) agroforestry, (ii)
honey processing, (iii) cassava processing,
(iv) fruit processing, (v) an ice factory, (vi)
poultry and (vii) aquaculture, representing
85% of subprojects and around 84% of
the total investment in subprojects. In
the State of Sergipe, 247 productive
subprojects directly benefited 10,800
households. The most common activities
supported by the subprojects are fishing,
cattle, goat production and agricultural
mechanization (particularly the procurement
of tractors). The average production
investment support given by the project
amounted to US$930 per beneficiary
household and US$40,500 per subproject.
EFFICIENCY: Regarding specific projects, the EFA for
the Colombia PAAP I project was based on
a random sample of 23 productive alliances.
Of these, 69% were found to have a FIRR
higher than 12%, and 31% lower than
12%. Only 13% had a negative return. As
in 2008 the rainfall in the project areas was
significantly higher than average, affecting
productivity of annual and perennial crops,
the returns can be expected to be higher in
the future under normal rainfall conditions.
The EFA for the Colombia PAAP II was
based on a sample of 56 alliances selected
through a two-stage process stratified by
main products and geographic location.
The FIRR was estimated at 29% when only
considering direct costs. When indirect
costs were included, the FIRR decreased
to 27%. To test the robustness of these
results in the face of possible adverse
technical, climate-, or market-related events,
net incremental income was reduced
by 20%. Under this scenario, the FIRR
decreased further to 25%, still a robust
result. Average FIRR range from a high
of 38% for plantains to 18% for rubber.
The EFA for the Bolivia PAR I project was
based on data from the project M&E system
for a random sample of 535 productive
alliances. These represented the nine major
products supported, equivalent to 70% of
direct beneficiaries and 72% of investment
in alliances (dairy, quinoa, coffee beef, pigs,
cocoa, potato seeds, peaches, sesame). It
is the only EFA conducted without primary
data collection. The average FIRR was found
to be 35% (including direct and indirect
investments costs). The products with the
higher performance were quinoa and coffee,
followed by potato seed production and
peaches. The EFA of Guatemala’s PDER
project was based on a random sample of
39 productive alliances. The aggregated
IRR on direct investment costs was 20%,
and considering project management
and monitoring costs proportionate
to the investment is 17%. Similar to
Colombia PAAP II, a 20% reduction of
net incremental income was calculated to
test the robustness of the results against
adverse technical, climate, or market-related
events. As a result, the FIRR decreased to
12%. The EFA of the Panama PRORURAL
project is based on 12 randomly selected
alliances, a smallest sample due to time
and resource limitations and hence not
representative of the sampling universe
with a high degree of statistical confidence.
The average IRR was 11%. However,
about one third of alliances resulted in
negative financial feasibility indicators. In
other words, the generated revenues were
not sufficient to cover total costs when
accounting for the time value of money.
The EFA for Brazil Alto Solimôes was
done individually for each component,
which allowed for an analysis of the
efficiency of the productive alliance
activities. Given the lack of representative
data in the M&E system, the main source
of information for this analysis was the
collection of data carried out by the ICR
mission directly from the management of
the communities benefitting from productive
subprojects and micro-projects only for the
year 2014. Another complementary source
was the partial assessment reports prepared
by the PCU and consultants reports. As
in the other projects, the financial results
were highly heterogeneous, showing
FIRR above 24%percent for subprojects
supporting fishing activities, an average
FIRR of 21% for micro-projects financing
cassava processing units, and FIRR below
the reference rate of 12% for the remaining
subproject investments (honey from native
bees, Brazil nuts and aquaculture). The
incremental net income margin for 2014
varied across products and subproject,
with an average of about US$350 per
household for inland fisheries subprojects,
US$250 for Brazil nuts, US$320 for cassava
processing micro-projects and only US$30
for indigenous bees honey production.
The EFA of Brazil Pará is based on a
cost-benefit analysis conducted for 10
illustrative cases out of seven economic
activities, representing about 84% of the
total investment in subprojects. A weakness
of this is analysis is that the illustrative cases
are not representative of all subproject
activities due to the heterogeneous level
of maturity of each activity financed and in
their size and characteristics. Instead, the
results should be interpreted as viability
estimates of each product. Three scenarios
were analyzed: the current situation, the
minimum scenario and a best case scenario.
The financial analysis shows that if current
90
Linking Farmers to Markets through Productive Alliances
bottlenecks are not solved (i.e. current
scenario), only four of the 10 cases would
attain an FIRR equal or above 12% and
positive net margin (in agroforestry and
aquaculture). The minimum scenario, in
which the existing bottlenecks are assumed
to be overcome to attain both positive
net margin and NPV, is deemed likely to
be achieved by four productions systems
(agroforestry, honey, ice, aquaculture),
while uncertainty about the resolution
of existing problems remains for the
remaining cases (cassava processing,
fruit pulp and poultry) is significant.
The EFA of the productive investments
done in Brazil Sergipe is based on a simple
of 23 subprojects. According to the ICR,
these are proportionally representative
of the most common subproject types:
(i) fishing equipment (8% of productive
investments), cattle and goat production
support (8%) and agricultural mechanization
(46%, mainly tractors). The financial results
were heterogeneous across products, with
an average FIRR of 39%. However, the EFA
states that 8-13% of the 23 subprojects
showed an FIRR below 10%, implying that
56-35% of subprojects generated marginal
or negative financial returns, depending
on assumptions of reduced benefit.
IMPACT EVALUATION METHODOLOGIES
Bolivia PAR IThe Bolivia PAR I project aimed to
implement an impact evaluation since its
inception. Although two baseline surveys
were carried out to inform project design
and execution, they could not in the end
be used for the impact evaluation as they
did not allow for the adequate identification
of treated and non-treated groups. The
2006 survey collected information on local
producers within the project intervention
areas but did not incorporate sufficient
information to identify the surveyed
farmers for follow-up. Similarly, the 2008
survey collected information only from
people who were already effectively
receiving support from the project.
General sampling strategy. The baseline
survey for the follow-up project (PAR II)
was used to estimate the counterfactual
outcomes of the project (PAR). A PAR
II baseline survey was carried out with
producers who had applied to the first
call for proposals and who had passed
the pre-feasibility filter (“opportunity
evaluation”). This survey of potential
PAR II beneficiaries was used to build
a counterfactual control group for the
project’s (PAR) impact evaluation, as
those surveyed were considered by the
project but had yet to receive support,
thus eliminating selection bias. A sample
of PAR beneficiaries was surveyed using
the same questionnaire employed for the
PAR II baseline to allow for comparison.
The survey was designed to show impact
in four intervention areas. Given that it
is impossible to know which producer
organization will effectively receive PAR
II support, the project’s baseline survey
includes a random sample of 3,824
producers pulled from all organizations
which had passed the pre-feasibility phase.
In accordance with the trend observed in
PAR I, it is expected that about half of these
organizations will receive project support.
Simultaneously, a sample of 2,142 PAR
I beneficiaries was surveyed in the four
regions where both PAR and PAR II have had
activities (Norte, Valle, Chaco, Trópico). This
sample was designed to ensure significant
results in each region so as to evaluate PAR’s
regional impact given that the intervention
areas are varied in terms of agro-ecological,
cultural, marketing and socio-economic
settings. The samples were extracted from
the project’s information system (SIGG).
Methodologies used for analyses.
PAR beneficiaries were matched with
producers who had applied to PAR II’s first
call and passed the pre-feasibility phase.
The beneficiaries were then matched with
similar non-beneficiaries in accordance
with the Mahalanobis distance, having
taken into account a set of pre-treatment,
observable characteristics. In order to
evaluate the robustness of the results, a
Propensity Score Matching was also carried
out even though the treated and non-
treated groups did not participate in the
same selection process. Several variables
were included in this matching process,
comprising characteristics related to the
producer, his/her household and family, as
collected through the survey: sex, age, years
of education, number of family members,
migration status, ethnicity, department
of residence, access to basic services
(electricity, water and sanitation), use of
combustibles to cook, number of rooms
per household members and household
construction materials. Non-significant
variables at 10% of significance within
the binary model were excluded from the
matching processes. Although the analysis
uses the ‘5-nearest neighbors’ procedure,
summarized results of ‘nearest neighbor’
and ‘3-nearest neighbors’ are also reported
to show the robustness of the results in
accordance with different specifications.
The matching allowed for a re-weighting
of the non-beneficiary group to bring it
closer to the beneficiary group in order
to reduce the selection bias caused by
observable characteristics. These weights
were used to estimate the counterfactual
outcomes which were compared to
the outcomes effectively attained by
beneficiaries. In order to properly evaluate
the project’s impact,, four income variables
were assessed, including: (i) agricultural
sales that include the market value of
crops, cattle and derivative productions; (ii)
total agricultural income that includes the
market value of sales and the estimated
value of subsistence production; (iii) net
agricultural income that subtracts reported
costs from total agricultural income; and,
(iv) total household labor income that
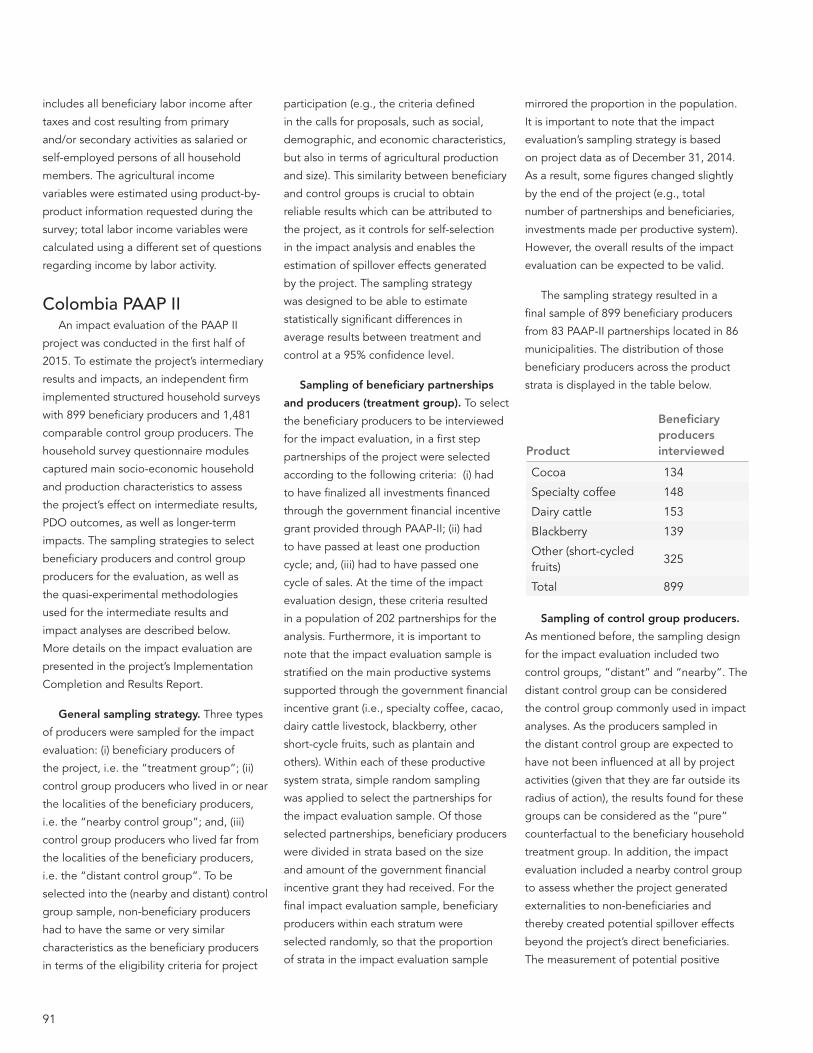
91
includes all beneficiary labor income after
taxes and cost resulting from primary
and/or secondary activities as salaried or
self-employed persons of all household
members. The agricultural income
variables were estimated using product-by-
product information requested during the
survey; total labor income variables were
calculated using a different set of questions
regarding income by labor activity.
Colombia PAAP II An impact evaluation of the PAAP II
project was conducted in the first half of
2015. To estimate the project’s intermediary
results and impacts, an independent firm
implemented structured household surveys
with 899 beneficiary producers and 1,481
comparable control group producers. The
household survey questionnaire modules
captured main socio-economic household
and production characteristics to assess
the project’s effect on intermediate results,
PDO outcomes, as well as longer-term
impacts. The sampling strategies to select
beneficiary producers and control group
producers for the evaluation, as well as
the quasi-experimental methodologies
used for the intermediate results and
impact analyses are described below.
More details on the impact evaluation are
presented in the project’s Implementation
Completion and Results Report.
General sampling strategy. Three types
of producers were sampled for the impact
evaluation: (i) beneficiary producers of
the project, i.e. the “treatment group”; (ii)
control group producers who lived in or near
the localities of the beneficiary producers,
i.e. the “nearby control group”; and, (iii)
control group producers who lived far from
the localities of the beneficiary producers,
i.e. the “distant control group”. To be
selected into the (nearby and distant) control
group sample, non-beneficiary producers
had to have the same or very similar
characteristics as the beneficiary producers
in terms of the eligibility criteria for project
participation (e.g., the criteria defined
in the calls for proposals, such as social,
demographic, and economic characteristics,
but also in terms of agricultural production
and size). This similarity between beneficiary
and control groups is crucial to obtain
reliable results which can be attributed to
the project, as it controls for self-selection
in the impact analysis and enables the
estimation of spillover effects generated
by the project. The sampling strategy
was designed to be able to estimate
statistically significant differences in
average results between treatment and
control at a 95% confidence level.
Sampling of beneficiary partnerships
and producers (treatment group). To select
the beneficiary producers to be interviewed
for the impact evaluation, in a first step
partnerships of the project were selected
according to the following criteria: (i) had
to have finalized all investments financed
through the government financial incentive
grant provided through PAAP-II; (ii) had
to have passed at least one production
cycle; and, (iii) had to have passed one
cycle of sales. At the time of the impact
evaluation design, these criteria resulted
in a population of 202 partnerships for the
analysis. Furthermore, it is important to
note that the impact evaluation sample is
stratified on the main productive systems
supported through the government financial
incentive grant (i.e., specialty coffee, cacao,
dairy cattle livestock, blackberry, other
short-cycle fruits, such as plantain and
others). Within each of these productive
system strata, simple random sampling
was applied to select the partnerships for
the impact evaluation sample. Of those
selected partnerships, beneficiary producers
were divided in strata based on the size
and amount of the government financial
incentive grant they had received. For the
final impact evaluation sample, beneficiary
producers within each stratum were
selected randomly, so that the proportion
of strata in the impact evaluation sample
mirrored the proportion in the population.
It is important to note that the impact
evaluation’s sampling strategy is based
on project data as of December 31, 2014.
As a result, some figures changed slightly
by the end of the project (e.g., total
number of partnerships and beneficiaries,
investments made per productive system).
However, the overall results of the impact
evaluation can be expected to be valid.
The sampling strategy resulted in a
final sample of 899 beneficiary producers
from 83 PAAP-II partnerships located in 86
municipalities. The distribution of those
beneficiary producers across the product
strata is displayed in the table below.
Product
Beneficiary producers interviewed
Cocoa 134
Specialty coffee 148
Dairy cattle 153
Blackberry 139
Other (short-cycled fruits)
325
Total 899
Sampling of control group producers.
As mentioned before, the sampling design
for the impact evaluation included two
control groups, “distant” and “nearby”. The
distant control group can be considered
the control group commonly used in impact
analyses. As the producers sampled in
the distant control group are expected to
have not been influenced at all by project
activities (given that they are far outside its
radius of action), the results found for these
groups can be considered as the “pure”
counterfactual to the beneficiary household
treatment group. In addition, the impact
evaluation included a nearby control group
to assess whether the project generated
externalities to non-beneficiaries and
thereby created potential spillover effects
beyond the project’s direct beneficiaries.
The measurement of potential positive
92
Linking Farmers to Markets through Productive Alliances
spillover effects is important, because
ignoring their existence can lead to an
under-estimation of the overall impact
of a project (e.g., when producers who
benefited from spillovers are selected into
the control group). The nearby control
group for the impact evaluation of PAAP-
II was composed of producers who lived
in or near the localities of the beneficiary
producers, but did not directly benefit
from the project. Producers in both control
groups were randomly-selected from non-
beneficiary producers who lived in or near
the localities of the beneficiary producers
(nearby control group) and/or who lived
far from the localities of the beneficiary
producers (distant control group). The final
control group sample was composed of
582 distant control group producers and
899 nearby control group producers.
Methodologies used for analyses. Due
to the lack of representative baseline data
for the project, the analyses on intermediary
results and impacts used quasi-experimental
methodologies. Regarding the comparison
of results for the beneficiary producers to
the control group producers, it is important
to recall that both nearby and distant control
group producers had to have the same or
very similar characteristics as the beneficiary
producers. As a result, propensity score
matching was used to pair beneficiary
producers and control group producers with
the same or very similar characteristics to
reduce confounding biases in the impact
analysis. For the analysis of intermediate
results, differences in means in the variables
of interest between beneficiary producers
(i.e., treatment group) and control group
producers are presented. For estimating the
project’s impact, difference-in-differences
analysis was used. Finally, expansion factors
were used to make the results representative
of the population of partnerships evaluated.
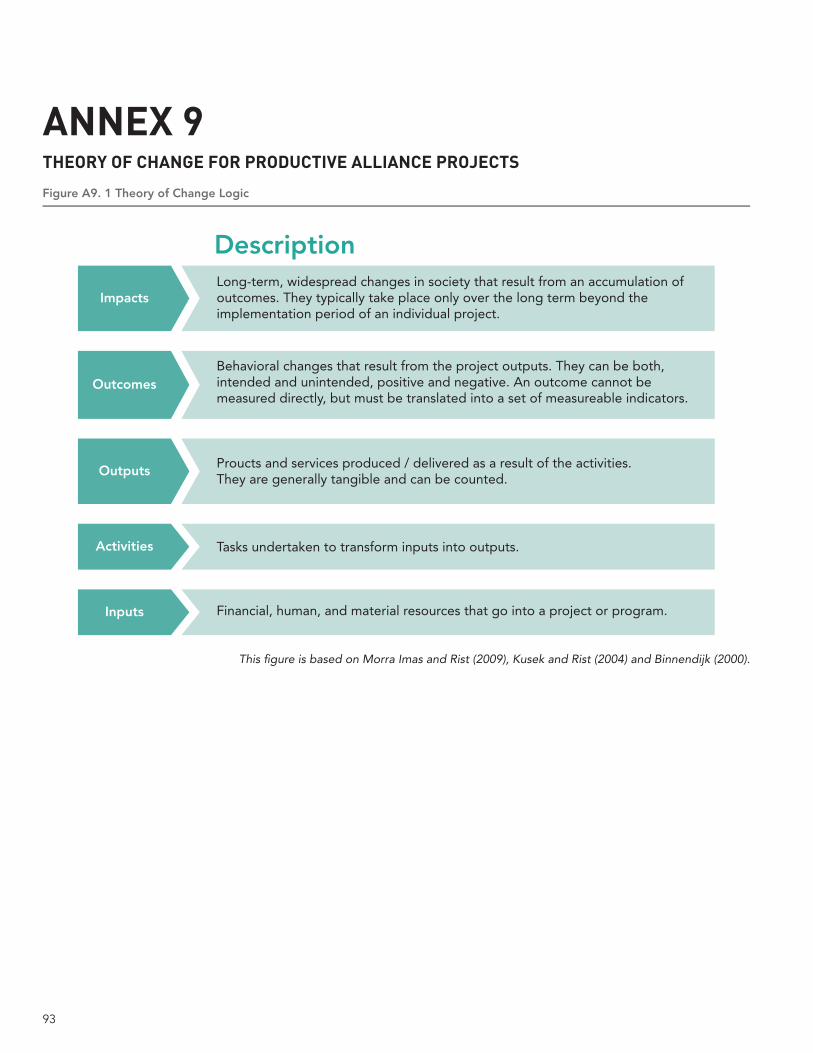
93
ANNEX 9THEORY OF CHANGE FOR PRODUCTIVE ALLIANCE PROJECTS
Figure A9. 1 Theory of Change Logic
Description
ImpactsLong-term, widespread changes in society that result from an accumulation of outcomes. They typically take place only over the long term beyond the implementation period of an individual project.
OutcomesBehavioral changes that result from the project outputs. They can be both, intended and unintended, positive and negative. An outcome cannot be measured directly, but must be translated into a set of measureable indicators.
Outputs Proucts and services produced / delivered as a result of the activities. They are generally tangible and can be counted.
Activities Tasks undertaken to transform inputs into outputs.
Inputs Financial, human, and material resources that go into a project or program.
This figure is based on Morra Imas and Rist (2009), Kusek and Rist (2004) and Binnendijk (2000).
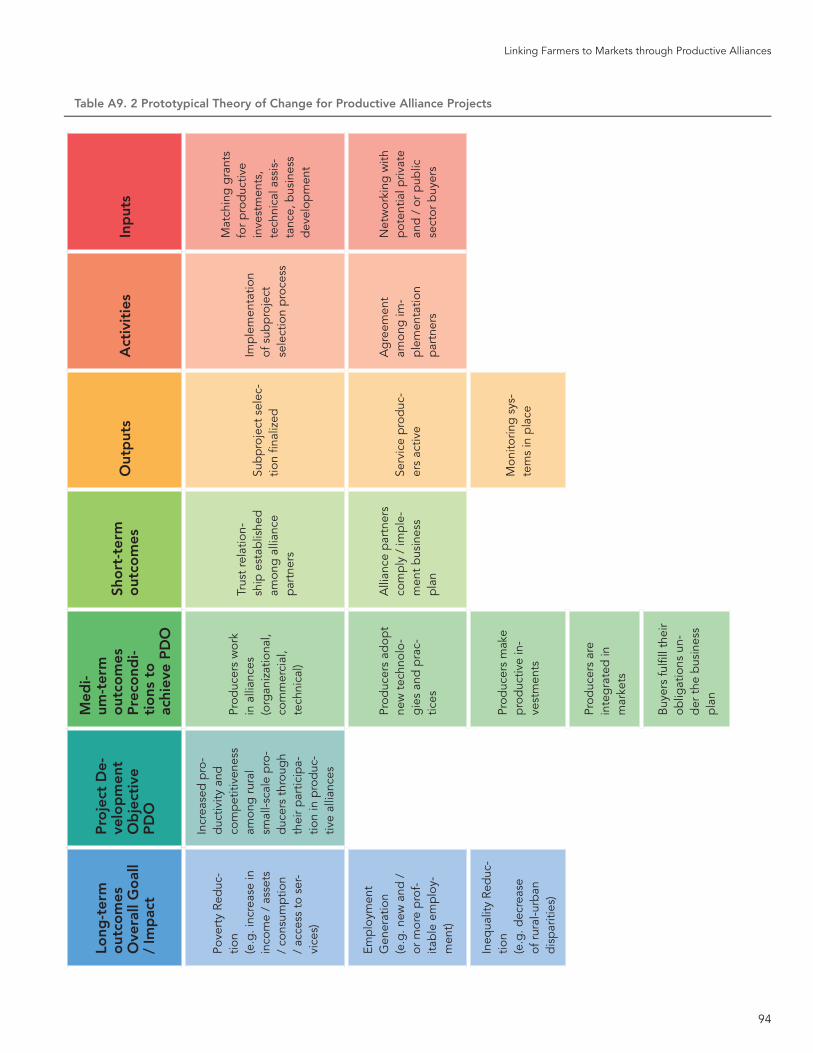
94
Linking Farmers to Markets through Productive Alliances
Table A9. 2 Prototypical Theory of Change for Productive Alliance ProjectsLo
ng-t
erm
o
utco
mes
Ove
rall
Go
all
/ Im
pac
t
Pro
ject
De-
velo
pm
ent
Ob
ject
ive
PD
O
Med
i-um
-ter
m
out
com
esP
reco
ndi-
tio
ns t
o
achi
eve
PD
O
Sho
rt-t
erm
o
utco
mes
Out
put
sA
ctiv
itie
sIn
put
s
Pove
rty
Red
uc-
tion
(e.g
. inc
reas
e in
in
com
e /
asse
ts
/ co
nsum
ptio
n /
acce
ss t
o se
r-vi
ces)
Incr
ease
d p
ro-
duc
tivity
and
co
mp
etiti
vene
ss
amon
g r
ural
sm
all-s
cale
pro
-d
ucer
s th
roug
h th
eir
par
ticip
a-tio
n in
pro
duc
-tiv
e al
lianc
es
Prod
ucer
s w
ork
in a
llian
ces
(org
aniz
atio
nal,
com
mer
cial
, te
chni
cal)
Trus
t re
latio
n-sh
ip e
stab
lishe
d
amon
g a
llian
ce
par
tner
s
Sub
pro
ject
sel
ec-
tion
final
ized
Imp
lem
enta
tion
of s
ubp
roje
ct
sele
ctio
n p
roce
ss
Mat
chin
g g
rant
s fo
r p
rod
uctiv
e in
vest
men
ts,
tech
nica
l ass
is-
tanc
e, b
usin
ess
dev
elop
men
t
Emp
loym
ent
Gen
erat
ion
(e.g
. new
and
/
or m
ore
pro
f-ita
ble
em
plo
y-m
ent)
Prod
ucer
s ad
opt
new
tec
hnol
o-g
ies
and
pra
c-tic
es
Alli
ance
par
tner
s co
mp
ly /
imp
le-
men
t b
usin
ess
pla
n
Serv
ice
pro
duc
-er
s ac
tive
Ag
reem
ent
amon
g im
-p
lem
enta
tion
par
tner
s
Net
wor
king
with
p
oten
tial p
rivat
e an
d /
or
pub
lic
sect
or b
uyer
s
Ineq
ualit
y Re
duc
-tio
n(e
.g. d
ecre
ase
of r
ural
-urb
an
dis
par
ities
)
Prod
ucer
s m
ake
pro
duc
tive
in-
vest
men
ts
Mon
itorin
g s
ys-
tem
s in
pla
ce
Prod
ucer
s ar
e in
teg
rate
d in
m
arke
ts
Buy
ers
fulfi
ll th
eir
oblig
atio
ns u
n-d
er t
he b
usin
ess
pla
n
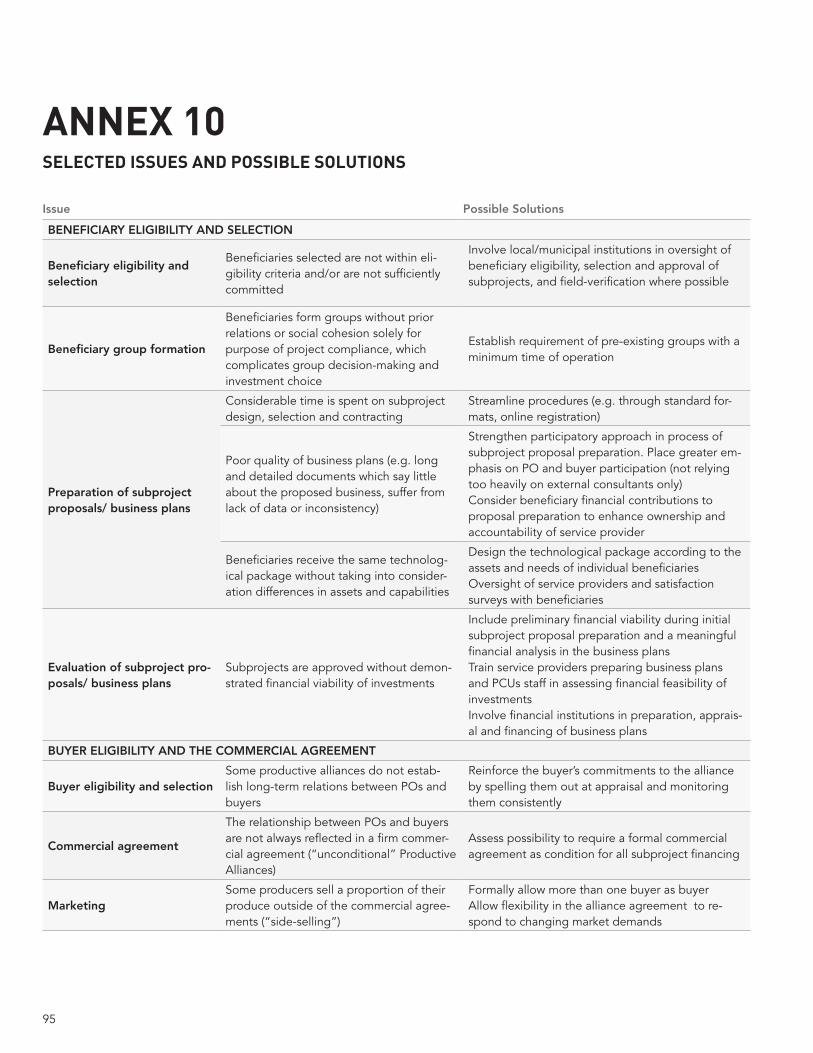
95
Issue Possible Solutions
BENEFICIARY ELIGIBILITY AND SELECTION
Beneficiary eligibility and selection
Beneficiaries selected are not within eli-gibility criteria and/or are not sufficiently committed
Involve local/municipal institutions in oversight of beneficiary eligibility, selection and approval of subprojects, and field-verification where possible
Beneficiary group formation
Beneficiaries form groups without prior relations or social cohesion solely for purpose of project compliance, which complicates group decision-making and investment choice
Establish requirement of pre-existing groups with a minimum time of operation
Preparation of subproject proposals/ business plans
Considerable time is spent on subproject design, selection and contracting
Streamline procedures (e.g. through standard for-mats, online registration)
Poor quality of business plans (e.g. long and detailed documents which say little about the proposed business, suffer from lack of data or inconsistency)
Strengthen participatory approach in process of subproject proposal preparation. Place greater em-phasis on PO and buyer participation (not relying too heavily on external consultants only)Consider beneficiary financial contributions to proposal preparation to enhance ownership and accountability of service provider
Beneficiaries receive the same technolog-ical package without taking into consider-ation differences in assets and capabilities
Design the technological package according to the assets and needs of individual beneficiariesOversight of service providers and satisfaction surveys with beneficiaries
Evaluation of subproject pro-posals/ business plans
Subprojects are approved without demon-strated financial viability of investments
Include preliminary financial viability during initial subproject proposal preparation and a meaningful financial analysis in the business plans Train service providers preparing business plans and PCUs staff in assessing financial feasibility of investmentsInvolve financial institutions in preparation, apprais-al and financing of business plans
BUYER ELIGIBILITY AND THE COMMERCIAL AGREEMENT
Buyer eligibility and selection Some productive alliances do not estab-lish long-term relations between POs and buyers
Reinforce the buyer’s commitments to the alliance by spelling them out at appraisal and monitoring them consistently
Commercial agreement
The relationship between POs and buyers are not always reflected in a firm commer-cial agreement (“unconditional” Productive Alliances)
Assess possibility to require a formal commercial agreement as condition for all subproject financing
MarketingSome producers sell a proportion of their produce outside of the commercial agree-ments (“side-selling”)
Formally allow more than one buyer as buyer Allow flexibility in the alliance agreement to re-spond to changing market demands
ANNEX 10SELECTED ISSUES AND POSSIBLE SOLUTIONS
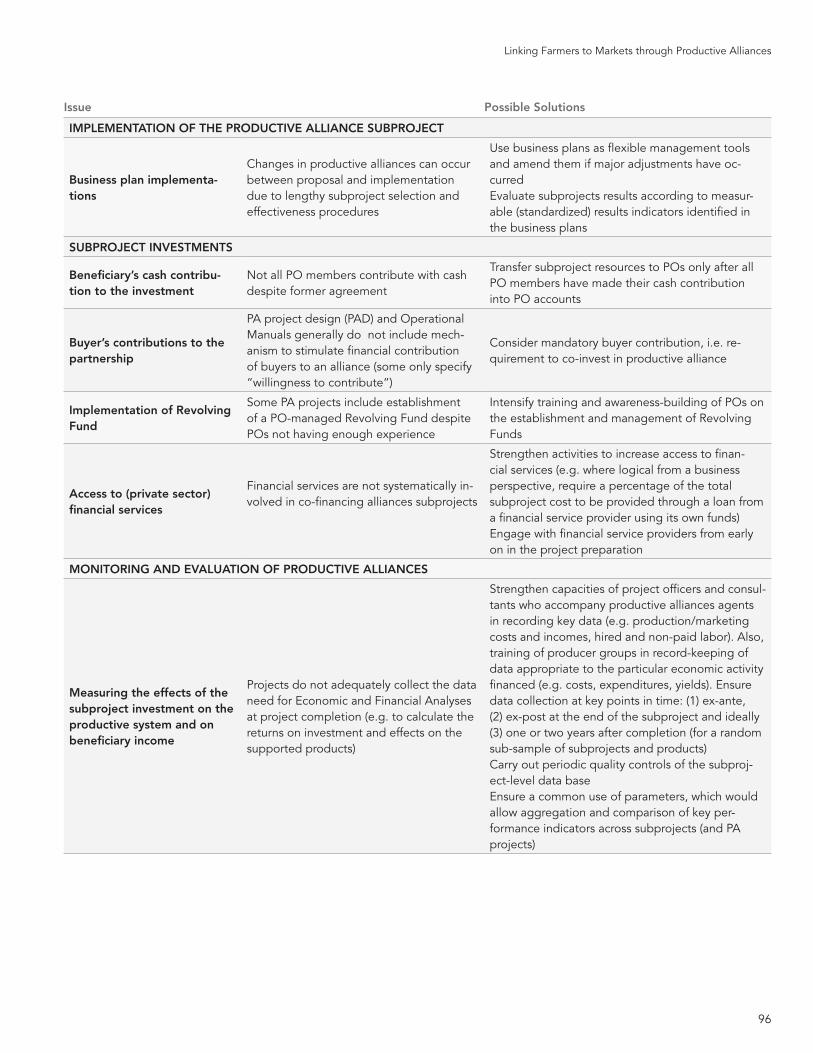
96
Linking Farmers to Markets through Productive Alliances
Issue Possible Solutions
IMPLEMENTATION OF THE PRODUCTIVE ALLIANCE SUBPROJECT
Business plan implementa-tions
Changes in productive alliances can occur between proposal and implementation due to lengthy subproject selection and effectiveness procedures
Use business plans as flexible management tools and amend them if major adjustments have oc-curredEvaluate subprojects results according to measur-able (standardized) results indicators identified in the business plans
SUBPROJECT INVESTMENTS
Beneficiary’s cash contribu-tion to the investment
Not all PO members contribute with cash despite former agreement
Transfer subproject resources to POs only after all PO members have made their cash contribution into PO accounts
Buyer’s contributions to the partnership
PA project design (PAD) and Operational Manuals generally do not include mech-anism to stimulate financial contribution of buyers to an alliance (some only specify “willingness to contribute”)
Consider mandatory buyer contribution, i.e. re-quirement to co-invest in productive alliance
Implementation of Revolving Fund
Some PA projects include establishment of a PO-managed Revolving Fund despite POs not having enough experience
Intensify training and awareness-building of POs on the establishment and management of Revolving Funds
Access to (private sector) financial services
Financial services are not systematically in-volved in co-financing alliances subprojects
Strengthen activities to increase access to finan-cial services (e.g. where logical from a business perspective, require a percentage of the total subproject cost to be provided through a loan from a financial service provider using its own funds)Engage with financial service providers from early on in the project preparation
MONITORING AND EVALUATION OF PRODUCTIVE ALLIANCES
Measuring the effects of the subproject investment on the productive system and on beneficiary income
Projects do not adequately collect the data need for Economic and Financial Analyses at project completion (e.g. to calculate the returns on investment and effects on the supported products)
Strengthen capacities of project officers and consul-tants who accompany productive alliances agents in recording key data (e.g. production/marketing costs and incomes, hired and non-paid labor). Also, training of producer groups in record-keeping of data appropriate to the particular economic activity financed (e.g. costs, expenditures, yields). Ensure data collection at key points in time: (1) ex-ante, (2) ex-post at the end of the subproject and ideally (3) one or two years after completion (for a random sub-sample of subprojects and products) Carry out periodic quality controls of the subproj-ect-level data baseEnsure a common use of parameters, which would allow aggregation and comparison of key per-formance indicators across subprojects (and PA projects)
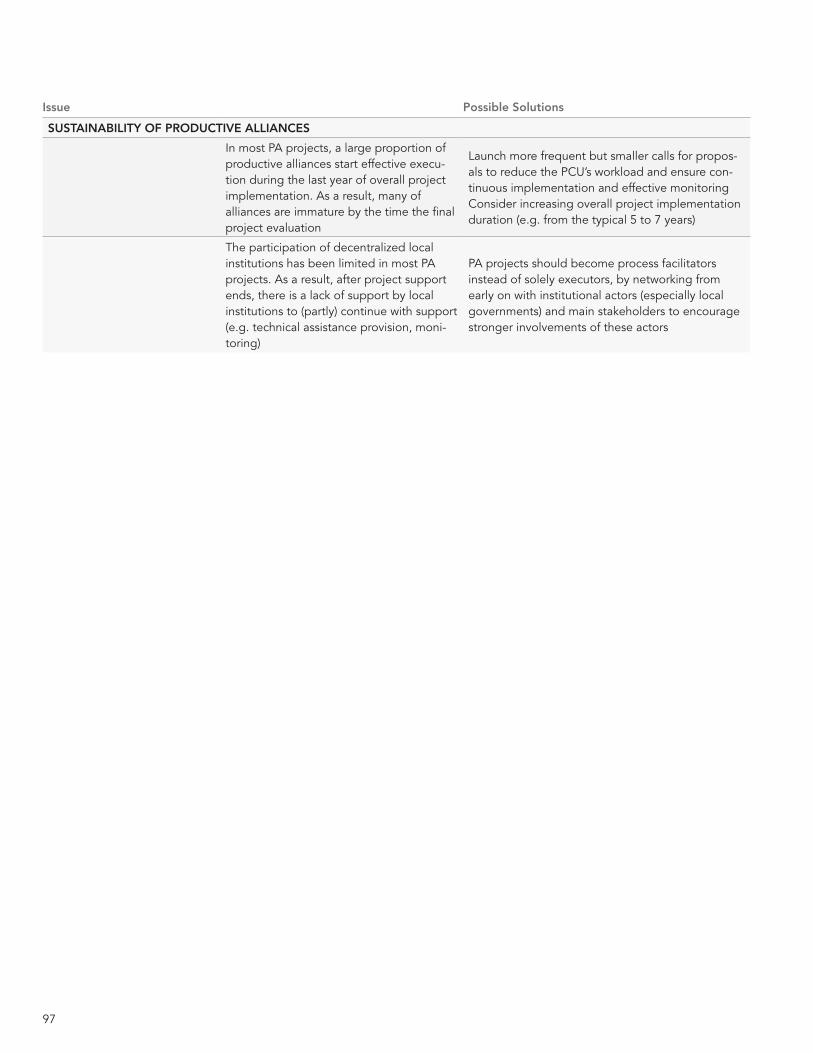
97
Issue Possible Solutions
SUSTAINABILITY OF PRODUCTIVE ALLIANCES
In most PA projects, a large proportion of productive alliances start effective execu-tion during the last year of overall project implementation. As a result, many of alliances are immature by the time the final project evaluation
Launch more frequent but smaller calls for propos-als to reduce the PCU’s workload and ensure con-tinuous implementation and effective monitoringConsider increasing overall project implementation duration (e.g. from the typical 5 to 7 years)
The participation of decentralized local institutions has been limited in most PA projects. As a result, after project support ends, there is a lack of support by local institutions to (partly) continue with support (e.g. technical assistance provision, moni-toring)
PA projects should become process facilitators instead of solely executors, by networking from early on with institutional actors (especially local governments) and main stakeholders to encourage stronger involvements of these actors
98
Linking Farmers to Markets through Productive Alliances
REFERENCES GENERAL
» Berdégué, J. A. and Fuentalba, R. (2011). Latin America: The State of Smallholders in
Agriculture. IFAD Conference on New Directions for Smallholder Agriculture.
» Binnendijk, A. (2000). Results-Based Management in the Development Cooperation Agencies: A Review of
Experience. Paper prepared for the OECD/DAC Working Party on Aid Evaluation, Paris, France.
» Collion, M.H. (2012). Rural Productive alliances. An Inclusive Agribusiness Model for
Overcoming Small-holder Market Barriers. Draft paper (unpublished)
» Collion, M.H. and Friedman, M. (2011). Productive Alliances: A Model for Overcoming
Market Barriers. World Bank Innovative Activity Profile 6.
» De Salvo, P. (2014). Productive Alliances in Latin America and the Caribbean. A Review. FAO Agro-noticias.
» Goldstein, M. (2016). What works for improving welfare in agriculture: version 0.001. World Bank Development Impact Blog
03/09/2016: http://blogs.worldbank.org/impactevaluations/what-works-improving-welfare-agriculture-version-0001
» IEG. (2011). Impact Evaluations in Agriculture: An Assessment of the Evidence.
Independent Evaluation Group. Washington, DC, USA.
» Jaffee, S., Henson, S. and Diaz Rios, L. (2011). Making the Grade: Smallholder Farmers, Emerging Standards, and Development
Assistance Programs in Africa. A Research Program Synthesis. World Bank Report No. 2324-AFR. Washington DC, USA.
» Kusek, J.Z. and Rist, R.C (2004). Ten Steps to a Results-Based Monitoring and Evaluation System. World Bank. Washington, DC.
» Morra Imas, L. and Rist, R.C. (2009). The Road to Results: Designing and Conducting
Effective Development Evaluations. World Bank. Washington DC, USA.
» Reardon, T. and Gulati, A. (2008). The Supermarket Revolution in Developing Countries.
Policies for “Competitiveness with Inclusiveness”. IFPRI Policy Brief 2.
» World Bank. (2015). Ending Poverty and Hunger by 2030. Washington DC, USA.
BOLIVIA RURAL ALLIANCES PROJECT I & II (PAR I & PAR II) » EMPODERAR Program, PAR, Ministry of Rural Development and Land (MDRyT) (2013). Operational Manual. PAR II.
» EMPODERAR Program, PAR, Ministry of Rural Development and Land (MDRyT). Operational Manual (2009) PAR I.
» World Bank. (2015). Implementation Status & Results PAR II (Mid-Term Review). Washington, DC
» World Bank. (2014). Implementation Completion and Results Report (ICR): PAR I. Report No: ICR00003388. Washington, DC
» World Bank. (2013). Implementation Status & Results Report: PAR I. Report No: ISR12872. Washington, DC
» World Bank. (2012). Project Appraisal Document (PAD): PAR II. Report No: 71702-BO. Washington, DC
» World Bank. (2009). Proposed Additional Financing Credit: PAR I. Report No: 47478 – BO. Washington, DC
» World Bank. (2005). Project Appraisal Document (PAD): PAR I. Report No: 32080 – BO. Washington, DC
99
BRAZIL ALTO SOLIMÔES BASIC SERVICES AND SUSTAINABLE DEVELOPMENT PROJECT » World Bank. (2007). Project Appraisal Document.
» World Bank. (2015). Implementation Status Reports.
» World Bank. (2015). Implementation Completion and Results Report.
BRAZIL BAHIA STATE INTEGRATED PROJECT RURAL POVERTY AND SUSTAINABLE RURAL DEVELOPMENT PROJECT » World Bank. (2005). Project Appraisal Document.
» World Bank. (2014). Implementation Completion and Results Report.
» World Bank. (2014). Project Appraisal Document.
» World Bank. (2016). Implementation Status Reports.
BRAZIL CEARÁ RURAL SUSTAINABLE DEVELOPMENT AND COMPETITIVENESS PROJECT » World Bank. (2012). Project Appraisal Document.
» World Bank. (2014). Mid-Term Review Report.
» World Bank. (2016). Implementation Status Reports.
» Brazil Pará Integrated Rural Development Project
» World Bank. (2006). Project Appraisal Document.
» World Bank. (2015). Implementation Status Reports.
» World Bank. (2015). Implementation Completion and Results Report.
BRAZIL PARAÍBA SUSTAINABLE RURAL DEVELOPMENT PROJECT » World Bank. (2016). Project Appraisal Package.
» World Bank. (2016). Implementation Status Reports.
BRAZIL PARANA MULTI SECTOR DEVELOPMENT PROJECT » World Bank. (2009). Project Appraisal Document.
» World Bank. (2016). Implementation Status Reports.
BRAZIL PERNAMBUCO RURAL ECONOMIC INCLUSION PROJECT » World Bank. (2012). Project Appraisal Document.
» World Bank. (2015). Mid-Term Review Report.
» World Bank. (2016). Implementation Status Reports.
BRAZIL SÃO PAULO SUSTAINABLE RURAL DEVELOPMENT AND ACCESS TO MARKETS PROJECT » World Bank. (2010). Project Appraisal Document.
» World Bank. (2016). Implementation Status Reports.
100
Linking Farmers to Markets through Productive Alliances
BRAZIL SANTA CATARINA RURAL COMPETITIVENESS PROJECT » World Bank. (2010). Project Appraisal Document.
» World Bank. (2016). Implementation Status Reports.
BRAZIL SERGIPE INTEGRATED PROJECT » World Bank. (20X). Project Appraisal Document.
» World Bank. (2016). Implementation Status Reports.
BRAZIL RIO DE JANEIRO SUSTAINABLE RURAL DEVELOPMENT PROJECT » World Bank. (2008). Project Appraisal Document.
» World Bank. (2012). Implementation Completion and Results Report.
» World Bank. (2016). Implementation Status Reports.
COLOMBIA PRODUCTIVE PARTNERSHIPS PROJECT I & II (PAAP I & PAAP II) » CIAT. (2014). Productive Partnerships: An effective instrument for the inclusion of vulnerable population
groups in diverse contexts of Colombia. International Center for Tropical Agriculture. Cali, Colombia.
» Escobar, G., María Teresa Palacios, M.T., Cruz Doren, M.E., Lizarazo Beltrán, M.O. (2010). Mid Term Review: PAAP II.
» Ministry of Agriculture and Rural Development (2013). Operational Manual. PAAP I
» Ministry of Agriculture and Rural Development (2008). Final Report. PAAP I
» Ministry of Agriculture and Rural Development (2003). Operational Manual. PAAP I
» World Bank. (2015). Implementation Status & Results Report: PAAP II. Washington, DC
» World Bank (2013). Paper on a proposed project modification: PAAP II. Report No: 74863-CO. Washington, DC
» World Bank. (2009). Implementation Completion and Results Report (ICR): PAAP I. Report No: ICR0000860. Washington, DC
» World Bank. (2015). Implementation Completion and Results Report (ICR): PAAP I. Report No: ICR0003038. Washington, DC
» World Bank. (2007). Project Appraisal Document (PAD): PAAP II. Report No: 39472-CO
» World Bank. (2001). Project Appraisal Document (PAD): PAAP I. Report No: 23246-CO
GUATEMALA PROJECT TO SUPPORT THE RURAL ECONOMIC DEVELOPMENT PROGRAM (PDER) » Ministry of Economy (2014). Final Completion Report.
» SEGEPLAN, Ministry of Economy, FONAPAZ (2013). Operational Manual.
» World Bank. (2015). Implementation Completion Report: Washington, DC
» World Bank. (2014). Implementation Status & Results. Report No: ISR16955. Washington, DC
» World Bank. (2013).Third Amendment to Loan Agreement: Guatemala Project to
Support the Rural Economic Development Program. Washington, DC
» World Bank. (2006). Project Appraisal Document: Report No: 34978-GT. Washington, DC
101
HONDURAS RURAL COMPETITIVENESS PROJECT (COMRURAL) » Mid Term Review (2013). COMRURAL. Honduras Rural Competitiveness Project.
» República de Honduras Secretaría de Agricultura y Ganadería- COMRURAL (2009). Operational Manual.
» World Bank. (2008). Project Appraisal Document. Report No. 43539 – HN. Washington, DC
» World Bank. (2015). Implementation Status & Results Report. Washington, DC
JAMAICA RURAL ECONOMIC DEVELOPMENT INITIATIVE PROJECT (REDI) » Implementation Support Missions to REDI, Aide-Memoires of Mid-Term and January 2015
» Jamaica Social Investment Fund- JSIF (2009). Operational Manual Supplement.
» World Bank. (2009). Project Appraisal Document (PAD). Report No: 49392-JM. Washington, DC
» World Bank. (2014). Implementation Status & Results Report. Washington, DC
MEXICO SUSTAINABLE PRODUCTION SYSTEMS AND BIODIVERSITY PROJECT (SPSB) » Corredor Biológico Mesoamérica, SPSB, GEF, World Bank (2013). Operational Manual.
» World Bank. (2015). Implementation Status & Results Report. Washington, DC
» World Bank. (2012). Project Appraisal Document (PAD). Report No: 66664-MX. Washington, DC
PANAMA RURAL PRODUCTIVITY PROJECT (PRORURAL) » Ministry of Agricultural Development. (2015). Final Evaluation Report.
» Ministry of Agricultural Development. (2011). Final Report: Mid-term Review.
» Ministry of Agricultural Development. (2007, revised 2009). Operational Manual.
» World Bank. (2015). Implementation Completion and Results Report (ICR). Report No: ICR03095. Washington, DC.
» World Bank. (2012). Restructuring: Panama Rural Productivity Project. Washington, DC
» World Bank. (2007). Project Appraisal Document (PAD): Panama Rural
Productivity Project. Report No: 38056 – PA. Washington, DC
PERU SIERRA RURAL DEVELOPMENT PROJECT (ALIADOS) » ALIADOS (2011). Final Draft Evaluation Report.
» Ministry of Agriculture of Peru - ALIADOS (2008). Operational Manual.
» World Bank. (2015). Implementation Status & Results Report. Washington, DC
» World Bank. (2013). Project Paper on Proposed Additional Loan. Report No: 69275-PE. Washington, DC
» World Bank. (2012). Restructuring paper on a Proposed Project Restructuring of ALIADOS. Report No: 73254-PE. Washington, DC
» World Bank. (2007). Project Appraisal Document (PAD). Report No: 37733-PE. Washington, DC

Linking Farmers to Markets through Productive Alliances
An Assessment of the World Bank Experience in Latin America
November 2016