evaluating bangestan reservoirs and targeting productive
TRANSCRIPT
994 © 2016 Sinopec Geophysical Research Institute Printed in the UK
Evaluating Bangestan reservoirs and targeting productive zones in Dezful embayment of Iran
Aynur Nasseri1,4, Mohammad Jafar Mohammadzadeh2 and Seyyed HashemTabatabaee3
1 Department of Mining Engineering, Ahar Branch, Islamic Azad University, Ahar, Iran2 Faculty of Mining Engineering, Sahand University of Technology, Tabriz, Iran3 Head Department of Geophysics, Exploration Directorate of National Iranian Oil Company (N.I.O.C), Tehran, Iran
E-mail: [email protected], [email protected], [email protected] and [email protected]
Received 16 May 2016, revised 1 October 2016Accepted for publication 13 October 2016Published 28 November 2016
AbstractA progressive stepwise procedure was adopted to evaluate the main reservoirs of the Bangestan group in a southwestern oil field of Iran. In order to identify productive zones, the results of lithofacies and well tops correlation were assessed using well log and core data. Accordingly the resulting zonation based on lithofacies revealed inaccurate results. Therefore, in order to limit the uncertainty of zonation, well tops correlations were considered. For this purpose, boundaries of reservoirs were precisely defined and well logs correlation was carried out based on geological information and full set logs. The resulting well tops correlation indicates the presence of several reservoirs such as Ilam and Sarvak formations, and each of these has several zones. Among them, the Ilam formation is recognized as the best reservoir in the field and the Sarvak formation in the second priority for oil production. Due to changes in the facies trend of the Sarvak formation, more than Ilam, the Sarvak formation was mostly considered in this study. Subsequently the Ilam formation was divided into four zones, among them (Ilam-Upper, Ilam- Main, Ilam-Poor) were identified as the oil reservoir units. Similarly, the Sarvak formation was also divided into 11 units, where the Sarvak-L2b unit was identified as the oil-bearing reservoir in the formation. Furthermore, in order to contribute for better analysis of the depositional environment and to improve the understanding of its lateral and vertical variations, 3D modeling of reservoir units was established, which lead to limit the uncertainty in evaluation.
Based on the well correlation results, deep and thickness maps, porosity, water saturation and the hydrocarbon column assessments were prepared, in addition the distribution of petrophysical parameters was also evaluated. Finally, an oil reserve estimation was carried out based on volumetric estimation and its corresponding distribution maps in different reservoir units of the formation were presented. This study indicates that the consecutive sequential approach to the problem, by self controlling the process, lead to the detection of the Sarvak-L2b unit as one of the productive zones in the field. This zone also indicates favorable conditions for high productivity in central areas of the field where the reservoir has a high quality for production.
Keywords: reservoir zonation, hydrocarbon pay zone, well correlations, deposition modeling, reserve estimation, Sarvak formation, Iran oil field
(Some figures may appear in colour only in the online journal)
A Nasseri et al
Printed in the UK
994
JGEOC3
© 2016 Sinopec Geophysical Research Institute
13
J. Geophys. Eng.
JGE
1742-2132
10.1088/1742-2132/13/6/994
Paper
6
Journal of Geophysics and Engineering
IOP
Journal of Geophysics and Engineering
994
1001
2016
4 Author to whom any correspondence should be addressed.
1742-2132/16/060994+8$33.00
doi:10.1088/1742-2132/13/6/994J. Geophys. Eng. 13 (2016) 994–1001
Dow
nloaded from https://academ
ic.oup.com/jge/article/13/6/994/5106833 by guest on 12 July 2022
A Nasseri et al
995
1. Introduction
Reservoir characterization and hydrocarbon potential map-ping is an important domain of reservoir management. Many decisions, such as number and types of infill drilling wells, field development strategies, economic and risk evaluation, and forecasting future reservoir performance, are made based on reservoir characterization studies. Therefore in this paper the integration of multi-disciplinary data such as seismic, well logs, production and completion data were undertaken for careful review of environment variability, anisotropy and to characterize the reservoir accurately. Essentially two important aspects of reservoir characterization include finding reservoir properties away from the well bores and identifying the most productive zones of the reservoir both spatially and vertically. For this purpose, well logs are obtained for estimating recov-erable hydrocarbon volumes, lithology identification, porosity estimation, locating lithological boundaries (MacGregor et al 2008, Gupta et al 2012a, Ghosh et al 2016) and reflecting the heterogeneities of reservoirs in the vertical and plane scale based on well correlation (Miall 1988, Ainsworth et al 1999, Yu et al 2011, Gupta et al 2012b, Chatterjee et al 2013).
Another crucial aspect covered by this paper is reservoir characterization and identification of prolific zones along the cross section of the reservoir. Care has been taken in identi-fication of net pay as a thickness of the reservoir containing a significant volume of potentially exploitable hydrocarbons. The significance of net pay lies in the original hydrocarbon place, calculations of ultimate recovery factors, well test inter-pretations, stimulation and completion designs (Egbele et al 2005, Worthington 2010).
Another important outcome of net pay identification is volumetric calculation of reserves.
The most common method to identify net pay is to select intervals based on their corresponding well log characteristics (Krygowski 2003). This is achieved by the use of petrophysical cutoffs limiting values of formation parameters and removing the noncontributing intervals (Cobb and Marek 1999; Worthington and Cosentino 2003, Worthington 2010, Log Interpretation Charts 1984, Lucia et al 2002). Snyder (1971) discusses the methods to identify net pays using self-potential (SP), gamma ray (GR), porosity logs (NPHI) and core data. Several studies carried out with the aim of identifying pay zones in terms of hydraulic flow units (Abbaszadeh et al 1996, D’Windt 2007, Liu and Mendel 2007, Lee et al 2009, 2011, Guo et al 2010, Lin et al 2010, Tamhane et al 2000). Given the importance of dif-ferent aspects in reservoirs evaluation this study also would like to put an effort in the view of identifying potentially favorable zones and to evaluate reservoir quality based on petrophysical characteristics in a southwestern oil field of Iran.
1.1. Geology of the area
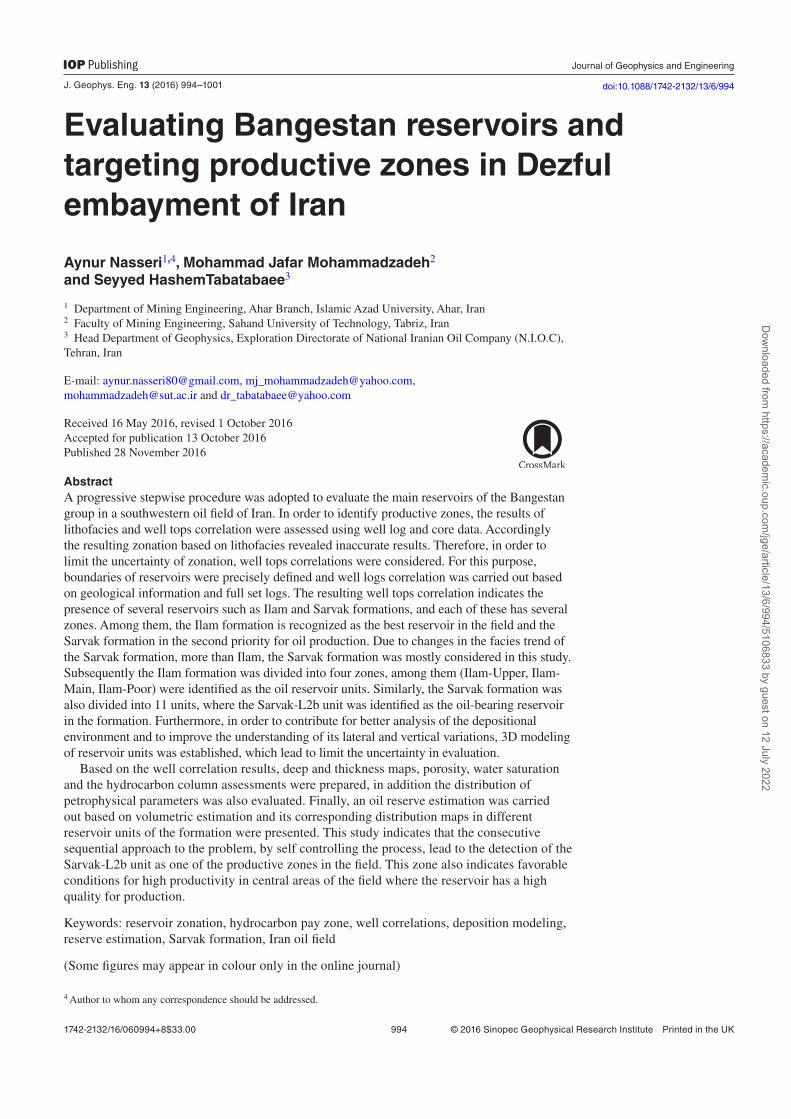
The study area is one of the onshore fields located in the Izeh zone, at Dezful embayment, trending E–NE and W–SW of the Abadan province, SW of Iran. The general trend of the oil field is NW–SE. The SE part of the zone bending toward the south with the most vertical position. The SW part has been subjected to a saddle- shaped depression separated from the main zone (figure 1).
In this figure, most of the Persian Gulf main oil fields are the result of two major important tectonic events, the orogenic phase of the Omman and Zagros mountains which include the structural features of the studied area. The primitive form and structure of the studied field have been formed during the orogenic phase of Omman and subjected to folding in the
Figure 1. Modified and simplified tectonic map showing the location of the study area.
J. Geophys. Eng. 13 (2016) 994
Dow
nloaded from https://academ
ic.oup.com/jge/article/13/6/994/5106833 by guest on 12 July 2022
A Nasseri et al
996
Zagros orogenic event to its final reformation. Since the field is located in the least tension area with limited fracture zones, the fractured reservoirs are expected to be low in this structure.
Zagros basement metamorphic rocks are dominantly com-posed of sets of metamorphosed crystalline complex of gran-ites. The basement complex in Zagros has no exposure and its lithology (granite, granodiorite, granitoid, schists, prob-ably ophiolite, marble and sum metamorphosed sedimenta-ries) have been identified through the fragment rocks of the Hormoz salt dome (Motiei 1995).
The important stratigraphy of the field comprises of the Khami and Bangestan groups and its major oil fields include
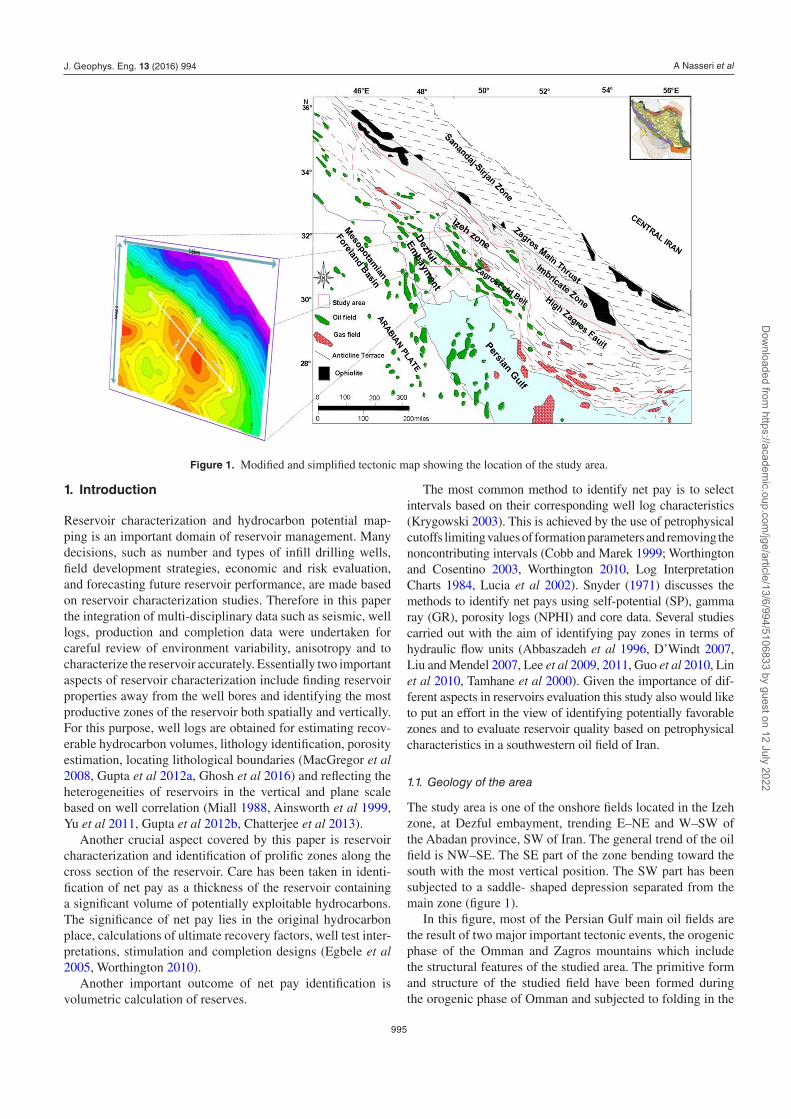
the Kazhdomi, Sarvak and Ilam formations. As the stratig-raphy of the studied area is somehow similar to the S–SE stra-tigraphy of Iraq, therefore figure 2 can be used as an example of the Cretaceous stratigraphy in parts of the Persian Gulf.
From a sequence stratigraphy point of view the Persian Gulf basin formations were deposited in rather specific sequences; these sequences are regularly repeated from the Fahliyan to Kazhdomi formation, deposited under high stand system track (HST) and transgressive system track (TST). A similar trend has also continued in the Sarvak formation, which is also deposited under the HST system and clearly depicted in the chronostratigraphy section (figure 3). It is also evident from
Figure 2. Sequence stratigraphy section of formations from SW of Iran to SE of Iraq.
Figure 3. Chronostratigraphy section of the Sarvak formation from SW of Iran–Iraq to Saudi Arabia.
J. Geophys. Eng. 13 (2016) 994
Dow
nloaded from https://academ
ic.oup.com/jge/article/13/6/994/5106833 by guest on 12 July 2022

A Nasseri et al
997
figure 3 that the Ilam formation deposited above the Sarvak formation with specific discontinuity under the TST and then the HST conditions.
It is notable that facies changes trend in Sarvak more than the Ilam formation through the entire region. In the Khuzestan province where the study area is located, the time interval in which the sedimentation has not been deposited is more than other areas so that in most cases it reaches 20 million years (from the Turonian to Maastrichtian). This duration has a great impact (positive or negative) on the quality of reservoir rocks.
The major reservoirs of the Mesopotamian basin and Zagros fold belt have formed during Cretaceous—Tertiary. Basically, in these two basins the number of oil reservoirs are higher than the gas storages. The major reservoirs belong to the carbonate basin where large sandstones reservoirs in the Cretaceous are also observed. The Jurassic source rock in the Mesopotamian basin is the major source of hydrocarbon in the area. The thermal history of the region suggests that the Jurassic source rock during the Mesozoic–Cenozoic have been subjected to hydrocarbon generation at the appropriate temperature due to burial and continued basin subsidence. Lithologically the Sarvak formation comprises of a thick sequence of white chalky mudstone and dense brownish mud-stone—wackestone where the lower part of this formation is cherty. A few layers of wackestone—packstone also exists in the upper portion of the Sarvak formation, which may contain the oil. Most of the caprocks for large and major oil fields of the Mesopotamian and Zagros fold belt are Cretaceous shales. In most reservoirs of the area, the facies changes along its path have caused reservoir rock to either become a source or cap rock. Similar facies changes have occurred in the studied area with the changes in the sedimentary environ ment creating suitable caprocks in the region. Similarly, the Sarvak reservoir formation also in some parts has been converted to a caprock due to initial changes (sedimentary environment condition) and secondary changes (digenesis). Therefore, mostly Sarvak formation was emphasized and its assessment was undertaken to evaluate reservoir quality and pay zone identification based on petrophysical characteristics. Thus these petrophysical parameters in the carbonate reservoirs, due to the intensity impact of diagnostic changes in sediments after deposition, are much higher than sandstones.
2. Materials and methods
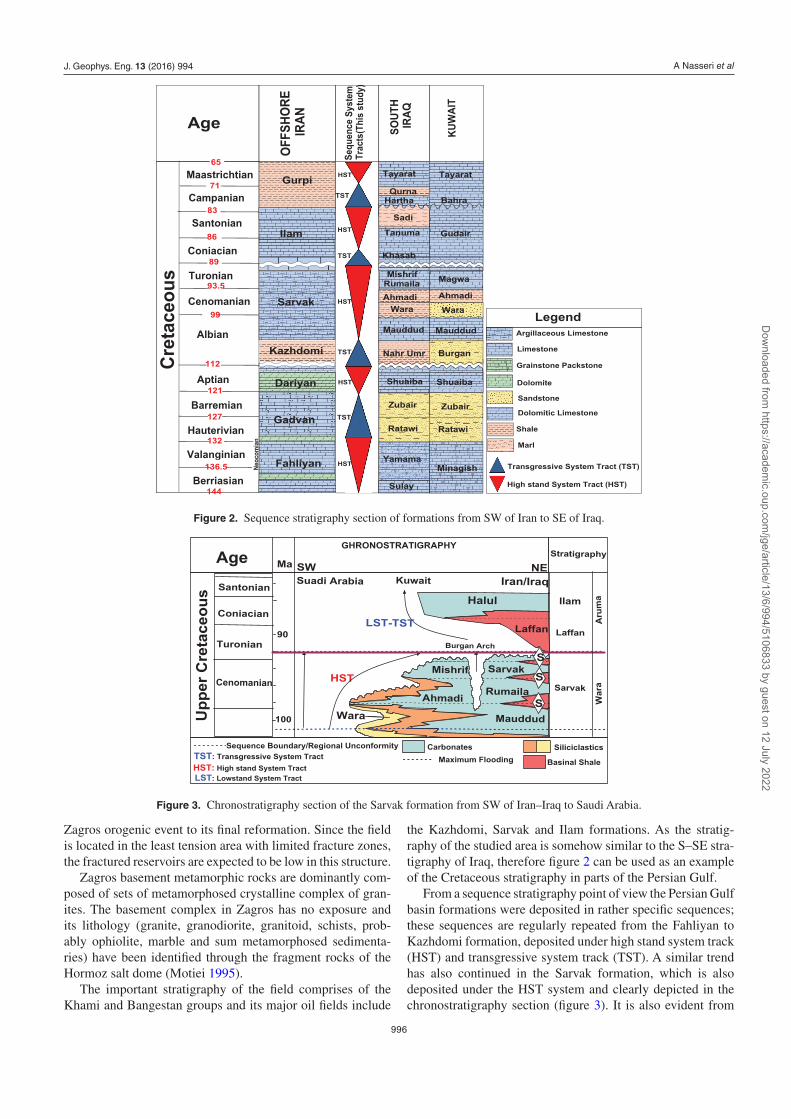
Figure 4 shows formations zoning based on lithofacies (LF) derived from thin section studies, for instance it is presented in two wells.
Figure 4 shows that the LF based assessment of the sequences and zonation was inaccurate, where distribution and interrelation of the sequences between the given wells were not easy to understand. Therefore, in order to limit the uncertainty of the zonation for optimal assessment of reser-voirs, well tops correlation was attempted. The correlation enables the samples to be placed in the correct formations and sequences, and provides information about the depositional system, age and relative location.
The aim of the present well correlation was to correlate the Cretaceous lithostratigraphic and sequence stratigraphic units for all five wells of interest (figure 4), which were focused on the Middle Albian and Santonian interval, including the Ilam to Sarvak formations.
During the data processing, several wire-line logs (GR, DT, NPHI, RHOB, LLD, LLS, MSFL) and evaluated logs (PHE, SWE) were used to aid the reservoir zonation and discrimi-nate productive zones from non-productive ones. All of these logs have the ability to indicate changes in lithology. The bulk density and resistivity logs are especially good for detecting any coal layers. Interpretation of the logs is based on the prin-ciples defined in the interpretation guide by Asquith (2004).
In order to target the reservoir zones, well logs were evalu-ated and different information such as thickness of forma-tions and location of lithological changes were extracted. Subsequently, lithological columns followed by stratigra-phyical section were prepared. Zoning based on lithological changes apparent in each of the logs correspond to the folds longitudinal section was performed and ultimately completed using reservoir engineering data (such as production rate, MDT, DST, etc.).
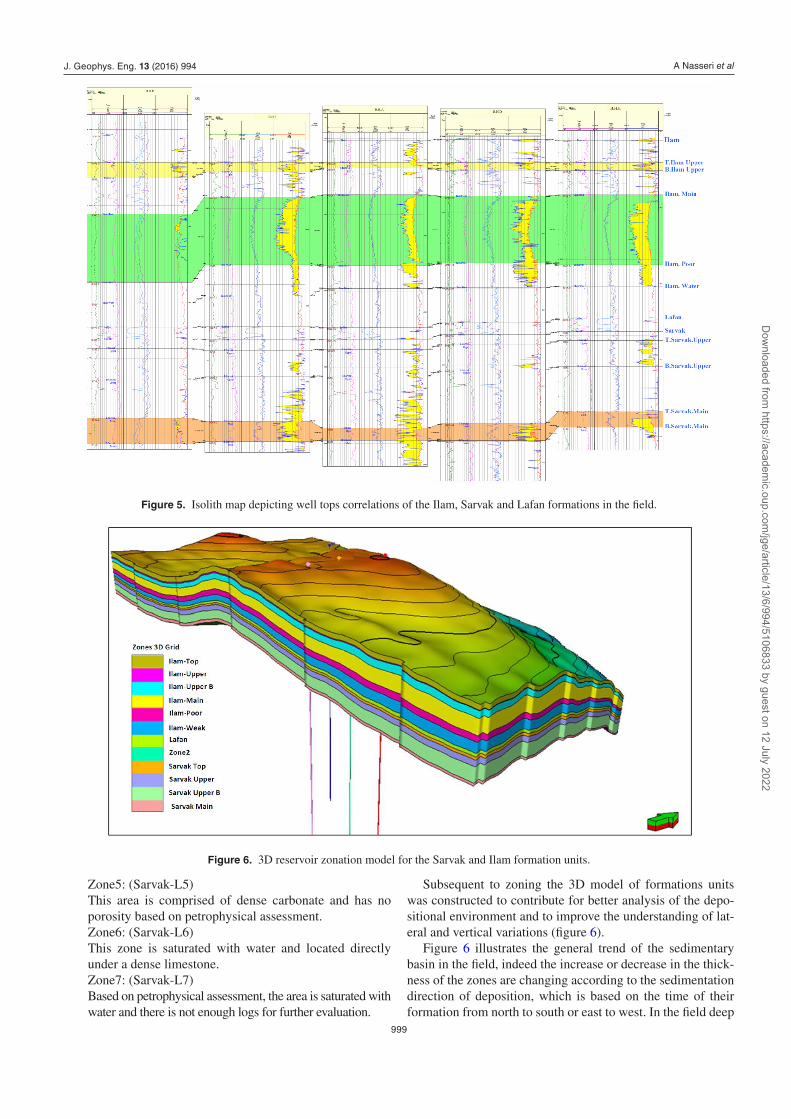
The results that can be deduced from figure 5 indicate more precise well tops correlation of the sequences and zonation in the Ilam, Sarvak and Lafan formations. The main focus of the evaluation was to obtain a correlation between the anoma-lously porous zones and sequences. Accordingly, three main reservoirs have been marked and shown on the isolith map.
After the well correlation was finished and all the well tops set completed, the logs were cross-plotted against each other, to allow a more thorough analysis of the log values. Petrophysical parameters such as net-to-grass and their ratio, effective and non-effective porosity, effective hydrocarbon column and water saturation were also used during data analysis.
In order to study the overall trend of the sedimentary basin in the field, 3D modeling of reservoir units was proposed in figure 6. Ultimately, the mean distribution of Standard Oil Initial in place was estimated based on the volumetric method. This method requires a limited amount of information, and can be used even in the absence of actual drilling of a well. Obviously, if data can be collected from a well, the volumetric estimates will be subject to a much lesser uncertainty than if no well data were available.
3. Results and discussion
From the well correlation results, it becomes evident that the field includes several reservoirs, each of these has several zones. Among them the Ilam formation was recognized as the best reservoir and the Sarvak formation is a subsequent priority for oil production. According to figure 5, three main reservoirs (Upper Elam, Main Elam and Sarvak) have been identified. The Ilam formation from top to bottom was divided into four zones (Ilam-Upper, Ilam-Main, Ilam-Poor) as the oil reservoir units based on the presence of shaly barrier, petro-physical properties, reservoirs pressure and oil–water levels.
J. Geophys. Eng. 13 (2016) 994
Dow
nloaded from https://academ
ic.oup.com/jge/article/13/6/994/5106833 by guest on 12 July 2022
A Nasseri et al
998
Similarly the Sarvak formation also divided into 11 units from the end of the Lafan shale to the end of the Sarvak described as, Sarvak-L1, Sarvak-L2a, Sarvak-L2b Sarvak-L3a, Sarvak-L3b, Sarvak-L3c, Sarvak-L4, Sarvak-L5, Sarvak-L6, Sarvak-L7, IntraSVK. Among these units, the Sarvak-2b was recognized as an oil bearing reservoir unit in this study. A description of each unit and their features have been given as follows;
Zone1: (Sarvak-L1) The SB5-B1 region mainly includes chalky limestone
with veins of shale (figure 5). This area forms the upper Sarvak which is located immediately below the Lafan shale. The thickness of the area is between 37 m to 41.2 m in borehole. It is considered as a potential reservoir layer according to the petrophysical evaluation.
Zone2: (Sarvak-L2) This part is related to the section SB-B2 of the HST deposi-
tion system and is divided into three sub-zones IIA-IIB-IIC based on hydrocarbon potentiality (figure 5). The Sarvak IIB zone was recognized as the main hydrocarbon sub-zone that mainly composed of wackestone—packstone and parts of rudist/algal within the intergranular porosity with thickness of 8.3 m to 12 m. The sub zone of IIC is mainly made up of chalky mudstone—wackestone with inter- granular porosity, which may be saturated with oil.
Zone3: (Sarvak-L3) This zone corresponds to the SB-B2 section of (figure 5)
under the TST deposition system. It has an average thick-ness of 74 meters with no hydrocarbon potential.
Zone4: (Sarvak-L4) This zone is related to the SB-B3 section formed under
the HST system. The average thickness of this zone is 180 m with no hydrocarbon potential.
Figure 4. Formations zoning based on LF in two wells.
5 Sequence boundary.
J. Geophys. Eng. 13 (2016) 994
Dow
nloaded from https://academ
ic.oup.com/jge/article/13/6/994/5106833 by guest on 12 July 2022
A Nasseri et al
999
Zone5: (Sarvak-L5) This area is comprised of dense carbonate and has no
porosity based on petrophysical assessment. Zone6: (Sarvak-L6) This zone is saturated with water and located directly
under a dense limestone. Zone7: (Sarvak-L7) Based on petrophysical assessment, the area is saturated with
water and there is not enough logs for further evaluation.
Subsequent to zoning the 3D model of formations units was constructed to contribute for better analysis of the depo-sitional environment and to improve the understanding of lat-eral and vertical variations (figure 6).
Figure 6 illustrates the general trend of the sedimentary basin in the field, indeed the increase or decrease in the thick-ness of the zones are changing according to the sedimentation direction of deposition, which is based on the time of their formation from north to south or east to west. In the field deep
Figure 5. Isolith map depicting well tops correlations of the Ilam, Sarvak and Lafan formations in the field.
Figure 6. 3D reservoir zonation model for the Sarvak and Ilam formation units.
J. Geophys. Eng. 13 (2016) 994
Dow
nloaded from https://academ
ic.oup.com/jge/article/13/6/994/5106833 by guest on 12 July 2022
A Nasseri et al
1000
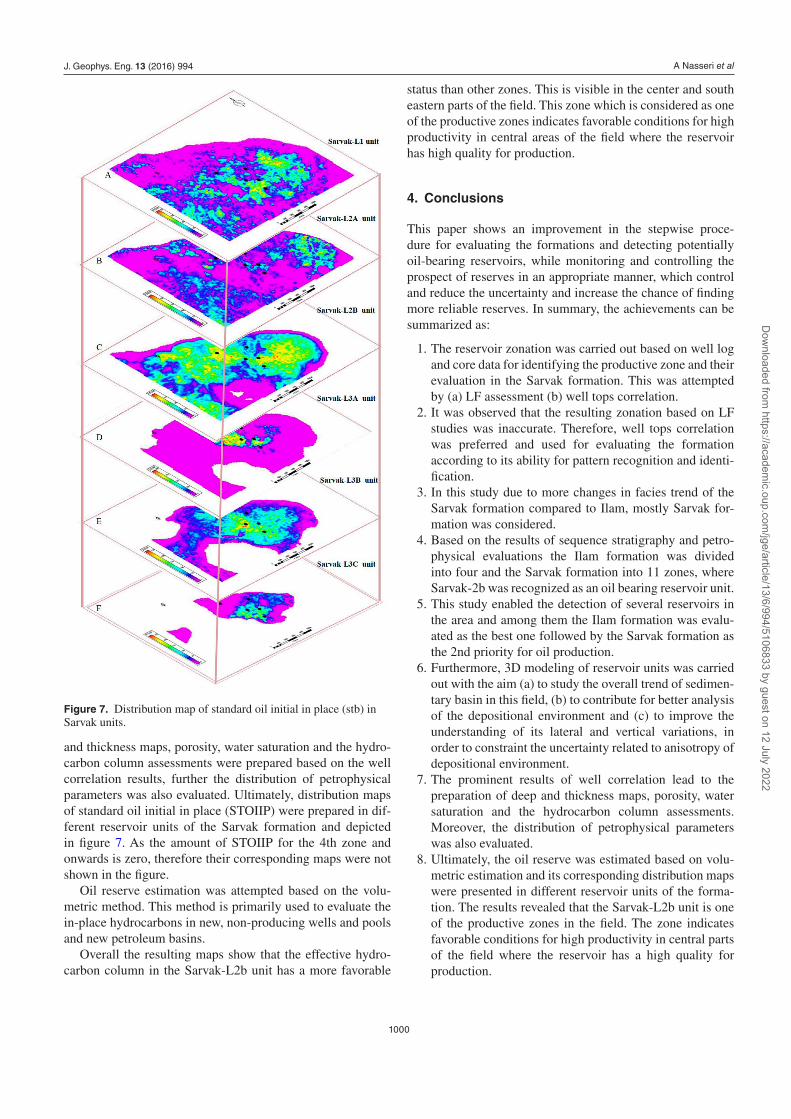
and thickness maps, porosity, water saturation and the hydro-carbon column assessments were prepared based on the well correlation results, further the distribution of petrophysical parameters was also evaluated. Ultimately, distribution maps of standard oil initial in place (STOIIP) were prepared in dif-ferent reservoir units of the Sarvak formation and depicted in figure 7. As the amount of STOIIP for the 4th zone and onwards is zero, therefore their corresponding maps were not shown in the figure.
Oil reserve estimation was attempted based on the volu-metric method. This method is primarily used to evaluate the in-place hydrocarbons in new, non-producing wells and pools and new petroleum basins.
Overall the resulting maps show that the effective hydro-carbon column in the Sarvak-L2b unit has a more favorable
status than other zones. This is visible in the center and south eastern parts of the field. This zone which is considered as one of the productive zones indicates favorable conditions for high productivity in central areas of the field where the reservoir has high quality for production.
4. Conclusions
This paper shows an improvement in the stepwise proce-dure for evaluating the formations and detecting potentially oil-bearing reservoirs, while monitoring and controlling the prospect of reserves in an appropriate manner, which control and reduce the uncertainty and increase the chance of finding more reliable reserves. In summary, the achievements can be summarized as:
1. The reservoir zonation was carried out based on well log and core data for identifying the productive zone and their evaluation in the Sarvak formation. This was attempted by (a) LF assessment (b) well tops correlation.
2. It was observed that the resulting zonation based on LF studies was inaccurate. Therefore, well tops correlation was preferred and used for evaluating the formation according to its ability for pattern recognition and identi-fication.
3. In this study due to more changes in facies trend of the Sarvak formation compared to Ilam, mostly Sarvak for-mation was considered.
4. Based on the results of sequence stratigraphy and petro-physical evaluations the Ilam formation was divided into four and the Sarvak formation into 11 zones, where Sarvak-2b was recognized as an oil bearing reservoir unit.
5. This study enabled the detection of several reservoirs in the area and among them the Ilam formation was evalu-ated as the best one followed by the Sarvak formation as the 2nd priority for oil production.
6. Furthermore, 3D modeling of reservoir units was carried out with the aim (a) to study the overall trend of sedimen-tary basin in this field, (b) to contribute for better analysis of the depositional environment and (c) to improve the understanding of its lateral and vertical variations, in order to constraint the uncertainty related to anisotropy of depositional environment.
7. The prominent results of well correlation lead to the preparation of deep and thickness maps, porosity, water saturation and the hydrocarbon column assessments. Moreover, the distribution of petrophysical parameters was also evaluated.
8. Ultimately, the oil reserve was estimated based on volu-metric estimation and its corresponding distribution maps were presented in different reservoir units of the forma-tion. The results revealed that the Sarvak-L2b unit is one of the productive zones in the field. The zone indicates favorable conditions for high productivity in central parts of the field where the reservoir has a high quality for production.
Figure 7. Distribution map of standard oil initial in place (stb) in Sarvak units.
J. Geophys. Eng. 13 (2016) 994
Dow
nloaded from https://academ
ic.oup.com/jge/article/13/6/994/5106833 by guest on 12 July 2022

A Nasseri et al
1001
Acknowledgment
The authors gratefully acknowledge their special thanks to the Research and Development management office of the National Iranian Oil Company due to offering required data and infor-mation. We also would like to acknowledge our sincere thanks to anonymous reviewers for their constructive comments.
References
Abbaszadeh M, Fujii H and Fujimoto F 1996 Permeability prediction by hydraulic flow units-theory and applications SPE Formation Eval. 11 263–71
Ainsworth R B, Sanlung M and Duivenvoorden S T C 1999 Correlation techniques, perforation strategies, and recovery factors: an integrated 3D reservoir modeling study, Sirikit Field, Thailand AAPG Bull. 83 1535–51
Asquith G B, Krygowski D and Gibson C R 2004 Basic Well Log Analysis (Methods in Exploration 16) (Tulsa, OK: American Association of Petroleum Geologists) p 239
Chatterjee R, Gupta S D and Farroqui M 2013 Reservoir identification using full stack seismic inversion technique: a case study from Cambay basin oilfields, India J. Pet. Sci. Eng. 109 87–95
Cobb W M and Marek F 1999 Net pay determination for primary and waterflood depletion mechanisms SPE Hydrocarbon Economics and Evaluation Symp. pp 9–14
D’Windt A 2007 Reservoir zonation and permeability estimation: a Bayesian approach 48th Annual Logging Symp.: Society of Petrophysicists and Well Log Analysts
Egbele E, Ezuka I and Onyekonwu M 2005 Net-to-gross ratios: implications in integrated reservoir management studies Nigeria Annual Int. Conf. and Exhibition: Society of Petroleum Engineers (doi:10.2118/98808-MS)
Ghosh S, Chatterjee R and Shanker P 2016 Estimation of ash, moisture content and detection of coal lithofacies from well logs using regression and artificial neural network modelling Fuel 177 279–87
Guo S, Cai J, Zhou J, Niu Y, Feng L, Yu Y H and Khong C K 2010 Hydraulic flow unit based permeability characterization and rapid production prediction workflow for an offshore field South China Sea Int. Oil and Gas Conf. and Exhibition in China: Society of Petroleum Engineers (doi:10.2118/131486-MS)
Gupta S D, Chatterjee R and Farooqui M 2012a Formation evaluation of fractured basement, Cambay Basin, India J. Geophys. Eng. 9 162
Gupta S D, Chatterjee R and Farooqui M 2012b Rock physics template (RPT) analysis of well logs and seismic data
for lithology and fluid classification in Cambay Basin Int. J. Earth Sci. 101 1407–26
Krygowski D A 2003 Guide to Petrophysical Interpretation (Austin, TX: American Association of Petroleum Geologists)
Lee K-H, Ortega A, Ghareloo A and Ershaghi I 2011 An active method for characterization of flow units between injection/production wells by injection-rate design SPE Reservoir Eval. Eng. 14 433–45
Lee K-H, Ortega A, Nejad A M, Jafroodi N and Ershaghi I 2009 A Novel method for mapping fractures and high-permeability channels in waterfloods using injection and production rates SPE Western Regional Meeting: Society of Petroleum Engineers (doi:10.2118/121353-MS)
Log Interpretation Charts 1984 Publication SMP-7006 (Houston TX: Schlumberger Ltd)
Lin Y-T, Ortega A, Nejad A M and Ershaghi I 2010 Waterflood tomography: mapping high contrast permeability structures using injection/production data SPE Western Regional Meeting: Society of Petroleum Engineers (doi:10.2118/132699-MS)
Liu F L and Mendel J M 2007 Forecasting injector–producer relationships from production and injection rate using extended Kalman filter SPE Annual Technical Conf. and Exhibition: Society of Petroleum Engineers 14 653–64
Lucia F J, Jennings J W, Kerans C and Ruppel S C 2002 Locating new oil in old carbonate reservoirs AAPG Annual Meeting 2002
MacGregor L, Harris P and Walls J 2008 Reservoir characterization through joint interpretation of EM, seismic and well log data EAGE Non-Seismic Methods Workshop (doi:10.3997/2214-4609.201402602)
Miall A D 1988 Reservoir heterogeneities in fluvial sandstones: lessons from outcrop studies AAPG Bull. 72 682–97
Motiei H 1995 Petroleum Geology of Zagros (Geological Organization of Iran) (in Farsi)
Snyder R H 1971 A review of the concepts and methodology of determining ‘Net Pay’ Fall Meeting of the Society of Petroleum Engineers of AIME: Society of Petroleum Engineers (doi:10.2118/3609-MS)
Tamhane D, Wong P, Aminzadeh F and Nikravesh M 2000 Soft computing for intelligent reservoir characterization SPE Asia Pacific Conf. on Integrated Modelling for Asset Management: Society of Petroleum Engineers (doi:10.2118/59397-MS)
Worthington P F 2010 Net Pay—What is it? What does it do? How do we quantify it? How do we use it? SPE Reservoir Eval. Eng. 13 812–22
Worthington P F and Cosentino L 2003 The role of cut-offs in integrated reservoir studies SPE Annual Technical Conf. and Exhibition: Society of Petroleum Engineers 8 276–90
Yu X, Ma Y Z, Psaila D, La Pointe P, Gomez E and Li S 2011 Reservoir characterization and modeling: a look back to see the way forward Uncertainty Analysis and Reservoir Modeling (AAPG Memoir 96) eds Y Z Ma and P R La Pointe pp 289–309
J. Geophys. Eng. 13 (2016) 994
Dow
nloaded from https://academ
ic.oup.com/jge/article/13/6/994/5106833 by guest on 12 July 2022