linking cultural and marketing practices of (agro)pastoralists
TRANSCRIPT
Citation: Benti, D.W.; Birru, W.T.;
Tessema, W.K.; Mulugeta, M. Linking
Cultural and Marketing Practices of
(Agro)pastoralists to Food (In)security.
Sustainability 2022, 14, 8233. https://
doi.org/10.3390/su14148233
Academic Editor: Hossein Azadi
Received: 9 March 2022
Accepted: 12 May 2022
Published: 6 July 2022
Publisher’s Note: MDPI stays neutral
with regard to jurisdictional claims in
published maps and institutional affil-
iations.
Copyright: © 2022 by the authors.
Licensee MDPI, Basel, Switzerland.
This article is an open access article
distributed under the terms and
conditions of the Creative Commons
Attribution (CC BY) license (https://
creativecommons.org/licenses/by/
4.0/).
sustainability
Article
Linking Cultural and Marketing Practices of (Agro)pastoraliststo Food (In)securityDerib Woldeyohannes Benti 1,* , Worku Tuffa Birru 2, Workneh Kassa Tessema 3 and Messay Mulugeta 4
1 Department of Agribusiness and Value-Chain Management, College of Agriculture, Wolaita Sodo University,Wolaita Sodo 0138, Ethiopia
2 Center for Rural Development, College of Development Studies, Addis Ababa University,Addis Ababa 1176, Ethiopia; [email protected]
3 Department of Management, College of Business and Economics, Addis Ababa University,Addis Ababa 1176, Ethiopia; [email protected]
4 Center for Food Security, College of Development Studies, Addis Ababa University,Addis Ababa 1176, Ethiopia; [email protected]
* Correspondence: [email protected]
Abstract: Many pastoralist communities around the world rely on the traditional livestock farmingsub-sector for a living and to meet their food consumption needs. Food insecurity, on the other hand,is a growing concern in these communities, and the reasons for this must be understood in orderto implement appropriate policy measures to improve food security. Based on data collected fromAramis-Adaar and the Asale pastoralist and agro-pastoralist (hereafter (agro)pastoralist) communitiesin Afar, Ethiopia, this study investigates the relationship between social–cultural–economic character-istics and food (in)security. To measure the severity of food insecurity and assess the associations,we used the household food insecurity access score (HFIAS) and ordered logistic regression, respec-tively. Our findings show that food insecurity in the study area is persistent where improvement infood security is significantly constrained by some culture elements (the (agro)pastoralists’ culturalorientation). It has also been found that the (agro)pastoralists’ market exchange practices, as wellas the centuries-old practice of guro (livestock mobility as a traditional coping strategy), help toreduce food insecurity. These findings contribute to our understanding of food insecurity in the(agro)pastoralist context and thereby add to the ‘move-up’ or ‘move-out’ pastoralist developmentpolicy debate. Therefore, the results suggest that there is a need for a combination of approachesthat combine pastoral production services and market production orientation and capitalize on(agro)pastoralist traditions, such as mobility, to promote sustained (agro)pastoral livelihoods and‘move-up’ the pastoral production system.
Keywords: food security; pastoralism; marketing; culture; Ethiopia
1. Introduction
At the heart of the development goals of poor countries comes the achievement offood security, which is commonly perceived as a state in which everyone has access toadequate, safe, and nutritious food at all times for a healthy and active life [1]. In thissense, food security encompasses sufficiency, access, security, and sustainability and isrelated to both the physical and the economic access to food that meets the dietary needsand (cultural) preferences of the people [2,3]. Food security is therefore a complex phe-nomenon that can be applied at the individual, household, community, and national levelsand can be achieved through three consecutive pathways: availability, accessibility, andutilization [4,5]. The stability of these three pillars (often considered as a fourth pillar),which is mainly influenced by the dynamic interactions between agro-ecology and socio-economics, determines food security [5]. Food insecurity, on the other hand, is a conditionin which people have limited/uncertain physical and economic access to safe, adequate,
Sustainability 2022, 14, 8233. https://doi.org/10.3390/su14148233 https://www.mdpi.com/journal/sustainability
Sustainability 2022, 14, 8233 2 of 22
and nutritious food to meet their dietary needs or food preferences for a productive, healthy,and active life [1]. According to the FAO [6], severely food-insecure people are ‘those whohave likely run out of food, experienced hunger and, at the most extreme, gone for dayswithout eating, putting their health and well-being at grave risk’. Although such a severelevel of food insecurity has the greatest impacts on people’s lives around the world, it isincreasingly concentrated among the drought-prone regions in developing countries suchas those in sub-Saharan Africa [6]. Thus, there is a need to discuss how to increase theresilience of vulnerable groups and to raise understanding about food insecurity. Con-sequently, food insecurity has currently attracted the attention of academia and policiesthat provide better risk management and support for those people who are consideredvulnerable to food insecurity [7,8], as well as appropriate policies for food security indeveloping countries [4,9–11].
The overall socio-economic circumstances and well-being of the people in the (semi)aridregions have been extensively studied. To mention but a few recent ones, vulnerability [12–14],resilience [15], poverty and income inequality [16,17], livelihoods [18], and foodsecurity [19–21] are among many others. In analyzing the status of poverty, Teka et al. [17]employed the expenditure approach (calorie intake per adult equivalent), while Jemal et al. [16]used a multidimensional poverty index (capability, economic wellbeing, and social exclusion).Furthermore, Kahsay et al. [21] used the consumption (calorie) approach (kcal/AE/day) tomeasure household food security status, while Asenso-Okyere et al. [20] used the availabil-ity of food in the household as a proxy for food security. Yet, in another study, the resilienceto food security was explained using measures such as total income, per capita expenditure,asset levels, level of education, and social network [15].
Thus, from the available literature, at least three forms of arguments dominantlyappear. First, the groups identified as “food-insecure” are often gauged as such from thefood availability component, with the view that these groups may not have enough foodto feed their families, mainly because of production failures caused by climate-extremeevents [22]. However, previously, Sen [23], in his seminal work, challenged such viewsof food insecurity from mere availability and introduced food entitlement (accessibility).Accordingly, food insecurity is not only caused by the shortage (supply), but also by a lack ofpurchasing power and access. In this regard, the FAO [6] confirms that despite global effortsand gains in food production towards a food-secure world over the decades, today close to822 million and over 2 billion people are still hungry and experiencing moderate/severefood insecurity, respectively. From the (agro)pastoral context in particular, the availabilityof food alone cannot tell a true story of food security conditions, as better off familieswith resources such as livestock and livestock products may be identified as food-insecuredue to constraints on access to markets. Pastoralists with livestock might still experiencefood insecurity because of limited access to markets where they can sell their livestock topurchase food items. There is, therefore, a need to measure the access component of foodsecurity so that food insecurity can be examined from the point of view of markets andlimited purchasing power [24]. Second, existing studies almost invariably employ indirect(proxy) measures, such as income, food expenditure, household poverty status, dietaryintake, or nutritional and health status [25]. These measures are strongly blamed for notadequately reflecting food access at the household level and thereby capturing only thesufficiency element in household food security analyses [3]. Thus, food insecurity needs tobe addressed using direct measures where previous work has only focused on other aspects.Thirdly, while (agro)pastoralists are largely dependent on their cultural reciprocities [26]and market exchanges for their food needs [27,28], these elements are rarely considered inthe food security analyses. This appears to be a weak link of the food security studies ofthese areas, and thus, the hypotheses regarding food insecurity determinants appear to benot well-grounded.
To fill these gaps, the current study seeks to understand the causes of (agro)pastoralistfood insecurity from the perspective of food accessibility (access), based on data fromthe (semi)arid regions of Ethiopia, which are among the most food-insecure areas of the
Sustainability 2022, 14, 8233 3 of 22
world [6,29]. Most of the people in these areas depend on traditional mobile livestockproduction for food and livelihoods [27], and mainly due to the recurring droughts, thelivestock-based pastoralist production method fails to sustainably support their liveli-hoods [30,31]. These areas also commonly suffer from problems such as low productiv-ity, high poverty [32], food shortages [29], food insecurity [31,33], and environmentalshocks [34]. Consequently, the quality of life in these areas is endangered, and they achievelow welfare outcomes [35].
In attempting to address such stresses and secure livelihoods in (semi)arid regions, thepastoral development policies focus on how to sedentarize pastoralists [36,37]. Such policyorientation has given rise to development prescriptions that advocate ‘moving pastoralistsout of pastoralism’ [38] and sedentarism evaluations towards food security [39]. Yet, theexisting policy efforts deemed to improve wellbeing have attained limited successes [36].Addressing (agro)pastoralist food (in)security from the ‘access’ pillar using experience-based measures uncovers how the pastoral resources are used to tackle food insecurityand provides a complete picture of the causes of food insecurity in the (semi)arid regions.Thus, the study contributes to the body of knowledge by especially considering pastoralistculture elements as determinants of household food (in)security. In addition, adding toeither side of the ‘move up’ or ‘move out’ diverging policy debate, it serves to informpolicy direction.
The remainder of the paper is organized as follows: Section 2 addresses the(agro)pastoralists’ food (in)security and vulnerability. Section 3 provides an overviewof the approaches to and measurement of food (in)security, while Section 4 outlines themethods used. Section 5 reports on the empirical findings, and Section 6 discusses thefindings. Section 7 concludes the paper.
2. (Agro)pastoralist Food (In)security and Vulnerability: A Background Understanding
Food security in rural communities, often measured by the absence of hunger or thelow prevalence of food insecurity [2], is regarded as the state of rural peoples in whichthey have secured access to food for a healthy life at all times [1], while the reverse is astate in which people experience a lack of or a limited access to nutritious food to meettheir dietary needs for an active life, which constitutes food insecurity [1,40]. Furthermore,food insecurity occurs when households lack or face an inadequacy of the resources bywhich to obtain enough food to acquire nutritionally adequate and safe foods in a sociallyacceptable way [2]. In the most extreme cases, food-insecure groups may last for dayswithout eating anything, or in its modest state, they may be likely to run out of foodor go hungry, endangering their health and well-being [6]. Therefore, when it comes toconceptual development and research, food security and food insecurity are inseparable.While the former is used to refer to ‘sufficiency’, the latter refers to an ‘inadequacy’ or a‘lack’ of resources by which to have command over food. Additionally, due to the recentfood crises and the increase in the number of vulnerable populations at both the regionaland the global levels, there seems to be a growing interest in food insecurity [7,8].
There is a high degree of vulnerability to food insecurity among the (agro)pastoralcommunities around the world [12,41]. In this respect, food insecurity is widespread andremains a major development problem for Ethiopia’s pastoralist communities as well [42].Because of this, a high level of malnutrition is often a feature among the pastoralist com-munities of these regions [19]. Studies widely report that a significant proportion of(agro)pastoralists are vulnerable to climate-induced shocks and stresses, often leading toproduction failures [13,14,42]. This, in turn, leads to the depletion of pastoral resources,leading to food shortages. Thus, food security among the (agro)pastoralist communitieslargely depends on their capacity to produce and/or purchase non-pastoral food grains [43]where livestock sales are the main source of income [44]. In response to extreme environ-mental events, pastoralists are heavily engaged with markets and towns to sell livestockand buy grains [45]. Some studies even consider that (agro)pastoralist communities arebecoming more dependent on markets than crop farmers [29,45]. An anthropological study

Sustainability 2022, 14, 8233 4 of 22
of the Afar (agro)pastoralist communities in Ethiopia showed that pastoralists increasinglyturn to the market to meet basic household needs [26].
In light of this, a range of social, cultural, and economic causes contributing to thehigher incidence of food insecurity in (agro)pastoral communities elsewhere have beenidentified. To name but a few, an empirical study conducted to identify the determinantsof food security at the household level among the agro-pastoral communities found thatclimate and climate change-induced hazards (e.g., drought) are the main causes of foodinsecurity, followed by market and service problems (e.g., poor transport facilities) andhuman factors (e.g., mobility restriction and conflict) [14]. Furthermore, Mayanja et al. [46]found that the livelihood system, livestock holdings, involvement in social networks, andlandholding are used to explain food (in)security among the (agro)pastoral communities.Siraje and Bekele [47], on the other hand, found that herd size, income from livestockproduction, and non-farm incomes were positively associated with the food security levelof pastoralists. Yet another study identified livestock ownership (herd size), sex, familysize (adult equivalent), and the mothers’ time constraints as significant factors determiningfood insecurity [21]. In addition to the size of resources owned, such as farmland andlivestock, peace and security also influences food security among the (agro)pastoralistcommunities [20]. Thus, it follows from these that most households in (agro)pastoral areasare characterized by low incomes and a low level of human capital, as well as limited accessto markets and service institutions, such as veterinary services, credits, and extensionservices, which directly or indirectly explain food (in)security situations. Yet, culturalelements appeared to be a loose link in understanding food (in)security in these regions.
3. Overview of Current Approaches to Measuring Food (In)security
To address food insecurity, the research efforts so far have developed models based onsupply, demand, and market failure theories, indicating that the failures are caused by thevulnerability factors [48]. Hence, food insecurity can be explained from both the availability(supply side—represented by Food Availability Decline models referring to the decline inper capita food availability) and the accessibility (demand side—known as Food EntitlementDecline models) directions [23]. In this explanation, food availability and entitlement,respectively, are used to refer to the supply of food and the household’s/individual’scommand over food. Thus, the focus of attention has shifted to the lack of access byhouseholds/individuals to food because of low incomes (entitlements) or the lack ofpurchasing power as the cause of food insecurity [23,49,50]. The adequate supply offood at the national level may not in itself guarantee household-level food security [49].Ensuring enough food is not a sufficient condition for food security unless access tofood is guaranteed [51,52]. It follows from this that it is important to examine the accessto available food in order to understand the persistence of food insecurity in vulnerablecommunities [5]. Accessibility to food is ensured when households have adequate resourcesto obtain appropriate food for a nutritious diet [50]. It depends upon the income availableto the household, the distribution of income within the household, and food prices. Thus,concerns about insufficient food access have resulted in a greater policy focus on incomes,markets, and prices in addressing food insecurity objectives.
There are different measures commonly used to assess food insecurity [25]. Themeasures are broadly identified as indirect or derivative measures (e.g., dietary intake, percapita expenditure on food) [15,20,21] and a fundamental or direct measure (e.g., experience-based food insecurity scales) [53]. The latter is advantageous in capturing the physicalas well as the psychosocial dimensions of food security as it uses scales based on theexperiences perceived by the affected individuals [25].
Given the food insecurity vulnerability context of (agro)pastoralist communities [19],this study used a direct measure of food access, developed based on coping strategies [3].This method is recommended for use with vulnerable communities [9]. Thus, a nine-itemfood insecurity scale, a widely used welfare index called the household food insecurityaccess scale (HFIAS), which has been tested in Ethiopia [8] and was developed by USAID’s

Sustainability 2022, 14, 8233 5 of 22
FANTA Project [54], was used to measure food (in)security. The measure relies on directresponses to the nine questions on (in)secure access to adequate food for the members ofthe household at a point in time (one month previously) [54]. The measurement instru-ment follows a progression that begins with anxiety about food supplies either from ownproduction or the markets (item 1), followed by a decrease in the quality of consumedfood (items 2–4), a decrease in the quantity of food (items 5–7), and finally going to sleephungry (item 8) and going all day and night without eating anything (item 9) [54,55]. Themaximum score is 27, when a household responds ‘often’ to all the nine questions, and theminimum is 0, when the household did not experience any occurrence in the previous fourweeks; hence, the score is within the range of 0–27. The higher the score, the more food-insecure the household is. The final scores in the HFIAS scale are assessed using a scoringalgorithm to determine whether the household fits into one of four different categories ofhousehold food access, ordered as severely, moderately, and mildly food-insecure access orfood-secure access (for details, see Coates et al. [54]).
Following Coates et al. [54] and Knueppel et al. [55], the assessment and groupingwas done as follows:
(a) Food secure—experience none of the food insecurity conditions, or just worry,but ‘rarely’;
(b) Mildly food insecure—worry about not having enough food ‘sometimes’ or ‘often’,and/or unable to eat preferred foods, and/or eat a more monotonous diet thandesired, and/or eat some foods considered to be ‘undesirable’, but only ‘rarely’.However, do not cut back on quantity or experience any of the three most severeconditions (running out of food, going to bed hungry, or going whole day and nightwithout eating);
(c) Moderately food insecure—sacrifice quality more frequently by eating a monotonousdiet or undesirable foods ‘sometimes’ or ‘often’, and/or started to cut back on quantityby reducing the size or number of meals, ‘rarely’ or ‘sometimes’. However, do notexperience any of the three most severe conditions;
(d) Severely food insecure—graduated to cutting back on meal size or number ‘often’,and/or experience any of the three most severe conditions, even as infrequentlyas ‘rarely’.
4. Materials and Methods4.1. Study Area Description
The Afar region is one of the dominantly pastoral regions of Ethiopia. It is estimatedthat 90% of the region’s population depends on pastoralism—herding camels, cattle, sheep,and goats. The area is a sparsely populated dryland region with low and erratic rainfall andagricultural potential along the Awash River valley. Half the region consists of semi(arid)rangeland that can only sustain mobile livestock production, and even the higher rainfallareas are unable to support reliable rain-fed agriculture [56]. The region is divided intofive administrative zones, namely Awsi-Rasu, Kilbeti-Rasu, Gebi-Rasu, Fenti-Rasu andHari-Rasu and constitutes eight livelihood zones (Asale pastoral, Asale agro-pastoral,Teru pastoral, Eli-Daar pastoral, Awsa-Gewane agro-pastoral, Aramis-Adaar pastoral,Namalefane-Baadu pastoral, and Chenno crops Livelihood Zones).
For this study, two livelihood zones, Aramis-Adaar pastoral and Asale agro-pastoral,were purposively selected, mainly to address cultural variations (see also Figure 1). Aramis-Adaar pastoral zone is located within the Awash drainage system in the southwesternquadrant of the region. Its altitude ranges from 500–600 m above mean sea level (amsl)in the east to 600–1000 m amsl in the west. The climate is generally dry with an annualaverage temperature in excess of 30 ◦C and a total annual rainfall of 250–400 mm. It wasselected for the study because pastoralism is the main livelihood in this zone. The largerpart of the zone is adjacent to the neighboring Amhara region and largely dependent onits markets to sell livestock and to purchase grains for food. Hence, it has access to majormarkets (Bati, Kemissie, Sembete) outside the zone. Livestock sales play a dominant role
Sustainability 2022, 14, 8233 6 of 22
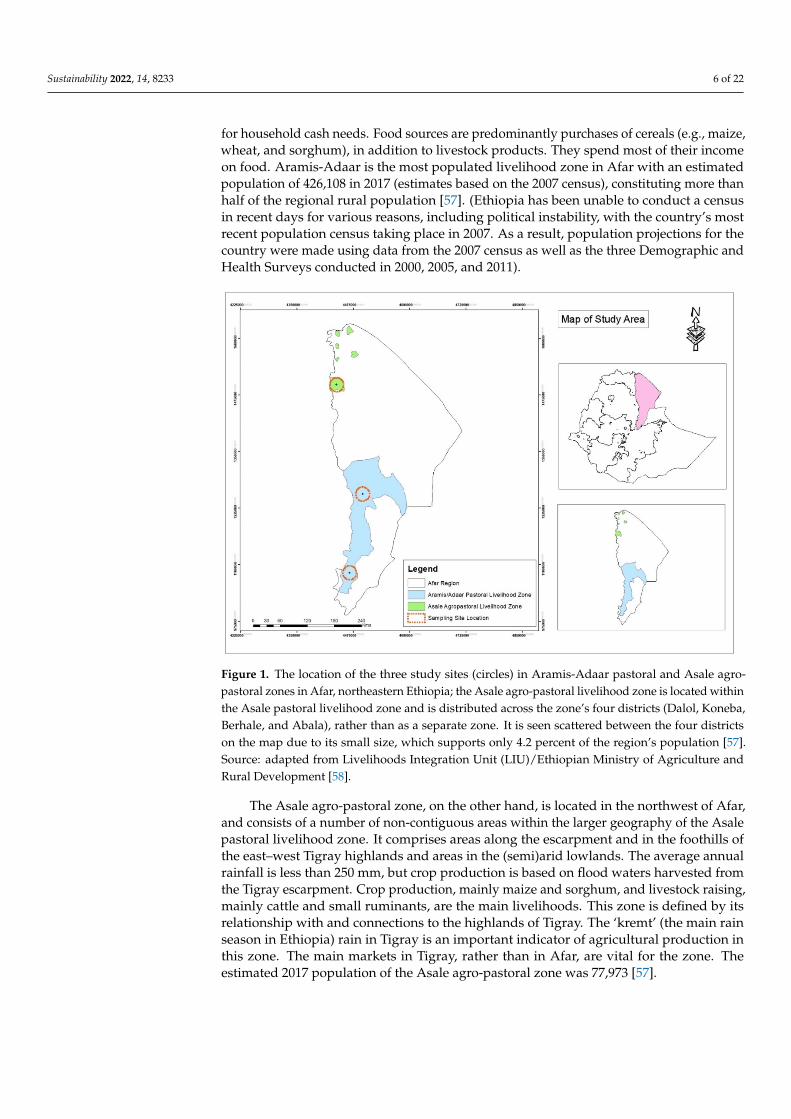
for household cash needs. Food sources are predominantly purchases of cereals (e.g., maize,wheat, and sorghum), in addition to livestock products. They spend most of their incomeon food. Aramis-Adaar is the most populated livelihood zone in Afar with an estimatedpopulation of 426,108 in 2017 (estimates based on the 2007 census), constituting more thanhalf of the regional rural population [57]. (Ethiopia has been unable to conduct a censusin recent days for various reasons, including political instability, with the country’s mostrecent population census taking place in 2007. As a result, population projections for thecountry were made using data from the 2007 census as well as the three Demographic andHealth Surveys conducted in 2000, 2005, and 2011).
Sustainability 2022, 14, x FOR PEER REVIEW 6 of 23
Aramis-Adaar pastoral zone is located within the Awash drainage system in the southwestern quadrant of the region. Its altitude ranges from 500–600 m above mean sea level (amsl) in the east to 600–1000 m amsl in the west. The climate is generally dry with an annual average temperature in excess of 30 °C and a total annual rainfall of 250–400 mm. It was selected for the study because pastoralism is the main livelihood in this zone. The larger part of the zone is adjacent to the neighboring Amhara region and largely dependent on its markets to sell livestock and to purchase grains for food. Hence, it has access to major markets (Bati, Kemissie, Sembete) outside the zone. Livestock sales play a dominant role for household cash needs. Food sources are predominantly purchases of cereals (e.g., maize, wheat, and sorghum), in addition to livestock products. They spend most of their income on food. Aramis-Adaar is the most populated livelihood zone in Afar with an estimated population of 426,108 in 2017 (estimates based on the 2007 census), constituting more than half of the regional rural population [57]. (Ethiopia has been unable to conduct a census in recent days for various reasons, including political instability, with the country’s most recent population census taking place in 2007. As a result, population projections for the country were made using data from the 2007 census as well as the three Demographic and Health Surveys conducted in 2000, 2005, and 2011).
Figure 1. The location of the three study sites (circles) in Aramis-Adaar pastoral and Asale agro-pastoral zones in Afar, northeastern Ethiopia; the Asale agro-pastoral livelihood zone is located within the Asale pastoral livelihood zone and is distributed across the zone’s four districts (Dalol, Koneba, Berhale, and Abala), rather than as a separate zone. It is seen scattered between the four districts on the map due to its small size, which supports only 4.2 percent of the region’s population [57]. Source: adapted from Livelihoods Integration Unit (LIU)/Ethiopian Ministry of Agriculture and Rural Development [58].
The Asale agro-pastoral zone, on the other hand, is located in the northwest of Afar, and consists of a number of non-contiguous areas within the larger geography of the Asale pastoral livelihood zone. It comprises areas along the escarpment and in the foothills of the east–west Tigray highlands and areas in the (semi)arid lowlands. The average annual rainfall is less than 250 mm, but crop production is based on flood waters harvested from the Tigray escarpment. Crop production, mainly maize and sorghum, and livestock raising, mainly cattle and small ruminants, are the main livelihoods. This zone is defined
Figure 1. The location of the three study sites (circles) in Aramis-Adaar pastoral and Asale agro-pastoral zones in Afar, northeastern Ethiopia; the Asale agro-pastoral livelihood zone is located withinthe Asale pastoral livelihood zone and is distributed across the zone’s four districts (Dalol, Koneba,Berhale, and Abala), rather than as a separate zone. It is seen scattered between the four districtson the map due to its small size, which supports only 4.2 percent of the region’s population [57].Source: adapted from Livelihoods Integration Unit (LIU)/Ethiopian Ministry of Agriculture andRural Development [58].
The Asale agro-pastoral zone, on the other hand, is located in the northwest of Afar,and consists of a number of non-contiguous areas within the larger geography of the Asalepastoral livelihood zone. It comprises areas along the escarpment and in the foothills ofthe east–west Tigray highlands and areas in the (semi)arid lowlands. The average annualrainfall is less than 250 mm, but crop production is based on flood waters harvested fromthe Tigray escarpment. Crop production, mainly maize and sorghum, and livestock raising,mainly cattle and small ruminants, are the main livelihoods. This zone is defined by itsrelationship with and connections to the highlands of Tigray. The ‘kremt’ (the main rainseason in Ethiopia) rain in Tigray is an important indicator of agricultural production inthis zone. The main markets in Tigray, rather than in Afar, are vital for the zone. Theestimated 2017 population of the Asale agro-pastoral zone was 77,973 [57].

Sustainability 2022, 14, 8233 7 of 22
4.2. Sampling Techniques and Sample Size Determination
Multi-stage purposive and random sampling procedures were employed to select thestudy settings and sample households, respectively. First, the Aramis-Adaar pastoral andAsale agro-pastoral livelihood zones were purposively selected. From the two livelihoodzones, three districts (two from Aramis-Adaar and one from Asale) were randomly selected.To reduce bias in selecting the study kebeles (the smallest administrative unit in Ethiopia),the kebeles of the three districts were first coded as ‘road-side’, ‘mid-distance’, and ‘distant’,based on their proximity to major roads and different service centers, in consultation withthe enumerators and experts. The study kebeles were then chosen at random from thethree coded groups, proportional to the number of kebeles in the selected districts, bearing13 kebeles for the study. Permission to enter the interview sites was obtained from local au-thorities and the respective clan elders via the recruited local guides (facilitators). Finally, arandom selection of representative pastoral and agro-pastoral households, proportionate tothe size of the households in each kebele, was made under the supervision of pastoral ruraldevelopment experts working in the three research sites (Figure 1). In total, 319 householdswere surveyed.
In determining the appropriate sample size for a study, one usually takes account offactors such as the purpose of the study, the population size from which the sample wastaken, the level of precision, and the confidence level or risk and degree of variability in theattributes being measured [59]. Given these, Cochran [60] proposed a useable formula toyield a representative, proportionate sample in cases of large populations:
n0 =Z2 pq
e2 (1)
where n0 is sample size, Z2 is the abscissa of the normal curve that cuts off an area α atthe tails (1 − α equals the desired confidence level), e is the desired level of precision,p is the estimated proportion of an attribute that is present in the population, and q is1 − p. However, this formula does not consider the population from which sample is taken.Hence, accounting for population size, it can be adjusted using:
n =n0
1 + (n0−1)N
(2)
where is the adjusted sample size and N is the population. However, in populations of aconsiderable degree of homogeneity, such as (agro)pastoralists, it is wise to rely on smallersample sizes than the one scientifically determined [61]. Thus, in this study the actualsize is adjusted to be 341 (though the formula yielded approximately 384). Accordingly,a semi-structured questionnaire survey involving 341 households was administered asthe main survey. However, some 22 recklessly filled and incomplete questionnaires weredropped, and the remaining 319 were used for the analysis (n = 319 is the sample size forthe study; it is for the three districts in total).
4.3. Data Type and Data Collection
This study examines the association between social–cultural–economic characteristicsand the level of food (in)security (which is numerically measured and analyzed using arange of statistical techniques), and hence, quantitative research (cross-sectional researchdesign) was used to collect data from the randomly selected households using a pre-testedsurvey questionnaire. (The original form questionnaire was pretested with a small numberof respondents, and the final version used in the study was modified by removing somequestions and restructuring others. We dropped dietary diversity questions because welearned from the pre-test that pastoralists eat a limited variety of foods and thus decided touse only HFIAS to measure food (in)security). We also removed questions about sellinganimal products because they have no tradition of doing so. Furthermore, we learned fromthe tests that some questions were irrelevant to the agro-pastoral context (for example,

Sustainability 2022, 14, 8233 8 of 22
they share traditions with the neighboring Tigray Region and are not loyal to some Afarcultural practices); so, we used the skip rule while conducting the interview) [59]. Thedata were collected, among others, on the household’s socio-economic variables, livestockholdings and herd characteristics, livestock sales participation, cultural practices, and foodsecurity indicators (using the nine generic HFIAS questions with minor modificationsto use in (agro)pastoralist context). The data collection process was assisted by trainedenumerators who speak the languages of Afar and Tigray (for the cases of Aramis-Adaarand Asale, respectively). The Afar culture does not allow talking to married women unlessthe husbands are part of the discussion; hence, almost all the respondents (above 97%)interviewed were married men with their spouses around. The wives were made part of thediscussions mainly to get information related to food preparations. There were few casescorresponding to interviewed widowed or divorced women (less than 3%). During theinterviews, the husbands at times asked their wives when in need of additional informationto convey. The enumerators talked to men and the women were used to supplement towhat the men said, when invited by the husbands.
4.4. Method of Data Analysis
Household food insecurity is explained as an anxiety about either food supply or thereduced quality or quantity of the food consumed. In this study, the food insecurity wasmeasured using HFIAS (these groups are well-known for their traditional support networksand sharing resources during times of adversity, such as drought. However, meeting theday-to-day family consumption needs and decisions on the sale of livestock other thancamels and cattle are household responsibilities that necessitate individual efforts. Thisensures that HFIAS can be used to assess the food security status of households in suchcommunities). An ordered logit model was employed to predict the associations betweenfood (in)security and the social, cultural, and economic factors. The objective of applyingthe ordered logistic regression was to estimate the odds of being at or below the givencategory and to identify the factors associated with the increased likelihood of being in thehighest levels of food security. The actual values taken on by the outcome variable (severitylevels of food insecurity measured using HFIAS), as 0, 1, 2, and 3, are irrelevant. However,the larger values (say, value 3) are assumed to correspond to ‘higher’ outcomes (foodsecure access), and the smaller values (say, value 0) designate the ‘lower’ levels (severelyfood insecure access) (for details, see also [54]). Assuming that there are ‘n’ independentobservations with ‘p’ predictor variables, the response variable (the HFIAS scores, orderedas ‘mildly’, ‘moderately’, and ‘severely’ food-insecure access and food ‘secure’ access) fallsinto ‘K’ ordered categories (1, 2, . . . , k) [62]. Letting ‘Y’ denote the response variable, thecumulative distribution for ‘Y’ would likely be:
Fj(xi) = Pr(Y ≤ j ‖ Xi = xi1, . . . , Xp = xip); j = 1, 2, . . . , (K− 1) (3)
The cumulative odds model predicts the odds and probability of an observation beingat or below a specific outcome level based on a set of explanatory variables [63]. Becausethere are ‘K’ possible ordinal outcomes, the model makes ‘K – 1’ predictions, each ofwhich corresponds to the accumulation of probability across successive categories. If welet π(Y ≤ j ‖ x1, x2, . . . , xp) = π j(x) represent the probability that a response falls in acategory less than or equal to the jth category (j = 1, 2, . . . , K − 1), then we would have acollection of cumulative probabilities for each case [62]. The final category has a cumulativeprobability of 1.0. With an extension from the general logistic regression model, thepredictions are logits for the cumulative probabilities which relate to the cumulative logit:
ln(Y′ j
)= ln
(π j(x)
1− π j(x)
)= αj + (β1X1 + β2X2 + · · · βpXp) (4)
The cumulative logits associated with being at or below a particular category ‘j’ canbe exponentiated to arrive at the estimated cumulative odds, which are used to find the

Sustainability 2022, 14, 8233 9 of 22
estimated cumulative probabilities associated with being at or below category ‘j’. Hence,the regression equation for the proportional odds model is given as:
Lj(xi) = log(
Fj(xi)1− Fj(xi)
)= β0j + β1jx1i + β2jx2i + · · ·+ βpjxpi (5)
where j = 1, 2, . . . , k categories; x1 i, . . . , xpi are the values of the p predictor variables forthe ith observation; β0 is the intercept/constant; and β1, . . . , βp are the coefficients.
Following Asenso-Okyere et al. [20], Coates et al. [54], Kahsay et al. [21], Lemma et al. [14],Maxwell et al. [8], Mayanja et al. [46], Siraje and Bekele [47], and Vaitla et al. [64], groupsof predictor variables, such as household characteristics, livestock wealth, market inacces-sibility, pastoralist norms, livelihood strategies, and production risk factors were used toestimate the outcome variable (the severity level of the food insecurity).
4.5. Reliability and Validity of the Data and Instrument
Two livelihood zones—Aramis-Adaar pastoral and Asale agro-pastoral (Figure 1)—were included in this study because taking into account different livelihood zones optimizesthe variations and ensures equal representation of the study participants. The decisionon which livelihood zones to include as the target populations was made after consultingwith experts from the regional bureau of pastoral development, who confirmed that thetwo zones chosen were fairly representative. This improves the data’s generalizability andreliability. We then developed the survey instruments after conducting a thorough reviewof previous studies in the fields of pastoralism and food (in)security. We adopted the nine-item HFIAS questions developed by Coates et al. [54], with minor modifications to fit the(agro)pastoral settings. In some instances, we used pre-existing instruments that had beenpublished in peer-reviewed journals (e.g., [39,47]). Because developing a valid and reliableinstrument necessitates multiple iterations of piloting and testing, we called for a “subjectmatter expert review” to assess the instrument’s content validity, involving well-knownexperts from Addis Ababa University and the regional bureau of pastoral development.Then, the original form of the questionnaire was pretested with 15 respondents, and thefinal version used in the study was modified by removing some questions and restructuringothers. For example, we dropped the dietary diversity questions from an earlier version ofthe instrument because we learned from the pre-test that pastoralists eat a limited varietyof foods, and thus, we decided to use only HFIAS questions to assess food (in)security. Wealso removed questions about selling animal products because they have no tradition ofdoing so. Furthermore, we learned from the tests that some questions were irrelevant tothe agro-pastoral context (for example, they share traditions with the neighboring TigrayRegion and are not loyal to some Afar cultural practices); so, we used the skip rule whileconducting the interview.
5. Results5.1. Descriptive Results5.1.1. Household Characteristics and Human Capital
Table 1 presents the social, cultural, and economic characteristics of the sample house-holds. As shown in the table, the average age of the respondents (heads) is 48.6 years.The average available family labor force size—aged between 15 and 64—is 2.8, indicatingthat each household has at least two and at most three labor force members supportingthe household. The average numbers of persons under 5, between 6 and 14, and above64 years old are 1.4, 2.1 and 0.089, respectively, indicating that there are more dependentsin each household. Nevertheless, unlike in the highlands, (agro)pastoralist children aged6–14 serve in the herding of small stock near the homestead. Therefore, the dependentsin the families are under 5 and above 64. The average household size is 6.4. In addition,the data show that 87.8% of the respondents cannot read and write. (We have segregatedbetween ‘unable to read and write’ and ‘read and write’ to measure ‘literacy level’, which

Sustainability 2022, 14, 8233 10 of 22
is a commonly used technique in predominantly illiterate communities, such as that of the(agro)pastoralists, who do not follow the formal education ladder).
Table 1. Social, cultural, and economic characteristics of sample households.
Household Characteristics Mean or % SD or n Minimum Maximum
Livelihood Zone Aramis-Adaar (pastoral)154 (48.3)
Asale (agro-pastoral)165 (51.7)
Age, head 48.59 8.50 30 80Family size 6.44 1.58 2 11
Available family labor 2.81 1.155 1 8Dependency ratio 0.239 0.133 0 0.6
Literacy level Unable to read and write280 (87.77)
Able to read and write39 (12.23)
Livestock wealth (herd size), TLU 12.52 9.75 0.70 57.9Large stock 9.61 8.92 0 52Small stock 2.91 2.24 0 15.2
Female stock 9.95 8.37 0.5 52Male stock 2.57 2.48 0.1 27.5
Purpose of husbandryOwn
consumption191 (59.9)
Accumulations73 (22.9)
Marketing (for sale)55 (17.2)
Livestock sales volume, TLULivestock sales income, ETB
2.0218134.17
1.5816184.85
0.2900
7.886800
Livestock marketing costs 216.30 148.13 10 850Livestock consumption, TLU 0.42 0.52 0 3.6
Livestock purchases, TLU 0.06 0.22 0 1.4Livestock given out, TLU 0.13 0.52 0 6.2Livestock received, TLU 0.093 0.301 0 2
Non-livestock incomes, ETB 974.26 2275.82 0 19500Consumption expenditure, ETB 4158.1 2719.1 1000 12900
Walking times(nearest market)
Half an houror less
37 (11.6)
Up to an hour134 (42.0)
Up to 1 h anda half
42 (13.2)
2 h and more106 (33.2)
Market information access/sources Percent users Percent reliability
Visiting nearby market 57.4 34.17Dagueing 29.5 45.45
Mobile phone 13.2 20.38
Season livestocksold
Gilaal266 (83.65)
Hagai27 (8.49)
Sugum21 (6.29)
Karma5 (1.57)
Extension visitfrequencies
Once17 (5.33)
Twice52 (16.30)
Three times147 (46.08)
More than 3 times103 (32.29)
Reasons for notreceiving credits
No access tocredit
132 (41.38)
No need ofcredit
92 (28.84)
Fear ofrepayment53 (16.61)
No money to repay42 (13.17)
Credit services (no/yes) 266 (83.4) 53 (16.6)Memberships in coops (no/yes) 274 (86.89) 45 (14.11)
Guro (mobility) (no/yes) 221 (69.3) 98 (30.7)Clan consent to sell LS (no/yes) 127 (39.8) 192 (60.2)
Sanction payments in LS (no/yes) 288 (90.3) 31 (9.7)Livestock sharing (no/yes) 213 (66.8) 106 (33.2)
Conflict occurrences (no/yes) 262 (82.1) 57 (17.9)Livestock deaths due to
drought/diseases (no/yes) 212 (66.5) 107 (33.5)

Sustainability 2022, 14, 8233 11 of 22
Table 1. Cont.
Household Characteristics Mean or % SD or n Minimum Maximum
Food self-sufficiency(food availability) 298 (93.42) 21 (6.58)
Food coping strategies Purchases203 (63.64)
Aids104 (32.60)
Sharing/borrowing12 (3.76)
Meals a day Once71 (22.3)
Twice101 (31.7)
3 times andmore
131 (41.1)
As obtained16 (5.0)
Food insecurityprevalence
Severely85 (26.65)
Moderately132 (41.38)
Mildly79 (24.76)
Food secure23 (7.21)
TLU = Tropical Livestock Unit equivalent to 250 kg of live animal weight, where 1 TLU = 10 heads of sheep/goats= 0.7 cattle = 1 camel [65]; LS = Livestock; numbers in parenthesis = %; ETB = Ethiopian currency.
5.1.2. Livestock Wealth, Herd Characteristics, and Purpose of Husbandry
Nearly 48 percent of the respondents are from the pastoral (Aramis-Adaar) livelihoodzone, while the remaining are from the agro-pastoral (Asale) zone. The two zones varyin terms of the social, cultural, and economic variables used in the analysis. The TLUs(Tropical Livestock Units) were aggregated for each household to constitute the measure oflivestock wealth. The average herd size for the entire sample is 12.52 (15.1 for pastoralistsand 10.5 for agro-pastoralists). The sizes of the small stock (sheep and goats) relative to thelarge stock (camels and cattle) and the male stock compared to the female stock are smalleras they are more likely to be sold. The main purpose which the herders give to the livestockis food (milk and dairy products and meat); the majority of them (77.1%) are most likelyto use livestock for food purposes, either directly consuming livestock and/or livestockproducts or selling livestock to purchase food grains. Wealth accumulations in livestock,keeping a number as big as they wish as a sign of wealth, is another reason why theylike to keep livestock. In this regard, 22.9% and 17.2% of the respondents responded that‘accumulations’ and ‘marketing’ were their main purposes (see also Table 1). (Separatelyanalyzed, the ‘pastoralist groups’ were found to be inclined to ‘accumulations’ (61%) astheir main purpose of husbandry, whereas the ‘agro-pastoralist’ groups tended to devotetheir livestock to sale (53%).
5.1.3. Livestock Marketing Practices
All the respondents had participated in selling a minimum number of their holdings;so, there were no records of non-market participants. They sell livestock all year round,but the seasons with the highest sales are the driest seasons between October and Januaryand between May and June, which are locally called ‘gilaal’ and ‘hagai’, respectively. Theaverage TLU of livestock sold (sales volume) and the average income generated fromsales were ETB 2.02 and ETB 18,134.17, respectively. The reasons for why they sell rangefrom grain purchases, transportation fees, family clothing, and medical costs to socialcommitments. The largest expenditure was spent on consumption, as assured by thefood purchase costs, averaging ETB 4,158.00. The results also show that households buylivestock and replace depleted animals with the money left over after they pay for foodgrains. However, it is a minimal and rare case with average purchases of 0.06 TLU, lessthan a sheep or a goat. The marketing costs incurred in the sale of livestock includetransportation, taxes, brokerage/witnesses, and information (mobile phone charges), withan average of ETB 216.3. Regarding access to the market, the majority (88.4%) walk formore than an hour to the main road and the district town to access the livestock or grainmarkets. They access market information through walking to market center, dagueing(the Afar’s traditional information exchange) or using their mobile phones. About 57% ofthem prefer to go to a nearby market rather than dagueing or making cell phone calls toaccess market information. In terms of frequency and earnestness of accessing information,dagueing is a more reliable tool (45%) than the others because it is used on a daily basis and

Sustainability 2022, 14, 8233 12 of 22
makes up their tradition. The data also revealed that accessible households were visitedmore often by extension workers who reside at the district towns and who frequently moveto the easily accessible villages using motorbikes. Close to 80% of them were visited threeor more times a year for counseling. Yet, some villages are too far from the center andnot easily accessible; they were visited less frequently (once or twice a year). About 83%of respondents do not receive credit for any purpose, mainly due to a range of reasons,such as ‘no access to credit’ (42%), ‘no need of credit’ (29%), and ‘fear of or no moneyfor down payment’ (30%). Those who received credit (16.6%) reported that they receivedthe credit from their relatives and neighbors (unofficial sources) and used it primarily topurchase grain and cereals. Among the sampled respondents, only 14% are members inlocal pastoralist cooperatives (see Table 1).
5.1.4. Pastoralist Social Norms
Through the decision of the clan chiefs, each clan watches all the affairs of the indi-vidual pastoralists. The clan leaders’ responsibilities include, among others, controllinglivestock sales and managing communal resources. Individual pastoralists are not freeto choose sales over individual holdings (especially camels) based on their own interests.The clan chiefs intervene in livestock sales, asking “why?” and saying “no!” to sales forunjustified reasons. If a pastoralist wishes to sell one from his herd for unavoidable reasons(e.g., cash needs for non-pastoral food grain purchases), he must first obtain the permissionof his clan. Believing that the owner is doing so for a silly reason, that it is something forhis joy, the clan through the chief would certainly not allow the sales. More than 60% ofthe households in the sample said that their clan chiefs decide on their sales plans, andit is common for livestock to be subject to restrictions in the event of a breach. Sanctionspaid in times of offenses in livestock terms is customary. They also have a tradition togive or receive cattle in the form of gifts or loans. The communal nature of the communityis used to balance the wealth gap through the exchange of resources, and in turn, theirsocial ties are strengthened. Those who do not have enough to sustain their lives receivelivestock from those who have enough. The practice of sharing livestock comes in differentforms. It takes the form of giving/receiving as gifts or loans, where, in the latter case, theloaner uses the milk of the loaned animal. The loaner is also given the right to sell or breedthe offspring of the loaned animals but has to return the parent stock to the owner. Thedata indicated that 33% of the households were involved in livestock transfers (sharing);they had either given out or received livestock of different species in the year before thesurvey. In TLU terms, a maximum of 6.2 is given as a gift or loan, equivalent to 6 camels or62 goats/sheep. Another traditional custom for them is to move along with cattle (called‘guro’ in Afar) in search of pasture and water. It defines their system of husbandry and isoften practiced in times of drought as a coping strategy (see also Table 1).
5.1.5. Production Risk Factors and Coping Strategies
Conflict between clans and within clans (18%) commonly occurs due to competitionfor limited resources in pasture and water supplies, resulting in loss of animals and lives,assaults on livestock, and physical damage. About 34% said that they had experiencedlivestock death due to drought/diseases, which in turn led to production failures andfood shortages. While for only a few (less than 7%) what they produced was sufficientfor consumption, the vast majority suffer from insufficiencies. In addition, with regard tothe frequency of daily meals, almost 60% of households reported that they were served ameal once or twice a day or ate as they got it, which they attributed to a lack of food or theresources to obtain food. Their long experience and tradition of pastoralism has helpedthem develop coping mechanisms such as mobility (69.3%) and food sharing (3.76%).Livestock sales (63.64%) also serve as a coping strategy. Furthermore, food aids for about33% of the sampled households serve as another scheme with which they smoothen thefood deficit seasons, especially the prolonged dry periods. Moreover, non-pastoral activities

Sustainability 2022, 14, 8233 13 of 22
and crop farming (for agro-pastoral groups) also serve as risk-minimizing practices (seealso Table 1).
5.1.6. Prevalence of Food Insecurity: HFIAS Results
Based on the answers to the nine-item HFIAS questions, more respondents reportedaffirmatively (‘rarely’, ‘sometimes’ or ‘often’) to the items indicating less severe food insecu-rity, such as ‘not being able to eat the kinds of food they preferred’, than to items indicatingmore severe food insecurity, such as ‘going a whole day and night without eating’ (Table 2).Affirmative responses to the items range from 22.3% to 97.2%. The item most frequentlyreceiving an affirmative response was: ‘how often are you worried that your householdwould not have enough food?’, while that receiving the least affirmative responses was:‘how often do you or any household member go a whole day and night without eatinganything?’ Thus, a month before the survey period, nearly all the respondents (97.2%)worried that their households would not have enough food to eat due to a lack of resourcesto create food access. However, a few (22.3%) responded that at least one member of thehousehold had experienced going the whole day and night without food. This means thatnearly all of them have experienced anxiety about whether their household would haveenough food. More than 90% of them had to do without preferred foods and ate foods ofless quality that they did not want to eat because of a lack of resources. Close to 70% had toreduce the amount of food that they ate or cut the number of meals due to the economicconstraints on obtain food to eat. Again, 27% mentioned that there was at least one timewithin the last thirty days where there was no food to serve the family. For about 24% ofthe households surveyed, hunger was reported as a daily experience as at least one (adult)member of the household had gone to sleep at night hungry or gone the whole day andnight without eating anything. Accordingly, the households had experienced all the foodinsecurity signals—from anxiety about the supply of food to consuming less preferred(quality) food and a lesser quantity of food to passing a day and night without eatinganything (Table 2). Additionally, the HFIAS results indicate that more than ninety percentof households fall under the food insecure category, i.e., in the mildly (24.76%), moderately(41.38%), or severely (26.65%) food-insecure category, while only 7.21% of them fall underthe food-secure access category (Table 1).
Table 2. Distribution of affirmative responses (‘rarely’, ‘sometimes’ or ‘often’) to HFIAS items.
Because of a Lack of Food or Resources to Obtain Food, in the Past Four Weeks . . . Affirmative Responses (%) 1
How often do you worry that your household would not have enough food? 97.2How often are you or any household member not able to eat the kinds of foods you preferred? 92.8How often do you or any household member have to eat a limited variety of foods? 90.9How often do you/any member have to eat some foods that you really didn’t want to eat? 86.8How often do you/any household member have to eat a smaller meal than you felt you needed? 69.0How often do you or any other household member have to eat fewer meals in a day? 67.7How often is there no food to eat of any kind in your household? 27.3How often do you or any household member go to sleep at night hungry? 25.4How often do you or any household member go a whole day/night without eating anything? 22.3
1 We learned whether households experience anxiety about food supplies from their own production or markets(item 1); a decrease in the quality (items 2–4) or quantity (items 5–7) of food consumed, going to bed hungry (item8), and going all day and night without eating anything (item 9). The percentage values are meaningful on theirown and indicate how many of the households responded affirmatively (“Yes” responses) to each of the items,across the two livelihood zones.
5.2. Econometrics Model Results: Ordered Logistic Regression
Table 3 presents the results of an ordered logistic regression model. The social, cultural,and economic characteristics that are found to predict food (in)security are livestock wealthand sales volumes (values), pastoral development workers’ visits, market inaccessibility,livestock slaughters for rituals (ritualization), guro (mobility), occurrences of inter- and intra-clan conflicts, non-livestock incomes, and livelihood zone effects. Some culture variables

Sustainability 2022, 14, 8233 14 of 22
(such as sanction paying) were not found to predict food (in)security. This might be becausesuch elements are a rare case, where less than ten percent of the sampled householdsresponded affirmatively to the variables of concern (e.g., sanction payments in livestock,Table 1). Due to the heavy impositions for violations of customary norms, members ofthe study community tended to obey customary rules and refrain from activities deemed‘wrong’ in the community. However, excluding the other socio-economic characteristicsfrom the model, culture orientation and market inaccessibility alone exert significant effectson food security, where all the variables but one (guro) are significant (Table 4).
Table 3. Results from ordered logit model.
Variables Coefficients p > |z|Marginal Effects (Level of Food Security)
Severely Moderately Mildly Secure
Livestock sales 0.317 *** 0.002 −0.0410026 ** −0.0116073 0.0459582 ** 0.0066516 *Livestock wealth 0.034 ** 0.031 −0.0044085 * −0.001248 0.0049413 * 0.0007152 *Livelihood 2.893 *** 0.000 −0.373585 ** −0.105757 0.4187374 ** 0.0606046 **Age −0.013 0.383 0.0016167 0.0004577 −0.001812 0.0606046Family size −0.098 0.206 −0.0127377 −0.0036059 0.0142772 0.0020664Livestock consumption −0.152 0.639 0.0193956 0.005965 −0.0221332 −0.0032274Livestock accumulation 0.180 0.700 −0.022523 −0.0082233 0.0267804 0.0039658Livestock slaughters −1.045 *** 0.000 0.1349084 ** 0.0381908 −0.1512137 ** −0.0218854 *Extension services 0.401 *** 0.007 −0.0518158 ** −0.0146684 0.0580783 ** 0.0084058 *Market access −0.475 *** 0.000 0.0614067 ** 0.0173834 −0.0688284 ** −0.0099617 **Coping by sharing 0.324 0.656 −0.0376239 −0.0206544 0.0504248 0.0078535Coping by purchase −0.185 0.468 0.0235329 0.00764 −0.0271885 −0.0039844Livestock sharing 0.448 * 0.089 −0.0550396 −0.022479 0.0673513 0.0101673Sanctions −0.071 0.861 0.0093919 0.0022243 −0.0101629 −0.0014533Conflicts −0.787 ** 0.027 0.12036 * −0.0084779 −0.0986528 * −0.0132293 *Mobility (guro) 0.706 * 0.042 −0.08334 * −0.0428275 0.1090015 0.017166Clan consent −0.065 0.849 0.0082857 0.0024346 −0.0093613 −0.001359Non-Livestock income 0.002 *** 0.001 −0.0000244 ** −6.90e−06 0.0000273 ** 3.95 × 10⁻⁶ **Credit access −0.202 0.466 0.03668 0.0067209 −0.028966 −0.0041681
Obs. = 319, LR χ2(19) = 213.50, Prob. > χ2 = 0.000, Log likelihood = −292.88569, Pseudo R2 = 0.2671
***, **, * significant at 0.1, 0.05, 0.01 level of significance, respectively.
Table 4. Culture and market inaccessibility variables on food insecurity: an ordered logit.
Variables Coefficients p > |z| Marginal Effect
Livestock accumulations 0.5479312 * 0.096 0.0990574Livestock slaughters (ritualization) 1.177119 *** 0.000 0.196275Livestock sharing 0.335985 ** 0.041 0.2891918Sanctions paying in livestock 0.6487281 * 0.090 0.1239526Livestock mobility (guro) −0.080485 0.788 −0.0133001Clan consent for selling livestock 1.374176 *** 0.000 0.2117139Market inaccessibility 0.3494806 *** 0.001 0.0582731
*, **, *** significant at 0.1, 0.05, 0.01 level of significance, respectively.
5.2.1. Livelihood Strategy
The results from the econometrics analysis show that the state of food insecuritymarkedly varies between pastoralists and agro-pastoralists. Noticeably, pastoralists haveabout a 37% chance of being severely food-insecure as compared to agro-pastoralists. Theresult further confirms that the probability for pastoralists to be food-secure is only 6%,which means that food insecurity among the pastoralists is more severe than it is with theagro-pastoralists. Unlike pastoralists, agro-pastoral groups engage in non-pastoral activitiessuch as growing crops (crop production is usually done once or twice a year, using floodwaters harvested from the Tigray escarpment), which helps them diversify their income

Sustainability 2022, 14, 8233 15 of 22
to ensure food security. In this regard, the result corresponding to non-pastoral activitiesconfirms that crop income contributes significantly to food security (p-value = 0.000).
Similarly, livestock wealth and food security show a positive link. Increasing herd sizecan cause a transition from lower levels of food security to higher levels. A TLU increase inherd size reduces the probability of being severely food-insecure by 0.44% and increases theprobability of food-secure access by 0.07%. Livestock serve as the main source of animalsource foods that support consumption and can be converted into cash to facilitate access tonon-pastoral food grains. The results confirm that there is a positive relationship betweenfood security and livestock sales, which is expressed as sales volume (TLU) or sales revenue(cash value). The results of the model show that a unit increase in sales volume or totalrevenue from sales reduces the probability of the severity of food insecurity by 4.1%.
5.2.2. Access to Market and Extension Services
The association between market access and food security is found to be the inverse,indicating that as pastoralists and (agro)pastoralists walk farther to reach the nearest marketto trade with pastoral or non-pastoral products, their level of food security significantlyreduces. Specifically speaking, an hour increase in the walking distances to market centerscauses the likelihood of food security to decrease by 1%. Furthermore, a significant pos-itive association is found between the frequency of extension services and food security,suggesting that as the number of visits by extension workers increases the tendency forhouseholds to improve their food security increases by a factor of 0.4.
5.2.3. Conflict—A Risk Factor
An increase in the likelihood of conflict worsens food insecurity by 12.04%. As theinhabitants are more exposed to inter- and intra-clan conflicts, they suffer from damagesuch as livestock raids, loss of life, and physical damage to the available labor force. This inturn results in a decline in stock. As the level of yield and income derived from livestock is afunction of the level of stock (herd size), the overall result is thus to assume production andincome levels less than the actual potential, limiting its contribution towards food security.
5.2.4. Mobility (Guro)—A Coping Strategy
The mobility of livestock, which is often viewed as a coping strategy, has a positiveeffect on food security, at a significance level of less than 0.05 (p-value = 0.042). For herdersmoving along with their livestock in search of better pasture and water, a unit increasein the likelihood of mobility leads to a reduction in the severity of food insecurity by8.3 percentage points.
5.2.5. Ritualization—A Culture Orientation
As can be seen from Table 3, a TLU increase in livestock slaughters for rituals (ritual-ization) leads to 13.5 percentage point increases in the probability of severe food-insecureaccess, and 2.2% decreases in the probability of food-secure access. More appreciably, whentreated separately, cultural elements (except guro) and market inaccessibility are positivelyand significantly associated with severe food insecurity levels. The cultural variables causethe severity levels (in probability terms) of food insecurity to increase by 10–30 percentagepoints (Table 4).
6. Discussions
Pastoralists entirely and agro-pastoralists partly are culture-oriented in the sense thatthe purpose of raising their livestock is more for accumulation or rituals. For example, forthe ritual, large-scale slaughter is practiced, in which a large number of villagers gatherin groups for celebrations and meals. This happens occasionally and may not help tosmoothen a person’s daily consumption; rather, it depletes livestock resources. Theydedicate livestock to rituals, which means that they have less of a livestock product supplyto use as food or for exchange in the market in order to have a command over food. This

Sustainability 2022, 14, 8233 16 of 22
suggests that such a culture orientation greatly exacerbates the severity of food insecurity inthe study area to a considerable degree. In addition, pastoral communities are vulnerable toand live under various production risk factors, such as drought, conflict, and animal disease.Conflict, for example, is a major risk factor for (agro)pastoralist production. Due to theserisk factors, livestock deaths and raids are common and erode pastoral resources (livestock),thereby weakening consumption. Market inaccessibility is another issue that constrains(agro)pastoralist food security. The long travel period for entry into the market means thatherders would be discouraged to trade with their produce, which in turn constrains themto trade in non-pastoral foods for consumption. Therefore, it emerges from the findingsthat cultural orientation, production risk factors, and poor marketing infrastructures areaggravating food insecurity among (agro)pastoralists. Conversely, the externally inducedand infrastructure-constrained market exchange practices by (agro)pastoralists and theirlong-lived tradition of ‘guro’ contribute to improving food security.
6.1. (Agro)pastoralist Market Exchange Practices and Food (In)security
In fact, households with a greater number of livestock resources of different speciesare advantaged in terms of consumption smoothing. They are affluent with animal sourcefoods and with the marketable surplus of livestock and livestock products. In the firstcase, they directly consume animal products for food. In the latter case, they sell livestockand products in the market for income and buy non-livestock food to complement orsupplement consumption. The non-livestock foods are used to complement consumptionin times of drought when the animal-source foods are scarce. In times of affluence, however,purchased grains are used as supplementary food sources. In either case, market exchangemakes a considerable share of the consumption of (agro)pastoralists. The implication oflivestock wealth and sales participation (incomes) for food security is presumably immenseas it appears that (agro)pastoralists are dependent on livestock selling to fulfill consump-tion. In the face of recurring drought, they sell livestock and in return purchase food grainsand other consumption requirements to supplement their food needs as livestock productsare not sufficient to smooth consumption. Therefore, surplus pastoral production is notsufficient to bring about food security improvements. Marketing practices, mainly sellingout livestock and purchasing in non-pastoral food items, make-up a major componentof accessing food in the (agro)pastoralist context. While (agro)pastoralists have enoughfood available in their vicinity or in the market, they may be food-insecure because theycannot access it. Hence, market exchange for building purchasing powers and marketinginfrastructure (accessibility) to sufficiently engage in markets for food security are equallyimportant. In this regard, Rocha [22] contends that lack of participation in markets is themost prevalent cause of food insecurity as the economic accessibility of food is intimatelyrelated to income security. Therefore, market accessibility is an important element of foodsecurity at the household level in the (agro)pastoralist context. It is the degree to which(agro)pastoralists obtain the markets necessary for their exchange needs, or the opportunity,the capacity, and the ability that they have to engage in selling their products. Nevertheless,while an improved market access plays a part in determining food security, our resultssuggest that the (agro)pastoralists’ lack of market orientation (mainly due to their cultureorientation) and market inaccessibility are hindering food security. (Agro)pastoralists walkfor long hours to get into market centers where market inaccessibility is an impediment tothem when participating in the market, leading to deteriorated food security levels. Theiruse of marketing technologies (e.g., mobile phones to access marketing information) thatreduce marketing transaction costs, the availability of marketing infrastructures, and theavailability of and memberships in a formal local group are not that dependable. Thus, interms of time and cost, the use of innovations and memberships in cooperatives to achievefood security and their access to markets remain challenging for them. Consequently, in-creased transaction costs are barriers that increasingly become impediments for them whenaccessing markets. Therefore, in dealing with market accessibility and participation, theexpansion and adoption of technologies that ameliorate market inaccessibility by reducing
Sustainability 2022, 14, 8233 17 of 22
the problems created by transaction costs are needed [66] as the divide between improvedand constrained access to markets for food security is the use of innovations to reducetransaction costs [67]. Rural infrastructure in the context of access to markets needs to easemarket participation for better food security outcomes. Jacoby [68], in this regard, stressedthat rural roads and transport infrastructures are particularly important forms of rural in-frastructure, providing cheap access to both input and output markets. Market accessibilityin terms of reduced distances and walking times to roads, services, towns, and marketoutlets is important to improving food security [69]. Additionally, the extent to whichpastoralists bargain in the market depends on their ability to take collective actions [70],where the actions enable them to take advantage of new value chains [71]; marketing costscan be shared by many producers, making market participation feasible [22], and theycan deal with existing market imperfections [72] for better food security. Thus, it emergesthat pastoral/livestock development services—improved techniques of production andmarketing through extension services—are typically important for (agro)pastoralists forimprovements in production and marketing sustainably for food security goals. In termsof the frequency of extension visits, it has been noted that (agro)pastoralists in the studyarea are visited by development workers more often. Yet, the type, timeliness, and qualityare priority concerns in terms of the effectiveness of the services for desired livelihoodgoals. Hence, frequent visits with quality and timely extension services with proper servicepackages have paramount importance to improvements in market participation for betterfood security achievements.
6.2. (Agro)pastoralist Cultural Orientations and Food (In)security
Livestock are the central element defining pastoralism as a production system. In theface of recurrent droughts, a large herd size matters not only when determining the amountof food available for consumption but also to sustaining pastoralism as a viable system.Pastoralists often prefer to adopt a traditional accumulation strategy to avoid/reduce therisks associated with herd loss due to risk factors, such as drought [73]. Their orientationtowards livestock accumulation serves them as a traditional insurance risk and copingstrategy in overcoming natural or man-made calamities [74]. With this rationale, pastoralistsand agro-pastoralists raise different species of livestock mainly as a traditional way to makea living. They raise livestock (especially large stock—camels and cattle) for milk andprestige, showing social status, and as wealth indicators, keeping the number as largeas they wish with all the costs. The inherent motive behind herd maximization is thatit safeguards the community from undue circumstances [75]. Additionally, livestock arethe subject of social relations in the community in that they are shared with those whodo not have enough. They are considered as common assets and shared among themembers of a particular clan. Livestock are also subject to slaughter in large numbersor are given to another party as amends for the owners’ wrongdoings (e.g., violatingcustomary norms) and as compensations to the victims in times of intra- and inter-clanconflicts. A large number of livestock are often sacrificed to serve cultural ceremonials andfor rituals typical of their tradition and the sanction paid to the victims. Thus, culturalorientation in Afar tradition is predominant, wherein the entire societal fabric is tied upwith livestock accumulation and sharing, slaughters (ritualization and festivities), andsanction paying (in livestock). The social setting and cultural fabric on which pastoralismis founded encourages accumulation at all costs and the excessive use of livestock forcultural purposes such as mass slaughtering. This endures among them and explains theimportance of solidarity against the individually based sedentary mode of lifestyle. Addedto the natural or induced risk factors (e.g., droughts, conflicts, and diseases), these practicesput pressure on the pastoral assets. Consequently, the drought-remnant livestock resourcegets depleted as it is accumulated to be shared, used, paid in sanction, and sacrificed.Thus, it ends up falling short of sufficiently supporting consumption, leading to severfood insecurity.

Sustainability 2022, 14, 8233 18 of 22
Furthermore, such a cultural orientation is not in the direction of engaging in mar-keting practices to supplement consumption for food security. Livestock are the object ofpastoralist cultural practices. Selling is not encouraged, mainly for cultural reasons. Thus,pastoralists attach more importance to their livestock for cultural uses than for trading forcash to support consumption. Due to cultural obligations, they are not ready to provide pas-toral produce to market for exchange. As also documented in Tessema et al. [76], culturalorientations stand at odds with markets orientations. (Agro)pastoralist cultural orientationstands to constrain pastoralism against improved livelihoods in terms of food security.Hence, the more that households engage in cultural practices such as rituals, the worsewill be their food insecurity as the herds are subject to accumulation in large numbers andmass slaughter for ritualization and festivities and to being shared and paid to others forsanctions. Thus, selling livestock is not appreciated because the social status, social power,and social authority of an individual in the community are measured based on the numberof livestock that one possesses. The conflict between the persisting culture orientation,such as the communal practices of pastoralism, and market ideals is real [77], resulting in alack of adequate supply to trade. This leads to low off-takes for (agro)pastoralists who arepresumed to consume the cereals which would be gained from livestock sales.
6.3. Production Risk Factors and Traditional Coping Strategy
Production risk factors, such as climate factors and livestock death due to eitherdiseases or conflicts, impede production and market orientation and thereby exacerbatefood insecurity among (agro)pastoralists. For instance, inter- and intra-clan conflicts arevery common in the study area, causing loss of livestock and lives, physical damage,mobility restrictions, and the probability of commercial orientation declining, therebyimpeding food security efforts. Moreover, the climate-induced factors are increasinglychallenging (agro)pastoralist production and are regarded as the most important causesof food insecurity in these areas [14]. Pastoralists and agro-pastoralists, from their longexperiences of living with environmental uncertainties, have developed a traditional copingstrategy that has helped them cope with these challenges. Among these is mobility, atradition practiced to escape unfavorable circumstances arising from climate variability.Seasonal mobility, known as guro in Afar, is a tradition of moving along with livestockin search of better pasture and water for the moving stock. It is their main practice, apart of their tradition and livelihood, and they think that it is good for the health of thelivestock. In the pastoralist setting, it is a common practice to move along with animals,where mobility enables them to use the still unexploited pastures and water sources [78].It remains fundamental as a strategy for coping with unpredictable rainfall and livestockdiseases. This helps them to escape exhausted resources in their permanent base villagesand to take advantage of the opportunities of resource abundance elsewhere. Movingherders can also get better access to and interactions with buyers along the moving routesas it might be easy and inexpensive to trade livestock over the long distances. This couldattract them towards the market, which in turn promotes market production for better foodsecurity. However, while mobility is a risk-managing and coping strategy, market facilitiesacross the moving routes and guro terminus hardly exist. Mobility is constrained by marketaccess and safety issues such as resource conflicts, and livestock raids are likely to occur [33].Both the local and the terminal markets are, respectively, set near villages and at regionaltowns distant from the ‘guro’ terminus, where buyers often go to visit these sites. Hence,during guro, pastoralists move far away, along with their livestock, and little or nothingremains for the market at their permanent settlements. Their move farther away from thebase villages often means that the value of the livestock falls, fetching them poor prices.In effect, they are obliged to sell with minimum prices at guro terminus. Moreover, thecosts and risks associated with guro, such as inter- and intra-clan conflicts, animal theft andraids, long hours of trekking (labor) costs, and uncertainties, are persistent [79]. Therefore,our result demonstrating a positive relationship between mobility and food security holdsunder better market access along the moving routes and guro terminus and no or reduced

Sustainability 2022, 14, 8233 19 of 22
risks and costs constraining mobility. Hence, sustainable conflict management led by theelders needs to be promoted so that guro sufficiently serves traditional coping strategy toenhance food security.
7. Conclusions
The findings of this study show that food insecurity persists in the study area and thatfood security concerns in Ethiopia’s (agro)pastoral areas are, for the most part, related tothe cultural orientation of these communities. While some cultural elements (for example,ritualization) exacerbate food insecurity, others (for example, guro, although it is restrictedby conflicts) help to reduce food insecurity levels in these areas. It also appears thatwhile (agro)pastoral production is intertwined with a variety of pressures, resulting insevere food insecurity, poor infrastructure-constrained market exchange practices playa rescuing role. These findings have implications for promotion of pastoralism as animportant livelihood option. Pastoral culture norms, in particular, as well as exchangepractices, emerge as policy considerations. This can be accomplished by designing policiesthat can balance and align the marketing practices within pastoralism. First, the role ofcustomary institutions in policymaking must be recognized. Second, markets should bebuilt around existing pastoral culture norms. Furthermore, market expansion opportunitiesmust be accompanied by the development of the necessary infrastructure and the access tomarket facilities, which can be sought by utilizing the existing pastoralists’ knowledge andexpertise as the foundation that drives market production within the context of pastoralism.Thus, this paper concludes that food (in)security in the context of (agro)pastoral settingscannot be understood solely in terms of inefficiency in the management of risks, production,and distribution. It necessitates a multifaceted approach that situates it not only within thenetworks of food production, distribution, and consumption, but also within the broadercontext of the cultural relations and social networks in which the households invariablyseek to secure their food needs and reproduce their livelihoods. In order to comprehendfood security in the (agro)pastoral setting, emphasis should be placed on pastoral cultureorientation as well as market exchange practices. As a result, a mix of approaches thatcombines livestock production services, market production orientation, and a marketinfrastructure development that is consistent with the pastoralist tradition remains criticalto ‘move-up’ pastoralism. Furthermore, capitalizing on guro as a traditional coping strategycan contribute to pastoralism’s long-term viability. It would also be better if the designatedlocations (or villages) of the moving (agro)pastoralists were properly known, in order forthem to have access to infrastructure, as it is difficult to locate them during guro.
8. Limitations of the Study and Future Research Directions
The results of this study should be used with caution for the following reasons. First,cultural variables are difficult to quantify numerically, which implies that these elementsneed to be addressed qualitatively to better capture their links with food (in)security. Ifthe question of ‘how the specific pastoral culture elements relate to food (in)security?’had been approached qualitatively, the results might have been different. As a result,future research needs to investigate pastoral food (in)security using qualitative methodsto capture the ‘how’ and the ‘why’ elements, while linking the pastoralists’ culture withthe food (in)security issues. Second, the variables identified in this study as influencing(agro)pastoralists’ food security are based on cross-sectional data collected only once duringone season. Thus, for the consistency of the findings, further conformity of the findings isrequired by research using panel data that capture the influencing variables as well as thefood (in)security itself across multiple time periods.
Author Contributions: Conceptualization, D.W.B., W.T.B. and W.K.T.; Formal analysis, D.W.B.;Investigation, D.W.B.; Methodology, D.W.B.; Supervision, W.T.B. and W.K.T.; Validation, W.T.B.,W.K.T. and M.M.; Writing—original draft, D.W.B.; Writing—review & editing, D.W.B., W.T.B., W.K.T.and M.M. All authors have read and agreed to the published version of the manuscript.

Sustainability 2022, 14, 8233 20 of 22
Funding: This research received no external funding.
Institutional Review Board Statement: Not applicable.
Informed Consent Statement: Not applicable.
Data Availability Statement: The data used in this paper were collected as a part of a PhD projectentitled “Relating Pastoralists’ Culture Orientation, Livestock Marketing Practices, and HouseholdFood Security among the Afar Pastoralists of Northeastern Ethiopia”. Hence, at this point in time, wecannot share the data. However, it can be accessed by requesting the corresponding author.
Conflicts of Interest: The authors declare no conflict of interest.
References1. FAO. World Food Summit: Rome Declaration on World Food Security; FAO: Rome, Italy, 1996.2. Keenan, D.P.; Olson, C.; Hersey, J.C.; Parmer, S.M. Measures of Food Insecurity/Security. J. Nutr. Educ. 2001, 33 (Suppl. 1),
S49–S58. [CrossRef]3. Maxwell, D.G. Measuring food insecurity: The frequency and severity of “coping strategies”. Food Policy 1996, 21, 291–303.
[CrossRef]4. Barrett, C.B. Measuring Food Insecurity. Science 2010, 327, 825–828. [CrossRef]5. Scanlan, S.J. Guns, Butter, and Development: Security and Military Famine Extensions of the Modernization versus Dependency
Debate. J. Political Mil. Sociol. 2001, 29, 331–355.6. FAO. The State of Food Security and Nutrition in the World 2019: Safegurding against Economic Slowdowns and Downturns; FAO:
Rome, Italy, 2019.7. Ibok, O.W.; Osbahr, H.; Srinivasan, C. Advancing a new index for measuring household vulnerability to food insecurity. Food
Policy 2019, 84, 10–20. [CrossRef]8. Maxwell, D.; Vaitla, B.; Coates, J. How do indicators of household food insecurity measure up? An empirical comparison from
Ethiopia. Food Policy 2014, 47, 107–116. [CrossRef]9. Ballard, T.; Kepple, A.; Cafiero, C. The Food Insecurity Experience Scale: Development of a Global Standard for Monitoring Hunger
Worldwide; FAO: Rome, Italy, 2013. [CrossRef]10. Hajdu, F.; Hadju, F.; Ansell, N.; Robson, E.; van Blerk, L.; Chipeta, L. Socio-Economic Causes of Food Insecurity in Malawi. Soc.
Malawi J. 2009, 62, 6–18.11. Motbainor, A.; Worku, A.; Kumie, A. Level and determinants of food insecurity in East and West Gojjam zones of Amhara Region,
Ethiopia: A community based comparative cross-sectional study. BMC Public Health 2016, 16, 503. [CrossRef]12. Dong, S.; Wen, L.; Liu, S.; Zhang, X.; Lassoie, J.P.; Yi, S.; Li, X.; Li, J.; Li, Y. Vulnerability of Worldwide Pastoralism to Global
Changes and Interdisciplinary Strategies for Sustainable Pastoralism. Ecol. Soc. 2011, 16, 1–23. [CrossRef]13. Fenta, M.; Jordaan, A.; Melka, Y. Vulnerability of Southern Afar pastoralists to climate variability and change, Ethiopia. Jàmbá
2018, 11, 575. [CrossRef]14. Lemma, Y.; Beyene, F.; Hundie, B. Climate Change and Variability: Implications for Household Food Security in Agro-pastoral
Areas of Jigjiga District, Eastern Ethiopia. Ethiop. J. Econ. 2013, 22, 71–106.15. Mekuyie, M.; Jordaan, A.; Melka, Y. Understanding resilience of pastoralists to climate change and variability in the Southern
Afar Region, Ethiopia. Clim. Risk Manag. 2018, 20, 64–77. [CrossRef]16. Jemal, K.; Legesse, B.; Haji, J.; Ketema, M. Multidimensional Poverty in Pastoral Area: The Case of Somali and Afar Regional
States, Ethiopia. Am. Int. J. Contemp. Res. 2017, 7, 47–60.17. Teka, A.M.; Woldu, G.; Fre, Z. Status and determinants of poverty and income inequality in pastoral and agro-pastoral communi-
ties: Household-based evidence from Afar Regional State, Ethiopia. World Dev. Perspect. 2019, 15, 100123. [CrossRef]18. Tsegaye, D.; Vedeld, P.; Moe, S.R. Pastoralists and livelihoods: A case study from northern Afar, Ethiopia. J. Arid Environ. 2013, 91,
138–146. [CrossRef]19. Catley, A.; Lind, J.; Scoones, I. The futures of pastoralism in the Horn of Africa: Pathways of growth and change. Rev. Sci. Tech.
Off. Int. Epiz. 2016, 35, 389–403. [CrossRef] [PubMed]20. Asenso-Okyere, K.; Mekonnen, D.A.; Zerfu, E. Determinants of Food Security in Selected Agro-pastoral Communities of Somali
and Oromia Regions, Ethiopia. J. Food Sci. Eng. 2013, 3, 453–471.21. Kahsay, S.T.; Reda, G.K.; Hailu, A.M. Food security status and its determinants in pastoral and agro-pastoral districts of Afar
regional state, Ethiopia. Afr. J. Sci. Technol. Innov. Dev. 2019, 12, 333–341. [CrossRef]22. Rocha, C. Food Insecurity as Market Failure: A Contribution from Economics. J. Hunger Environ. Nutr. 2007, 1, 5–22. [CrossRef]23. Sen, A. Poverty and Famines: An Essay on Entitlement and Deprivation; International Labour Organisation: Geneva, Switzerland, 1981.24. FAO. Methods for Estimating Comparable Rates of Food Insecurity Experienced by Adults Throughout the World; FAO: Rome, Italy, 2016.25. Pérez-Escamilla, R.; Segall-Corrêa, A.M. Food insecurity measurement and indicators. Rev. Nutr. 2008, 21, 15s–26s. [CrossRef]26. Reda, K.T. Social organization and cultural institutions of the Afar of Northern Ethiopia. Int. J. Sociol. Anthropol. 2011, 3, 423–429.27. Davies, J. Capitalization, Commoditization and Obligation Among Ethiopia’s Afar Pastoralists. Nomad. Peoples 2006, 10, 29–52.
[CrossRef]

Sustainability 2022, 14, 8233 21 of 22
28. Little, P.D.; Debsu, D.N.; Tiki, W. How pastoralists perceive and respond to market opportunities: The case of the Horn of Africa.Food Policy 2014, 49, 389–397. [CrossRef]
29. Devereux, S. Better Marginalised than Incorporated? Pastoralist Livelihoods in Somali Region, Ethiopia. Eur. J. Dev. Res. 2010, 22,678–695. [CrossRef]
30. Aklilu, Y.; Catley, A. Mind the Gap: Commercialization, Livelihoods and Wealth Disparity in Pastoralist Areas of Ethiopia; Tufts University:Medford, MA, USA, 2010. [CrossRef]
31. Headey, D.; Taffesse, A.S.; You, L. Diversification and Development in Pastoralist Ethiopia. World Dev. 2014, 56, 200–213.[CrossRef]
32. Nassef, M.; Anderson, S.; Hesse, C. Pastoralism and Climate Change Enabling Adaptive Capacity; ODI: London, UK, 2009.33. Rettberg, S. Contested narratives of pastoral vulnerability and risk in Ethiopia’s Afar region. Pastoralism 2010, 1, 248–273.
[CrossRef]34. Megersa, B.; Markemann, A.; Angassa, A.; Zárate, A.V. The role of livestock diversification in ensuring household food security
under a changing climate in Borana, Ethiopia. Food Secur. 2014, 6, 15–28. [CrossRef]35. Negatu, W. Economic Interactions of Pastoral Lowland and Highland Systems and Implications for Sustainable Livelihoods: A Case Study
in Northeastern Ethiopia; Forum for Social Studies: Addis Ababa, Ethiopia, 2011.36. Gebeye, B.A. Unsustain the sustainable: An evaluation of the legal and policy interventions for pastoral development in Ethiopia.
Pastoralism 2016, 6, 243. [CrossRef]37. Levine, S. An Unromantic Look at Pastoralism in Karamoja: How Hard-hearted Economics Shows That Pastoral Systems Remain
the Solution, and Not the Problem. Nomad. Peoples 2010, 14, 147–153. [CrossRef]38. Krätli, S. Pastoral Development Orientation Framework: Focus on Ethiopia; MISEREOR: Aachen, Germany, 2019. [CrossRef]39. Haji, J.; Legesse, B. Impact of sedentarization program on the livelihood and food security of Ethiopian pastoralists. J. Arid
Environ. 2017, 136, 45–53. [CrossRef]40. Ramakrishna, G.; Demeke, A. An Empirical Analysis of Food Insecurity in Ethiopia: The Case of North Wello. Afr. Dev. 2002, 27,
127–143.41. Amwata, D.A.; Nyariki, D.M.; Musimba, N.R.K. Factors influencing pastoral and agropastoral household vulnerability to food
insecurity in the drylands of Kenya: A case study of Kajiado and Makueni Counties. J. Int. Dev. 2015, 28, 771–787. [CrossRef]42. Ambelu, A.; Birhanu, Z.; Tesfaye, A.; Berhanu, N.; Muhumuza, C.; Kassahun, W.; Daba, T.; Woldemichael, K. Intervention
pathways towards improving the resilience of pastoralists: A study from Borana communities, southern Ethiopia. Weather Clim.Extrem. 2017, 17, 7–16. [CrossRef]
43. Teka, T.; Azeze, A.; Gebremariam, A. Cross-Border Livestock Trade and Food Security in the Southern and Southeastern EthiopiaBorderlands; OSSREA: Addis Ababa, Ethiopia, 1999.
44. Roba, G.M.; Lelea, M.A.; Kaufmann, B. Manoeuvring through difficult terrain: How local traders link pastoralists to markets.J. Rural Stud. 2017, 54, 85–97. [CrossRef]
45. McPeak, J. Confronting the risk of asset loss: What role do livestock transfers in northern Kenya play? J. Dev. Econ. 2006, 81,415–437. [CrossRef]
46. Mayanja, M.N.; Rubaire-Akiiki, C.; Greiner, T.; Morton, J.F. Characterising food insecurity in pastoral and agro-pastoralcommunities in Uganda using a consumption coping strategy index. Pastoralism 2015, 5, 11. [CrossRef]
47. Siraje, I.; Bekele, A. Assessment of Food Insecurity and Coping Mechanisms among Pastoral Households of Afar NationalRegional State: The Case of Chifra District, Ethiopia. Ethiop. J. Agric. Sci. 2013, 23, 145–156.
48. Alemu, G. Revisiting the entitlement approach to famine: Taking a closer look at the supply factor—A critical survey of theliterature. East. Afr. Soc. Sci. Res. Rev. 2007, 23, 95–129. [CrossRef]
49. Staatz, J.M.; D’Agostino, V.C.; Sundberg, S. Measuring Food Security in Africa: Conceptual, Empirical, and Policy Issues. Am. J.Agric. Econ. 1990, 72, 1311–1317. [CrossRef]
50. The World Bank. Poverty and Hunger: Issues and Options for Food Security in Developing Countries; The International Bank forReconstruction and Development/The World Bank: Washington, DC, USA, 1986.
51. Moltedo, A.; Troubat, N.; Lokshin, M.; Sajaia, Z. Analyzing Food Security Using Household Survey Data; International Bank forReconstruction and Development/The World Bank: Washington, DC, USA, 2014.
52. Ruane, J.; Sonnino, A. Agricultural biotechnologies in developing countries and their possible contribution to food security.J. Biotechnol. 2011, 156, 356–363. [CrossRef]
53. Smith, M.; Kassa, W.; Winters, P. Assessing food insecurity in Latin America and the Caribbean using FAO’s Food InsecurityExperience Scale. Food Policy 2017, 71, 48–61. [CrossRef]
54. Coates, J.; Bilinsky, P.; Coates, J. Household Food Insecurity Access Scale (HFIAS) for Measurement of Food Access: Indicator Guide:Version 3; Food and Nutrition Technical Assistance Project, Academy for Educational Development: Washington, DC, USA, 2007;pp. 1–36.
55. Knueppel, D.; Demment, M.; Kaiser, L. Validation of the Household Food Insecurity Access Scale in rural Tanzania. Public HealthNutr. 2009, 13, 360–367. [CrossRef] [PubMed]
56. Helland, J. Afar Resilience Study; CMI Work Paper WP 2015:6; Chr. Michelsen Institute: Bergen, Norway, 2015; 47p, Availableonline: http://www.cmi.no/publications/file/5560-afar-resilience-study.pdf (accessed on 4 April 2020).
57. CSA. Population Projections for Ethiopia, 2007–2037; CSA: Addis Ababa, Ethiopia, 2013.

Sustainability 2022, 14, 8233 22 of 22
58. MOARD. An Atlas of Ethiopian Livelihoods: The Livelihoods Integration Unit; Government of Ethiopia: Disaster Risk Managementand Food Security Sector: Addis Ababa, Ethiopia, 2010.
59. Saunders, M.; Lewis, P.; Thornhill, A. Research Methods for Business Students, 5th ed.; Pearson Education Limited:Edinburgh, UK, 2009.
60. Cochran, W.G. Sampling Techniques, 2nd ed.; John Wiley & Sons, Inc.: New York, NY, USA, 1963.61. Lenth, R.V. Some Practical Guidelines for Effective Sample Size Determination. Am. Stat. 2001, 55, 187–193. [CrossRef]62. Grilli, L.; Rampichini, C. Ordered Logit Model. In Encyclopedia of Quality of Life and Well-Being Research; Springer: Dordrecht, The
Netherlands, 2014; pp. 4510–4513. [CrossRef]63. Liu, X. Fitting Stereotype Logistic Regression Models for Ordinal Response Variables in Educational Research (Stata). J. Mod.
Appl. Stat. Methods 2014, 13, 528–545. [CrossRef]64. Vaitla, B.; Coates, J.; Glaeser, L.; Hillbruner, C.; Biswal, P.; Maxwell, D. The measurement of household food security: Correlation
and latent variable analysis of alternative indicators in a large multi-country dataset. Food Policy 2017, 68, 193–205. [CrossRef]65. Schwartz, H.J.; Shaabani, S.; Walther, D. Range Management Handbook of Kenya; Republic of Kenya, Ministry of Livestock
Development (MOLD), Range Management Division: Nairobi, Kenya, 1991; Volume II.66. Muto, M.; Yamano, T. The Impact of Mobile Phone Coverage Expansion on Market Participation: Panel Data Evidence from
Uganda. World Dev. 2009, 37, 1887–1896. [CrossRef]67. Rueff, H.; Rahim, I. 2016. Enhancing the economic viability of pastoralism: The need to balance interventions. Rev. Sci. Tech. Off.
Int. Epiz. 2016, 35, 577–586. [CrossRef]68. Jacoby, H.G. Access to Markets and the Benefits of Rural Roads. Econ. J. 2000, 110, 713–737. [CrossRef]69. Kruseman, G.; Ruben, R.; Tesfay, G. Diversity and development domains in the Ethiopian highlands. Agric. Syst. 2006, 88, 75–91.
[CrossRef]70. Nunow, A.A. Pastoralistss and Market: Livestockk Commercialization and Food Security in Nnorth-Eastern Kenya; UvA-DARE:
Amsterdam, The Netherlands, 2000.71. Tessema, W.K.; Ingenbleek, P.T.M.; van Trijp, H.C.M. Pastoralism, sustainability, and marketing. A review. Agron. Sustain. Dev.
2014, 34, 75–92. [CrossRef]72. Markelova, H.; Mwangi, E. Collective Action for Smallholder Market Access: Evidence and Implications for Africa. Rev. Policy
Res. 2010, 27, 621–640. [CrossRef]73. Næss, M.W.; Bårdsen, B.-J. Why Herd Size Matters—Mitigating the Effects of Livestock Crashes. PLoS ONE 2013, 8, e70161.
[CrossRef]74. Gebru, G.; Mcpeak, J. Herd Accumulation: A Pastoral Strategy to Reduce Risk Exposure; Global Livestock CRSP, University of
California-Davis: Davis, CA, USA, 2004.75. Mulder, M.B.; Fazzio, I.; Irons, W.; McElreath, R.L.; Bowles, S.; Bell, A.; Hertz, T.; Hazzah, L. Pastoralism and Wealth Inequality.
Curr. Anthr. 2010, 51, 35–48. [CrossRef]76. Tessema, W.K.; Ingenbleek, P.T.; van Trijp, H.C. Refining the smallholder market integration framework: A qualitative study of
Ethiopian pastoralists. NJAS—Wagening. J. Life Sci. 2019, 88, 45–56. [CrossRef]77. Casciarri, B. Between Market Logic and Communal Practices: Pastoral Nomad Groups and Globalization in Contemporary Sudan
(Case Studies from Central and Western Sudan). Nomad. Peoples 2009, 13, 69–91. [CrossRef]78. Bollig, M.; Göbel, B. Risk, Uncertainty and Pastoralism: An Introduction. Nomad. Peoples 1997, 1, 5–21. [CrossRef]79. Turner, M.D.; Schlecht, E. Livestock mobility in sub-Saharan Africa: A critical review. Pastoralism 2019, 9, 13. [CrossRef]